politecnico di torino - bim portale
TRANSCRIPT

POLITECNICO DI TORINO
Master of Science in Civil Engineering Thesis
INFRABIM: Modeling applications for design and maintenance plan. The case study
of the “overpass 16” from the main renovation project of S.S. 372 “Telesina”
Tutors:
Anna Osello
Francesco Semeraro
Candidate
Agustin Vincenti
July 2018

ii

iii
Dedication:
It makes me very happy to close this stage of my life. I can say now, that many years of effort
and dedication have finally paid off.
First of all, I want to thank my family, who supported me throughout this long process from
the distance, without them nothing would have been possible. I would also like to thank my
friends and my girlfriend, with whom I shared so many nice moments and made me feel at home,
even in a foreign country.
I would also like to thank Professor Anna Osello, for giving me the chance of doing the thesis
in the “Drawing to the future” department, and Francesco Semeraro, who guided me
throughout the process and was always there to dedicate his time when I needed it.
Finally, I will always be grateful to both the National University of Cordoba and the
Polytechnic of Torino for giving me the opportunity to carry out this experience under the double
degree agreement.
iv
Summary:
SECTION 1 : INTRODUCTION ..................................................................................................... 1
BIM ....................................................................................................................................... 2
Definition: ......................................................................................................................... 2
BIM importance today:...................................................................................................... 3
BIM throughout the project-life cycle: ............................................................................... 4
BIM Stage 1: Object-Based Modelling ............................................................................ 5
BIM Stage 2: Model-Based Collaboration ....................................................................... 5
BIM Stage 3: Network-Based Integration ....................................................................... 5
Interoperability: ................................................................................................................ 6
Semantic interoperability and BIM ................................................................................ 6
BIM dimensions: ............................................................................................................... 7
3D (The shared information model) ............................................................................... 7
4D (Construction sequencing) ........................................................................................ 7
5D (Cost) ....................................................................................................................... 8
6D BIM (Project lifecycle information) ........................................................................... 8
BIM maturity levels: .......................................................................................................... 9
Level 0: ........................................................................................................................ 10
Level 1: ........................................................................................................................ 10
Level 2: ........................................................................................................................ 10
Level 3: ........................................................................................................................ 10
Level of development [LOD] ............................................................................................ 10
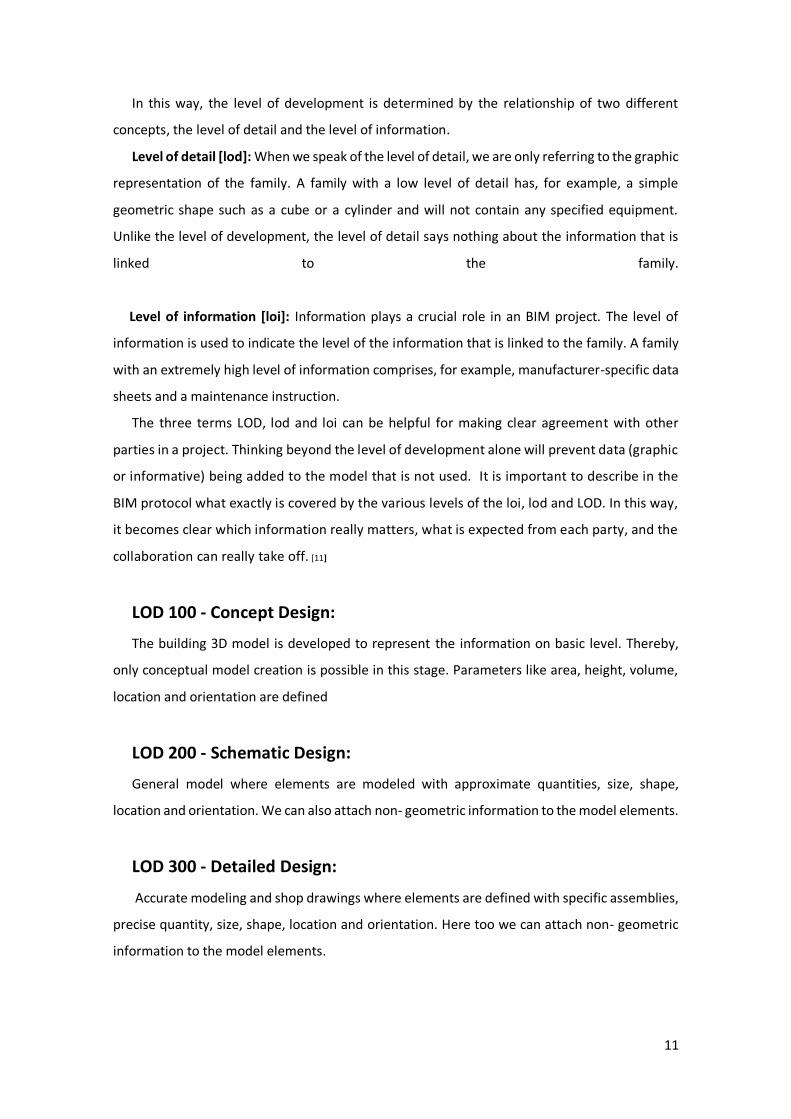
LOD 100 - Concept Design: .......................................................................................... 11
LOD 200 - Schematic Design: ....................................................................................... 11
LOD 300 - Detailed Design: .......................................................................................... 11
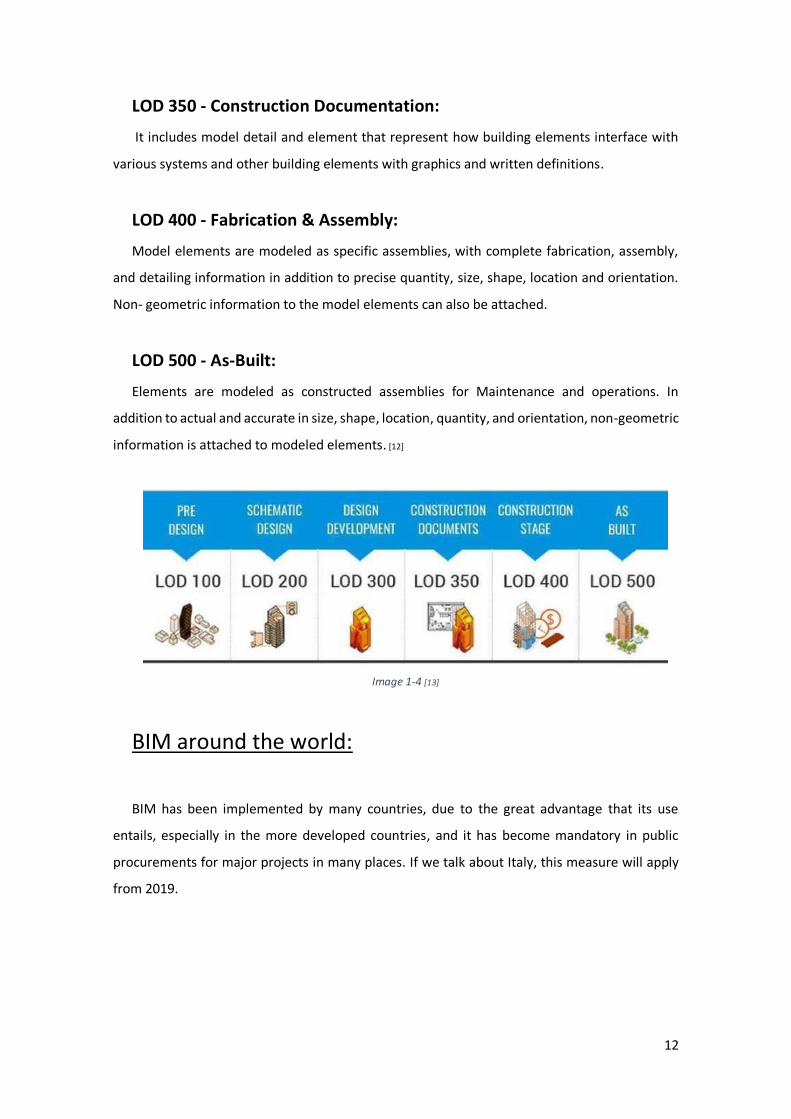
LOD 350 - Construction Documentation: ..................................................................... 12
LOD 400 - Fabrication & Assembly: .............................................................................. 12
LOD 500 - As-Built: ...................................................................................................... 12
BIM around the world: .................................................................................................... 12
BIM applied to infrastructure: ......................................................................................... 13
InfraBIM state of the art: ............................................................................................. 14
SECTION 2 : WORK METHODOLOGY .................................................................................... 16
Project presentation: .......................................................................................................... 17
v
S.S. 372 Telesina: ............................................................................................................. 17
Project to carry out: ........................................................................................................ 17
ANAS: .............................................................................................................................. 18
Study case: ...................................................................................................................... 18
Organization: ...................................................................................................................... 20
First approach: ................................................................................................................ 20
Phases: ........................................................................................................................ 20
SECTION 3 : INFRASTRUCTURE PROJECT ACCORDING TO BIM METHODOLOGY ....................... 24
CONTEXT MODELING .......................................................................................................... 25
Software chosen: ............................................................................................................ 26
Surface: ........................................................................................................................... 26
Alignments: ..................................................................................................................... 29
Horizontal alignment: .................................................................................................. 29
Vertical alignments: ..................................................................................................... 31
Road Sections: ................................................................................................................. 35
Corridors: ........................................................................................................................ 39
Intersections: .................................................................................................................. 42
Final surface: ................................................................................................................... 48
Report:................................................................................................................................ 49
OVERPASS MODELING......................................................................................................... 50
Chosen software: ............................................................................................................ 51
Project Units: .................................................................................................................. 51
Import Data from CivilCAD file: ........................................................................................ 52
Coordinates system location: .......................................................................................... 53
Families creation: ............................................................................................................ 54
Levels and Grids creation: ............................................................................................... 58
Families location: ............................................................................................................ 60
Foundations: ............................................................................................................... 61
Abutments: ................................................................................................................. 62
Bearings: ..................................................................................................................... 64
Deck: ........................................................................................................................... 67
Concrete slabs casted in place: .................................................................................... 72
Asphalt layer: .............................................................................................................. 73
Security Barriers: ......................................................................................................... 74
Reinforcement: ........................................................................................................... 75
Final Result:..................................................................................................................... 76
vi
Interoperability with CSiBridge: ....................................................................................... 78
Report:................................................................................................................................ 82
SECTION 4 : LINKING TO MAINTENANCE PLAN INFORMATION ................................................ 84
First approach: ................................................................................................................ 85
Inside Revit: .................................................................................................................... 86
Shared parameters: ..................................................................................................... 87
Schedules: ................................................................................................................... 88
URL parameters:.......................................................................................................... 90
Sheets: ........................................................................................................................ 94
Project browser organization: ...................................................................................... 95
Project DB: ...................................................................................................................... 99
Maintenance plan schedule: .......................................................................................... 103
Link schedule to model: ................................................................................................. 106
Simulation: ................................................................................................................ 107
Report:.............................................................................................................................. 110
SECTION 5 : CONCLUSION ..................................................................................................... 112
References: ....................................................................................................................... 115
vii
Images list:
Image 1-1 [7]........................................................................................................................ 7
Image 1-2 [9]........................................................................................................................ 9
Image 1-3 [10] ...................................................................................................................... 9
Image 1-4 [13] .................................................................................................................... 12
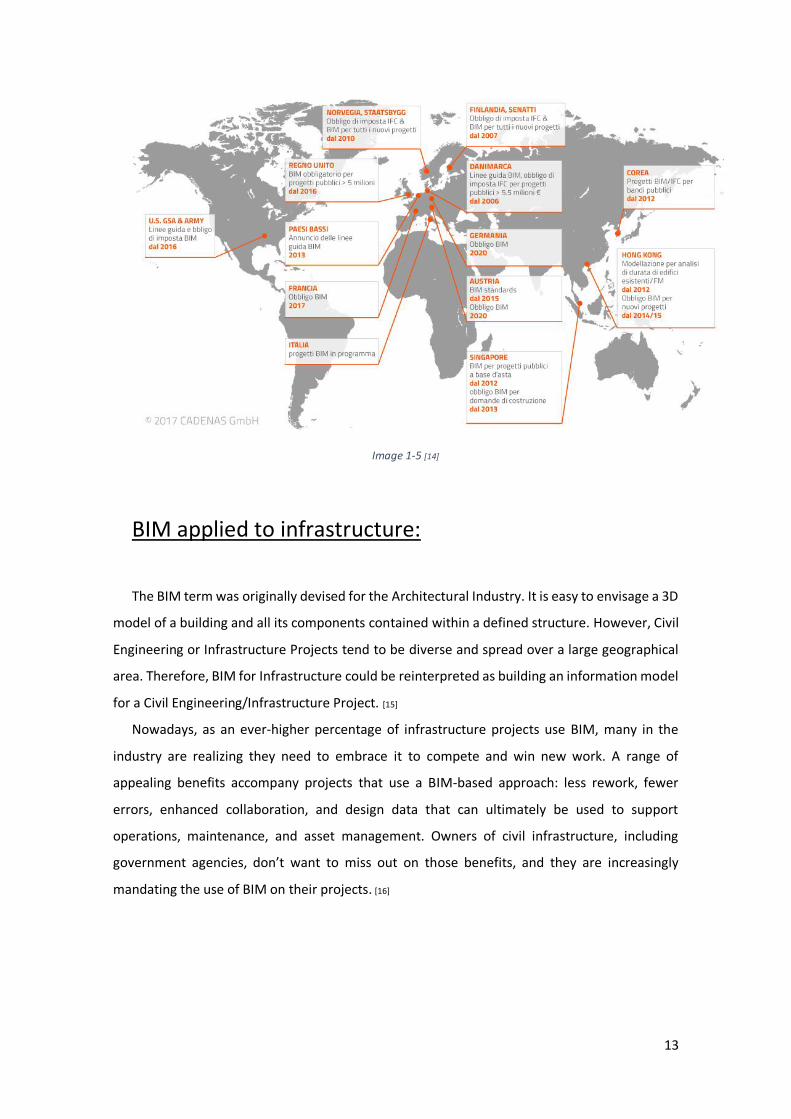
Image 1-5 [14] .................................................................................................................... 13
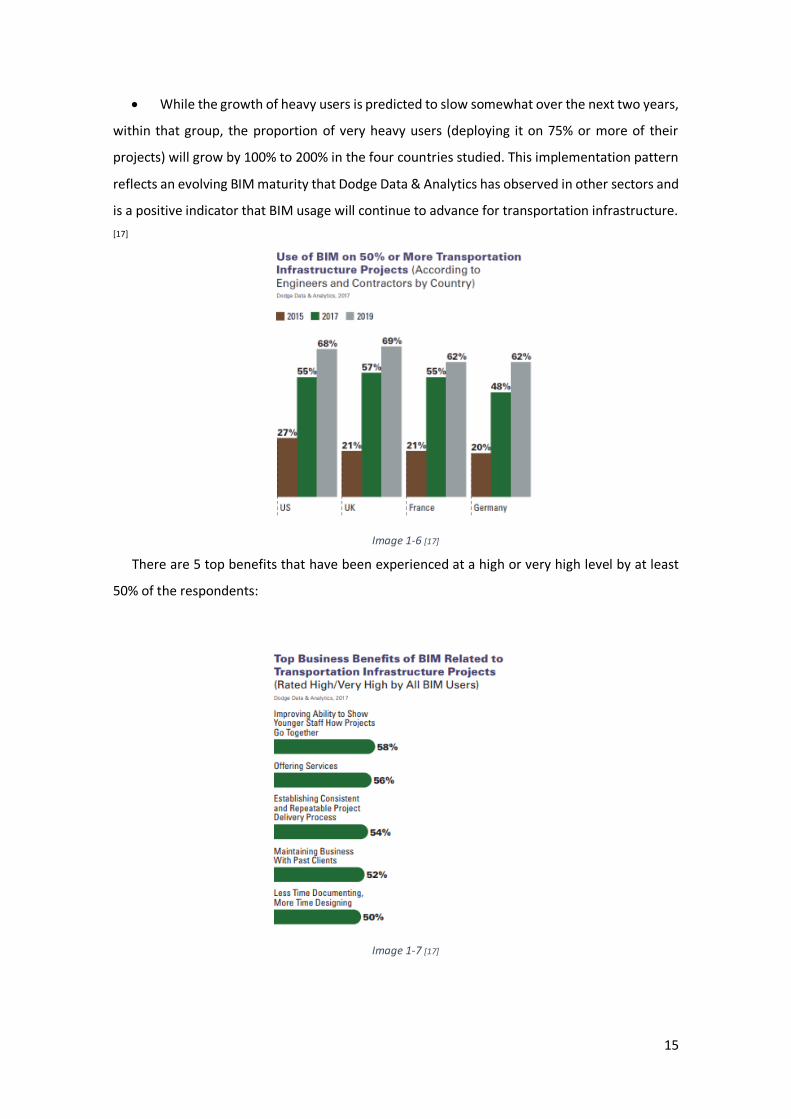
Image 1-6 [17] .................................................................................................................... 15
Image 1-7 [17] .................................................................................................................... 15
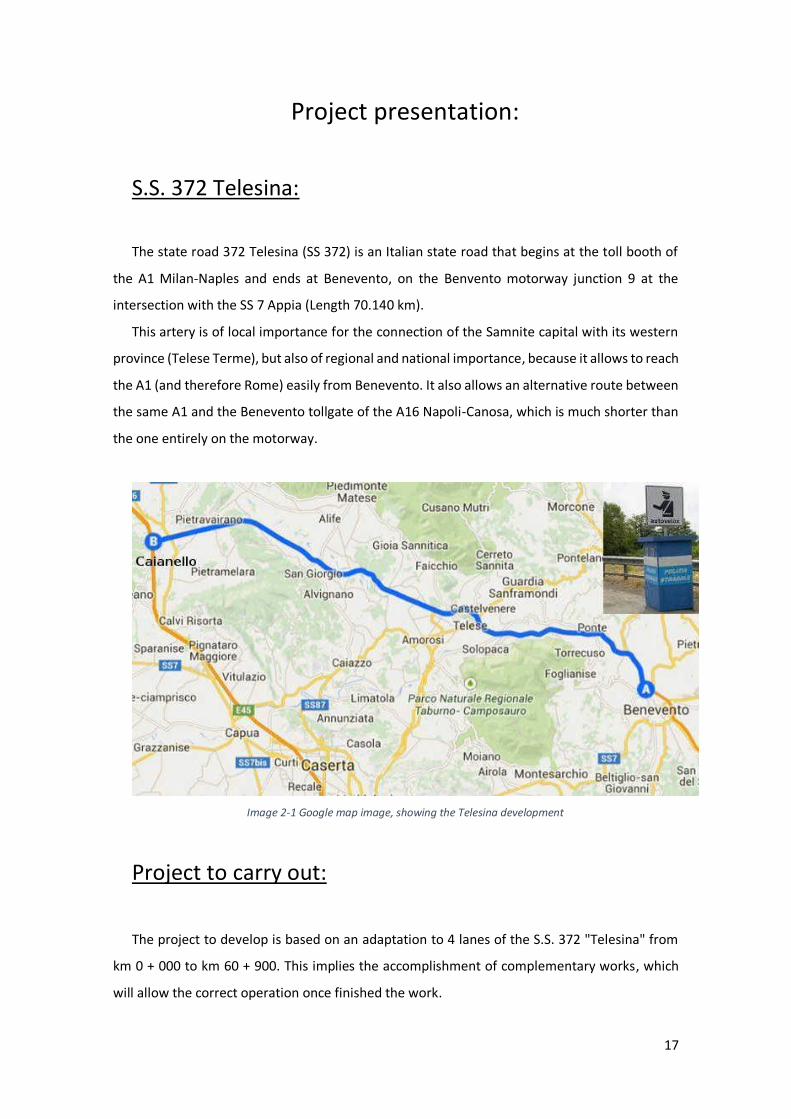
Image 2-1 Google map image, showing the Telesina development ..................................... 17
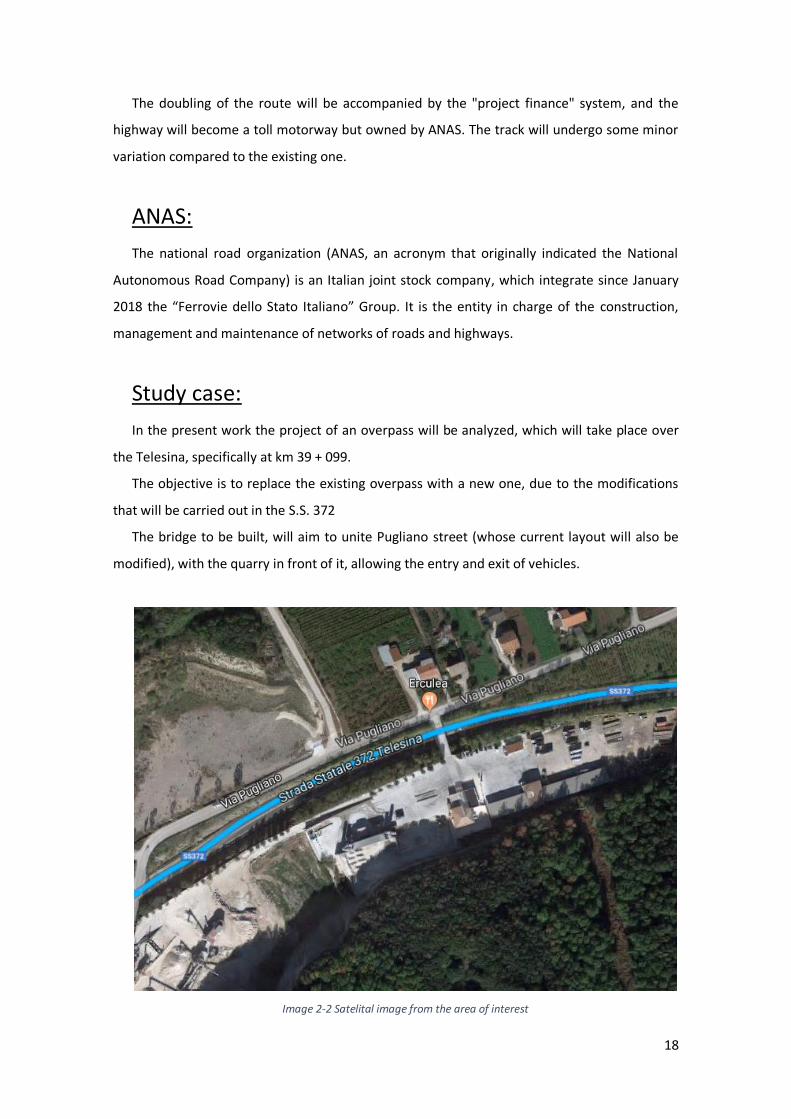
Image 2-2 Satelital image from the area of interest ............................................................ 18
Image 2-3 2D view form the AutoCAD file .......................................................................... 19
Image 3-1 Original Surface ................................................................................................. 27
Image 3-2 Initial surface elevation table ............................................................................. 28
Image 3-3 Surface to crop .................................................................................................. 28
Image 3-4 Cropped surface ................................................................................................ 29
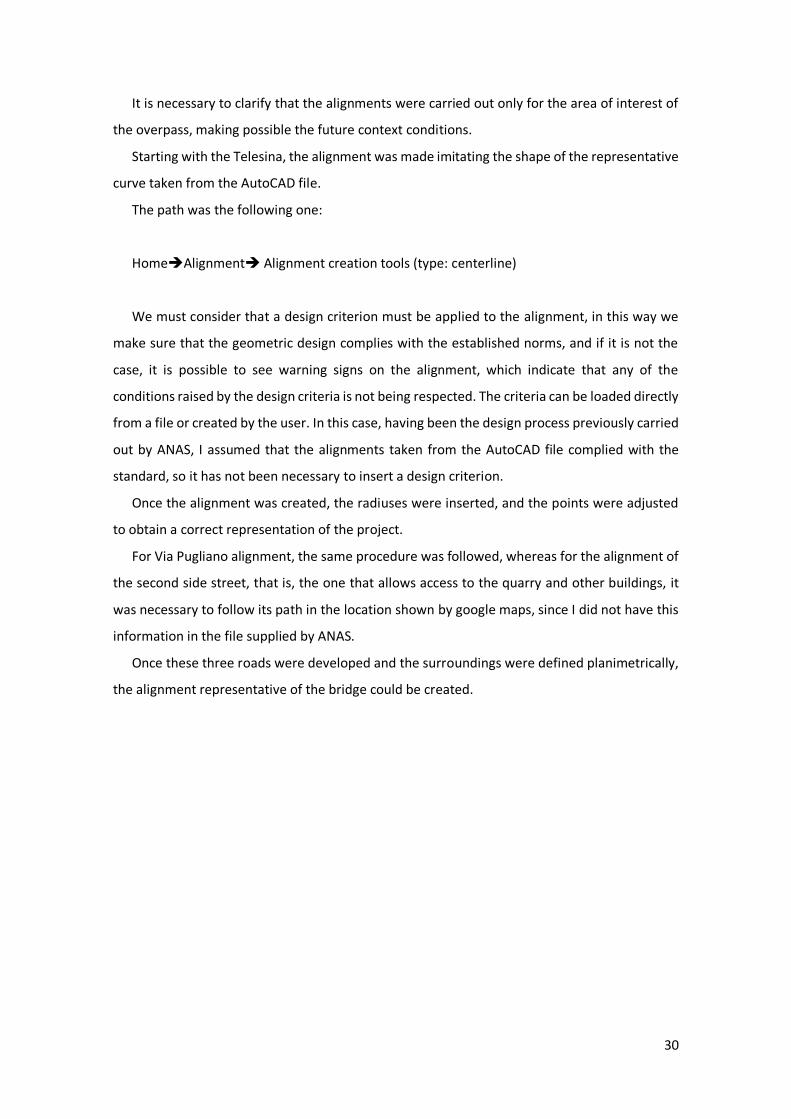
Image 3-5 2D view of the horizontal alignments ................................................................. 31
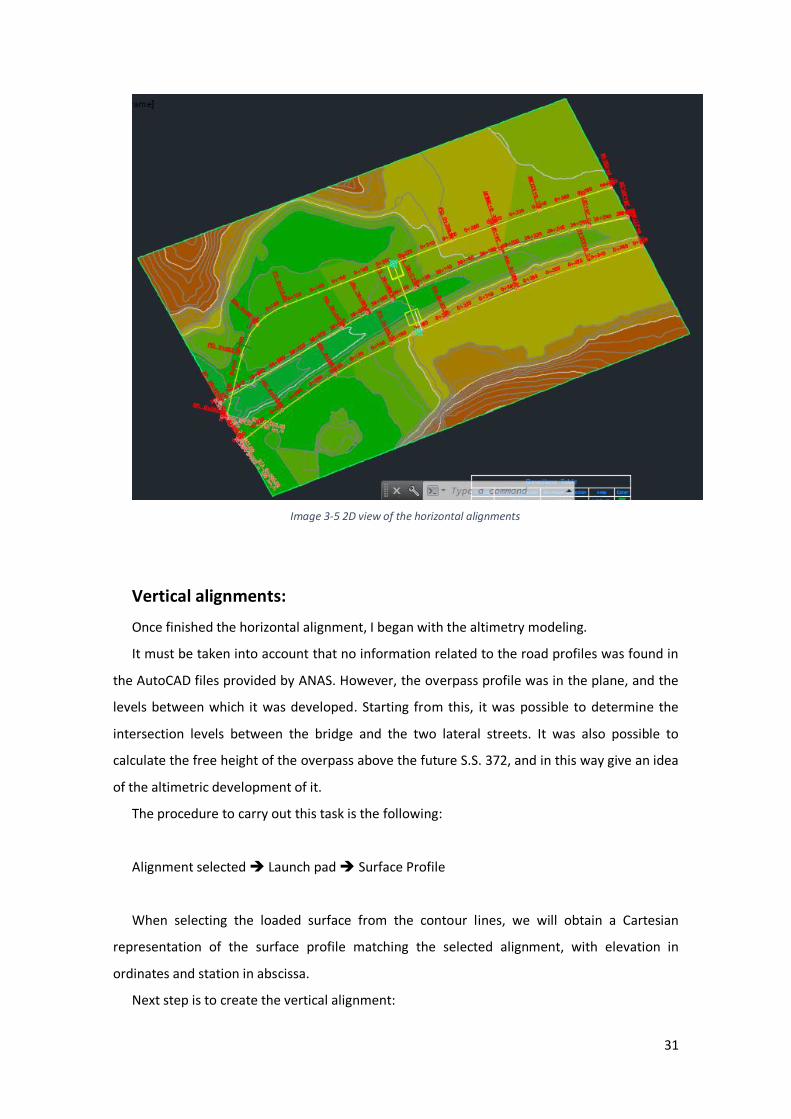
Image 3-6 S.S. 372 profile ................................................................................................... 32
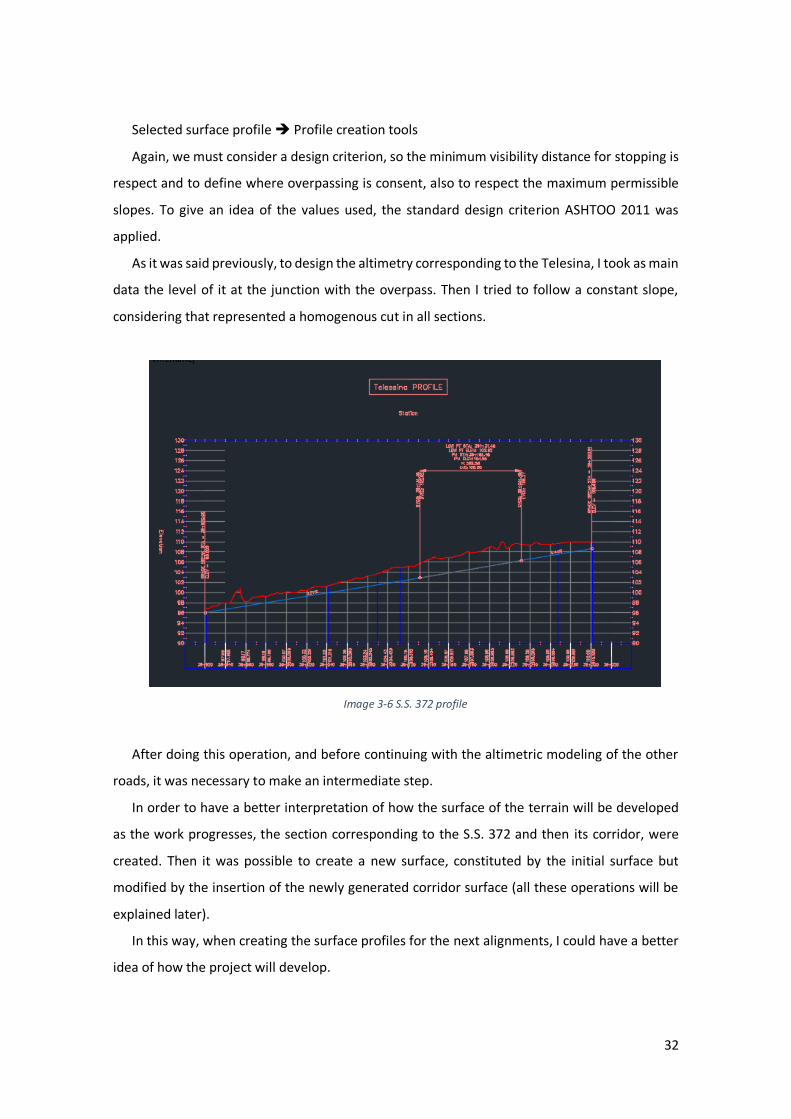
Image 3-7 Modified surface................................................................................................ 33
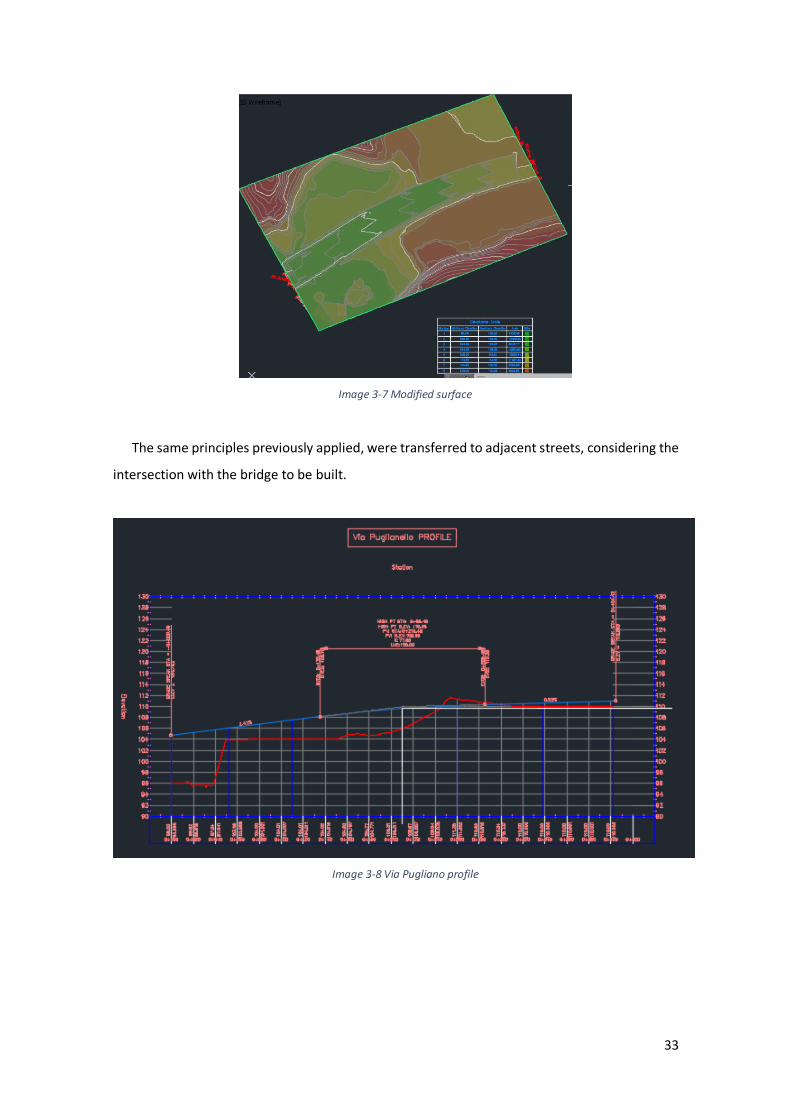
Image 3-8 Via Pugliano profile ............................................................................................ 33
Image 3-9 Existing road profile ........................................................................................... 34
Image 3-10 Overpass profile............................................................................................... 34
Image 3-11 S.S. 372 cross-sections ..................................................................................... 36
Image 3-12 Via Pugliano cross-sections .............................................................................. 37
Image 3-13 Existing road cross-section ............................................................................... 37
Image 3-14 Overpass section from the AutoCAD file .......................................................... 38
Image 3-15 Overpass cross-sections ................................................................................... 38
Image 3-16 Telesina corridor properties ............................................................................. 40
Image 3-17 Target mapping for the first part ...................................................................... 40
Image 3-18 Target mapping for the second part ................................................................. 41
Image 3-19 2D view of created corridors ............................................................................ 41
Image 3-20 3D overview from S.S. 372 corridor .................................................................. 42
Image 3-21 Intersection with Via Pugliano properties ........................................................ 44
viii
Image 3-22 Via Pugliano additional sections ....................................................................... 44
Image 3-23 Overpass additional sections............................................................................ 45
Image 3-24 Existing road additional sections ...................................................................... 45
Image 3-25 Via Pugliano corridor regions ........................................................................... 46
Image 3-26 2D model view ................................................................................................. 47
Image 3-27 3D overview..................................................................................................... 47
Image 3-28 Final surface .................................................................................................... 48
Image 3-29 Project units .................................................................................................... 52
Image 3-30 Project coordinates base point ........................................................................ 54
Image 3-31 Generic beam .................................................................................................. 56
Image 3-32 Pile foundation ................................................................................................ 56
Image 3-33 Bearing ............................................................................................................ 56
Image 3-34 Bearing base .................................................................................................... 57
Image 3-35 Principal beam ................................................................................................. 57
Image 3-36 HEB 500 ........................................................................................................... 57
Image 3-37 Brace ............................................................................................................... 58
Image 3-38 L Profile ........................................................................................................... 58
Image 3-39 Levels creation ................................................................................................. 59
Image 3-40 Grids creation .................................................................................................. 60
Image 3-41 2D view of profiles in AutoCAD file................................................................... 61
Image 3-42 3D view of foundation piles in Revit ................................................................. 61
Image 3-43 Foundation piles with analytical representation ............................................... 62
Image 3-44 First abutment family creation. Optimum visual results, but bad analytical
representation ........................................................................................................................ 63
Image 3-45 Analytical representation of abutment ............................................................ 64
Image 3-46 3D view of abutment ....................................................................................... 64
Image 3-47 Bearings scheme .............................................................................................. 64
Image 3-48 3D view of supports ......................................................................................... 65
Image 3-49 Boundaries condition assigned......................................................................... 66
Image 3-50 Pinned Boundary condition .............................................................................. 66
Image 3-51 Roller boundary condition ............................................................................... 66
Image 3-52 Principal Beams ............................................................................................... 67
Image 3-53 Stiffeners addition ........................................................................................... 68
Image 3-54 Nested family created ...................................................................................... 69
Image 3-55 Internal trusses ................................................................................................ 70
ix
Image 3-56 Bottom braces ................................................................................................. 70
Image 3-57 Top braces ....................................................................................................... 71
Image 3-58 Prefabricated slabs .......................................................................................... 72
Image 3-59 Casted in place slabs ........................................................................................ 73
Image 3-60 Asphalt layer .................................................................................................... 74
Image 3-61 Security barriers and road stripes addition ....................................................... 75
Image 3-62 Rebar applied to foundations and abutments .................................................. 76
Image 3-63 3D overpass view ............................................................................................. 77
Image 3-64 Analytical model view ...................................................................................... 77
Image 3-65 CSiBridge information chart ............................................................................. 78
Image 3-66 Detail of exported analytical elements ............................................................. 79
Image 3-67 Detail of imported analytical elements............................................................. 79
Image 3-68 CSiBridge analytical model ............................................................................... 80
Image 3-69 CSiBridge architectonic model ......................................................................... 80
Image 4-1 WBS codes assigned .......................................................................................... 86
Image 4-2 Shared parameters ............................................................................................ 87
Image 4-3 Schedule maintenance plan ............................................................................... 88
Image 4-4 Schedule Security Barrier ................................................................................... 89
Image 4-5 Highlighted 01.OM.CV.01.SP.01 code WBS......................................................... 89
Image 4-6 Parameters in object properties......................................................................... 90
Image 4-7 URL parameter in Abutment wall ....................................................................... 91
Image 4-8 URL field added to the Schedule ........................................................................ 92
Image 4-9 Abutment description ........................................................................................ 92
Image 4-10 Abutment manual of use ................................................................................. 93
Image 4-11 Abutment maintenance manual....................................................................... 93
Image 4-12 Maintenance program ..................................................................................... 94
Image 4-13 Maintenance plan sheet .................................................................................. 95
Image 4-14 Browser organization properties ...................................................................... 98
Image 4-15 Project browser ............................................................................................... 98
Image 4-16 Append querys .............................................................................................. 100
Image 4-17 New querys created ....................................................................................... 100
Image 4-18 Pavement form .............................................................................................. 101
Image 4-19 Description report ......................................................................................... 101
Image 4-20 Manual of use report ..................................................................................... 102
Image 4-21 Maintenance manual report .......................................................................... 102
x
Image 4-22 Control panel ................................................................................................. 103
Image 4-23 Created tasks ................................................................................................. 104
Image 4-24 Gant chart ..................................................................................................... 105
Image 4-25 Example of attached items to the first task .................................................... 107
Image 4-26 Task types creation ........................................................................................ 108
Image 4-27 Example of running simulation ....................................................................... 108
Image 4-28 Example of running simulation ....................................................................... 109
Graphics List
Figure 3-1 Civil 3D Performance ......................................................................................... 49
Figure 3-2 Modelling performance ..................................................................................... 83
Figure 4-1 Maintenance plan linking................................................................................. 111

SECTION 1 : INTRODUCTION
2
BIM
Definition:
The term Building Information Modelling (BIM) has many interpretations and definitions.
BIM is the acronym for Building Information Modelling or Building Information Model became
over time Building Information Management. The different meanings of the same acronym are
due to the fact that the applications of BIM have evolved over time and that the potential of
BIM was wider than initially foreseen.
BIM is a process in which different actors work together, efficiently exchange information
(data and geometry) and collaborate to provide a more efficient construction process (e.g. less
errors, faster construction) but also more efficient buildings that produce less waste and are
cheaper but also easier to operate. With that vision the key is not the three-dimensional
modelling itself, but the information developed, managed and shared, in support of better
collaboration.
The US National Building Information Model Standard Project Committee has the following
definition:
Building Information Modeling (BIM) is a digital representation of physical and functional
characteristics of a facility. A BIM is a shared knowledge resource for information about a facility
forming a reliable basis for decisions during its life-cycle; defined as existing from earliest
conception to demolition
Building Information Modelling is generally used during design, construction and operation
in order to:
- Provide support for the project’s decision-making process
- Parties have a clear understanding of the project objectives & interfaces with other related
trades/stakeholders
- Visualize design solutions
- Assist in design and the coordination of designs
- Increase and secure the quality of the building process and the final product
- Make the process during construction more effective and efficient
- Improve safety during construction and throughout the building’s lifecycle
- Support the cost and lifecycle analysis of the project
- Support the transfer of project data into data management software during operation. [1]
3
BIM importance today:
No matter how simple or how complicated a construction project is, utilizing Building
Information Modeling, or BIM, is an important part of the process that can have a big impact on
the end result. From the pre-planning and construction stages, on through to the final approvals,
taking advantage of the BIM process is a smart solution for effective project execution, and it’s
something that can give construction and engineering companies a leg up over the competition.
With BIM, construction managers utilize specialized software to create what are known as
building information models. These files, which contain detailed information about a particular
space, including all of its unique characteristics, are all stored within the same project for easy
access. Having this type of detailed information makes it easier to create building plans, make
changes to the existing space, and to maintain the space once it has been completed, a big value-
add for building owners.
Instead of having to rely on 2D building plans and layouts, today’s project managers and their
clients can take advantage of BIM software and the opportunities that it offers. Utilizing BIM
software in big projects offers improved opportunities for different teams to collaborate across
project teams and also facilitates improved communications. BIM software also makes it
possible to hand over all of the facility information once a construction project has been
completed, so that building owners have a full record of the building and the project. When it
comes to having complete transparency into any project from the design to the final
construction, increased visibility can be enjoyed with BIM. [2]
How does Building information management help?
Improves Productivity and Reduces Cost
Building information management being a single point of reference improves communication
and operational efficiency. It heavily cuts down the cross referencing and approval time during
the project's construction phase leading to greater improvements in productivity and quality of
work. Increased productivity in turn directly reduces the overall project construction time and
costs.
Decreases Reworks
Unclear information between designers and executioners, or lack of updates or changes in
design information may lead to minor or major reworks which may heavily burn the company's
4
finances. As BIM is centralized, any updates or changes made are instantly reflected leading to
uniformity of information and work which leads to zero construction errors.
Provides Related Documents
Though infrastructural designs are substantiated with scores of design documents like 2D or
3D drawings; they lack other important information like contract agreement details, bids, bills
of purchase, building and government specifications, schedules, etc. This is where BIM services
come in and fill up all the information holes to bring an overall coordination. BIM also
significantly improves over 2D drafting giving an all angle view of the building and elevation,
which helps in rectifying errors beforehand.
Gives Complete Project Snapshot
Unlike the general practice where one department isn't fully aware or informed about other
department in the overall project, building information management services give stakeholders,
engineers, designers, managers, etc., an overall view of the entire project. This provides people
associated with the project with reliable information that is easily available and track project
assessment, communication, coordination, cost estimations, and progress.
Improves Coordination
With BIM, one department can work coherently with the other by indexing their work in
centrally located BIM data. This improves coordination and provides a great work environment.
Enhances Customer Satisfaction
The overall quality, speed of work, information transparency and consistency surely make
customers extremely satisfied and happy with your work. [3]
BIM throughout the project-life cycle:
A construction project passes through multiple phases from inception to demolition. These
phases are typically referred to as Project Lifecycle Phases (PLPs) and include pre-construction
activities like programming, cost planning as well as post-construction activities like occupancy
and facility maintenance.
The effects of BIM in the different phases can be summarized as:
5
BIM Stage 1: Object-Based Modelling
BIM implementation is initiated through the deployment of an ‘object-based 3D parametric
software tool’ similar to ArchiCAD®, Revit®, Digital Project® and Tekla®. At Stage 1, users
generate single-disciplinary models within either design, construction or operation – the three
Project Lifecycle Phases. These models - like architectural design models and duct fabrication
models- are primarily used to automate the generation and coordination of 2D documentation
and 3D visualizations. Other deliverables of Stage 1 models include basic data exports (ex: door
schedules, concrete quantities, FFE costs, etc.) and light-weight 3D models (ex: 3D DWF, 3D PDF,
NWD, etc...) which have no modifiable parametric attributes. However, the ‘semantic’ nature of
object-based models and their ‘hunger’ for early and detailed resolution of design and
construction matters encourage ‘fast-tracking’ of Project Lifecycle Phases
BIM Stage 2: Model-Based Collaboration
Having developed single-disciplinary modelling expertise through Stage 1 implementations,
Stage 2 players actively collaborate with other disciplinary players. This may occur in many
technological ways according to each player’s selection of BIM software tools.
Model-based collaboration can occur within one or between two Project Lifecycle Phases.
Examples of this include the Design-Design interchange of architectural and structural models,
the Design-Construction interchange of structural and steel models and the Design-Operations
interchange of architectural and facility maintenance models. Stage 2 maturity also alters the
granularity of modelling performed at each lifecycle phase as higher-detail construction models
move forward and replace (partially or fully) lower-detail design models
BIM Stage 3: Network-Based Integration
In this stage semantically-rich integrated models are created, shared and maintained
collaboratively across Project Lifecycle Phases. This integration can be achieved through model
server technologies (using proprietary, open or non-proprietary formats), single / integrated /
distributed / federated databases and/or SaaS (Software as a Service) solution. [4]
6
Interoperability:
With respect to software, the term interoperability is used to describe the capability of
different programs to exchange data via a common set of exchange formats, to read and write
the same file formats, and to use the same protocols. [5]
In the construction industry where one-off projects teams are assembled across different
organizations, disciplines and phases; different discipline tools to share information with each
other are required as well as data generated in one phase to be usable without re-entry for the
next phase. This is the foundation for openBIM. There cannot be a true openBIM workflow
without interoperable software.
Semantic interoperability and BIM
To communicate with each other systems need to use common data formats and
communication protocols. Examples of formats are XML, JSON, SQL, ASCII and Unicode.
Examples of protocols are HTTP, TCP, FTP and IMAP. When systems are able to communicate
with each other using these standards they exhibit syntactic interoperability.
For BIM tools to work together is needed more than just the ability to transfer information.
Is needed the ability to transfer meaning. What is sent must be the same as what is understood.
To achieve this both sides must refer to a common information exchange reference model. We
need semantic interoperability. [6]
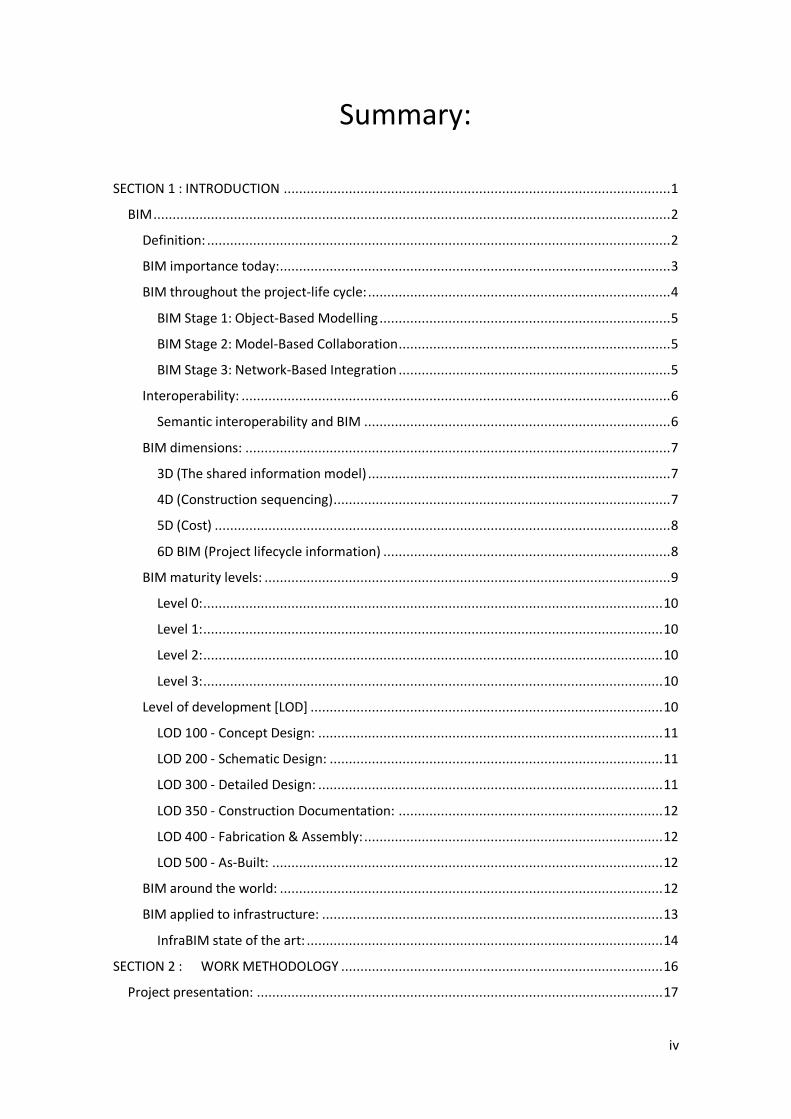
7
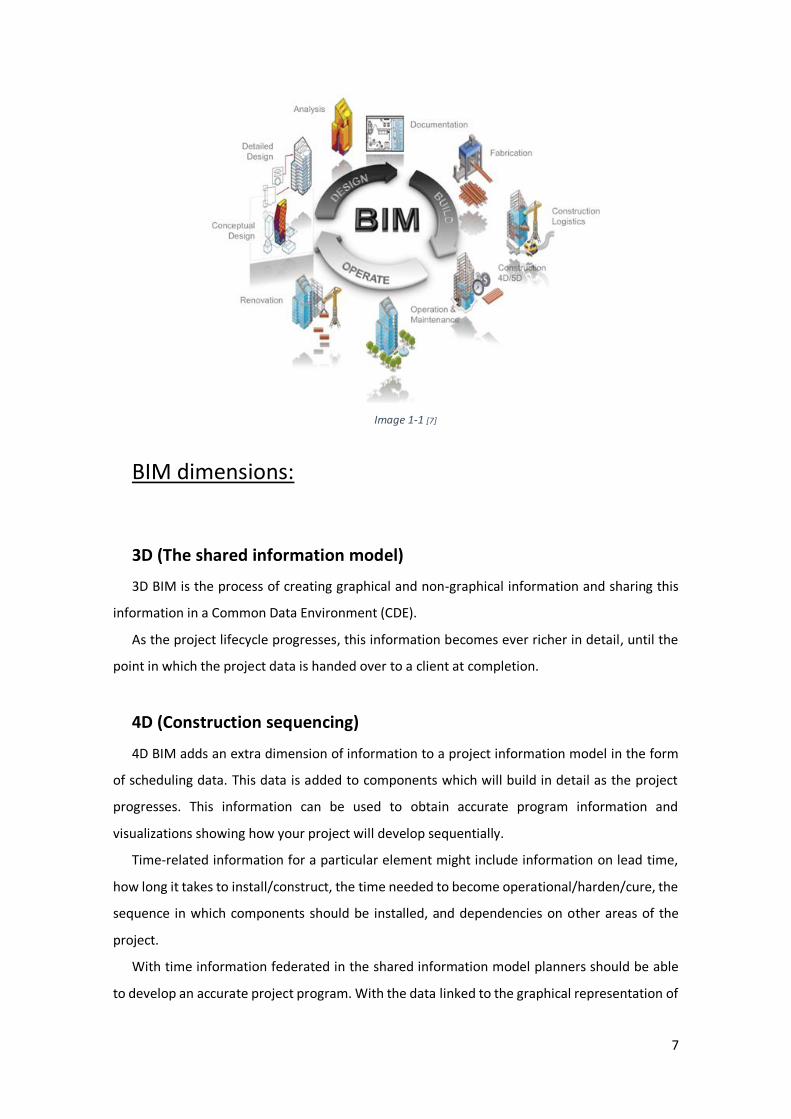
Image 1-1 [7]
BIM dimensions:
3D (The shared information model)
3D BIM is the process of creating graphical and non-graphical information and sharing this
information in a Common Data Environment (CDE).
As the project lifecycle progresses, this information becomes ever richer in detail, until the
point in which the project data is handed over to a client at completion.
4D (Construction sequencing)
4D BIM adds an extra dimension of information to a project information model in the form
of scheduling data. This data is added to components which will build in detail as the project
progresses. This information can be used to obtain accurate program information and
visualizations showing how your project will develop sequentially.
Time-related information for a particular element might include information on lead time,
how long it takes to install/construct, the time needed to become operational/harden/cure, the
sequence in which components should be installed, and dependencies on other areas of the
project.
With time information federated in the shared information model planners should be able
to develop an accurate project program. With the data linked to the graphical representation of
8
components/systems it becomes easy to understand and query project information and it is also
possible to show how construction will develop, sequentially, over time showing how a structure
will visually appear at each stage.
5D (Cost)
Drawing on the components of the information model being able to extract accurate cost
information is what's at the heart of 5D BIM.
Considerations might include capital costs (the costs of purchasing and installing a
component), its associated running costs and the cost of renewal/replacement down the line.
These calculations can be made on the basis of the data and associated information linked to
particular components within the graphical model. This information allows cost managers to
easily extrapolate the quantities of a given component on a project, applying rates to those
quantities, thereby reaching an overall cost for the development.
The benefits of a costing approach linked to a model include the ability to easily see costs in
3D form, get notifications when changes are made, and the automatic counting of
components/systems attached to a project. However, it's not just cost managers who stand to
benefit from considering cost as part of your BIM process. Assuming the presence of 4D program
data and a clear understanding of the value of a contract, you can easily track predicted and
actual spend over the course of a project. This allows for regular cost reporting and budgeting
to ensure efficiencies are realized and the project itself stays within budget tolerances.
6D BIM (Project lifecycle information)
The construction industry has traditionally been focused on the upfront capital costs of
construction. Shifting this focus to better understand the whole-life cost of assets, where most
money is proportionately spent, should make for better decisions upfront in terms of both cost
and sustainability. This is where 6D BIM comes in.
Sometimes referred to as integrated BIM or iBIM, 6D BIM involves the inclusion of
information to support facilities management and operation to drive better business outcomes.
This data might include information on the manufacturer of a component, its installation date,
required maintenance and details of how the item should be configured and operated for
optimal performance, energy performance, along with lifespan and decommissioning data. [8]
9
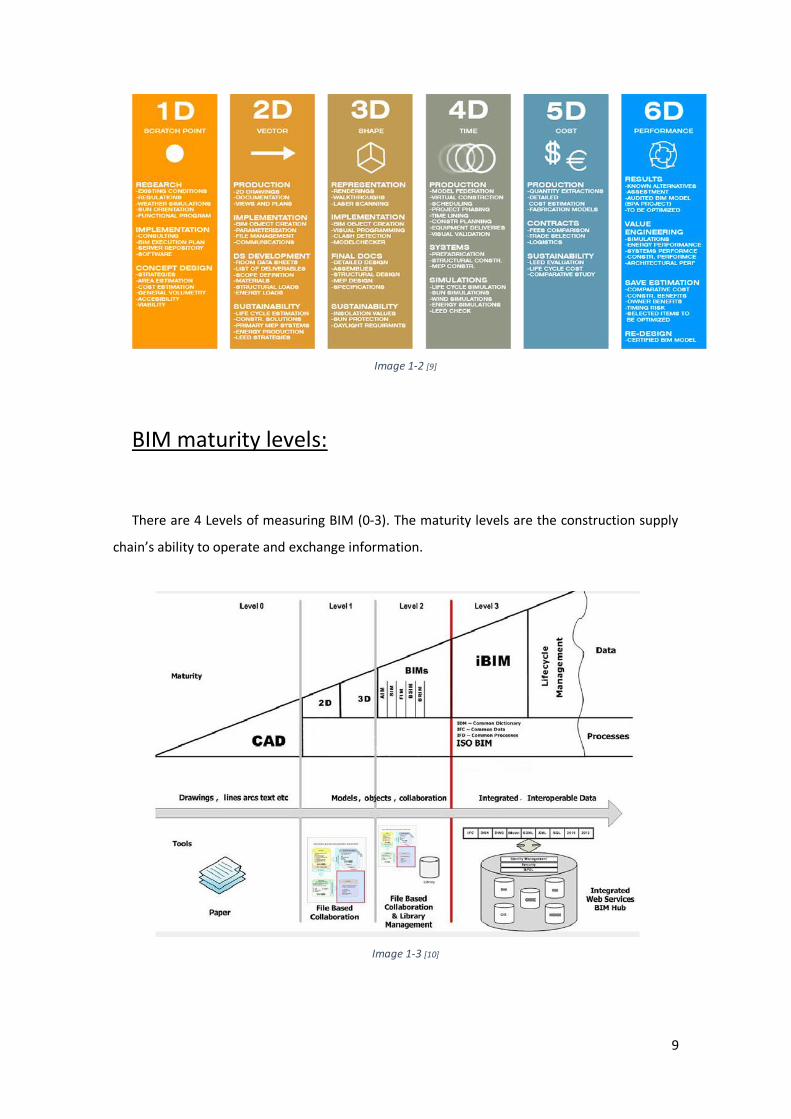
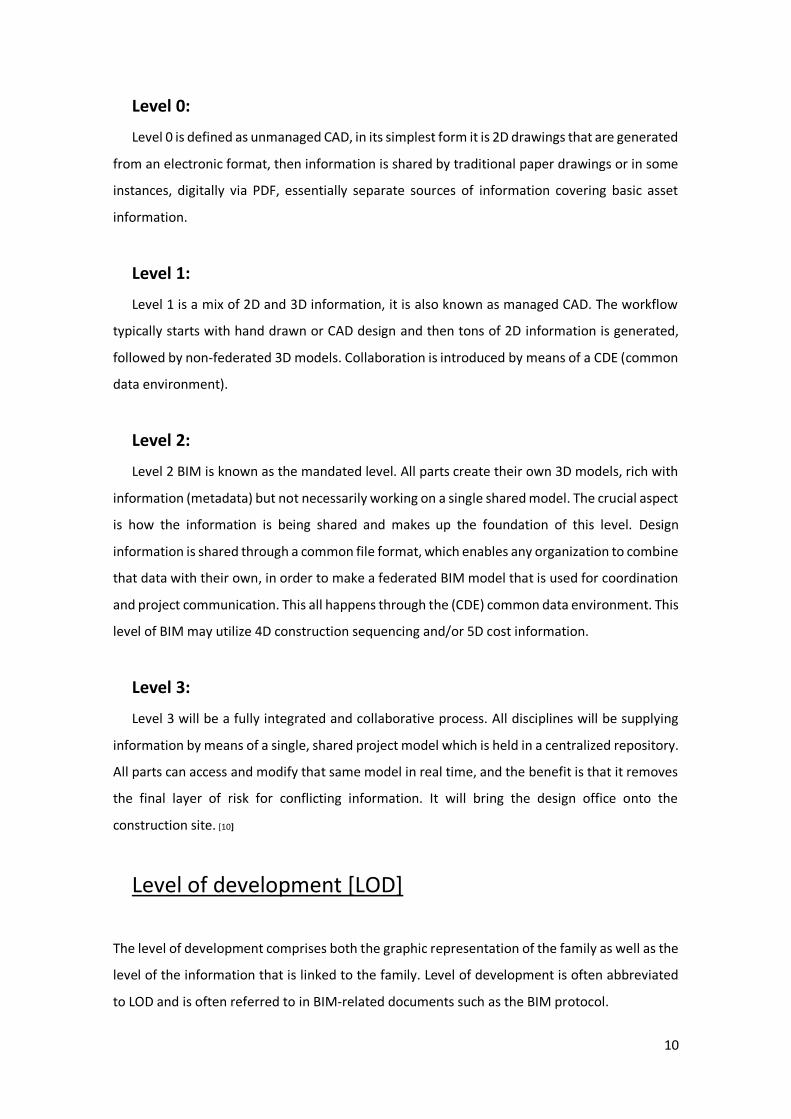
Image 1-2 [9]
BIM maturity levels:
There are 4 Levels of measuring BIM (0-3). The maturity levels are the construction supply
chain’s ability to operate and exchange information.
Image 1-3 [10]
10
Level 0:
Level 0 is defined as unmanaged CAD, in its simplest form it is 2D drawings that are generated
from an electronic format, then information is shared by traditional paper drawings or in some
instances, digitally via PDF, essentially separate sources of information covering basic asset
information.
Level 1:
Level 1 is a mix of 2D and 3D information, it is also known as managed CAD. The workflow
typically starts with hand drawn or CAD design and then tons of 2D information is generated,
followed by non-federated 3D models. Collaboration is introduced by means of a CDE (common
data environment).
Level 2:
Level 2 BIM is known as the mandated level. All parts create their own 3D models, rich with
information (metadata) but not necessarily working on a single shared model. The crucial aspect
is how the information is being shared and makes up the foundation of this level. Design
information is shared through a common file format, which enables any organization to combine
that data with their own, in order to make a federated BIM model that is used for coordination
and project communication. This all happens through the (CDE) common data environment. This
level of BIM may utilize 4D construction sequencing and/or 5D cost information.
Level 3:
Level 3 will be a fully integrated and collaborative process. All disciplines will be supplying
information by means of a single, shared project model which is held in a centralized repository.
All parts can access and modify that same model in real time, and the benefit is that it removes
the final layer of risk for conflicting information. It will bring the design office onto the
construction site. [10]
Level of development [LOD]
The level of development comprises both the graphic representation of the family as well as the
level of the information that is linked to the family. Level of development is often abbreviated
to LOD and is often referred to in BIM-related documents such as the BIM protocol.
11
In this way, the level of development is determined by the relationship of two different
concepts, the level of detail and the level of information.
Level of detail [lod]: When we speak of the level of detail, we are only referring to the graphic
representation of the family. A family with a low level of detail has, for example, a simple
geometric shape such as a cube or a cylinder and will not contain any specified equipment.
Unlike the level of development, the level of detail says nothing about the information that is
linked to the family.
Level of information [loi]: Information plays a crucial role in an BIM project. The level of
information is used to indicate the level of the information that is linked to the family. A family
with an extremely high level of information comprises, for example, manufacturer-specific data
sheets and a maintenance instruction.
The three terms LOD, lod and loi can be helpful for making clear agreement with other
parties in a project. Thinking beyond the level of development alone will prevent data (graphic
or informative) being added to the model that is not used. It is important to describe in the
BIM protocol what exactly is covered by the various levels of the loi, lod and LOD. In this way,
it becomes clear which information really matters, what is expected from each party, and the
collaboration can really take off. [11]
LOD 100 - Concept Design:
The building 3D model is developed to represent the information on basic level. Thereby,
only conceptual model creation is possible in this stage. Parameters like area, height, volume,
location and orientation are defined
LOD 200 - Schematic Design:
General model where elements are modeled with approximate quantities, size, shape,
location and orientation. We can also attach non- geometric information to the model elements.
LOD 300 - Detailed Design:
Accurate modeling and shop drawings where elements are defined with specific assemblies,
precise quantity, size, shape, location and orientation. Here too we can attach non- geometric
information to the model elements.
12
LOD 350 - Construction Documentation:
It includes model detail and element that represent how building elements interface with
various systems and other building elements with graphics and written definitions.
LOD 400 - Fabrication & Assembly:
Model elements are modeled as specific assemblies, with complete fabrication, assembly,
and detailing information in addition to precise quantity, size, shape, location and orientation.
Non- geometric information to the model elements can also be attached.
LOD 500 - As-Built:
Elements are modeled as constructed assemblies for Maintenance and operations. In
addition to actual and accurate in size, shape, location, quantity, and orientation, non-geometric
information is attached to modeled elements. [12]
Image 1-4 [13]
BIM around the world:
BIM has been implemented by many countries, due to the great advantage that its use
entails, especially in the more developed countries, and it has become mandatory in public
procurements for major projects in many places. If we talk about Italy, this measure will apply
from 2019.
13
Image 1-5 [14]
BIM applied to infrastructure:
The BIM term was originally devised for the Architectural Industry. It is easy to envisage a 3D
model of a building and all its components contained within a defined structure. However, Civil
Engineering or Infrastructure Projects tend to be diverse and spread over a large geographical
area. Therefore, BIM for Infrastructure could be reinterpreted as building an information model
for a Civil Engineering/Infrastructure Project. [15]
Nowadays, as an ever-higher percentage of infrastructure projects use BIM, many in the
industry are realizing they need to embrace it to compete and win new work. A range of
appealing benefits accompany projects that use a BIM-based approach: less rework, fewer
errors, enhanced collaboration, and design data that can ultimately be used to support
operations, maintenance, and asset management. Owners of civil infrastructure, including
government agencies, don’t want to miss out on those benefits, and they are increasingly
mandating the use of BIM on their projects. [16]

14
InfraBIM state of the art:
According to a research done by Dodge Data & Analytics (North America’s leading provider
of analytics and software-based workflow integration solutions for the construction industry)
and partners, in 2017 in different countries (U.S., U.K., France and Germany), a dramatic growth
in BIM implementation was reported:
BIM users at a high level of implementation (on at least half of their projects) grew from
20% in 2015 to 52% in 2017.
By 2019, 61% forecast that they will be at that high level of implementation.
Between 2017 and 2019, the growth in BIM implementation is most dramatic among
those deploying BIM on nearly all (75% or more) of their projects, with the percentage almost
doubling from 17% to 32%.
These levels of growth are relatively consistent in all four countries despite other differences
between these markets. The study demonstrates that there are some compelling reasons for
the embrace of BIM in the transportation sector:
Most BIM users (87%) report that they see positive value from their use of BIM. Another
positive sign is that most believe that they are just starting to see the full potential of BIM, a
driver for wider future implementation.
Nearly two thirds believe that they are seeing a positive ROI from their use of BIM, with
about half of those reporting a ROI of 25% or more.
Most of them find that using BIM improves their processes and project outcomes most
by reducing errors and providing greater cost predictability.
Over half also report that BIM helps them to achieve two types of business benefits:
o They can do business better through improving younger staff’s understanding of how
projects go together and establishing a consistent and repeatable project delivery process.
o They can find more work through increased ability to offer services and by being able to
maintain business with previous clients.
Dodge Data & Analytics measures the growth of BIM implementation (the percentage of
projects on which a user deploys it) as a key indicator of the dynamics of BIM usage. The chart
below shows how many of the engineers and contractors who are currently working with BIM
report they were (2015), are (2017), and expect to be (2019) using BIM on 50% or more of their
transportation infrastructure projects.
The percentage of heavy BIM users (deploying it on half or more of their transportation
infrastructure projects) powerfully surged between 2015 and 2017.
15
While the growth of heavy users is predicted to slow somewhat over the next two years,
within that group, the proportion of very heavy users (deploying it on 75% or more of their
projects) will grow by 100% to 200% in the four countries studied. This implementation pattern
reflects an evolving BIM maturity that Dodge Data & Analytics has observed in other sectors and
is a positive indicator that BIM usage will continue to advance for transportation infrastructure.
[17]
Image 1-6 [17]
There are 5 top benefits that have been experienced at a high or very high level by at least
50% of the respondents:
Image 1-7 [17]

16
SECTION 2 : WORK METHODOLOGY
17
Project presentation:
S.S. 372 Telesina:
The state road 372 Telesina (SS 372) is an Italian state road that begins at the toll booth of
the A1 Milan-Naples and ends at Benevento, on the Benvento motorway junction 9 at the
intersection with the SS 7 Appia (Length 70.140 km).
This artery is of local importance for the connection of the Samnite capital with its western
province (Telese Terme), but also of regional and national importance, because it allows to reach
the A1 (and therefore Rome) easily from Benevento. It also allows an alternative route between
the same A1 and the Benevento tollgate of the A16 Napoli-Canosa, which is much shorter than
the one entirely on the motorway.
Image 2-1 Google map image, showing the Telesina development
Project to carry out:
The project to develop is based on an adaptation to 4 lanes of the S.S. 372 "Telesina" from
km 0 + 000 to km 60 + 900. This implies the accomplishment of complementary works, which
will allow the correct operation once finished the work.
18
The doubling of the route will be accompanied by the "project finance" system, and the
highway will become a toll motorway but owned by ANAS. The track will undergo some minor
variation compared to the existing one.
ANAS:
The national road organization (ANAS, an acronym that originally indicated the National
Autonomous Road Company) is an Italian joint stock company, which integrate since January
2018 the “Ferrovie dello Stato Italiano” Group. It is the entity in charge of the construction,
management and maintenance of networks of roads and highways.
Study case:
In the present work the project of an overpass will be analyzed, which will take place over
the Telesina, specifically at km 39 + 099.
The objective is to replace the existing overpass with a new one, due to the modifications
that will be carried out in the S.S. 372
The bridge to be built, will aim to unite Pugliano street (whose current layout will also be
modified), with the quarry in front of it, allowing the entry and exit of vehicles.
Image 2-2 Satelital image from the area of interest
19
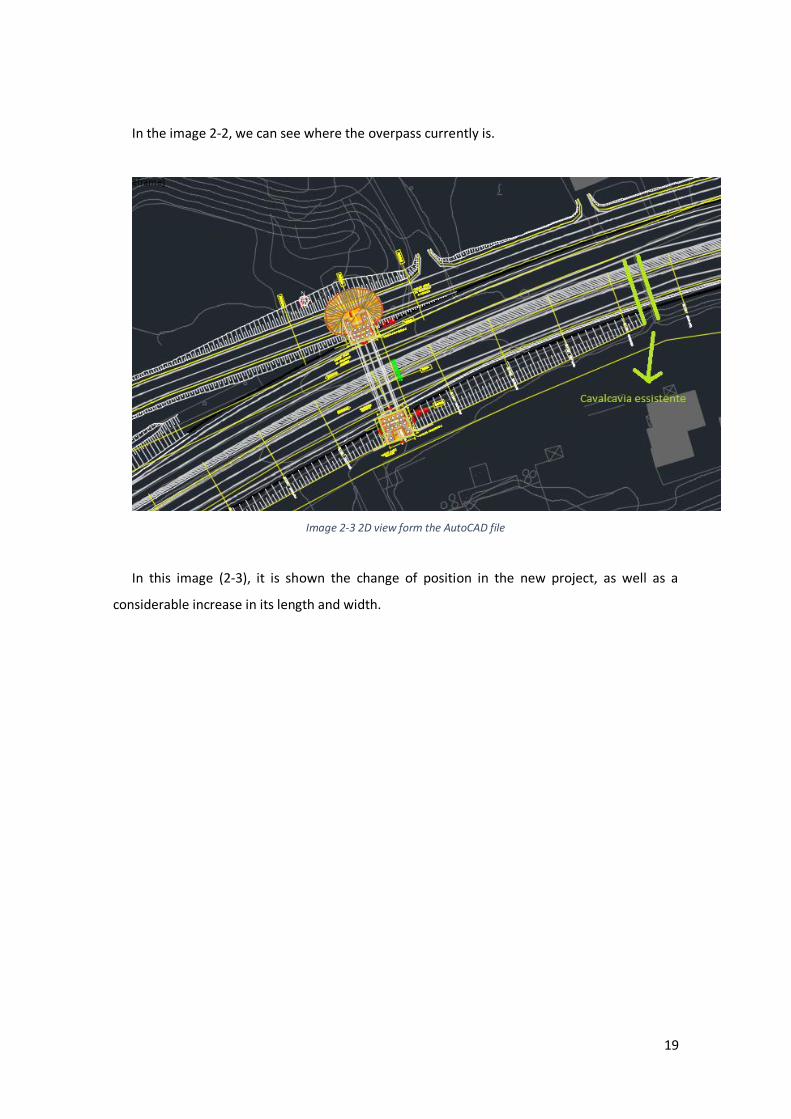
In the image 2-2, we can see where the overpass currently is.
Image 2-3 2D view form the AutoCAD file
In this image (2-3), it is shown the change of position in the new project, as well as a
considerable increase in its length and width.
20
Organization:
First approach:
The work has been developed in different stages, using different software (appropriate for
each task) in each of them. In this way it has been possible to analyze the interoperability
between them, as well as the benefits and limitations for the execution of an infrastructure
project, as is the case.
A 3D model of the project in question has been developed, achieving not only a model with
visual purposes, but also an analytical model, where a structural analysis can be performed.
Regarding this last point, no analysis has been carried out, but the interoperability between Revit
and a specific software for structural analysis was studied.
After this, the modeling has been expanded to 4 dimensions, linking the overpass and its
elements with a maintenance plan (once the bridge is finished), being able to access to
information related to the tasks to be carried out, and to their schedules.
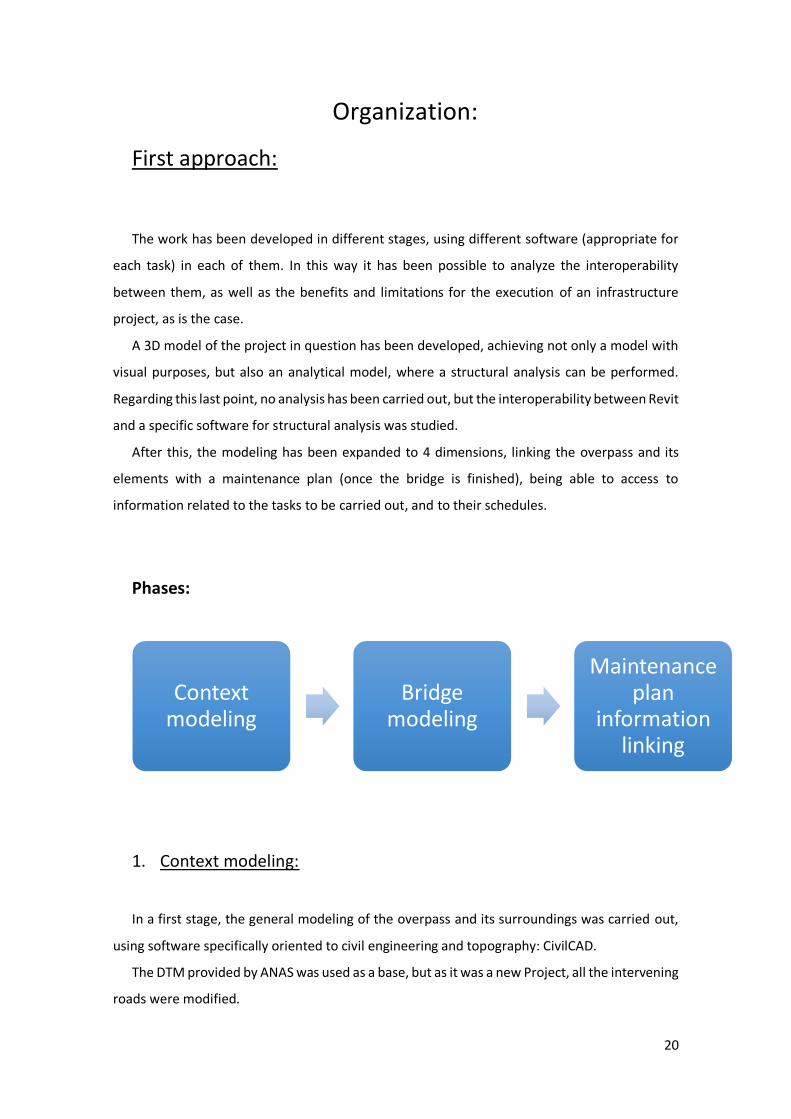
Phases:
1. Context modeling:
In a first stage, the general modeling of the overpass and its surroundings was carried out,
using software specifically oriented to civil engineering and topography: CivilCAD.
The DTM provided by ANAS was used as a base, but as it was a new Project, all the intervening
roads were modified.
Context modeling
Bridge modeling
Maintenance plan
information linking
21
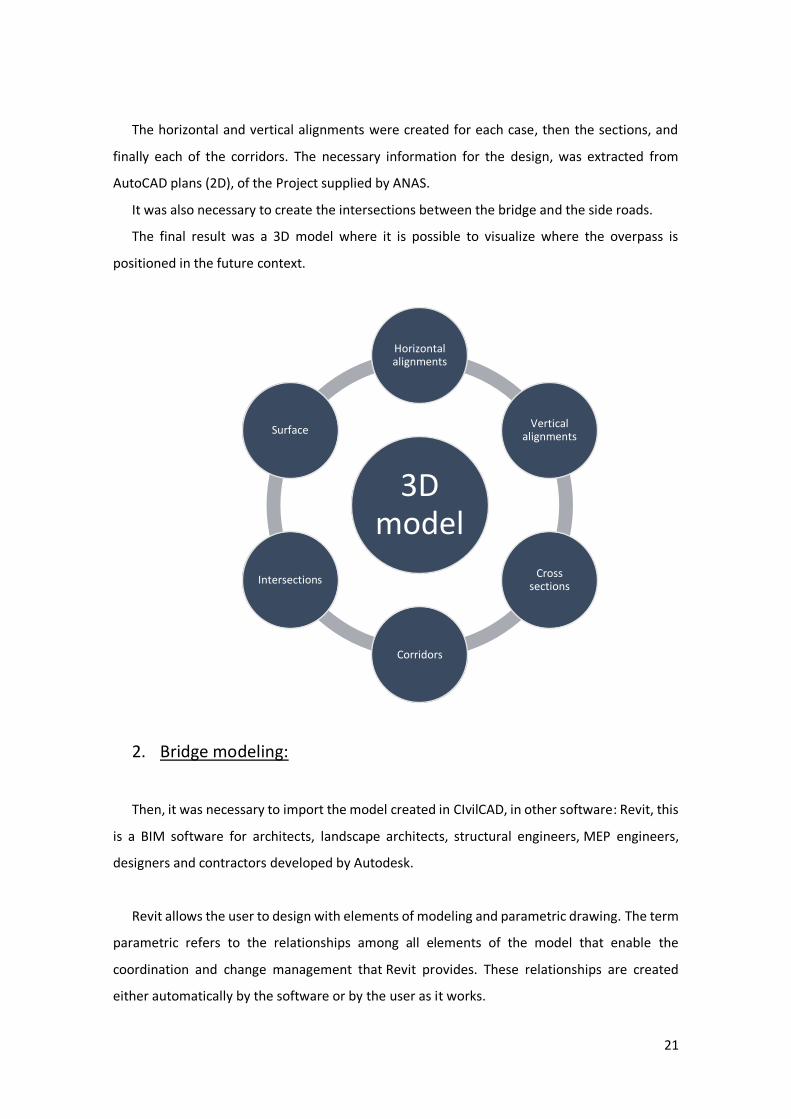
The horizontal and vertical alignments were created for each case, then the sections, and
finally each of the corridors. The necessary information for the design, was extracted from
AutoCAD plans (2D), of the Project supplied by ANAS.
It was also necessary to create the intersections between the bridge and the side roads.
The final result was a 3D model where it is possible to visualize where the overpass is
positioned in the future context.
2. Bridge modeling:
Then, it was necessary to import the model created in CIvilCAD, in other software: Revit, this
is a BIM software for architects, landscape architects, structural engineers, MEP engineers,
designers and contractors developed by Autodesk.
Revit allows the user to design with elements of modeling and parametric drawing. The term
parametric refers to the relationships among all elements of the model that enable the
coordination and change management that Revit provides. These relationships are created
either automatically by the software or by the user as it works.
3D model
Horizontal alignments
Vertical alignments
Cross sections
Corridors
Intersections
Surface
22
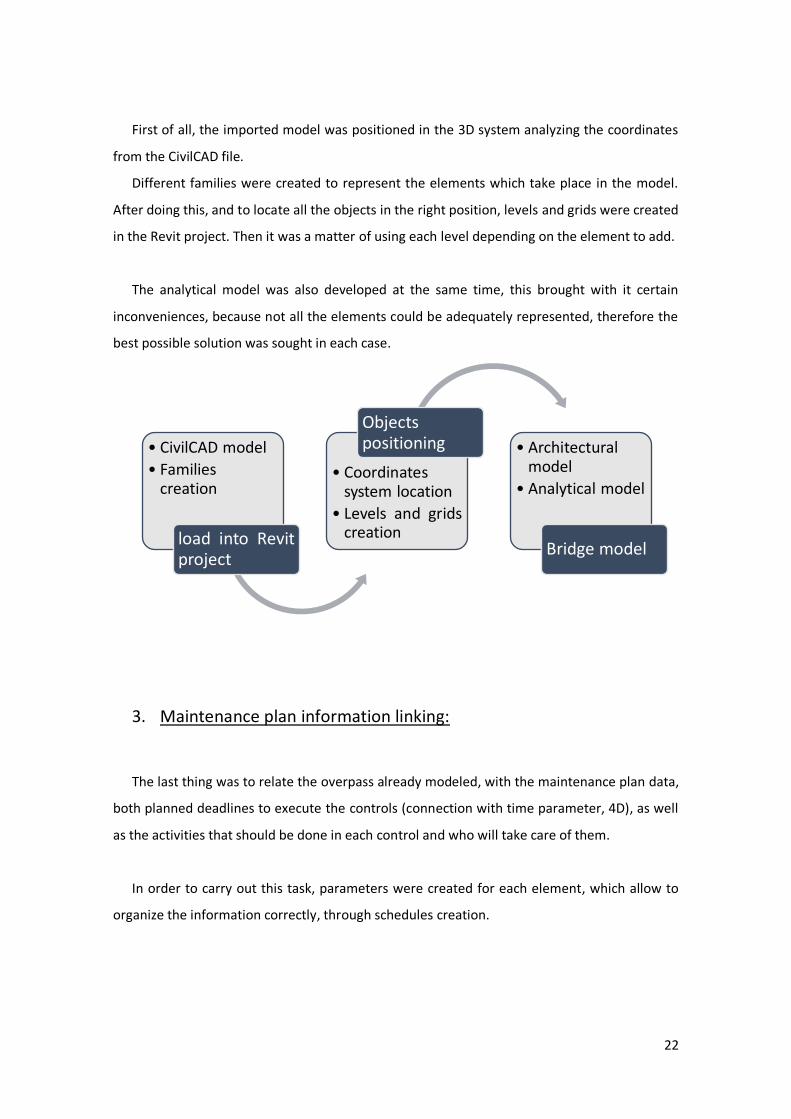
First of all, the imported model was positioned in the 3D system analyzing the coordinates
from the CivilCAD file.
Different families were created to represent the elements which take place in the model.
After doing this, and to locate all the objects in the right position, levels and grids were created
in the Revit project. Then it was a matter of using each level depending on the element to add.
The analytical model was also developed at the same time, this brought with it certain
inconveniences, because not all the elements could be adequately represented, therefore the
best possible solution was sought in each case.
3. Maintenance plan information linking:
The last thing was to relate the overpass already modeled, with the maintenance plan data,
both planned deadlines to execute the controls (connection with time parameter, 4D), as well
as the activities that should be done in each control and who will take care of them.
In order to carry out this task, parameters were created for each element, which allow to
organize the information correctly, through schedules creation.
• CivilCAD model
• Familiescreation
load into Revitproject
• Coordinatessystem location
• Levels and gridscreation
Objectspositioning • Architectural
model
• Analytical model
Bridge model
23
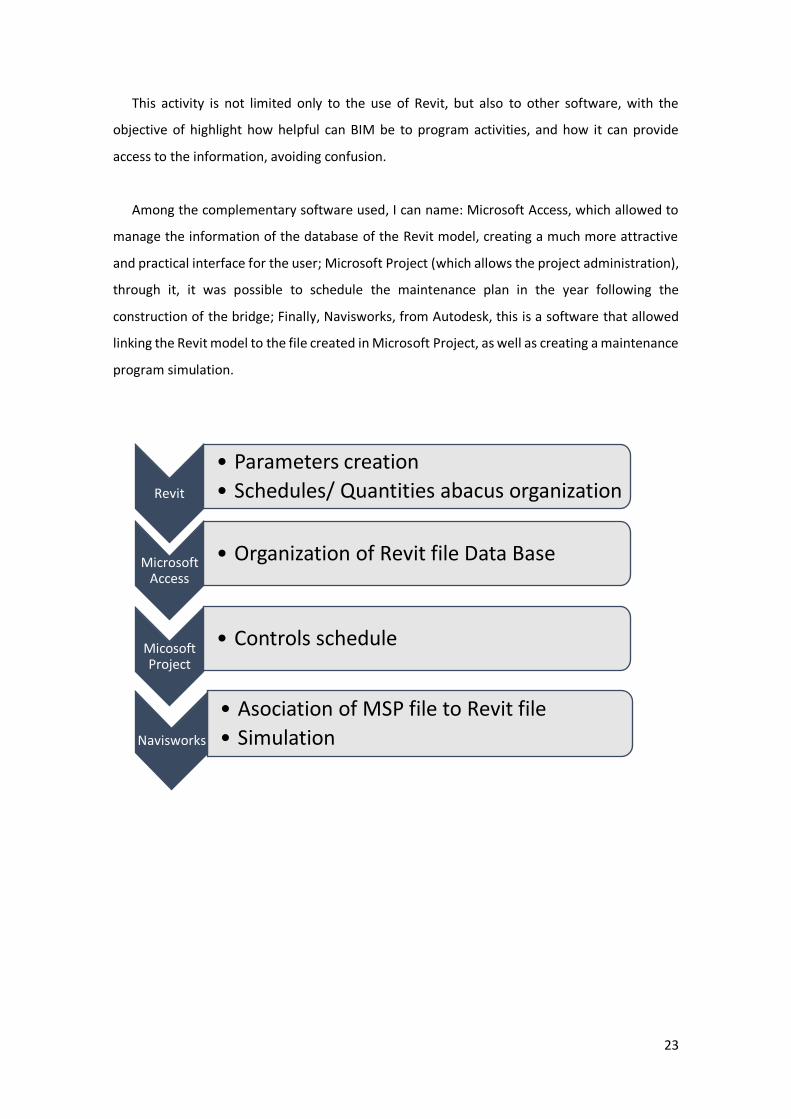
This activity is not limited only to the use of Revit, but also to other software, with the
objective of highlight how helpful can BIM be to program activities, and how it can provide
access to the information, avoiding confusion.
Among the complementary software used, I can name: Microsoft Access, which allowed to
manage the information of the database of the Revit model, creating a much more attractive
and practical interface for the user; Microsoft Project (which allows the project administration),
through it, it was possible to schedule the maintenance plan in the year following the
construction of the bridge; Finally, Navisworks, from Autodesk, this is a software that allowed
linking the Revit model to the file created in Microsoft Project, as well as creating a maintenance
program simulation.
Revit
• Parameters creation
• Schedules/ Quantities abacus organization
Micosoft Project
• Controls schedule
Navisworks
• Asociation of MSP file to Revit file
• Simulation
Microsoft Access
• Organization of Revit file Data Base
24
SECTION 3 : INFRASTRUCTURE
PROJECT ACCORDING TO BIM
METHODOLOGY

25
CONTEXT MODELING
26
Software chosen:
The software used for modeling the environment in which the overpass will be located was
AutoCAD Civil 3D. This software was chosen mainly for being developed by Autodesk, which
allows you to download it for free with the student license, and for having a good
interoperability with the next software that I needed to use: Revit.
“Civil 3D is an engineering software application used by civil engineers and other
professionals to plan, design, and manage civil engineering projects. These projects fall under
the three main categories of land development, water, and transportation projects; and can
include construction area development, road engineering, river development, port construction,
canals, dams, embankments, and many others. Civil 3D is used to create three-dimensional (3D)
models of land, water, or transportation features while maintaining dynamic relationships to
source data such as grading objects, break lines, contours, and corridors. As an industry-leading
building information modeling (BIM) solution, Civil 3D is well known in the civil engineering
community and widely used on a variety of infrastructure projects both large and small.
Civil 3D was originally created to be an add-on for AutoCAD but as its popularity and demand
grew, it was further evolved and developed into a stand-alone product — built on the AutoCAD
platform. Civil 3D offers a familiar design environment and many AutoCAD-compatible
shortcuts; and with true DWG (drawing) file support, Civil 3D allows you to store and share
design data with existing AutoCAD users. With Civil 3D projects, changes to drafting and
annotation are automatically reflected throughout the model for quick and efficient
visualizations that remain in sync as you make design changes at any stage of the process.” [18]
Surface:
The first thing that is needed to start modeling by means of AutoCAD Civil 3D is a surface, in
which the planimetry and altimetry of the roads necessary for the project will take place.
You can create composite surfaces from a combination of points, break lines, and contours.
In this particular case, I worked with contours, which were extracted from an AutoCAD file,
provided by ANAS. The contours supplied belonged to the area of interest where the overpass
would be built.
After moving this data from the AutoCAD file to a new Civil 3D file, it was necessary to create
the surface:
27
1. First, a new empty surface was created, using the controls in the lateral toolbar.
2. Second, the imported contours were added to the surface definition recently created.
Surfaces Created surface Definition Right click on Contours Add
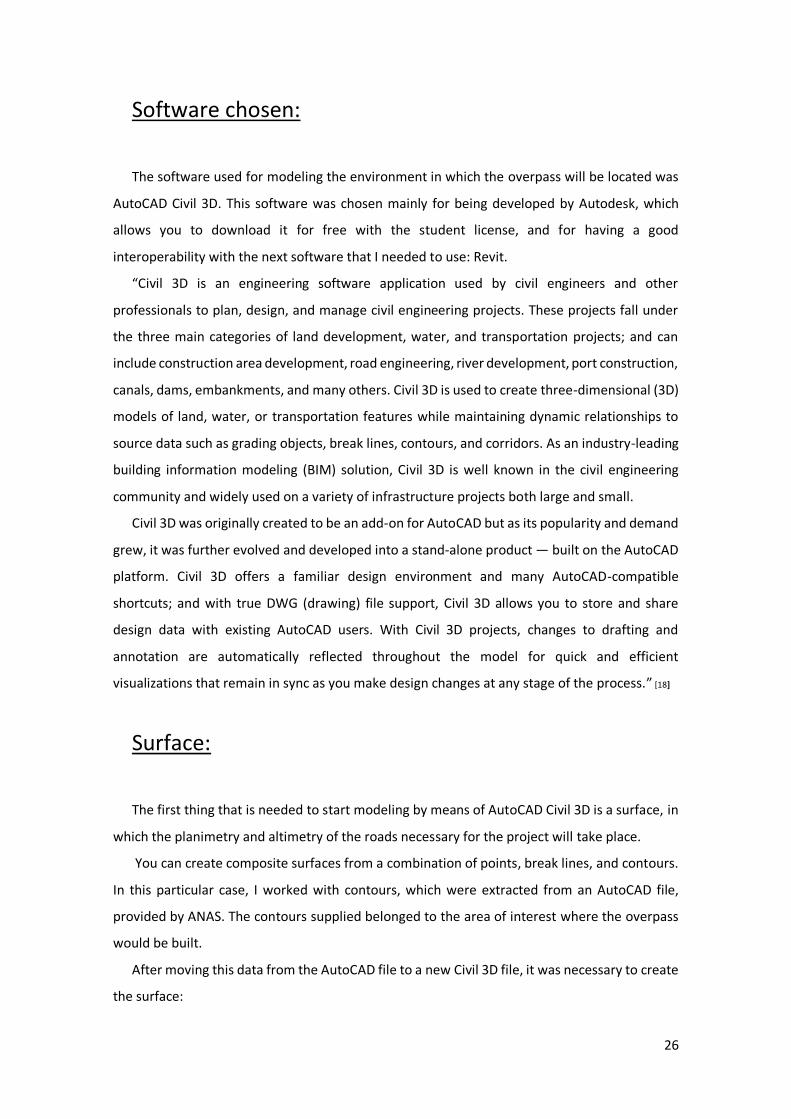
Once this was done, representative lines of the planimetric alignment were added on the
surface, both the existing alignment and the future one. It also represents where the bridge
currently is and where will be once the work is complete. This data was extracted from the same
AutoCAD file from which the contour lines were extracted.
Image 3-1 Original Surface
In yellow it is possible to see the existing alignments (S.S. 372 and Via Pugliano), and in blue,
the projected ones.
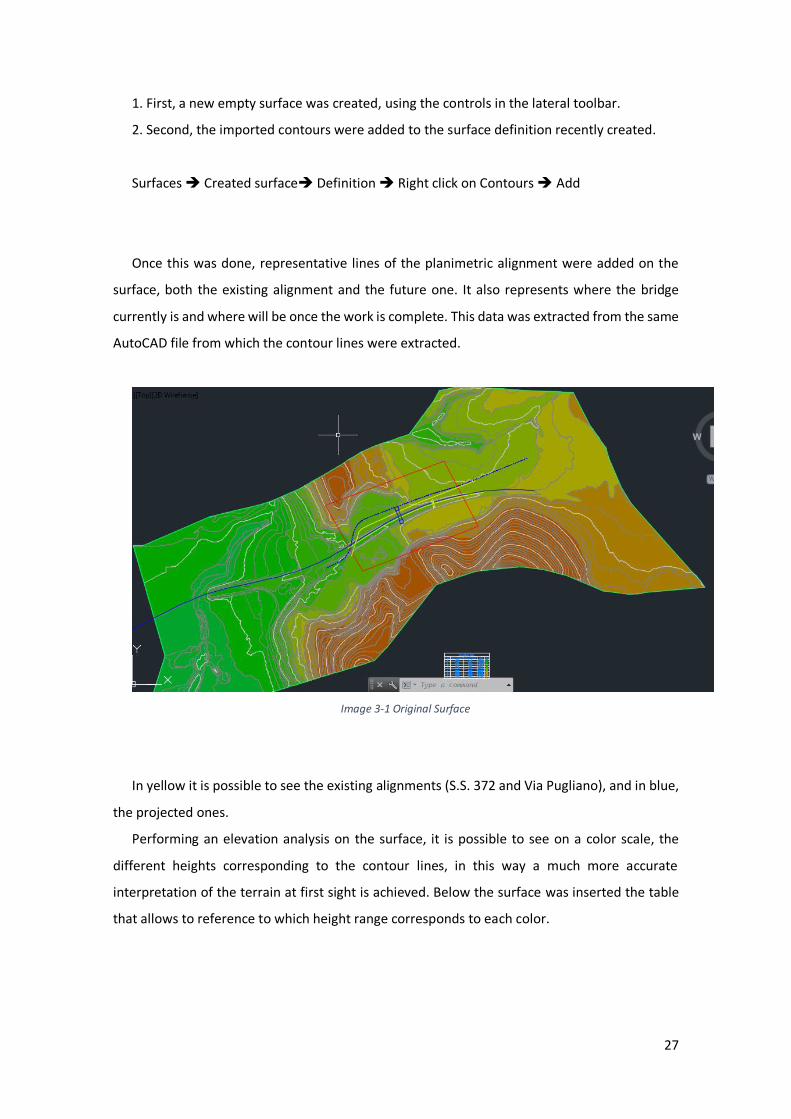
Performing an elevation analysis on the surface, it is possible to see on a color scale, the
different heights corresponding to the contour lines, in this way a much more accurate
interpretation of the terrain at first sight is achieved. Below the surface was inserted the table
that allows to reference to which height range corresponds to each color.
28
Image 3-2 Initial surface elevation table
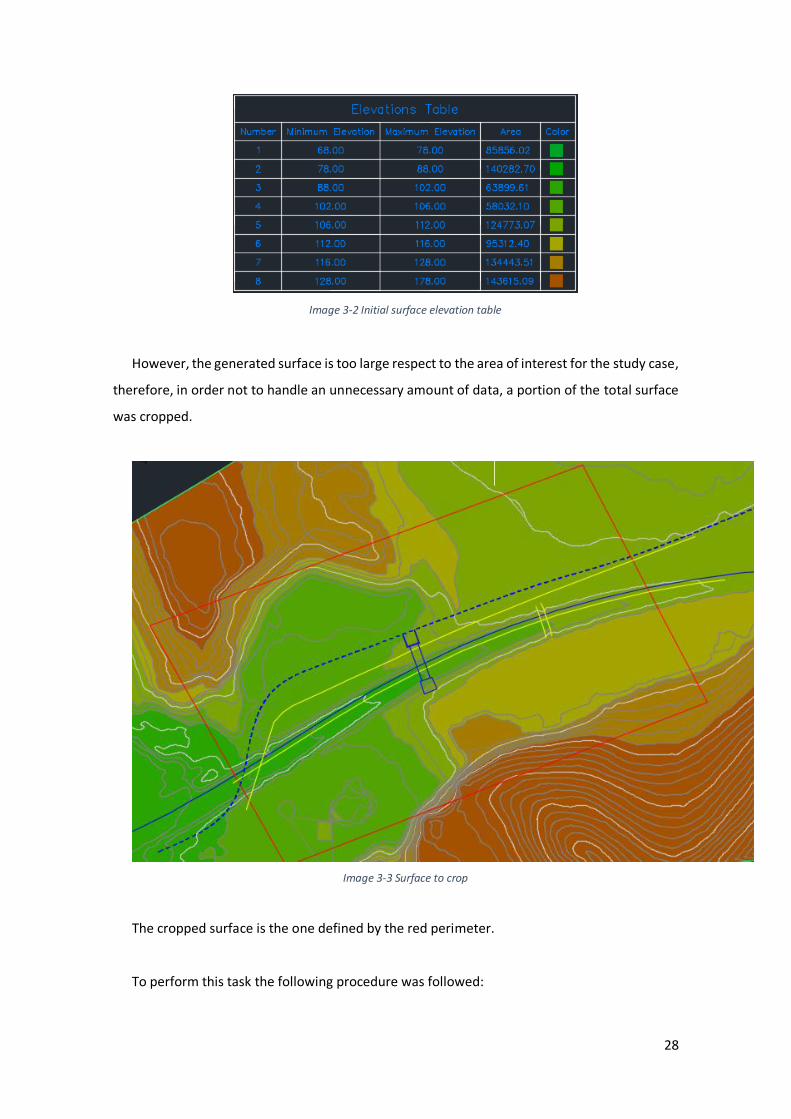
However, the generated surface is too large respect to the area of interest for the study case,
therefore, in order not to handle an unnecessary amount of data, a portion of the total surface
was cropped.
Image 3-3 Surface to crop
The cropped surface is the one defined by the red perimeter.
To perform this task the following procedure was followed:
29
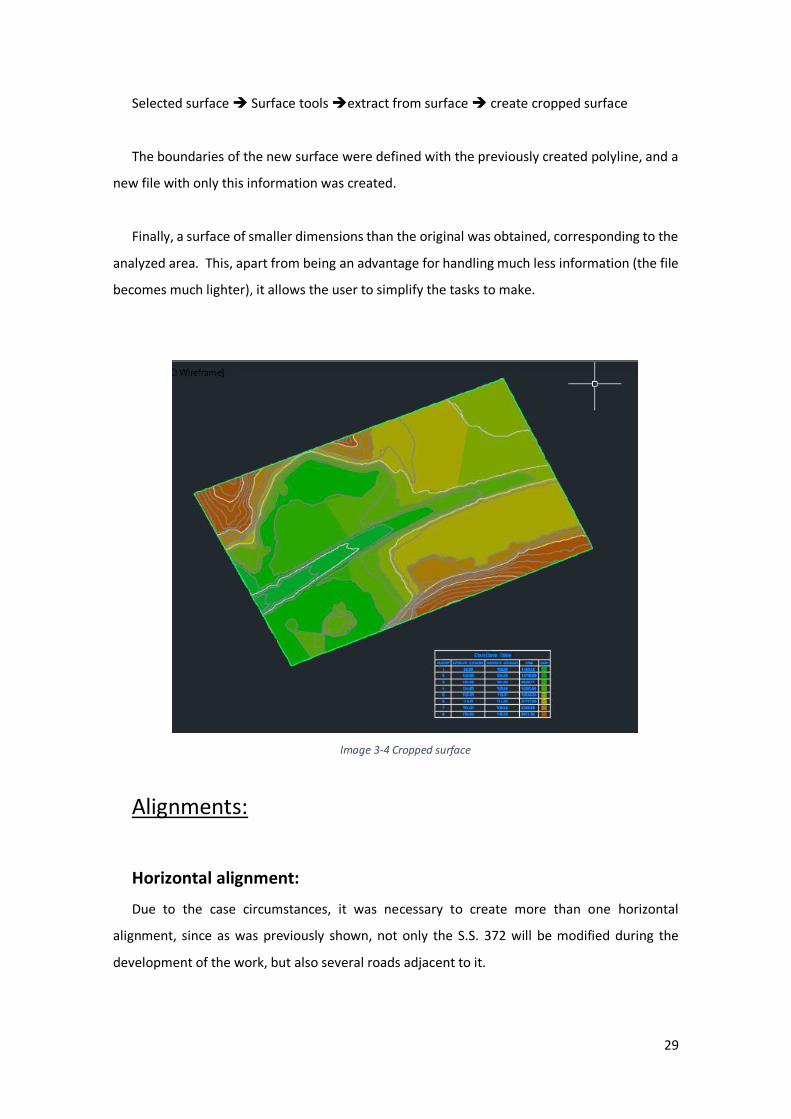
Selected surface Surface tools extract from surface create cropped surface
The boundaries of the new surface were defined with the previously created polyline, and a
new file with only this information was created.
Finally, a surface of smaller dimensions than the original was obtained, corresponding to the
analyzed area. This, apart from being an advantage for handling much less information (the file
becomes much lighter), it allows the user to simplify the tasks to make.
Image 3-4 Cropped surface
Alignments:
Horizontal alignment:
Due to the case circumstances, it was necessary to create more than one horizontal
alignment, since as was previously shown, not only the S.S. 372 will be modified during the
development of the work, but also several roads adjacent to it.
30
It is necessary to clarify that the alignments were carried out only for the area of interest of
the overpass, making possible the future context conditions.
Starting with the Telesina, the alignment was made imitating the shape of the representative
curve taken from the AutoCAD file.
The path was the following one:
HomeAlignment Alignment creation tools (type: centerline)
We must consider that a design criterion must be applied to the alignment, in this way we
make sure that the geometric design complies with the established norms, and if it is not the
case, it is possible to see warning signs on the alignment, which indicate that any of the
conditions raised by the design criteria is not being respected. The criteria can be loaded directly
from a file or created by the user. In this case, having been the design process previously carried
out by ANAS, I assumed that the alignments taken from the AutoCAD file complied with the
standard, so it has not been necessary to insert a design criterion.
Once the alignment was created, the radiuses were inserted, and the points were adjusted
to obtain a correct representation of the project.
For Via Pugliano alignment, the same procedure was followed, whereas for the alignment of
the second side street, that is, the one that allows access to the quarry and other buildings, it
was necessary to follow its path in the location shown by google maps, since I did not have this
information in the file supplied by ANAS.
Once these three roads were developed and the surroundings were defined planimetrically,
the alignment representative of the bridge could be created.
31
Image 3-5 2D view of the horizontal alignments
Vertical alignments:
Once finished the horizontal alignment, I began with the altimetry modeling.
It must be taken into account that no information related to the road profiles was found in
the AutoCAD files provided by ANAS. However, the overpass profile was in the plane, and the
levels between which it was developed. Starting from this, it was possible to determine the
intersection levels between the bridge and the two lateral streets. It was also possible to
calculate the free height of the overpass above the future S.S. 372, and in this way give an idea
of the altimetric development of it.
The procedure to carry out this task is the following:
Alignment selected Launch pad Surface Profile
When selecting the loaded surface from the contour lines, we will obtain a Cartesian
representation of the surface profile matching the selected alignment, with elevation in
ordinates and station in abscissa.
Next step is to create the vertical alignment:
32
Selected surface profile Profile creation tools
Again, we must consider a design criterion, so the minimum visibility distance for stopping is
respect and to define where overpassing is consent, also to respect the maximum permissible
slopes. To give an idea of the values used, the standard design criterion ASHTOO 2011 was
applied.
As it was said previously, to design the altimetry corresponding to the Telesina, I took as main
data the level of it at the junction with the overpass. Then I tried to follow a constant slope,
considering that represented a homogenous cut in all sections.
Image 3-6 S.S. 372 profile
After doing this operation, and before continuing with the altimetric modeling of the other
roads, it was necessary to make an intermediate step.
In order to have a better interpretation of how the surface of the terrain will be developed
as the work progresses, the section corresponding to the S.S. 372 and then its corridor, were
created. Then it was possible to create a new surface, constituted by the initial surface but
modified by the insertion of the newly generated corridor surface (all these operations will be
explained later).
In this way, when creating the surface profiles for the next alignments, I could have a better
idea of how the project will develop.
33
Image 3-7 Modified surface
The same principles previously applied, were transferred to adjacent streets, considering the
intersection with the bridge to be built.
Image 3-8 Via Pugliano profile
34
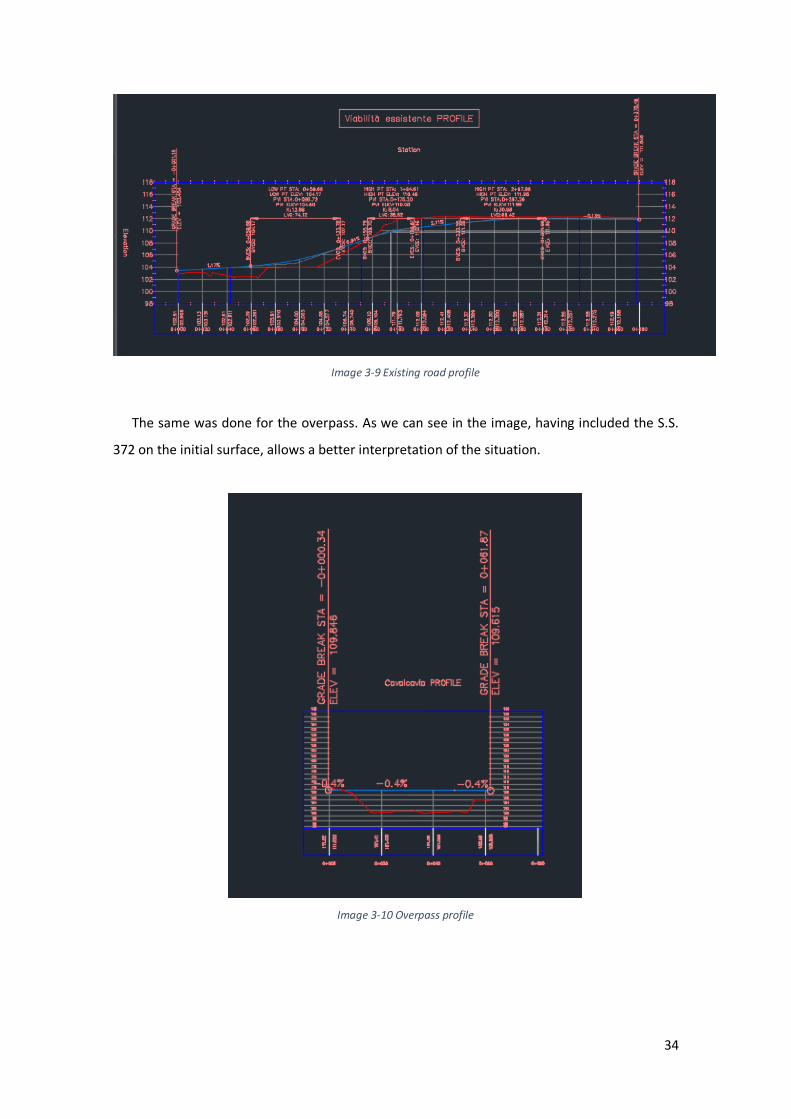
Image 3-9 Existing road profile
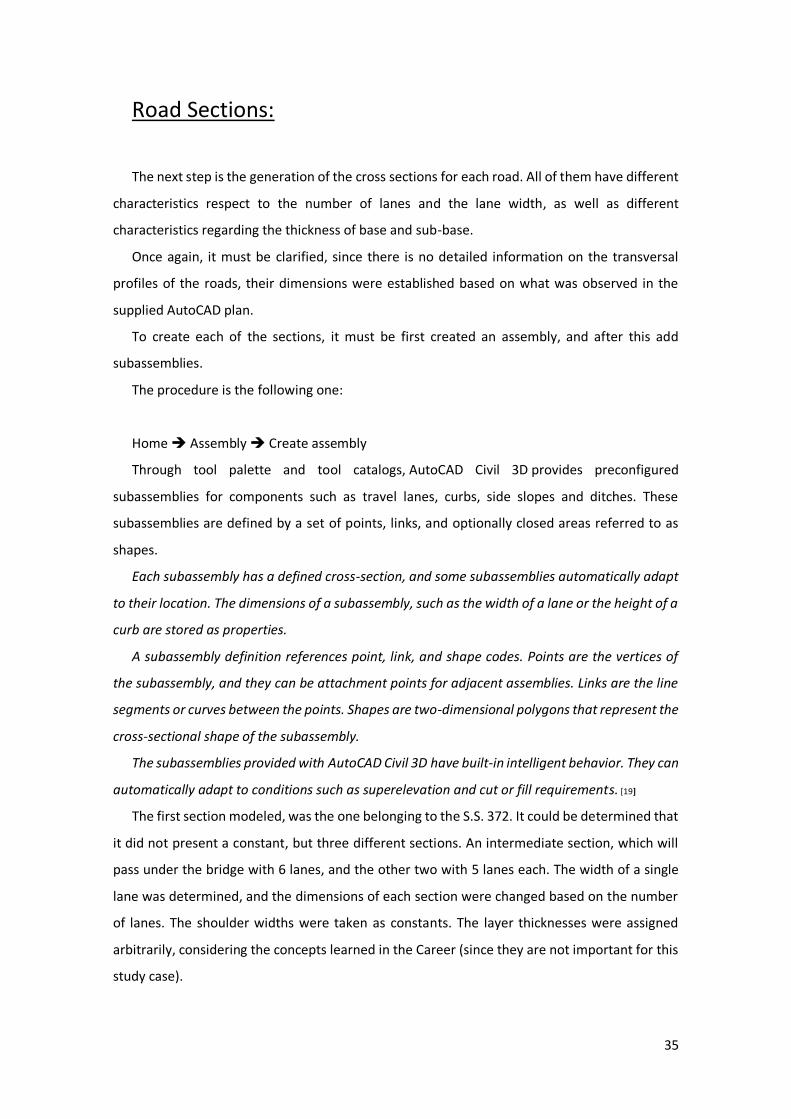
The same was done for the overpass. As we can see in the image, having included the S.S.
372 on the initial surface, allows a better interpretation of the situation.
Image 3-10 Overpass profile
35
Road Sections:
The next step is the generation of the cross sections for each road. All of them have different
characteristics respect to the number of lanes and the lane width, as well as different
characteristics regarding the thickness of base and sub-base.
Once again, it must be clarified, since there is no detailed information on the transversal
profiles of the roads, their dimensions were established based on what was observed in the
supplied AutoCAD plan.
To create each of the sections, it must be first created an assembly, and after this add
subassemblies.
The procedure is the following one:
Home Assembly Create assembly
Through tool palette and tool catalogs, AutoCAD Civil 3D provides preconfigured
subassemblies for components such as travel lanes, curbs, side slopes and ditches. These
subassemblies are defined by a set of points, links, and optionally closed areas referred to as
shapes.
Each subassembly has a defined cross-section, and some subassemblies automatically adapt
to their location. The dimensions of a subassembly, such as the width of a lane or the height of a
curb are stored as properties.
A subassembly definition references point, link, and shape codes. Points are the vertices of
the subassembly, and they can be attachment points for adjacent assemblies. Links are the line
segments or curves between the points. Shapes are two-dimensional polygons that represent the
cross-sectional shape of the subassembly.
The subassemblies provided with AutoCAD Civil 3D have built-in intelligent behavior. They can
automatically adapt to conditions such as superelevation and cut or fill requirements. [19]
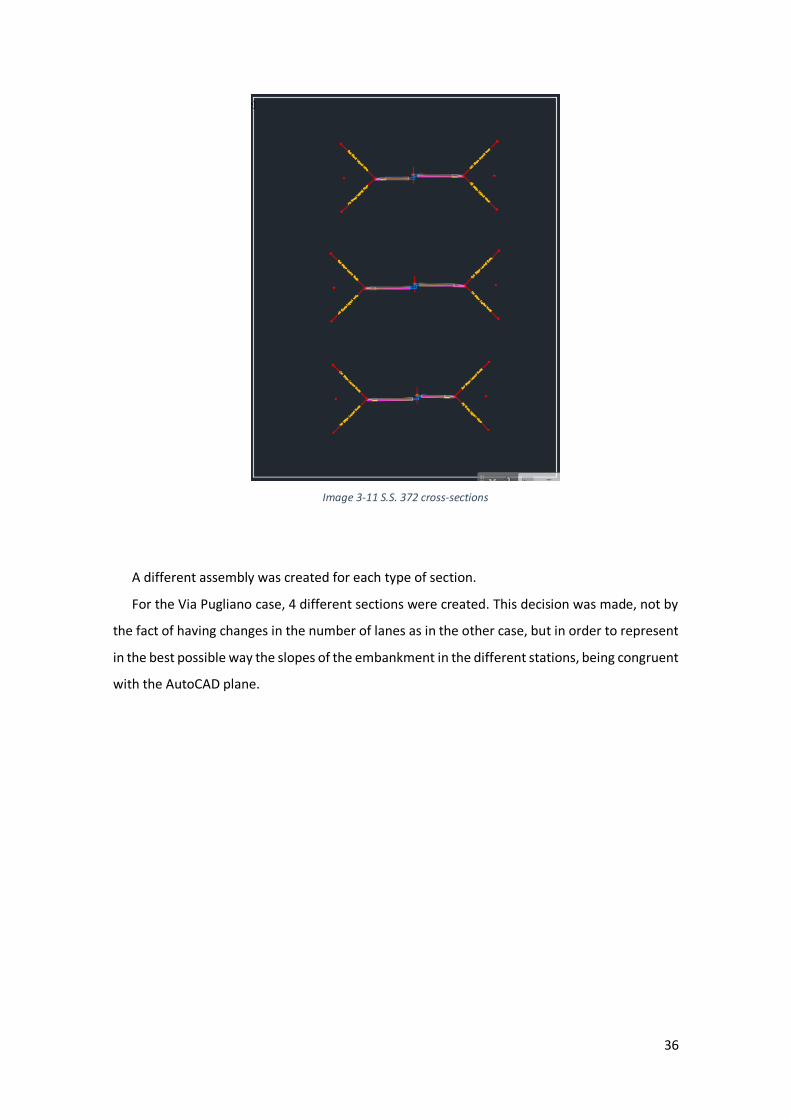
The first section modeled, was the one belonging to the S.S. 372. It could be determined that
it did not present a constant, but three different sections. An intermediate section, which will
pass under the bridge with 6 lanes, and the other two with 5 lanes each. The width of a single
lane was determined, and the dimensions of each section were changed based on the number
of lanes. The shoulder widths were taken as constants. The layer thicknesses were assigned
arbitrarily, considering the concepts learned in the Career (since they are not important for this
study case).
36
Image 3-11 S.S. 372 cross-sections
A different assembly was created for each type of section.
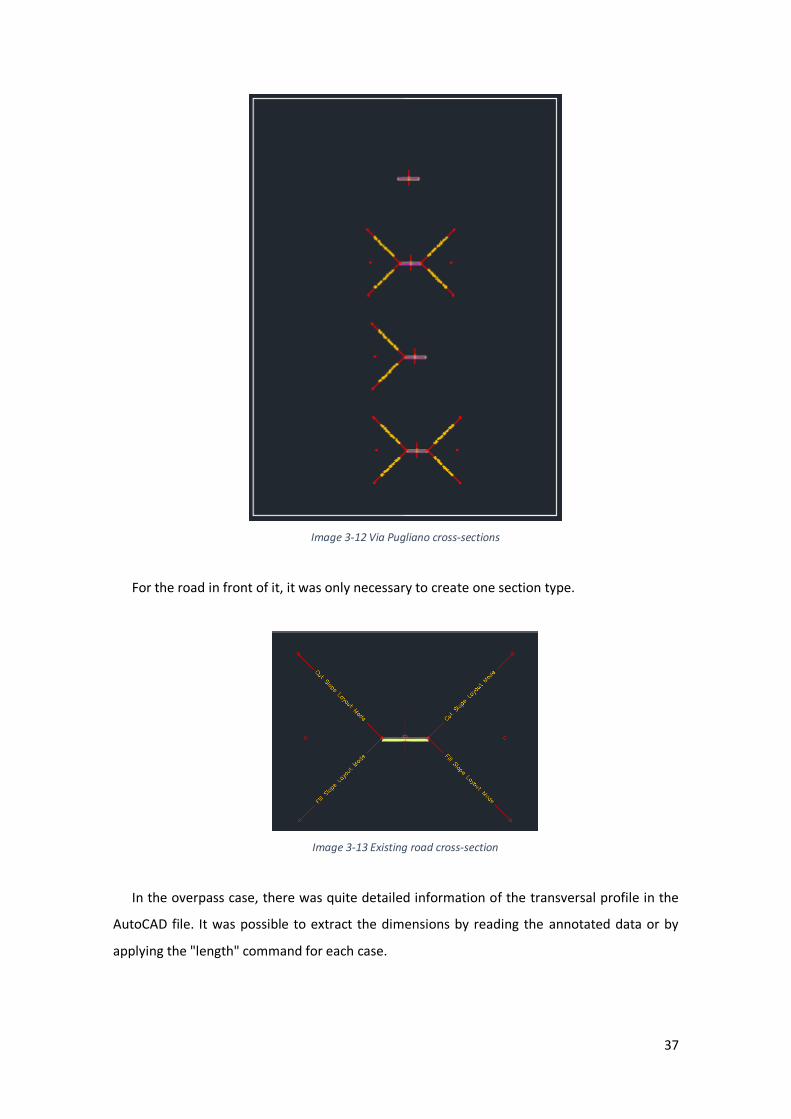
For the Via Pugliano case, 4 different sections were created. This decision was made, not by
the fact of having changes in the number of lanes as in the other case, but in order to represent
in the best possible way the slopes of the embankment in the different stations, being congruent
with the AutoCAD plane.
37
Image 3-12 Via Pugliano cross-sections
For the road in front of it, it was only necessary to create one section type.
Image 3-13 Existing road cross-section
In the overpass case, there was quite detailed information of the transversal profile in the
AutoCAD file. It was possible to extract the dimensions by reading the annotated data or by
applying the "length" command for each case.
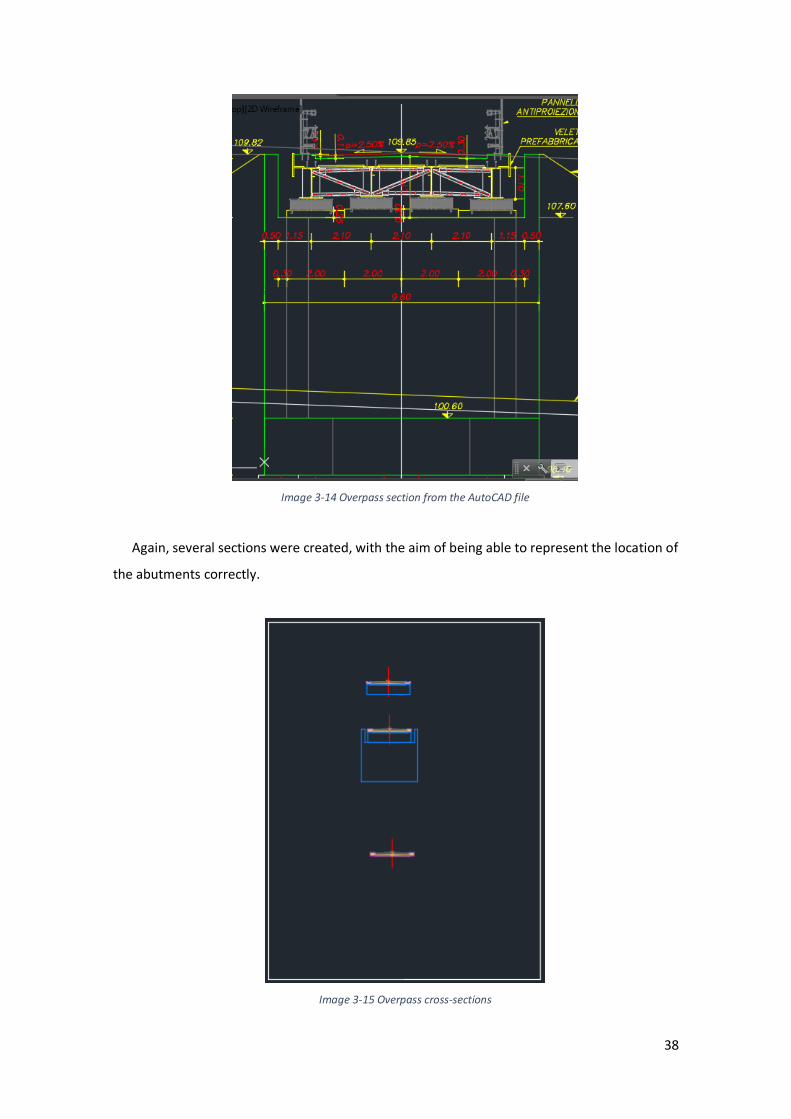
38
Image 3-14 Overpass section from the AutoCAD file
Again, several sections were created, with the aim of being able to represent the location of
the abutments correctly.
Image 3-15 Overpass cross-sections
39
Corridors:
Next step is corridors generation.
A corridor model builds on and uses various AutoCAD Civil 3D objects and data, including
subassemblies, assemblies, alignments, feature lines, surfaces, and profiles.
Corridor objects are created along one or more horizontal baselines by placing a 2D section
(assembly) at incremental locations and creating matching slopes that reach a surface model at
each incremental location. [19]
Path to follow:
Home Corridor
At this moment, the desired horizontal alignment and its corresponding vertical alignment
are loaded, if the user want to vary the assemblies along the corridor, "set baseline and region
parameters" is checked. From here, it is possible to decide between which stations the user want
to generate the corridor, and which assemblies to use. The frequency to apply assemblies can
be modified in the curves to obtain an adequate representation.
Starting with the Telesina, a single corridor was created for the alignment, but it was specified
between which stations the different sections would be developed.
As it is to be supposed, between the different assemblies there were discontinuities, due to
the disparity of the number of lanes in each one. It was necessary to create a boundary, which
would serve as a transition between one assembly and the next one. In order to do this, a
polyline was created, joining the end of a part of the corridor with the beginning of the next one,
and then transforming this polyline into a featured line. Feature lines are 3D objects which can
be used as grading footprints, surface breaklines, and as corridor baselines.
Finally, "offset targets" were established for each case, obtaining an adequate representation
of the future S.S. 372.
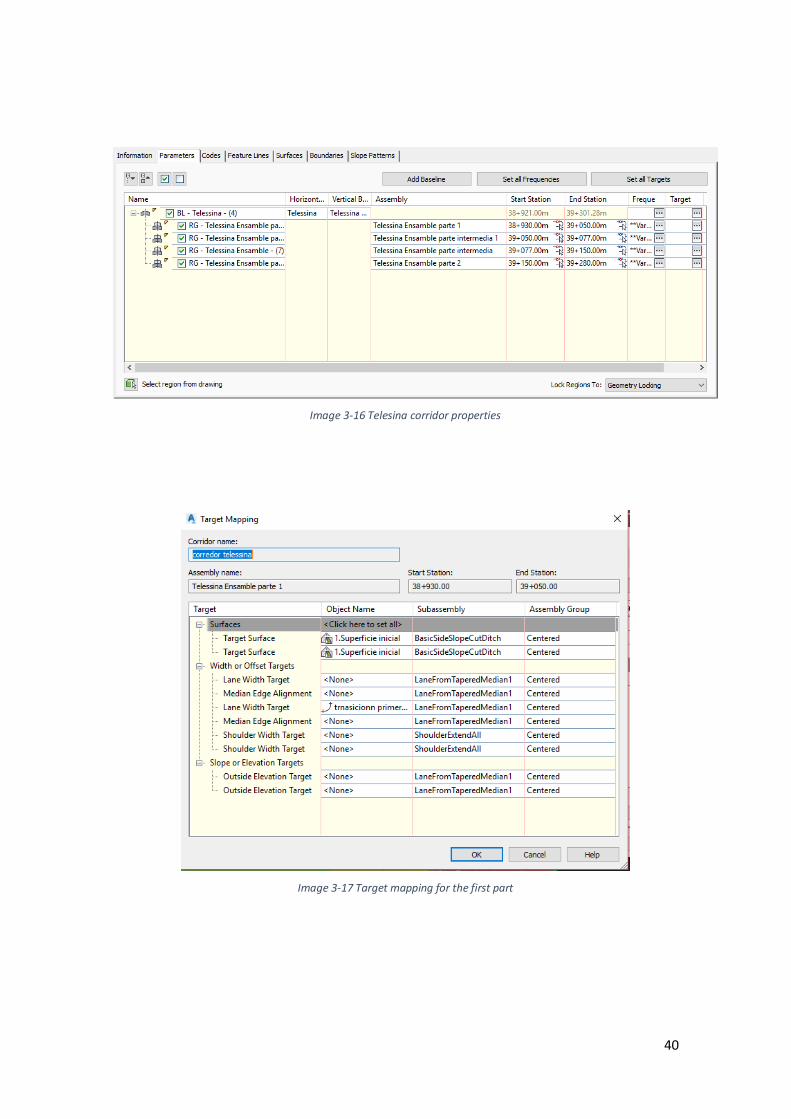
40
Image 3-16 Telesina corridor properties
Image 3-17 Target mapping for the first part
41
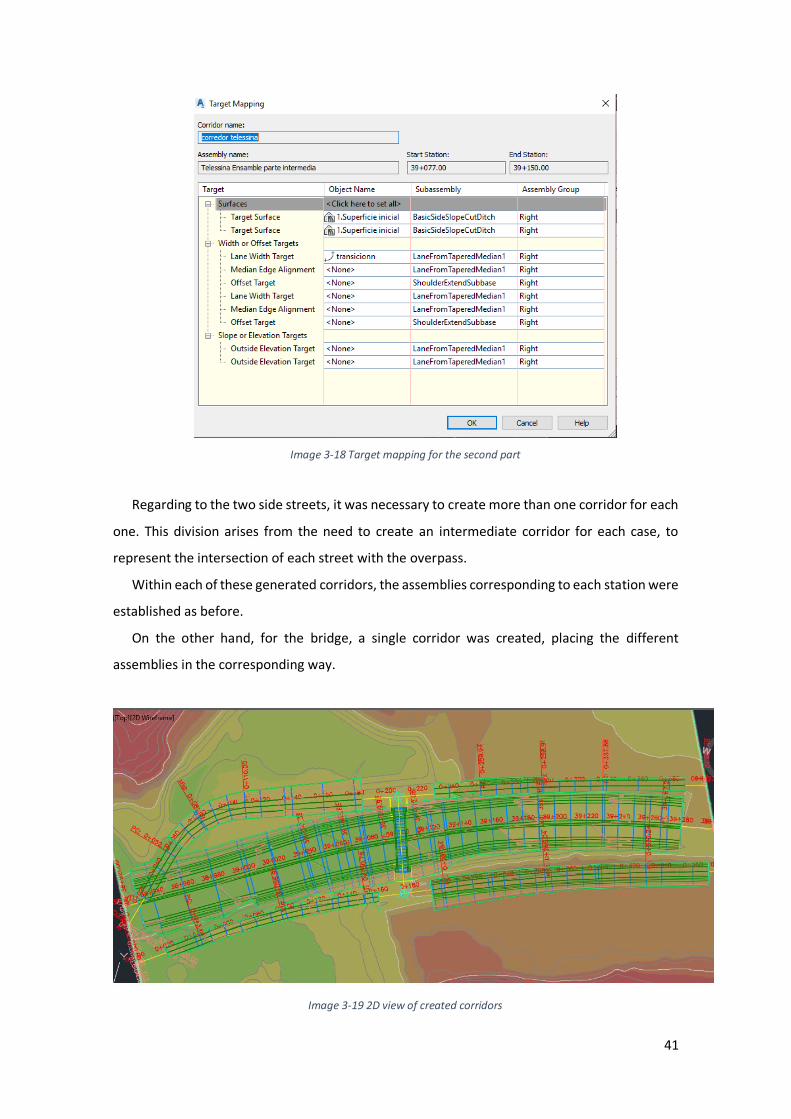
Image 3-18 Target mapping for the second part
Regarding to the two side streets, it was necessary to create more than one corridor for each
one. This division arises from the need to create an intermediate corridor for each case, to
represent the intersection of each street with the overpass.
Within each of these generated corridors, the assemblies corresponding to each station were
established as before.
On the other hand, for the bridge, a single corridor was created, placing the different
assemblies in the corresponding way.
Image 3-19 2D view of created corridors
42
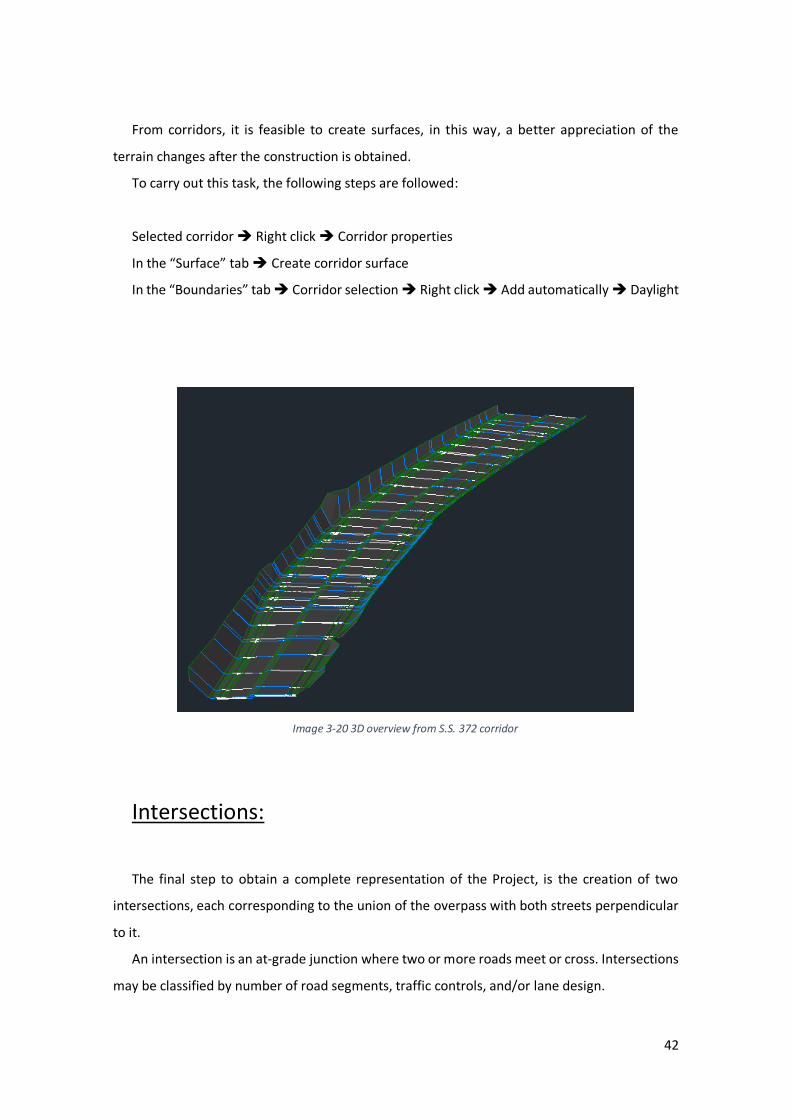
From corridors, it is feasible to create surfaces, in this way, a better appreciation of the
terrain changes after the construction is obtained.
To carry out this task, the following steps are followed:
Selected corridor Right click Corridor properties
In the “Surface” tab Create corridor surface
In the “Boundaries” tab Corridor selection Right click Add automatically Daylight
Image 3-20 3D overview from S.S. 372 corridor
Intersections:
The final step to obtain a complete representation of the Project, is the creation of two
intersections, each corresponding to the union of the overpass with both streets perpendicular
to it.
An intersection is an at-grade junction where two or more roads meet or cross. Intersections
may be classified by number of road segments, traffic controls, and/or lane design.
43
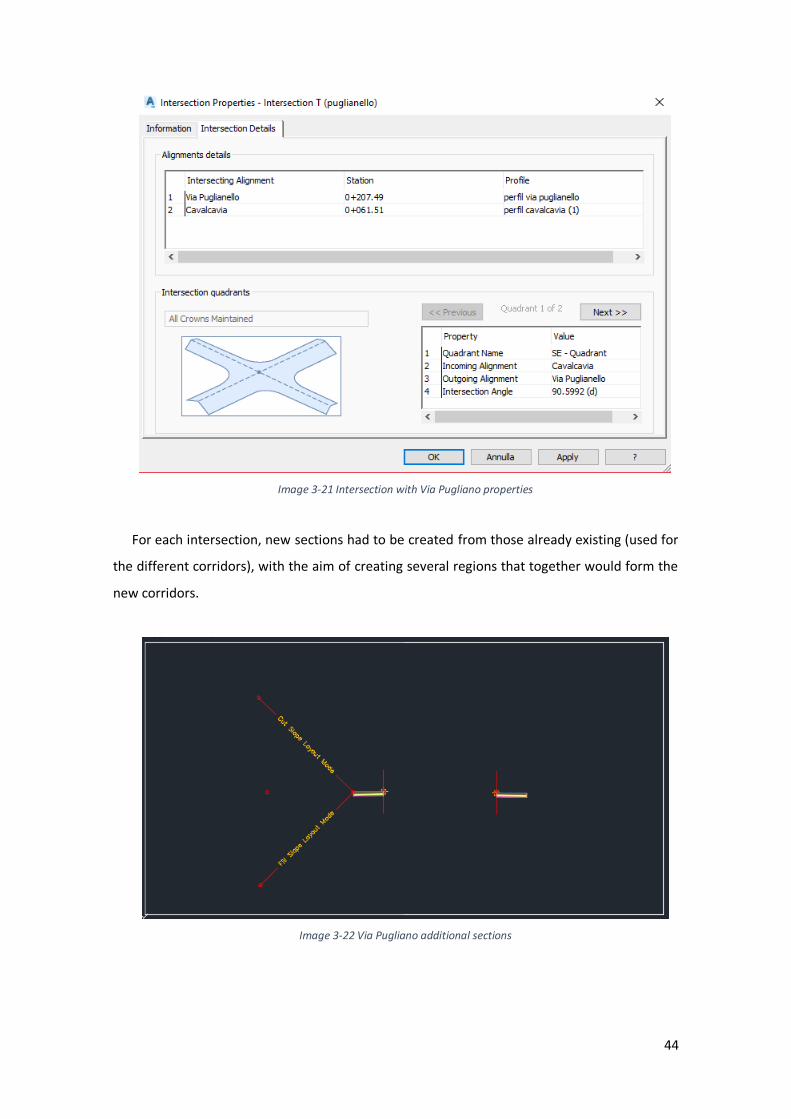
In CivilCAD it is possible to create two basic types of intersections, which differ in how the
intersecting road crowns are blended:
In a peer road intersection, the crowns of both roads are maintained. The primary road
centerline profile is maintained, and a locked PVI is created on the secondary road centerline
profile where it intersects with the primary road centerline. The pavement of both roads is
blended into the curb returns.
In a primary road intersection, the primary road crown is maintained. The primary road
centerline profile is maintained, and a locked PVI is created on the secondary road centerline
profile where it intersects with the primary road centerline. Two additional locked PVIs are
created on the secondary road centerline profile at the primary road edges of pavement. The
primary road cross-slope is maintained, and the secondary road pavement is blended from the
primary road edges of pavement along the secondary road pavement edges.
To create a complete intersection model, it is necessary to have a centerline alignment and
profile for each of the intersecting roads. The horizontal and vertical geometry for the remaining
elements, including the offsets and curb returns, is generated based on the specified
parameters.
In a peer road intersection, the crowns of all intersecting roads are held at a common grade.
The pavement for both roads is blended into the curb return regions, which form the transitions
between the intersecting roads. For the two intersections created, this modality was followed.
The path is the next one:
Home Intersections Create intersection Select intersection
Once here, there are several considerations to take into account, in order to create the
intersection correctly.
First, as stated above, the type of "All crowns maintained" corridor was selected, and then
different design parameters were adjusted such as radiuses, slopes, lane widths, etc.
44
Image 3-21 Intersection with Via Pugliano properties
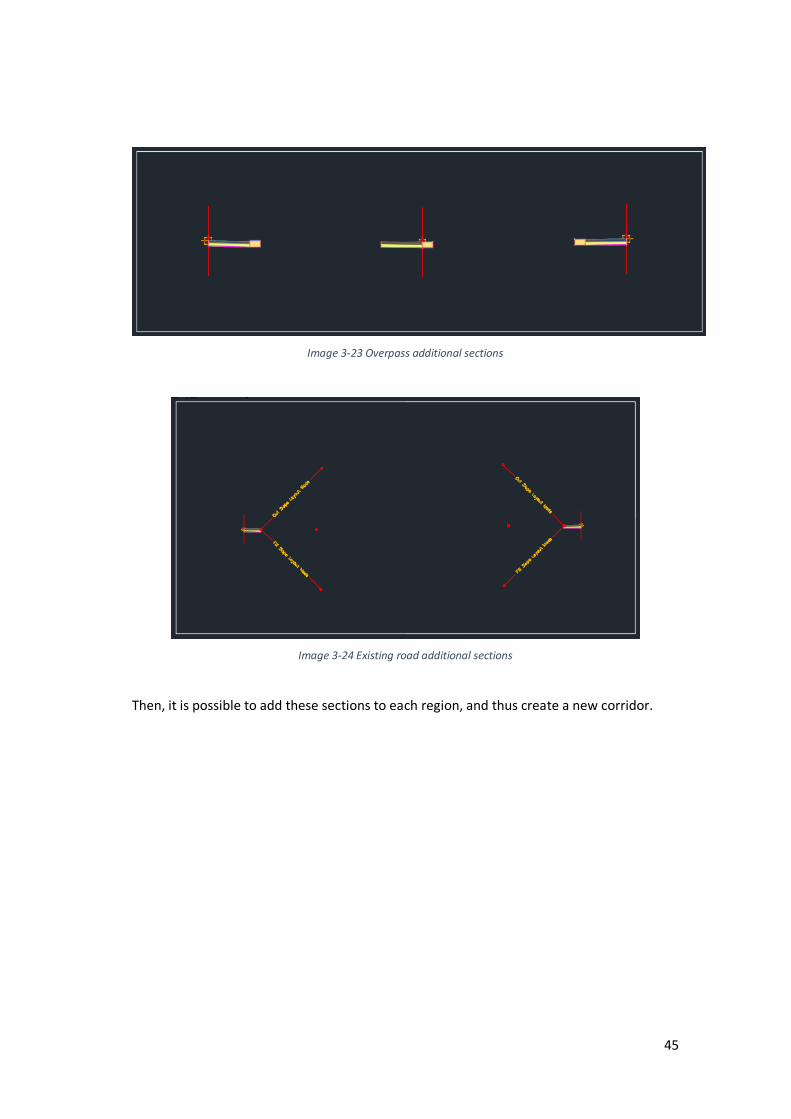
For each intersection, new sections had to be created from those already existing (used for
the different corridors), with the aim of creating several regions that together would form the
new corridors.
Image 3-22 Via Pugliano additional sections
45
Image 3-23 Overpass additional sections
Image 3-24 Existing road additional sections
Then, it is possible to add these sections to each region, and thus create a new corridor.
46
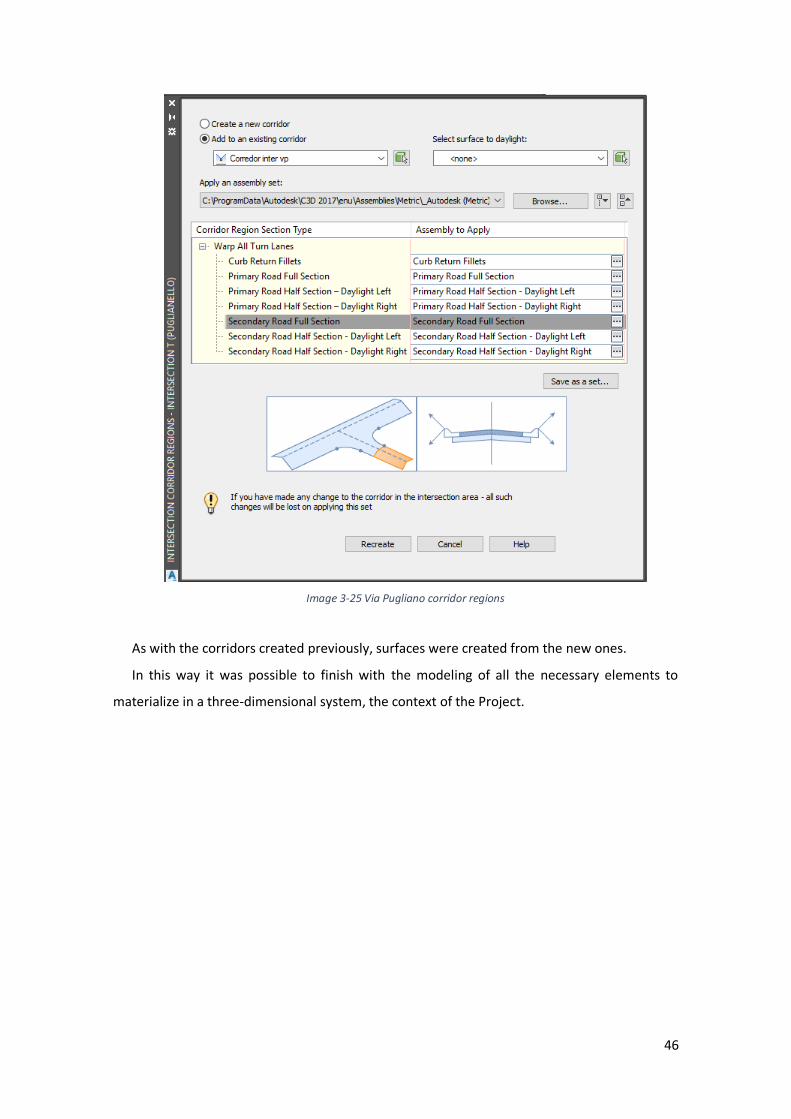
Image 3-25 Via Pugliano corridor regions
As with the corridors created previously, surfaces were created from the new ones.
In this way it was possible to finish with the modeling of all the necessary elements to
materialize in a three-dimensional system, the context of the Project.
47
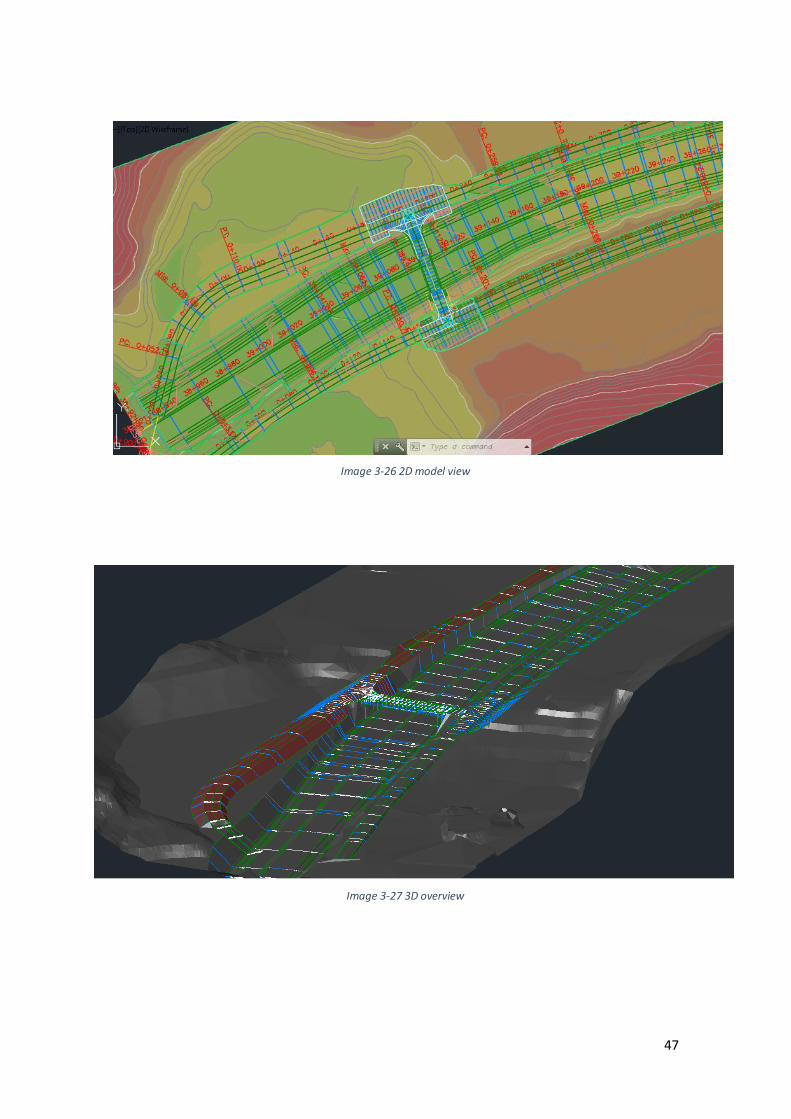
Image 3-26 2D model view
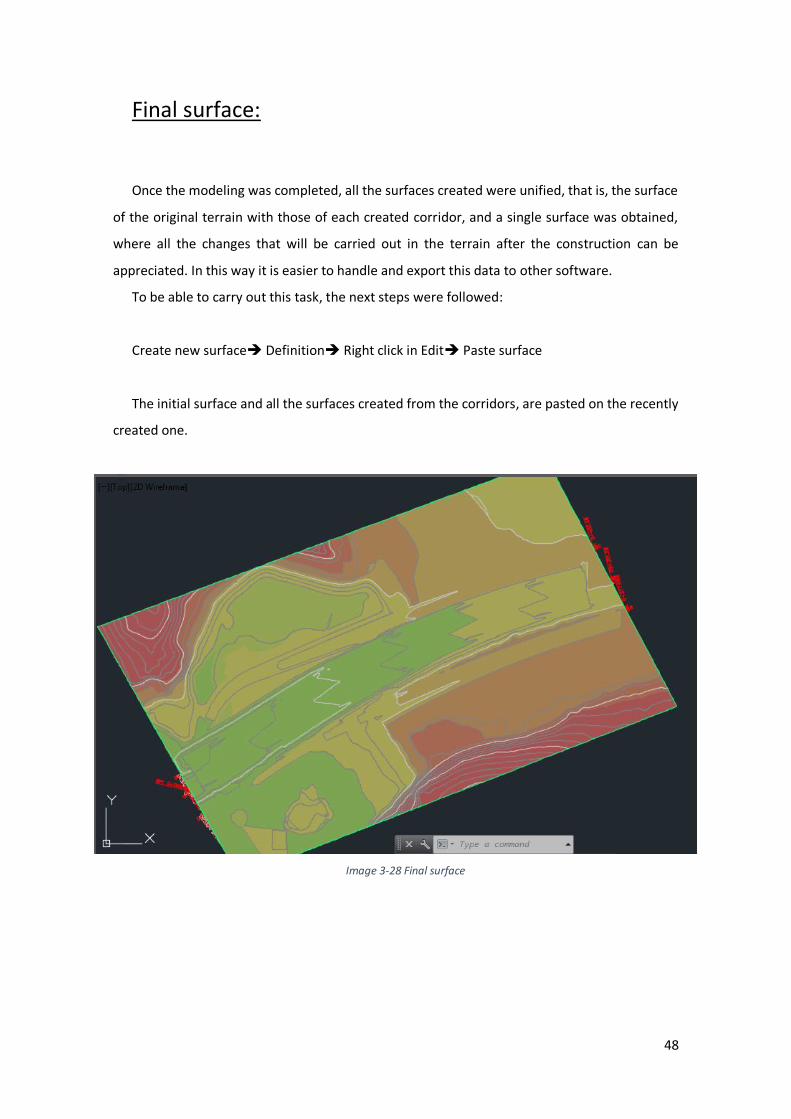
Image 3-27 3D overview
48
Final surface:
Once the modeling was completed, all the surfaces created were unified, that is, the surface
of the original terrain with those of each created corridor, and a single surface was obtained,
where all the changes that will be carried out in the terrain after the construction can be
appreciated. In this way it is easier to handle and export this data to other software.
To be able to carry out this task, the next steps were followed:
Create new surface Definition Right click in Edit Paste surface
The initial surface and all the surfaces created from the corridors, are pasted on the recently
created one.
Image 3-28 Final surface
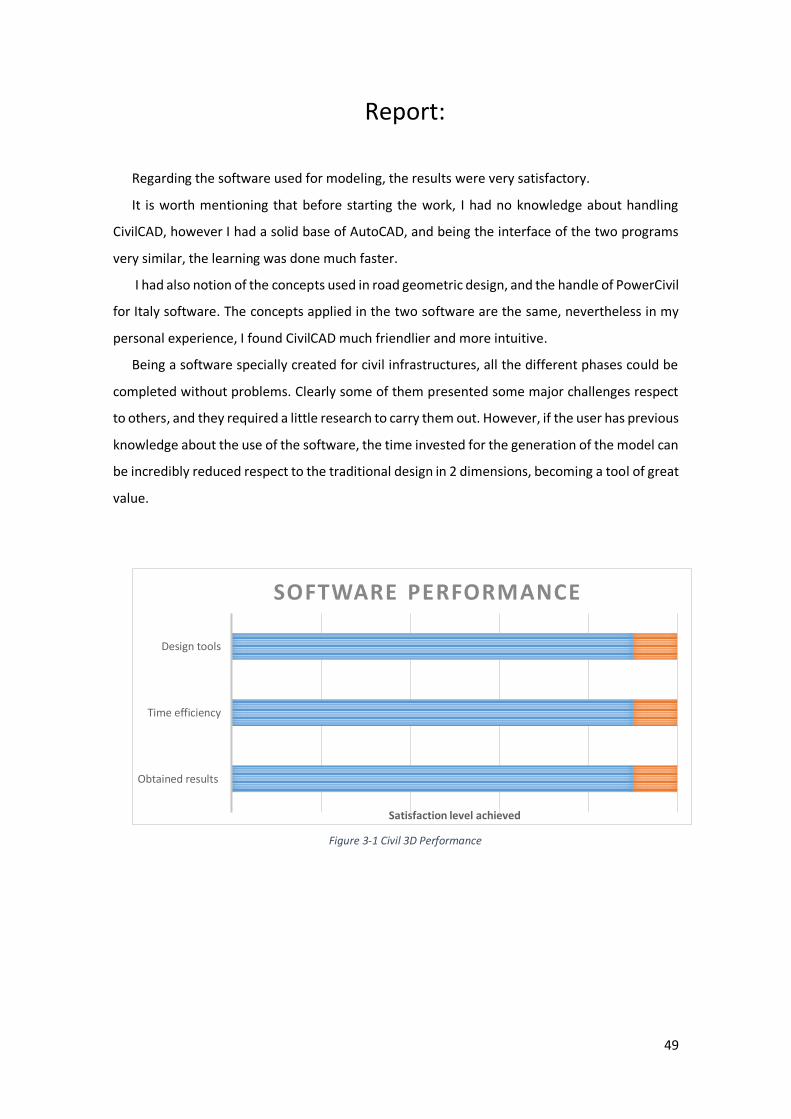
49
Report:
Regarding the software used for modeling, the results were very satisfactory.
It is worth mentioning that before starting the work, I had no knowledge about handling
CivilCAD, however I had a solid base of AutoCAD, and being the interface of the two programs
very similar, the learning was done much faster.
I had also notion of the concepts used in road geometric design, and the handle of PowerCivil
for Italy software. The concepts applied in the two software are the same, nevertheless in my
personal experience, I found CivilCAD much friendlier and more intuitive.
Being a software specially created for civil infrastructures, all the different phases could be
completed without problems. Clearly some of them presented some major challenges respect
to others, and they required a little research to carry them out. However, if the user has previous
knowledge about the use of the software, the time invested for the generation of the model can
be incredibly reduced respect to the traditional design in 2 dimensions, becoming a tool of great
value.
Figure 3-1 Civil 3D Performance
Obtained results
Time efficiency
Design tools
Satisfaction level achieved
SOFTWARE PERFORMANCE
50
OVERPASS MODELING
51
Chosen software:
The software used to obtain a detailed model of the bridge, with all its component elements,
was Revit, from Autodesk. As with all the software developed by Autodesk, it can be download
for free with the student license.
“Autodesk Revit is building information modeling software for architects, landscape
architects, structural engineers, MEP engineers, designers and contractors developed
by Autodesk. It allows users to design a building and structure and its components in 3D,
annotate the model with 2D drafting elements, and access building information from the
building model's database. Revit is 4D BIM capable with tools to plan and track various stages in
the building's lifecycle, from concept to construction and later maintenance and/or demolition.
Revit can be used as a very powerful collaboration tool between different disciplines in the
building design sphere. The different disciplines that use Revit approach the program from
unique perspectives. Each of these perspectives is focused on completing that discipline's task.
Companies that adopt the software first examine the existing work flow process to determine if
such an elaborate collaboration tool is required.
The Revit work environment allows users to manipulate whole buildings or assemblies (in the
project environment) or individual 3D shapes (in the family editor environment). Modeling tools
can be used with pre-made solid objects or imported geometric models.”
Project Units:
Revit comes with 2 different units by default: metric and imperial units. To change the units
globally, it is necessary to change it in Project Units. All annotation settings by default are set to
“use project settings”.
Manage Project Units
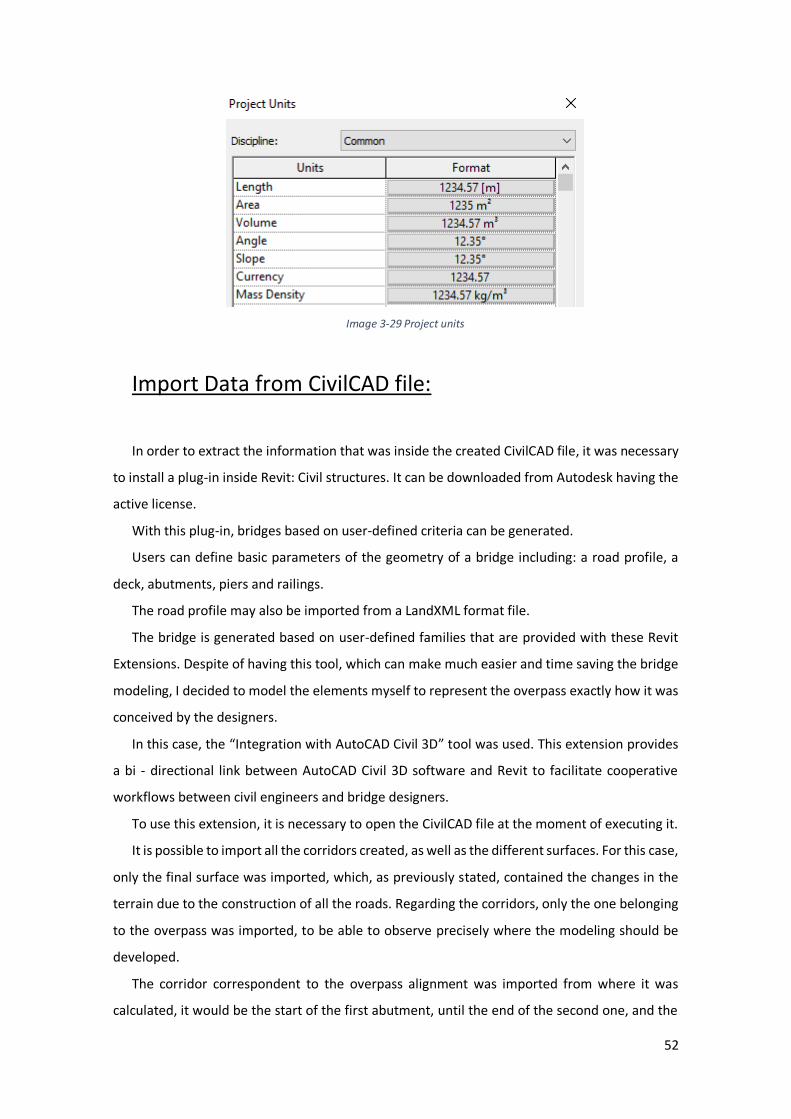
52
Image 3-29 Project units
Import Data from CivilCAD file:
In order to extract the information that was inside the created CivilCAD file, it was necessary
to install a plug-in inside Revit: Civil structures. It can be downloaded from Autodesk having the
active license.
With this plug-in, bridges based on user-defined criteria can be generated.
Users can define basic parameters of the geometry of a bridge including: a road profile, a
deck, abutments, piers and railings.
The road profile may also be imported from a LandXML format file.
The bridge is generated based on user-defined families that are provided with these Revit
Extensions. Despite of having this tool, which can make much easier and time saving the bridge
modeling, I decided to model the elements myself to represent the overpass exactly how it was
conceived by the designers.
In this case, the “Integration with AutoCAD Civil 3D” tool was used. This extension provides
a bi ‐ directional link between AutoCAD Civil 3D software and Revit to facilitate cooperative
workflows between civil engineers and bridge designers.
To use this extension, it is necessary to open the CivilCAD file at the moment of executing it.
It is possible to import all the corridors created, as well as the different surfaces. For this case,
only the final surface was imported, which, as previously stated, contained the changes in the
terrain due to the construction of all the roads. Regarding the corridors, only the one belonging
to the overpass was imported, to be able to observe precisely where the modeling should be
developed.
The corridor correspondent to the overpass alignment was imported from where it was
calculated, it would be the start of the first abutment, until the end of the second one, and the
53
Project was centered at the midpoint of the Bridge. I also tried to import intersections, to give a
better representation of the context, but Revit could not achieve this task, at least in a good
way, so I decided to exclude them.
Coordinates system location:
Next step was to position the coordinates origin, at a useful point for modeling.
It must be considered that Revit uses 2 coordinate systems: a survey coordinate system and
a project coordinate system.
The survey coordinate system provides a real-world context for the building model. It is
intended to describe locations on the surface of the earth. This system is used to identify the
specific location on the earth's surface where the Revit model resides. This coordinate system is
defined outside the context of a project. The project coordinate system describes locations relative to the building model. It uses
a selected point within the property boundary or within the extents of the project as a reference
for measuring distances and positioning objects in relation to the model. The project coordinate
system is used to determine the position of objects relative to a specified point near the model.
This coordinate system is specific to the current project. [19]
For the study case, only the project coordinate base point was established, which was set in
the middle of the overpass. To do this, it was necessary to extract the point coordinates, from
the CivilCAD file, through the "coordinates" command.
Once the origin was positioned, the north of the project was rotated to make it match the
axis of the Bridge.
This was done in the following way:
Manage Position Rotate project North
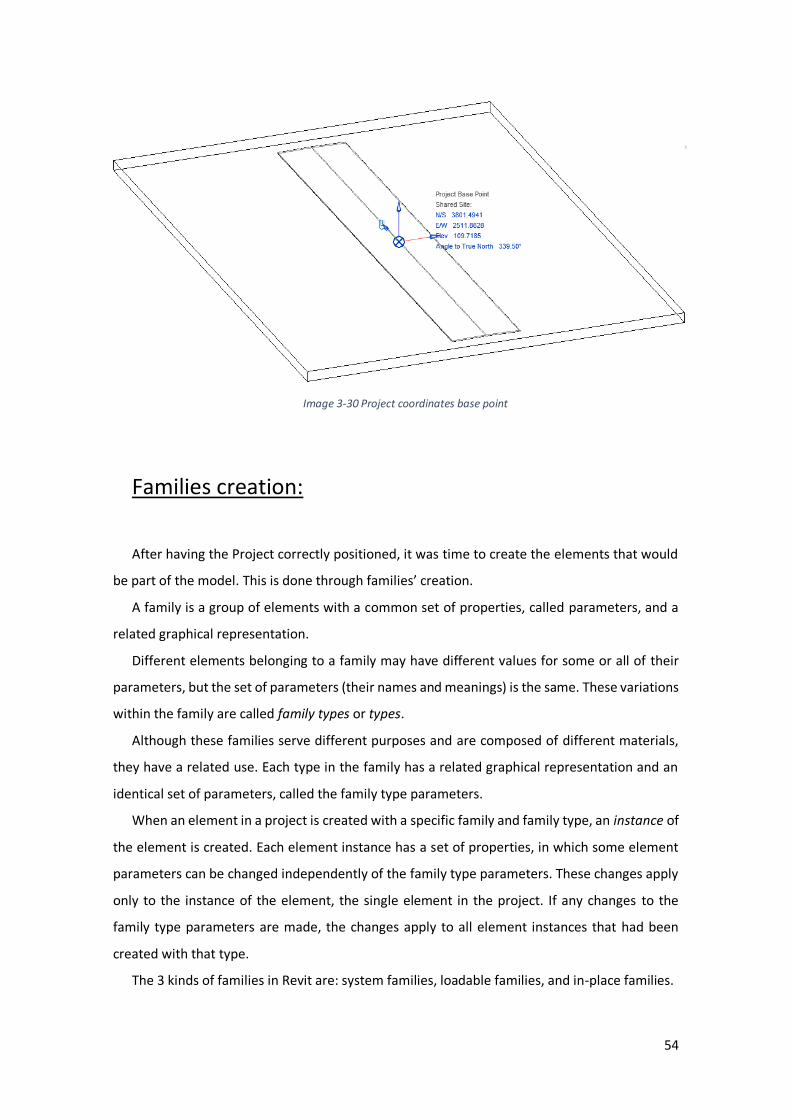
54
Image 3-30 Project coordinates base point
Families creation:
After having the Project correctly positioned, it was time to create the elements that would
be part of the model. This is done through families’ creation.
A family is a group of elements with a common set of properties, called parameters, and a
related graphical representation.
Different elements belonging to a family may have different values for some or all of their
parameters, but the set of parameters (their names and meanings) is the same. These variations
within the family are called family types or types.
Although these families serve different purposes and are composed of different materials,
they have a related use. Each type in the family has a related graphical representation and an
identical set of parameters, called the family type parameters.
When an element in a project is created with a specific family and family type, an instance of
the element is created. Each element instance has a set of properties, in which some element
parameters can be changed independently of the family type parameters. These changes apply
only to the instance of the element, the single element in the project. If any changes to the
family type parameters are made, the changes apply to all element instances that had been
created with that type.
The 3 kinds of families in Revit are: system families, loadable families, and in-place families.
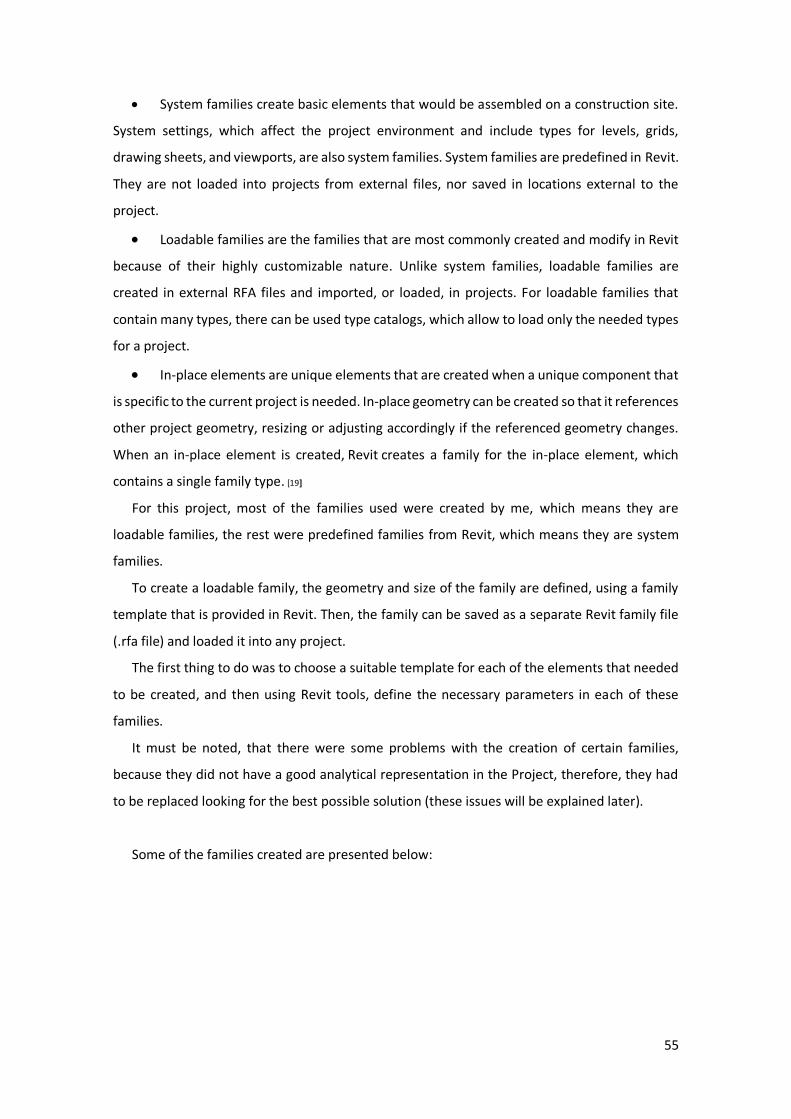
55
System families create basic elements that would be assembled on a construction site.
System settings, which affect the project environment and include types for levels, grids,
drawing sheets, and viewports, are also system families. System families are predefined in Revit.
They are not loaded into projects from external files, nor saved in locations external to the
project.
Loadable families are the families that are most commonly created and modify in Revit
because of their highly customizable nature. Unlike system families, loadable families are
created in external RFA files and imported, or loaded, in projects. For loadable families that
contain many types, there can be used type catalogs, which allow to load only the needed types
for a project.
In-place elements are unique elements that are created when a unique component that
is specific to the current project is needed. In-place geometry can be created so that it references
other project geometry, resizing or adjusting accordingly if the referenced geometry changes.
When an in-place element is created, Revit creates a family for the in-place element, which
contains a single family type. [19]
For this project, most of the families used were created by me, which means they are
loadable families, the rest were predefined families from Revit, which means they are system
families.
To create a loadable family, the geometry and size of the family are defined, using a family
template that is provided in Revit. Then, the family can be saved as a separate Revit family file
(.rfa file) and loaded it into any project.
The first thing to do was to choose a suitable template for each of the elements that needed
to be created, and then using Revit tools, define the necessary parameters in each of these
families.
It must be noted, that there were some problems with the creation of certain families,
because they did not have a good analytical representation in the Project, therefore, they had
to be replaced looking for the best possible solution (these issues will be explained later).
Some of the families created are presented below:
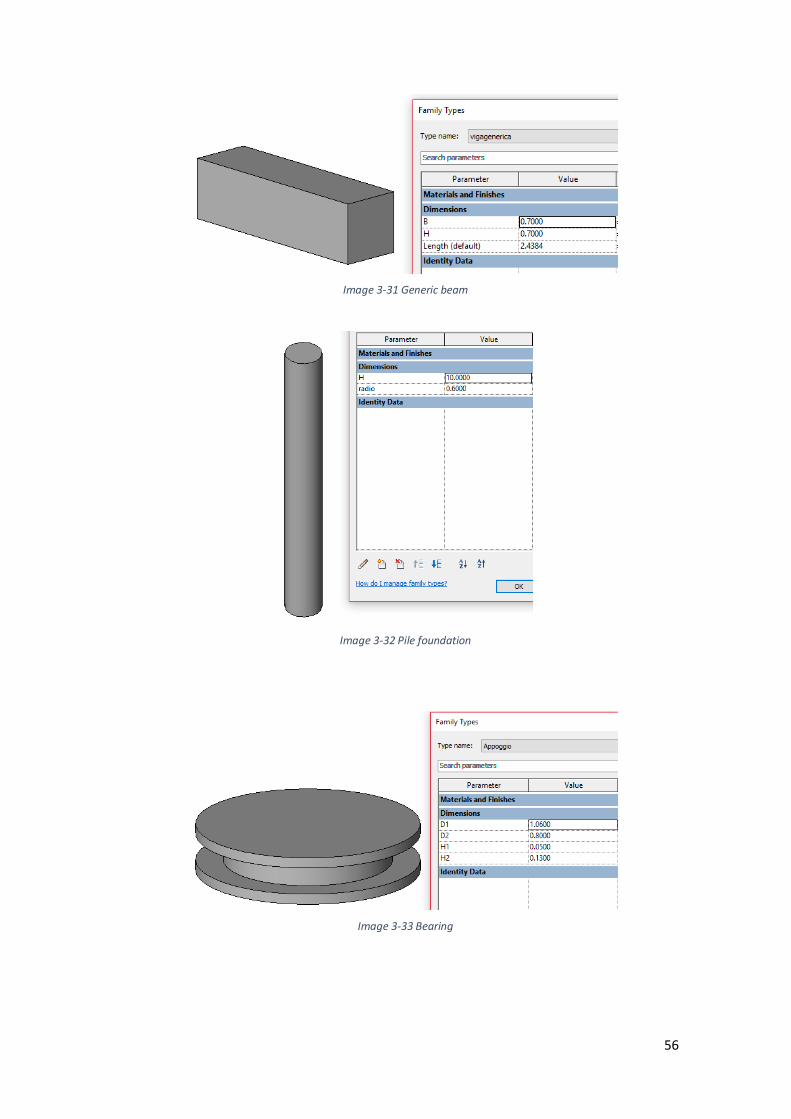
56
Image 3-31 Generic beam
Image 3-32 Pile foundation
Image 3-33 Bearing
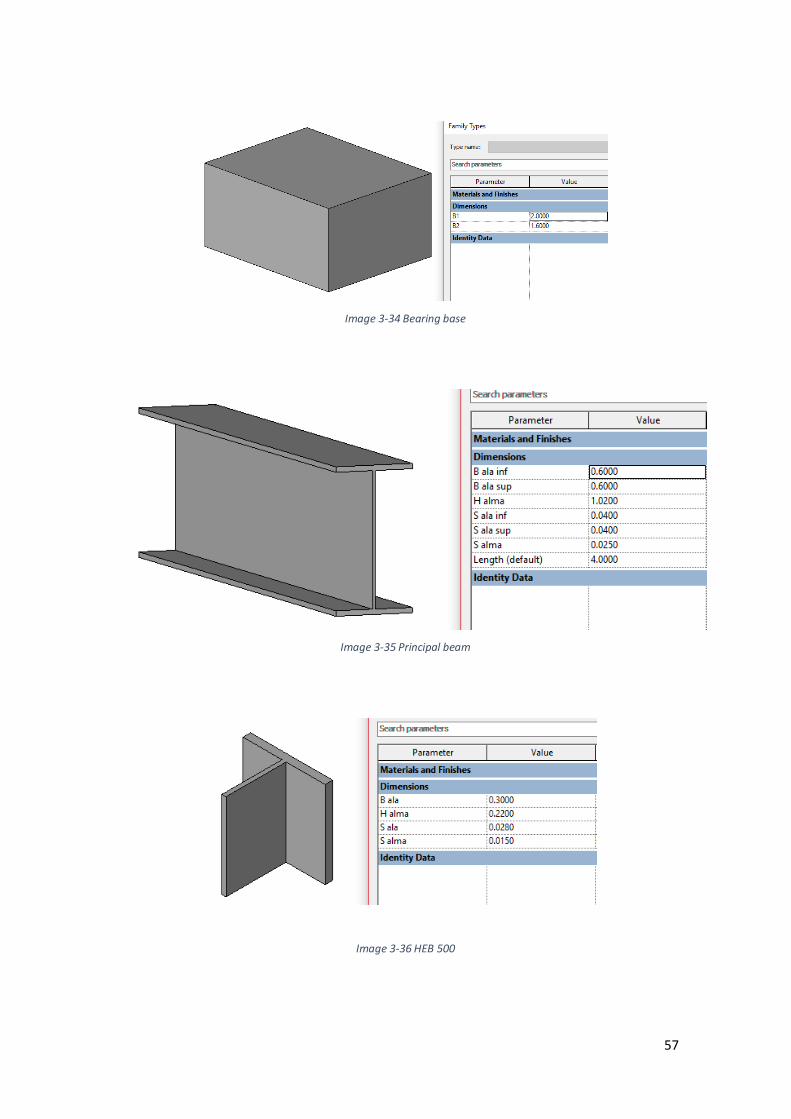
57
Image 3-34 Bearing base
Image 3-35 Principal beam
Image 3-36 HEB 500
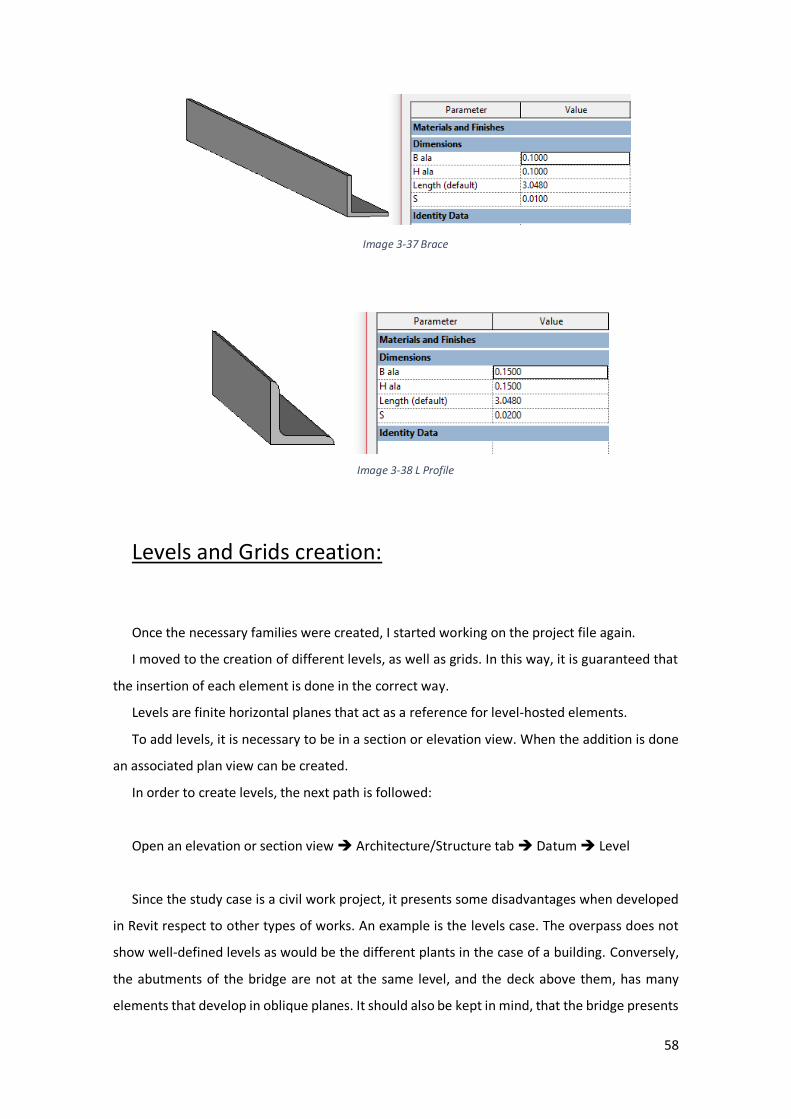
58
Image 3-37 Brace
Image 3-38 L Profile
Levels and Grids creation:
Once the necessary families were created, I started working on the project file again.
I moved to the creation of different levels, as well as grids. In this way, it is guaranteed that
the insertion of each element is done in the correct way.
Levels are finite horizontal planes that act as a reference for level-hosted elements.
To add levels, it is necessary to be in a section or elevation view. When the addition is done
an associated plan view can be created.
In order to create levels, the next path is followed:
Open an elevation or section view Architecture/Structure tab Datum Level
Since the study case is a civil work project, it presents some disadvantages when developed
in Revit respect to other types of works. An example is the levels case. The overpass does not
show well-defined levels as would be the different plants in the case of a building. Conversely,
the abutments of the bridge are not at the same level, and the deck above them, has many
elements that develop in oblique planes. It should also be kept in mind, that the bridge presents
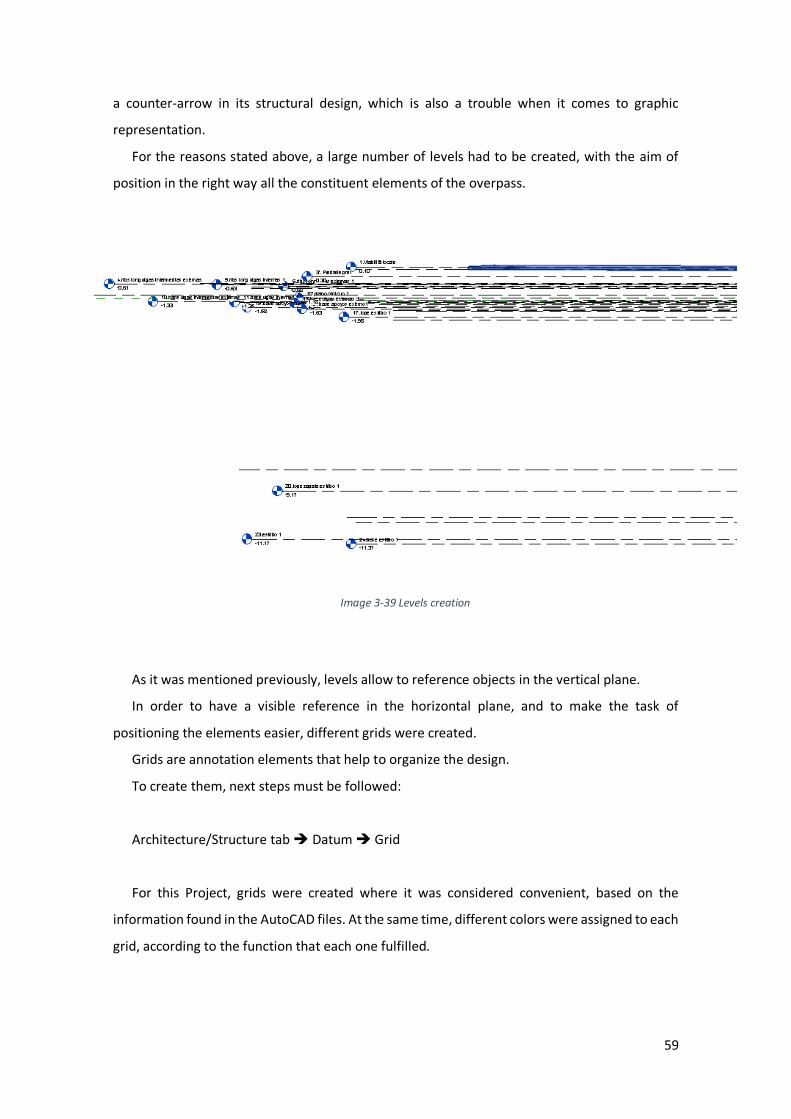
59
a counter-arrow in its structural design, which is also a trouble when it comes to graphic
representation.
For the reasons stated above, a large number of levels had to be created, with the aim of
position in the right way all the constituent elements of the overpass.
Image 3-39 Levels creation
As it was mentioned previously, levels allow to reference objects in the vertical plane.
In order to have a visible reference in the horizontal plane, and to make the task of
positioning the elements easier, different grids were created.
Grids are annotation elements that help to organize the design.
To create them, next steps must be followed:
Architecture/Structure tab Datum Grid
For this Project, grids were created where it was considered convenient, based on the
information found in the AutoCAD files. At the same time, different colors were assigned to each
grid, according to the function that each one fulfilled.
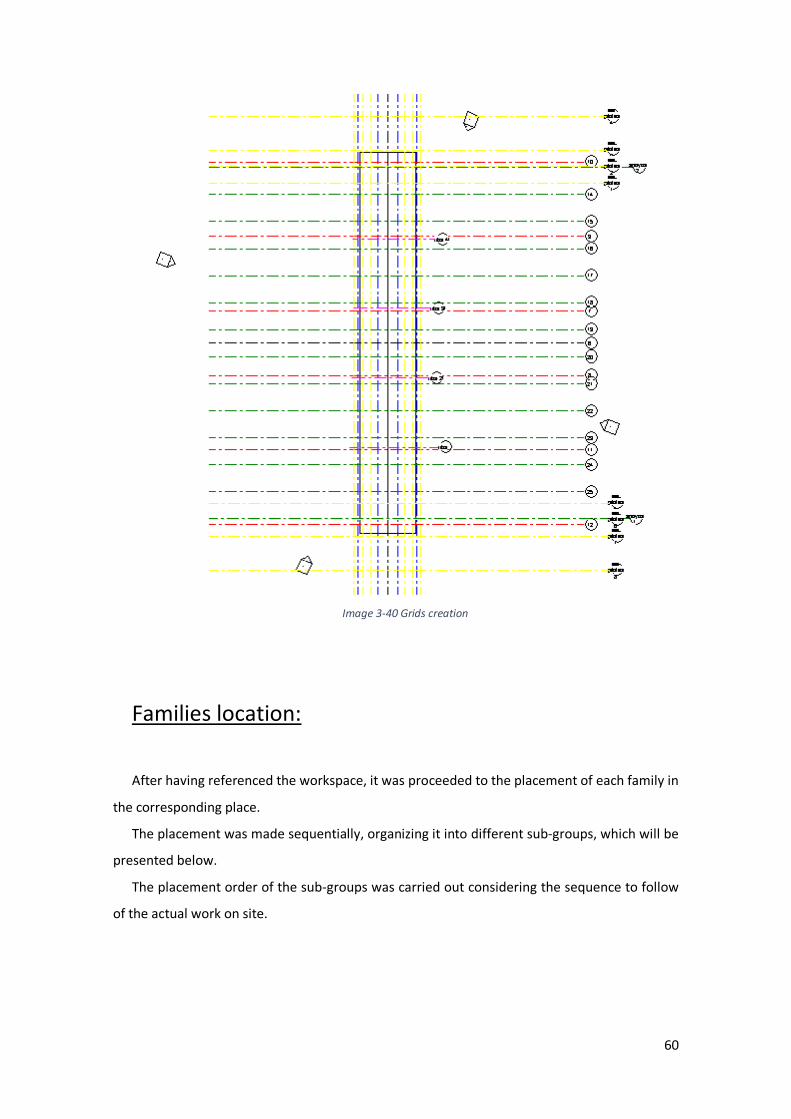
60
Image 3-40 Grids creation
Families location:
After having referenced the workspace, it was proceeded to the placement of each family in
the corresponding place.
The placement was made sequentially, organizing it into different sub-groups, which will be
presented below.
The placement order of the sub-groups was carried out considering the sequence to follow
of the actual work on site.
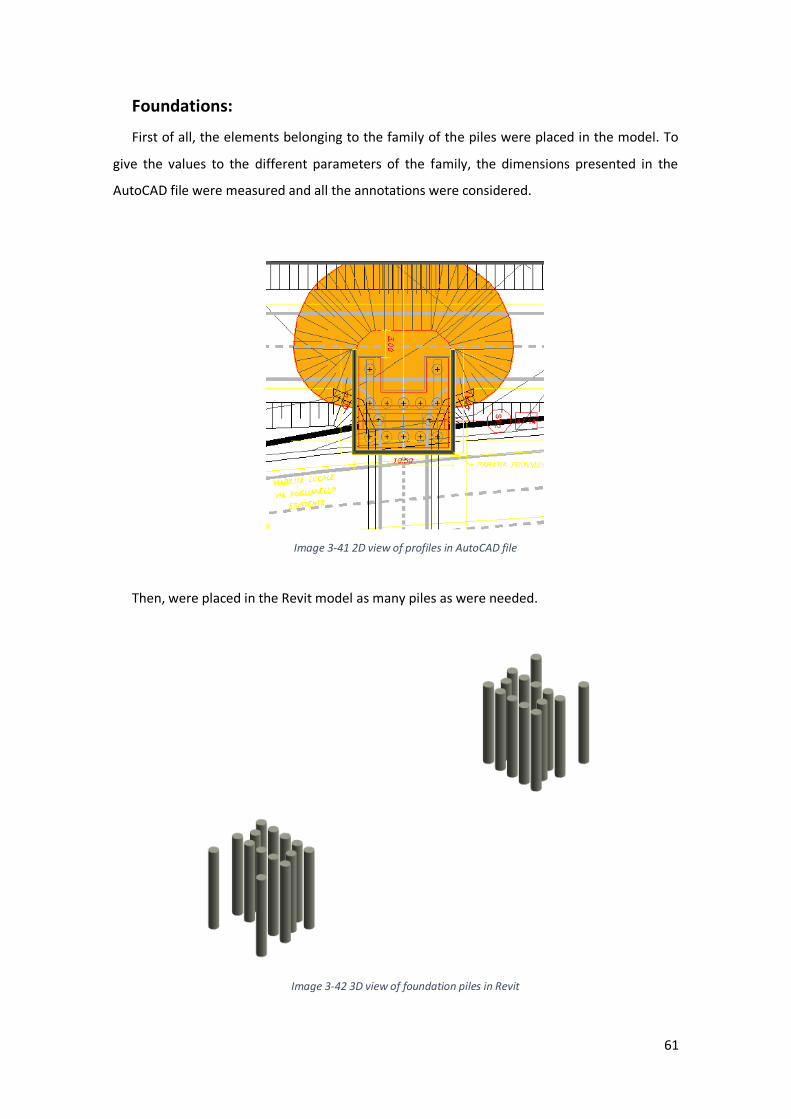
61
Foundations:
First of all, the elements belonging to the family of the piles were placed in the model. To
give the values to the different parameters of the family, the dimensions presented in the
AutoCAD file were measured and all the annotations were considered.
Image 3-41 2D view of profiles in AutoCAD file
Then, were placed in the Revit model as many piles as were needed.
Image 3-42 3D view of foundation piles in Revit
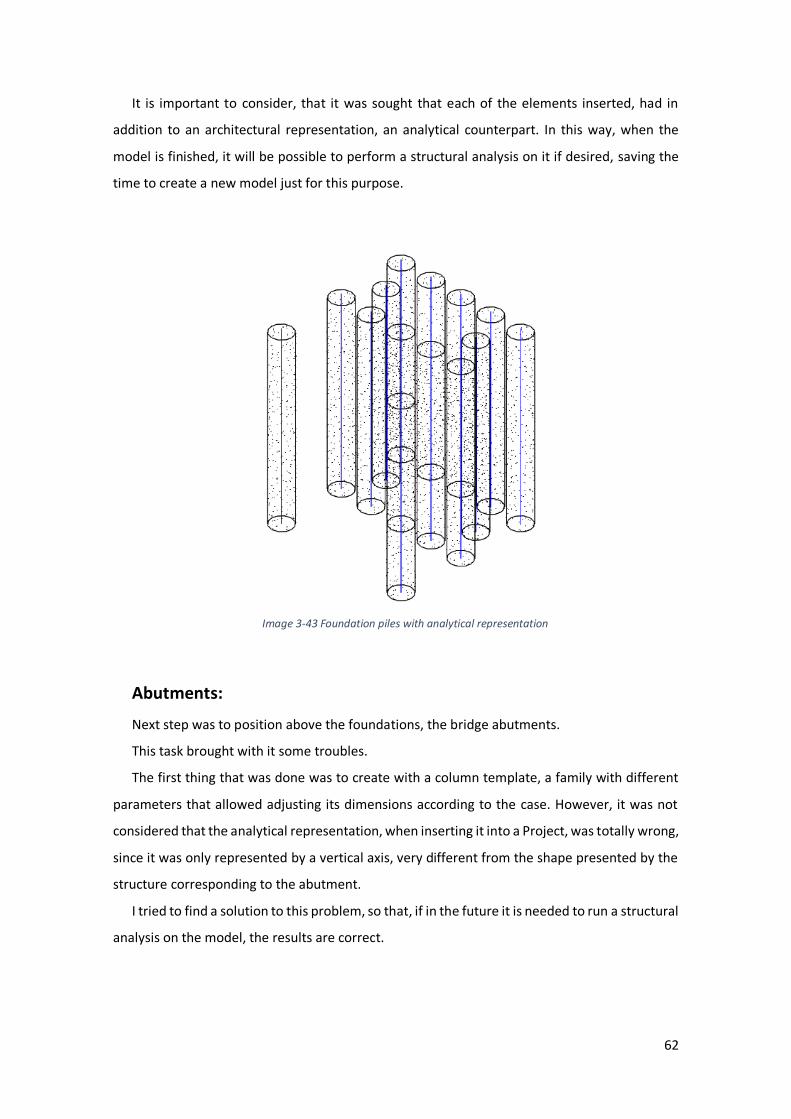
62
It is important to consider, that it was sought that each of the elements inserted, had in
addition to an architectural representation, an analytical counterpart. In this way, when the
model is finished, it will be possible to perform a structural analysis on it if desired, saving the
time to create a new model just for this purpose.
Image 3-43 Foundation piles with analytical representation
Abutments:
Next step was to position above the foundations, the bridge abutments.
This task brought with it some troubles.
The first thing that was done was to create with a column template, a family with different
parameters that allowed adjusting its dimensions according to the case. However, it was not
considered that the analytical representation, when inserting it into a Project, was totally wrong,
since it was only represented by a vertical axis, very different from the shape presented by the
structure corresponding to the abutment.
I tried to find a solution to this problem, so that, if in the future it is needed to run a structural
analysis on the model, the results are correct.
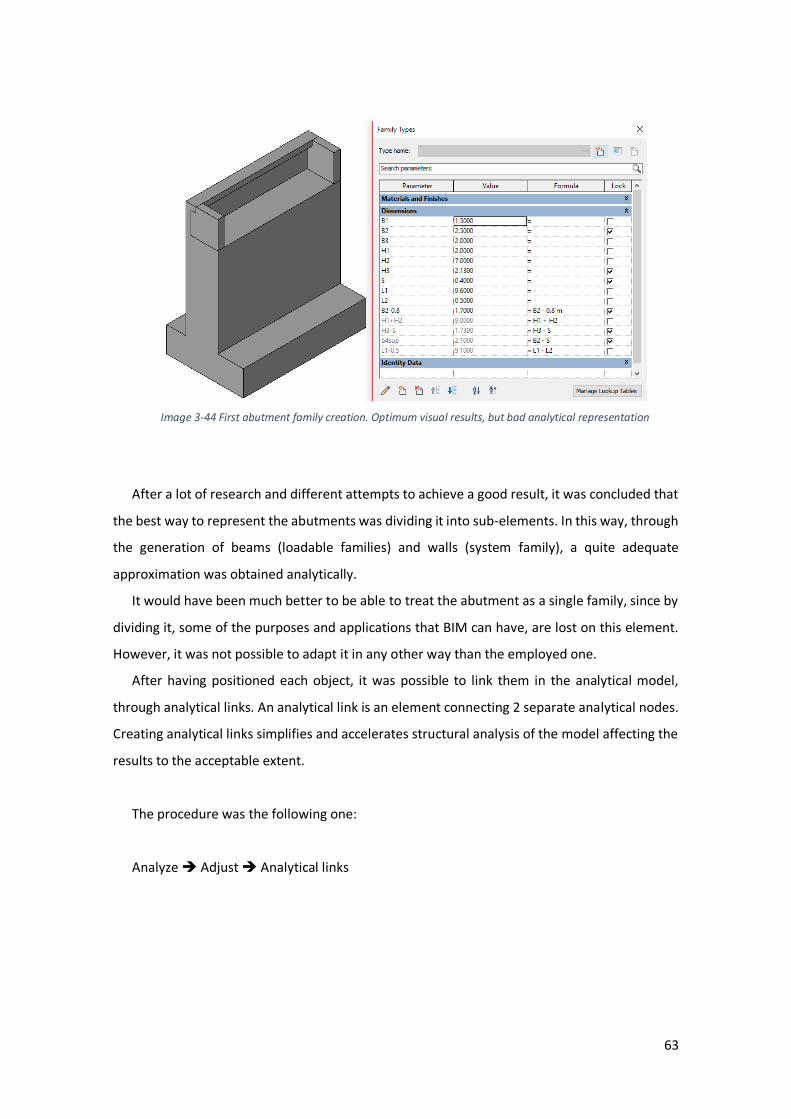
63
Image 3-44 First abutment family creation. Optimum visual results, but bad analytical representation
After a lot of research and different attempts to achieve a good result, it was concluded that
the best way to represent the abutments was dividing it into sub-elements. In this way, through
the generation of beams (loadable families) and walls (system family), a quite adequate
approximation was obtained analytically.
It would have been much better to be able to treat the abutment as a single family, since by
dividing it, some of the purposes and applications that BIM can have, are lost on this element.
However, it was not possible to adapt it in any other way than the employed one.
After having positioned each object, it was possible to link them in the analytical model,
through analytical links. An analytical link is an element connecting 2 separate analytical nodes.
Creating analytical links simplifies and accelerates structural analysis of the model affecting the
results to the acceptable extent.
The procedure was the following one:
Analyze Adjust Analytical links
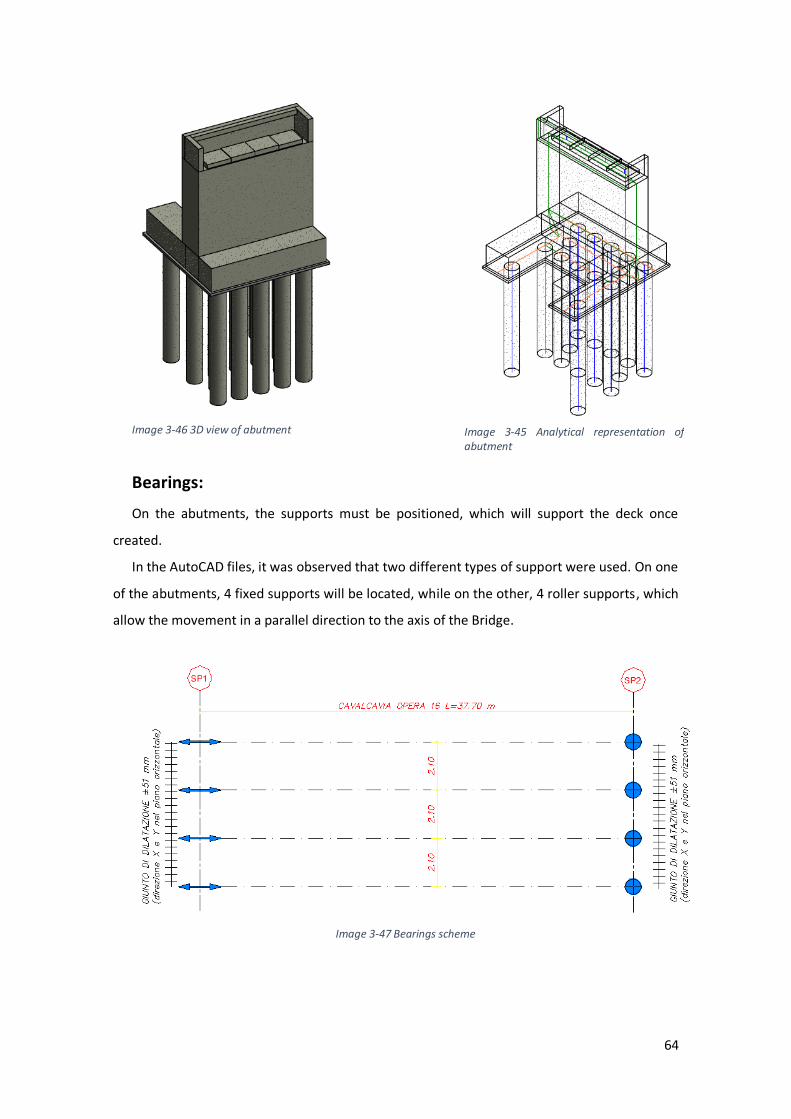
64
Image 3-46 3D view of abutment
Bearings:
On the abutments, the supports must be positioned, which will support the deck once
created.
In the AutoCAD files, it was observed that two different types of support were used. On one
of the abutments, 4 fixed supports will be located, while on the other, 4 roller supports, which
allow the movement in a parallel direction to the axis of the Bridge.
Image 3-47 Bearings scheme
Image 3-45 Analytical representation of abutment
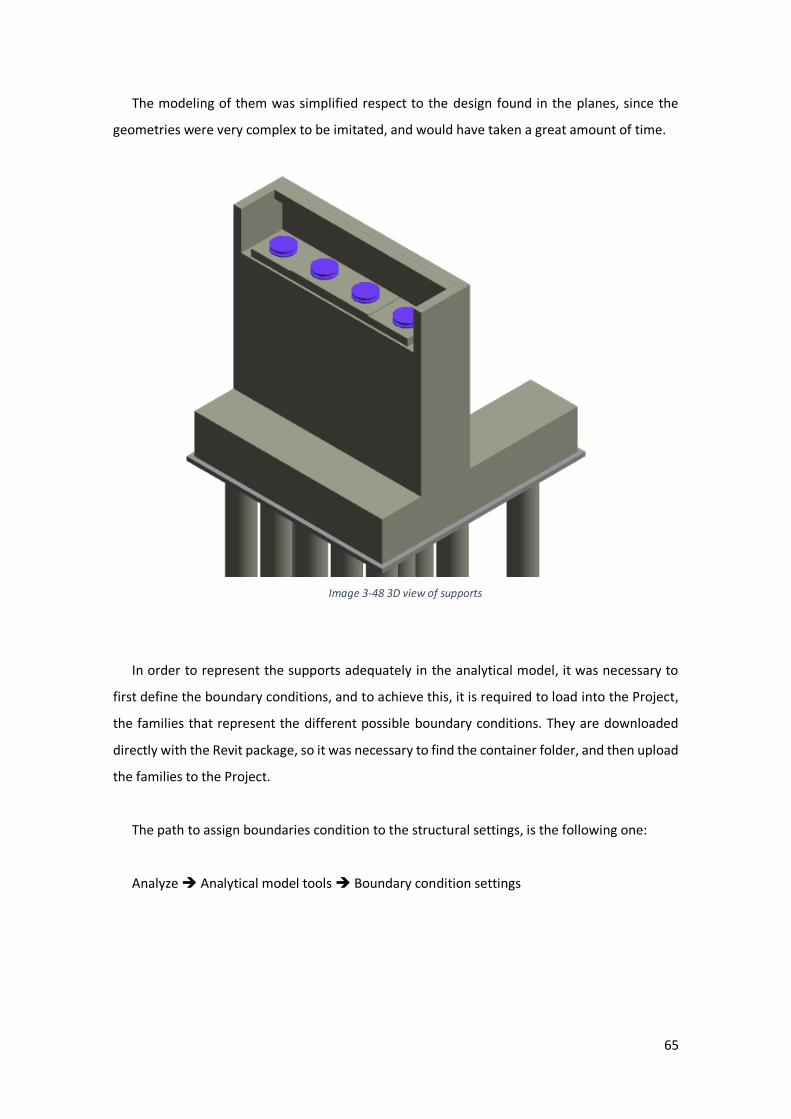
65
The modeling of them was simplified respect to the design found in the planes, since the
geometries were very complex to be imitated, and would have taken a great amount of time.
Image 3-48 3D view of supports
In order to represent the supports adequately in the analytical model, it was necessary to
first define the boundary conditions, and to achieve this, it is required to load into the Project,
the families that represent the different possible boundary conditions. They are downloaded
directly with the Revit package, so it was necessary to find the container folder, and then upload
the families to the Project.
The path to assign boundaries condition to the structural settings, is the following one:
Analyze Analytical model tools Boundary condition settings
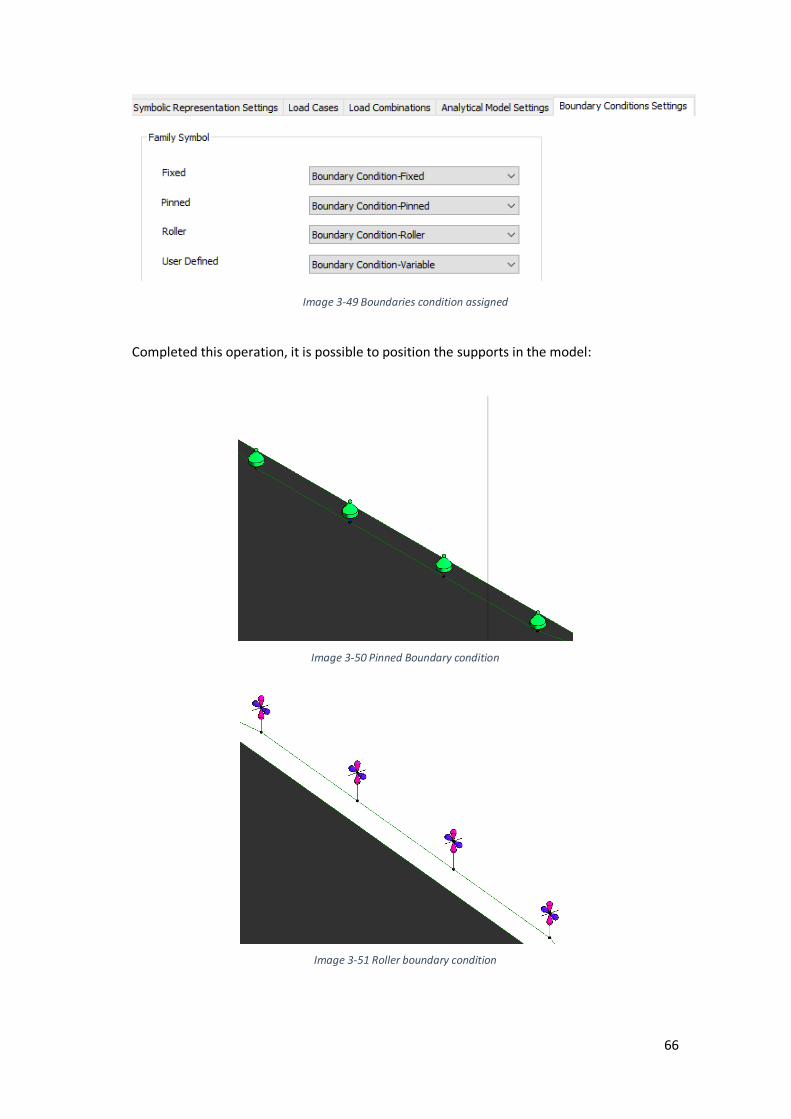
66
Image 3-49 Boundaries condition assigned
Completed this operation, it is possible to position the supports in the model:
Image 3-50 Pinned Boundary condition
Image 3-51 Roller boundary condition
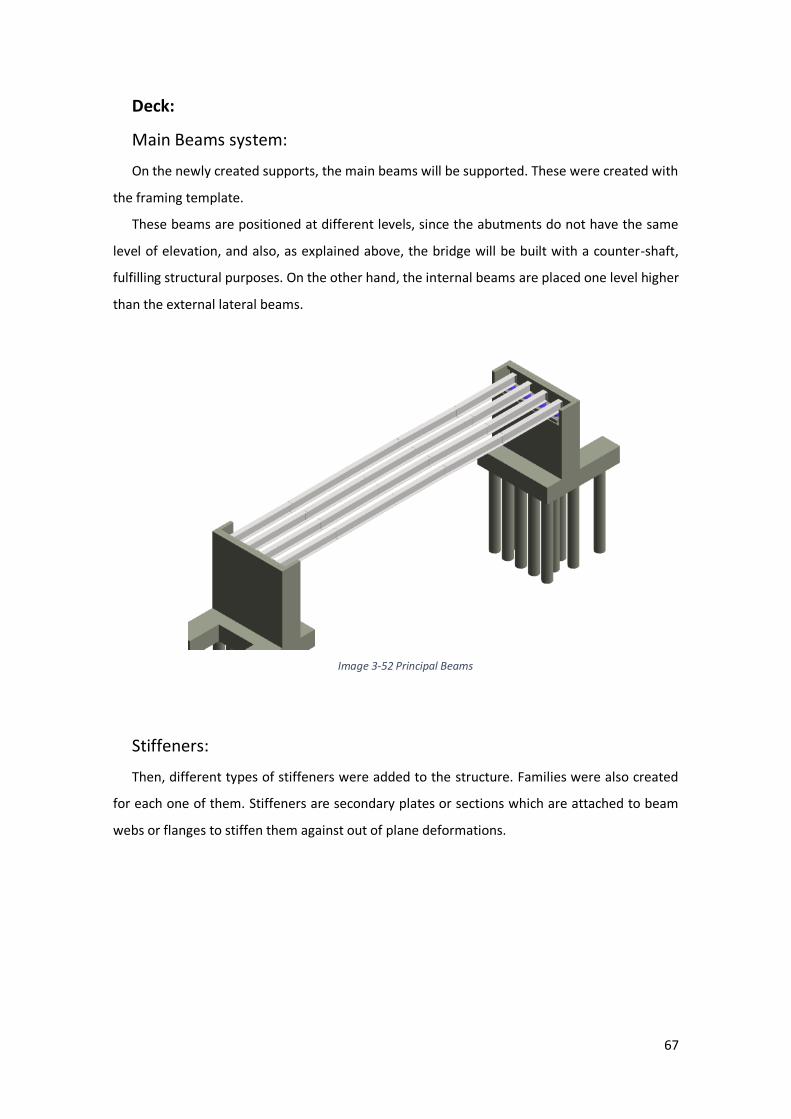
67
Deck:
Main Beams system:
On the newly created supports, the main beams will be supported. These were created with
the framing template.
These beams are positioned at different levels, since the abutments do not have the same
level of elevation, and also, as explained above, the bridge will be built with a counter-shaft,
fulfilling structural purposes. On the other hand, the internal beams are placed one level higher
than the external lateral beams.
Image 3-52 Principal Beams
Stiffeners:
Then, different types of stiffeners were added to the structure. Families were also created
for each one of them. Stiffeners are secondary plates or sections which are attached to beam
webs or flanges to stiffen them against out of plane deformations.
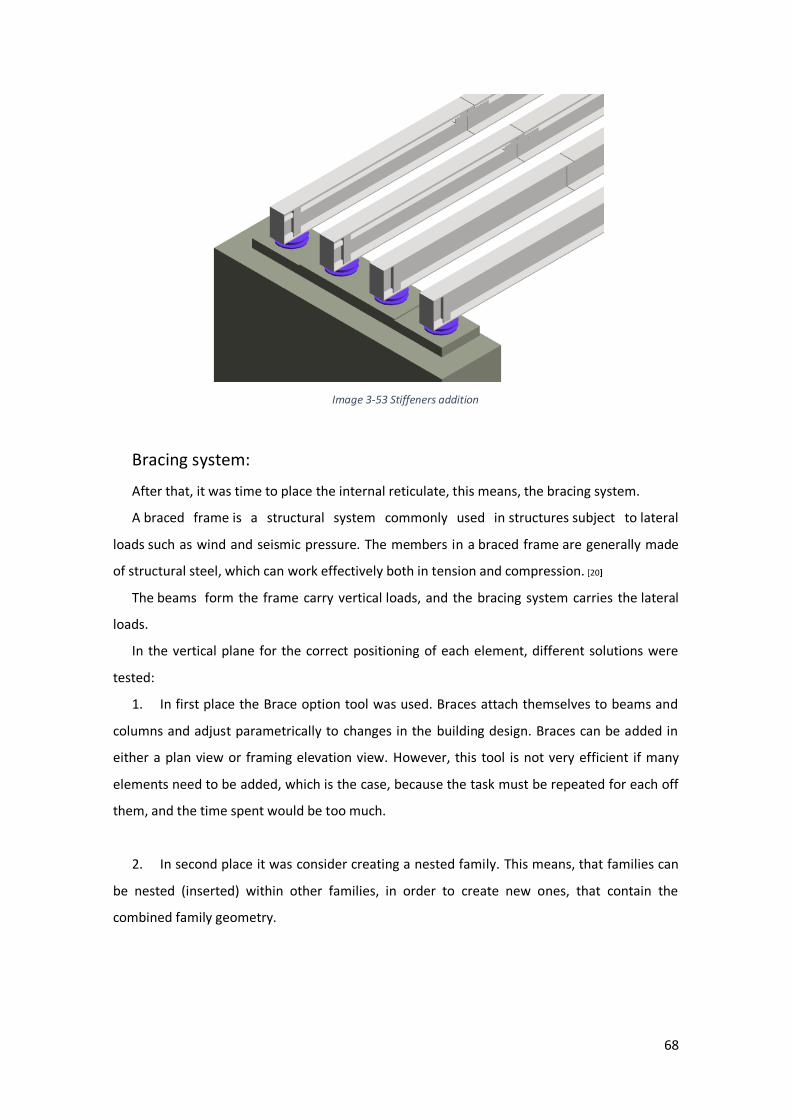
68
Image 3-53 Stiffeners addition
Bracing system:
After that, it was time to place the internal reticulate, this means, the bracing system.
A braced frame is a structural system commonly used in structures subject to lateral
loads such as wind and seismic pressure. The members in a braced frame are generally made
of structural steel, which can work effectively both in tension and compression. [20]
The beams form the frame carry vertical loads, and the bracing system carries the lateral
loads.
In the vertical plane for the correct positioning of each element, different solutions were
tested:
1. In first place the Brace option tool was used. Braces attach themselves to beams and
columns and adjust parametrically to changes in the building design. Braces can be added in
either a plan view or framing elevation view. However, this tool is not very efficient if many
elements need to be added, which is the case, because the task must be repeated for each off
them, and the time spent would be too much.
2. In second place it was consider creating a nested family. This means, that families can
be nested (inserted) within other families, in order to create new ones, that contain the
combined family geometry.
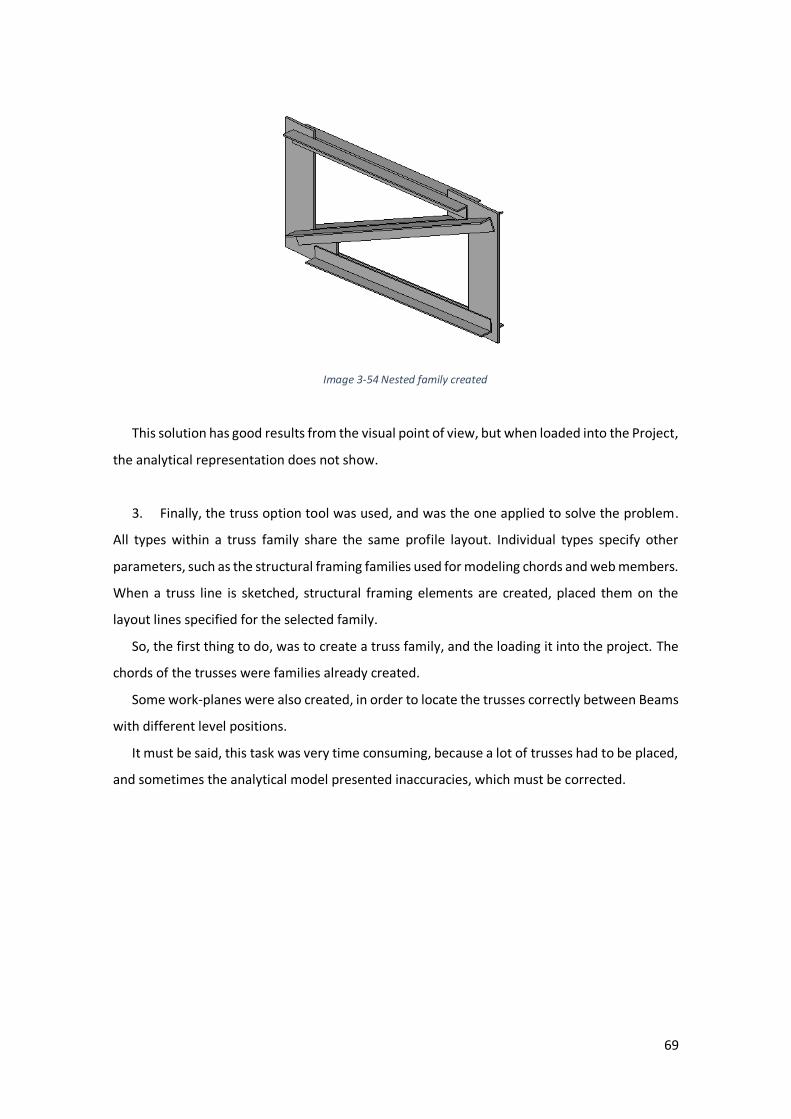
69
Image 3-54 Nested family created
This solution has good results from the visual point of view, but when loaded into the Project,
the analytical representation does not show.
3. Finally, the truss option tool was used, and was the one applied to solve the problem.
All types within a truss family share the same profile layout. Individual types specify other
parameters, such as the structural framing families used for modeling chords and web members.
When a truss line is sketched, structural framing elements are created, placed them on the
layout lines specified for the selected family.
So, the first thing to do, was to create a truss family, and the loading it into the project. The
chords of the trusses were families already created.
Some work-planes were also created, in order to locate the trusses correctly between Beams
with different level positions.
It must be said, this task was very time consuming, because a lot of trusses had to be placed,
and sometimes the analytical model presented inaccuracies, which must be corrected.
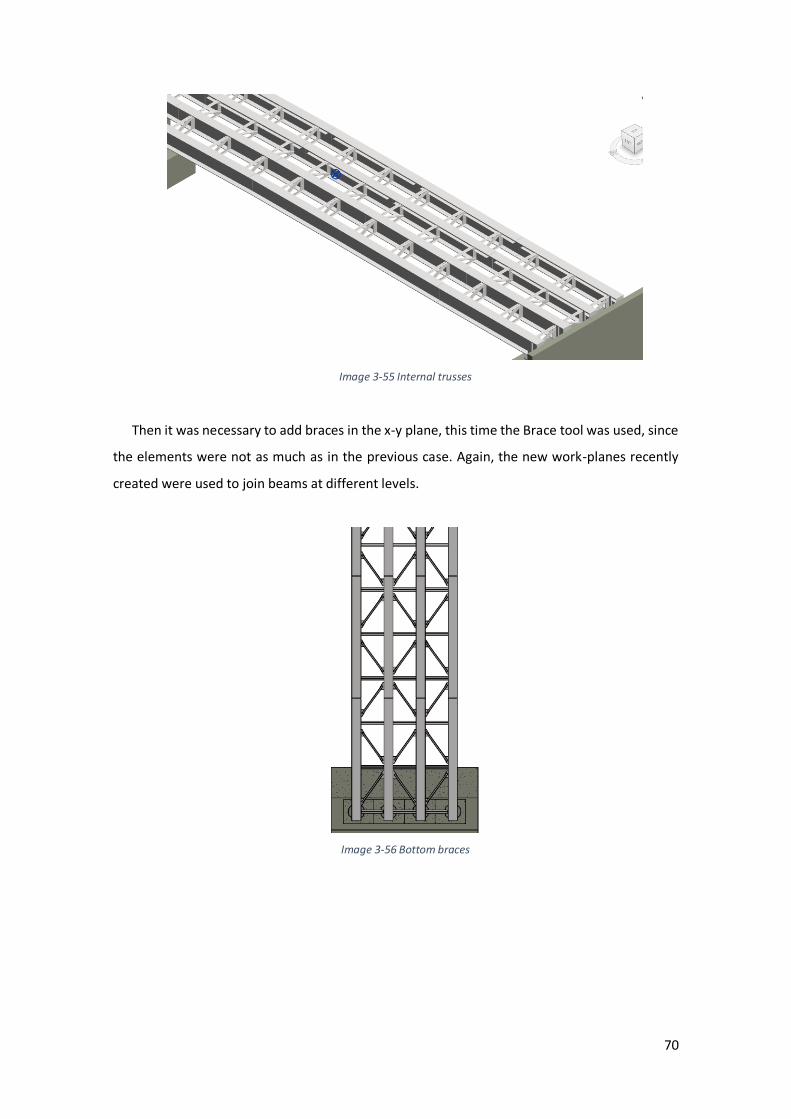
70
Image 3-55 Internal trusses
Then it was necessary to add braces in the x-y plane, this time the Brace tool was used, since
the elements were not as much as in the previous case. Again, the new work-planes recently
created were used to join beams at different levels.
Image 3-56 Bottom braces
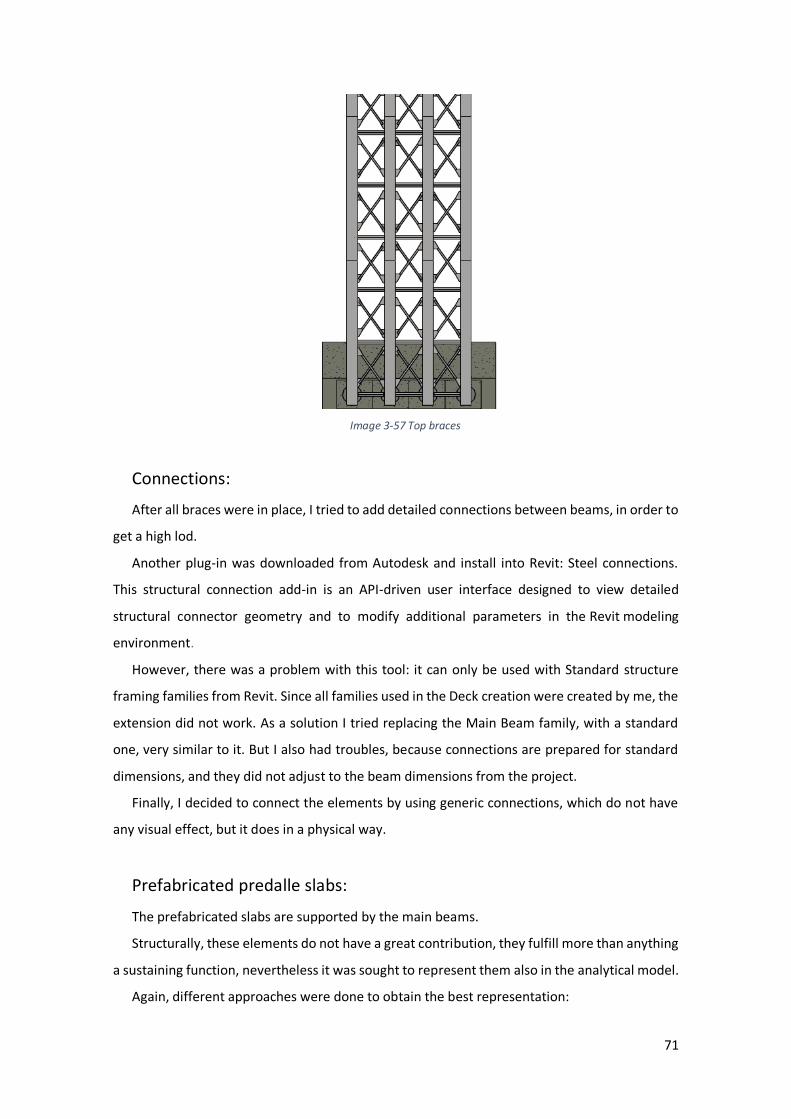
71
Image 3-57 Top braces
Connections:
After all braces were in place, I tried to add detailed connections between beams, in order to
get a high lod.
Another plug-in was downloaded from Autodesk and install into Revit: Steel connections.
This structural connection add-in is an API-driven user interface designed to view detailed
structural connector geometry and to modify additional parameters in the Revit modeling
environment.
However, there was a problem with this tool: it can only be used with Standard structure
framing families from Revit. Since all families used in the Deck creation were created by me, the
extension did not work. As a solution I tried replacing the Main Beam family, with a standard
one, very similar to it. But I also had troubles, because connections are prepared for standard
dimensions, and they did not adjust to the beam dimensions from the project.
Finally, I decided to connect the elements by using generic connections, which do not have
any visual effect, but it does in a physical way.
Prefabricated predalle slabs:
The prefabricated slabs are supported by the main beams.
Structurally, these elements do not have a great contribution, they fulfill more than anything
a sustaining function, nevertheless it was sought to represent them also in the analytical model.
Again, different approaches were done to obtain the best representation:
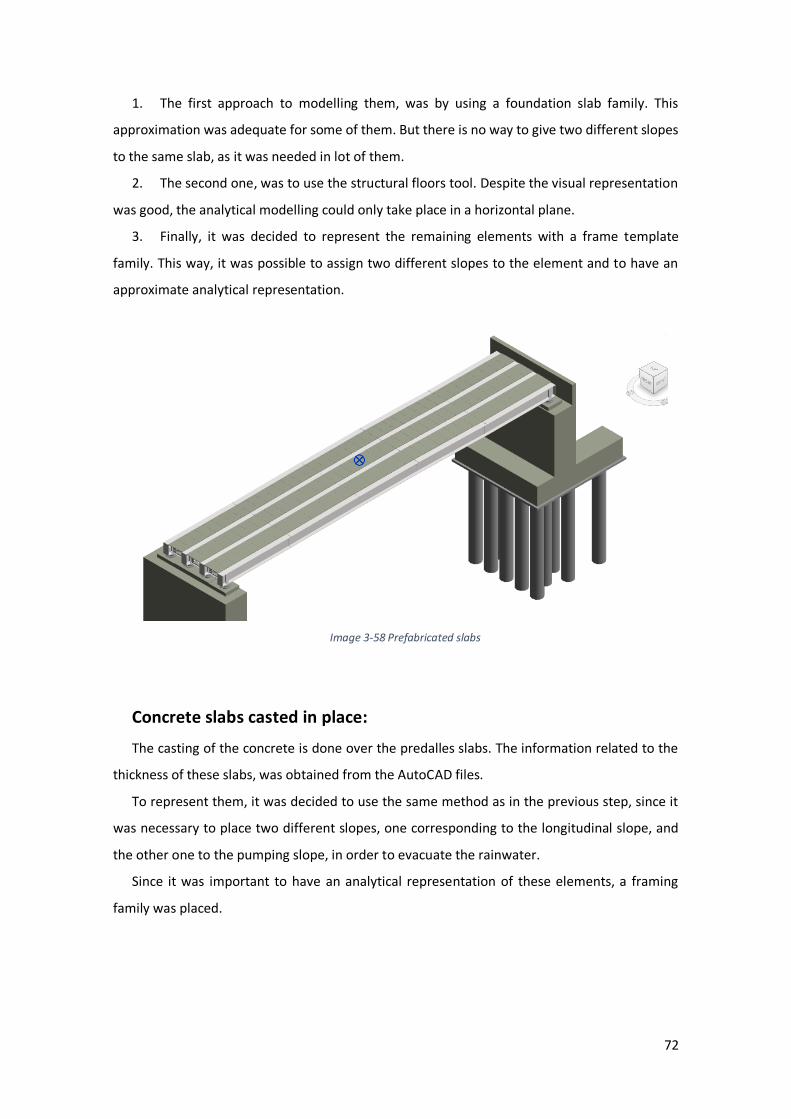
72
1. The first approach to modelling them, was by using a foundation slab family. This
approximation was adequate for some of them. But there is no way to give two different slopes
to the same slab, as it was needed in lot of them.
2. The second one, was to use the structural floors tool. Despite the visual representation
was good, the analytical modelling could only take place in a horizontal plane.
3. Finally, it was decided to represent the remaining elements with a frame template
family. This way, it was possible to assign two different slopes to the element and to have an
approximate analytical representation.
Image 3-58 Prefabricated slabs
Concrete slabs casted in place:
The casting of the concrete is done over the predalles slabs. The information related to the
thickness of these slabs, was obtained from the AutoCAD files.
To represent them, it was decided to use the same method as in the previous step, since it
was necessary to place two different slopes, one corresponding to the longitudinal slope, and
the other one to the pumping slope, in order to evacuate the rainwater.
Since it was important to have an analytical representation of these elements, a framing
family was placed.
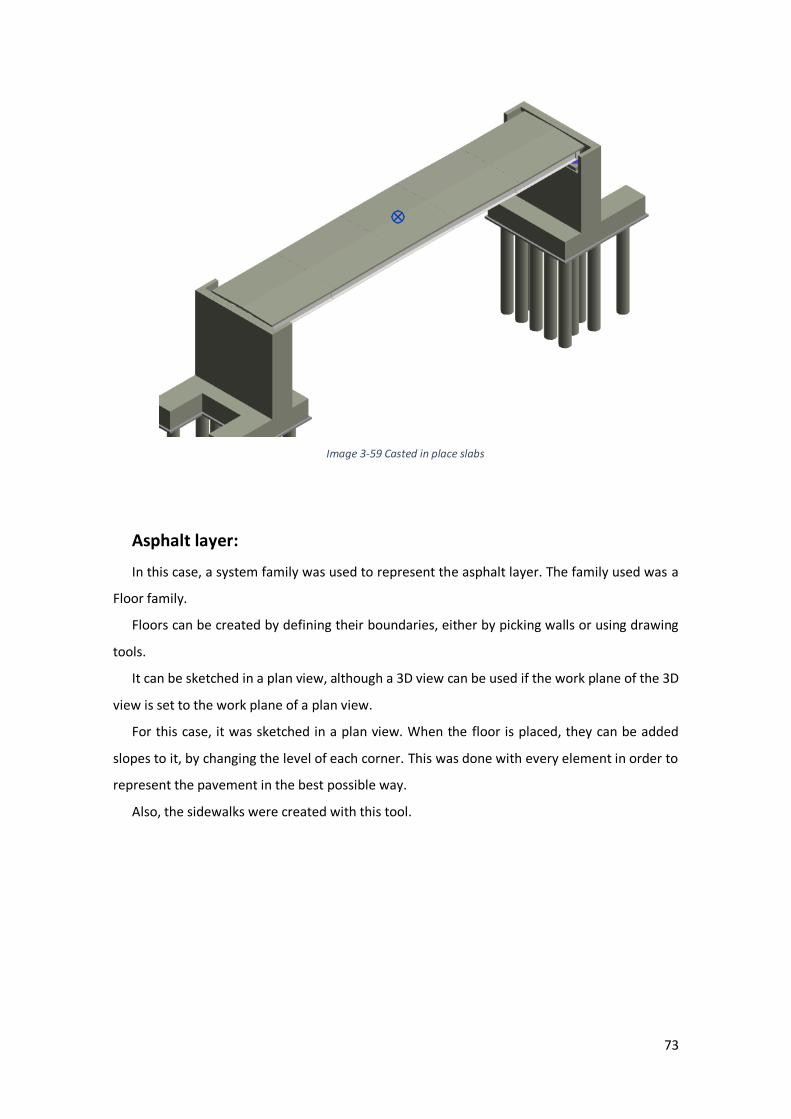
73
Image 3-59 Casted in place slabs
Asphalt layer:
In this case, a system family was used to represent the asphalt layer. The family used was a
Floor family.
Floors can be created by defining their boundaries, either by picking walls or using drawing
tools.
It can be sketched in a plan view, although a 3D view can be used if the work plane of the 3D
view is set to the work plane of a plan view.
For this case, it was sketched in a plan view. When the floor is placed, they can be added
slopes to it, by changing the level of each corner. This was done with every element in order to
represent the pavement in the best possible way.
Also, the sidewalks were created with this tool.
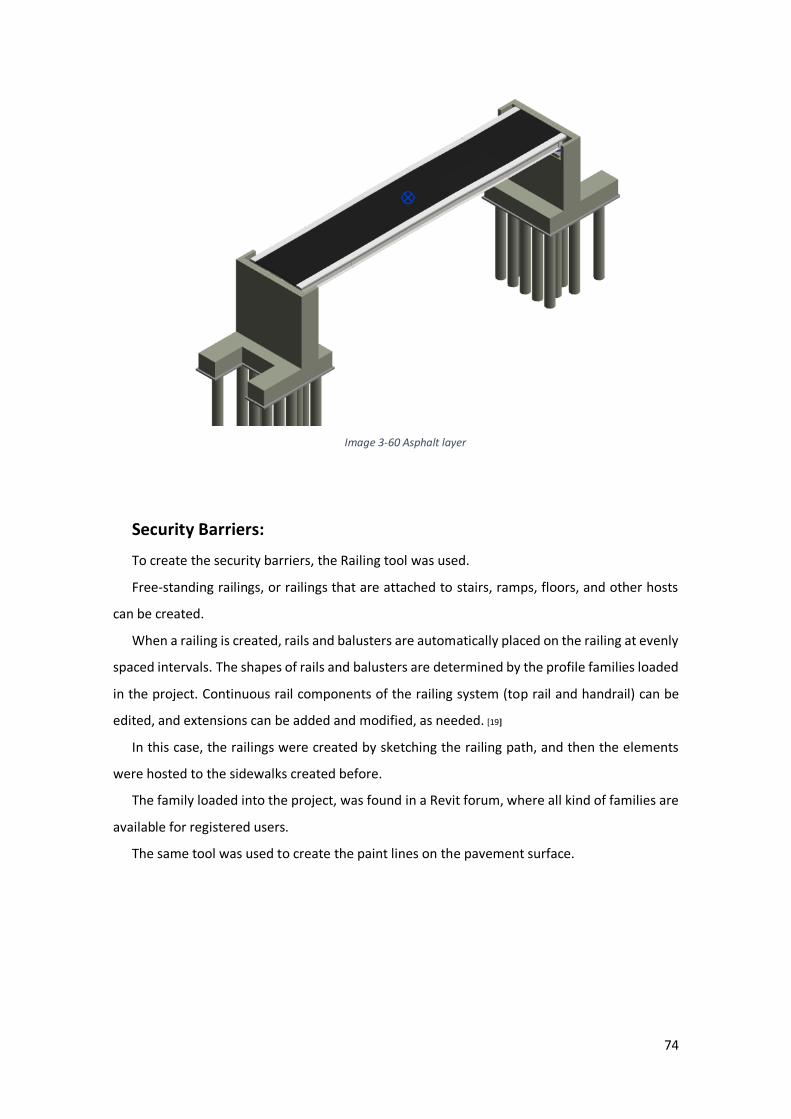
74
Image 3-60 Asphalt layer
Security Barriers:
To create the security barriers, the Railing tool was used.
Free-standing railings, or railings that are attached to stairs, ramps, floors, and other hosts
can be created.
When a railing is created, rails and balusters are automatically placed on the railing at evenly
spaced intervals. The shapes of rails and balusters are determined by the profile families loaded
in the project. Continuous rail components of the railing system (top rail and handrail) can be
edited, and extensions can be added and modified, as needed. [19]
In this case, the railings were created by sketching the railing path, and then the elements
were hosted to the sidewalks created before.
The family loaded into the project, was found in a Revit forum, where all kind of families are
available for registered users.
The same tool was used to create the paint lines on the pavement surface.
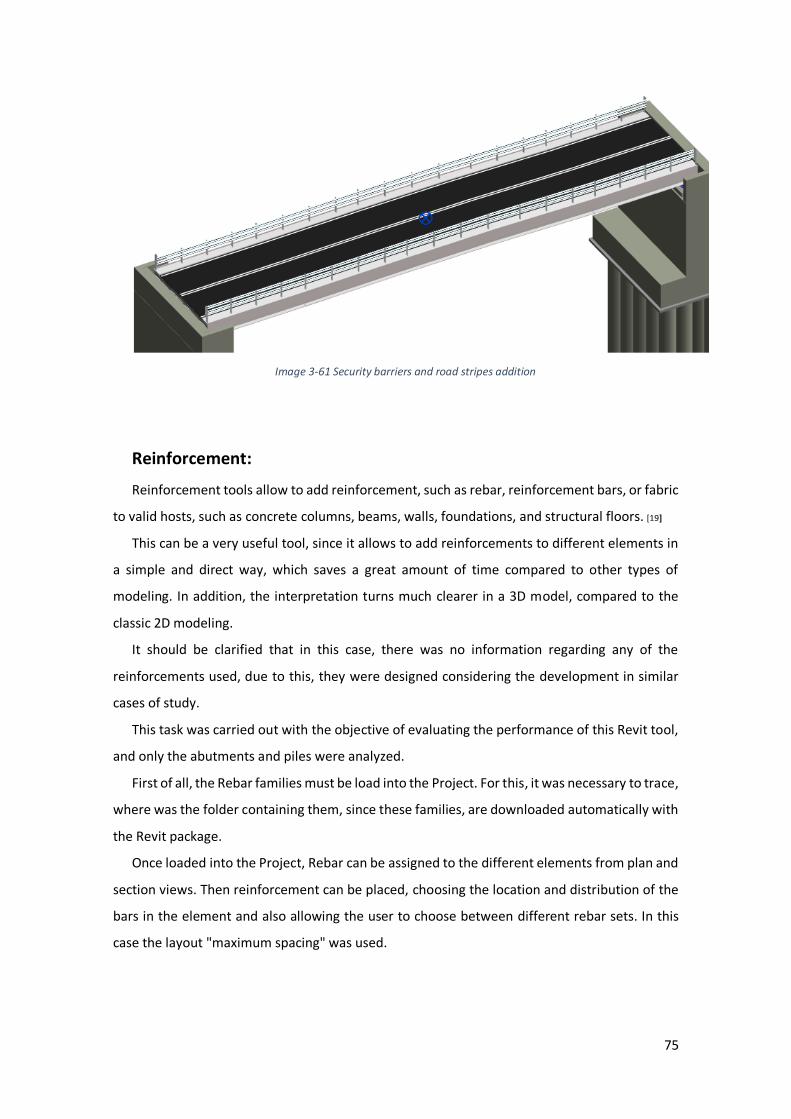
75
Image 3-61 Security barriers and road stripes addition
Reinforcement:
Reinforcement tools allow to add reinforcement, such as rebar, reinforcement bars, or fabric
to valid hosts, such as concrete columns, beams, walls, foundations, and structural floors. [19]
This can be a very useful tool, since it allows to add reinforcements to different elements in
a simple and direct way, which saves a great amount of time compared to other types of
modeling. In addition, the interpretation turns much clearer in a 3D model, compared to the
classic 2D modeling.
It should be clarified that in this case, there was no information regarding any of the
reinforcements used, due to this, they were designed considering the development in similar
cases of study.
This task was carried out with the objective of evaluating the performance of this Revit tool,
and only the abutments and piles were analyzed.
First of all, the Rebar families must be load into the Project. For this, it was necessary to trace,
where was the folder containing them, since these families, are downloaded automatically with
the Revit package.
Once loaded into the Project, Rebar can be assigned to the different elements from plan and
section views. Then reinforcement can be placed, choosing the location and distribution of the
bars in the element and also allowing the user to choose between different rebar sets. In this
case the layout "maximum spacing" was used.
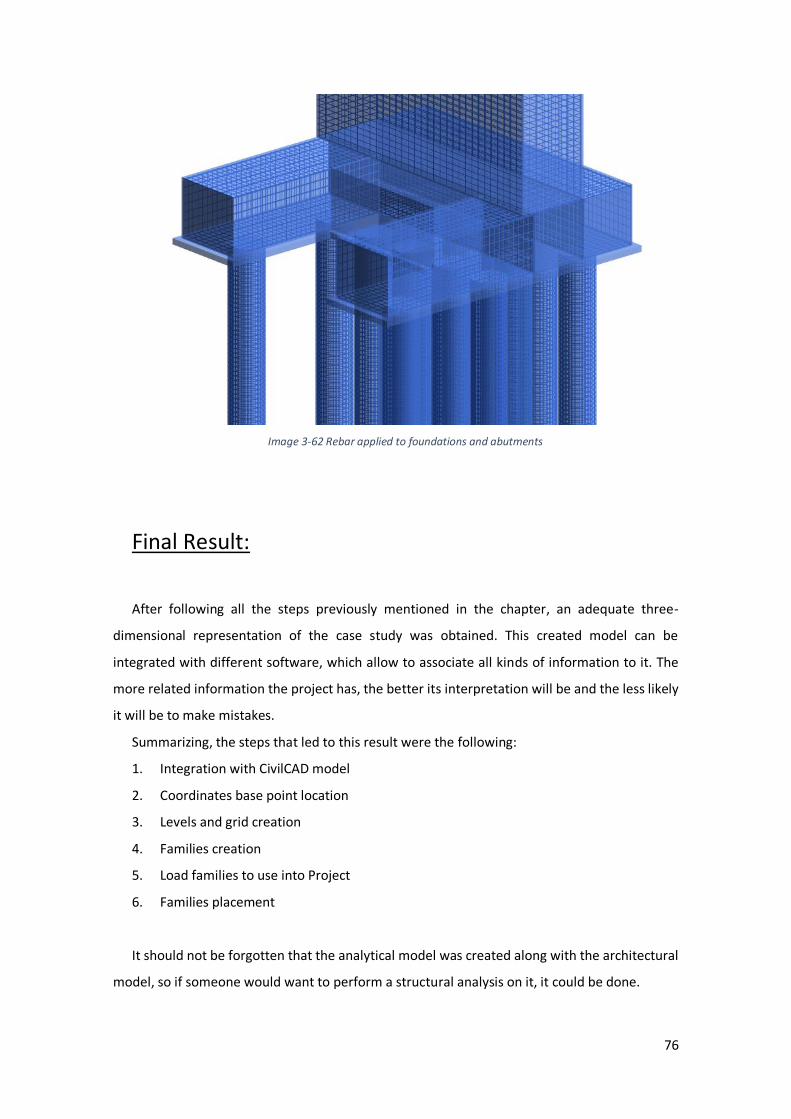
76
Image 3-62 Rebar applied to foundations and abutments
Final Result:
After following all the steps previously mentioned in the chapter, an adequate three-
dimensional representation of the case study was obtained. This created model can be
integrated with different software, which allow to associate all kinds of information to it. The
more related information the project has, the better its interpretation will be and the less likely
it will be to make mistakes.
Summarizing, the steps that led to this result were the following:
1. Integration with CivilCAD model
2. Coordinates base point location
3. Levels and grid creation
4. Families creation
5. Load families to use into Project
6. Families placement
It should not be forgotten that the analytical model was created along with the architectural
model, so if someone would want to perform a structural analysis on it, it could be done.
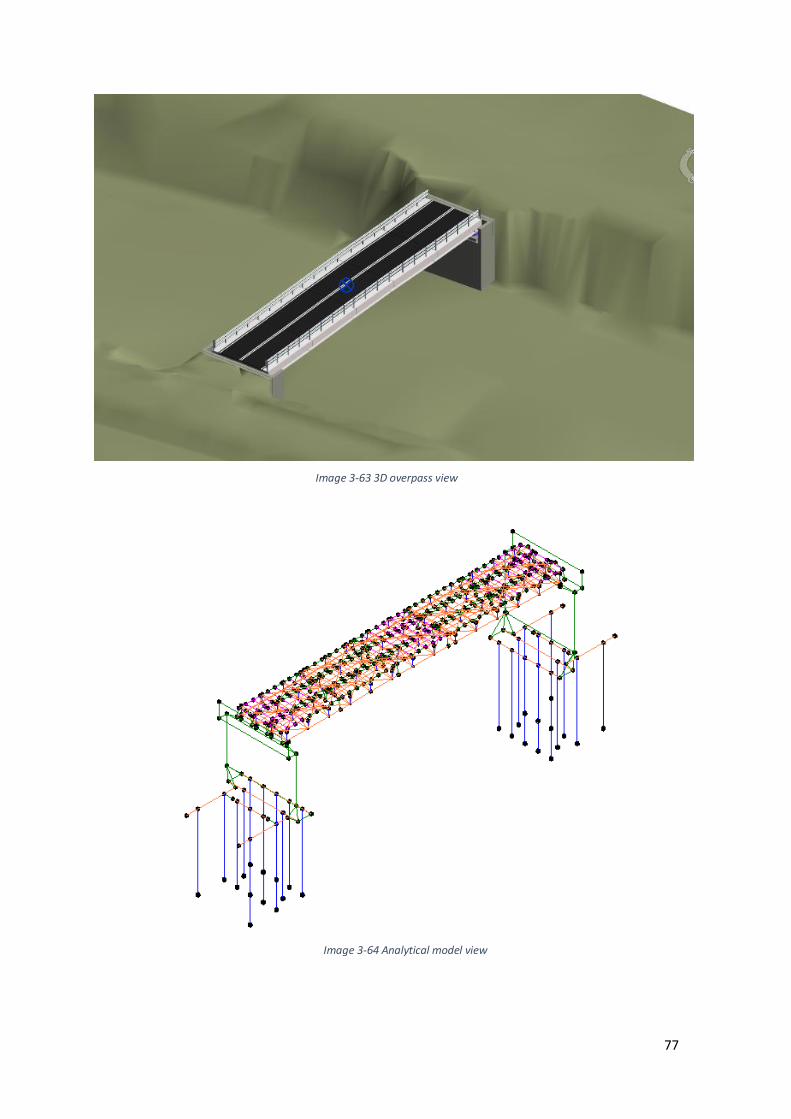
77
Image 3-63 3D overpass view
Image 3-64 Analytical model view
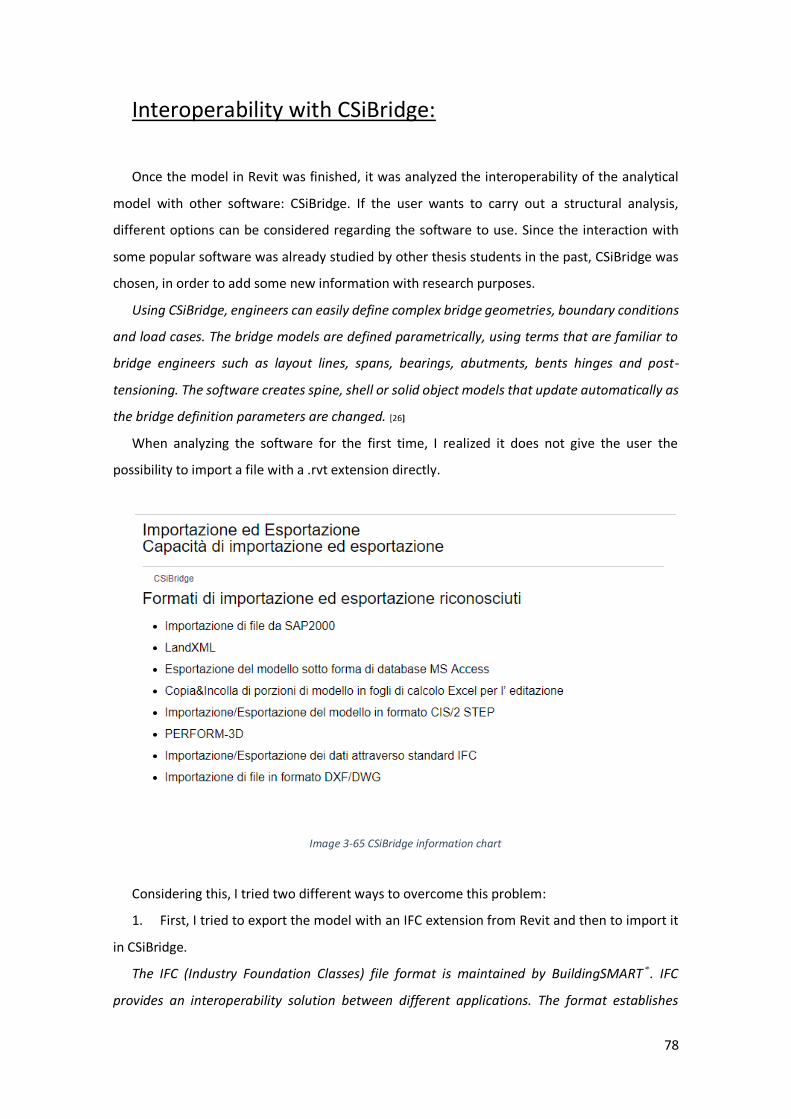
78
Interoperability with CSiBridge:
Once the model in Revit was finished, it was analyzed the interoperability of the analytical
model with other software: CSiBridge. If the user wants to carry out a structural analysis,
different options can be considered regarding the software to use. Since the interaction with
some popular software was already studied by other thesis students in the past, CSiBridge was
chosen, in order to add some new information with research purposes.
Using CSiBridge, engineers can easily define complex bridge geometries, boundary conditions
and load cases. The bridge models are defined parametrically, using terms that are familiar to
bridge engineers such as layout lines, spans, bearings, abutments, bents hinges and post-
tensioning. The software creates spine, shell or solid object models that update automatically as
the bridge definition parameters are changed. [26]
When analyzing the software for the first time, I realized it does not give the user the
possibility to import a file with a .rvt extension directly.
Image 3-65 CSiBridge information chart
Considering this, I tried two different ways to overcome this problem:
1. First, I tried to export the model with an IFC extension from Revit and then to import it
in CSiBridge.
The IFC (Industry Foundation Classes) file format is maintained by BuildingSMART®. IFC
provides an interoperability solution between different applications. The format establishes
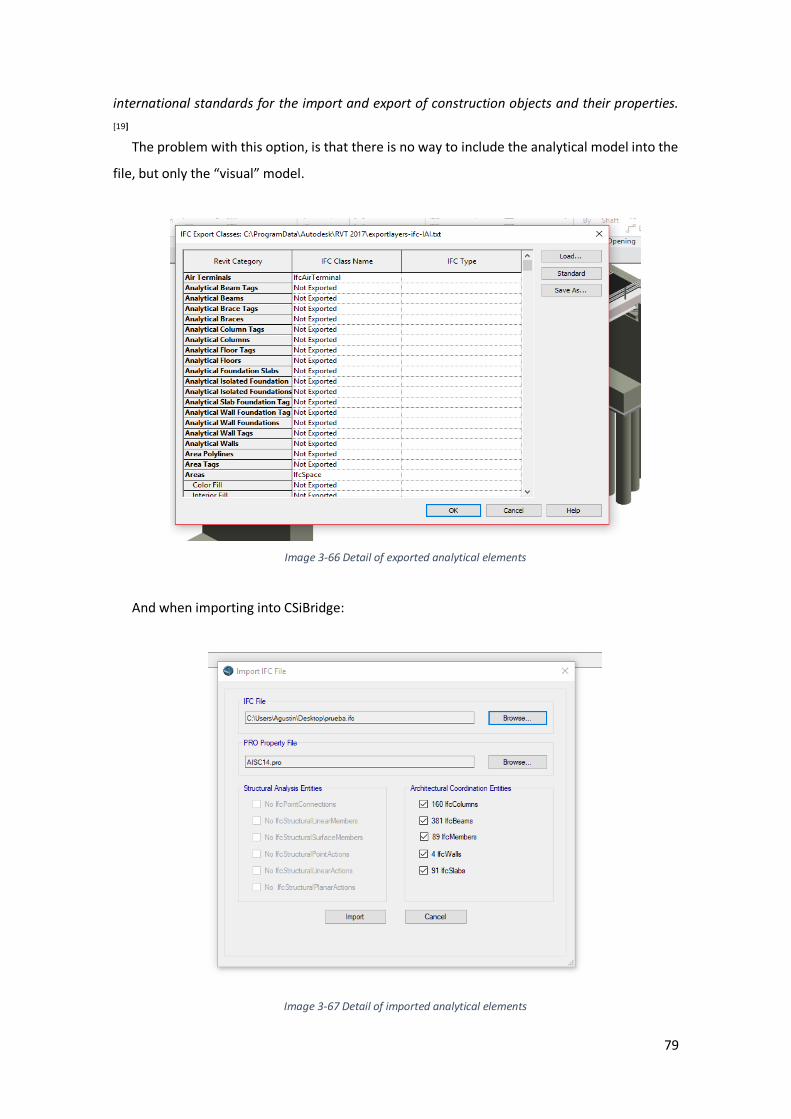
79
international standards for the import and export of construction objects and their properties.
[19]
The problem with this option, is that there is no way to include the analytical model into the
file, but only the “visual” model.
Image 3-66 Detail of exported analytical elements
And when importing into CSiBridge:
Image 3-67 Detail of imported analytical elements
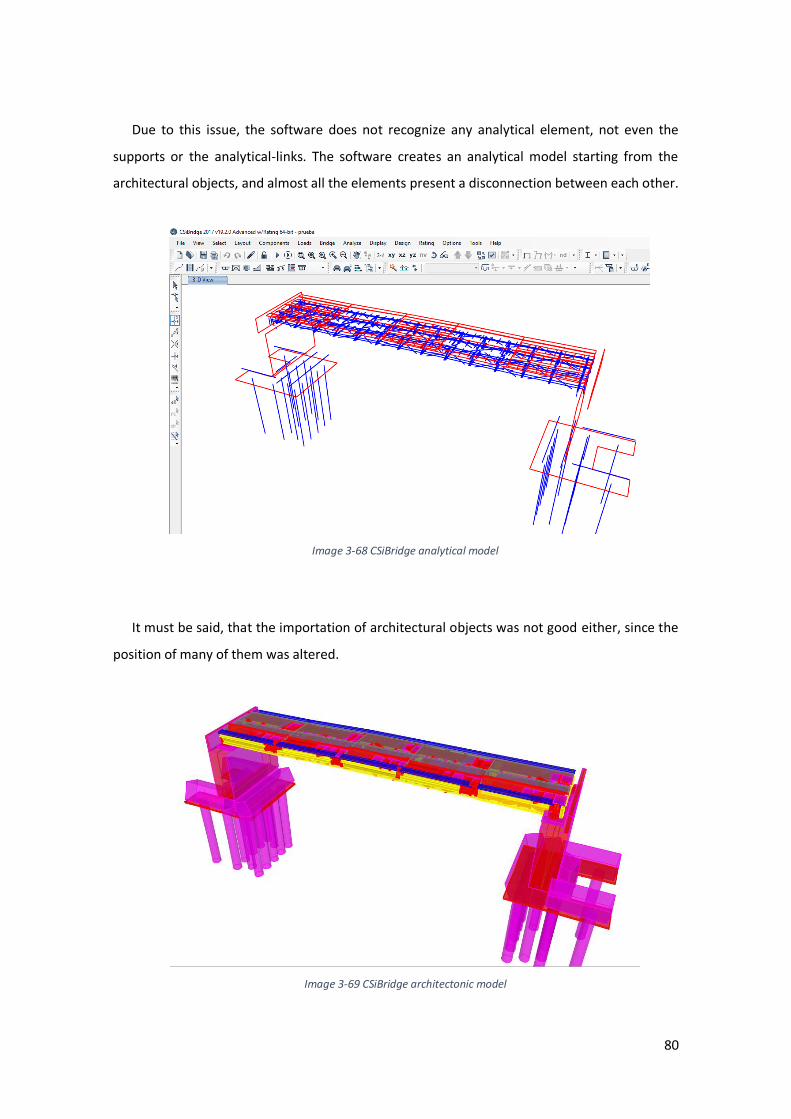
80
Due to this issue, the software does not recognize any analytical element, not even the
supports or the analytical-links. The software creates an analytical model starting from the
architectural objects, and almost all the elements present a disconnection between each other.
Image 3-68 CSiBridge analytical model
It must be said, that the importation of architectural objects was not good either, since the
position of many of them was altered.
Image 3-69 CSiBridge architectonic model

81
2. As a second choice, I decided to install an extension for Revit called CSiXRevit.
CSiXRevit is a plugin that can be installed in Revit to allow the exchange of information
between Revit and CSi software, particularly with SAP2000, ETABS and SAFE. It is a tool with
great potential that allows the integration of all the models of various specialties and promotes
productivity among the project teams.
I thought that this could be a good option to solve the problem, but the plug-in is not
compatible with CSiBridge.
Summarizing, the interoperability between Revit and CSiBridge was very bad, and I could not
find a solution to this problem.
In order to make it possible to have these two software working together, I think that the
CSiXRevit plug-in should be expand to CSiBridge too, or create a special one with this aim.
Another solution could be making possible to include the analytical model into the IFC file
format.
82
Report:
The first thing that should be highlighted is that I did not have any knowledge about how to
use the software before this work. For this reason, a lot of research had to be done in order to
learn to handle it. The family creation was the first challenge to face, and after this, how to use
the different tools which enable the Project development.
From the architectural and visual point of view, I think there were very positive aspects that
make Revit a powerful tool to use. The fact of working with parametric families and the
definition of different levels, brings with it much time saving for modeling.
However, they should also be highlighted the drawbacks to represent the model analytically,
which should be an advantage, ended up generating many complications, taking me to make
decisions I would have preferred to avoid, and demanding much more time than expected.
If we talk about building projects, I think that Revit is an incredibly useful tool, because of the
ease with which modeling can be executed, and not only from the visual point of view,
analytically speaking I think it would also provide great advantages. But in the field of
infrastructure and civil works, it should improve in several aspects to be considered an actual
efficient software. Problems such as the one related to creating so many levels for this Project,
in order to properly represent the bridge, can bring confusion to the user when using them. On
the other hand, having to choose alternative ways to create some elements such as the
abutments, dividing it into sub-elements, to have a good analytical representation, takes away
practicality from the BIM point of view.
Even so, taking into account the difficulties that had to be overcome, representing the model
three-dimensionally, was a great advantage respect to the traditional design in 2 dimensions,
leading to a much clearer interpretation of the Project, especially in regard to certain details
such as stiffeners, whose representation in the AutoCAD files was not very good, and it took me
a long time to understand the geometry and distribution of them.
Respect to interoperability, it was quite good between Autodesk software. The linking of the
file to CivilCAD was done without major problem, but it must be highlighted that intersections
modeled in CivilCAD, could not be represented in Revit. This was not a big problem here but is
something to take into account. Regarding the interoperability between Revit and the CSiBridge,
this was very bad, and to perform a structural analysis from a model created in Revit would be
unviable with this software.
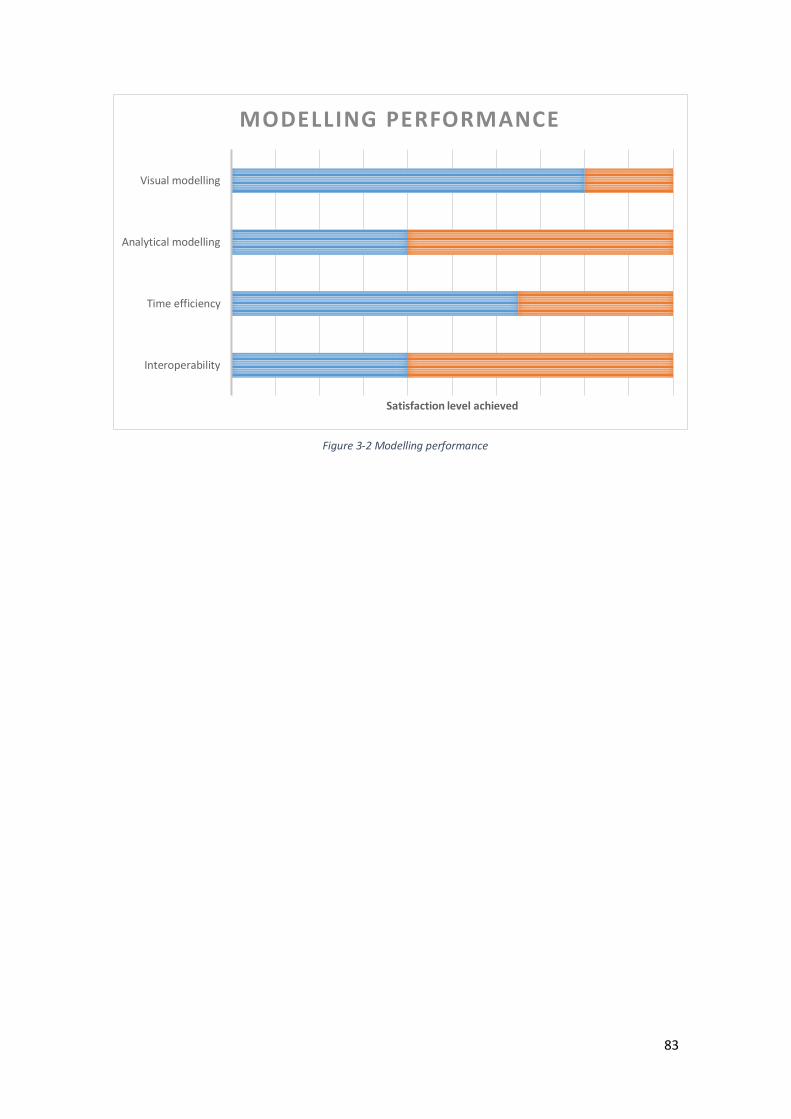
83
Figure 3-2 Modelling performance
Interoperability
Time efficiency
Analytical modelling
Visual modelling
Satisfaction level achieved
MODELLING PERFORMANCE
84
SECTION 4 : LINKING TO
MAINTENANCE PLAN INFORMATION
85
First approach:
After finishing the modeling, both the context and the Bridge, the model created in Revit was
linked to information correlated with the maintenance plan of the overpass.
To do this, different alternatives were tested, and different procedures were followed,
several software were used, which will be presented in each case.
It should be clarified that there was no information on the maintenance plan of this specific
Project, but it was possible to obtain documentation of an overpass very similar to the one of
the study case, where the deadlines and activities corresponding to the maintenance plan were
detailed.
The documentation analyzed correspond to the maintenance plan of the S.S. 131 di “Carlo
Felice”.
The maintenance plan structure is the following one:
The "Use Manual", provides a set of information that allows the user to know the
function and management mode of the asset, in order to avoid its early degradation. It indicates
the possible damages that may be suffered by the elements due to improper use, which are the
necessary operations without technical knowledge to conserve the asset and allows timely
recognition of the anomalous phenomena of asset deterioration, to intervene also with
"specialized" operations.
The "Maintenance Manual" provides the necessary indications for the correct
maintenance of the overpass, identifying them on time for the different parts and components
of it and in relation to the characteristics of the constituent materials.
The "Maintenance Program", defines the control and interventions system in time, to
be carried out at fixed intervals, in order to correctly manage and maintain over the years the
functional and quality characteristics of the works and their parts. The "Maintenance Program"
is divided into three sub-programs:
o Performance Sub-program, which defines at a programmatic level the state of use,
conservation and performance of the various parts of the asset during its life cycle.
o Controls Sub-program, which defines the program of checks and controls, in order to
detect the status of the works at various times in the life of the asset, identifying the details and
the dynamics of the performance falls.
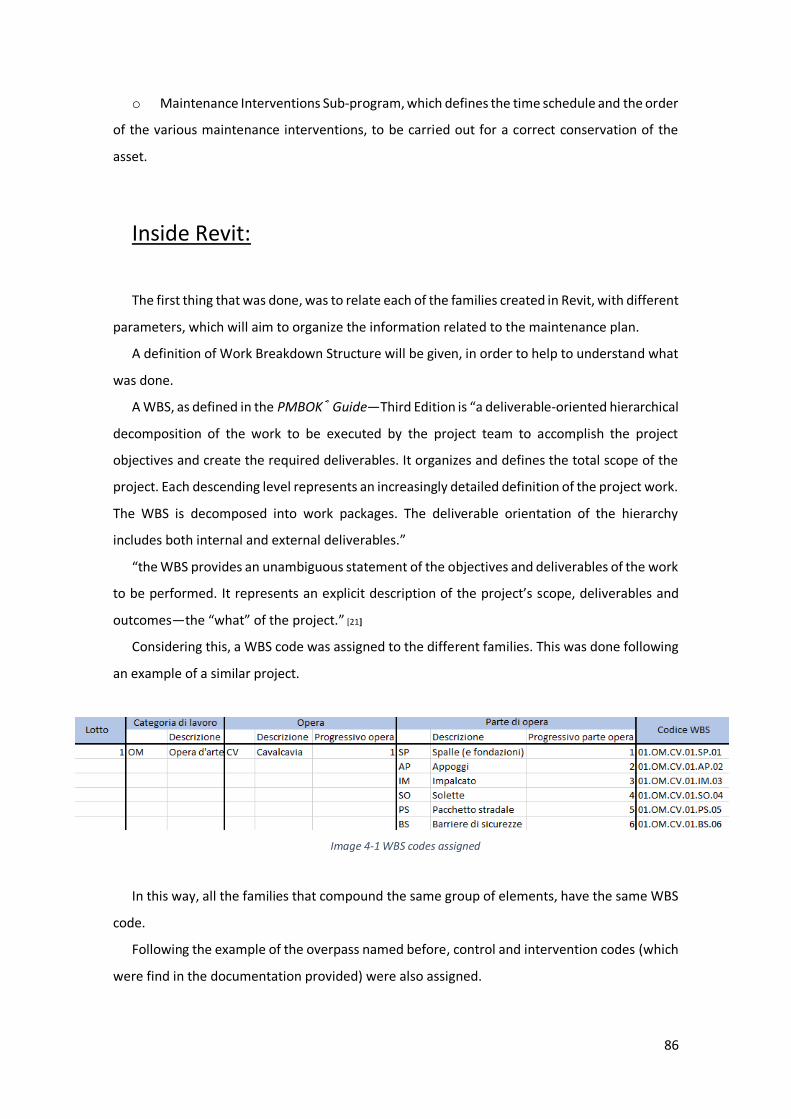
86
o Maintenance Interventions Sub-program, which defines the time schedule and the order
of the various maintenance interventions, to be carried out for a correct conservation of the
asset.
Inside Revit:
The first thing that was done, was to relate each of the families created in Revit, with different
parameters, which will aim to organize the information related to the maintenance plan.
A definition of Work Breakdown Structure will be given, in order to help to understand what
was done.
A WBS, as defined in the PMBOK® Guide—Third Edition is “a deliverable-oriented hierarchical
decomposition of the work to be executed by the project team to accomplish the project
objectives and create the required deliverables. It organizes and defines the total scope of the
project. Each descending level represents an increasingly detailed definition of the project work.
The WBS is decomposed into work packages. The deliverable orientation of the hierarchy
includes both internal and external deliverables.”
“the WBS provides an unambiguous statement of the objectives and deliverables of the work
to be performed. It represents an explicit description of the project’s scope, deliverables and
outcomes—the “what” of the project.” [21]
Considering this, a WBS code was assigned to the different families. This was done following
an example of a similar project.
Image 4-1 WBS codes assigned
In this way, all the families that compound the same group of elements, have the same WBS
code.
Following the example of the overpass named before, control and intervention codes (which
were find in the documentation provided) were also assigned.
87
Shared parameters:
The codes previously mentioned, were assigned as shared parameters.
Shared parameters are definitions of parameters that can be added to families or projects.
Shared parameter definitions are stored in a file independent of any family file or Revit project;
this allows the user to access the file from different families or projects. The shared parameter
is a definition of a container for information that can be used in multiple families or projects.
The information defined in one family or project using the shared parameter is not automatically
applied to another family or project using the same shared parameter.
Shared parameters are also useful when it is wanted to create a schedule that displays
various family categories; without a shared parameter, this cannot be done. If a shared
parameter is created and add to the desired family categories, then a schedule with these
categories can be created. This is called creating a multi-category schedule in Revit. [19]
In order to create them:
Manage Settings Shared parameters
It is necessary to define a new group, and then add the parameters, choosing the discipline
and the parameter type for each of them.
Image 4-2 Shared parameters
88
Schedules:
After adding the shared parameters to all the families, schedules were created. These
represent another way to see information attached to the project.
The first attempt to do them, was creating a multi-category Schedule/Quantities type. The
problem with this option, is that host families, such as floors, walls and railings, cannot be
included in the schedule.
Due to this issue, and doing a bit of research in internet, a better solution was find. Another
schedule type must be created, this was the "material takeoff" type one. In this way, I could put
almost all the family categories (except the safety barriers, which I had to put in a special
schedule for railing) in the same Schedule. However, a field related to the material type must be
included in the table, with no option to exclude it.
After the schedule was created, the shared parameters were added into it. In order to do
this, first it is necessary to create project parameters from them. Project parameters, are used
for scheduling, sorting and filtering in a Project. Apart from those, some other project
parameters were created to add information related to the maintenance plan to the different
families, and to have it organized in the schedule.
The path to create project parameters, is the following one:
Manage Settings Project parameters Add
Then, the parameter type, parameter data, and families’ categories to attach them to, are
chosen.
After all the project parameters were created, they were added as fields to the Schedule.
Image 4-3 Schedule maintenance plan
In the schedule above, it is possible to see all the objects grouped in composite elements. It
is also possible to see every single object if wanted, checking in the sorting/grouping properties:
89
Itemize every instance. For convenience purposes it was decided to display the schedule in this
way.
Image 4-4 Schedule Security Barrier
As mentioned before, a special schedule for “railing” category needed to be created, since
the elements belonging to this category, are not shown in the “material takeoff” schedule type.
If someone want to see specifically, which model objects belong to each of the subgroups (it
means, all the objects that have the same WBS parameter), these can be highlighted through
two simple steps:
Select a cell from the Schedule Highlight in model
If I do this for example with the cell “01.OM.CV.01.SP.01”, the 3D view of the model opens,
and shows every object with this code.
Image 4-5 Highlighted 01.OM.CV.01.SP.01 code WBS
90
Working with parameters, can be very useful, since by just clicking on a specific object of the
model, in its properties, you can see the information that interests the user.
Image 4-6 Parameters in object properties
I also tried to create different phases, with the objective of dividing the controls to be carried
out in different time frames. However, the schedules created in Revit, do not allow the inclusion
of families belonging to more than one phase, therefor, they lost utility. It was not possible to
assign the time factor to the various phases neither, reason for which, it was decided to leave
this division aside.
URL parameters:
As it was explained above, the added parameters allow access to information related to each
object quickly and directly, and through the use of schedules, it is possible to organize this
information so that the user has a better interpretation of it.
However, if we want to add more complete and detailed information, such as the one linked
to the “Manual of use” or “maintenance manual”, that is, which controls to carry out, who
should carry them out, etc. the parameters added are not enough.
Different options were taken into account in order to attach this type of information to the
model. In a first instance, it was decided to create another type of parameter, which would allow
access to the information through Revit. These are the so-called URL type parameters.
“Within Revit, URLs are added to the BIM by adding a URL parameter to a family. URLs will
typically link to extended information about a real-world object and will be applicable to all
instances of the object. Therefore, URL parameters will almost always be a type level parameter
and should seldom, if ever, be an instance level parameter.” [22]
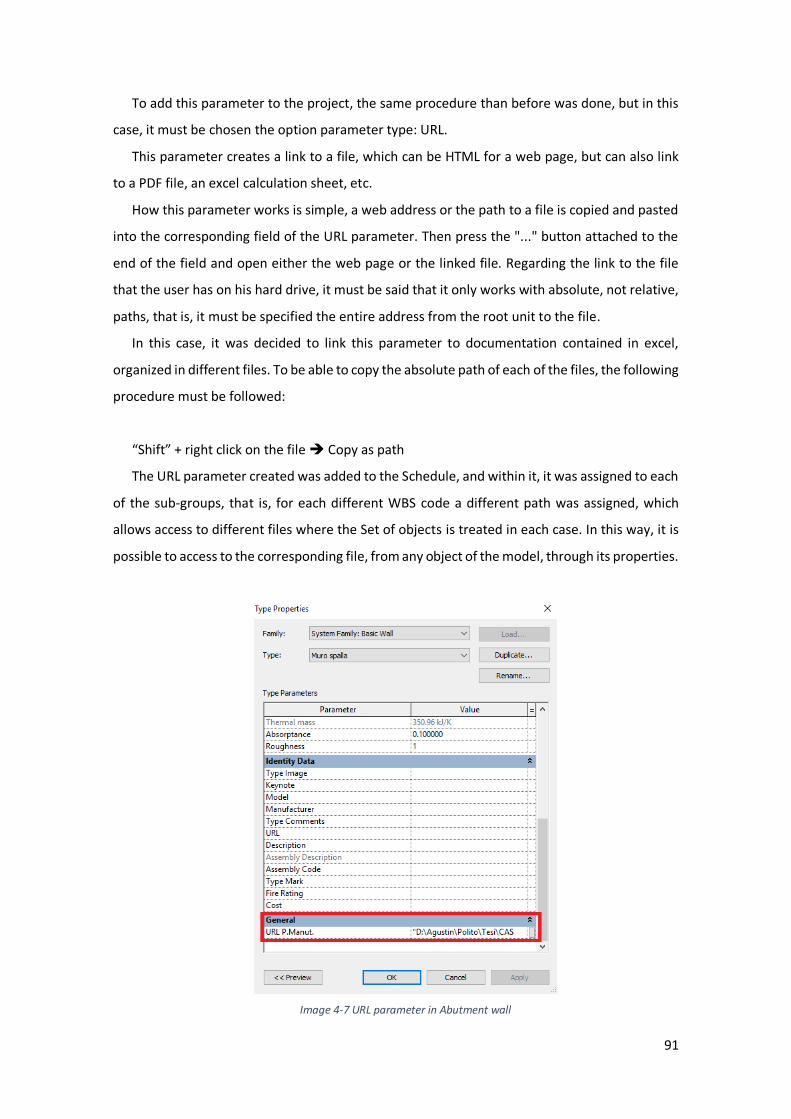
91
To add this parameter to the project, the same procedure than before was done, but in this
case, it must be chosen the option parameter type: URL.
This parameter creates a link to a file, which can be HTML for a web page, but can also link
to a PDF file, an excel calculation sheet, etc.
How this parameter works is simple, a web address or the path to a file is copied and pasted
into the corresponding field of the URL parameter. Then press the "..." button attached to the
end of the field and open either the web page or the linked file. Regarding the link to the file
that the user has on his hard drive, it must be said that it only works with absolute, not relative,
paths, that is, it must be specified the entire address from the root unit to the file.
In this case, it was decided to link this parameter to documentation contained in excel,
organized in different files. To be able to copy the absolute path of each of the files, the following
procedure must be followed:
“Shift” + right click on the file Copy as path
The URL parameter created was added to the Schedule, and within it, it was assigned to each
of the sub-groups, that is, for each different WBS code a different path was assigned, which
allows access to different files where the Set of objects is treated in each case. In this way, it is
possible to access to the corresponding file, from any object of the model, through its properties.
Image 4-7 URL parameter in Abutment wall
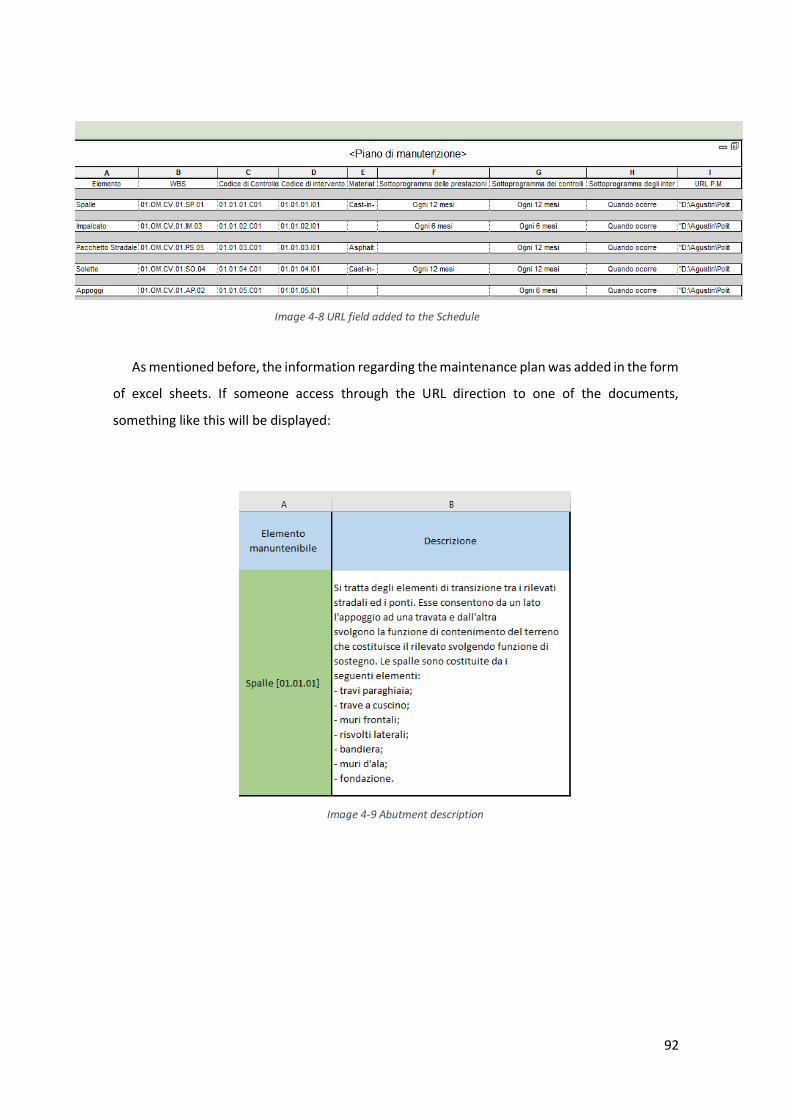
92
Image 4-8 URL field added to the Schedule
As mentioned before, the information regarding the maintenance plan was added in the form
of excel sheets. If someone access through the URL direction to one of the documents,
something like this will be displayed:
Image 4-9 Abutment description
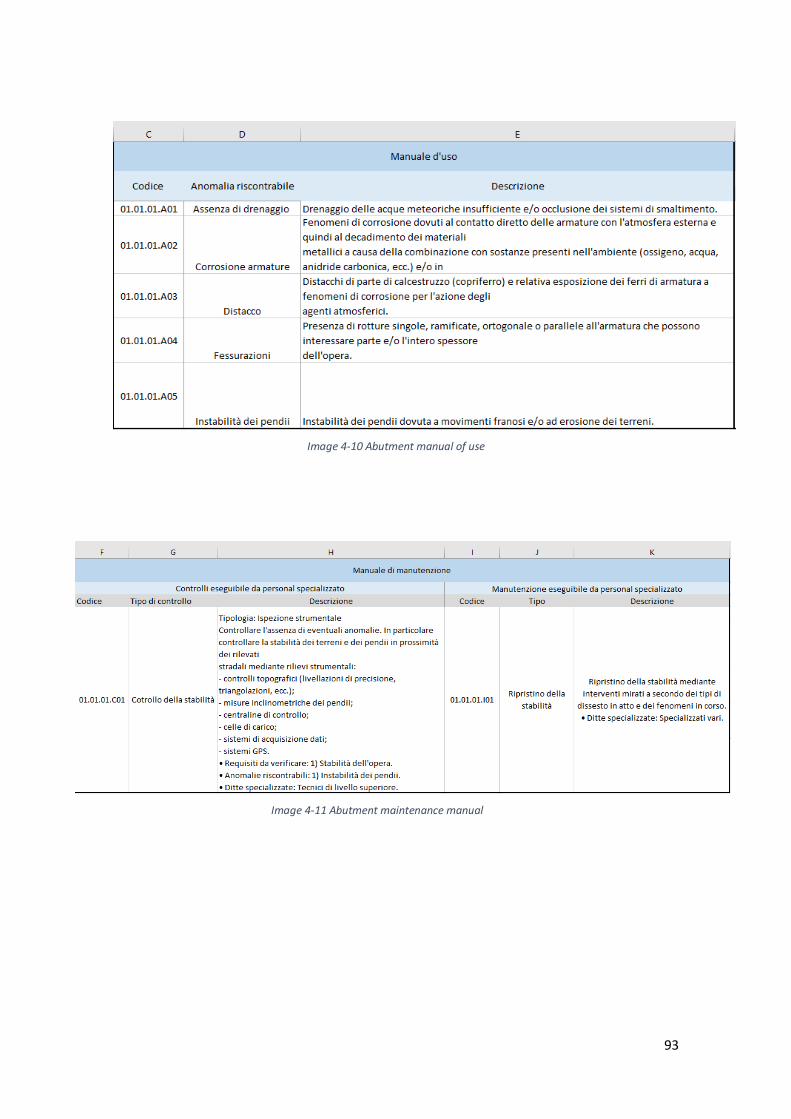
93
Image 4-10 Abutment manual of use
Image 4-11 Abutment maintenance manual
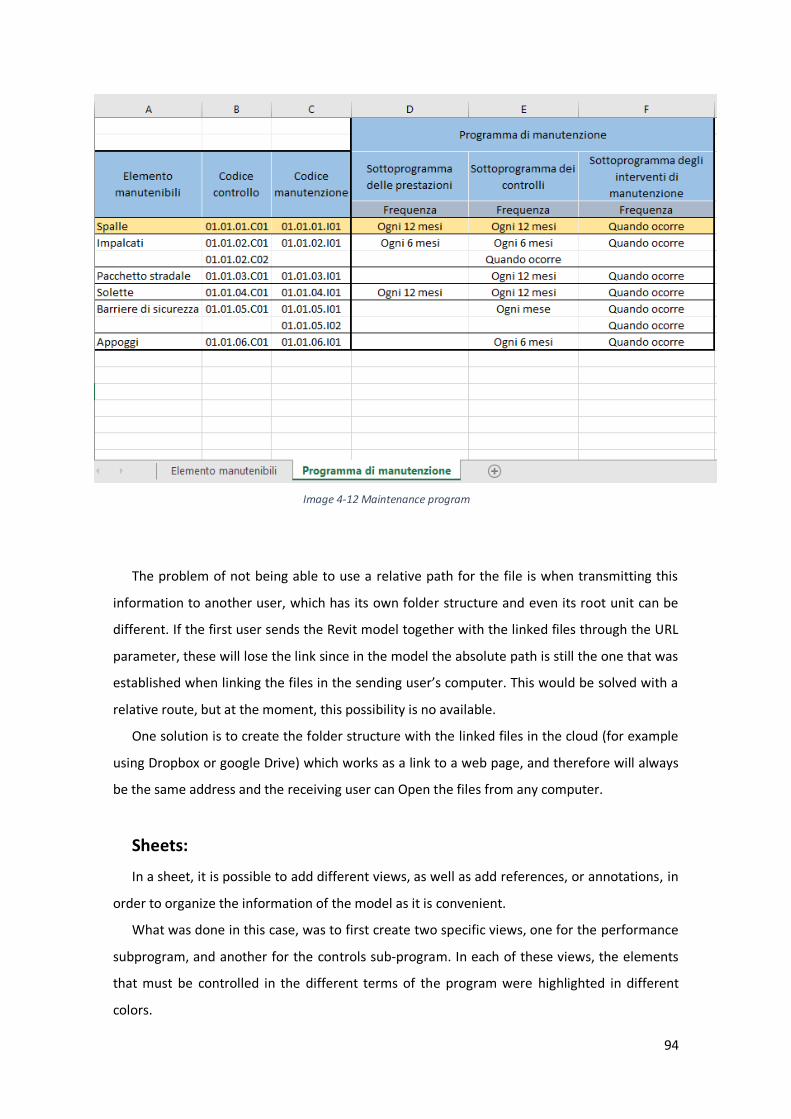
94
Image 4-12 Maintenance program
The problem of not being able to use a relative path for the file is when transmitting this
information to another user, which has its own folder structure and even its root unit can be
different. If the first user sends the Revit model together with the linked files through the URL
parameter, these will lose the link since in the model the absolute path is still the one that was
established when linking the files in the sending user’s computer. This would be solved with a
relative route, but at the moment, this possibility is no available.
One solution is to create the folder structure with the linked files in the cloud (for example
using Dropbox or google Drive) which works as a link to a web page, and therefore will always
be the same address and the receiving user can Open the files from any computer.
Sheets:
In a sheet, it is possible to add different views, as well as add references, or annotations, in
order to organize the information of the model as it is convenient.
What was done in this case, was to first create two specific views, one for the performance
subprogram, and another for the controls sub-program. In each of these views, the elements
that must be controlled in the different terms of the program were highlighted in different
colors.
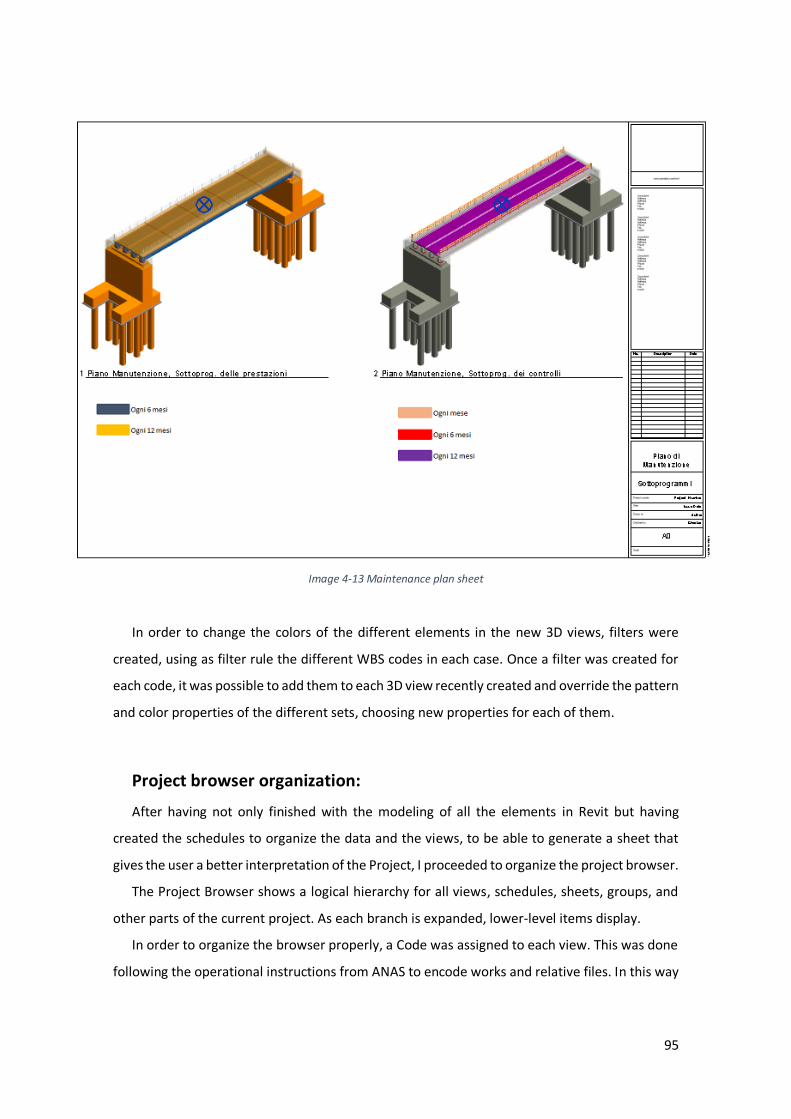
95
Image 4-13 Maintenance plan sheet
In order to change the colors of the different elements in the new 3D views, filters were
created, using as filter rule the different WBS codes in each case. Once a filter was created for
each code, it was possible to add them to each 3D view recently created and override the pattern
and color properties of the different sets, choosing new properties for each of them.
Project browser organization:
After having not only finished with the modeling of all the elements in Revit but having
created the schedules to organize the data and the views, to be able to generate a sheet that
gives the user a better interpretation of the Project, I proceeded to organize the project browser.
The Project Browser shows a logical hierarchy for all views, schedules, sheets, groups, and
other parts of the current project. As each branch is expanded, lower-level items display.
In order to organize the browser properly, a Code was assigned to each view. This was done
following the operational instructions from ANAS to encode works and relative files. In this way
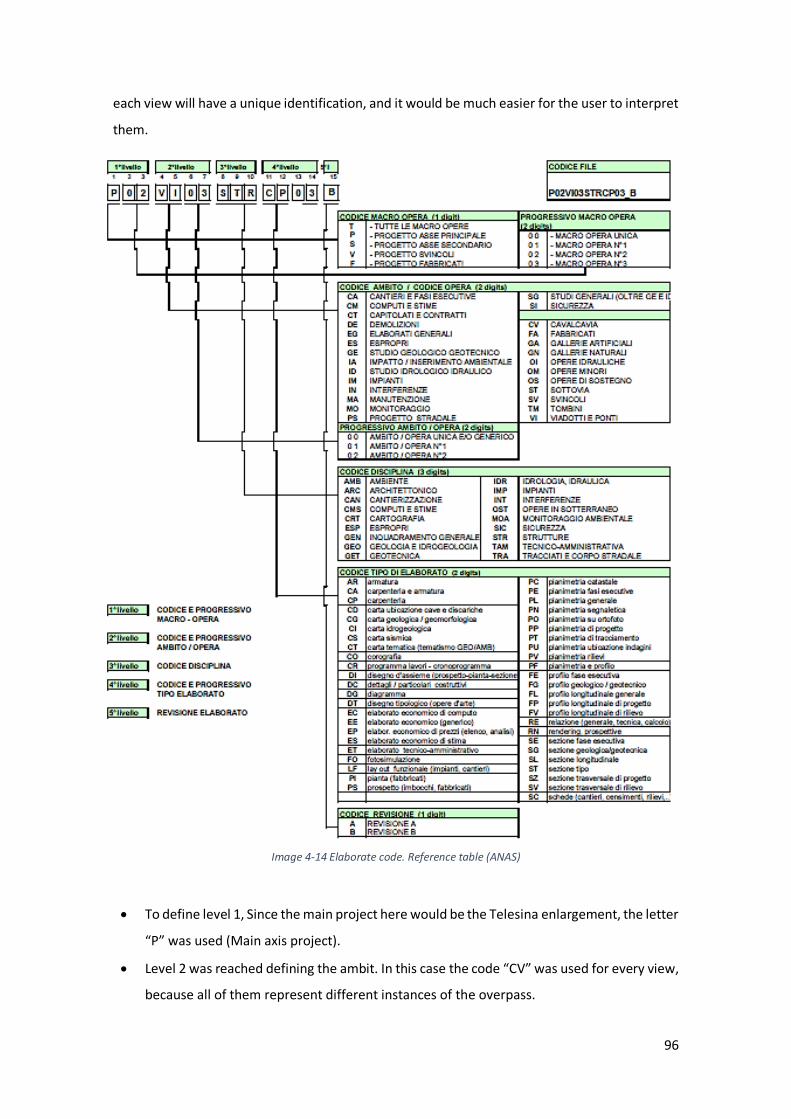
96
each view will have a unique identification, and it would be much easier for the user to interpret
them.
Image 4-14 Elaborate code. Reference table (ANAS)
To define level 1, Since the main project here would be the Telesina enlargement, the letter
“P” was used (Main axis project).
Level 2 was reached defining the ambit. In this case the code “CV” was used for every view,
because all of them represent different instances of the overpass.
97
The number assigned was “16”, since the bridge in question, is the overpass number 16 of
the main project.
To define level 3, Disciplines were assigned.
o “ARC”: which refers to architectonic views.
o “MA” which refers to the views related to the maintenance plan.
o “STR”: which refers to structure views (analytical view in this case).
Finally, level 4 was achieved, defining the view types:
o “PP”: which refers to the project planimetric views.
o “SL”: refers to longitudinal section views.
o “SZ”: refers to transversal section views.
o “EL”: this was defined by me, since there was not an identification to assign to
elevation views created in Revit.
o “RN”: refers to rendering or perspective. In this case, would be the 3D views.
o “CR”: which has to do with the chronogram. This was applied to the views from
the maintenance plan, since they represent the controls schedule.
After this, in order to assign these codes to the views, new project parameters were created.
Image 4-15 Example of assigned codes
The code corresponding to level 1 was include into the one corresponding to level 2, since it
was the same for every view.
Once this was done, it was possible to organize the browser. Next steps were followed:
ViewUser interface Browser organization
Once here, a new item was created, and the interesting views were filtered, since many of
the views created by default in Revit, did not contain relevant information for the Project. After
this, they were ordered, grouping them by Code. In the image below, it is possible to see clearly
how this was done.
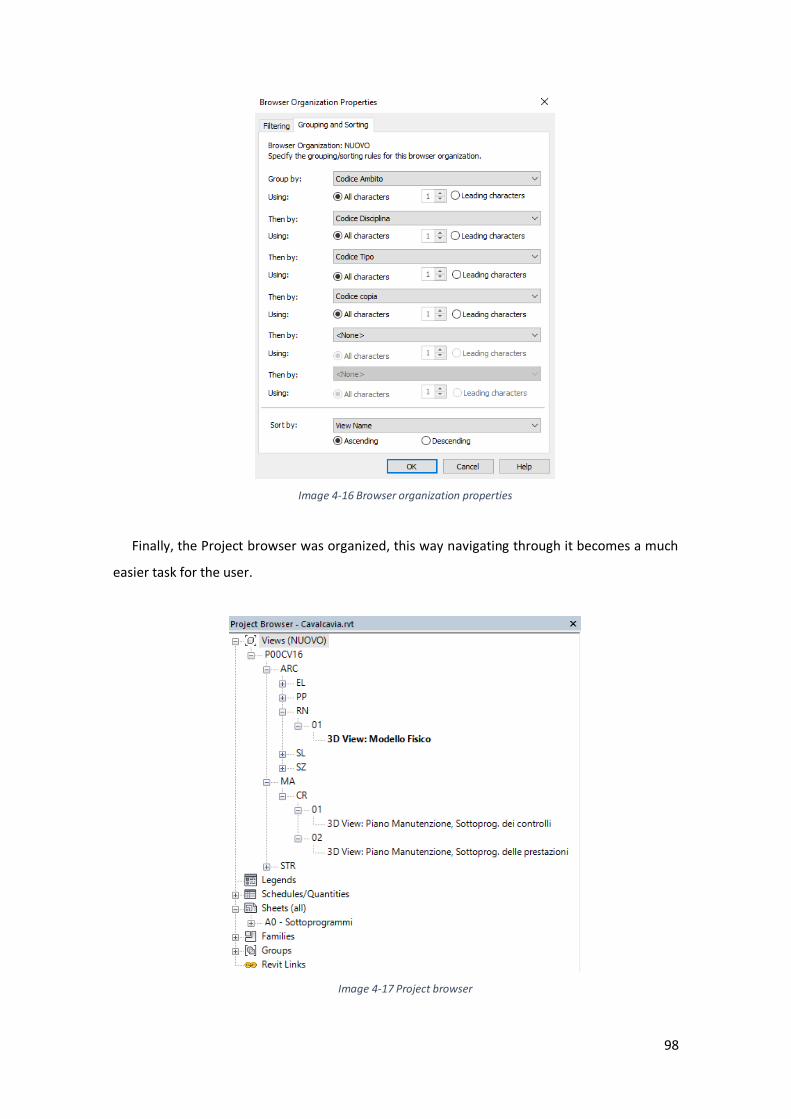
98
Image 4-16 Browser organization properties
Finally, the Project browser was organized, this way navigating through it becomes a much
easier task for the user.
Image 4-17 Project browser

99
Project DB:
Previously, URL parameters were created to link model objects to the maintenance plane. In
this case, it was decided to link the Project database to other software: MS Access, in order to
analyze, if it offered any advantage respect to the first option.
“Microsoft Access is a pseudo-relational database engine from Microsoft. It is part of the
Microsoft Office suite of applications that also includes Word, Outlook and Excel, among others.
Access is also available for purchase as a stand-alone product.” This software uses the Jet
Database Engine for data storage.
“Access is used for both small and large database deployments. This is partly due to its easy-
to-use graphical interface, as well as its interoperability with other applications and platforms
such as Microsoft’s own SQL Server database engine and Visual Basic for Applications (VBA).” [24]
In order to link the Revit database to MS access, it was necessary to first download an
extension, which was provided by Autodesk. This plug-in is called "Revit DB link". Once installed
and executed, a new connection was created for “MS Access 2007”.
After exporting the project data, it was necessary to order all the information contained in
the database, since it was scattered in a large number of tables, and the access to it for the
sought purposes, was quite a difficult task.
I must clarify that I had no previous knowledge about MS Access management, so I had to
research a lot to be able to organize the DB correctly.
First of all, a new table was created, and all the records that interested me in the DB (those
corresponding to maintainable objects, which had a WBS code) were inserted in it through
append querys. Not all the columns of each record were added, but only those which were
considered important for the Maintenance plan development.
Querys, are a tool, that allow the user to manipulate the data within the tables. Append
querys, allow to select records from one or more data sources and copy them to an existing
table.
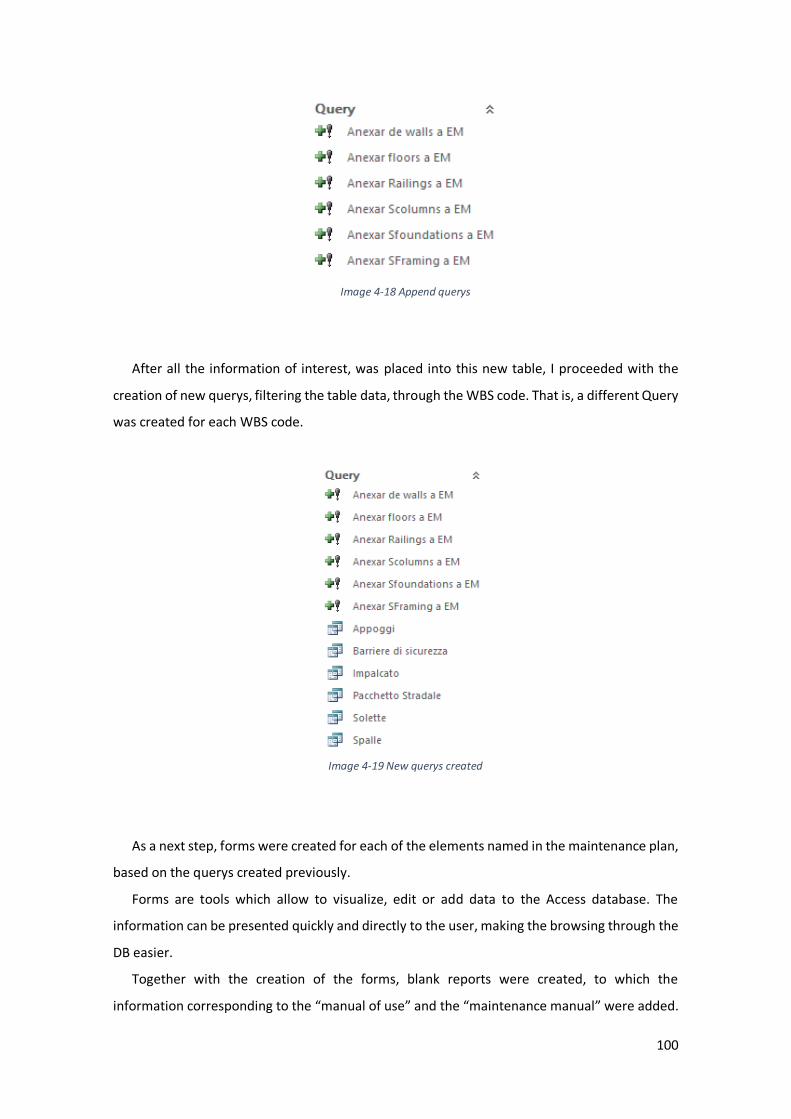
100
Image 4-18 Append querys
After all the information of interest, was placed into this new table, I proceeded with the
creation of new querys, filtering the table data, through the WBS code. That is, a different Query
was created for each WBS code.
Image 4-19 New querys created
As a next step, forms were created for each of the elements named in the maintenance plan,
based on the querys created previously.
Forms are tools which allow to visualize, edit or add data to the Access database. The
information can be presented quickly and directly to the user, making the browsing through the
DB easier.
Together with the creation of the forms, blank reports were created, to which the
information corresponding to the “manual of use” and the “maintenance manual” were added.
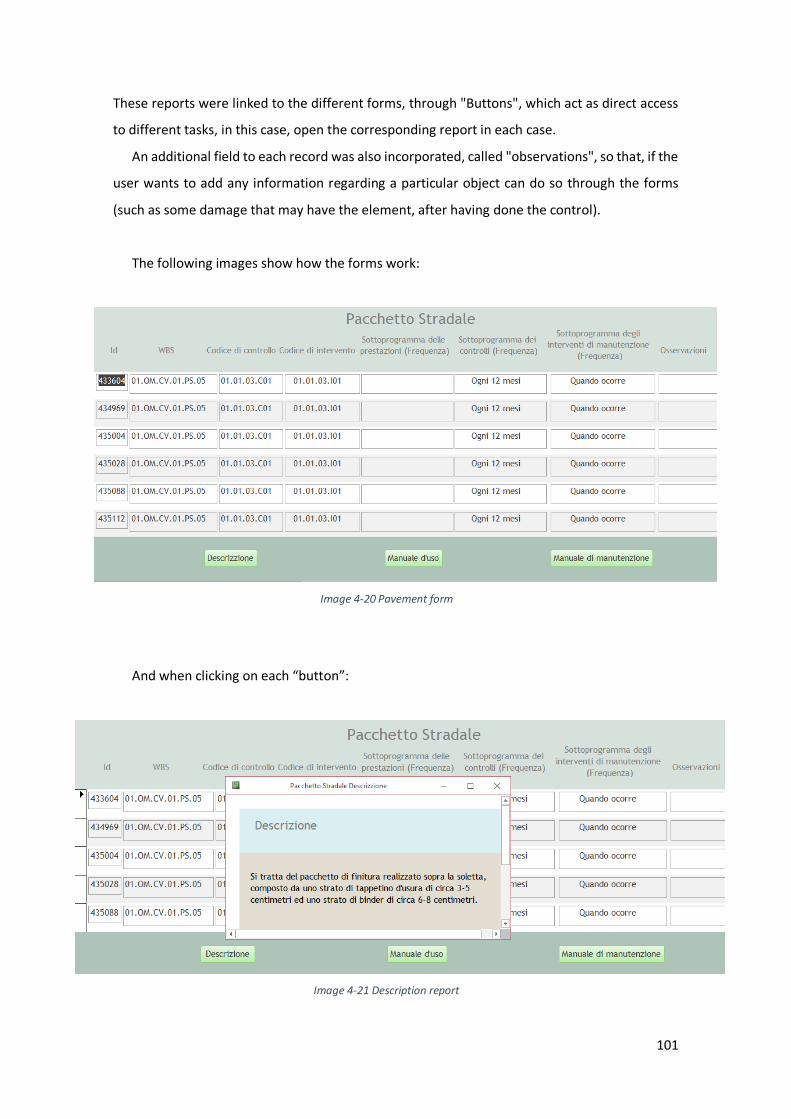
101
These reports were linked to the different forms, through "Buttons", which act as direct access
to different tasks, in this case, open the corresponding report in each case.
An additional field to each record was also incorporated, called "observations", so that, if the
user wants to add any information regarding a particular object can do so through the forms
(such as some damage that may have the element, after having done the control).
The following images show how the forms work:
Image 4-20 Pavement form
And when clicking on each “button”:
Image 4-21 Description report
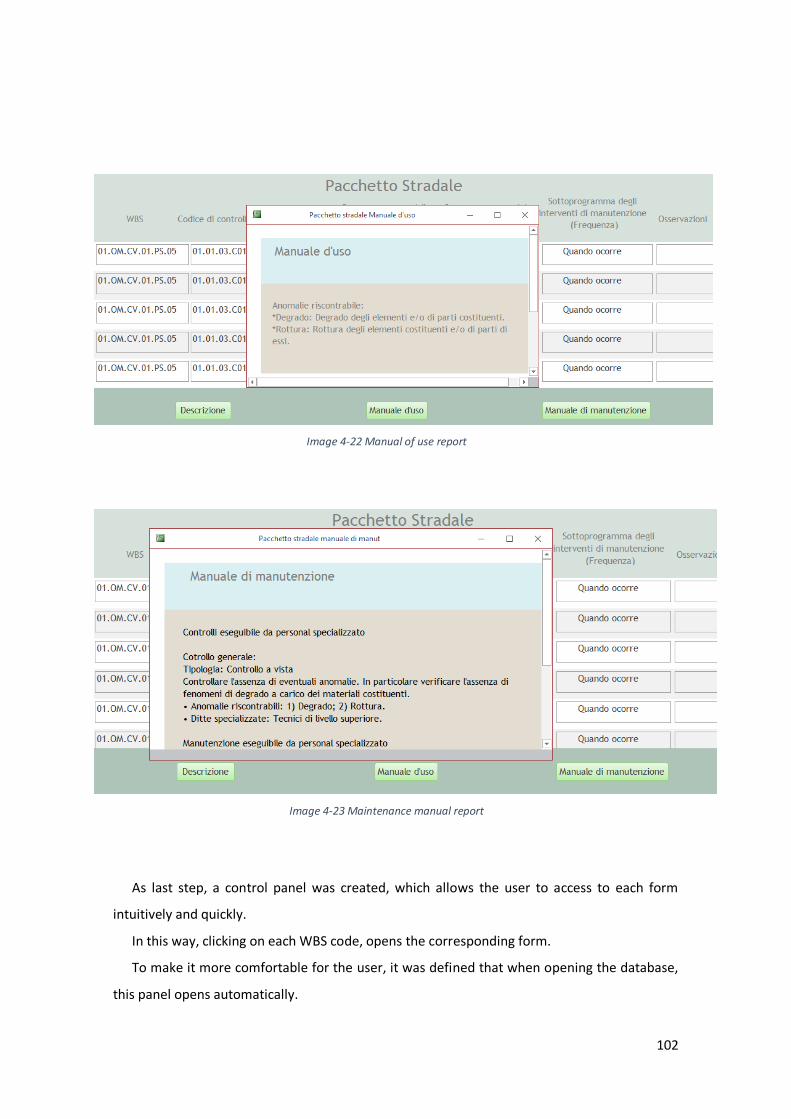
102
Image 4-22 Manual of use report
Image 4-23 Maintenance manual report
As last step, a control panel was created, which allows the user to access to each form
intuitively and quickly.
In this way, clicking on each WBS code, opens the corresponding form.
To make it more comfortable for the user, it was defined that when opening the database,
this panel opens automatically.
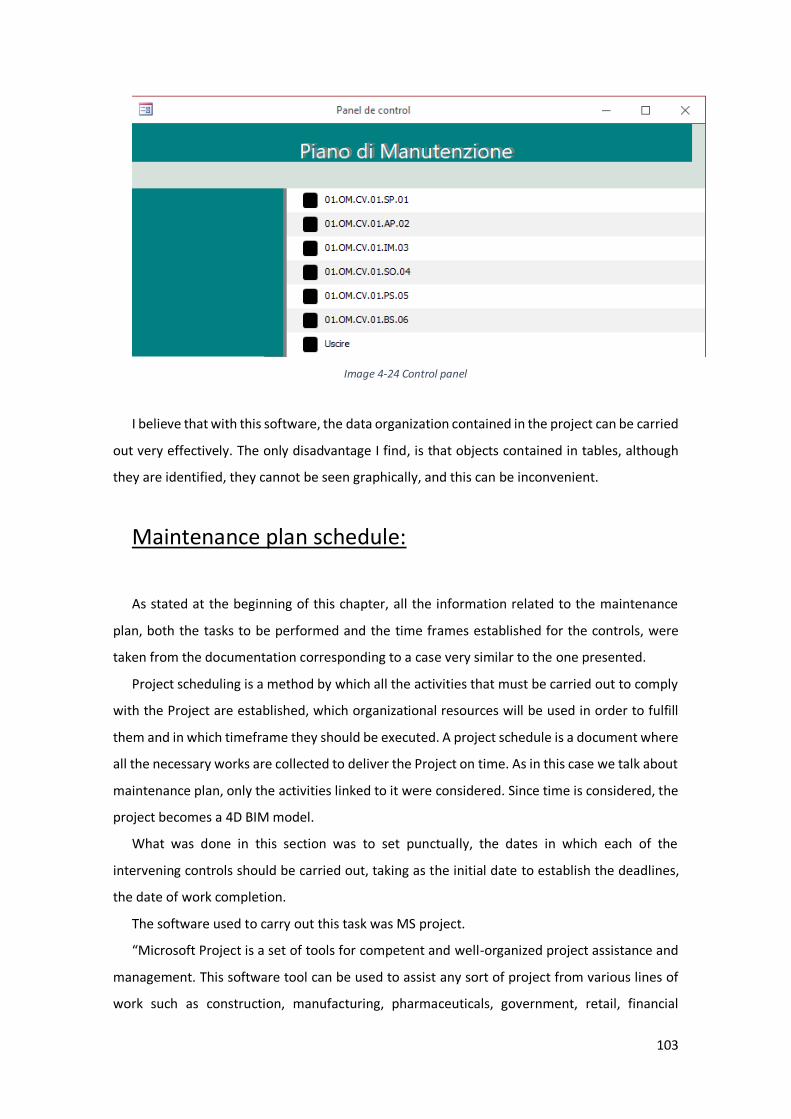
103
Image 4-24 Control panel
I believe that with this software, the data organization contained in the project can be carried
out very effectively. The only disadvantage I find, is that objects contained in tables, although
they are identified, they cannot be seen graphically, and this can be inconvenient.
Maintenance plan schedule:
As stated at the beginning of this chapter, all the information related to the maintenance
plan, both the tasks to be performed and the time frames established for the controls, were
taken from the documentation corresponding to a case very similar to the one presented.
Project scheduling is a method by which all the activities that must be carried out to comply
with the Project are established, which organizational resources will be used in order to fulfill
them and in which timeframe they should be executed. A project schedule is a document where
all the necessary works are collected to deliver the Project on time. As in this case we talk about
maintenance plan, only the activities linked to it were considered. Since time is considered, the
project becomes a 4D BIM model.
What was done in this section was to set punctually, the dates in which each of the
intervening controls should be carried out, taking as the initial date to establish the deadlines,
the date of work completion.
The software used to carry out this task was MS project.
“Microsoft Project is a set of tools for competent and well-organized project assistance and
management. This software tool can be used to assist any sort of project from various lines of
work such as construction, manufacturing, pharmaceuticals, government, retail, financial
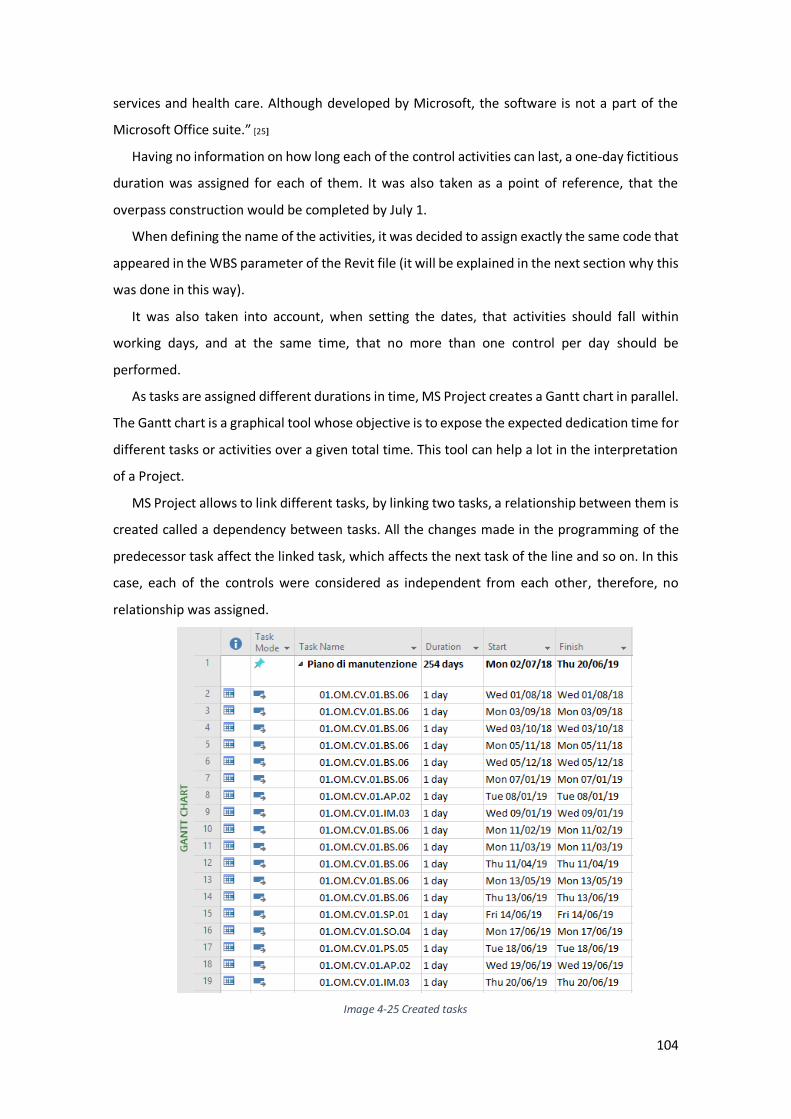
104
services and health care. Although developed by Microsoft, the software is not a part of the
Microsoft Office suite.” [25]
Having no information on how long each of the control activities can last, a one-day fictitious
duration was assigned for each of them. It was also taken as a point of reference, that the
overpass construction would be completed by July 1.
When defining the name of the activities, it was decided to assign exactly the same code that
appeared in the WBS parameter of the Revit file (it will be explained in the next section why this
was done in this way).
It was also taken into account, when setting the dates, that activities should fall within
working days, and at the same time, that no more than one control per day should be
performed.
As tasks are assigned different durations in time, MS Project creates a Gantt chart in parallel.
The Gantt chart is a graphical tool whose objective is to expose the expected dedication time for
different tasks or activities over a given total time. This tool can help a lot in the interpretation
of a Project.
MS Project allows to link different tasks, by linking two tasks, a relationship between them is
created called a dependency between tasks. All the changes made in the programming of the
predecessor task affect the linked task, which affects the next task of the line and so on. In this
case, each of the controls were considered as independent from each other, therefore, no
relationship was assigned.
Image 4-25 Created tasks
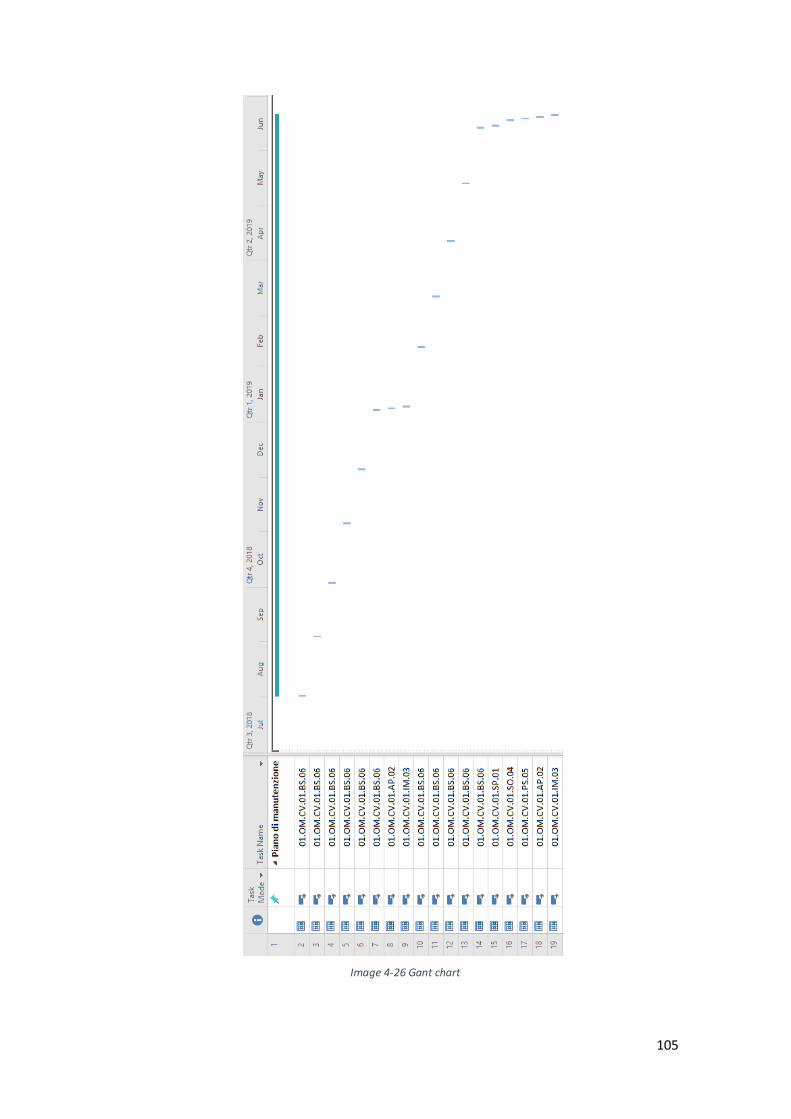
105
Image 4-26 Gant chart
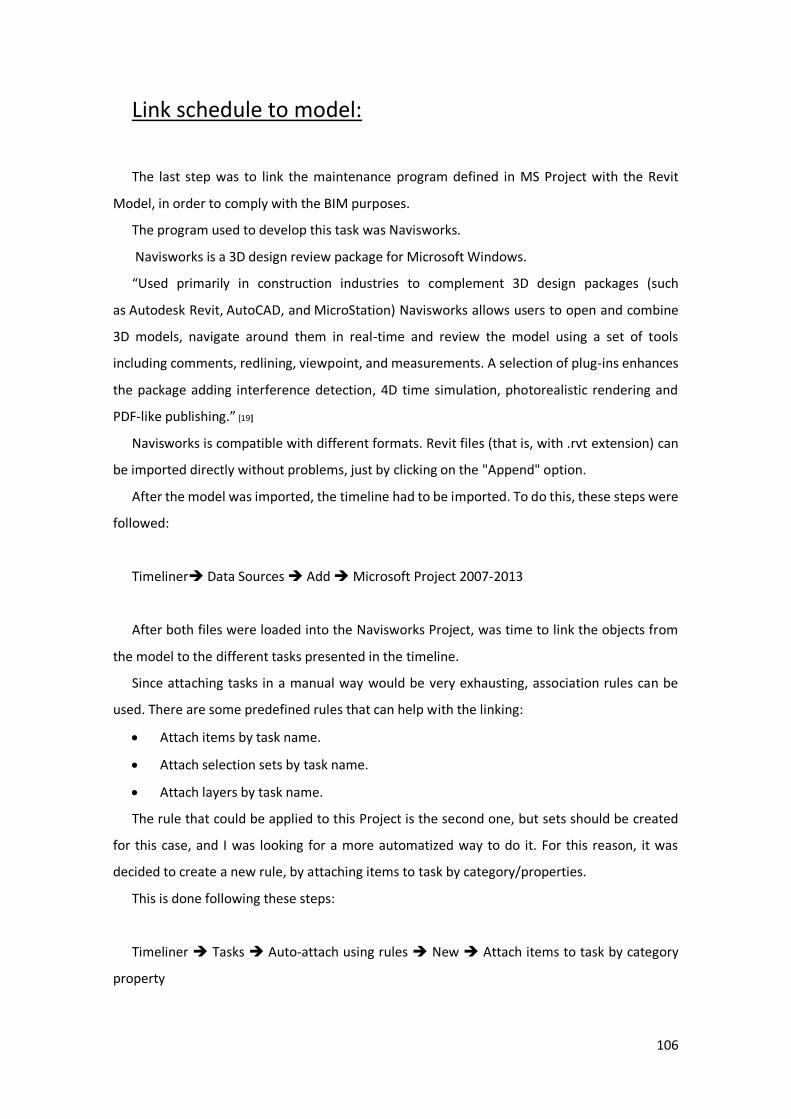
106
Link schedule to model:
The last step was to link the maintenance program defined in MS Project with the Revit
Model, in order to comply with the BIM purposes.
The program used to develop this task was Navisworks.
Navisworks is a 3D design review package for Microsoft Windows.
“Used primarily in construction industries to complement 3D design packages (such
as Autodesk Revit, AutoCAD, and MicroStation) Navisworks allows users to open and combine
3D models, navigate around them in real-time and review the model using a set of tools
including comments, redlining, viewpoint, and measurements. A selection of plug-ins enhances
the package adding interference detection, 4D time simulation, photorealistic rendering and
PDF-like publishing.” [19]
Navisworks is compatible with different formats. Revit files (that is, with .rvt extension) can
be imported directly without problems, just by clicking on the "Append" option.
After the model was imported, the timeline had to be imported. To do this, these steps were
followed:
Timeliner Data Sources Add Microsoft Project 2007-2013
After both files were loaded into the Navisworks Project, was time to link the objects from
the model to the different tasks presented in the timeline.
Since attaching tasks in a manual way would be very exhausting, association rules can be
used. There are some predefined rules that can help with the linking:
Attach items by task name.
Attach selection sets by task name.
Attach layers by task name.
The rule that could be applied to this Project is the second one, but sets should be created
for this case, and I was looking for a more automatized way to do it. For this reason, it was
decided to create a new rule, by attaching items to task by category/properties.
This is done following these steps:
Timeliner Tasks Auto-attach using rules New Attach items to task by category
property
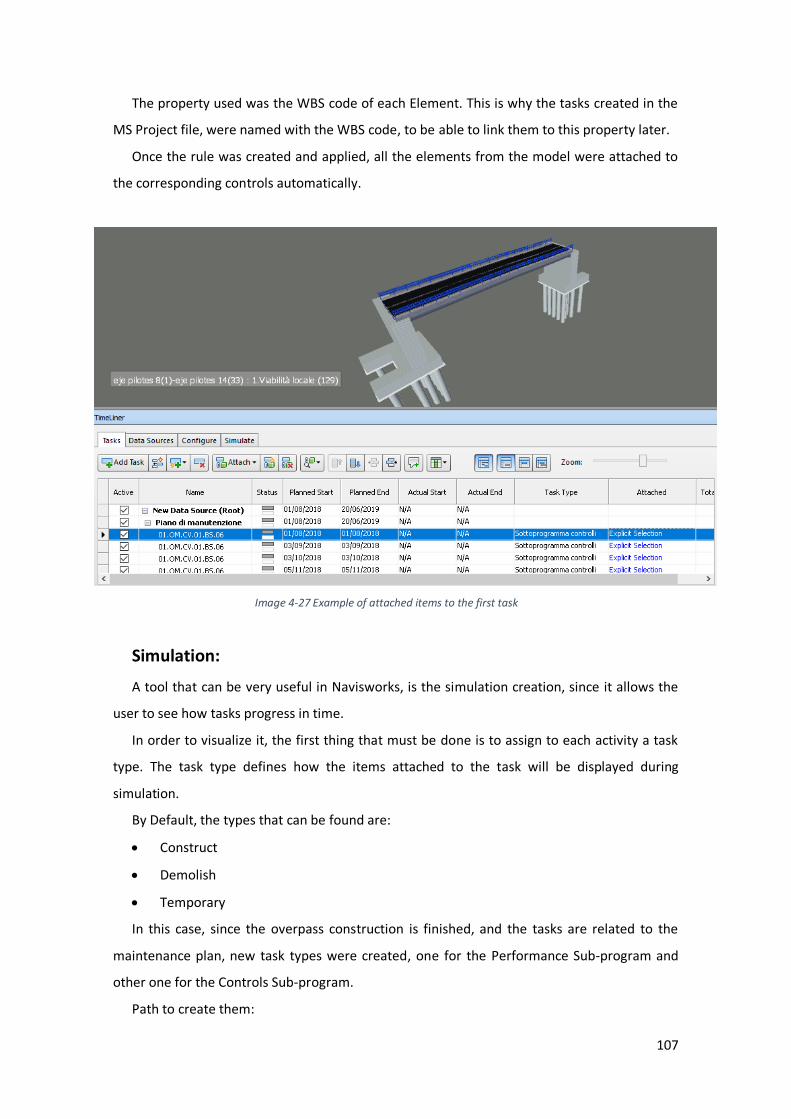
107
The property used was the WBS code of each Element. This is why the tasks created in the
MS Project file, were named with the WBS code, to be able to link them to this property later.
Once the rule was created and applied, all the elements from the model were attached to
the corresponding controls automatically.
Image 4-27 Example of attached items to the first task
Simulation:
A tool that can be very useful in Navisworks, is the simulation creation, since it allows the
user to see how tasks progress in time.
In order to visualize it, the first thing that must be done is to assign to each activity a task
type. The task type defines how the items attached to the task will be displayed during
simulation.
By Default, the types that can be found are:
Construct
Demolish
Temporary
In this case, since the overpass construction is finished, and the tasks are related to the
maintenance plan, new task types were created, one for the Performance Sub-program and
other one for the Controls Sub-program.
Path to create them:
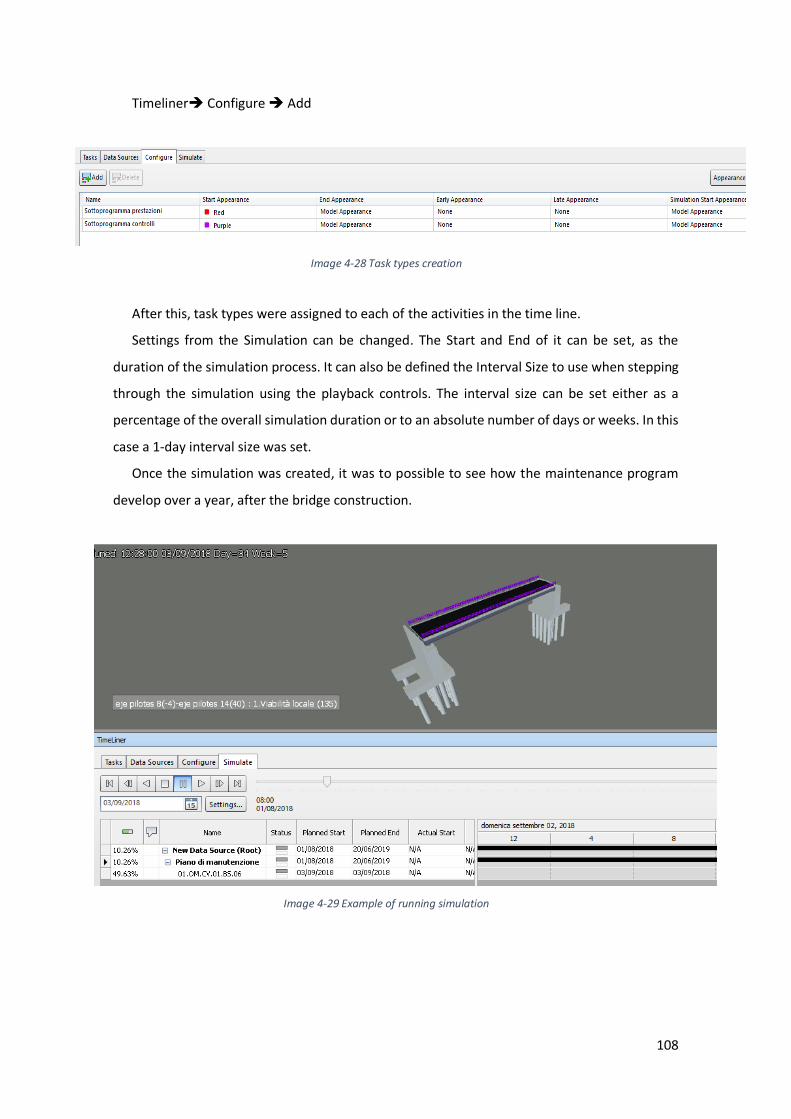
108
Timeliner Configure Add
Image 4-28 Task types creation
After this, task types were assigned to each of the activities in the time line.
Settings from the Simulation can be changed. The Start and End of it can be set, as the
duration of the simulation process. It can also be defined the Interval Size to use when stepping
through the simulation using the playback controls. The interval size can be set either as a
percentage of the overall simulation duration or to an absolute number of days or weeks. In this
case a 1-day interval size was set.
Once the simulation was created, it was to possible to see how the maintenance program
develop over a year, after the bridge construction.
Image 4-29 Example of running simulation
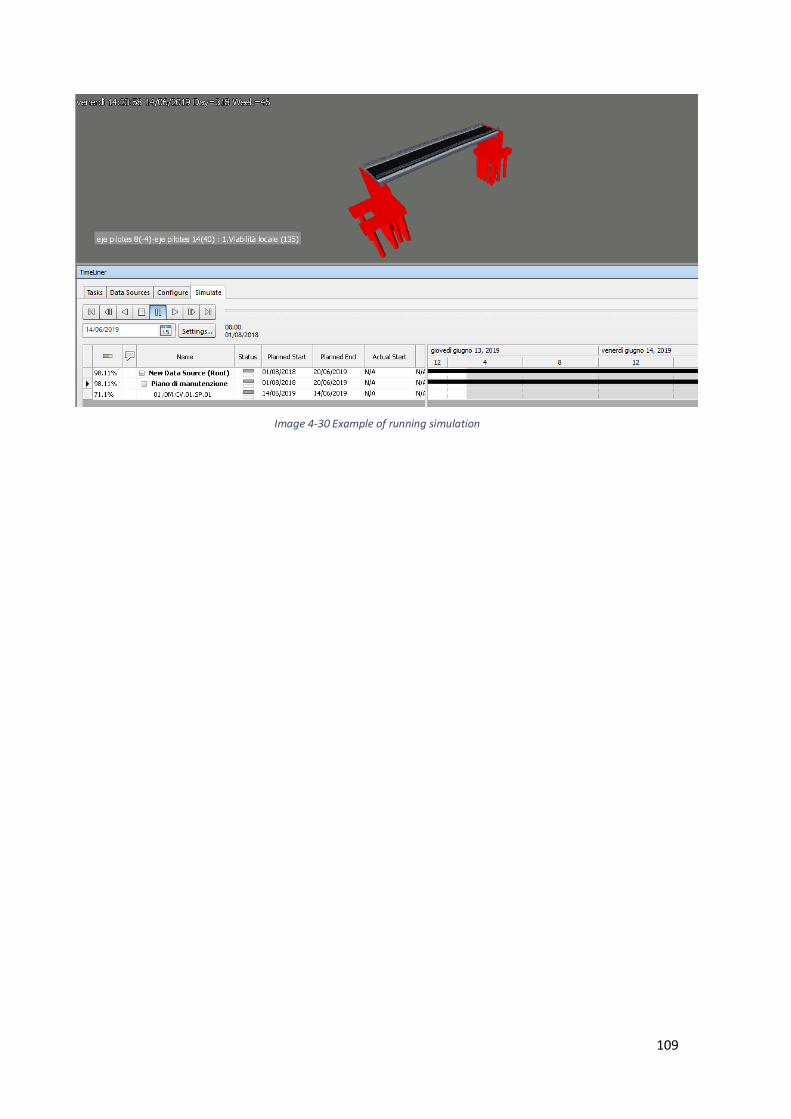
109
Image 4-30 Example of running simulation

110
Report:
In general, the connection of the Project with the maintenance plan, considering the different
options analyzed and software used, was good.
It should be clarified, as in the previous chapters, that I had no knowledge about how to
handle these software, but the tasks for which they were used, were applied without major
difficulties.
Regarding the parameters used in Revit, as mentioned before, I found them to be a tool with
great potential, which allows to add properties to modeled objects in an easy and direct way,
being also very useful when exporting the model. The fact of being able to create parameters
that can be used in different families and projects, such as shared parameters, is also a great
advantage.
Turning to the URL parameters, I think they can be of great help, but as long as the link is
made to a web site, or a container folder shared by all those who participate in the Project. Since
the link is lost when passing from one computer to another with a different folder structure, it
becomes useless.
The creation of schedules within Revit, allows to organize the information of the model as
the user sees convenient, however, it is quite restrictive in several aspects, for example, not all
categories of families can be introduced in the same schedule. On the other hand, it is not
possible to include families belonging to different phases of the Project.
Dividing the project in phases may be useful to evidence a project sequence, however in this
case was not a useful tool, and since it does not allow the addition of time frames to them, it
lose a lot of potential.
Regarding the software used to organize the database, MS Access, I consider that it can be a
very useful instrument, which provides an interactive and friendly way to the user for browsing,
being able to handle the information of interest very efficiently. In addition to organizing the
data of the model, it allows to make insertions and changes to it, being able to then import them
into the Revit file again. The only weakness that I noticed, is that by not being able to handle
graphical information, each element must be very well identified in order to avoid confusion.
It must be highlighted the perfect interoperability between the two software.
The schedule was also created without any kind of problems, MS Project turned out to be
intuitive and easy to use. Being able to observe the activities in the Gantt chart, and apply
relationships between them, gives great value to the software.
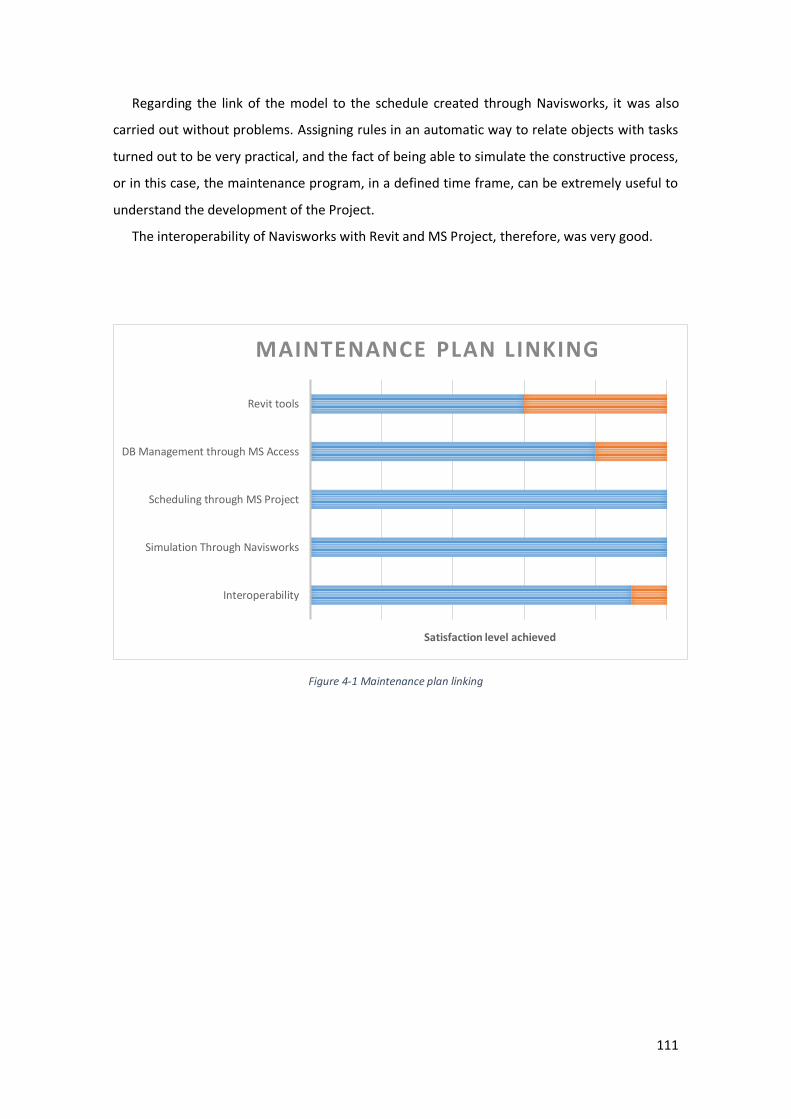
111
Regarding the link of the model to the schedule created through Navisworks, it was also
carried out without problems. Assigning rules in an automatic way to relate objects with tasks
turned out to be very practical, and the fact of being able to simulate the constructive process,
or in this case, the maintenance program, in a defined time frame, can be extremely useful to
understand the development of the Project.
The interoperability of Navisworks with Revit and MS Project, therefore, was very good.
Figure 4-1 Maintenance plan linking
Interoperability
Simulation Through Navisworks
Scheduling through MS Project
DB Management through MS Access
Revit tools
Satisfaction level achieved
MAINTENANCE PLAN LINKING
112
SECTION 5 : CONCLUSION
113
To summarize, I believe that the objectives set at the beginning of the work were achieved.
Some were more challenging than others, but in broad terms, the proposed goals were
achieved, and a good result was obtained. It was possible to demonstrate the utility of BIM technology, not only for the design phase
development, but also to give a follow-up to the constructive process, and once the works are
completed, as was the analyzed case, to follow the maintenance plan activities and schedules.
From the modeling point of view, this brings with it great benefits. First of all, it can save a
lot of time, compared to the one it can consume a modeling in the two dimensions traditional
way. In addition, a much clearer interpretation of the Project is achieved. Many times, when
working in two dimensions, it becomes difficult to understand some aspects of the drawings, as
it happened to me in this Project when representing the elements from the AutoCAD files, and
it is necessary to invest much more time in the creation of several views or section so that the
information can be communicated correctly to the user.
Another aspect to stand out respect to the 3D modeling, is that many mistakes can be
avoided, having shaped all the objects that take place in the work, interferences and crashes can
be detected. This brings with it money saving, since it prevents of incurring in mistakes during
the constructive phase, which could generate expenses.
Anyway, it must be said that respect to the used software for the modeling, several
drawbacks were presented. CivilCAD, being a software especially dedicated to the design of civil
works, had a very good performance for the land and corridors modeling. On the other hand,
Revit, used for the overpass, did not achieve my expectations. Being a software mainly oriented
to building projects, it presented many difficulties, and a long time had to be used to obtain a
good representation. In my opinion, it must improve a lot in terms of its applications to be used
effectively in the infrastructure field. Nowadays, some BIM design software, with special
applications to bridges, are being developed. This would help a lot to solve the mentioned
problems.
The other part, of utmost importance that makes BIM, more than just a 3D modeling tool, is
the association of the model with information, and the exchange of it between different parts.
In this particular case, the information linked to the model was related to the maintenance
plan. The additional software used for this task behaved satisfactorily.
On one hand, the use of parameters within Revit and of a software such as MS Access, allow
not only to organize the information that may be of interest for each case, but also to add and
make changes to it. This allows the user to interact with the model and generates a more
dynamic workflow.
114
On the other hand, the fact of being able to link “time” to the model is very useful, since it is
one of the main variables when developing a Project. MS Project allows the user to add activities
duration, setting the start and end of each of them. In this case, as previously mentioned, a one-
day fictitious duration was used for all the controls, but if the constructive process had to be
framed in time, this tool is crucial. It also allows to compare the planned times with the real
times, so its use is not only limited to the project.
Finally, linking the model with the schedule, through Navisworks in this case, makes the
Project to take a fourth dimension. By integrating the two things, it becomes much more useful
for the user, and the fact of being able to simulate the process to follow, makes the
interpretation unequivocal and errors free.
115
References:
[1] “Building Information Modelling – Belgian Guide for the construction Industry” by ADEB-
VBA, Edition 2015
[2] “The importance of BIM in construction management”, amHigley, Feb 14, 2014
[3] “Importance of building information modeling”, outsource2india
(https://www.outsource2india.com/eso/construction/articles/building-information-modeling-
importance.asp)
[4] “Episode 10: effects of BIM on project lifecycle phases”, BIM think space, November 24,
2008
[5] “The Official Guide to the SSCP Book “, by Gordon and Hernandez. SYBEX.
[6] “What Interoperability really means in a BIM context?”, by Johan Xia, BIM Model, Sept 5,
2016
[7] Image taken from: Modelli BIM Cos'è il BIM, by Edoardo Accettulli, Syncronia, 12/08/2016
[8] “BIM dimensions - 3D, 4D, 5D, 6D BIM explained”, by Richard McPartland, editor of the
NBS.com2015-2018, NBS
[9] Image taken from http://data.bim6d.es/bim-dimensions
[10] “BIM maturity levels explained” by Nick Erasmus, LinkedIN, february 17, 2017
[11] “LOD, lod or loi in BIM? This is how you deal with them”, 18 january 2018, MEP content,
the BIM library for MEP engineers
[12] “Are BIM’s models constructible?” (Frequently asked question), BIM Designs
(https://www.bimdesigns.net/about-bim-designs)
[13] Image taken from "Construction Design Phases vs BIM Levels of Development – Part 2 of
4" by Kelar Pacific, october 2017
[14] Image taken from "BIM in the World" http://www.a-sapiens.it/autodesk/corsi-
autodesk/corso-revit-master/
[15] “BIM for infrastructure”, Graitec,
(http://www.graitec.co.uk/~a00000ff/index.php?option=com_content&view=article&id=613&
Itemid=463)
[16] “How your processes and approach to projects change as you adopt BIM”, Autodesk
(https://www.autodesk.com/solutions/bim/hub/bim-for-infrastructure-implementation-guide)
[17] Images and information taken from “Top Business value of BIM for infrastructure 2017”,
by Dodge Data & analytics, Smart Market Report, 2017
116
[18] “what is civil 3D? How is civil 3D used?”, EDULEARN
(https://www.edulearn.com/article/what_is_civil_3d.html)
[19] Autodesk knowledge Network (for definitions related to Autodesk tools and software)
[20] “Braced frame structures”, Design Buildings Wiki,
(https://www.designingbuildings.co.uk/wiki/Braced_frame_structures)
[21] Brotherton, S. A., Fried, R. T., & Norman, E. S. (2008). Applying the work breakdown
structure to the project management lifecycle. Paper presented at PMI® Global Congress 2008—
North America, Denver, CO. Newtown Square, PA: Project Management Institute.
[22] “BIM tutorials: URLs in Revit”, GSA (https://www.gsa.gov/real-estate/design-
construction/3d4d-building-information-modeling/bim-guidelines-for-revit/tutorials/bim-
tutorials-urls-in-revit)
[23] “El parametro URL: informacion externa en Revit”, Apogea Virtual Building,
(http://www.apogeavirtualbuilding.com/parametro-url/)
[24] https://www.techopedia.com/definition/1218/microsoft-access
[25] https://www.techopedia.com/definition/16585/microsoft-project
[26] “CSiBridge overview”, CSi computers and structures
(https://www.csiamerica.com/products/csibridge)