politecnico di torino - webthesis
TRANSCRIPT

POLITECNICO DI TORINO
Corso di Laurea Magistrale in Ingegneria Biomedica
Tesi di Laurea Magistrale
SURFACE MODIFICATION OF TITANIUM FOR IMPROVEMENT OF SOFT TISSUE ADHESION AND
REDUCTION OF BACTERIAL CONTAMINATION
Relatrici Prof.ssa Silvia Maria Spriano Ing. Sara Ferraris
Candidata
Alice Sartori
Aprile 2018


TABLE OF CONTENTS
Introduction
CHAPTER I
KERATIN
1. Structure and Composition 2
1.1. Physical Properties 5
1.2. Swelling and Contraction 5
2. Keratin Extraction 6
3. Interaction between Bacteria and Keratin 7
3.1. General Features of oral bacteria 7
3.2. Keratin and bacteria 8
4. Interaction between Fibroblast and Keratin 13
4.1. General Features of fibroblast 13
4.2. Keratin and Fibroblasts 14
5. Interaction between Silver and Keratin 18
5.1. Antibacterial properties of silver 18
5.2. Keratin and antibacterial silver 21
CHAPTER II
STRATEGIES TO REDUCE BACTERIAL ADHESION OVER DENTAL
IMPLANTS
1. Oral Cavity 25
1.1. Structure and shape of the teeth 26
1.2. Periodotum 27
1.3. Periodontal Diseases 29
2. Dental Implants 31
2.1. General features of dental implants 31
2.2. Parts of a dental implant 33

2.3. Materials of a Dental Implant 36
2.4. Issues with perimplant soft tissue 38
2.5. Bacterial loading issue 41
3. Platform Switching 45
4. Morse Taper connection 48
5. Surface modification for abutment to reduce bacterial loading 52
CHAPTER III
TOPOGRAPHIC MODIFICATION TECHNIQUES AT THE MICRO AND
NANO SCALES
1. General Features 57
2. Topographic techniques on dental implants 58
2.1. Laser Welding 60
2.2. Electron Beam Welding 66
2.3. Laser Welding vs Electron Beam Welding 69
3. Topographic effect on bacteria 74
4. Topographic effect on fibroblasts 85
CHAPTER IV
MATERIALS AND METHODS
1. Cutting, Marking and Polishing of Samples 95
2. Samples Washing 97
3. Surface Treatment of EBW samples 98
4. Surface Activation with Plasma O2 99
5. UV activation 100
6. Electrospinning Technique 102
6.1. Spinning flaws 104
6.2. Critical Process factors 104
7. Thermal Treatment and Sterilization 109

8. Antibacterial Treatment with Silver 111
9. Surface Characterization 112
9.1. FESEM-EDS 112
9.2. XPS 116
9.3. Tape Test 118
9.4. FT-IR 121
9.5. Wettability 123
9.6. ζ Potential 125
10. Biological Test 129
10.1. Bacterial adhesion test 129
10.2. Cell test 131
CHAPTER V
RESULTS AND DISCUSSIONS
1. Adhesion Study 133
1.1. Tape test 133
1.2. FT-IR 135
1.3. XPS 137
2. Antibacterial Treatment Study 150
2.1. FESEM 150
2.2. EDS 154
2.3. FT-IR 158
2.4. XPS 160
2.5. Biological Test 173
2.5.1. Bacterial test 173
2.5.1.1. FESEM 176
2.5.2. Cell test 177
2.5.1.1. FESEM 180
3. EBW samples Study 183
3.1. Wettability 183
3.2. ζ Potential 186

3.3. Biological Test 188
3.3.1. Bacterial test 188
3.3.2. Cell test 189
Conclusions 193
Bibliography 195

INTRODUCTION
In orthodontics, to ensure the goodness and success of the prosthesis implant, it is
necessary to achieve primary and secondary stability. Within the scope of the research,
progress has been made with regard to the threaded portion of the prosthesis, which is in
contact with bone tissue, while the possibility to obtain soft tissue adhesion without
increasing bacterial adhesion is still an unmet need. The geometry, shape and topography
of a dental implant affect its interaction with biological tissues, in particular for the collar
and abutment regions, they should be designed with the main purpose of promoting the
adhesion of gingival fibroblasts (HGFs), soft tissue cells of the oral cavity and minimizing
bacterial adhesion. The purpose of this dissertation is to study the effect of surface
modification on commercially pure titanium (grade 2) in the context of soft tissue
interaction and reduction of bacterial contamination. The rationale of the work is to
modify titanium surfaces from the topographical, chemical and biological point of view.
As far as topography is concerned oriented nanogrooves have been produced in order to
guide fibroblast alignment without increasing bacterial adhesion. Grooves have been
produced by means of the Electron Beam structuring technique at the University of Graz.
As far as the biological modification is concerned keratin nanofibers were deposited on
titanium substrates by the Electrospinning technique at Consiglio Nazionale delle
Ricerche (CNR-ISMAC) of Biella. The choice of keratin is due to its ability to increase
adhesion, proliferation and cell differentiation. Afterwards, keratin coated samples were
enriched with silver, known for its antibacterial properties. All samples thus processed
have undergone superficial characterizations, e.g., roughness, FESEM, XPS and zeta
potential. The biological response to modified surfaces was evaluated by means of

Introduction
bacterial tests and cellular assays using the S. aureus strain and HGFs cells respectively
at Eastern Piedmont University (Novara). From the analysis of the experimental data
obtained, it can be concluded that Electron Beam obtained nanogrooves can promote cell
orientation, while at the same time reducing bacterial adhesion on the surface. In addition,
silver-enriched keratin nanofibres coatings exhibit antibacterial behaviour, and result a
suitable substrate for cell adhesion and proliferation (no cytotoxicity effects). Considering
the here summarized results the modified surfaces investigated in the present thesis
appears as promising for the development of innovative dental implants (collar region).

1
CHAPTER I
KERATIN
The term “keratin” (Greek kératos, meaning horn) generally refers to insoluble proteins
that contain the sulfur-rich cystine amino acid. In nature, it’s possible to find different
keratonic biomaterials with specific important roles, i.e., displaying of dominant behavior
entangling animal horns and claws; facilitating mobility in the use of quills and hooves,
guarding against environment by hair, wool, and feathers. Besides, natural patterns and
colors of some keratins are expressive for survival behavior of animals e.g. for gender
identification. Human keratins are found in hair and nails as well as in the epidermal
layers of the skin and in general are found in the epidermal tissues of vertebrates. Some
keratin materials occurred relevant value through technological developments and
scientific understanding, engineering advances were paralleled by developments in the
chemical and dye industries. This improvement, together with the development of
synthetic fibers, has provided the great range of applications of keratin fibers that stays at
the present time. Among the recent applications of sheep wool, we find: woolen fabrics
for sportswear, ultrafine drawn and set wool-fibers, insect-resistant and moth-proofed
wool batts, surface-treated wool fibers attached to the surface of polyester, reusable
medical sheep skins to reduce pressure ulcers, which can be sterilized by laundering at
high temperature. Moreover, the improved performance of the mechanical properties of
keratin materials have been made practicable by a better understanding of their physical
and chemical properties (1).

Keratin
2
1 STRUCTURE AND COMPOSITION Keratin is part of the family of fibrous, structural proteins, and its materials present many
similarities among their primary, secondary and tertiary protein structures. The molecular
weight of this protein in mammal changes in ranges from 40 to 70 kDa (2). A single
keratin protein polymer chain is made of a polypeptide backbone that have side chains
which include the salt-forming aspartic and glutamic acid residues, the lysine and arginine
residues as well as the sulfur-rich cysteine that crosslinks the peptide chains (figure 1)
and contributes to the physical and chemical stability of the keratins.
Figure 1. Schematic diagram of different components of keratin; (A) polypeptide single unit, (B) amino acid
sequence, (C) α-helix, and (D) β-Sheets conformations of keratin protein (F1)
These side chains are also involved in the reactivity of the keratins when they are modified
physically or chemically for commercial aims. The distribution of the amino acids
changes from component to component of a given keratin (3). There are many types of
keratins, one kind of differentiation is based on the isoelectric point, e.g., the distinction
between type I (acidic or subfamily A) keratins and type II (basic or subfamily B)
keratins. In humans, type I keratins have a pI of 4.9–5.4, while type II keratins have a pI
of 6.5–8.5 (4). In bovines, type I keratins have a pI < 5.6 and type II keratins have a pI >
6.0.

Keratin
3
Keratins that are specific to hair, nail or wool have a pI of 4.7–5.4 (5). In spite of the
differences in the isoelectric point, 30% of the amino acid types and sequences are the
same in the acidic and basic types of keratins and in other intermediate filaments (6), (7).
Generally, keratins may be classified into α-, β- or amorphous by their x-ray diffraction
patterns, reflecting the nature of the ordered, or not, molecular arrangements. The α-
pattern is characteristic of mammalian keratin structures and refers to the α-helical
conformation of the keratin protein, which chain gives many of the physical and
mechanical properties of the biopolymer keratin, while the β-pattern is obtained from the
avian keratins and the stretched form of mammalian keratins. A right handed α-helix is
stabilized by hydrogen bonding, which occurs between the amide hydrogen and the
carbonyl oxygen of the peptide groups, which are separated by three amino acid residues.
The x-ray pattern of a keratin fiber includes reflections, which have been interpreted to
represent larger molecular assemblies than the α-helix, e.g., a coiled coil rope consisting
of α-helices. Other important structural parts of the fiber structure include the
intermediate filament, which consists of several coiled coils embedded in an amorphous
matrix. The intermediate filaments are similar in diameter in many keratins, while their
packing changes from one type of keratin to another. The morphological and structural
features of a keratin fiber as illustrated by a Merino wool fiber are: α-helix (1 nm), coiled
coil rope (2nm), intermediate filament, like microfibril (7 nm), macrofibril (l00 nm),
cortical cell (200 nm), cortex (20 pm), and cuticle (~ 1 pm thick)1.
1 Note: The numbers in parentheses indicate the approximate cross-sectional diameter or
membrane thickness.

Keratin
4
Figure 2. Section of a wool keratin fiber (F2)
The outer sheath of a fiber is the cuticle, which consists of fine overlapping scales that
are smoother in the direction of fiber growth. The scale structure consists of a thin outer
epicuticle followed by the exocuticle and the endocuticle layers, the principal difference
between these is the relative cystine amino acid content ranging from 35% in the
exocuticle to ~ 3% in the endocuticle. The cell membrane complex is a complicated
system consisting of several thin layers embedded into an intercellular cement; one of the
most important ones, the P-layer, contains lipids, about 50% 18-methyl eicosanoic acid.
The bulk of the fiber is contained in the cortex, which consists of tightly packed cortical
cells that present the same orientation of the fiber axis. Fine fibers have two bilaterally
distributed populations, para- and ortho-cortices: The para-cortex is richer in sulfur than
the orthocortex. Cortical cells contain intermediate filaments embedded in a cystine-rich
cortical matrix and packed into macrofibrils. Besides the para and ortho cortex cells, there
is another called the meso cortical cell, in which the intermediate filaments are packed
even more regularly than in the para-type cells. The third component of a keratin fiber is
the medulla, generally represented by empty space running more or less continuously
down the center of a fiber but is practically absent in fine fibers. Another common
component of a keratin fiber is melanin, which is the coloring matter of fibers and are
ovoid or rod-shaped. While the composition and structure of a helical rope present
similarities, the globular terminal domains differ from one keratin to another and only a
few cystine cross-links are thought to bridge the two protein chains in the helical rod.

Keratin
5
Pairs of coiled coil ropes interact to form groups of four α-helices and seven or more of
these groups arrange themselves on the periphery of the microfibril. Although wool and
other mammalian fibers are chemically inert under normal environmental conditions, they
are reduced in the pH range 10-12 by sodium thioglycollate into two S-carboxy-
methylkerateines (SCMK) labeled A and B, which can be separated. The SCMKA
fraction is low in sulfur instead of SCMKB, which is high in this element (8).
1.1. Physical Properties
Mechanical and physical properties of keratins are conditioned by temperature, time,
moisture content and physical modifications. Whereas properties of the keratins are
sensitive to the moisture content, it is common to carry out measurements in water. The
stress-strain curve of a keratin fiber under environment conditions has three regions: For
the Hooks region, the Young’s modulus values are similar to that of ice (~ 10 GPa), while
an extended keratin fiber (up to 30% extension) immersed in water, for about 1 hour at
50°C, presents a recovery of mechanical properties, and this behaviour suggests that only
cohesive hydrogen bonding and coulombic forces are involved. In the postyield region,
if extention is continued, irretrievably of mechanical properties occurs, which points to a
breakdown of covalent bonds. Moreover, no chemical damage to wool fibers in water is
distinctly observed below 55 °C, but above this temperature and close to the boiling point,
cysteine hydrolysis is detectable. This reaction is pH dependent (9).
1.2. Swelling and Contraction
Relevant structural diametrical and longitudinal variations can take place when keratin
polymers are exposed to media and conditions that promote the breakage of cohesive
forces or covalent bonds. This is the principal cause of the contraction and swelling of the
material. A keratin fiber extended in water at 100°C (or higher), into the yield region
generally presents a loss in stiffness of about 30% and a significant contraction in length
(9).

Keratin
6
2. KERATIN EXTRACTION In natural state keratin biomaterials are covered to an extent with substances that are
generally removed before any treatment. These waxy lipids offer chemical and physical
protection from chemical attack derived from external environment, for this reason
keratins are sometimes referred to as inert biomaterials. Moreover, these cleaning
procedures are involved into the surface conditioning of a fiber (1).
Niloofar Eslahi at al. (10), propose an enzymatic hydrolisis which most important
parameters are enzyme loading, type of substrate and surfactant, reducing agent
concentration and hydrolysis time. The optimal condition to obtain maximum extraction
is made using 1 g/L sodium dodecyl sulfate (as surfactant) and 2.6% (v/v) protease (as
savinase), in addiction to 8.6 and 6.4 g/L sodium hydrogen sulfite (as reducing agent) for
wool and feathers, respectively, at liquor to fiber ratio of 25 mL/g for 4 hr. Their results
indicate higher degradation of wool fiber in comparison with feathers, due to the higher
hydrophilic nature of the former. Sodium dodecyl sulfate polyacrylamide gel
electrophoresis (SDS-PAGE) patterns shows that molecular weights of the extracted
keratin proteins from wool and feather were lower than those for the untreated fibers.
Likewise, FTIR spectra indicates no relevant changes in the chemical structure of the
hydrolyzed fibers (10).
Prachi Kakkar et al. (11), provide the extraction of pure keratin from bovine hooves and
characterized them with the manner of employment as an alternative material for tissue
engineering applications. The keratin protein take from the pulverized hooves is extract
by reduction and two polypeptide chains of molecular weight in the range of 45–50 and
55–60 KDa is determine using SDS-PAGE assay. Besides, FTIR analysis establish that
hoof keratin adopts α-helical conformation with admixture of β-sheet. The keratin from
the hoof expose a biocompatible behavior when analyzed with MTT assay using
fibroblast cells, revealing more than 90% cell viability, for this reason hoof keratin would
be useful for biomedical applications (11).

Keratin
7
3. INTERACTION BETWEEN BACTERIA AND KERATIN 3.1.General features of oral bacteria
The environment in the human oral cavity provides a source of water, nutrients and
moderate temperatures that allow the growth of characteristic microorganisms. The oral
cavity is formed by the lips, cheeks, palate, teeth and gingival sulcus. Microorganisms
range from Protozoa, Mycetes, Viruses to the dominators in numerical terms that are the
Bacteria. Saliva plays an important role in the oral cavity, which is produced by the
homonymous glands in quantities of 0.8-1.5 l per day (saliva production is considerably
reduced during the night hours) and with antero-posterior pattern it is swallowed. This
contains ions Na, K, Cl, Phosphates, Carbonates at a pH of 6.75 with a modest buffering
power that aims to limit the cariogenic activity of bacteria. It also contains glycoproteins
(which represent a potential nutrient for many micro-organisms), lysozyme,
lactoperoxidase, lactoferrin, immunoglobulins, and the OSCN- and H2O2 thiocyanate ion.
(14) The bacterial species prevalent in the oral cavity of healthy individuals include:
GRAM-POSITIVE GRAM-NEGATIVE
Actinomyces
Arachnia
Bacterionema
Bifidobacterium
Lactobacillus
Micrococcus
Peptostreptococcus
Propionibacterium
Rothia
Streptococcus
Treponema
Actinobacillus
Bacteroides
Capnocytophaga
Eikenella
Fusobacterium
Haemophilus
Leptotrichia
Moraxella
Neisseria
Selenomonas
Simonsiella
Veillonella
Wolinella
Table 1. Bacterial species in the oral cavity of healthy individuals (T1)

Keratin
8
Gram-positive bacteria are those that remain colored blue or purple after having
undergone Gram staining, due to the peptidoglycan layer present in their cell wall. While,
Gram-negative bacteria retain other contrasting colors (safranin or fuchsin) and appear
red or pink. The different behavior with respect to Gram staining is due to the fact that
Gram-negative bacteria have a decidedly thinner layer of peptidoglycan. Furthermore,
peptidoglycan is located between two cell membranes: an internal cell membrane and an
external bacterial membrane. Subdividing the bacteria according to the coloration they
present after being subjected to the Gram method is the most used way to distinguish the
different bacteria, even if this does not involve any degree of phylogenetic relationship
between the different bacterial species. (15) Bacterial adhesion is particularly important
for oral bacteria and gingival fissure area, which are tooth support structures, providing a
habitat for a variety of anaerobic species. Bacteria accumulate on both hard and soft oral
tissues in the form of biofilms. Oral bacteria have developed mechanisms to sensitize
their environment and escape or modify the host. Furthermore, there is a dynamic balance
between dental plaque bacteria and the innate host defense system. Of particular interest
is the role of oral microorganisms in the two main dental pathologies: dental caries and
periodontal disease (16).
3.2.Keratin and bacteria
Numerous study groups have analyzed the behavior of keratin extracted and treated
against different bacterial strains. In literature, it is possible to find reports showing the
antibacterial capacity of keratin but at the same time there are studies showing some
bacterial keratinolytic ability, so it is a study topic to be further investigated in order to
better classify the role and the capabilities of the keratin itself.
Sundaram et al. (17) synthesised keratin nanoparticles from chicken feathers. The
structure and morphological characteristic of keratin nanoparticles were examined by
using SEM and XRD while the antibacterial activity of keratin nanoparticle was identified
by diffusion method against bovine mastitis, Staphylococcus aureus isolated from milk
and E. coli. The zone of inhibition was found to be 11 mm in diameter against
Staphylococcus aureus and 9.5 mm against E. coli at 100μg/ml concentration. The results
show that the zone of inhibition formed for keratin nanoparticles is higher than the keratin
extract (Table 2).

Keratin
9
Table 2. Antibacterial activity of Keratin nanoparticle and keratin (T2)
Despite this, many studies have shown the presence of a group of enzymes capable of
hydrolyzing keratin. Examples of such enzymes are keratinase, beta-keratinase and
protease which are produced by some microorganisms such as P. aeruginosa, Candida
albicans, Aspergillus flavus, A. fumigatus, Trychophyton sp. and Bacillus subtilis (18).
In the case study, attention was focused on oral cavity bacteria. The microbial invasion
of gingival tissues has been observed in periodontal diseases. Proteases and, in particular,
keratinases could be involved both in the dissemination of invading microorganisms and
in the release of nutrients by host tissues.
Mikx et al. (19) measured keratinolytic activity by labeling keratin with isothiocyanated
fluorescein (FITC). The insoluble nature of this substrate was used to separate it from
degradation products labeled with FITC, directly measurable in the surfactant of the
reaction mixture. It has been seen that DTT (dithiothreitol) stimulates keratinolytic
activity, because reducing disulfide bridges and makes keratin more accessible to
enzymatic degradation. This group also demonstrate that the keratinolytic activity may
vary between the different bacteria and the strains of the same species (Table 3). For many
bacteria, the proteolytic activity is an unstable fraction and the loss of proteolytic activity
may occur due to the subculture.

Keratin
10
Table 3. Cell-bound keratinolytic activity of cutaneous and oral bacteria measured by the release of soluble
fluorescent products of FITC-labeled keratin (T3)
Riffel et al. (20) selected bacteria with high keratinolytic activity, isolating them from a
poultry processing plant, which has properties of keratinolytic activity and the ability to
degrade keratin waste. A previously characterized Chryseobacterium sp. strain,
designated as kr6, that presented keratinolytic activity was used for comparison. Bacterial
identification was based on colony morphology, microscopic examination of Gram-
stained cells, and biochemical tests and comparing the data obtained with standard
species. To test the effect of temperature on growth and proteolytic activity were prepared
milk agar plates for a primary screening and bacteria were inoculated onto plates and
incubated at 22, 30, 37, 46, and 55°C for 24 h. Thus, only those strains that produced
clearing zones in this medium were selected. These bacteria present different
characteristics, i.e. a wide range of growth temperatures. Optimal proteolytic activity was
found between 30-37 °C, while the principal known keratinolytic bacteria, e.g., some
species of Bacillus, actinomycetes and fungi, mostly have a high temperature feather
degradation activity. This study showed that pH value increase during feather
degradation, a trend similar to other microorganisms with large keratinolytic activity.

Keratin
11
This tendency may be associated with proteolytic activity, resulting in the release of
excess nitrogen as ammonium ions. The increase in pH during cultivation is indicated as
an important indication of the level of keratinolytic potential of microorganisms. In
addition, the selected bacteria isolated were able to develop and show keratinolytic
activity in different keratin waste. This would be useful for using these residues. These
new insulates have potential biotechnological use in processes involving the hydrolysis
of keratin.
Samen et al. (21) demonstrated in a study that Srr-1 protein is localized on the surface of
S. agalactiae cells and that it is able to interact with human K4 (keratin type 4). The
domain interacting with this mammalian protein was found to be restricted to one region
of 157 aa. Finally, it was shown that Srr-1 promotes adherence of S. agalactiae to
immobilized K4 and to epithelial HEp-2 cells. A growing set of reports describe the
involvement of keratins in the interaction between host and pathogens (22). However,
that is the first report describing a bacterial binding partner for K4.

Keratin
12
Keratin source Treatment
Final material
Used Bacteria Results Ref.
Keratin nanoparticles from chicken
feathers, keratin extract
100 mg of isolated keratin was suspended in 2ml of deionised water. 8ml of absolute ethanol was added to it under constant stirring.1 µl of 8% glutaraldehyde was added to it for the formation of keratin nanoparticles and it was stirred for 24hours. Nanoparticles were collected by centrifugation at 20,000rpm for 20 min. The prepared keratin nanoparticle was lyophilized and stored
Solution Staphylococcus
aureus, E.coli
The microbial invasion of gingival tissues has been observed in periodontal diseases. Proteases and, in particular, keratinases could be involved both in the dissemination of invading microorganisms and in the release of nutrients by host tissues.
(17)
Humans and animals cells
To obtain keratin, human callus was washed in water at 5C, defatted with a mixture of chloroform-methanol and ground in a mortar in liquid nitrogen. The keratin was then labeled with FITC. Keratin (20 g) and 250 mg of FITC were mixed in 200 ml of 0.2 M carbonate bicarbonate buffer (pH 9.6) and stirred for 4 h at room temperature of 20C. Labeled keratin was pelleted by centrifugation at 15,000 x g for 10 min and washed with the same bicarbonate buffer until the excess of free FITC was removed. To collect the finest keratin particles, the final suspension was allowed to settle for 10 min, and then 70 ml of the upper part of the 200-ml suspension was collected and pelleted by centrifugation. The labeled keratin was weighed, suspended to 2% (wt/vol) in sterile 0.2 M sodium phosphate buffer (pH 7.2), and stored at 4°C.m temperature(20°C).
Suspension Staphylococci, Coryneforms, oral bacteria
The keratinolytic activity may vary between the different bacteria and the strains of the same species. For many bacteria, the proteolytic activity is an unstable fraction and the loss of proteolytic activity may occur due to the subculture.
(19)
Feather keratin
The organisms were cultivated in feather meal broth for up to 8 days at 30ºC. Enzymes were obtained by centrifugation at 10,000 g for 5 min, and culture supernatants were used as crude enzyme extracts. Keratinase activity was assayed at different cultivation times.
Enzymes
Proteobacteria Cytophaga-
Flavobacterium group
Bacteria presenting high keratinolytic activity were selected
(20)
Human k4
S. agalactiae 6313 is a serotype III clinical isolate obtained from an infected neonate.E. coli DH5α was used for cloning
purposes, and E. coli BL21 and ER2566 served as hosts for the production of Srr-1 and K4 fusion proteins. S. agalactiae was cultivated at 37°C in Todd-Hewitt yeast broth containing 1% yeast extract. S. agalactiae clones. E. coli was grown at 37°C in Luria-Bertani broth.The cell line HEp-2 was obtained from the HEp-2 is a human epidermoid carcinoma cell line of larynx. Tissue cultures were incubated in a humid atmosphere at 37°C with 5% CO2.
Tissue colture Streptococcus
Agalactiae, E. Coli
Srr-1 promotes adherence of S. agalactiae to immobilized K4 and to epithelial HEp-2 cells. A growing set of reports describe the involvement of keratins in the interaction between host and pathogens
(21)
Table 4. Summary of the studies above mentioned

Keratin
13
4. INTERACTION BETWEEN FIBROBLAST AND KERATIN 4.1. General features of fibroblasts
Fibroblasts are mesenchymal cells that perform many vital functions during growth and
in adulthood. They are responsible for the synthesis of extracellular matrix in connective
tissue and play important roles in wound healing. This type of cells launches the
inflammation process in the presence of invasive microorganisms, in addition to, induces
the synthesis of chemokines through the exposure of receptors on its surface. The immune
cells in response to chemical signals expressed by fibroblasts, initiate a cascade of events
for eliminating the invasive microorganisms (23). Receptors present on the surface of
fibroblasts also allow the regulation of the hematopoietic cells and provide a path for the
immune cells to regulate the fibroblasts themselves. A series of diseases are associated
with fibroblasts, both because fibroblasts are involved in their etiology or because of
fibrosis that accompanies the damage of other cell types. Fibroblasts are one of the most
accessible of mammalian cells and one of the simplest forms of cells to be able to grow
in culture. Gingival fibroblasts (GF) are the most abundant types of cells present in the
periodontal connective tissues and have distinct functional activities in the repair of the
periodontal tissue as in the case of inflammatory diseases and periodontal diseases.
Human gingival fibroblasts (HGF) express a wide variety of surface molecules including:
• CD26, that is a widely distributed 110 kDa cell-surface glycoprotein with known
dipeptidyl-peptidase IV (DPP-IV) activity in its extracellular domain.
This ecto-enzyme is capable of cleaving amino terminal dipeptides from
polypeptides with either L-proline or L-alanine in the penultimate position. (24)
• CD71, that is also known as Transferrin receptor protein 1, TfR, sTfR, p90, TfR1,
Trfr, which belongs to the peptidase M28 family and M28B subfamily. CD71
/TFR contains one PA, protease associated, domain. CD71 / TfR1 is required for
iron delivery from transferrin to cells. CD71 is a potential new target in cases of
human leukomia & lymphoma. (25)
• CD86, this gene encodes a type I membrane protein that is a member of the
immunoglobulin superfamily. This protein is expressed by antigen-presenting
cells, and it is the ligand for two proteins at the cell surface of T cells. (26)
• CD99, the protein encoded by this gene is a cell surface glycoprotein involved in
leukocyte migration, T-cell adhesion, ganglioside GM1 and transmembrane
protein transport, and T-cell death by a caspase-independent pathway. (27)

Keratin
14
They also express mRNA for the protease-activated receptor-1 (PAR-1) and PAR-3.
Furthermore, human gingival fibroblast (HGF) may be used as stem cells for periodontal
tissue engineering (28).
4.2. Keratin and fibroblasts
Wang et al. (29) in order to evaluate the suitability of keratin hydrogels as substrates for
cell culture, have fabricated hydrogels using keratins extracted from human hair by
inducing polymerization with Ca2+ into an aqueous environment. These hydrogels exhibit
highly branched and porous micro-architectures (figure 3). L929 murine fibroblasts have
been used in a preliminary cell culture study to compare the in vitro biocompatibility of
the keratin hydrogels with collagen type 1 hydrogels of similar viscoelastic properties.
Results reveal that keratin hydrogels are comparable with collagen hydrogels in terms of
the promotion of cell adhesion, proliferation and the preservation of cell viability.
Furthermore, cells remain clustered in proliferative colonies within the keratin hydrogels
but are homogeneously distributed as single cells in collagen hydrogels.
Figure 3. Scanning electron microscopic images of lyophilized keratin (a) and collagen type 1, (b) hydrogels,
showing their highly porous and interconnected microarchitecture. Bar 200 μm. (F3)

Keratin
15
Figure 4. Fibroblasts morphology and distribution. For all groups, cells were seeded at a density of 10,000/cm2. Live
cells were labelled green by calcein AM and observed under a fluorescent microscope at days 2, 4 and 6 post-
seeding. Bars 100 μm. (F4)
As it possible to see from figures 4a, 4d and 4g, cells grown on tissue culture plastic
surfaces (Control (TCPS)) in 24- well plates show typical spindle morphology at all time
points and proliferate progressively to reach near 100% confluency by day 6. Images b,
e, h cells grown on keratin hydrogels exhibit spindle morphology by day 6 of culture and
proliferate in localized clusters. Images c, f, i only a small proportion of cells grown on
collagen hydrogels exhibit spindle morphology at day 4 of culture. Cell distribution is
comparable with that of controls (23).
Zackroff et al. (30) investigate some biochemical and immunological properties proteins
isolated from BHK-21 and mouse 3T3 cells. These lines were chosen because they are
classified as fibroblasts because of their morphology and they have been shown by
immunofluorescence criteria to be "keratin-negative". Intermediate filaments, isolated
from that variety of cultured fibroblasts, are composed principally of proteins of

Keratin
16
molecular weights of 54 kDa and 55 kDa and are capable of forming paracrystals that
exhibit a light or dark banding pattern when negatively stained with uranyl acetate. The
dark bands are composed of longitudinally aligned filaments with a diameter of 2 nm.
The center-to-center spacing between either dark or light bands is 37-40 nm. These
dimensions are consistent with the secondary structure of IF polypeptides and suggest
that the dark bands represent lateral alignment of a-helical coiled-coil domains.
Immunoblotting, secondary structure, as well as amino acid composition data indicate
that the paracrystal polypeptides with a molecular weight of 60 kDa-70kDa are similar to
keratin. Thus, polypeptides with biochemical and immunological properties of epidermal
keratin are present in cells normally considered to be fibroblasts.
Tachibana et all. (31) have fabricated wool keratin sponge scaffolds by lyophilization of
an aqueous wool keratin solution after controlled freezing. To obtain stable sponges, with
1 cm in diameter, the freezing process was performed at -20 °C for three days. Thus, the
resulting sponges did not show significant changes once they were subjected to a heat
treatment of 60 °C for several hours. The characterization of the material at SEM
(Scanning Electron Microscopy) have revealed a porous and homogeneous
microstructure with pore size of ≈100 µm. At one day from seeding, cell adhesion was
observed and subsequently cellular spreading on the surface of the sponge occured. At
long-term cultivation, 23–43 days, cells were regularly counted to be ≈4.2–7.4 million
per sponge. The maximum cell number was ≈37 times higher than on the same area of a
commercially available plastic culture dish. After the long-term cultivation, SEM
observation have revealed no abnormal morphology of living cells (figure 5a). In
conclusion, results have shown that wool keratin sponges are useful scaffolds for long-
term and high-density cell cultivation (figure 5b).

Keratin
17
Figure 5a. SEM observation of fibroblast cells adhesion and colonization on keratin sponge. (A) At 1 h after seeding,
ball-shaped cells adhered on the pore wall of the sponge. (B) At 1 day, fibroblasts spreading on the sponge. (C) At 23
days, fibroblasts were obs (F5)
Fig 5b. Cell growth on keratin sponge. A number of 5000 fibroblast cells were seeded onto the sponges. Cell counting was performed by the MTT method within 10 days and by the Burton method over 10 days. (F6)

Keratin
18
5. INTERACTION BETWEEN SILVER AND KERATIN 5.1.Antibacterial properties of silver
With the discovery of antibiotics, the use of silver as an antimicrobial agent, known since
the Middle Ages, decreased drastically, but the presence of bacterial strains resistant to
antibiotics has led to a renewed interest in silver. Only in recent years the availability of
innovative technologies such as the use of radioactive isotopes and electronic microscopy
has allowed to study the mechanism of action of silver as an antibacterial element. There
are various hypotheses about the mechanism of action of antibacterial silver. It is believed
that silver binds to the thiol groups -SH present in the enzymes causing their deactivation:
silver forms stable S-Ag bonds with the compounds containing the -SH groups present in
the cell membrane that are involved in energy production and in the Ion transport. Silver
could also take part in the catalytic oxidation reactions leading to the formation of R-S-
S-R disulfide bonds. The silver-catalyzed disulfide bridging, leads to variation in the
structure of the enzymes, influencing their functions. In one of the suggested activity
Keratin source Treatment Final material Fibroblast type Results Ref.
Keratin extracted from human’s hair
Polymerization with Ca ions into aqueous
enviroments Keratin hydrogel L929 murine
fibroblast
Results reveal that keratin hydrogels are comparable with collagen hydrogels in terms of the promotion of cell adhesion, proliferation and the preservation of cell viability. Furthermore, cells remain clustered in proliferative colonies within the keratin hydrogels but are homogeneously distributed as single cells in collagen hydrogels.
(29)
Keratin extracted from
wool
Lyophilization of an aqueous wool
keratin solution after controlled freezing.
Keratin scaffold L929 murine fibroblast
At one day from seeding, cell adhesion was observed and subsequently cellular spreading on the surface of the sponge occured. After the long-term cultivation, the maximum cell number counted was ≈37 times higher than on the
same area of a commercially available plastic culture dish. In conclusion, results have shown that wool keratin sponges are useful scaffolds for long-term and high-density cell cultivation.
(31)
Table 5. Summary of the studies above mentioned

Keratin
19
mechanisms for antimicrobial silver, Ag + ion enters the cell and intercepts between
complementary purine and pyrimidine bases, resulting in denaturation of the DNA
molecule. Although this is still to be demonstrated, it is certain that silver ions are
associated with DNA once they enter the cell. Most of the proposed mechanisms however
provide that silver enters the cells by damaging them and is believed to be able to use
membrane proteins that have, inter alia, the function of transporting molecules through
the membrane by means of pores, ion channels, ion pumps or specific carriers. In order
to carry out its antimicrobial activity, silver must be in ionic form, e.g., in the form of
silver nitrate or a zeolite matrix or in the form of nanoparticles. The latter are of particular
interest in their simplicity of production as well as for the high antimicrobial action and
the ability to adhere to many products such as surgical masks and cotton fibers (32).
Sondi et al. (33) have carried out bacteriological tests using Luria-Bertani (LB) medium
on solid agar plates and liquid systems, integrating them with different concentrations of
silver nanoparticles. For the characterization of the bactericidal action of this nanoscale
material, electronic scanning microscopy and electronic transmission microscopy have
been used. The bactericidal effect of silver nanoparticles was investigated using
approximately 105 colony forming units of E. coli strain B, cultured on LB agar plates
supplemented with nano-sized silver particles in concentrations of 10 to 100 μg cm−3.
Silver-free LB plates cultured under the same conditions were used as a control. All plates
were incubated for 24 h at 37 ◦C and the numbers of colonies were counted.
Figure 6. Number of E. coli colonies as a function of the concentration of silver nanoparticles in LB
agar plates expressed as a percentage of the number of colonies grown on silver-free control plates.
(F7)

Keratin
20
The image, in the upper right corner of the figure 6 above, shown LB plates containing
different concentrations of silver nanoparticles: (a) 0, (b) 10, (c) 20, and (d) 50 μg cm−3.
To examine the bacterial growth rate, E. coli bacteria were grown in 100 cm3 of liquid
medium LB, supplemented with 10, 50 and 100 μg of silver nanoparticles per cm3 of
medium. Furthermore, growth rates and bacterial concentrations were determined by
measuring the optical density at 600 nm every 30 min (OD of 0.1 corresponds to a
concentration of 108 cells per cm3). Results confirmed that treated E. coli cells were
damaged while silver nanoparticles were found to accumulate in the bacterial membrane.
A membrane with such morphology has a significant increase in permeability, resulting
in death of the cell.
Kim et al. (34) have prepared stable silver nanoparticles characterizing their shape and
size distribution by particle characterizer and transmission electron microscopic study.
The antimicrobial activity of silver nanoparticles was investigated against Escherichia
coli and Staphylococcus aureus. In those tests Muller Hinton agar plates were used and
silver nanoparticles of various concentrations were enhanced in liquid systems. The effect
of free-radical generation by nanoparticles on the inhibition of microbial growth was
studied by electron spin resonance spectroscopy. In conclusion, E. coli was inhibited at
the low concentration of silver nanoparticles, while the growth-inhibitory effects on S.
aureus were mild, thus have suggest that silver nanoparticles can be used as growth
inhibitors in different microorganisms, making them applicable to various medical
devices and antimicrobial control systems.

Keratin
21
5.2.Keratin and antibacterial silver
Wool fabric is a natural textile material with excellent characteristics and can form a skin-
like micro-environment due to its protein composition, which is the same of human skin
surface. Current approaches to the preparation of antibacterial fibers include coating, pad-
dry-cure, chemical modification and electro-less plating processes with metallic
elements, photo-catalytic materials and quaternary ammonium agents (35). Among them,
durability of antibacterial properties is not so good by coating and pad-dry-cure. Chemical
modification process can solve this problem, but it does damage to fabric's mechanical
strength, as it is a chemically aggressive process. Silver electro-less plating is an effective
way to give to the substrate antibacterial, antistatic properties and good durability. This
technique can be started on the catalyzed surface, so for textiles it can be difficult to
achieve due to the lack of reactive groups on the surface of the fiber. The adhesion
between the metal layer and the wool fabric is intrinsically poor and this can be
unfavorable to the use of metallization of textiles (35). The following study groups show
the relationship that may arise between silver nanoparticles and keratin nanofibers.
Hadad et al. (36) have deposited silver nanoparticles on the surface of natural wool with
the aid of powered ultrasound. Sonochemical irradiation is an effective method for the
synthesis of nanophase materials and for the deposition and insertion of nanoparticles
onto and into mesoporous and ceramic supports such as polymers (37). The sonochemical
irradiation of a slurry containing wool fibers, silver nitrate, and ammonia in an aqueous
medium for 120 min under an argon atmosphere produced a silver–wool nanocomposite.
By varying the gas and reaction conditions, it was possible to control the deposition of
metallic silver particles on the surface of the wool fibers. The efficiency of sonochemistry
comes from the explosive collapse of the bubbles forming in the liquid as a result of
sonochemical irradiation. The effect of very high temperatures obtained upon the collapse
of the bubbles, following by high cooling rates, leads to the creation of nanostructure
products. The advantage of this method is the achievement of a homogeneous coating
with a small particle size distribution (37). The resulting wool samples deposited in silver
were characterized by a variety of techniques, e.g., X-ray diffraction, transmission
electron microscopy, high-resolution transmission electron microscopy, high resolution
scanning electron microscopy, Brunauer and Teller physical adsorption method, X-ray
photoelectron spectroscopy and diffused reflection optical spectroscopy.

Keratin
22
The results shown that strong adhesion of silver to wool protein fibers was the
consequence of the absorption and interaction of silver with the sulfur parts of the cysteine
group.
Figure 7. XPS spectra of (a) neat and (b) silver-coated wool fibers (F8)
In particular, XPS studies have revealed that silver nanoparticles were attached to the
keratin fibers as a result of the interaction between either Ag+1 or Ag clusters and sulfur.
The origin of these sulfur atoms is most likely the partial disconnection of the S-S bond
in the keratin fibers at 161.7 eV band, as can be seen in figure 7. The stability of the
coating is maintained even after several cycles of thermal treatments and simulation of
washing and no change of silver concentration has been detected (37).
Lü et al. (38) based their study on a series of recent focal points in nanotechnologies that
include the application of nanoparticles in biology, with variable dimensions, depending
on conditions such as pH, temperature, substrate concentration, and reaction time. In
addition to the fact that microorganisms, DNA and proteins can be used in the synthesis
of silver nanoparticles through a strong affinity to silver with ligands -SH, -NH2 and -
COOH. They have decided to use keratin as capping agent of silver nanoparticles, as it
has several advantages over other agents: First, keratin is one of the most abundant
renewable proteins, also keratin content is greater than 50% in wool and feather.

Keratin
23
The characterization of the material obtained during the experiment includes: The use of
UV-vis spectroscopy, X-ray photoelectron spectrometer and X-ray diffraction
spectrometers for the study of this metal nanoparticles formation. The scanning electron
microscopy in vacuum and atomic force fluid microscopy to study the morphology. The
Fourier Transform Infrared Spectroscopy (FTIR) to investigate the potential interactions
between the silver core and the capping agent. Finally, the effects of keratin concentration
on nanoparticles incubation were observed by UV-Vis spectra. In conclusion, it was
found that under alkaline condition the incubation process was much faster than that under
neutral pH conditions and experimental results have shown that keratin is a good stabilizer
for silver nanoparticles. This is the first report that uses keratin as a nanoparticle capping
agent.

Keratin
24
Keratin Source Treatment Final material Characterization
techniques Principal results Ref.
Keratin fibers from
wool
Silver nanoparticles has been deposited on the surface of natural wool with the aid of powered ultrasound. The sonochemical irradiation of a slurry containing wool fibers, silver nitrate, and ammonia in an aqueous medium for 120 min under an argon atmosphere produced a silver–wool nanocomposite
Silver nanoparticles on
the surface of natural wool
X-ray diffraction; Transmission electron microscopy; High-resolution transmission electron microscopy; High resolution scanning electron microscopy; Brunauer and Teller physical adsorption method; X-ray photoelectron Spectroscopy; Diffused reflection optical spectroscopy;
Silver nanoparticles were attached to the keratin fibers as a result of the interaction between either Ag+1 or Ag clusters and sulfur. The stability of the coating is maintained even after several cycles of thermal treatments and simulation of washing and no change of silver concentration has been detected
(36)
Keratin extracted from wool
The reducing agent, NaBH4 (0.3 mol/L), was passivated in a clean beaker at 30 C for 16h before using. Ag NPs were synthesized by adding the passivated NaBH4 solution in the mixed solution of AgNO3 (0.5 mol/mL) and keratin. The NP incubation was performed at room temperature for several days. The molar ratio of NaBH4/AgNO3 was kept constant at 5:1. The effects of pH and Keratin concentration was studied in two ways: (a) keeping the pH under the neural conditions; (b) keeping the molar ratio of keratin/AgNO3 at 1:20 while varying the pH of the keratin-AgNO3 solution (pH 7). Solutions were treated with the following procedure to remove excess salts and unbound keratin: The excess salts were removed by dialysis the solution against DI water for 24 h. To remove the unbound keratin, the dialyzed solution was treated by centrifugation at 13,000 rpm for 30 min. The unbound keratin will stay in the clear liquid after centrifugation. The Ag NPs solution without salts and unbound keratin is obtained by dissolving the precipitate after centrifugation.
Mixture
UV-vis spectroscopy; X-ray photoelectron spectrometer; X-ray diffraction spectrometers; Scanning electron microscopy in vacuum and atomic force Fluid microscopy; Fourier Transform Infrared Spectroscopy (FTIR); UV-Vis spectra;
Under alkaline condition the incubation process was much faster than that under neutral pH conditions and experimental results have shown that keratin is a good stabilizer for silver nanoparticles.
(38)
Table 6. Summary of the studies presented above

25
CHAPTER II
STRATEGIES TO REDUCE BACTERIAL ADHESION OVER DENTAL IMPLANTS
1. ORAL CAVITY The oral cavity is delimited by the palate, the oral floor, the cheeks and lips, as well as
from the uvula and the palatine arches, which extend laterally from the latter. The inside
of the oral cavity is composed of the upper jaw and lower jaw teeth. The "oral cavity"
(Cavum ori) is therefore definable as the region comprising the front and side portions of
the dental area, which is largely covered by the tongue. The space between the teeth and
the lips or cheeks is defined as "oral vestibule "(Vestibulum oris).
Figure 8. Oral cavity structure (F9)

Strategies to reduce bacterial adhesion over dental implants
26
The oral mucosa, which completely covers the oral cavity, is kept constantly wet by saliva
produced by the salivary glands and contains sensory receptors for temperature and sense
of touch.
While the surface mucous portion of the tongue has a predominance of sensory receptors
for the sense of taste. The transition zone between the mucosa of the lips or cheeks and
the mobile mucosa of the alveolar process is also called "vestibular plica". In the cheeks
region, single mucous membrane protrudes towards the alveolar process, resulting in so-
called "lateral vestibular frenules". In addition, from the mucosa of the upper and lower
lip radiates a labial frenulum, which reaches the mucosa of the alveolar process. The
mobile mucosa located around the rows of teeth turns into the gum, which is fixed to the
maxillary bone. The lower limit of the oral cavity is the oral floor that is formed by the
mylohyoid muscle, which extends from the lower jaw to the hyoid bone. In the anterior
region of the oral floor there is a fold of mucous plica, which extends from the center up
to the alveolar process, called "lingual frenulum". On the right and on the left of the
lingual frenulum, two small bulges are visible, corresponding to the orifices of the
submandibular salivary glands. Laterally the orifices begin the sublingual plica, where
the sublingual salivary glands have several output ducts (Figure 8). (39)
1.1. Structure and shape of the teeth
Basically, in each tooth, it is possible to distinguish between the crown and one or more
roots. In the transition area between the crown and the root lies the tooth collar. In the
tooth region near the root apex, called "apical", there is a small opening (apical foramen)
through which blood vessels, lymph vessels and nerves pass, entering the tooth to provide
nourishment and innervation. The teeth, consist of three hard substances enamel, dentine
and cement and a soft substance (dental pulp). Dental crowns visible in the oral cavity are
covered with enamel, which represents the toughest substance of the human body. The
enamel is formed for about 96% by calcium, phosphorus, carbonate, magnesium and
potassium compounds, as well as water and organic compounds. Most of the tooth is
made of dentine, which is surrounded by enamel at the coronal level and, in the root area,
is covered with cement. Dentine is the second toughest substance in the human body and
is composed of about 70% by inorganic substances, and by 20% by organic material and
water. Dentine is produced by odontoblasts whose cellular bodies are located on the
dental pulp edge. The cement covers the surface of the roots and has a structure similar

Strategies to reduce bacterial adhesion over dental implants
27
to that of the human bones. Cement is produced by cementoblasts, and is made up of 65%
by inorganic compounds, mainly calcium and phosphate (39) (Figure 9).
Figure 9. Tooth structure (F10)
1.2. Periodontum
All the elements that contribute to the anchoring of the teeth are part of the periodontium.
The structure of the periodontium also helps to dampen the forces acting on the teeth,
forces that, with the tight bite, can correspond to a weight of up to 80 kg. The tissue parts
which fix the teeth and form the periodontium are:
Periodontal ligament (desmodont or alveolar-dental ligament)
Alveolar process (processus alveolaris)
Cementum
The cement covers the root of the tooth from the neck to the root apex. Above it, fibers
of the periodontal ligament develop and adhere to the alveolar bone. Therefore, it mainly
serves to anchor the tooth inside the alveolus. Periodontal ligament consists mainly of
connective tissue fibers, which connect the alveolar process to the tooth cement and
extend into the compact bone layer of the alveolar wall. Therefore, single teeth do not
grow with the alveolar bone, but are fixed to the membrane by connective tissue fibers.
In this way, in biting and chewing the loading pressure becomes a tensile load.

Strategies to reduce bacterial adhesion over dental implants
28
Aside from the connective tissue fibers, the periodontal ligament contains a dense
network of blood vessels that, in addiction to nourishing the cells of the cement and those
of the connective tissue, dampen the chewing pressure. In the periodontal ligament, there
are also nerve fibers that transmit to the teeth the sense of pressure and contact. In a
healthy periodontium, the bone starts at about 1-2 mm below the cement-enamel line.
(39) The gum covers the area of the dental neck as well as the top of the alveolar process
and, as an interdental gum, forms an interdental papilla at the level of the spaces between
each tooth. The free or marginal gingiva appears as a thin, uniform, wavy margin running
parallel to the dental collars, whose width ranges from 1.5 to 2.5 mm. Within the marginal
gingiva, connective tissue fibers adhere, inter alia, to cement and alveolar bone. In the
area of dental neck, the marginal gingiva adheres by means of a special junctional
epithelium, while between the tooth surface and the marginal gingiva is present a gingival
sulcus (Sulcus gingivae) deep by 1 to 2 mm. The junction epithelium surrounds the dental
neck as a ring, it forms the floor of the gingival groove or periodontal pouch and adheres
to the tooth, protecting the bone from the external influences of the oral cavity. Unlike
the marginal gingiva, the adherent gingiva, wide from 1 to 9 mm, is anchored to the
alveolar bone and is immobile with respect to the underlying tissue. It also presents a pale
pink appearance and has an opaque, dotted surface. These stippling are produced by the
traction of the connective tissue fibrous bundles on the underside, which ensure fastening
to the periosteum of the alveolar process and cement. In this way, the fastening is strong
enough to resist the action of the forces in the chewing and bite. Finally, from the
mucogingival junction line, the adherent gum turns in the mobile mucosa of the alveolar
process (Figure 10). (39)

Strategies to reduce bacterial adhesion over dental implants
29
Figure 10. Anatomy of Periodontium (F11)
1.3. Periodontal Diseases
Periodontal inflammatory diseases are gingivitis and periodontitis. The most common
primary cause of both is the bacterial plaque, whose formation can be accelerated by other
factors defined as secondary causes and classified as Local Factors or Endogenous
Factors. The former includes: Plaque, caries, oral breathing, reduced salivation, plaque
retention points, edges of protruding crowns as plaque retention points, fillings poorly
executed as a plaque retention points, anatomical features that make oral hygiene difficult
and smoking. The latter refers to metabolic disorders such as diabetes mellitus, allergies,
smoking, bad eating habits, hepatic disease, immune system disorders, stress, hormonal
imbalances. The inflammation development, which is a defense response of the immune
system, is crucial as it determines the extent and inflammation course itself. The local
defense action is reinforced by increased blood flow. If the immune system fails to
prevent the spread of the sublingual plaque, the junction epithelium is the first portion of
tissue that is lost. As a result, the gap becomes permeable to bacteria and gingivitis
becomes periodontitis, whose further course involves dental mobility and loss of teeth.
(39)

Strategies to reduce bacterial adhesion over dental implants
30
In case of gingivitis, the spread of the disease is limited to the gum. In periodontitis, all
parodontal tissues (gingiva, alveolar bone, desmodont and cement) are affected.
Gingivitis from the plaque is an inflammation of the gum resulting from soft bacterial
deposits and the main clinical symptoms are redness, swelling, loss of characteristic
stippling appearance. In addition to gingivitis caused by the plaque alone, there are
gingivitis caused by systemic factors such as hormonal upheavals that affect the immune
system, resulting in a change in the inflammatory processes of the gums. Furthermore
shapes, dimensions and particular positions of the teeth involving the presence of
interstices, protruding edges of crowns and fillings, absence of contact points for the use
of crowns or fillings and incorrect support of dental prostheses. In most cases, gingival
and periodontal recessions are a clear indication of aggressive brushing techniques:
excessive frequency or pressure, use of too hard bristle brushes (Figure 11).
Figure 11. Current paradigm of periodontitis. (F12)

Strategies to reduce bacterial adhesion over dental implants
31
Treatment of periodontal diseases involves the following procedure:
Blocking the Infection. The first step involves consulting the patient, followed by
removal of plaque, concretions and tartar;
Elimination of causes through careful removal of concretions close to dental roots,
including removal of gum to facilitate access, removal of granulocyte tissue (rich
in capillaries and inflamed) from gum and bone pouches, antibiotic accompanying
therapy in case of aggressive course of the pathology and mucogingival surgery;
Conserving the result. Maintenance therapy is associated with the patient's
constant follow-up with supportive measures, such as smoothing of any
protruding edges of the filling. (39)
2. DENTAL IMPLANTS 2.1. General features of dental implants
The term "implant" refers to the insertion into the body of artificial or human material,
partially or totally, in the latter case it is defined as transplantation. Dental implantology
focuses mainly on the insertion of artificial roots into the jaw for replacing one or more
teeth or for attaching a removable prosthesis. Implants can replace individual missing
teeth or act as artificial bridges with fixed or removable support, and also contribute to
stabilizing total prostheses and thus improving chewing function. (39) Dental implants
are made up of inert, alloplastic materials and embedded in the jaw for the treatment of
tooth loss and to help replace the lost structures following trauma, cancer and congenital
defects. The most common type of dental implant is the endosseous, comprising a single
implant unit and screw or cylinder shapes, arranged in a hole in the dental or alveolar
bone. Commercially pure titanium and titanium alloy are the most common constituents
of dental implants. However, alternative materials include ceramics such as aluminum
oxide and other alloys (gold and nickel-chrome-vanadium). Generally, endosseous
implants have a coating that may include plasma sprayed titanium or a hydroxyapatite
layer to enhance initial bone osseointegration. (40) ‘Osseointegration’ was discovered by
P. I. Branemark in 1969, when he observed that a piece of titanium embedded in a rabbit
bone became firmly anchored and difficult to remove. Following one year of observation,
no inflammation was detected in the peri-implant bone, while soft tissue had formed an
attachment to the metal and bone to the titanium. (41)

Strategies to reduce bacterial adhesion over dental implants
32
The Branemark system of dental implants was introduced in 1971. After endosseous
implant fixtures are surgically inserted into bone, the process of osseointegration begins.
Osseointegration is considered “a direct, structural and functional connection between
organised vital bone and the surface of a titanium implant, capable of bearing the
functional load”. (42) This is possible because the titanium surface oxide layer, mainly
titanium dioxide, is biocompatible, reactive and spontaneously forms calcium phosphate
apatite. In addition, the titanium oxide surface of the implants results in a union with the
superficial gingival that can block the entry of oral microorganisms. As a result, the
interface between the soft tissue and the implant is similar to the union between the tooth
and the gum. Dental implants are predominantly placed in primary care settings,
commonly in general dental practice in local anesthesia. Despite this and the
contaminated oral surgical field through which they are placed, success rates are reported
as being as high as 90% e 95%. (43)
Dental implants are generally divided into five typologies (Figure 12):
Subperiostal implants: a metallic structure that is surgically placed between the
bone surface and the periosteum. The implant pillars pierce at some points the
mucosa that covers it. These implants are seldom used due to the shape that is
unlike natural roots, thus less reproducing the right incentive to osteointegration,
which is why they have high percentages of failure;
Endosseous implants: the implant is inserted into the bone in a direct way; while
the closed ones, under the periosteum, cannot communicate with the oral cavity,
the open ones are equipped with a pillar having such function; most part of
endosseous implants are of the latter type. Moreover, there is a subtype of
endosseous implant that will remain underneath an integer epithelial layer for
several months (cicatrization phase) and is only exposed later on. These are the
most commonly used systems, for the sake of simplicity of surgical techniques
and for the possibility of applying a new implant in case of failure. Subperiostal
endosseous implants are a combination of the two previous types (one part is
above the bone; one part is inside it);
Transosseous implants: are specific to the jaw and through vertically it;

Strategies to reduce bacterial adhesion over dental implants
33
Transdental implants: they are also called endodontics as they stabilize the teeth
in which they are placed, as if they had a kind of "biological collar" for the
anchorage between the separation seal with the oral cavity and the periodontium
of a natural tooth;
Intramucosal implants: they are inserted into the lining mucosa by fixing to a base
prosthetic and because they do not perforate the lining epithelium and do not
remain permanently in the implant site, they are more suitable for classical
prosthesis rather than implant prostheses. (44)
Figure 12. Types of dental implants. (F13)
2.2.Parts of a dental Implant
Dental implantology is the branch of dentistry that is concerned with implants aimed at
replacing the missing teeth. (45) Dental implant, like the endosseous or the subperiostal
implant, as an artificial root, is inserted firmly into the alveolar bone and can successfully
support a single capsule or a bridge, or it can act as an excellent anchor to an unstable or
bad denture tolerated by the patient. Depending on needs, is possible to insert one or more
implants, to replace only one tooth, multiple teeth (partial dental prosthesis) or all the
teeth of the arch (full dental prosthesis).

Strategies to reduce bacterial adhesion over dental implants
34
A dental implant consists essentially of 3 parts (Figure 13):
Figure 13. Parts of dental implant. (F14)
Prosthesis: artificial crown replacing the natural one;
Abutment: small structure that connects the prosthesis implant;
Implant: structure, generally screw, which comes inserted into the bone; The
transmucosa area of the implant is in contact with gingival tissues and serves to
ensure a good integration of the gingival mucosa; (46)
The dental implant can be done according to two distinct techniques of implant surgery:
Immediate loading implantology and deferred loading implantology. The former provides
the insertion of the implant and the anchorage of the crowns taking place in one phase.
For this type of operation, dental implants are used in monobloc, that is composed of only
one piece equipped with the stump, or modular, in which the stump is placed at the same
time as the implant. The latter is a technique that is performed in two phases: in the first
step, a gingival patch is opened and the implant, on which a top is placed, is inserted;
Then the gum is closed with stitches. The success of insertion depends on how much bone
tissue grows around the implant, incorporating it into its structure, in the next three or six
months after operation. The second step involves inserting and positioning the prosthesis.
(47) The time span between one phase and another Is generally 3-4 months for the
mandible and 5-6 months for the upper jaw. (48)

Strategies to reduce bacterial adhesion over dental implants
35
Currently, thanks to the scientific research concerning the surface and the shape of the
implants, it is possible to imagine an immediate load after the intervention, i.e. the patient
can have a permanent prosthesis within 12 hours. (46) Implant stability can be seen as a
combination of:
Mechanical stability, which is the result of the compressed bone holding the
implant firmly, in situ;
Biological stability, which is the result of the formation of new bone tissue, which
forms on the implant site thanks to osteointegration.
Mechanical stability, named also primary stability, is generally high at once after insertion
of the implant. This stability is due to the mechanical compression of the bone when the
system is inserted, and it decreases over time. Biological stability or secondary stability,
however, does not occur immediately after placement. It becomes clear only when new
bone cells are formed in the implant site and Increases with time. In conclusion, as a result
of the osteointegration, initial mechanical stability is strengthened and replaced by
biological stability and the final stability level of an implant is the sum of the two.
However, stability does not remain constant after implant insertion, for example, an initial
diminish in stability occurs, followed by a next increase when the plant becomes
biologically stable (Figure 14). (49)

Strategies to reduce bacterial adhesion over dental implants
36
Figure 14. Comparison between implant and healthy tissue. (F15)
2.3. Materials of a Dental Implant
The most commonly used material for dental implants is commercially pure titanium,
grade 2 or grade 4. This material has demonstrated a high rate of success due to it
biocompatibility and the ability to be osteointegrated allowing to use it in direct contact
with living bone. In addition to biocompatibility, titanium has a high resistance to
corrosion, property conferred by the formation of a thin layer of titanium inert oxide on
its surface, e.g. TiO2. (46) Another advantage resulting from this corrosion resistance is
the absence of taste, once inserted into the oral environment. Finally, the thermal
conductivity of commercially pure titanium is particularly low, approximately 20 W
(m*K) -1, value which is 3.2 times lower than that of alloys CrCo and 13.5 times less than
gold. This helps to avoid irritation of the dental pulp, as opposed to other alloys. The
patient can then enjoy drinks and hot or cold foods without accusing the discomfort of
over-temperature overlays too high.

Strategies to reduce bacterial adhesion over dental implants
37
Other materials used, though more limited, are titanium alloys and in particular the
Ti6Al4V alloy, which has both higher tensile strength and yield strength than titanium
(860 MPa and 795 MPa respectively). However, these alloys are less used because of
their corrosion resistance, which is lower than that of commercially pure titanium. Figure
8 shows some properties that make commercially pure titanium a desirable material for
orthodontic implants (Figure 15).
Figura 15. Data sheet of commercially pure Titanium (F16)

Strategies to reduce bacterial adhesion over dental implants
38
Despite the great success of titanium as a material used in these types of implants, a
growing interest in metal-free, non-metal dental materials emerged recently.
Ceramic materials have a reduced tendency to corrosion, they are also relatively inert and
have low solubility; they have good resistance to temperature and low electrical
conductivity. Besides, the use of titanium may be a disadvantage with regard to aesthetics
if a thin layer of gum occurs, a problem that could also be accentuated locally by the
reactions of the soft tissue with titanium. Ceramic materials, instead, do not present this
aesthetic issue. (46) Table 7 shows the materials used mainly for the various parts of a
dental implant:
2.4. Issues with perimplant soft tissue
Dental implants, among all types of medical implants, are the only ones that can create
two interfaces: one with the bone and the other with the gums. Maintaining both interfaces
is essential for the goodness and durability of the implant. The gingival epithelial tissue,
at the point where the natural tooth emerges from the bone, forms a barrier between the
inner and outer environment. The tissue must then be regenerated around the neck to
protect the underlying connective tissue, thus preventing mobility and worse, detachment
of the implant. (50) The adhesion of the soft tissue, i.e. the gingiva, to the collar of the
dental implants is an underdeveloped problem, unlike the adherence of the bone tissue to
the threaded part of the implant, however, is a key point to ensure the success of the
implant. In addition, as can be seen in Figure 16, both bone tissue and soft tissue
developing around a dental implant are different from the configuration around the natural
tooth (Figure 16).
PART OF IMPLANT MATERIAL
Implant Titanium Zirconia
Abutment
Titanium Ceramic
Prosthesis
Metal-Ceramic Ceramic
Gold
Table 7. Material used for specific part of implant (T4)

Strategies to reduce bacterial adhesion over dental implants
39
Figura 16. Comparison between pre - and post - implant tissue. (F17)
In natural teeth the continuity between epithelium, connective tissues and tooth is
guaranteed by the basal lamina, which connect the dental enamel and the epithelium
adhering to the natural tooth. These structures are missing in tissues close to dental
implants. (51) Another fundamental difference between periodontal and perimplantary
tissues is the soft tissue anchoring, in fact, while the periodontal mucosa is attached to the
tooth by means of collagen fibers inserted into the supra-crestal portion of the root, the
mucosa around the implant does not possess this anchor type. One possible consequence
of this absence is the mucosa detachment from the surface of the implant. (52) In addition,
peri-implant epithelium has less ability to act as a defense mechanism than the natural
junction epithelium. For these reasons, dental implants require the use of a biological
closure system to inhibit epidermal degradation and bacterial colonization on the
subepithelial connective tissue and the interface with the implant. Usually, the surfaces
in contact with the soft tissue are kept smooth to discourage bacterial adhesion, while
physical closure is obtained by the contraction of the fibrous connective tissue, which
occurs during the wound healing process. However, the formation of a fibrotic capsule
on the smooth surface may not be sufficient to ensure the biological closure required to
inhibit septic decline. (51) The soft tissue collar surrounding the dental implants is
considered a critical point for the protection of the bone-implant anchorage, in fact this
soft tissue region has to replacing the gum in the role of defense of the periodontium. (53)

Strategies to reduce bacterial adhesion over dental implants
40
Franco Bengazi et al. evaluate how the position of the margin of recession of the gum
changed over a period of 2 years after the implantation of a fixed prosthesis. The results
shown that recession of soft tissue occurs during the first follow-up phase, i.e. in the first
six months of the implant. In addition, recession of the soft tissue is correlated with the
initial height of this tissue, which increases as the initial height increases, but is not
influenced by the quality or mobility of the perimplant mucosa. (52) It is essential to
prevent this soft tissue recession as it may lead, in addition to aesthetic issues, to loss of
support tissue, loss of osteointegration and failure of the whole implant. In this regard, it
is important to investigate the role of the topography of the plant in preventing this
problem. A 2011 study shows that the anodizing of the top of the collar provides a smooth
surface, the which reduces the deposition of dental plaque and hence prevents tissue
recession. However, the bottom of the collar should be micro-threaded to counter bone
resorption, in accordance with Wolff's law, and to increase the shear strength and
optimize the stability of the implant. (54) The above studies introduce the importance of
locating the correct topography of the plant to ensure that it is as durable as possible. In
particular, we will focus on the surface topography of the collar and its effects on the
integration of gingival tissues. The affected cells are fibroblasts, as the parodontal tissue
is mainly composed of gingival fibroblasts and periodontal ligament fibroblasts. It is
desired that fibroblasts do not adhere and proliferate rapidly in the endosseous area of the
implant to avoid the fibrous encapsulation of the dental envelope which would cause the
plant to detach itself. (55) A different tissue response and consequently a reduced bone
loss is observed when applying the concept of platform switching. It consists of using a
lower diameter abutment than the diameter of the implant's neck and an extremely precise
Morse cone connection that greatly reduces the gap between the components of the
implant. (56)

Strategies to reduce bacterial adhesion over dental implants
41
2.5. Bacterial loading issue
Infection represents one of many factors contributing to the failure of dental implants.
Presently, no single micro-organism has been closely associated with colonization or
infection of any implant system. Failing dental implants are associated with a microbial
flora traditionally associated with periodontitis. (43). The microbial complex in the oral
cavity is called biofilm. Biofilm formation is a multistage process. Saliva give the major
source of nutrients to the bacteria. The thin film covering the tooth called as acquired
pellicle is derived from the salivary proteins and covers the enamel within seconds after
brushing. Proteins and the glycoproteins are the molecules binding implant to the tooth
surface. These molecules primarily act to promote the adhesion and coaggregation of the
oral bacteria. The bacterial adherence to the pellicle is facilitated specially by the lectins
present on the bacterial cell surface. Further intercellular bacterial adhesion and secretion
of the extracellular polysaccharides, form the multilayered bacterial colonies suspended
in the polymer matrix. Slow aggregation of the bacterial colonies leads to the formation
of the multilayered cell clusters in the polymer matrix. (57) The colonization process of
the surface by bacteria needs 4 hours. This process starts by the Streptococci. The
planktonik bacteria take the aid of their receptors to bind to the cell surfaces of the initial
colonizing bacteria and finally on to the tooth surface. This bacterial cell to cell reaction
that occurs or the coaggregation happens to be an important mechanism leading to the
bacterial colonization and dental biofilm formation. Secondary colonizers bind to the
bacteria predominantly comprising of the Actinomycesspecies, S. mutans, S. sobrinus.
The bacteria multiply and co aggregate with the partner species. Fusobacterium
nucleatum has the property to co-aggregate with multiple bacteria hence this species is an
important link in the dental biofilms bridging the early and the late colonizers. (58) The
oral bacteria thrive for their nutrient supply from saliva, gingival crevicular fluid, sugar
rich food metabolic products of other bacteria, and food debris. The plaque begins to
behave as a complex microorganism with an inherent “circulatory system.”. Metabolic
products and evulsed cell wall constituents (lipopolysaccharides, vesicles) activate the
host response. Specialized cell-cell communication is exhibited by the bacteria that
coordinate the gene expression. This communication is passed on as signals. Bacteria
sense the changes in the local environment (cues) and receive the information of the
adjacent population. Specific interspecies communication within the biofilms is mediated
through the metabolic exchange, genetic exchange, and the quorum sensing. Quorum

Strategies to reduce bacterial adhesion over dental implants
42
sensing is genetically governed chemical communication among bacteria in response to
cell density and influence several functions of the bacteria, e.g., virulence, acid tolerance,
and the biofilm formation. (59)
The oral bacteria produce two specific signaling molecules:
Gram-positive bacteria communicate via small diffusible peptide channel called
as “Competence Stimulating Peptides (CST) and AI-2.” AI-2 (autoinducer-2) is a
popular signaling molecule exhibited by both gram-positive;
Gram-negative bacteria responsible for the quorum sensing. (60)
The biofilm acts as a barrier for the bacteria against host immunity and the antimicrobial
agents. The anaerobic microflora succeeds to occupy the subgingival environment
gradually as the plaque starts maturing. Supra-gingival plaque sets up the stage for the
disease process of gingivitis and the subgingival microbial colonies advance the gingivitis
to an established form of periodontitis. Thus, a transition is observed from a
predominately Gram-positive non-motile, aerobic and facultative anaerobic composition
towards a flora with a greater proportion of Gram-negative, motile, anaerobic bacteria. If
this predominates for significant time periods, then peri-implantitis and eventual implant
failure may occur. (61)

Strategies to reduce bacterial adhesion over dental implants
43
Table 8. Summary of studies investigating microbiology of failing implants (T5)
Table 8 highlights studies investigating the microbiology of failing implants.
Interestingly, micro-organisms not usually associated with periodontitis or dental
abscesses such as staphylococci, coliforms and Candida spp. are commonly isolated from
peri-implant lesions in some studies. Staphylococci are present within the oral cavity and
their isolation from peri-implant infection is significant as both Staphylococcus aureus
and coagulase-negative staphylococci are frequently responsible for infections associated
with metallic biomaterials and medical infections in general. (62) More recently,
Staphylococcus aureus has been demonstrated to have the ability to adhere to titanium
surfaces. This may be significant in the colonization of dental implants and subsequent
infections. (43) There are few published guidelines on infection control during the
placement of dental implants. Those available advocate that the surgical field should be
isolated and free of contamination.

Strategies to reduce bacterial adhesion over dental implants
44
This is clearly not readily achievable within the oral cavity. However, it has been
elucidated that contamination of the operative site by patient’s saliva does not preclude
success. Additionally, no significant differences were found in osseointegration success
rates for implants placed under controlled operating conditions compared to a less
environmentally controlled dental school clinic. This may imply that the operative
environment is not as critical to the success of dental implants compared to implant
placement within other body sites. Several strategies to reduce contamination from the
oral flora during surgery have been postulated. One such strategy involves rinsing pre-
operatively with chlorhexidine as this may reduce microbial complications following
implant placement. During the surgical procedure, the implant should be stored in the
manufacturer’s sterile packaging and only used in conjunction with the recommended
instruments. Previously, the drills used for bone preparation were not designated single
use and were decontaminated according to local protocols. Manufacturers are gradually
introducing single-use drills for use with their implant systems. (43)

Strategies to reduce bacterial adhesion over dental implants
45
3. PLATFORM SWITCHING The “platform switching” is a concept that has only recently been introduced in clinical
practice which refers to a simple and effective way to control circumferential bone loss
around dental implants. By altering the horizontal position of the microgap, the horizontal
component of bone loss after abutment connection can be reduced. (63) This implant
shape refers to placing screwed or friction fit restorative abutments of narrower diameter
on implants of wider diameter, instead, to placing abutments of similar diameters, which
refers to as "platform matching". The benefits of platform switching have become the
focus of implant-related research with increasing frequency. Numerous peer-reviewed
articles and recent systematic reviews have revealed that platform switching can be
considered a means of preventing initial peri-implant bone loss. (64) It has been observed
that some degree of bone resorption occurs at the crest of bone following implant
placement. Bone resorption around the implant neck depends on both biological and
mechanical factors such as surgical trauma to the periosteum, characteristics of the
implant neck design, prosthetic components, size of the microgap between the implant
and abutment, bacterial colonization of the implant sulcus and imbalance in host parasite
equilibrium. (64) The remodeling of crestal bone occurs in response to the stress that
develops between the neck of an implant system and cortical bone. Since cortical bone is
65% more susceptible to shear forces than compressive forces, the bone loss may be
explained by the lack of mechanical stress distribution between the coronal portion of the
implant and the surrounding bone. Peak bone stress that appear in marginal bone have
been hypothesized to cause bone microfracture and may be responsible of the peri-
implant bone loss after prosthetic loading. Prevention of horizontal and vertical marginal
peri-implant bone resorption is fundamental in maintaining stable gingival levels and
profiles around implant-supported restorations. Reduced stress in the coronal portion
helps to prevent crestal bone loss. Also, the extent of bone resorption is related to both
the surfaces of the implant and abutment and the morphology of the implant-abutment
junction (IAJ). The IAJ is always surrounded by an inflammatory cell infiltration and to
protect the underlying bone from this microbiologic invasion, healthy connective tissue
is needed to establish a biologic seal comparable to that around natural teeth. Thus, the
current theory of the benefit of platform switching is related to the physical repositioning
of the implant-abutment junction away from the outer edge of the implant and the

Strategies to reduce bacterial adhesion over dental implants
46
surrounding bone, thereby containing the inflammatory infiltrate within the width of the
platform switch (Figure 17). (65)
(a) (b)
Figure 17. Traditional connection (a) vs Platform Switching (b). (F18)
Lazzara et all. define in two different publications Platform Switching as "The coupling
of an implant with a small diaphragm component with the gradient of 90° between the
two parts". This "abnormal" coupling seems to reduce peri-implant bone resorption. The
discovery was casual and was born following the introduction of wide implants types on
the market, replacement of failed implants, which were protected with standard
components. (66)
Despite the recent discovery of a literature review, it was found that already in 1992 were
recorded clinical cases of prosthetic abutment with a smaller diameter.
Wagenberg et all. carried out a prospective study on 94 Plants with Switch platforms, the
results show that 88% of the total 94 plants with bone loss below 0.8 mm appear very far
from 1.5 mm recommended by Smith and Zarb. (67)
Rodriguez in 2009 conducted a prospective study by placing restored plants according to
the concept of platform switching at a distance less than 3 mm, while with the traditional
method the minimum intrusion distance to allow a bone peak greater than or equal to 0.4
mm is 3.5 mm. In the case of the switch, an average vertical re-absorption rate of 0.62
mm is obtained and a horizontal re-absorption rate of 0.60 mm, with a mean bone peak
higher than the line of the two implants of 0.24 mm. (68)

Strategies to reduce bacterial adhesion over dental implants
47
Yu et all. conduced a short-term clinical study on 78 prostheses, implanted with platform
switching and with average follow-up of 11.8 months from surgery and 7.4 months from
prosthesis. The implants showed a 100% survival with a bone remodeling of 0.16 mm
and with a standard variation of 0.8 mm or less. (69)
Despite rapid grownth of body of evidence with regard to platform switching, further
substantiation with experimental and clinical outcomes with larger sample size and longer
follow-up periods is still needed to determine the viability of this technique. More
accurate long-term studies with more relevant number of patients are required to allow
proper conclusions related to soft and hard tissue reaction to this alternative restorative
protocol. (64)
The clinical relevance of platform switching concerns:
Increased biomechanical support;
Effect on soft tissue esthetics around dental implants;
Effect on crestal bone stress levels in implants with microthreads. (64)
Several hypotheses have been made to explain this phenomenon and protection against
crestal bone by platform switching:
I. Mechanical theory indicates greater stress on the entire surface of the neck in the
traditional implant, while in the one with platform switching the stress zone moves
to the center of the implant and not to the peripheral area;
II. Bacterial-inflammatory theory predicts that the infiltrate on the abutment-implant
junction will be moved horizontally towards the center of the implant, thus
moving away from the adjacent crestal bone. (56)

Strategies to reduce bacterial adhesion over dental implants
48
4. MORSE TAPER CONNECTION The mechanical stability of the implant-abutment connection is an important issue in
modern implantology although the problems surrounding implant-attachment remain
unsolved. At present, most commonly used systems for fastening the abutment on the
implant involve screw connections. In these systems, the effectiveness of the
consolidation of the interface between the abutment and the implant depends on the
preload of the screw, which is generated by applying a specific torque during the
installation. Maintenance of screw tightening is accomplished when the force, exerted by
the abutment screw exceeds the separating forces generated by occlusal contacts acting
on the assembly. However, dynamic loading forces, during physiologic functions, that do
not exceed the maximum resistance of an implant–abutment connection or even that are
far below, can loosen the implant– abutment connection gradually or make it fail suddenly
because of fatigue. Furthermore, in case of exceeding the preload, eccentric occlusal loads
can lead to plastic deformation of the screw. The immediate consequence of these
phenomena is the occurrence of mechanical complications, such as the loss of connection
between implant and abutment. These complications are a biologic issue because
micromovements at the implant–abutment interface can stimulate crestal bone resorption.
To overcome these difficulties, implant manufacturers have introduced different systems,
adopting screw-type internal connections. The most recent screw-type connections with
an internal hexagon are now associated with various forms of taper. Morse Taper
implant–abutment connection is based on the principle of ‘‘cold welding’’ obtained by
high contact pressure and frictional resistance between the surfaces of the implant and the
abutment. This type of connection, depending on the taper angle, can have different
mechanical characteristics, in terms of fatigue strength (due to the presence of cyclic
applied loads, i.e. mastication), and a different degree of mechanical coupling with the
bone in which the connection itself is inserted. For example, the connection is defined as
‘‘self-locking’’ if the taper angle is less than 5°. Recent studies have clearly demonstrated
that the morse taper implant–abutment connection can resist eccentric loading complexes
and bending moments, ensuring an absolute mechanical stability and significantly
reducing the incidence of prosthetic complications at the implant–abutment interface
(Figure 18). (70)

Strategies to reduce bacterial adhesion over dental implants
49
Figure 18. Drawing of an implant with a cone Morse taper interference–fit locking taper combined with an internal
hexagon. The Morse taper presents a taper angle of 1.5°. (F19)
Therefore, implant systems differ in terms of the geometry of the implant–abutment
interface with particular differences between both conical and nonconical connection
systems. The implant–abutment connection represents the weakest point of dental
endosseous implant fixtures, as it must constantly resist to masticatory forces as well as
penetration by bacteria. The formation of a marginal gap between the implant and
abutment might lead to increased loss of marginal bone because of the penetration of
bacteria into the implant–abutment interface, i.e. compared to an implant without a gap
that permits bacterial invasion. It has been claimed that, with conical implant–abutment
connection systems, is not so high the risk as the gap is much smaller with less leakage at
the implant–abutment interface (71), retarding or preventing bacterial colonization.
However, there are no endosseous dental implant systems that can provide a complete
seal at the implant–abutment interface and so this is still an important clinical issue.
Regarding the mechanical properties of implant connections, it has been assumed that
different abutment connections might provide greater resistance to displacement that is
caused by excessive occlusal forces. In this regard, it has been speculated that this
displacement will increase stress/strain on the endosseous implant promoting the
acceleration of marginal bone loss. (72) Clearly, at this time, it is unknown as one
connection system currently available might be superior to others. To focus more
specifically on the performance of conical morse taper implant–abutment connection
systems and to compare them with each other and with implant systems with non-conical

Strategies to reduce bacterial adhesion over dental implants
50
interfaces, to determine whether there might be improved clinical outcomes with one of
these systems. (73) Table 9 shows the study characteristics and outcomes for in vitro
studies regarding the seal performance, specifically eight trials that examined the bacterial
leakage of the implant–abutment interface.
Table 9. Summary of trials that examined the bacterial leakage of the implant–abutment interface_Part 1

Strategies to reduce bacterial adhesion over dental implants
51
Table 9. Summary of trials that examined the bacterial leakage of the implant–abutment interface_Part 2

Strategies to reduce bacterial adhesion over dental implants
52
5. SURFACE MODIFICATION FOR ABUTMENT TO REDUCE BACTERIAL
LOADING Titanium is considered by the medical and scientific community as gold standard for
dental implants, as it demonstrates excellent biocompatibility and osteointegration
properties. However, it is influenced by surface morphology and peri-implant infections
that can affect both the implant and the outcome of long-term bone osseointegration. It is
possible to reduce the bacterial contamination on the abutment portion by acting on the
surface.
There are different strategies that can be exploited for this purpose:
The creation of a coating that on one hand, adheres to the surface of the implant
and, on the other hand, once the prosthesis has been inserted in the oral cavity
environment, it is able not only to withstand environmental conditions, but also to
perform an antibacterial action preventing, for example, bacterial adhesion along
the whole coating. Therefore, the chemical composition of a coating on implant-
abutment junction surface (IAJ) should have a key role in preventing bacterial
infection; (74)
The modification of the geometry of the internal connections and abutment
interface, which are parts of the prosthesis, usually more susceptible to bacterial
contamination, as they promote the formation of an ideal micro-environment for
bacterial adhesion. In this case, an uncoated, commercially pure titanium surface
is obtained, which not only improves the adhesion of soft tissues and fibroblasts,
but also reduces bacterial colonization at the interface.
Lauritano et al. (74) tested in an in vitro model a new antimicrobial polysiloxane coating
functionalized with chlorexidine digluconate (PXT) in order to evaluate its effectiveness
in reducing bacterial loading inside and outside IAJ. The PXT product provided by
Edierre, is composed by an alcoholic solution containg polysiloxane-titanate oligomers
and chlorexidine digluconate at 1%. The product has the ability of binding the titanium
surface via interaction of the OH functionalities present on the polysiloxane chains and
at the titanium surface. The role of the alkyl chains presents on the siloxane units consist
of trapping through Van der Waals interactions chlorhexidine molecules, allowing their
slow release while in contact with an aqueous medium. Coating of the internal chamber

Strategies to reduce bacterial adhesion over dental implants
53
of the implants was realized by filling with the PXT solution, followed by draining and
implant heating at 60°C for 45 min. Coating of the abutments and screws was realized by
immersion in the PXT solution followed by centrifugation on a sintered glass filter and
subsequent heating at 60°C for 45 min. The microbial species used are Staphilococcus
aureus, ATCC 6538, Pseudomonas aeruginosa, ATCC 15442, Escherichia coli, ATCC
10536 and were cultured in lysogeny broath (LB) containing both Kanamycin and
Ampicillin (50ug/ml both) at 37°C for 24h in a shacking incubator. A first preliminary
microbiological test on ten implants coated with PXT was performed by contaminating
the internal implant chambers with 20μl of a microbial pool constituted by:
Staphilococcus aureus, Escherichia coli, Pseudomonas aeruginosa, at the concentration
level of 1–5 × 10⁶ ufc/ml.
After 15 minutes of contact, development in LBA (Luria-Bertani Agar) and incubation at
37°C for 24h, the developed colonies were counted. On the remaining ten implants treated
with PXT, twenty microliters of sterile culture medium with antibiotics (kanamycin and
ampicillin, each at 50ug/ml) were placed in the internal chamber of each implant, the
abutments were screwed at 35 newton and fixtures placed in plastic tubes. After this time,
the capsule was examined evaluating the colonies proliferation (figure 19).
Figure 19. Left, control plate seeded with 20μl of the microbial pool after incubation. Right, Petri with the coated
implant after contamination and incubation showing absence of colony forming units. (F20)

Strategies to reduce bacterial adhesion over dental implants
54
Figure 19 shows the complete absence of colonies in the treated sample for all the coated
implants, with respect to the control plates in which a 20μl amount of the same microbial
pool were seeded in the Petri dishes. In the microbiological evaluation, no living bacteria
were detected in the internal part of the treated implants as well as in the external culture
medium. Covering IAJ surfaces with coatings by adding biomimetic bioactive substances
to improve its biological characteristics has been recently investigated. Modifications of
IAJ using various strategies aim to improve prevention of bacterial infection and promote
faster healing times. These aspects are important in modern dentistry, since immediate or
early loading has become a predictable treatment protocol. Moreover, coating IAJ
surfaces with cell-adhesive proteins, improves cells attachment, proliferation, and
activity. (75) The results demonstrate that the applications of the PXT antimicrobial
coating to the IAC surface prevents the bacterial growth inside the implant chamber,
eliminating thus one of the possible cause of infection, with differences between treated
and untreated samples which are statistically significant. The microbiological
experiments show that in the internal part of the implants bacterial growth is not observed.
The external culture medium behaves similarly, this can be interpreted as a consequence
of the contact between the culture medium and the abutment treated with the antimicrobial
PXT which can release during the 48h of immersion the active species chlorhexidine.
Furthermore, PCR analysis shows that in 48 h only 0.3% ca of the bacterial contaminating
the external of the implant-abutment junction penetrates the internal implant chamber and
is then completely inactivated, as demonstrated by microbiological tests. In summary,
this study has clearly demonstrated that the new coating determines a remarkable
reduction of bacterial loading inside and outside IAJ, becoming a very useful medical
device in preventing peri-implantitis which are the main cause of failure in implantology.
(74)
Nassar et al. (76) evaluate the bacterial leakage of two different internal implant abutment
connections in vitro. The amount of bacterial colonization between the implants and
abutments depends on the fit accuracy between the fixture and abutment, their tightening
torque and micromovements between the connected components during mastication.
External and internal connections, such as hexagonal, Morse taper or a combination of
both, are generally the most commonly used connections.

Strategies to reduce bacterial adhesion over dental implants
55
The internal implants abutment connection is reported as being more favorable to the
infiltration of fluids than other joints. The microgap in this implant design varies from 1
to 49 µm, depending on the type of abutment that is selected. Biologically small
molecules like toxins and molecular constituents of the bacterial wall are responsible for
inflammatory reactions. It is well known that endotoxin, a small molecule complex of
lipopolysaccharides and proteins, is one of the most important toxins of gram-negative
bacteria and plays a major role in bone destruction processes. (77) Twenty dental implants
of titanium alloy-resorbable blast textured (rbt) body 4.0x12 mm (BioHorizons Implant
Systems Inc.) were divided into two equal groups and compared basing on their fixture
abutment interface microgap geometry. Group 1, fixtures with an internal hexagonal
geometry connected to standard straight abutments with a height of 6 mm; Group 2,
fixtures with a tri-lobe internal connection were connected to 3-mm high abutments
(Figure 20).
Figure 20. Internal hexagon connection on the left and tri-lobe connection on the right. (F21)
A bacterial suspension of cultivated Staphylococcus aureus was prepared in brain heart
infusion (BHI) broth and incubating it for 24 h at 37°C. The abutments were carefully
connected to the implants according to the manufacturer's instructions.
All implant-abutment assemblies were firstly submerged in sterile BHI broth to determine
whether there was any external contamination and then incubated at 37°C for 14 days.
After this time, all implant-abutment assemblies were submerged in sterile tubes
containing 4 mL of S. aureus broth culture and were incubated at 37°C for 14 days. The
specimens were removed from the test tubes using sterile pliers, immersed in 70% alcohol
for 3 min to prevent external contamination, and dried with sterile gauze. After
disassembling of the specimens, the inner surfaces of the implants were sampled by sterile

Strategies to reduce bacterial adhesion over dental implants
56
paper points for bacterial contamination. Then, the paper points were immersed in test
tubes containing sterile BHI broth, from which culture was done on blood agar plates and
incubated at 37°C for 24 h. Thereafter, the resulting colonies were identified by Gram's
stain and biochemical reactions. The incidence of loads and unscrewing of the prosthetic
abutment can increase infiltration, whereas optimal adaptation, minimal micromovement
and exceptional prosthetic and occlusal planning are factors that can minimize
microleakage. (78) Current implant systems cannot completely prevent microbial leakage
and bacterial colonization of the inner part of the implant. The penetration of oral
microorganisms through the implant abutment interface may produce soft-tissue
inflammation and constitute risk to the clinical success of the implants. Loading forces
on implants may also contribute to the bacterial colonization of the fixture abutment
interface microgap. In summary, bacterial leakage seems to be unavoidable but fixture
abutment interface geometry plays an important role in the amount of leakage. Tri-lobe
internal connection showed less amount of bacterial leakage than internal hexagonal
connection under static condition. Several in vitro studies have described the occurrence
of bacterial leakage along the implant-abutment interface of systems with different
internal connection designs in static or dynamic loading conditions. (78)
Steinebrunner et al. (79) evaluated in an in vitro experiment the bacterial leakage along
the fixture abutment interface microgap using loading forces and discovered statistically
significant differences between five implant systems with respect to the number of
chewing cycles and bacterial colonization.

57
CHAPTER III
TOPOGRAPHIC MODIFICATION TECHNIQUES AT THE MICRO AND NANO SCALES
1. GENERAL FEATURES Surface topography of a material to be treated can be modified by mechanical machining,
chemical patternings or even electric fields. After processing, the material will form
surface waves, known as capillary waves, as a result of the inherent entropy of the system
balancing the increased energy of the greater surface area. (80) Biological interactions
with a surface have also been found to depend on its topography. A good review of the
topological control of cell adhesion and activity on a surface has been made by Curtis and
Wilkinson (81). Such considerations are relevant for a number of in vivo and in vitro
applications, such as biological sensors, hip replacements, and more complex tissue
implants such as replacement bone, where the growth of cells within the artificial
structure is to be encouraged. The larger scale topography was found to lead to less
favorable spheroidal cells that formed fewer intercellular connections. In some cases, the
topography of a surface may be carefully controlled to promote cell adhesion and to
reduce the bacterial one. (82) Already by the beginning of the 1980s, surface structure
was identified as one of the six factors particularly important for implant incorporation
into bone (83), a statement that has been confirmed in later published research. Faster and
stronger bone formation may provide better stability during the healing process, thus
allowing more rapid loading of the implant. For many years, the Branemark implant was

Topographic modification techniques at the micro and nano scales
58
considered the gold standard for implant surfaces, its surface was machined with a turning
process with specific topographical properties such as anisotropy and a rather small
average height deviation. However, a machined surface can actually be turned, electro
discharged, end milled, ground, sandblasted, fly cut, bored, slap or polished, to mention
just a few techniques (84). Such surfaces have very different topographies and different
machining methods can be detected due to differences in the topographical appearance.
In oral implant research, machined surfaces have been used synonymously with a
Branemark turned implant without a particular turning process applied for this particular
implant. Thus, very different surfaces have been used as ‘machined’ controls when
investigating new and rougher surfaces. An increasing number of surface modifications
are introduced and despite the comparison with ‘machined’ surfaces with new rough
surfaces, it is not clear whether, in general, one surface modification is better than another.
Moreover, not only is surface topography changed with many techniques but also surface
chemistry and both result in a change in the chemistry and vice-versa. Albrektsson &
Wennerberg (2004) suggested smooth surfaces to have an Sa value of 0.5 µm; minimally
rough surfaces were identified with an Sa of 0.5-1 µm, moderately rough surfaces with Sa
1-2 µm, and rough surfaces with an Sa of 42 µm. (85)
2. TOPOGRAPHIC TECHNIQUES ON DENTAL IMPLANTS Moderate micron-scale (1.0-2.0 µm range) topographic modification of the cp Titanium
surface is generally accepted in the endosseous dental implant market place. (86) The
belief that micron-level surface topography results in greater accrual of bone at the
implant surface is supported by some clinical evidence. (87) Today, a growing aspect of
endosseous implant surface research is focused on further enhancing the activity of bone
forming cells and limiting adhesion of bacteria at the tissue implant interface. Current
trends in clinical dental implant therapy include use of endosseous dental implant surfaces
embellished with nanoscale topographies. Nanotechnology offers engineers and
biologists new ways of interacting with relevant biological processes. Moreover,
nanotechnology has provided means of understanding and achieving cell specific
functions. Implant surface character is one implant design factor affecting the rate and
extent of bacterial adhesion, soft tissue attachment and osseointegration. Nanotechnology
has been defined as ‘‘the creation of functional materials, devices and systems through
control of matter on the nanometer length scale (1–100 nm), and exploitation of novel

Topographic modification techniques at the micro and nano scales
59
phenomena and properties (physical, chemical, and biological) at that length scale’’,
moreover, nanotechnology involves materials that have a nano-sized topography or are
composed of nano-sized materials. These materials are also classified according to their
form and structure as nanostructures, nanocrystals, nanocoatings, nanoparticles, and
nanofibers. Application of nanotechnology to the dental implant surface involves a two-
dimensional association of surface features, i.e. across and away from the mean surface
plane (Figure 21). (88)
Figure 21. Nanoscale surface modification. (A) Self-assembled monolayers (SAMs) can change the topography and
chemistry of a surface to impart novel physical and/or biochemical properties. (B) Deposition or chemical modification
techniques can apply nanoscale features in nanoscale distribution. The cell response to surfaces represented by (B) or
(C) may be different. (D) Isotropic surfaces can be created in the nanoscale (x < 100 nm) by subtractive or additive
methods. The distribution can be in either the nano- (y) or micron-scale (y’). It is thought that some nanosurfaces
mimic natural cell environments. (F22)
These nanofeatures can be arranged in an organized or unorganized manner, also defined
as isotropic or anisotropic respectively, often depending on the method of manufacture of
the surface topographies that have been applied to a dental implant surface. The
topography is often characteristically anisotropic, instead, isotropic features such as
nanogrooves or nanopits that are created largely by optical methods are predominantly
applied to complex screw shaped objects. When these concepts are applied to the
endosseous implant surface, implied is the embellishment of the surface with nanometer-
scale features that lead to novel physicochemical behavior, e.g. bone bonding, or
biochemical events, e.g. altered protein adsorption, cell adhesion with changes in cell
behavior and bacterial adhesion. Nanoscale modification of the titanium endosseous
implant surface may affect both the topography as well as the chemistry of the surface.

Topographic modification techniques at the micro and nano scales
60
(88) Recent studies have shown that the best implant–body interface adherence is
observed for hybrid micro–nano and multi-modal surfaces, with conclusion that
roughness in few micrometer range favors strength of prosthesis–body interlock. The
classic Ti modifications encompass mechanical sandblasting, acid etching, anodization
and plasma spraying, which allow for cleaning, alter chemical composition and surface
topography. The main complication of the surface treatments listed above is their
propensity to contaminate the substrate material. This problem can be reduced by non-
contact surface modifications like laser roughening techniques. Previous laser
modificationreports supply promising results. Chen et al. (89) showed that the
combination of laser micro grooving and the chemical functionalization improves
implant–bone adherence and accelerate osteointegration.
Branemark et al. (90) noticed 250% increasement in removal torque of laser modified
prosthesis relative to standard machined surface. Improvement in the surface-tissue
interlock is assigned to the roughness modification as well as the creation of thicker oxide
structures (91). Despite positive results, conventional laser technologies are limited to
formation homogenous instead of controlled multimodal topography with nano- and
micrometer components. (92)
2.1.Laser Welding
Laser Welding (LW) is a non-contact process which requires access to the weld zone
from only one side of the parts being welded. The laser weld is formed as the intense laser
light rapidly heats the material typically calculated in milliseconds. Three type of laser
welds can be achieved with laser welding: conduction, conduction/penetration and
penetration or 'keyhole.' Conduction welds are performed at low energy, resulting in wide,
shallow weld nuggets. Conduction/penetration welds utilize a medium energy density and
result in a deeper weld nugget. Penetration or keyhole welds are resultant of direct energy
delivery into the material being welded resulting in deep, narrow nuggets. As laser
welding is a non-contact process, there are many joint geometries that can be welded, but
there must be a close fit-up at the joint interfaces. Laser welders can join a wide range of
steels, nickel alloys, titanium, aluminum, and copper. As with other joining technologies,
some materials are difficult to laser weld unless they meet specific characteristics,
namely, reflectivity, the effect of high thermal cycling, and the vaporization of volatile

Topographic modification techniques at the micro and nano scales
61
alloying elements. With laser welding, it is possible to join parts by self-welding of the
metal components themselves. Laser welding causes changes to the microstructure of
NiCrMo and CoCrMo cast alloys due to the rapid heating and solidification processes.
Cracks appeared in the welded area due to thermal residual stresses during the welding
stage and/or changes in microstructure that affect the quality of the welded parts. The
influence of laser beam quality, power and other physical parameters on the penetration
depth of metals has been researched primarily for industrial purposes. Specific data
relating to the choice of laser parameters to weld dental alloys successfully, to enhance
laser penetration and to avoid surface damage are lacking in the literature. Parameters due
to the operator are: dexterity, eyesight (has an influence on the adjustment of the laser
beam focusing) and knowledge (concerning the possible disfunction of the machine).
Physical parameters are: power and pulse duration of the laser radiation to determine the
best settings to improve the beam’s penetration depth and ensure success in the welding
procedure (function of the wire diameter and thermal conductivity of the alloy). After the
melting, the alloy exhibits large grains (Figure 22). Due to these modifications in the
microstructure, the welded area is softer (HV 0.1=290) than the non-welded alloy (HV
0.1=410). The change in the hardness of the welded area is due to the re-crystallisation of
the alloy. Various surfaces have been optimized and patented by companies using the
techniques outlined, such as laser lock from biohorizon, Synthegra by Geass. (93)
Figure 22. Microstructure of the wire: Interface between the welded and non-welded area. (F23)
P. Kwasniak et al. (94) used two-step functionalization of Ti grade 2 surfaces. The
employed methods include initial chemical etching and direct laser interference
lithography (DLIL) technique which is based on the interference of two laser beams. The
surface treatments were performed on semi-finished industrial products—sheet with
thickness of 1 mm and 0.3 mm diameter wire to investigate the effect of curvature on

Topographic modification techniques at the micro and nano scales
62
surface architecture. The obtained structures were characterized in terms of shape,
roughness, chemical composition, mechanical properties and microstructures of substrate
material. The first step consists of chemical treatment of Ti to remove oxide,
contamination and smoothing surface defects remaining after previous plastic
deformation during samples preparation. In all the cases, fluoridrid acid is used to dissolve
TiO2 thin films. The second step consists of manufacturing of periodic surface
topography, executed with DLIL, using lasers with large power density (from MW/cm2
to GW/cm2). This method allows for forming micro- and sub-micrometer structures with
well-defined large range ordering. Direct laser interference lithography method was used
to produce periodic and striated Ti surface. Such configurations allow for fast fabrications
of 1 cm2 square periodic structures. The laser surface functionalizations were running on
air atmosphere using previously etched samples and energy density in range 400–600
mJ/cm2.
Figure 23. Chemical composition of the Ti plate surface: (a) after chemical etching, (b) after DLIL surface
modification (400 mJ/cm2); (energy dispersive spectroscopy linear scan) (F24)
Figure 24. Sample ridge shape profiles acquired from optical profilometry of place modified using DLIL technique
(400 mJ/cm2) (F25)

Topographic modification techniques at the micro and nano scales
63
The conclusions arising from investigation carried out, can be listed as follow:
DLIL technique employed to Ti grade 2 allows for obtaining hierarchical surface
composition with multimodal roughness in 10-500 nm scale;
Clean and smooth surface is obtained directly after etching of semi-finished
industrial products;
Chemical composition of created surface striations, indicates gradient distribution
of oxygen concentration which is the effect of short-lived, high temperature
phenomena, local melting, sublimation and condensation (Figure 23);
Interaction of laser beams with substrate forms the 0.6-1.5 µm thick, continuous
layer consisting of nanograins which improves hardness of Ti (Figure 24);
DLIL method does not modify original macro topography and can be applied for
modification of the flat and curve Ti surfaces. (94)
Alkhodary et al. (95), utilized laser direct writing to produce 10 microns wide uniform
grooves on the surface of Ti-6Al-4V dental implants (prosthesis and neck), and the tri-
peptide RGD coating to produce a micro-mechanical and a chemical union with the
tissues around the implant-crest module and minimize crestal bone loss. By controlling
the size of laser machined grooves, cells can be induced to grow into the grooves and
orient themselves accordingly. This phenomenon is known as contact guidance and can
be used to regulate where bone grows, and ultimately, what sort of bone develops. This
spatial and material control means that isotropic and anisotropic properties can be
controlled. Moreover, there is evidence that suggests that the groove geometry plays a
role in determining what sort of tissue develops. For instance, 10 microns grooves are
thought to induce bone stem cells to differentiate into cortical bone. In biological terms,
RGD is a cell adhesion receptor molecule that interacts with membrane bound talin and
vinculin proteins to promote the cellular surface adhesion process and to accelerate the
process of tissue binding to the implant surface (Figure 25).

Topographic modification techniques at the micro and nano scales
64
Figure 25. SEM of the laser microgrooved dental implant: (a) Macroscopic appearance of a laser microgrooved
implant, (b) SEM of the implant head, original magnification x25, (c) SEM of the threads, original magnification x97,
(d) SEM of the foot, original magnifi
Figure 26. FT-IR spectroscopy: Immunofluorescent Microscopy Image of Laser-grooved Surface Funtionalized with
the Alkyl Phosphonate (AP), the Linker Molecule to the RGD (F27)

Topographic modification techniques at the micro and nano scales
65
This study was conducted in a trial to improve the adhesion of the bone to the implant
surface both micro-mechanically and chemically, with consequent better stress
distribution to the surrounding bone, and ultimately, a better peri-implant bone healing
and remodeling that provides a long-term support of the implant and the prosthesis it
retains. The results of this study demonstrated higher bone density profiles next to the
laser micro-grooved implants coated with the RGD than those only having the laser
micro-grooves. Further studies need to be conducted to compare the results of this study
and other studies using titanium dental implants with random surface roughness, to
validate the hypothesis of contact guidance, and other surface coatings to compare the
effect of RGD surface functionalization (Figure 26).
Chen et all (10) designed, produced and evaluated titanium surfaces for levels of
osseointegration into the femurs of rabbits. A total of 36 Ti-6Al-4V pins were prepared
into three experimental groups. These were designed to test the effects of osseointegration
on laser grooved, RGD coated, and polished control surfaces, as well as combined effects.
Circumferential laser grooves were introduced onto pin surfaces (40 μm spacing) using a
UV laser (λ=355 nm). Of the prepared samples, surface morphology and chemistry were
analyzed using scanning electron microscopy (SEM) and immunoflourescence (IF)
spectroscopy, respectively. The experimental pin surfaces were surgically implanted into
rabbit femurs. The samples were then harvested and evaluated histologically. In the case
of the RGD coated and laser grooved surfaces, histological results showed accelerated
bone growth into the implant, pull-out tests were also used to compare the adhesion
between bone and the titanium pins with/without laser textures and/or RGD coatings.
Figure 27. Laser grooved pin SEM (F28)

Topographic modification techniques at the micro and nano scales
66
Prior to laser grooving, the surfaces of the Ti-6Al-4V specimens were polished to a
uniform roughness using 320 grit polishing paper. Grooves with 25 μm wide and 40 μm
spacing were machined on to the surface of the pins. A spot size of 20 μm was obtained
using a microscope objective and each pin was rotated at 2800 rpm on an X–Y stage. The
laser was fired at 1000 Hz for 1.25 s (75 rotations of the pin) to produce one
circumferential groove. The pin was then translated laterally in increments of 40 μm to
produce multiple grooves. The resulting grooves were 25±2 μm wide, with a spacing of
40±1 μm. The average groove depth was 11±2 μm, as determined by profilometry. The
laser-grooved pins were characterized in a scanning electron microscope (SEM) that
revealed uniform machined grooves, as well as the nano-scale and sub-micro-scale
roughness left behind by the laser ablation process (Figure 27).
2.2. Electron Beam Welding
Another widely-developed technique for nanophotography is electron beam welding
(EBW): the process where high speed electrons are concentrated in a thin beam directed
towards the workpiece, generating heat vaporizing the material. EBW, compared to other
thermal cutting processes, and surface finishing, is better because it allows a narrower
cutting width. A difference in laser beam welding, this requires that the piece be placed
in a room where the vacuum was previously produced. (96) EBW is a thermoelectric
process; the remarkable resemblance to laser beam machining is due to the high
temperatures and thermal density that can be reached. In the electron gun, in addition to
the anode and the cathode, there is a third electrode defined as Wehnelt Lens, which is
connected to the cathode and has the function of regulating the electrons flow. (56) The
voltage between the anode and the cathode, called accelerator voltage, affects the velocity
of the electrons and the thermal energy that can be developed by electronic bombardment
and is therefore proportional to the voltage; they generally do not exceed 60 KW of
power. The gun is placed in a vacuum chamber and is equipped to move vertically; the
bundle remains generally stationary and the workpiece is moved to the desired speed
under the electronic beam (power supply). The temperatures obtainable are sufficient to
vaporize the tungsten (with a melting temperature of 3370 ° C) or any other known
material and the vacuum pressures reached in the chamber, ranging from 10-2 to 10-5
Torr (mmHg), depending on of the room area. In the machining zone, the vacuum

Topographic modification techniques at the micro and nano scales
67
pressure must be at least 10-4 Torr, and the electrons fired from the cannon reach a speed
between 50,000 and 200,000 Km/sec (Figure 28).
Figure 28. Schematic representation of an Electron Beam Welding system. (F29)
Modern electron-beam welders are usually designed with a computer-controlled
deflection system that can traverse the beam rapidly and accurately over a selected area
of the work piece. Thanks to the rapid heating, only a thin surface layer of the material is
heated. Applications include hardening, annealing, tempering, texturing, and polishing
(with argon gas present). If the electron beam is used to cut a shallow trough in the
surface, repeatedly moving it horizontally along the trough at high speeds creates a small
pile of ejected melted metal. With repetition, spike structures of up to a millimeter in
height can be created. These structures can aid bonding between different materials and
modify the surface roughness of the metal. (97)
Ramskogler et al. (2016) studied the effect of a designed surface on the osteoblast
behaviour and the influence of the electron beam on the microstructure of titanium base
alloys. Commercially pure titanium of grade 2 (TiGr2) and titanium alloy Ti6Al4V were
structured under vacuum by a high energy electron beam. Moreover, structured figures

Topographic modification techniques at the micro and nano scales
68
were designed following different criteria in order to develop a specific topography and
roughness on the surface (Figures 29 and 30).
Figure 29. Material and deflection figure parameters for cell cultivation. (F30)
Figure 30. Surface roughness of EB structured Ti6Al4V and TiGr2 samples (F31)
During electron beam structuring, the energy input of the electron beam process created
a melt pool on the surface and the subsequent fast cooling have formed a gradient of
microstructure for both materials. The microstructure change was independent of the
geometry of the figures but was strongly influenced by the current of the beam. The
morphology of pre-osteoblast cells (MC3T3-E1) after culturing for 24h, 48h and 72h on
Ti6Al4V, TiGr2 and cover glass were examined with SEM (Figure 31). MC3T3-E1 cells
appeared well spread out with a polygonal morphology on the surface of each structure
and the cells connected to each other through elongated actin filaments were extended in
various directions. (98)

Topographic modification techniques at the micro and nano scales
69
Figura 310. SEM images; MC3T3-E1 a) Ti6Al4V, hexagonal wallarray 96 arms + chemical milling, 24h cultivation
b) TiGr2, hexagonal wallarray 96 arms, 48h cultivation c) TiGr2, square pinarray 100 arms, 24h cultivation d)
Ti6Al4V, hexagonal wallarray 96 arms, 72h cul
In summary, the beam travel direction and the number of arm produced in the designed
figure influenced on the surface roughness. Under same conditions, commercially pure
titanium (TiGr2) shown lower Ra values in comparison to Ti6Al4V. (98)
2.3. Laser Beam Welding vs Electron Beam Welding
Laser welding energy sources utilize either a continuous wave (CW) or pulsed output of
photons. With CW systems, the laser beam is always on during the welding process.
Pulsed systems are modulated to output a series of pulses with an off time between those
pulses. The laser beams may be delivered directly to the part via classical hard-optics, or
through a highly flexible fiber optic cable capable of delivering the laser energy to distant
workstations. It is the high energy density of the laser that allows the surface of the
material to be brought to its liquidus temperature rapidly, allowing for a short beam
interaction time compared to traditional welding methods such as GTAW (TIG welding)
and similar processes. Energy is thus given less time to dissipate into the interior of the
workpiece. This results in a narrow heat-affected zone and less fatigue debit to the
component. Beam energy output can be highly controlled and modulated to produce

Topographic modification techniques at the micro and nano scales
70
arbitrary pulse profiles. Weld seams may be produced by overlapping individual pulses,
which reduces heat input by introducing a brief cooling cycle between pulses, giving a
great advantage for producing welds in heat sensitive materials. CW lasers can achieve
penetrations up to and exceeding 0.5 inches, while pulsed lasers typically achieve only
0.030-0.045 inches, but these results may vary between laser systems and are largely
dependent on processing parameter choice and joint design. The laser’s high-power
density results in small heat-affected zones and ensures that critical components are
unharmed. This has particular advantage for surgical instruments, electronic components,
sensor assemblies and many other precision devices. Unlike EBW, LBW does not
generate any x-rays and is easily manipulated with automation and robotics. Generally,
LBW has simpler tooling requirements as well, and there are no physical constraints of a
vacuum chamber. Shorter cycle times translate to cost advantages without decrease
quality.
The main advantages of continuous wave and pulse LBW are:
Lower capital equipment-cost advantage over EBW: No physical constrains of an
exclosure or vacuum chamber enables simplified setup, rapid cycling, and less
complex single station tooling;
Shorter cycles than EBW times translate to lower cost;
Simpler tooling requirements than EBW;
Small heat affected zone;
Scalable, one laser servicing several platforms;
Many OEMs support the technology;
No x-rays generated. (99)
Widely accepted across many industries, EBW permits the welding of refractory and
dissimilar metals that are typically unsuited for other methods such as laser welding. The
kinetic energy of the electrons is converted to heat energy, which in turn is the driving
force for fusion. Usually no added filler material is required or used, and post-weld
distortion is minimal. Ultra-high energy density enables deep penetration and high aspect
ratios, while a vacuum environment ensures an atmospheric gas contamination-free weld
that is critical for metals. However, the main necessity for operating under vacuum is to
control the electron beam precisely. Scattering occurs when electrons interact with air
molecules; by lowering the ambient pressure electrons can be more tightly controlled.

Topographic modification techniques at the micro and nano scales
71
Modern vacuum chambers are equipped with state-of-the-art seals, vacuum sensors, and
high-performance pumping systems enabling rapid evacuation. These features make it
possible to focus the electron beam to diameters of 0.3 to 0.8 millimeters. By
incorporating the latest in microprocessor Computer Numeric Control (CNC) and systems
monitoring for superior part manipulation, parts of various size and mass can be joined
without excessive melting of smaller components. The precise control of both the
diameter of the electron beam and the travel speed allows materials from 0.001” to several
inches thick to be fused together. These characteristics make EBW an extremely valuable
technology. The process puts a minimal amount of heat into the workpiece, which
produces the smallest possible amount of distortion and allows finish machined
components to be joined together without additional processing. Since most EB welding
is performed inside a vacuum chamber, it is an excellent fit for joining advanced materials
used in such industries as aerospace, power generation, medical and nuclear, which need
to be produced in a vacuum environment to protect them from oxygen and nitrogen found
in an open-air environment. EBW parts require a minimum of post weld machining and
heat treatment and, unlike other fusion welding processes, EBW requires no shielding
gases. The process is extremely efficient (typically 95%), all the process parameters are
carefully controlled and the process fully automated.
The main advantages of EB welding are:
Welding in a vacuum ensures no gas contaminance;
Deeper penetration than LBW with high aspect ratios;
Energy absorption indipendent from the surface material conditions;
Similar heat affected zone to LBW;
Permits welding of refractory and dissimilar metals not weldable with
conventional welding processes;
Proven track record, widely accepetd;
Included in many welding specifications. (99)

Topographic modification techniques at the micro and nano scales
72
The following Table 10 sums up the most significant advantages and disadvantages for
LBW and EBW:
Table 10. Advantages and disadvantages for LBW and EBW. (T6)

Topographic modification techniques at the micro and nano scales
73
Proponents of laser beam welding (LBW) and electron beam welding (EBW) each
pronounce the singular praises of their favored technology, but often the best solution for
a customer is to use both technologies together. Both processes are well suited to joining
components with complex geometries, and capable of meeting the most stringent. Using
both laser and electron beam technologies in a single facility can streamline the
manufacturing process when a component’s design incorporates multiple weld joints
separately tailored for one process or the other. Examples include sensors, medical
devices, and products that require an inert gas or vacuum to be sealed within the finished
part. Laser processing is required either when the size of the final assembly is too large
for an EB welding chamber, some component in an assembly is incompatible with
vacuum processing, or when the weld is inaccessible to an electron beam source. Electron
beam will be the primary choice when the completed assembly must be sealed with
internal components under vacuum, when weld penetrations exceed 1⁄2", when the
material is challenging to initiate laser coupling, or when the weld must not be exposed
to atmospheric conditions until it has cooled to an acceptable temperature. Examples are
aerospace welding of titanium and its alloys, and many refractory metals such as tungsten,
niobium, rhenium, and tantalum. (99)

Topographic modification techniques at the micro and nano scales
74
3. TOPOGRAPHIC EFFECT ON BACTERIA Many studies are underway to determine with certainty whether and how sub micrometric
and nanometric surface topographies affect bacterial adhesion. The small size of the
bacteria, in the order of a few μm, make the bacteria susceptible to superficial
characteristics with the size of the microgrooves, especially with a Ra≥ 0.2 µm gap
dimensions. In addition, the bacteria have a very rigid cell wall and this feature limits the
interaction between bacteria and surfaces with topographic features of smaller size than
the size of the bacterium such as nanogrooves. (100)
Katrina J. Edwards et al. (101) have shown that the greater the effect on the alignment of
bacteria is the shape of the grooves rather than the size. In this study, two types of grooves,
U-shaped and V-shaped, respectively, were made on pyrite substrates, and the bacterial
adhesion energy (Thiobacillus caldus, radius about 0.32 mm) was calculated in feature of
the groove dimension (r). The results have shown that the different shape of the grooves
can alter the bond strength, especially when the topography characteristics are of the same
order of magnitude as the bacterium, in particular a higher adhesion force for the substrate
with U -shaped.
Truong et al. (102) demonstrated that two bacterial strains, Staphylococcus aureus and
Pseudomonas aeruginosa, exhibited different attachment affinities towards two types of
molecularly smooth commercially pure titanium (grade 2 and grade 4, with an average
grain size of 20 and 30 μm respectively) surfaces each possessing a different
nanoarchitecture. They also found that the attachment of S. aureus cells was not restricted
on surfaces that had an average roughness (Sa) less than 0.5 µm. In contrast, P. aeruginosa
cells were found to be unable to colonise surfaces possessing an average roughness below
1 µm, unless sharp nanoprotrusions of approximately 20 µm in size and spaced 35.0 µm
apart were present. Thus, they postulated that the enhanced attachment of P. aeruginosa
onto the surfaces possessing these nanoprotrusions was facilitated by the ability of the
cell membrane to stretch over the tips of the nanoprotrusions as confirmed through
computer simulation, together with a concomitant increase in the level of extracellular
polymeric substance (EPS) being produced by the bacterial cells. Billets from these
materials, were processed by equal channel angular pressing (ECAP) to produce an
ultrafine grain structure together with the application of back pressure under the

Topographic modification techniques at the micro and nano scales
75
temperature regime selected, ensuring production of samples containing a uniform
distribution of predominantly equiaxed grains. The physical-chemical characteristics of
the surfaces as received and modified by the ECAP have been analyzed and found
substantially similar. Analysis of AFM height tapping results and AFM phase imaging on
areas of 1 μm × 1 μm provided further insights into the differences between the two
surface architectures, named Ti EG2 and Ti EG4, respectively, whose different
microstructure of most of the two grades gave rise to two different types of surface
topography (EG2 and EG4) on a nanometer scale. The surface of the Ti EG2 exhibited a
number of broad valleys and peaks, which appeared in highly contrasting colours that
highlighted a distinction between the peaks and the valleys (Figure 32).
Figure 32. Surface architecture of Ti EG2 and Ti EG4 at sub-nanometric scale. (a, b) Transmission electron micrographs visualising the differences in geometry and orientation of nanograins; c, d surface architecture of EG2 and EG4 presented by AFM height images. Ti EG2 surfaces exhibit wide and broad peaks and valleys; in contrast, Ti EG4 surfaces exhibit a number of sharp peaks protruding off homogenously flat surfaces; the arrows indicate sharp nanoprotrusions (white spots); e, f corresponding AFM phase images of c and d which demonstrate that surface architectures are influenced by organisation of Ti nanograins (orange), grain boundary (blue) and sub-nanograin structure (green). (F33)

Topographic modification techniques at the micro and nano scales
76
In summary, in this study, it is found that a threshold existed for S. aureus bacteria
attaching onto titanium substrates with varying average surface roughness. In cases where
the average roughness was below 0.5 µm, similar S. aureus attachment patterns were
found even if the detail of surface morphology was different. In contrast, P. aeruginosa
bacterial cells were found to be unable to colonise Ti substrate surfaces with an average
roughness below 1 µm, unless sharp nanoprotrusions of approximately 20 µm in diameter
were present (Table 11).
Puckett et al. (103) have performed an in vitro study on titanium surfaces having different
nanoprography as a means to reduce bacterial adhesion. Nanorough titanium (Figure 33b)
is obtained by means of a Temescal electronic beam evaporator and exhibits a decrease
in bacterial adhesion compared with the case of untreated conventional titanium (Figure
33a). However, nanotubular titanium, with an internal diameter of 60 ÷ 70 nm, obtained
by anodising in 1.5% HF for 10 minutes and nanotextured titanium, obtained by anodizing
in 0.5% HF for 1 min, show increased bacterial adhesion despite these superficial surfaces
exhibit higher surface energy and greater adsorption of fibronectin than conventional
titanium. The fluorine present on the nanotubular and on the nanotextured Ti surfaces
increased bacterial adhesion compared to conventional and nanorough ones. Moreover,
examining bacteria attachment on the anodized nanotubular surfaces revealed the highest
bacteria attachment compared to the anodized nanotextured surfaces, this is a possible
role of greater bacteria attachment correlated with fluorine concentration. Another factor
is the presence of amorphous TiO2 on nanotextured and nanotubular surfaces, while
nanorough and conventional titanium contain TiO2 crystalline (anatase and rutile).
Research has shown that the amorphous phase promotes bacterial adhesion in contrast to
anatase, which is known for its antibacterial properties. (104)
Bacterial strains
Initial cell density x 106 (number of cells per mm2)
Attached cell density x 104 (number of cells per mm2) Biovolume (µm3/µm2)
Ti EG2 Ti EG4 Ti EG2 Ti EG4
S. aureus
20.8±1.7 28.1±3.1 30.2±4.5 4.8±1.5 5.9±1.8
P. aeruginosa
13.0±1.5 0.5±0.3 2.6±0.8 0.5±0.3 6.3±1.2
Table 11. Retained bacterial cells on the Ti surfaces. (T7)

Topographic modification techniques at the micro and nano scales
77
Figure 33. SEM micrographs of Ti before and after electron beam evaporation and anodization: (a) conventional Ti
as purchased from the vendor; (b) nanorough Ti after electron beam evaporation; (c) nanotextured Ti after
anodization for 1 min in 0.5% HF at 20 V; (d) nanotubular Ti after anodization for 10 min in 1.5% HF at 20 V. Scale
bars=200 nm. (F34)
Truong et al. (105) discuss the effect of extreme grain refinement in the bulk of
commercially pure, grade 2, titanium on bacterial attachment to the mechano-chemically
polished surfaces of the material. The ultrafine crystallinity of the bulk was achieved by
plastic deformation through equal channel angular pressing (ECAP). It was found that
physico-chemical surface characteristics of the untreated pure titanium and the ECAP-
modified one, did not differ in any significant way, instead of the surface roughness at
the nano-scale. Optical profilometry performed on large scanning areas (225 µm x 300
µm) revealed that there was no significant difference between the roughness parameters
Ra and Rq for surfaces in the two conditions, the overall level of roughness being lower
for the ECAP-processed one. It was found that the bacterial strains used in this study as
adsorbates, i.e. Staphylococcus aureus CIP 65.8 and Pseudomonas aeruginosa ATCC

Topographic modification techniques at the micro and nano scales
78
9025, showed preference for surfaces of ECAP-processed titanium. S. aureus cells were
found to have a greater propensity for attachment to surfaces of ECAP-modified titanium,
while the attachment of P. aeruginosa, while also showing some preference for the ECAP-
processed material, was less sensitive to the ECAP processing.
Figure 34. Representative S. aureus (I) and P. aeruginosa (II) attachment patterns on the as-received (left column)
and ECAP (right column) titanium surfaces after 18 h incubation. SEM images (a) represent an overview of the
attachment pattern. CSLM images (b) reveal the production of EPS (stained green with concanavalin A 488) and
viable cells (stained red with SYTO_ 17 Red). (F35)
Bacterial strain Water
contact angle θ (°)
Zeta potential Ζ (mV)
Initial density x 106 (number of cells per mm2)
Retained cells x 104 (number of cells per mm2)
Ti surfaces As-received ECAP
S. aureus
72.2± 8 -35.2± 1.0 20.8± 1.7 14.67± 3.34 30.57± 7.36
P. aeruginosa
43.3± 8 -14.4± 0.7 13.0± 1.5 0.06± 0.02 0.37± 0.06
Table 12. Bacterial cell surface characteristics and retained cells on the surfaces of as-received and ECAP-
processed titanium after mechano-chemical polishing. (T8)

Topographic modification techniques at the micro and nano scales
79
Figure 35. Biovolume and average biofilm thickness of P. aeruginosa on surfaces of as-received and ECAP titanium.
(F36)
The analysis of SEM and CSLM images (Figures 34 and 35 and Table 12) revealed
different attachment responses of S. aureus and P. aeruginosa grown on the as-received
and the ECAP-modified titanium surfaces. After 18 h incubation, S. aureus cells were
able to colonise titanium surfaces of both types (Table 12). A statistically significant
increase in the number density (30.57x10⁴ cells per mm2) of S. aureus attached to the
surfaces of ECAP-processed Ti was recorded (t=0.002, p < 0.05). In contrast with the
attachment response of S. aureus, the overall response of P. aeruginosa cells to surfaces
of both as-received and ECAP-processed titanium was fairly poor, as demonstrated by
SEM analysis and CSLM imaging. Thus, only 0.37x10⁴ P. aeruginosa cells per mm2 were
retained on the surfaces of as-received Ti. It should be noted, however, that the biovolume
and the average thickness of P. aeruginosa biofilms on titanium surfaces of both types
were not much different (t=0.29 and 0.30 respectively, p > 0.05) and were comparable to
those of S. aureus (Figure 32). This means that P. aeruginosa cells produced a

Topographic modification techniques at the micro and nano scales
80
considerable amount of EPS, which was retained on the surface of Ti. The degree of the
biofilm heterogeneity of P. aeruginosa on surfaces of the as-received material was much
higher than that on the surfaces of ECAP-processed material (Figure 32 refers to the
biofilm distribution maps). (105)
Scheuerman et al. (106) studied the effect of substratum topography on bacterial surface
colonization using a chemically homogeneous single crystal 1, 1, 1 silicon coupon
smoothed at the micrometer level. Grooves were 10µm deep, and widths were within 20%
of the predicted value. The cross-sectional shape of the grooves was more u-shaped than
rectangular. Based on the ability of a bacterium suspended in fluid to reach the surface is
influenced by sedimentation, attractive interactive forces, and a velocity component
toward the surface provided by collisions between flowing particles, Pseudomonas
aeruginosa and Pseudomonas fluorescens were cultured on micrometric grooves
perpendicular to the flow of bulk water fluid, into a flow cell under specific flow
conditions, chemostat media (except for glucose which was 0.4 g/L), and chemostat cell
growth rate (0.2/h). They observed significant differences in the number of bacteria
attached to the downstream and upstream parts of the tops of the grooves. These
differences were probably due to variations in bacteria–surface initial contacts induced
by the different flow regimes present at the material surface. These results suggest that
bacterial responses to topographical nanofeatures may also be affected by the flow
regime. Therefore, studies on the influence of topographical surface nanofeatures on
bacterial adhesion should consider both static and dynamic experimental approaches to
the bacterial surface colonization.
Harris et al. (107) showed that polishing a titanium surface or coating titanium with
various treatments (shown in Table 13) that decreased the surface's coefficient of friction,
had no signicant effect on minimising S. aureus adhesion to these surfaces under static
conditions in comparison to standard medical grade titanium. The Ra and Rq roughness
parameters, are represented in Table 14. Differences in roughness were observed between
the samples, with TS, THY, TIG, TLF, and TAST showing comparable roughness, TSS
and TC were smoother, wishlist TE and TM were the smoothest. SEM images of the
surface topographies confirmed the roughness parameter results (Figure 36, surface
clearly seen behind the bacteria).

Topographic modification techniques at the micro and nano scales
81
LABEL DESCRIPTION
TSS Unalloyed Ti, gold anodised, Supplier A
TS Unalloyed Ti, gold anodised, Supplier B
TLF Low friction grey anodised Ti, Supplier A
TIG Nitrogeni on implanted TSS
THY TSS grefted with sodium hyaluronate
TAST TSS with polymer cell promotion
TC Chemically polished Ti, gold anodised, Suppler B
TE Electropolished Ti, gold anodised, Suppler B
TM Mechanically polished Ti, gold anodised, Supplier
Table 13. List of the surfaces used in that case of study, including surface label and description of the surface
treatment. (T9)
Figure36. SEM images of S. aureus adhered to the standard titanium surfaces and coated surfaces after 1h culturing.
(a) TS, (b) TSS, (c) THY, (d) TIG, (e) TLF, (f) TAST. Very few bacteria are seen on the THY surface compared to the
other surfaces, where small.

Topographic modification techniques at the micro and nano scales
82
SEM images of the coated surfaces showed that S. Aureus adhered to all the surfaces
prepared (Figure 36) with exception of the THY surface (Figure 33c). The density of
bacteria on TS, TE and TM were comparable despite differences in surface roughness
(Table 14). The only coating that significantly decreased the density of adhering S. aureus
was the titanium surface coated with sodium hyaluronate. Thus, such a coating could have
potential use as a coating for dental implants.
Test surface
TS TSS THY TIG TLF TAST TC TE TM
Ra 1.15 0.83 1.09 1.05 1.14 1.09 0.67 0.18 0.15 Rq 1.45 1.08 1.35 1.31 1.42 1.46 0.85 0.23 0.20.2
Table 14. Surface roughness parameters for the different treated titanium surfaces. Ra is the arithmetic mean and Rq
the root mean square. (T10)

Topographic modification techniques at the micro and nano scales
83
The following tables are schematic summary of the studies cited above:
Roughness Ra Technique Results Ref.
1,8,10 nm Etching on glass
A decrease in the size of the topographic features causes an increase in the number of bacteria that adhere to the surface. Bacteria respond to topography in a different way depending on the species: some become wider on etching surfaces without major changes in shape, others become smaller and less elongated on etching surfaces than those that have not undergone this treatment.
(100)
Machining on pyrite
What is most affecting the alignment of bacteria is the shape rather than the size of the grooves. Topography can alter the binding force, especially when the topography characteristics are of the same order of magnitude as the bacterium. There is a bacterial alignment parallel to the main axes of crystallographic pyrite planes.
(101)
0.3-0.5 nm ECAP process
In cases where the average roughness was below 0.5 nm, similar S. aureus attachment patterns were found even if the detail of surface morphology was different. In contrast, P. aeruginosa bacterial cells were found to be unable to colonise Ti substrate surfaces with an average roughness below 1 nm, unless sharp nanoprotrusions of approximately 20 nm in diameter were present. It is suggested that the enhanced attachment of P. aeruginosa onto surfaces possessing nanoprotrusions of this magnitude is likely to be a result of their ability to form stable contacts with the surface, which is facilitated by the cell membrane stretching over the tips of the nanoprotrusions as confirmed through increase in the level of EPS production.
(102)
Electron beam evaporation, anodization, surface characterization
The decreased adhesion of S. aureus, S. epidermidis, and P. aeruginosa (bacteria that limit orthopedic implant function and efficacy) on nanorough Ti surfaces created through electron beam evaporation while nanotubular and nanorough Ti created through anodization resulted in an increase of bacteria attachment. This research demonstrated that through careful selection of nanometer surface properties to increase fibronectin adsorption, while maintaining favorable chemistry and crystallinity (specifically, anatase TiO2) it was possible to decrease bacteria adhesion
(103)
Table 15. Summary of the studies cited above_Part 1

Topographic modification techniques at the micro and nano scales
84
Roughness Ra Technique Results Ref.
(83.02 ± 56.82) nm for 225 µm x 300 µm scanning area
ECAP process
Ultrafine crystallinity of commercial purity titanium achieved in the bulk material by means of equal channel angular pressing is also reflected in its characteristic, rich surface architecture at nanoscale. Moreover, two human pathogenic strains, S. aureus and P. aeruginosa, showed preferential bacterial attachment to ECAP-modified titanium. These results suggest that the surface architecture of the ultrafine-grained titanium at nano-scale may be one of the major factors influencing bacterial attachment.
(105)
Etching on a silicon coupon
The flow cell experiments with the three organisms showed that there were differences in the attachment rates of the bacteria, but not the patterns. For all bacteria the rate was independent of groove size and was greatest on the downstream edges of the grooves (10 µm deep and 10, 20, 30, and 40 µm wide were etched on the coupon perpendicular to the direction of flow). The presence of grooves perpendicular to flow resulted in preferential attachment to the downstream edges of the grooves, and to a lesser extent to the upstream edges. For motile bacteria, the initial attachment rate at the control position between grooves on the surface was similar to the bottom of the grooves. Non-motile bacteria were not found in the bottom of the grooves. When the cell concentration was held constant and the flow velocity increased, the rate of attachment increased, with a decrease in the importance of position relative to the grooves. The widths of the grooves displayed no effect, even though the hydrodynamic model predicted differences in flow relative to the widths. Inert beads did not behave like the nonmotile bacteria, except that both beads and nonmotile cells showed little coverage at the bottoms of the grooves.
(106)
0.15-1.15 nm
Gold Anodization, Sodium Hyaluronate Grafting, Chemical and Mechanical Electro-polishing
Polished or coatied surfaces do not have a significant effect on minimizing S. aureus adhesion, except for sodium hyaluronate coated surface, which significantly decreased the density of S. aureus adhering to the surfaces, and could have potential use in osteosynthesis, orthopaedics or dental applications. The study confirmed that TAST surface could promote bacterial adhesion, as well as cell adhesion it is designed to promote.
(107)
Table 15. Summary of the studies cited above_Part 2

Topographic modification techniques at the micro and nano scales
85
4. TOPOGRAPHIC EFFECT ON FIBROBLASTS One of the basic requirements of a biomaterial used for implantology is the ability to
promote cell adhesion, from which it will be colonized. The contact points between the
cells and the ECM are defined as Focal Adhesions (FA). They are specialized, flat and
elongated organelles that occupy an area of a few microns square and are often located at
the periphery of the cell. FAs are anchoring sites with which the ECM is indirectly linked
to the actin cytoskeleton through a complex membrane protein network. Anchor proteins
perform both a signal function for the activation of specific metabolic pathways such as
tyrosine kinase proteins, GTPase, phosphatase and other enzymes, as well as a structural
function of binding to actin fiber bundles such as tensine, vinculin, α-actinine and mica.
(108) At the level of the cell-substrate site there are small point-like structures defined as
focal complexes. With the maturation of the focal complex there is a thickening or
clustering of the integrins and the reorganization of actin filaments in large stress fibers,
which in turn promotes further clustering of the integrins. At these structures, there is
intracellular fast-assembly of specialized proteins: adhesion plaque proteins. (47)
The adhesion complexes mature, following the pattern:
Nascent adhesion: 3-5 integrins Groups;
Focal complex: Approximately 500 nm;
Focal adhesion: Up to 2-3 microns.
The most common anchoring molecules are integrins, which are transmembrane
heterodimeric proteins and have a size of some nanometer (8-12 nm). Therefore,
considering the size of focal complexes (micron order) and integrins (order of
nanometers), adhesion of cells to a substrate, hence their subsequent migration and
proliferation, is influenced by topographies of both scales. It is well documented that
many cells, including fibroblasts, respond to these topographies by changing their
proliferation and adhesion, orienting themselves in a preferential direction (Figure 37).
Moreover, especially for fibroblasts, the best surface condition becomes when surface
roughness is so moderate, instead of osteoblasts and bacteria. (109)

Topographic modification techniques at the micro and nano scales
86
Figure37. Model for cell alignment on the nanogrooved substrate. (a) Actin filaments parallel to the grooves form wide
focal adhesions at filament terminations. On the other hand, termination of perpendicular filaments is fragmented
because focal adhesions form only on the ridge. (b) Filopodia movements are isotropic. Cell protrusions extended
isotropically, but some that were perpendicular to the nanogrooved pattern retracted more rapidly than those parallel
to the nanogrooved pattern. These cell protrusion dynamics force a cell to elongate and align along the nanogrooved
pattern. (F38)
Andersson et al. (2003) suggested that the alignment of individual cells occurs only in the
presence of a continuous edge, that is, only if it accompanies the groove along its entire
length, without interruption or gap. This effect is known as “Contact Guidance”. (110)
Teixeira et al. (2004) achieved grooves on silicone surfaces on which keratinocytes were
cultured and showed that these cells adhere better to larger grooves and to a smooth
substrate than nanogrooves; alignment however occurs only in the presence of grooves,
instead of on smooth substrates where keratinocytes are randomly placed. They noticed
that 70% of cultured keratinocytes aligned with substrates where the sum of the widths
of the ridges and grooves is at least 800 nm; if that sum reaches 400 nm, the alignment
rate is 45%. Samples were made using electron beam lithography (E-beam lithography).
After 12 hours of incubation, the pattern with the fewest number of adherent cells was
400-nm pitch (Figure 38) than with wider pitches. While the highest level of alignment
of keratinocytes is observed in topography with pitch of 800 nm. (111)

Topographic modification techniques at the micro and nano scales
87
Figure 38. Sample pattern with pitch of 400nm. (F39) (34)
Hamilton and Brunette (2005) conducted a study to understand the response of human
gingival fibroblasts (HGF) in the presence of discontinuity. The topography provided
repeated open squares with an opening in each corner. It emerged that the cells were
guided in their movements despite the absence of a continuous edge due to the location
of focal adhesions and a reorganization of the cytoskeleton, the actin microfilaments and
especially the microtubules. Cells showed a gap guidance, migrating diagonally from one
gap to the other at the corners of the panel, attesting that substrate continuity is not a basic
requirement for aligning fibroblasts. (112)
Su-Yeon Kim et al. (2009) made titanium surfaces with microgrooves of 15, 30 and 60
μm wide and deep 3.5, 5 and 10 μm and some of these samples were acidified, i.e.,
Samples E15 / 3,5 E30 / 5 E60 / 10. On these surfaces, later, human gingival fibroblasts
were cultured in vitro. The results showed that the width of 60 μm and the depth of 10
μm of the grooves obtained better results in terms of cell proliferation and expression of
those genes coding for fibronectin involved in the formation of ECM. (113)
Nevins et al. (2012) demonstrated that by constructing micro-channels with laser
technique on circumferential abutment, with a range of amplitude and depth of 8-12 μm,
the behavior of epithelium, fibroblasts and osteoblasts is altered. In this way, the
orientation of the connective tissue is changed, allowing it to act as an anatomical barrier
to the migration of the junctional epithelium. Such microchannels, placed adjacent to the
abutment-implant interface, allow adhesion of the supracrestal connective tissue
perpendicularly to the surface of the implant, mitigating the negative influence of the
microgap formed at the abutment-implant interface and preventing the epithelium
migration junctional. The result was a minimal loss of crestal bone and as in natural teeth,

Topographic modification techniques at the micro and nano scales
88
a perimeter soft tissue layer of 3 mm wide was formed. The microgap that forms at the
interface between abutment and implant tends to promote the formation and activation of
osteoclasts and the repositioning of peri-implant connective tissue. (114)
Wieland et al. (2002) used a two-stage replica technique with a subsequent titanium-
coating treatment, using commercially pure grade 2 titanium, to replicate topographies of
mechenically polished (PO), acid-etched (AE), machined-like (MA), finely blasted (FB),
coarsely blasted (CB), coarsely blasted and acidetched (SLA), and Ti plasma-sprayed Ti
surfaces(TPS). The replicas were used to study the influence of different rough surface
topographies on the response of human fibroblasts in vitro, under conditions of constant
surface chemistry for all the surfaces. To judge the ability of the impression technique to
replicate complex topographies, SEM and stereo- SEM investigations were performed on
original Ti surfaces (PO, MA, AE, FB, CB, SLA, and TPS) and their replicas. A
combination of LPM and stereo-SEM was used to characterize surface topographies
because each method has its own limitations in terms of resolution and scan range and
therefore it is not possible to measure topographic features across a wide range of
dimensions with just one method. (36) In summary, the wavelength-dependent roughness
evaluation demonstrated that over the wavelength range from 100 nm to 1 mm, the
original surfaces and their replicas were congruent, and no significant differences could
be found (p > 0.05). Different surface topographies markedly altered cell morphology of
fibroblasts as has previously been found for fibroblasts cultured on microfabricated or
native Ti surfaces. (11,25) Cells cultured on smooth (PO) replicas were well spread, but
cells on rough surfaces (SLA and TPS replicas) provided multiple points of attachment
that might be influenced by submicrometer features. However, such observations of cell
morphology give no quantitative information about cell shape (Figure 39). (38)

Topographic modification techniques at the micro and nano scales
89
Figura 39. SEM micrographs of fibroblasts cultured for 24 h on Ti-coated epoxy-resin replicas of (a) PO (original
magnification ×1000), (b) AE (original magnification ×1000), (c) FB (original magnification ×500), (d) MA (original
magnification ×500), (e) CB (original magnification ×500), (f) SLA (original magnification ×1000), and (g) TPS
(original magnification ×1000) surfaces. (h) SLA surfaces provide multiple points of attachment that appear to depend
on the sub-micrometer range (original magnification ×5800). (F40)
It allows investigating the influence of surface topography on cell responses based
on the same
controlled chemical composition for all surfaces;
Epoxy-resin replicas can easily be sectioned, and prepared for light microscopy
and transmission electron microscopy;
It enables one to fabricate multiple samples of implants with the same complex
surface topography;
The fabrication cost is much cheaper than that of corresponding Ti samples.

Topographic modification techniques at the micro and nano scales
90
The 3D reconstruction of cells used here enabled the determination of cell thickness and
volume for cells cultured on surfaces with complex topographic features. Cell thickness
and morphology, but not cell volume, were affected by surface roughness. (115)
Pecora et al. (2009) evaluated in a prospective, controlled clinical trial a tapered dental
implant subjected to Laser-Lok [LL] surface treatment, with a 2mm wide collar, that has
been laser micromachined in the lower 1.5 mm to accomplish bone and connective tissue
attachment while inhibiting epithelial downgrowth. (116)
Figure 40. At implant placement and 25 monhs postoperative, 44 years, male. Control and silhouette with Laser Lock
surface treatment (LL). (F41)
The implants are placed adjacent to machined collar control implants of the same design.
At all measurement periods there are significant differences in the probing depths and the
crestal bone loss differences are significant after 7 months (P < 0.001). At 37 months the
mean probing depth is 2.30 mm and the mean crestal bone loss is 0.59 mm for LL versus
3.60 and 1.94 mm, respectively, for control implant. Also, comparing results in the
mandible versus those in the maxilla demonstrates a bigger difference (control implant-
LL) in the mean in crestal bone loss and probing depth in the maxilla (Figure 40). The
consistent difference in probing depth between LL and control implant demonstrates the
formation of a stable soft-tissue seal above the crestal bone. The LL implant was found
to be comparable with the control implant in safety endpoints plaque index and sulcular
bleeding index. There is a non-statistically significant suggestion that the LL crestal bone
retention superiority is greater in the maxilla than the mandible.
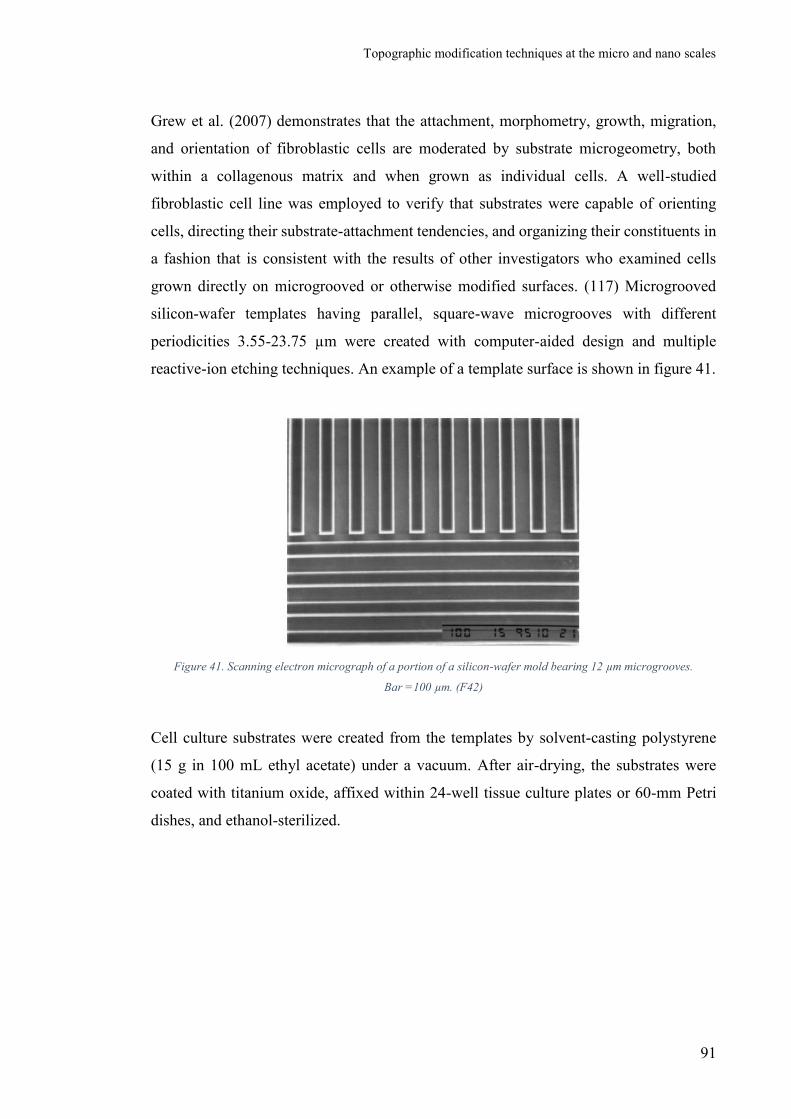
Topographic modification techniques at the micro and nano scales
91
Grew et al. (2007) demonstrates that the attachment, morphometry, growth, migration,
and orientation of fibroblastic cells are moderated by substrate microgeometry, both
within a collagenous matrix and when grown as individual cells. A well-studied
fibroblastic cell line was employed to verify that substrates were capable of orienting
cells, directing their substrate-attachment tendencies, and organizing their constituents in
a fashion that is consistent with the results of other investigators who examined cells
grown directly on microgrooved or otherwise modified surfaces. (117) Microgrooved
silicon-wafer templates having parallel, square-wave microgrooves with different
periodicities 3.55-23.75 µm were created with computer-aided design and multiple
reactive-ion etching techniques. An example of a template surface is shown in figure 41.
Figure 41. Scanning electron micrograph of a portion of a silicon-wafer mold bearing 12 µm microgrooves.
Bar =100 µm. (F42)
Cell culture substrates were created from the templates by solvent-casting polystyrene
(15 g in 100 mL ethyl acetate) under a vacuum. After air-drying, the substrates were
coated with titanium oxide, affixed within 24-well tissue culture plates or 60-mm Petri
dishes, and ethanol-sterilized.

Topographic modification techniques at the micro and nano scales
92
Figure 42. Scanning-electron micrographs of NIH-3T3 fibroblasts grown on 8 µm (a) and 12 µm (b) microgrooved
substrates for 8 days. The individual cell grown on 8 µm grooves is attached to several adjacent ridges, bridging the
intervening grooves. The cells grown on 12 µm grooves most frequently lie atop the ridges or within the grooves. Both
microgroove dimensions impose a strong orientation effect upon the cells. Bar=10 µm. (F43)
The lengths, widths, aspect ratios, and attachment areas of individual cells reveal that
microgroove dimension affected the sizes of cells (rat tendon fibroblasts RTF) and their
abilities to spread. Cell densities reflect the rates of cell proliferation that occurred on
each type of substrate. Cell orientations, determined by measuring the angular deviation
of the direction of the long axis of each cell from the direction of the underlying
microgrooves, indicate the ability of the various microgroove dimensions to direct the
organization of the cells’ contents. Cells grown on microgrooved substrates were nearly
uniformly oriented in parallel with the direction of the microgrooves (Figure 42). (117)
The following table is a schematic summary of the studies cited above:

Topographic modification techniques at the micro and nano scales
93
Grooves dimensions Technique Results Ref.
400- 800- 1200- 2000 nm (pith) E-beam lithography
The highest level of alignment of keratinocytes occurs in topographic fields with a pitch of 800 nm. Focal adhesions for both types of cells are essentially along the surface ridges.
(111)
Width x depth, (34x34 –
65x65) μm x (4-10) μm
HGFs and epithelial cells of the porcine periodontal ligament are oriented diagonally in the panels made on the surface of the substrate, proving that no continuous border for aligning these cells is required.
(112)
Width x depth, 200 μm ×
100 μm; Distance between microgrooves, 50 μm
Photolithography on cp Ti (22.351±2.766) μm (113)
8-12 μm Laser
The distance between the base and the free margin of the gingiva (probing depth) is lower, as well as the crestal bone loss around the implant.
(114)
Stamping procedures
and Sputtering over cp Ti samples
XPS investigations indicated that the chemical composition of the Ti-coated epoxy-resin replica samples was the same for all surfaces independent of the roughening processes such as blasting or etching originally used to produce the different topographies of the cpTi samples. Thus, these replica surfaces can be used to investigate the effects of surface topography on cell behavior under conditions of constant surface chemistry.
(115)
Width x depth, 12 μm x 10
μm Laser Lock
The consistent difference in probing depth between LL and control implant demonstrates the formation of a stable soft-tissue seal above the crestal bone. LL limited the crestal bone loss to the 0.59 mm range as opposed to the 1.94 mm crestal bone loss reported for control implant. The LL implant was found to be comparable with the control implant in safety endpoints plaque index.
(116)
Parallel, square-wave microgrooves with periodicities of 3.55, 12.83, 15.75, and 23.75 µm.
Grooves dimensions are, respectively:
1.80x1.75x1.75 µm3
6.50x6.33x5.00 µm3
8.00x7.75x7.50 µm3
12.00x11.75x7.50 µm3
Multiple reactive ion etching
Microgrooves are powerful determinants of cell orientation in vitro. Cellular orientation, expressed as degrees of deviation from the direction of microgroove direction, was profoundly and significantly reduced in cultures grown on microgrooves, compared with the high deviation from horizontal seen in cultures grown on flat, control surfaces.
(117)
Table 16. Summary of the studies cited above

Topographic modification techniques at the micro and nano scales
94

95
CHAPTER IV
MATERIALS AND METHODS
1. CUTTING, MARKING AND POLISHING OF SAMPLES
This thesis work has been carried out on commercially pure titanium of grade 2, ASTM
B348, Titanium Consulting and Trading, which is more osteointegrable but less resistant
than commercially pure titanium of grade 4, vice versa, suitable for small section systems,
e.g. dental implants, the main final application designed for the superficial changes
developed in this thesis work. Samples dimensions are in the form of disks of 10 mm of
diameter and 2 mm thick, obtained by cutting cylindrical bars. The cutting machine used
is the ATM "Brilliants 220" automatic cutter, with an alumina blade (Al2O3) and a speed
of 0.020 mm/s (Figure 43).
Figure 43. Cutting Machine for cutting samples in disks with 2mm thickness

Materials and methods
96
Samples shown clear signs of cuts, imperfections and scrap. So, the faces of each sample
obtained were undergone to two different procedures. The sample's face that will not
affected by the processing techniques and the subsequent tests were marked using an
electric pen, the other one, instead, i.e. the unmarked face, was firstly polished and then
used for next treatments. The polishing machine used is the Struers -LaboPol-2 polisher
(Figure 44).
Figure 44. Polishing machine
The polished samples were obtained by the following polishing protocol:
1 minute with paper 320;
1 minute with paper 600;
1 minute with paper 800;
1 minute with paper 1000;
5 minutes with paper 2500;
10 minutes with paper 4000.
Figure 45. Samples obtained following the polishing process

Materials and methods
97
Afterward, 4000 abrasive paper was replaced with a special cloth and a mirror polishing
step was performed using a colloidal silica suspension based on 25 ml of silica suspension
and 10 ml of ultrapure water and then sonicated for 5 min. (Figure 45)
The rough samples were produced using a sequence of abrasive papers to obtain a
roughness, Ra, in the range of 0.1-0.15 μm, useful for adhesion and alignment of
fibroblasts and such that it does not increase the bacterial adhesion.
2. SAMPLES WASHING
To remove contaminations introduced on the surface of the samples because of the
previous operations, disks were washed in an ultrasonic bath. Particularly, by
accomplishing a specific protocol, three washings were performed at room temperature.
First, the samples were immersed in 30 ml of acetone, placing the marked side, which is
not of interest, in contact with the bottom of the becher and leaving up the polished or
rough side, i.e. the one on which the subsequent treatments will be made. This was done
by working under laminar flow cabinet and with HEPA filter. After that, the bechers were
covered with aluminum paper and transferred to the sonicator by setting a 5-minute
working time. At the end of 5 minutes, the samples were transferred under the laminar
flow cabinet and immersed in 50 ml of distilled water and re-inserted into the sonicator
for 10 minutes. This last washing was repeated a second time with new ultrapure water.
The instrument used, the sonicator (Figure 46), ensures the separation of residuals and
contaminations of various sorts, thanks to the transmission of mechanical vibrations
amplified by a high frequency electric current, equal to about 20 kHz, in a tank containing
water, in which the bechers containing samples are placed; this electric energy is
transformed into an acoustic impact energy between the detergent liquid, i.e. the water,
and the surface to be cleaned. At the end of the washing, disks could dry under a laminar
flow cabinet and then packed in special sealed envelopes.

Materials and methods
98
Figure 46. Utrasonic machine
3. SURFACE TREATMENT OF EBW SAMPLES
A part of the samples used in this work, after having been polished according to the
protocol described in the previous paragraph, has undergone a surface treatment by means
of Electron Beam Welding (EBW) at the Technical University of Graz. Three types of
samples have been created with different widths of the grooves, respectively of 5, 10 and
30 micrometers. (Table 17) The dimensions chosen are those studied in previous works
and which showed the ability to condition the behavior not only of the adhesion of
gingival fibroblasts but also of the adhesion of bacteria. (47) (56)
An important feature of the EBW technique is deep penetration. This effect is achieved
thanks to the highly accelerated electronic beam. Electrons hit the surface and penetrate
slightly beneath it, releasing most of their kinetic energy, which becomes heat. This leads
to enormous heating in the beam region of the beam and therefore to the partial
evaporation of the base material. The beam can cross the vapors with greater ease than
the solid metal, thus facilitating the penetration of electrons into the metal itself.
SAMPLE NOMENCLATURE AMOUNT STEP SIZE
EBW 5 3 5 µm
EBW 10 3 10 µm
EBW 30 3 30 µm
Table 17. Summary table of samples produced by Electron Beam Structuring

Materials and methods
99
The width of the molten zone is therefore extremely limited: the depth/width ratio can
exceed the value of 20/1. The thermal input of this technique on the sample is controlled
by 4 variables:
Beam current;
Acceleration potential;
Beam spot size;
Welding speed.
The penetration level increases by increasing the beam power density. In order to vary
the level of penetration, the first two parameters are crucial, while the third and the fourth
essentially serve to control the process.
4. SURFACE ACTIVATION WITH PLASMA O2
Plasma activation is a method of surface modification employing plasma processing,
which improves surface adhesion properties of many materials including metals, glass,
ceramics, a broad range of polymers and natural materials. Plasma processing achieves
this effect through a combination of reduction of metal oxides, ultra-fine surface cleaning
from organic contaminants, modification of the surface topography and deposition of
functional chemical groups. Particularly, the plasma activation can be performed at the
atmospheric pressure using air or typical industrial gases including hydrogen, nitrogen
and oxygen. Thus, the surface functionalization is achieved without expensive vacuum
equipment or wet chemistry, which positively affects its costs, safety and environmental
impact. Fast processing speeds further facilitate numerous industrial applications. (118)
In this work, surface treatment with oxygen plasma was carried out in order to make the
surface of the samples more reactive for the subsequent adhesion of keratin nanofibers
coating by electrospinning technique. Samples were placed in special housings inside a
vacuum chamber. Once the chamber has been sealed, oxygen is inserted in the form of
gas and an electric field is applied to allow plasma formation (Figure 47).
Loaded ions, affecting the exposed surface of the samples, modified Ti surface bonds,
making it more responsive. The samples at the end of the treatment were placed in Petri
Plates of 12 wells, two of them were sealed in air at room temperature and the other two
were sealed in a physiological solution at room temperature. The purpose of this different

Materials and methods
100
packing of samples was to maintain the reactivity of the treated surfaces and to study how
the different type of packaging could affect the goodness of the adhesion of keratin
nanofibers coating.
Figure 47. Instrument for oxygen plasma activation.
5. UV ACTIVATION Titanium is a very reactive metal, if exposed to the atmosphere or to an environment
containing free oxygen, on its free surface occurs an oxidation reaction that forms a thin,
tenacious oxide film. This passive oxide layer, or even defined protective oxide, whose
thickness is about 5 nm, gives to the material excellent corrosion resistance in a wide
range of aggressive media. If the environment in which titanium is placed is sufficiently
rich in oxygen, the oxide film is able to regenerate itself in a short time if mechanically
damaged. (119) The nano-structured titanium dioxide has photocatalytic properties: for
example, it can absorb the light-emitting radiation by generating photo-catalytic effects,
that is, it can take advantage of the electromagnetic radiation energy absorbed to cause
chemical reactions in other molecules that are very close to surface of metal particles.
This process is only effective using ultraviolet radiation, whose wavelength λ belongs to
the range of 400 nm ÷ 10 nm. (120) The absorption by the TiO2 of UV radiation generates
electron-gap pairs, the titanium dioxide gap discomposes the molecules of water in
hydrogen and hydroxyl ions/radicals, the electron instead, reacts with the oxygen
molecules to form superoxide ions. (121) For this reason, ultraviolet pretreatment of

Materials and methods
101
titanium, especially the TiO2 layer, before functionalization can make improvements,
ascribable to an increase in superficial OH groups. (122) The irradiation took place after
the deposition of keratin coating, in order to stabilize and strengthen the adhesion of the
coating to the metal oxide substrate. The lighting was obtained with a low power 300 W
lamp with monochromatic emission at wavelength λ = 365 nm (Figure 48).
The distance between the lamp and the samples is 25 cm and the environmental conditions
were:
Temperature 20 °C
Humidity 65%
Samples subjected to UV irradiation were:
Smooth-Ti cp/Keratin;
Figure 48. Lamp for UV activation

Materials and methods
102
6. ELECTROSPINNING TECHNIQUE
Electrospinning is a production method through which fibers having a diameter of
hundreds of nanometers can be produced using an electrostatic guiding system that allows
their controlled deposition over a substrate. (123) Unlike conventional spinning
techniques, it is possible to obtain fibers with a diameter below micrometers reaching up
to a few nanometers. The main features of these nanofibers are the following:
Ultra-fine diameters, less than 100 nm;
Large surface areas;
Allow to create structures like the ECM (Extra Cellular Matrix) or porous
structures with pore sizes of a few micrometers;
The electrospinning process is performed with a syringe (or micrometric nozzle)
containing a polymeric solution, which will be pushed in a pump-controlled manner to
generate a constant flow. A high-power generator creates the potential difference between
nozzle and collector. The polymeric fiber jet is stretched up to a few micrometers from
the electric field that has to cross and then it is gathered on a metal collector.
Figure 49. Electrospinning Process. Vertical configuration. (F44)

Materials and methods
103
From figure 49 is possible to observe that the output of the syringe nozzle creates the
Taylor Cone, which causes drastic reduction of fiber sizes. This cone varies depending
on the viscosity of the solution and on the force of the electric field (3-12 kV). During
Taylor's cone formation, the surface tension forces and the electric field forces 'squeeze'
the solvent to evaporate the solution. Using traditional nozzles, full fibers can be obtained.
Modified nozzles can also be used to obtain, for example, empty or bicomponent fibers.
In addition, it is possible to use multiple nozzles in one electrical field to optimize the
yield of the manufacturing process.
Figure 50. Electrospinning Diagram. (F45)
At the end of Taylor's Cone, the jet goes through what is called the Instability Zone, within
which the jet undergoes a three-dimensional distortion and further reduces its diameter
(Figure 50). The filament collection area, that is, the metal collector, can be a plane, a
rotating cylinder or other geometries. Depending on the geometry chosen, clusters, cracks
or other configurations of deposited fibers are obtained. (123)

Materials and methods
104
Spinning flaws
Electrospinning is a technique with several critical factors. During spinning, we can create
impurities in the texture such as beads, ribbons and surface defects that compromise its
purity:
Beads are fibrous swellings provoked by too slow evaporation of the solvent
occurred after deposition on the collector;
Ribbons are still rich in solvent fibers that collapse on them, losing their
cylindrical geometry;
Surface defects are the index of a not optimized spinning system.
Critical process factors
These are factors that play a key role in determining the success of spinning and can be
treated by dividing them into three categories.
1. System parameters, which mainly concern the properties of the solution and the
properties of the polymer:
Solution properties
Concentration. There is a minimum concentration under which is
established an electrospray process and a maximum concentration above
which the solution is too viscous to ensure a continuous process;
Viscosity. For too low values the fibers that are formed are not continuous,
at too high values the polymeric jet has difficulty forming;
Conductivity. A factor that depends on the nature of the polymer, the
solvent and the presence of salts in the solution. For excessively low
values there are discontinuous fibers and beads, for excessively conductive
solutions the instability region is very marked and fibers with very uneven
diameters are produced;
Surface Tension. It depends mainly on the solvent. For low values, the
prospect of having beads in fibers will be lower;

Materials and methods
105
Polymer properties
Molecular weight. It influences viscosity, surface tension and
conductivity of the solution and dielectric strength. The more easily
filamented polymers generally have high molecular weights, otherwise
beads can be formed. As the molecular weight increases, the fiber diameter
also increases;
Structure. A linear structure polymer is easier to thread, because of major
inter-chain interactions;
Process parameters
Voltage. There is a minimum voltage above which the fibers can be
obtained. When the voltage increases, the fibers have a lower diameter.
Above a threshold value the diameters increase again, because the jet
increases at the output of the nozzle;
Flow. The flow influences the speed of the process. Low flow rates allow
for better evaporation of the solvent before deposition over the collector.
High flow rates, hence faster, will have larger fiber diameters and larger
pores of electrophilic membranes;
Tip-Collector Distance. Below a minimum distance the solvent does not
have the time to evaporate and consequently the fibers do not have time to
form;
2. Environmental parameters. These parameters influence not only the fiber
morphology but also the external electrical field.
Humidity. The high humidity causes the formation of pores on the surface
of the fibers. Conversely, if low, the solvent evaporates quickly, and the
needle becomes clogged after a few minutes;
Pressure. Decreasing pressure does not improve the electrospinning
process; (123)

Materials and methods
106
In this dissertation work, smooth samples, underwent electrospinning technique at the
laboratories of CNR-ISMAC (Institute for Macromolecular Studies) of Biella, Piedmont.
The instrument used for electrspinning was Spellman High Voltage Electronics
Corporation, SL 50, Power supply, KDS 200, KD Scientific Inc. in bottom-up
configuration. The deposition took place under the following conditioins:
The electrophilic solution, 15% by weight of keratin in formic acid (HCOOH), was
prepared 20 hours before the process and mixed with a magnetic stirrer, then inserted into
a syringe of 5 ml size and connected to a stainless-steel capillary with internal diameter
of 0,2 mm and the external one of 0,4 mm, which acts as cathode (Figure 51). The
collector, which is the anode, is a stainless-steel plate on which the sample is placed.
Moreover, the collector is covered with an aluminum foil to prevent the keratin jet from
getting it dirty when it does not reach the sample (Figure 52).
Figure 51. Syringe containing the keratin solution
Environmental Conditions Average Value Standard Deviation
Temperature [°C] 26,36 0,76
Humidity (%) 40,24 0,76
Table 2. Environmental conditions for the deposition of keratin

Materials and methods
107
Figure 52. Metal collector coated with aluminum foil
The solution jet starts from the bottom, crosses the capillary and rises upward in the
direction of the collector. To direct the jet well, the capillary passes through the hole of
an insulating box (Figure 53).
Figure 53. Detail of the electrospinning instrument

Materials and methods
108
The following process parameters have been set:
Voltage 25 kV;
Rate 0.002 ml/min;
Capillary- Collector distance 20 cm.
A preliminary spinning test was carried out without placing the sample on the collector
to verify the deposition, that is, the formation of a white patina on the surface. It was
chosen as a deposition time of 5 min and no inclination of the sample with respect to the
collector because of the previous work these were the optimal deposition conditions. (56)
Samples used were:
2 Smooth-Ti cp, as control;
2 Smooth-Ti cp, which after the electrospinning process were treatd with UV
irradiation, at the CNR of Biella;
2 Smooth-Ti cp, previously subjected to oxygen plasma treatment and stored dry
until the deposition of keratin;
2 Smooth-Ti cp, previously subjected to oxygen plasma treatment and stored in
physiological solution up the deposition of keratin;
The keratin used in this thesis work was extracted from sheep wool. The wool belongs to
the group of proteins called keratins, which have a high content of cystine or sulfur
residues and can be classified as hard or soft according to their tactile properties. There
is about 3% more sulfur in hard keratins, i.e. wool, compared to soft keratin, i.e. the skin.
Furthermore, the wool contains only 82% of keratin proteins, in fact the rest is composed
of proteins with a low cystine content, such as waxy lipids and polysaccharides. (124)
Usually to extract the keratin from the wool it is necessary to break the SS sulfur bridge
bonds by reduction with thiols (thioglycolic acid, dithiothreitol or 2-mercaptoethanol),
oxidation with peracetic acid and performic acid or by sulphite, reaction obtained with
sulfite ions, bisulphite or m-bisulphite. All these agents must be used in pairs with a
protein denaturant, such as urea, which breaks up hydrogen bridge bonds.
Since most of the reducing and oxidizing agents are harmful, the extraction of keratin
from sheep wool, carried out by the CNR-ISMAC of Biella, was obtained by

Materials and methods
109
sulphytolysis, a reaction according to which the SS bonds of cystine residues are broken
down. in cysteine residues and cistein-S-sulphonate residues, called Bunte salts, even if
with this method the extraction yields are lower. (124)
7. THERMAL TREATMENT AND STERILIZATION Samples coated with nanofibers of keratin for 5 min and EBW samples were left in the
Petri dishes (Figure 54) and have been subjected to a heat treatment in an oven at 180 °C
for 2 h, in order to stabilize the coating and to make a previous sterilization.
Figure 54. Detail of heat treated material
On completion of treatment, the Petri dishes were enveloped in paper-plastic bags to
preserve the sterility during storage. All the materials necessary for the subsequent silver
treatment were then sterilized and autoclaved. The packaging envelope has a transparent
side to allow to recognize the content and the process indicators; the closure of the
envelope is done by heat sealing.

Materials and methods
110
Sterilization in autoclave (Figure 55 and Figure 56) at 121 ° C, 1 bar for 30 min of:
21 jars for samples;
bottles of bi-distilled water;
bechers;
2 clamps;
pipettes;
2 spatulas;
2 magnetic stirrers.
Figure 55 e 56. Autoclave instrument for sterilization and detail of sterilized material
The sterilization is verified by the process indicator which is turned from light to dark
brown. All samples upon completion of treatment, were left in the Petri dishes closed
with aluminum foil and wrapped, waiting for the subsequent treatments for bacterial and
cell cultures.

Materials and methods
111
8. ANTIBACTERIAL TREATMENT WITH SILVER Treatment with silver aims to reduce the problem of bacterial adhesion to dental implants.
Three concentrations of silver were chosen and listed below:
Low concentration of AgNO3;
Intermediate concentration of AgNO3;
High concentration of AgNO3.
The treatment was carried out at room temperature, maintaining the pH of the solution as
prepared, and subsequently using it as a control parameter for each of the three
concentrations. For each type of concentration, six samples were used and each of them
was immersedin 10 ml of solution. All operations were carried out under laminar flow
hood and with HEPA filter (Figure 57). The pH was measured in the three solutions for
a short time. In this way, there is a good compromise between efficiency and time of
treatment, because when the concentration of the solution is increased, a good amount of
silver on the samples is guaranteed and the short time allows to speed up the operations.
Figure 57. Laminar flow hood and jars containing the samples immersed in the corresponding agno3 solution

Materials and methods
112
Samples subjected to Ag treatment were:
6 smooth-Ti cp/keratin/Low AgNO3;
6 smooth -Ti cp/keratin/Intermediate AgNO3;
6 smooth-Ti cp/keratin/High AgNO3;
The six samples used for each solution were subdivided into two groups of three samples,
the first group to be subjected to cellular testing, while the second group to be subjected
to bacterial adhesion tests.
9. SURFACE CHARACTERIZATION FESEM-EDS
The Field Emission Scanning Electron Microscope (FESEM) is an analysis instrument
that allows observing the surface of a sample by exploiting electrons released from a field
emission source. Inside a high vacuum column, the so-called primary electrons are
focused and deflected by electronic lenses in such a way as to produce a narrow beam
which bombards the object to be analyzed. As a result, the object emits secondary
electrons, whose angle and velocity are related to the surface structure. A detector
captures secondary electrons and produces an electronic signal which is amplified and
transformed into a video image. In standard electronic microscopes, electrons are
generated predominantly by heating a tungsten filament, exploiting the Joule effect
generated by the current passage. In FESEM, however, a "cold" source is used, i.e., a thin
and pointed tungsten needle with a 10-7-10-8 m tip diameter that functions as a cathode in
front of a primary and secondary anode. The voltage between these is in the order of 0.5-
30 kV and it is necessary to achieve a high degree of vacuum, 10-8 Torr, in the microscope
column. The electron beam produced is about 1000 times smaller than that of a standard
microscope and therefore the image quality is much higher. For this reason, FESEM is
used to expose very small topographic details on the surface of objects. Biologists,
chemists and physicists apply this technique to the analysis of structures that can be small
up to 1 nm. Images can be viewed in two modalities:
Secondary electron (SE)
Backscattered electron (BSE)

Materials and methods
113
The SE is used to map the surface of a sample, so it is necessary to detect type 1 secondary
electrons (SE1) and this is done efficiently by a detector located in the optical path. A
second detector is placed on the wall of the chamber that contains the sample and allows
to detect secondary electrons having a small backscattered component. The working
distance therefore exerts a significant influence on the efficiency of this mode: the
detector works particularly well over long distances and, since it is mounted with a certain
angle with respect to the sample, the view is always lateral and offers good information
on the surface. The BSE mode instead, is intended to show the compositional differences
within the sample. Since the BSE detector is placed below the last lens, it offers a solid
wide angle to detect backscattered electrons. The resulting contrast in BSE images
depends on the presence of elements with different atomic numbers and their distribution
(Figure 58).
Figure 58. FESEM scheme (F46)

Materials and methods
114
In addition to this kind of analysis, FESEM also enables Energy Dispersive X-ray
Spectrometry (EDS), which is an instrumental analysis that identifies the elements present
on the surface and their relative proportions such as, for example, their atomic percentage.
It uses the X-ray emission from a sample hit by an accelerated electronic beam. The graph
shows the X-ray spectrum of the scanned area: Axis-x reports the number of X-rays
received and processed by the detector while on the y axis is reported the corresponding
energy level. Anelastic interactions between the electron beam and sample atoms produce
two types of X-ray: those resulting from the electron-ejection contained in an internal
atomic shell and those resulting from the interaction of the beam with the atomic nucleus.
The former appear as peaks on a continuous X-ray background and their energy depends
on the atomic number of the element. The X-rays may derive from deeper areas of the
sample compared to secondary and backscattered electrons (Figure 59).
Figure 59. Emission depth of various types of electrons and X-rays (F47)
However, retro-diffused electrons come from a volume that approximates more the one
from which X-rays are emitted and therefore BSE images are often correlated with this
type of analysis. The qualitative analysis, namely the identification of elements present
in the sample, is a prerequisite for subsequent quantitative analysis. (125)

Materials and methods
115
The FESEM analysis was conducted on:
Five samples, using the instrument Merlin Gemini, Zeiss:
Smooth-Ti cp/Keratin/Ag0.01;
Smooth-Ti cp/Keratin/Ag0.05;
Smooth-Ti cp/Keratin/Ag0.1;
For samples treated with silver, the secondary and back scattering images were captured
in magnifications of 2000x, 5000x, 10000x, 50000x and 100000x. For the other two
samples were captured only secondary images at 2000x 5000x, 10000x, 30000x and
100000x. The aim was to identify the presence and the atomic percentages of indicative
elements of keratin such as C, O, S, N and silver;
Eight samples with thin coating, silver treatment and in both cellular and bacterial
tests using the instrument SUPRATM 40, Zeiss, making possible to observe the
morphology of deposited keratin and to evaluate the presence and distribution of
bacteria and cells:
Smooth-Ti cp/Keratin/cells seeding of 72 h;
Smooth-Ti cp/Keratin/Ag0.01/ cells seeding of 72 h;
Smooth-Ti cp/Keratin/Ag0.05/ cells seeding of 72;
Smooth-Ti cp/Keratin/Ag0.1/ cells seeding of 72
Smooth-Ti cp/Keratin/bacteria seeding of 72 h;
Smooth-Ti cp/Keratin/ Ag0.01/ bacteria seeding of 72 h;
Smooth-Ti cp/Keratin/ Ag0.05/ bacteria seeding of 72 h;
Smooth-Ti cp/Keratin/ Ag0.1/ bacteria seeding of 72 h;

Materials and methods
116
XPS
X-ray Photoelectron Spectroscopy (XPS) is a quantitative analysis technique that allows
to determine the chemical elements present on the surface of a sample. The object to be
analyzed is irradiated with a low energy monochromatic X-ray beam, generated by an
aluminum anode. Based on the number and kinetic energy of the electrons emitted, it is
possible to determine their binding energy, which is specific to each element and allows
the chemical characterization of the sample. The range of depth of the XPS analysis is
about 1-10 nm (Figure 60), reason why it is widely used to know the surface chemical
composition of a sample. If the X-ray beam can penetrate the sample in depth, the emitted
electrons originate from the more superficial layers, because, for energies around 1.4 keV,
the electrons emitted from depths greater than 10 nm have a low probability to leave the
surface without encountering energy loss events, thus contributing to the underlying
signal rather than to the well-defined peaks of primary photoelectrons. (126)
Figure 60. Depth of information of XPS analysis (F48)
A typical XPS spectrum, the Survey spectrum, is a graph showing the number of electrons
detected as a function of their binding energy. Each chemical element produces a
characteristic set of peaks at specific energy values. The number of electrons counted for
each of these peaks is correlated with the amount of that element in the sampling volume
of the XPS. The quantification of XPS spectra assumes that the number of electrons

Materials and methods
117
detected is proportional to the number of atoms in each state. The basic instrument for
measuring the number of electrons recorded for a specific atomic layer is the
quantification region whose primary goals are to define the range of energies on which
the signal can be attributed to the transition of interest and to define the type of appropriate
approximation to remove the background signal that does not belong to the peak, although
for some transitions, such as peaks p, d and f, data appear in double-form. The best way
to compare XPS intensities is by atomic percentage concentrations, since not all electrons
emitted by the sample are detected by the instrument. In this way, intensities are
represented as a percentage, correlating the intensity of interest to the total intensity of
the electrons involved in the measure. With XPS is also possible to perform a high-
resolution analysis, useful not only in the case of distinct elements that show overlapping
but also in the case of a single element of which you want to know the oxidation state and
the chemical around. In these cases, the peaks are matched by Gaussian or Lorentzian
curves, which model the envelope of the data. The XPS analysis was conducted on the
same samples analyzed by FESEM-EDS with the XPS, PHI 5000 Versa Probe, Physical
Electronics. It was possible to accurately determine the chemical composition of the first
superficial layers and to add more information about the chemical elements of interest.
The high-resolution spectrum revealed the types of chemical bond in which the keratin is
involved and allowed to understand how the keratin restrain silver and other elements.
(127)
This analysis was conducted on the following samples:
Smooth-Ti cp/keratin (as control);
Smooth-Ti cp/keratin/UV treatment;
Smooth-Ti cp/Plasma O2 dry/keratin;
Smooth-Ti cp/Plasma O2 physio-sol/keratin;
Smooth-Ti cp/keratin/Ag 0.01;
Smooth-Ti cp/keratin/Ag 0.05;
Smooth-Ti cp/keratin/Ag 0.1.

Materials and methods
118
Tape test
Adhesion is defined as a set of physico-chemical phenomena that occur in the molecular
attraction between two different of materials placed in contact, as in this case that one that
has been established between the nanofibres of keratin and commercially pure titanium
surface. The adhesion force is that one required to separate the two materials at interface
between them. Because of the wide variety of coating materials, their thicknesses and
their deposition methods, doesn't exist a gold standard method for assessing adhesion.
The following are the most commonly used ones:
Tape Test;
Scrape Test;
Pull-Off Test;
Burnishing Test;
Heat-Quench Test.
In this work, the Tape Test was performed, which consist of a semiquantitative evaluation
of the adhesion assessment and was conducted by reference to the Standard Test Methods
for Measuring Adhesion by Tape Test, ASTM D 3359-97.
The experimental procedure includes the following steps:
Creating cuts with a sharp tool to produce edges from which the coating can be
lifted. Note that the cut patterns can be different, in this case is used the grid cut
one;
Application of an adhesive tape, conforming to EN ISO 2409, above the cutting
zone, then performing a certain pressure to ensure adhesion of the tape itself;
Removing the adhesive tape, parallel to the surface;
Examination of the tested area with the aid of a magnifying glass;
Evaluation of adhesion strength, depending on the amount of coating removed.

Materials and methods
119
Figure 61 shows the table for the evaluation of the results from the norm ASTM D 3359-
97:
Figure 61. shows the table for the evaluation of the results from the norm ASTM D 3359-97: classification of
adhesion test results (F49)

Materials and methods
120
The instrument used is the Elcometer 107 Cross Hatch Cutter, made up of 6 blades with
a cutting distance of 1 mm, suitable for up to 60 μm on hard surfaces, in accordance with
ASTM regulation (Figure 62).
Figure 62. Elcometer 107 Cross Hatch Cutter (F50)
Samples were observed under an optical microscope before and after the tape test, in order
to have a better evaluation of the permanence and the eventual removal of the keratin
nanofibers.

Materials and methods
121
FT-IR
Fourier transform spectroscopy is a type of non-destructive analysis for the identification
of materials by the analysis of vibration of chemical bonds. It is based on the absorption
of infrared radiation by the materials and the ability to seize all components of the infrared
spectrum in the detector, which makes it unnecessary to scan the wavelength. This is
possible by transforming the polychromatic infrared radiation emitted from the source by
an interferometer into an interferogram where absorption is not a function of frequency
but of time. By means of a computer, which makes the Fourier transform, it is possible to
switch from interferogram to spectrum, which represents the variation of the intensity of
the signal according to the radiation wave number. (128) The operating diagram is shown
in figure 63.
Figure 63. FTIR operating diagram (F51)
The IR spectrum is specific to each molecular structure, so FT-IR analysis provides
accurate information on the organic and inorganic groups present on the surface of the
sample to be analyzed. Spectrum peak amplitude has a direct proportionality with the
amount of substance present on the sample. In this type of analysis, it is necessary to have
a background, i.e., a reference material, and to do a compensation for H2O and CO2, as
they absorb the IR radius, to obtain the correct spectrum for the sample. In this work, FT-
IR analysis was performed to observe the type of keratin atomic bonds on the surface of
commercially pure Ti samples coated using the electrospinning technique.

Materials and methods
122
This analysis was conducted on the following samples:
Smooth-Ti cp/keratin (as control);
Smooth-Ti cp/keratin/UV treatment;
Smooth-Ti cp/keratin/Tape test;
Smooth-Ti cp/Plasma O2 dry/keratin;
Smooth-Ti cp/Plasma O2 physio-sol/keratin;
Smooth-Ti cp/keratin/Ag 0.01;
Smooth-Ti cp/keratin/Ag 0.05;
Smooth-Ti cp/keratin/Ag 0.1.
FT-IR analysis was used as the radius penetration depth on the surface of the sample is
about 1 μm and the keratin coating has a thickness of some micrometers. The
measurement was set in such a way as to obtain a spectrum resulting in reflection, which
reflects the reflectance peaks according to the wave number. The instrument used was the
IR Hyperion 2000, Bruker.

Materials and methods
123
Wettability
Wettability is the ability of a liquid to remain in contact with a solid surface due to
intermolecular interactions that develop at the interface between the two. The degree of
wettability is given by the balance between cohesive forces and adhesion forces: The first
type of force lends the liquid drop a spherical form that minimizes the contact with the
solid, while the second one causes a drop of liquid that expands on the surface of the
solid. By measuring the contact angle (θ), it is possible to determine the degree of
wettability, this angle is measured on the drop section and is formed by the encounter
between the direction of the solid-liquid interfacing stress and the direction of the liquid-
vapor interfacing stress, tangent to outer surface of the drop with the vertex in the three-
phase solid-liquid-vapor point as shown in figure 64. (129)
Figure 64. Contact angle (F52)
Where ϒsl is the solid-liquid interfacial free energy, ϒsv is the solid surface free energy,
ϒlv is the liquid surface free energy. In the case of a smooth and homogeneous surface,
or rather an ideal condition as there is always a slight roughness, wettability is defined by
Young's equation, which establishes the balance of horizontal forces acting on a drop of
volume negligible in relation to the surface:
ϒsv - ϒsl = ϒlv cosθ
Depending on the contact angle value, it is possible to determine the degree of wettability
of a surface (Table 19).

Materials and methods
124
There is a relationship between wettability and surface energy that quantifies the
breakdown of intermolecular bonds that form the surface itself. High-energy solid
surfaces have strong chemical-type bonds, i.e., ionic, metallic or covalent, and are
completely wet with most of the polar liquids. While low-energy solid surfaces are made
up of atomic species held together by physical bonds such as Van der Waals bonds and
hydrogen bonds and can be completely or partially wet depending on the liquid being
considered. Still different is the case for liquids, for which surface tension coincides with
surface energy. In the case of biomaterials, the study of wetting is of great importance in
predicting interaction with the biological environment. (129) The purpose of this work
was to evaluate whether and how the topography of titanium, the presence and topography
of the keratin coating and the presence of silver modify the wettability. Two wettability
tests were performed, both under ambient conditions. The first test was performed on
samples stored in Petri dishes, the second test, however, was performed on the same
samples but previously stored in bacterial broth, in order to detect any change in the
hydrophilic/hydrophobic characteristics of the sample surface. A thermal microscope was
used to perform the analysis by working at room temperature. The sample was placed on
a horizontal plate and a front microscope made it possible to capture sample images
during the test. For each sample, two measurements were made, depositing, at a distance
from each other, 5 μl of milli-Q water with the aid of a micropipette. Once captured, the
images were processed with the ImageJ software and the static contact angle
measurement was made. The instrument used was a KRUSS DSA 100.
Contact Angle Wettability Degree Adhesion Force Cohesion Force
𝜽 = 𝟎° Perfect Very strong Very weak
𝟎° < 𝜽 < 𝟗𝟎° High Strong/Weak Strong/Weak
𝟗𝟎° < 𝜽 < 𝟏𝟖𝟎° Low Weak Strong
𝜽 = 𝟏𝟖𝟎° Null Very weak Very strong
Table 19. Relationship between contact angle, degree of wettability and forces involved (T11)

Materials and methods
125
Samples used were:
2 smooth samples;
2 mechanical rough samples;
2 EBW5 samples;
2 EBW10 samples;
2 EBW 30 samples.
Zeta potential
The concept of zeta potential (ζ) is related to colloidal systems such as particle or
emulsion dispersion and its colloidal chemical applications are discussed in many
textbooks. Although primarily described as a colloidal analysis parameter, the theoretical
background is the same regardless of whether it is applied for colloidal or solid surface
characterization. In this case a different approach is required, the zeta potential is
indicative of the charge surface that is formed when the material is in contact with an
aqueous system. The behavior of charges on the solid-liquid interface can be explained
using the double electrical or electrochemical model, according to which, due to the
charge that the solid assumes in water, stationary liquid and a counter-ion mobile layer
compensating for surface charge. The zeta potential is defined at the shear plane, which
is the separation zone between the moving liquid phase and the stationary liquid phase
(Figure 65). (130)
Figure 65. Model of double electrochemical layer at solid-liquid interface (F53)

Materials and methods
126
Knowledge of zeta potential goes through the measurement of electrokinetic phenomena
occurring at the interface between a solid, liquid or gaseous phase and a liquid phase when
there is a relative motion between them. Particularly, when an aqueous solution flows
through a capillary system, a continuous voltage or DC current is generated, depending
on how the measurement is made. The capillary through which the aqueous solution flows
can be of irregular shape, such as the voids between the fibers of a fibrous matrix, or as
regular as the channel that is created between two planar surfaces of a material. When the
aqueous solution is slid, shear forces are generated on counter-ions, which begin to move
in the direction of flow. Between the capillary inlet and outlet generates a charge
separation that creates an electric force that is opposed to the flow. Thanks to two
electrodes placed at the ends of the capillary it is possible to detect the flow potential.
Measurement depends on the following parameters:
Volumetric flow rate of the solution;
Capillary size;
Ionic Force: The effect of ionic strength on the reproducibility of zeta potential
can be eliminated by providing a known aqueous ionic solution; in general, a 1:1
electrolyte (NaCl, KCl, KNO3) to the ionic strength of 0.001 mol/l.
Figure 66. Dependence of the zeta potential for material surfaces with acidic, basic, amphoteric behavior. (F54)
The experimental set-up consists of a sample cell, two electrodes, a voltmeter, a case
containing the measuring fluid and connected to the cell, a grounded metal cage to protect
against external electromagnetic fields, a pump, pressure transducers and probes for pH

Materials and methods
127
measurement and conductivity of the solution. Solid-liquid interface charge is mainly
driven by acid-base reactions between surface functional groups and water and the
physical adsorption of aqueous ions. Since these processes strongly depend on the pH of
the aqueous solution, pH is the most important parameter of the liquid phase that affects
the zeta potential. The zeta potential data must then refer to the pH of the aqueous solution
used for the analysis. Titration has as its main objective the estimate of the isoelectric
point (IEP), which is the pH at which the zeta potential changes with a value of 0 mV.
This is equivalent to a net electrokinetic charge of 0 C/m2 and thus to a balance between
the superficial groups loaded positively and negatively. The IEP is a good indicator of the
chemistry of the functional groups present on the surface of a solid. In the case of surfaces
that exhibit only one type of functional group, the zeta potential is described as a function
of pH by well-defined curves, which show a plateaux in a variable position depending on
whether the surface has an acid, basic or amphoteric behavior. (130)
However, in most cases, the samples analyzed show a heterogeneous composition of
functional groups and hence the curve that will be obtained will be different from the one
shown in figure 66. Furthermore, there is no evidence that the zeta potential is dependent
on the size of the sample and the roughness of the surface.
In this dissertation work the ζ potential has been studied on the following couples of
samples:
EBW5;
EBW10;
EBW30;
Smooth-Ti cp;
Metallic Ag.
In this way, it was possible to ascertain how surface roughness, surface topography, and
presence of silver influence on the surface charge of the samples. The Surpass
electrokinetic analyzer, Anton Paar was used (Figure 67).

Materials and methods
128
Figure 67. Electrokinetic analyzer for zeta potential measurement
The samples were fixed with a suitable adhesive to the sample holder, which in turn have
been inserted into the slots dedicated present in the measuring cell to leave a small gap
between them. This space was brought by rotating one of the graduated wheels included
in the cell at 100 μm in the initial step of adjusting the measurement parameters. Prior to
mounting the cell, the instrument was washed with distilled and ultra-filtrated water by
interposing a connecting tube between the two electrodes, then performing the closed-
loop filling procedure without titration, using as electrolyte solution 45 mg of KCl in 600
ml of milli-Q water. Thereafter, flow control was performed by instrument software,
which returns the flow, expressed in [ml/min], as a function of the pressure, expressed in
[mbar], by tracing two curves; the first relative to the flow from left to right and the second
to the flow in the opposite direction, thus allowing the detection of the pressure value to
be set for a flow of 100 ml/min. The first measurement was done without titration to find
the zeta potential of the sample at the pH of the electrolyte. In this work it was decided to
perform the basic titration first. For basic titration, an increase in ml of NaOH 0.05 M
was set to add during the measurement and for each step the software returned four
measurements with corresponding average value. At the end of the basic titration, two
washings of the instrument were carried out with milli-Q water, leaving the cell mounted,
then passing to the titration with 0.05M HCl. The way to proceed was quite similar to the
one described for the basic titration and the parameters that were measured are: pH,
conductivity, temperature, flow current, pressure and flow.

Materials and methods
129
10. BIOLOGICAL TESTS Bacterial adhesion test
Bacterial adhesion tests were also conducted in the laboratories of the Department of
Health Sciences at the University of Eastern Piedmont Amedeo Avogadro and involved
the following samples:
Samples used were:
3 EBW5;
3 EBW10;
3 EBW30;
3 Smooth-Ti cp/Ker/Ag 0.01;
3 Smooth-Ti cp/Ker/Ag 0.05;
3 Smooth-Ti cp/Ker/Ag 0.1;
3 Smooth-Ti cp/Ker (as control).
The bacterial strain that has been investigated is Staphylococcus aureus, cultivated in
Luria-Bertani (LB, Sigma-Aldrich, MO, USA) agarized solid soil plates at 37 °C in a
humid environment until the emergence of single colonies. Plates were maintained at 4
°C and from the formation of these colonies and before each experiment, a new culture
was carried out in LB liquid medium at 1x10⁷ bacteria per ml (turbidity according to
standard MCFarland 1.0). Subsequently the samples were lying in the wells of a 24-well
plate and submerged with a volume of 1 ml of the bacterial culture prepared as described
above. The plate was placed for 90 minutes at 37 °C by stirring (120 rpm) to favor biofilm
cell adhesion to the sample surface (separation phase). At the end of 90 minutes,
supernatants containing planktonic cells were removed from each well and replaced with
1 ml of fresh LB soil (biofilm growth phase). The biofilm was then cultivated on sample
surfaces for 24 hours at 37 °C. After 24 h the grown biofilm on the surfaces was analyzed
by XTT (sigma-Aldrich) colorimetric test to evaluate its bacterial vitality.

Materials and methods
130
The assay was performed by carrying out the following steps:
Samples gently washed with PBS to remove non-adherent bacteria;
1 ml of a solution of XTT powder (3 mg/ml) and PBS-menadione (0.1µM) was
added in each well;
The plate was incubated 3 hours in the dark at 37 °C;
100 µl of XTT solution were taken from each well and transferred to a 96-well
plate (Nunc Delta).
The number of bacteria on the surface of the samples was evaluated by counting the unit
forming colonies (CFUs). Biofilm cells were detached from the samples by sonicator
(AcquaSonic, VWR PBI International, Milan, Italy) and vortex (5 cycles of 30 seconds
per sample). The biofilm detached was diluted in 1 ml of PBS (mother solution) and used
to run a series of 6 dilutions 1/10 in PBS (20 µl of mother solution and 180 µl of PBS).
From each dilution were collected 20 µl, which were placed in Petri dishes containing LB
agar. Plates were incubated at 37 °C and the following day the number of colonies was
counted as follows (131):
Number CFU = [Number of colonies x Dilution factor x 10 ^ (Serial dilution)]
To determine the vitality of the bacteria, the following kit was used: Molecular Probes,
Life Technologies Italy, Monza, Italy, comprising two fluorophores:
SYTO9: Color both vital and dead bacteria;
Propidium iodide: colors only the dead bacteria.
Subsequently, 1 ml of each fluorophore solution was inserted into 3 ml of PBS and, after
mixing, the solution was distributed in the plates containing the samples and incubated at
room temperature for 15 minutes in the dark. The samples were examined by a
fluorescence microscope (Leica 6500, Leica Microsystems, Basel, Switzerland). Finally,
the number of dead bacteria was calculated as a percentage of the total number of bacteria
using the following software: ImageJ (NIH, Bethesda, USA). Finally, statistical analyzes
were performed using the following software: SPSS v20.0, IBM Co. Armonk, NY, with
a 5% significance level.

Materials and methods
131
Cell test
These tests were conducted in the laboratories of the Department of Health Sciences,
University of Eastern Piedmont Amedeo Avogadro and involved the following samples:
Samples used were:
3 Smooth-Ti cp/keratin/Ag 0.01;
3 Smooth-Ti cp/keratin/Ag 0.05;
3 Smooth-Ti cp/keratin/Ag 0.1;
3 Smooth-Ti cp/keratin (as control);
The types of cells used were primary human fibroblasts (HGFs), isolated from the human
gingiva, surgically removed from healthy patients. Dermatome was used to remove thin
mucous layers and the epithelial layer was enzymatically separated by a digestion with
0.5% of dispase at a temperature of 4°C overnight.
Cells thus obtained were cultured in α-MEM (Sigma) supplemented with 10% FBS fetal
bovine serum (Sigma) inactivated by heat action and with 1% of antibiotics-antimycotics
(penicillin/streptomycin/amphotericin B, Anti-Anti, Sigma) at 37 °C in a humidified
atmosphere at 10% of CO2.
The cytocompatibility was evaluated in vitro by means of direct and indirect tests:
Direct Test: Samples were placed in 24-well plates; 2x10⁴ cells were sown on the
surfaces of each sample and allowed to adhere for 4 hours. Subsequently, each
well was filled with 1 ml of culture medium. Vitality was evaluated with the Blue
Alamar Test (Sigma-Aldrich) after 48 hours. Finally, the supernatant optical
density (O.D.) was measured at a wavelength of 590 nm with a spectrophotometer
(Conte Spectra, Packard Bell);
Indirect Test: The α-MEM medium was incubated without cells for 1 week at 37
°C, 5% of CO2 in direct contact with the samples at a ratio of 1 mL/sample for a
total of 10 mL/test tube. The medium was then supplemented with 10% of FBS
fetal bovine serum and used to cultivate HGFs. The cells were sown on 24-well
plates (Star Cell Phone, International PBI, Milan, Italy) and cultivated for 48
hours at 37 °C, 5% of CO2. Subsequently, cell viability was evaluated by means
of the Blue Alamar assay as described for the direct cytocompatibility assay.

Materials and methods
132
After 48 hours of direct cultivation, the cells were fixed with 3% paraformaldehyde
(Sigma-Aldrich) in PBS for 2 hours and then washed in 1 mol of sodium cacodylated 1-l
buffered solution, dehydrated with 70%, 80%, 90% and 100% ethanol (10 min each). The
morphology of the cells cultured on samples was investigated by immunofluorescence
(IF) and FESEM, placing the samples on an aluminum housing with conductive carbon
tape, covered with a layer of chrome and observed by FESEM (SUPRATM 40, Zeiss) at
various magnifications. The dyes used for immunofluorescence were:
Anti-vimentin (AbCam, 1: 150 in PBS, 5% goat serum, 1% BSA) and anti-type
collagen II
(AbCam, 1: 100 in PBS, 5% goat serum, 1% BSA) for 1 hour;
Falloin (AbCam, 1: 500 in PBS);
4,6-diamidino-2-phenylindole (DAPI, Sigma) to visualize F-actin and nucleus.
The images were obtained using a fluorescence microscope (Leica 6500, Leica
Microsystems, Basel, Switzerland).

133
CHAPTER V
RESULTS AND DISCUSSIONS
1. ADHESION STUDY Tape test
The following samples, mirror polished and subsequently coated with keratin, were
subjected to the Tape Test to evaluate the adhesion of this coating:
Smooth-Ti cp/Ker (as control);
Smooth-Ti cp/PlasmaO2Dry/Ker;
Smooth-Ti cp/PlasmaO2Physio/Ker;
Smooth-Ti cp/Ker/UV.
From the following table (Table 20) it is possible to observe the samples during the Tape
Test. Although the adhesion test was very aggressive towards the coating deposited for
electrospinning, it was noticed that the test only removed the outermost layers of the
coating, probably because of its high thickness.

Results and discussions
134
Table 20. Images of the samples subjected to the evaluation of the adhesion coating keratin
It was decided to proceed with a series of analyzes such as FESEM-EDS, XPS and FT-
IR, in order to study the surface chemical composition and the type of bonds established
within the coating.

Results and discussions
135
FT-IR
The FT-IR analysis was carried out to observe on the surface of the samples the presence
and the type of atomic bonds. In this case, the atomic bonds characteristic of keratin, in
order to study the quality of the adhesion of the nanofibers to the metal substrate. This
analysis was conducted on the following samples:
Smooth-Ti cp/Ker
Smooth-Ti cp/Ker/UV
Smooth-Ti cp/PlasmaO2Physio/Ker
Smooth-Ti cp/PlasmaO2Dry/Ker
Smooth-Ti cp/Ker/Tape
Below are the FT-IR spectra of each sample in a single chart:
Figure 68. FT-IR characterization of the samples used for the adhesion study

Results and discussions
136
The peaks highlighted in figure 68 are related to the following chemical bonds (132):
N-H, O-H at 3278 cm-1;
C-H, O-H at 2921 cm-1;
CO2 not well compensated at 2355 cm-1;
-COOH at 1650 cm-1;
C=C at 1523-1542 cm-1;
C-N at 1221 cm-1;
S-O at 1020 cm-1;
In Figure 68 it is observed that most of the peaks present in the spectra of the samples
analyzed are identifying the same types of bonds, although the intensity is sometimes weaker.
This may be due not only to a homogeneous distribution of the keratin coating but also to its
thickness, which could prevent the detection of different chemical bonds despite the different
treatments carried out on the surfaces of the samples. In particular, we can note the presence
of the amide band A (centered at 3282 cm-1) connected to the stretching vibration of the N-H
bonds, the presence of the amide II (1580-1510 cm-1) deriving mainly from the bending of
the N-H in the plane with a certain contribution of the vibrations of stretching C-N and of the
amide III (1300-1220 cm-1), which depends on the nature of the side chains and hydrogen
bonding. (133) Substantial differences between the signals of the samples are not visible,
excluding the not well-balanced CO2 peak at 2355 cm-1 for the control sample. The peaks
present are those typical of keratin nanofibers present in literature (133), even if present at
different intensities, increasing with respect to the control sample. The sample after the Tape
test does not show substantial differences compared to the others, which means that on the
surface remains a layer of keratin with a thickness greater than the depth of penetration of the
FTIR analysis. A very thin layer is then removed. This shows how large the thickness of the
keratin coating is and how much it is characterized by the same bonds in the various layers.
It is important to note that this type of analysis is able to reach depths close to 1µm, not
sufficient to reach the interface area between the keratin coating and the titanium substrate
with surface treatment, instead providing information on the chemical characteristics of the
nanofibrous keratin coating.

Results and discussions
137
XPS
Table 21 shows the atomic percentages obtained from the Survey spectra of the various
samples:
Table 21. Atomic percentages from the four-sample Survey spectra
It can be seen that, with regard to carbon, this is always present on the surface of our
samples for two reasons: both for the superficial reactivity of titanium and for the
presence of keratin. A significant amount of nitrogen and a moderate amount of sulfur,
attributable to keratin, is observable. The presence of sodium is instead attributable to
contamination.
Element Smooth-Ti cp/Ker Smooth-Ti cp
/PlasmaO2Physio/Ker
Smooth-Ti cp
/PlasmaO2Dry/Ker
Smooth-Ti cp
/Ker/UV
C 60.70 59.00 60.40 59.10
O 21.10 22.80 21.50 23.00
N 14.00 14.80 15.00 13.30
Na 2.30 1.50 1.10 2.70
S 1.90 1.90 2.00 1.90

Results and discussions
138
Below, in figures 69a, 69b, 69c and 69d, the Survey spectra for the four samples are
shown:
Figure 69a. Survey spectrum of Smooth-Ti cp/Ker sample
Figure 69b. Survey spectrum of Smooth-Ti cp/PlasmaO2Physio/Ker sample

Results and discussions
139
Figure 69c. Survey spectrum of Smooth-Ti cp/PlasmaO2Dry/Ker sample
Figure 69d. Survey spectrum of Smooth-Ti cp/Ker/UV sample

Results and discussions
140
For each sample the high-resolution HR spectra of the carbon, oxygen, nitrogen and silver
regions were then acquired. The binding energies were corrected by matching the main
carbon peak to the bonding energy of 284.6 eV, according to conventional use. (134) The
possible attribution of the individual peaks was made on the basis of what reported in the
literature. (135) (136)
In the following figures, the possible attributions of the binding energies detected during
the analysis are listed according to the detained element.

Results and discussions
141
a.
b.
c.
d.
Figure 70. HR carbon spectra for: a. Smooth Ti-cp/Ker, b. Smooth-Ti cp/PlasmaO2Physio/Ker, c. Smooth-Ti
cp/PlasmaO2Dry/Ker, d. Smooth-Ti cp/Ker/UV

Results and discussions
142
The C-C, C-H, C-O and C=O bonds that appear in the spectra of Figure 70 are attributable
to the carbon present as a contaminant. These bonds, together with the C-S and C-N, also
present in figure 70, are also contained in the primary structure of keratin, so the
contribution to the peaks in question is twofold. (137) (138)
For each sample the ratio between the percentage area of the detected peaks and the
percentage area of the peak at 284 eV taken as reference was calculated (Table 22). It is
observed for all the samples, in figures 70a., 70b., 70c. and 70d., the presence of a relative
abundance of the C-O/C-N attribution relative to the reference, except for the sample with
ultraviolet surface treatment, figure 70d., for which there is no relative abundance with
respect to the reference. For the attribution C=O a relative abundance is observed with
respect to the reference in each sample, and in particular for the sample with ultraviolet
treatment. This result might suggest that the surface UV treatment, performed following
the deposition of the nanofibers in order to stabilize the coating, has favored especially
the exposure of that type of bond.
Table 22. Summary of the percentage areas and ratios for the HR carbon spectra
Smooth Ti-cp/Ker Area [%] Ratio 284.43 eV 32.24 1
285.64 eV 36.16 1.12
287.72 eV 31.60 0.98
Smooth-Ti cp/PlasmaO2Physio/Ker Area [%] Ratio 284.34 eV 31.86 1
285.50 eV 33.69 1.057
287.59 eV 34.45 1.081
Smooth-Ti cp/PlasmaO2Dry/Ker Area [%] Ratio 284.48 eV 32.35 1
285.72 eV 35.63 1.101
287.79 eV 32.02 0.989
Smooth-Ti cp/Ker/UV Area [%] Ratio 284.44 eV 31.62 1
285.62 eV 35.45 1.121
287.75 eV 32.93 1.041

Results and discussions
143
a.
b.
c.
d.
Figure 71. HR oxygen spectra for: a. Smooth Ti-cp/Ker, b. Smooth-Ti cp/PlasmaO2Physio/Ker, c. Smooth-Ti
cp/PlasmaO2Dry/Ker, d. Smooth-Ti cp/Ker/UV

Results and discussions
144
In Figure 71 for all the four samples, two peaks can be identified, each corresponding to
a specific oxygen bond. The presence of the C=O double bond and the O-H hydroxyl
groups, probably derive from the keratin coating. (138) (139)
For each sample, in Figures 71a., 71b., 71c. and 71d., the ratio between the percentage
area of the peak at lower energy and that of the peak at higher energy was calculated
(Table 23). The presence of a constant relative abundance of the C-O/C=O attribution is
observed for all the samples with respect to the peak attributed to the C-O-C/C-OH bond.
This result could suggest that none of the surface treatments has made the substrate
surface differently reactive, but most likely the absence of differences between the surface
treatments is due to the thickness of the coating that prevents this type of analysis from
providing information regarding the interface between the nanofibrous coating and the
titanium substrate.
Table 23. Summary of the percentage areas and ratios for the HR oxygen spectra
Smooth Ti-cp/Ker Area [%] Ratio 531.40 eV 76.40 1
533.06 eV 23.60 0.308
Smooth-Ti cp/PlasmaO2Physio/Ker Area [%] Ratio 531.25 eV 73.31 1
532.79 eV 26.69 0.364
Smooth-Ti cp/PlasmaO2Dry/Ker Area [%] Ratio 531.46 eV 77.57 1
533.22 eV 22.43 0.289
Smooth-Ti cp/Ker/UV Area [%] Ratio 531.42 eV 76.21 1
533.03 eV 23.79 0.312
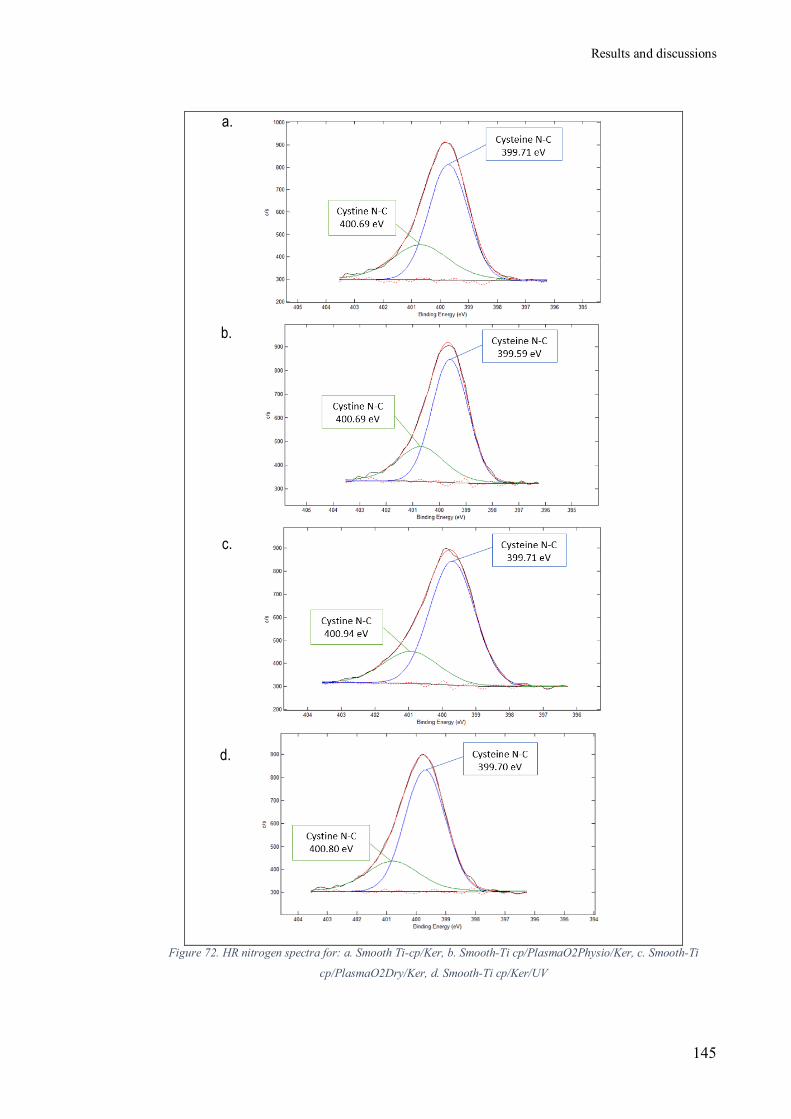
Results and discussions
145
a.
b.
c.
d.
Figure 72. HR nitrogen spectra for: a. Smooth Ti-cp/Ker, b. Smooth-Ti cp/PlasmaO2Physio/Ker, c. Smooth-Ti
cp/PlasmaO2Dry/Ker, d. Smooth-Ti cp/Ker/UV

Results and discussions
146
Regarding the nitrogen HR spectra, in Figure 72, the nitrogen peaks were attributed to
cysteine N-C (at 400 eV) and cystine N-C (at 401 eV) due to the confirmed presence of
sulfur fractions both in Table 21 and in the HR spectra in Figure 73. However, due to the
variety of amino acids present in keratin and the overlapping binding energies of cystine
in HR spectrum of nitrogen (N 1s), i.e. glycine, which is also present in the polypeptide
chain, these cannot be definitively assigned. (140)
For each sample the ratio between the percentage area of the peak attributed to the
cysteine N-C bond and the percentage area attributed to the N-C cystine bond was
calculated (Table 24). It is observed for all samples the presence of an increasing relative
abundance of the cysteine N-C attribution with respect to cystine N-C, starting from the
control sample then following the samples with oxygen plasma treatment (Figures 72a.,
72b. and 72c.), with the exception of the sample with ultraviolet surface treatment, figure
72d., for which there is no relative abundance of the cysteine N-C attribution compared
to cystine N-C that has an intermediate ration value to that calculated for the samples
treated with oxygen plasma. This result could suggest that the UV treatment, carried out
following the deposition of the nanofibers in order to stabilize the coating, has favored
especially the exposure of that type of bond.
Table 24. Summary of the percentage areas and ratios for the HR nitrogen spectra
Smooth Ti-cp/Ker Area [%] Ratio 399.71 eV 66.53 1
400.69 eV 33.47 0.503
Smooth-Ti cp/PlasmaO2Physio/Ker Area [%] Ratio 399.59 eV 70.36 1
400.69 eV 29.64 0.421
Smooth-Ti cp/PlasmaO2Dry/Ker Area [%] Ratio 399.71 eV 74.98 1
400.94 eV 25.02 0.333
Smooth-Ti cp/Ker/UV Area [%] Ratio 399.70 eV 72.72 1
400.80 eV 27.28 0.375

Results and discussions
147
a.
b.
c.
d.
Figure 73. HR sulfur spectra for: a. Smooth Ti-cp/Ker, b. Smooth-Ti cp/PlasmaO2Physio/Ker, c. Smooth-Ti
cp/PlasmaO2Dry/Ker, d. Smooth-Ti cp/Ker/UV

Results and discussions
148
Regarding the sulfur HR spectra, in Figure 73, the peaks were attributed to S-O (at 168.2-
168.7 eV), i.e. oxidised disulfide bonds of the cysteic acid residues of keratin, and to S-S
(at 163.9-164.0 eV), i.e. cystine disulfide bonds. As can be seen from Figure 73, all the
spectra exhibit very noisy signals due to the weakness of the signal. (141) For each sample
the ratio between the percentage area of the peak with attribution S-O and that of the peak
with attribution S-S was calculated (Table 25). It is observed for all the samples the
presence of a relative abundance of the S-O attribution relative to the peak attributed to
the S-S bond, in particular the sample with oxygen plasma treatment and maintenance in
physiological solution, in figure 73b., presents the lowest relative abundance in fact in
this case the percentage areas of the two contributions are visually more similar. Whereas,
the UV treated sample has the highest relative abundance of the S-O attribution (Figure
73d.). As in the previous cases, the UV treatment of slight peculiarities, suggesting that
this treatment has favored the formation and stabilization of this type of bond.
Smooth Ti-cp/Ker Area [%] Ratio
163.71 eV 41.18 1
168.5 eV 58.82 1.428
Smooth-Ti cp/PlasmaO2Physio/Ker Area [%] Ratio 163.58 eV 46.14 1
168.31 eV 53.86 1.167
Smooth-Ti cp/PlasmaO2Dry/Ker Area [%] Ratio 163.70 eV 41.87 1
168.51 eV 58.13 1.388
Smooth-Ti cp/Ker/UV Area [%] Ratio 163.71 eV 30.58 1
168.54 eV 69.42 2.270
Table 25. Summary of the percentage areas and ratios for the HR sulfur spectra

Results and discussions
149
In summary, these results suggest that the absence of differences between surface
treatments is most likely due to the thickness of the coating, which prevents this type of
analysis from providing information regarding the interface between the nanofibrous
coating and the titanium substrate. However, the XPS analysis made it possible to make
a slight distinction for the UV treatment, which having been carried out on the surface of
the coating and not on the surface of the titanium substrate, found small differences
compared to other treatments, especially for the areas distribution of most types of links
identified.

Results and discussions
150
2. ANTIBACTERIAL TREATMENT STUDY FESEM-EDS
FESEM
FESEM-EDS after Ag treatment of the samples coated with keratin
The samples analyzed were:
Smooth-Ti cp/Ker/Ag001
Smooth-Ti cp/Ker/Ag005
Smooth-Ti cp/Ker/Ag01
Figure 74. FESEM images (SE) of the three samples treated with AgNO3 at increasing magnifications for the study
of keratin globules. Bar scale= 10µm at magnification 2000x, bar scale= 2µm at magnification 5000x and bar
scale= 2µm at magnification 10000x

Results and discussions
151
From the images of Figure 74, at different magnifications of 2000x, 5000x and 10000x
respectively, it is observable not only a uniform distribution of the keratin coating over
the titanium substrate, but also a random orientation of the fibers and the absence of silver
precipitates. In particular, at 2000x magnification, it is possible to observe that the sample
with a higher concentration of Ag has a much more homogeneous coating, which is rich
in nanofibers compared to that of medium and low concentration samples. About samples
with medium and high concentration of Ag it is also possible to observe that the
distribution and orientation of the nanofibers is not influenced by the presence and
therefore by the level of concentration of Ag, since the deposition of Ag was performed
after the deposition of the keratin nanofibers. The causes of the different morphology of
deposited keratin may be due to factors that have influenced the electrospinning process,
such as incorrect positioning of the sample on the collector or a variation in humidity that
did not favor the deposition of the fibers. At 1000x magnification, the morphology of
keratin nanofibers becomes clearly visible, particularly, the nanofibers are randomly
arranged in the form of tangles.
Figure 75. FESEM images (SE) of the three samples treated with AgNO3 at increasing magnifications for the study
of silver precipitates. The orange circles highlight some of the micrometric subunits. Bar scale= 1µm at
magnification 30000x and bar scale= 100nm at magnification 100000x
At magnifications of 30kx and 100kx, in Figure 75, the conformation and the spatial
arrangement of the keratin nanofibers for each of the three samples taken into
consideration can be observed in more detail. As regards the sample with the highest
concentration of Ag, it is possible to observe the presence of submicrometric entities on

Results and discussions
152
the surface of some nanofibers. From the images to the FESEM one cannot, however,
conclude if such entities are precipitated of silver or superficial defects of the keratin
nanofibers. In Figure 75a, below, there are FESEM images of the three samples with the
relative diameters of the nanofibers, measured in a generic point of the surface of each
sample. It is possible to observe how the distribution of the nanofiber dimensions is
homogeneous.
Figure 75a. FESEM images (SE) of the three samples treated with AgNO3, with fiber diameters. Bar scale= 100nm
at magnification 10000x

Results and discussions
153
Figure 76. FESEM images (BSE) of the three samples treated with AgNO3. Bar scale= 10µm at magnification 2000x,
bar scale= 2µm at magnification 5000x and bar scale= 2µm at magnification 10000x
Figure 77. FESEM images (BSE) of the three samples treated with AgNO3. Bar scale= 1µm at magnification 30000x
and bar scale= 100nm at magnification 100000x

Results and discussions
154
Figures 76 and 77 are images, which show the acquisitions, for these three samples, in
back scattering, at 2kx, 5kx, 10kx and 30kx, 100kx magnification, respectively. In this
mode heavier elements are visualized in lighter color compared to lighter ones, such as
silver, which appears bright and clear. Silver, unlike previous work (56), is not observed
in the form of precipitates (scattered white dots), but in the form of light halos; while
lighter elements, such as carbon, appear dark. To determine whether the white halos are
attributable to the presence of silver, the EDS analysis was performed, while to say
whether it is ionic or metallic silver, the XPS analysis was carried out, discussed in the
next paragraphs.
EDS
Parallel to the FESEM analysis, the EDS analysis was performed to observe the
superficial elemental composition. The EDS analysis was carried out to obtain additional
information to those deriving from the sole FESEM analysis regarding the surface
chemical composition of the samples. It was carried out on: area and nanofiber. The
penetration depth of this technique is quite high (around the micron) and therefore the Ti
peaks are always present, even in the globule and fiber spectrum. For the same reason,
silver, which is present in small quantities, is not always detected. Sulfur, the presence of
which is indicative of cysteine residues present in keratin nanofibres.

Results and discussions
155
Smooth-Ti cp/Ker/Ag001 sample
Figure 78. EDS analysis of the areas and the keratin nanofiber of the sample “Smooth-Ti cp/Ker/Ag 001”
In the spectrum 2 of Figure 78, related to the nanofiber, appear the C and S indicative
keratin peaks and a peak of Ag, which reveals the occurrence of silver absorption within
the keratin coating. However, the atomic percentage is higher than those of the first and
second spectrum of Figure 78, since the nanofiber is very thin, and the EDS has a high
penetration depth in relation to it; therefore, in the totality of the atomic percentages, S
and Ag represent a very small part.

Results and discussions
156
Smooth-Ti cp/Ker/Ag005 sample
Figure 79. EDS analysis of the areas of the sample “Smooth-Ti cp/Ker/Ag 005”
As can be seen in Figure 79, the sample shows a peak of Ag on both the areas observed.
In this sample, the second spectrum of Figure 79 shows a Si peak, probably due to
contamination during the mechanical polishing phase of the samples, in which colloidal
silica was used.
Smooth-Ti cp/Ker/Ag01 sample
Figure 80. EDS analysis of the areas of the sample “Smooth-Ti cp/Ker/Ag 01”

Results and discussions
157
Here, as in the previous sample, the Ag peak is found in both areas, and the major value
is observed in the first spectrum of Figure 80. Furthermore, even in this sample, the
second spectrum shows a Si peak, probably due to contamination.
Table 26. Summary of averages and standard deviations of elements from area EDS for all samples with Ag
treatment
From Table 26 it is possible to observe how the high average percentage of Ti has been
detected on all samples and in almost equal percentages, followed by the high average
percentages of carbon and oxygen. The detection of titanium shows the range of depth
that this type of analysis is able to achieve, in fact, thanks to this analysis we have
information about the interface area between keratin coating enriched with Ag and
titanium substrate. the amount of silver increases moving from samples treated with Ag
0.001 to Ag 0.005 but remains stable further increasing the silver content in the treatment
solution.
Area EDS
Smooth-Ti cp/Ker/Ag001 Smooth-Ti cp/Ker/Ag005 Smooth-Ti cp/Ker/Ag01
Average Standard
Deviation Average
Standard
Deviation Average
Standard
Deviation
Element
[%]
C 32.69 0.282 34.425 0.049 32.765 0.247
N 7.715 0.388 8.325 0.388 8.835 0.403
O 28.42 0.141 28.985 0.982 29.255 0.728
S 0.3 0.042 0.35 0.042 0.315 0.021
Ti 30.625 0.007 27.465 1.407 28.34 0.183
Ag 0.255 0.007 0.39 0.049 0.395 0.014
Si / / 0.06 0.084 0.1 0.141

Results and discussions
158
FT-IR
The FT-IR analysis was carried out to observe on the surface of the samples the presence
and the type of atomic bonds. In this case, the atomic bonds characteristic of the keratin
nanofibers treated with silver, in order to observe the eventual presence of atomic bonds
or functional groups with antibacterial action. This analysis was conducted on the
following samples:
Smooth-Ti cp/Ker
Smooth-Ti cp/Ker/Ag001
Smooth-Ti cp/Ker/Ag005
Smooth-Ti cp/Ker/Ag01
Below are the FT-IR spectra of each sample in a single chart:
Figure 81. FT-IR characterization of the samples with the Ag treatment

Results and discussions
159
The peaks highlighted in figure 81 are related to the following chemical bonds (132):
N-H at 3278 cm-1;
C-H at 2921 cm-1;
CO2 not well compensated at 2355 cm-1;
-COOH at 1650 cm-1;
C=C at 1523-1542 cm-1;
C-N at 1221 cm-1;
S-O at 1020 cm-1;
In Figure 81 it is observed that most of the peaks present in the spectra of the samples
analyzed are identifying the same types of bonds, although the intensity is sometimes
weaker. This may be due not only to a homogeneous distribution of the keratin coating
but also to its thickness, which could prevent the detection of various chemical bonds as
well as take into account the fact that the measurement was performed even on a limited
area of the surface of the samples.
It is possible to observe from the FT-IR image of figure 81, that the spectrum of the
sample used as a control and therefore without treatment with Ag, has peaks which are as
those reported in the literature for keratin fibers, the same peaks reported in figure 68 for
samples with surface treatments to improve the adhesion of the keratin coating to the
titanium substrate. (142)
In Figure 81, it is observed that after the enrichment with Ag the S-O signal disappears at
1020 cm-1 and comparing this result with the subsequent XPS analysis we can suppose
the formation of S-Ag bonds. Unlike what was reported in the literature for copper, no
changes in the C=O signals are observed. (143)

Results and discussions
160
XPS
Table 27 shows the atomic percentages obtained from the Survey spectra of the various
samples:
Table 27. Atomic percentages from the four-sample Survey spectra
From the Table 27 it can be seen that compared to the EDS analysis, titanium was not
detected here, due to the lower penetration depth of the XPS (4-5 nanometers), while the
atomic percentages of carbon are higher. Carbon is present partly in the keratin coating
and partly as surface contamination, typical of reactive surfaces observed by XPS
analysis. The significant amount of oxygen usually attributed to titanium oxide TiO2,
which is created spontaneously on the surface of the titanium sample, in this work can be
mainly attributed to keratin because the depth range reached by the XPS analysis cannot
reach the interface between titanium substrate and keratin coating. As for silver, it was
detected on all samples, except for the one used as a control. As can be seen from Table
27, it is possible to observe that the atomic percentage of Ag is almost constant. However,
it is possible to notice a slight increase in Ag in the case of intermediate and high
concentration of the AgNO3 solution compared to the case of low concentration,
according to EDS analyses Nitrogen and sulfur are attributable to the keratin coating,
although the former is present with a higher atomic percentage. Finally, the presence of
fluorine and sodium is instead due to contamination.
Element Smooth-Ti
cp/Ker
Smooth-Ti cp
/Ker/Ag001
Smooth-Ti cp
/Ker/Ag005
Smooth-Ti cp
/Ker/Ag01
C 60.70 61.80 63.80 60.40
O 21.10 20.30 19.00 18.90
N 14.00 14.30 14.20 15.00
Na 2.30 0.20 / /
S 1.90 1.70 1.10 1.40
Ag / 1.70 1.90 1.90
F / / / 2.30

Results and discussions
161
Below, in figures 82a, 82b, 82c and 82d the Survey spectra for the three samples are
shown:
Figure 82a. Survey spectrum of Smooth-Ti cp/Ker sample
Figure 82b. Survey spectrum of Smooth-Ti cp/Ker/Ag001 sample

Results and discussions
162
Figure 82c. Survey spectrum of Smooth-Ti cp/Ker/Ag005 sample
Figure 82d. Survey spectrum of Smooth-Ti cp/Ker/Ag01 sample

Results and discussions
163
For each sample the high-resolution HR spectra of the carbon, oxygen, nitrogen and silver
regions were then acquired. The binding energies were corrected by matching the main
carbon peak to the bonding energy of 284.6 eV, according to conventional use. (134) The
possible attribution of the individual peaks was made on the basis of what reported in the
literature. (135) (136) In the following figures, the possible attributions of the binding
energies detected during the analysis are listed according to the detained element:

Results and discussions
164
a.
b.
c.
d.
Figure 83. HR carbon spectra for: a. Smooth Ti-cp/Ker, b. Smooth-Ti cp/Ker/Ag001, c. Smooth-Ti cp/Ker/Ag005, d.
Smooth-Ti cp/Ker/Ag01.

Results and discussions
165
The C-C, C-H, C-O and C=O bonds that appear in the spectra of both Figure 83 are
present probably due to the carbon as contaminant. These bonds, together with the C-S
and C-N, present in figure 83 and figure 84, are also contained in the primary structure of
keratin, so the contribution to the peaks in question is twofold. (137) (138)
For each sample the ratio between the percentage area of the detected peaks and the peak
area at 284 eV taken as reference was calculated (Table 28). It is observed for all samples
the presence of a relative reduction in the abundance of the attribution C-O/C-N compared
to the reference with the increase of the concentration of Ag. Also, for the attribution C=O
a relative reduction of the abundance with respect to the reference to the increase of the
concentration of Ag is detected, a small exception is made for the sample with a high
concentration of Ag, so there is a slight increase in relative abundance compared to cases
of samples with a low and intermediate concentration of silver. No peak displacement
was observed as a function of the increase in Ag concentration in the coating.
Smooth Ti-cp/Ker Area [%] Ratio
284.43 eV 32.24 1
285.64 eV 36.16 1.12
287.72 eV 31.60 0.98
Smooth-Ti cp/Ker/Ag001 Area [%] Ratio 284.54 eV 34.21 1
285.79 eV 37.84 1.1
287.86 eV 27.96 0.817
Smooth-Ti cp/Ker/Ag005 Area [%] Ratio 284.74 eV 55.67 1
286.09 eV 17.32 0.311
287.77 eV 27.01 0.48
Smooth-Ti cp/Ker/Ag01 Area [%] Ratio 284.80 eV 52.46 1
286.09 eV 18.05 0.34
287.77 eV 29.49 0.56
Table 28. Summary of the percentage areas and ratios for the HR carbon spectra

Results and discussions
166
a.
b.
c.
d.
Figure 84. HR oxygen spectra for: a. Smooth Ti-cp/Ker, b. Smooth-Ti cp/Ker/Ag001, c. Smooth-Ti cp/Ker/Ag005, d.
Smooth-Ti cp/Ker/Ag01

Results and discussions
167
In figure 84, for the first three samples, it is possible to identify two peaks, while for the
sample with a high concentration of Ag three contributions were identified. In all samples,
each peak corresponds to a specific bond with oxygen. The presence of the double carbon
C=O oxygen bond and the C-O bond is derived from keratin. (138) (139) While, the peaks
attributed to C-O-C, C-OH at higher energies, especially the peak at 533.77 eV in Figure
84d., can be attributed to the water present in the solution of AgNO3, which during the
enrichment with silver phase reacted with the keratin itself. For the samples in Figures
84a., 84b., 84c. and 84d., the ratio between the percentage area of the peak with the C-
O/C=O attribution and that of the peak attributed to C-O-C/C-OH has been calculated
(Table 29): For these samples we observe the presence of a relative abundance of the C-
O/C=O attribution increasing with increasing Ag concentration.
Smooth Ti-cp/Ker Area [%] Ratio
531.40 eV 76.40 1
533.06 eV 23.60 0.308
Smooth-Ti cp/Ker/Ag001 Area [%] Ratio 531.43 eV 69.28 1
532.85 eV 30.72 0.443
Smooth-Ti cp/Ker/Ag005 Area [%] Ratio 531.50 eV 84.12 1
533.28 eV 15.88 0.188
Smooth-Ti cp/Ker/Ag01 Area [%] Ratio 531.50 eV 74.61 1
532.79 eV 13.30 0.178
533.77 eV 12.09 0.162
Table 29. Summary of the percentage areas and ratios for the HR oxygen spectra

Results and discussions
168
a.
b.
c.
d.
Figure 85. HR nitrogen spectra for: a. Smooth Ti-cp/Ker, b. Smooth-Ti cp/Ker/Ag001, c. Smooth-Ti cp/Ker/Ag005, d.
Smooth-Ti cp/Ker/Ag01

Results and discussions
169
Regarding the nitrogen HR spectra, in Figure 85, the nitrogen peaks were attributed to
cysteine N-C (at 400 eV) and cystine N-C (at 401 eV) due to the confirmed presence of
sulfur fractions both in Table 27 and in the HR spectra in Figure 86. However, due to the
variety of amino acids present in keratin and the overlapping binding energies of cystine
in HR spectrum of nitrogen (N 1s), i.e. glycine, which is also present in the polypeptide
chain, these cannot be definitively assigned. (140) For each sample the ratio between the
percentage area of the peak attributed to the cysteine N-C bond and the percentage area
attributed to the cystine N-C bond was calculated (Table 30). The presence of an
increasing relative abundance of the cysteine N-C attribution with respect to cystine N-C
is observed for all samples, except for the sample with a low concentration of Ag, figure
85b., for which only the peak attributed to cysteine N-C is present. In particular, the
sample with a high concentration of Ag (Figure 85d.) shows a relative abundance of
cysteine N-C almost double compared to the sample with intermediate concentration of
Ag (Figure 85c.) and almost triple compared to the sample used as a control (Figure 85a.)
in addition to shifting both peaks, cysteine N-C to 399.87 eV and cystine N-C 401.21 eV
to higher energies.
Smooth Ti-cp/Ker Area [%] Ratio
399.71 eV 66.53 1
400.69 eV 33.47 0.503
Smooth-Ti cp/Ker/Ag001 Area [%] Ratio 399.92 eV 100 1
Smooth-Ti cp/Ker/Ag005 Area [%] Ratio 399.74 eV 76.81 1
400.69 eV 23.19 0.301
Smooth-Ti cp/Ker/Ag01 Area [%] Ratio 399.87 eV 86.52 1
401.21 eV 13.48 0.155
Table 30. Summary of the percentage areas and ratios for the HR nitrogen spectra

Results and discussions
170
a.
b.
c.
d.
Figure 86. HR sulfur spectra for: a. Smooth Ti-cp/Ker, b. Smooth-Ti cp/Ker/Ag001, c. Smooth-Ti cp/Ker/Ag005, d.
Smooth-Ti cp/Ker/Ag01

Results and discussions
171
Regarding the sulfur HR spectra, in Figure 86, the peaks were attributed to S-O (at 168.2-
168.7 eV), i.e. oxidised disulfide bonds of the cysteic acid residues of keratin, and to S-S
(at 163.9-164.0 eV), i.e. cystine disulfide bonds. As can be seen from Figure 86, all
spectra present noisy signals. (141) For the control sample the ratio between the
percentage area of the peak with attribution S-S and that of the peak with attribution S-O
was calculated (Table 31). While, for each of the samples with increasing Ag
concentration, the peak at lower energy undergoes a translation towards the low energies,
at 163.17 eV, 162.85 eV and 162.58 eV respectively; reason why in these cases the ratio
between the percentage areas of the peaks was calculated between the S-Ag and S-O
assignments. In particular, the sample with a low concentration of Ag (Figure 86a.) shows
a relative abundance of S-Ag almost double compared to the sample with intermediate
concentration of Ag (Figure 86c.) and slightly higher than the sample with a high
concentration of Ag (Figure 86d.). This result, already anticipated by the FT-IR analysis,
shows that silver in AgNO3 solution at different concentrations has been linked to sulfur
instead of oxygen.
Table 31. Summary of the percentage areas and ratios for the HR sulfur spectra
Smooth Ti-cp/Ker Area [%] Ratio 163.71 eV 41.18 1
168.5 eV 58.82 1.428
Smooth-Ti cp/Ker/Ag001 Area [%] Ratio 163.17 eV 85.52 1
168.45 eV 14.48 0.169
Smooth-Ti cp/Ker/Ag005 Area [%] Ratio 162.85 eV 73.80 1
168.52 eV 26.20 0.355
Smooth-Ti cp/Ker/Ag01 Area [%] Ratio 162.58 eV 83.14 1
168.51 eV 16.86 0.202

Results and discussions
172
a.
b.
c.
Figure 87. HR silver spectra for: a. Smooth-Ti cp/Ker/Ag001, b. Smooth-Ti cp/Ker/Ag005, c. Smooth-Ti cp/Ker/Ag01
The silver HR spectra, in Figure 87, allow the identification of two contributions for
samples at low and intermediate concentration of Ag (Figures 87a. and 87b). For the
sample with a high concentration of silver (figure 87c.) four peaks are identifiable: the
two at lower energy, 368.16 eV and 374.16 eV, are attributable to Ag metallic or S-Ag,
and in this case S-Ag was assumed as it would confirm what was seen in the FT-IR
analysis, while the two contributions to higher energies are satellite peaks attributable to
"charge transfer effects". (141) (144)

Results and discussions
173
Biological Tests
2.5.1. Bacterial tests
This test is used because of its greater specificity compared to the FESEM analysis. The
test involves the marking of bacteria, S. Aureus, with fluorophores thus being able to
distinguish between live and dead bacteria. Figures 88, 89 and 90 compares the viability
of the biofilm between the control samples and the samples with increasing concentration
of Ag, divided into the various classes:
Polystyrene (as control);
Smooth Ti-cp/Ker (as control);
Smooth Ti-cp/Ker/Ag001;
Smooth Ti-cp/Ker/Ag005;
Smooth Ti-cp/Ker/Ag01.
The viability of bacteria on these samples was assessed at 24, 48 and 72 hours,
respectively. In particular, optical density (O.D.) has been considered by means of a
spectrophotometer with a wavelength of 590 nm.
Figure 88. S. Aureus after 24h biofilm, XTT comparison between control samples and samples with increasing
concentration of Ag
0.0
0.1
0.2
0.3
0.4
0.5
0.6
Polystyrene Smooth-Ti cp Smooth-Ticp/Ker
Smooth-Ticp/Ker/Ag001
Smooth-Ticp/Ker/Ag005
Smooth-Ticp/Ker/Ag01
OD

Results and discussions
174
Figure 89. S. Aureus after 48h biofilm, XTT comparison between control samples and samples with increasing
concentration of Ag
Figure 90. S. Aureus after 72h biofilm, XTT comparison between control samples and samples with increasing
concentration of Ag
It is possible to observe, in all the figures 88, 89 and 90, that the number of live bacteria
decreases with increasing silver concentration, however only the sample with the highest
concentration shows a significant difference compared to the control. There are
significant differences of the sample with the highest concentration of Ag, both with
respect to the controls and to samples with a low and intermediate concentration of Ag.
0.0
0.1
0.2
0.3
0.4
0.5
0.6
Polystyrene Smooth-Ti cp Smooth-Ticp/Ker
Smooth-Ticp/Ker/Ag001
Smooth-Ticp/Ker/Ag005
Smooth-Ticp/Ker/Ag01
OD
0.0
0.1
0.2
0.3
0.4
0.5
0.6
Polystyrene Smooth TI-cp Smooth TI-cp/Ker
Smooth TI-cp/Ker/Ag001
Smooth TI-cp/Ker/Ag005
Smooth TI-cp/Ker/Ag01
OD

Results and discussions
175
Figure 10. Summary of XTT comparison between control samples and samples with increasing concentration of Ag at
different hours
This biological test has therefore confirmed what was observed in the FESEM images:
the samples with the keratin coating enriched with high concentration silver show the
best antibacterial behavior.
0.0
0.1
0.2
0.3
0.4
0.5
0.6
24 48 72
OD
TIME (hours)
Polystyrene Smooth-Ti cp Smooth-Ti cp/Ker
Smooth-Ti cp/Ker/Ag001 Smooth-Ti cp/Ker/Ag005 Smooth-Ti cp/Ker/Ag01

Results and discussions
176
2.5.1.1 FESEM after bacterial test
Figure 11. FESEM images after bacterial test of the four samples. Bar scale = 10µm at magnifications of 5000x and
bar scale= 2µm at magnification 10000x
Observing the FESEM images of figure 92, it can be stated that the quantity of bacteria
on the control sample, i.e. the one without silver, is considerably higher than the amount
present on the samples treated with Ag, for both magnification. It is possible to observe

Results and discussions
177
a trend of the quantity and distribution of bacteria as a function of the concentration of
Ag, with the increase of the latter the quantity of bacteria decreases.
2.5.2. Cell test
This test is used because of its greater specificity compared to the FESEM analysis. The
graphs below (figures 93, 94 and 95) show the data obtained from the evaluation of the
vitality of HGFs cells (Human gingival fibroblasts) after 24, 48 and 72 hours of seeding.
Figures 93, 94 and 95 compares the control samples and the samples with increasing
concentration of Ag, divided into the various classes:
Polystyrene (as control);
Smooth Ti-cp/Ker (as control);
Smooth Ti-cp/Ker/Ag001;
Smooth Ti-cp/Ker/Ag005;
Smooth Ti-cp/Ker/Ag01.
Cell viability was studied using the Alamar Blue method, detecting the RFU or the
“Relative Fluorescence Unit”, that is a unit of measurement used in the electrophoresis
analysis method which employs fluorescence detection.
Figure 12. HGFs after 24h, comparison between control samples and samples with increasing concentration of Ag
0
200
400
600
800
1000
1200
1400
Polystyrene Smooth-Ti cp Smooth-Ticp/Ker
Smooth-Ticp/Ker/Ag001
Smooth-Ticp/Ker/Ag005
Smooth-Ticp/Ker/Ag01
RFU

Results and discussions
178
Figure 13. HGFs after 48h, comparison between control samples and samples with increasing concentration of Ag
Figure 14. HGFs after 72h, comparison between control samples and samples with increasing concentration of Ag
As it is possible to see in Figures 93, 94 and 95, substantial differences between the
various samples for cell viability are not observable, this means that all the samples,
including the controls, are considered by the cells used, as favorable substrates for cell
adhesion. Unlike the case of the bacterial test (Figures 88, 89 and 90), the Ag high
concentration sample does not present, in a tangible way, a better behavior than both the
0
200
400
600
800
1000
1200
1400
1600
Polystyrene Smooth-Ti cp Smooth-Ticp/Ker
Smooth-Ticp/Ker/Ag001
Smooth-Ticp/Ker/Ag005
Smooth-Ticp/Ker/Ag01
RFU
0
200
400
600
800
1000
1200
1400
1600
1800
Polystyrene Smooth Ti-cp Smooth Ti-cp/Ker
Smooth Ti-cp/Ker/Ag001
Smooth Ti-cp/Ker/Ag005
Smooth Ti-cp/Ker/Ag01
RFU

Results and discussions
179
low and intermediate Ag concentration samples, but also with respect to the two control
samples.
Figure 15. Summary of comparisons between control samples and samples with increasing concentration of Ag at
different hours
The extracellular matrix (ECM) deposition was investigated by means of collagen
deposition; results are reported in Figure 97. This observation looks particular evident by
checking the staining of actin filaments, stained in red with phalloidin, and vimentin,
stained in green. In general, no conspicuous differences were noticed between samples
with different Ag concentration. In fact, cells were able to correctly deposit collagen
independently from the antibacterial treatment intensity.
Figure 16. Cell matrix deposition onto samples with antibacterial treatment
0
200
400
600
800
1000
1200
1400
1600
1800
24 48 72
RFU
Time (hours)Polystyrene Smooth Ti-cp Smooth Ti-cp/KerSmooth Ti-cp/Ker/Ag001 Smooth Ti-cp/Ker/Ag005 Smooth Ti-cp/Ker/Ag01

Results and discussions
180
2.5.2.1. FESEM after cell test
Figure 17. FESEM images after cellalur test of the samples treated with Ag. Bar scale = 100µm at magnification
500x and bar scale = 20 µm at magnification 1000x

Results and discussions
181
Figure 18. FESEM images after cellalur test of the samples treated with Ag. Bar scale = 20µm at magnification
2000x and bar scale = 10µm at magnification 5000x

Results and discussions
182
Figure 100. FESEM images after cellalur test of the samples treated with Ag. Bar scale = 2µm, magnification
10000x

Results and discussions
183
Observing the FESEM images of Figures 98, 99 and 100, it can be stated, though in a
qualitative way, that the amount of HGF on the control sample after 72 hours of seeding,
i.e. the one without silver (Smooth-Ti cp/Ker/Cells 72h), is equal to the amount present
on the samples treated with Ag, for all the magnifications. This data demonstrates the
non-cytotoxicity of the substrate also in the presence of silver, which in addition to having
an antibacterial effect, reveals, at high concentrations of Ag, a cytotoxic effect. It is
possible to observe, in addition to a homogeneous distribution of the cells on the surface
of the samples, that the cells have a "flattened" conformation, i.e. the occurrence of
cellular spreading can be noted; this means that the substrate with keratin nanofiber
coating and antibacterial solutions, is a cytocompatible substrate that promotes cell
adhesion.
3. EBW SAMPLES STUDY Wettability
Two wettability tests were performed, both under ambient conditions. The first test was
performed on samples stored in Petri dishes, the second test, however, was performed on
samples with bacterial broth, in order to detect any change in the hydrophilic/hydrophobic
characteristics of the sample surface. Tables 32 and 33 show the wettability values for the
samples analyzed. The mean and standard deviation of the values obtained for both tests
were calculated. In order to facilitate the comparison between the sample types and
between the two tests, the data were reported on a bar graph (Fig. 101 and Fig. 102),
enriched with the images of the morphology assumed by the drop of water milli-Q on the
surface of the sample.
Smooth-Ti cp Mechanically roughed-Ti cp EBW 5 EBW 10 EBW 30
Values
72.4 78.2 80.3 103.8 88.8
79.9 79.8 90.7 81.8 88.04
76.8 89.5 84.1 91.4 79.4
71.8 85.5 77.6 89.2 87.0
Average 75.225 83.25 83.175 91.55 85.81
Standard
Deviation 3.831 5.213 5.681 9.140 4.336
Table 32. Table of wettability in case of dry conserved samples

Results and discussions
184
Figure 19. Change in wettability with superficial topography of titanium expressed as an average of the values
measured during the first wettability test.
As can be seen in Figure 101, the contact angle tends to slightly increase in the presence
of grooves with respect to both the smooth sample and the mechanically roughened
sample. In particular, the sample with grooves of 10 µm makes the titanium substrate
more hydrophobic, to follow the sample with grooves of 30 µm and then 5 µm. This
means that superficial topography plays a key role in this scope. Compared to previous
works the values obtained are different, in this case the samples have a more marked
hydrophobicity, that is a greater contact angle.
The explanation could lie in a possible contamination of the samples, which tends to make
the surface more hydrophobic. In this work, this result will be compared with the results
of cell and bacterial tests, since it is known in the literature that the superficial topography
is able to influence the capacity of cell adhesion and consequently also the proliferation,
as well as the hydrophobicity/hydrophilicity of the surface.
0
10
20
30
40
50
60
70
80
90
100
Smooth-Ti cp Mechanicallyroughed-Ti cp
EBW 5 EBW 10 EBW 30
Co
nta
ct A
ngl
e [°
]

Results and discussions
185
Figure 20. Change in wettability with superficial topography of titanium expressed as an average of the values
measured during the second wettability test
As can be seen in Figure 102, in presence of bacterial broth, the contact angle tends
increases in EBW samples with 30 µm and 5 µm grooves dimensions respect to the
smooth sample. Compared to previous wettability test, in which the samples were
maintained in Petri dishes before the test, the values obtained are very different, in fact
the samples present a less hydrophobicity. The explanation could lie in the bacterial
adhesion on the substrates, which tends to make the surfaces less hydrophobic. These
results will be compared with the results of cell and bacterial tests.
60.0
62.0
64.0
66.0
68.0
70.0
72.0
74.0
76.0
78.0
Smooth-Ti cp EBW 5 EBW 10 EBW 30
Co
nta
ct A
ngl
e [°
]
Smooth-Ti cp EBW 5 EBW 10 EBW 30
Values
72.5 76.4 67.9 78.0 69.0 69.5 69.0 79.6 65.7 79 / 74.2 74.1 / / 70.0
Average 70.325 74.966 68.450 75.450 Standard Deviation 3.747 4.909 0.777 4.281
Table 33. Table of wettability in the case of samples previously stored in bacterial broth

Results and discussions
186
Zeta potential
The measurement of the zeta potential was performed on the following samples, in order
to investigate the surface charge:
EBW5 samples;
EBW10 samples;
EBW30 samples;
Smooth-Ti cp samples (as controls);
Metallic Ag foils.
Here are curves that represent the potential zeta of the samples listed above. The
commercially pure smooth titanium sample used as a control, was obtained from a
previous work and shows an acid behavior: its isoelectric point is at pH = 4 and at
physiological pH (pH = 7.4) its surface is negatively charged.
Figure 21. Zeta potential of the analyzed samples

Results and discussions
187
From the observation of Figure 103 it would seem that all the curves have a decreasing
trend as the pH increases and therefore at physiological pH the surface charge of the
samples is negative. Moreover, as the size of the grooves augments, the isoelectric point
slightly increases, i.e. higher pH values are observed with respect to the pH value of the
isoelectric point of the sample used as control. The surface charge at physiological pH is
maintained, for all samples, on negative values, although it is not possible to find a trend
according to the increasing dimensions of the grooves. Table 34 provides a summary of
the considerations made previously:
Type of Sample IEP z (pH=7.4) [mV]
EBW 5 4.2 -75.85
EBW 10 4.25 -72
EBW 30 4.51 -116.68
Smooth-Ti cp 4 -80
Table 34. IEP and surface charge at pH=7.4 of analyzed samples
Figure 104. Zeta potential of the Metallic Ag foils
Figure 104 represents the zeta potential for the silver-only sample. It is possible to see,
there it was not possible to determine the isoelectric point (it falls at too acidic values,
probably close to 2.5), although the literature reports an IEP of 10.4 for silver films. (145)
A possible explanation of the detected IP value for metallic Ag could be its oxidation
before performing the zeta potential measurement.

Results and discussions
188
Biological tests
3.3.1. Bacterial test
The test involves the marking of bacteria, S. Aureus, with fluorophores thus being able to
distinguish between live and dead bacteria. Results obtained by infecting bare titanium
control and EBW treated samples with S. aureus biofilm are reported in Figure 105.
Figure 22. Antibacterial activity. Results are summarized in function of time in (E) and (J). Bars represent averages
and standard deviations
The EBW treatment introduced anti-adhesive properties for bacteria to the samples
surfaces up to 48h. In general, the EBW treatment introduced anti-adhesive properties to
the treated samples surfaces that made difficult bacteria adhesion. In fact, after 2 hours
infection the viable biomass was lower in grooved samples in comparison with untreated
controls (A). Similar results were noticed at 24h (B), 48h (C) and 72h (D), where the

Results and discussions
189
grooved samples result less contaminated, as summarized in (E). However, for all the
samples bacteria growth was quite linear (E) thus leading to the supposition that the EBW
were not effective in cause bacteria death but in decreasing the number of adherent
bacteria. Consequently, the CFUs count was assayed at the same time-points achieved for
the Alamar blue test. A possible explanation comes from attached colonies count: after
2h the number of adhered bacteria was about 2 logs reduced onto EBW grooved samples
in comparison to the controls (F). Accordingly, similar results were achieved at 24h (G),
48h (H) and 72h (I), confirming bacteria difficulty to colonize treated surfaces. However,
also CFUs count assay confirmed that the number of viable bacteria increased in function
of time (J) thus confirming that the antibacterial properties introduced by the EBW
treatment are actually related to the enhanced bacteria difficulty to adhere to the surface.
3.3.2. Cell test
Cells viability evaluation results are reported in Figure 106. Both direct (A) and indirect
assay (B) did not reported any significant differences between the grooved samples and
the control sample (p>0.05) after 48 hours cultivation. Moreover, no statistically
significant differences were noticed between data representative for different groove sizes
(p>0.05). Subsequently, it can be supposed that the surface modification made by EBW
technique did not introduce any toxic compound.
Figure 23. Cytocompatibility evaluation. Bars represent averages and standard deviations

Results and discussions
190
It is observed how the different surface grooves size influence cells spread and
cytoskeleton orientation during the 48 hours cultivation. In fact, as shown in Figure 107,
cells seem to follow grooves orientation when groove size is of 10 µm (B): this
observation looks particular evident by checking the staining of actin filaments (stained
in red with phalloidin) and of vimentin (stained in green). On the opposite, only a
moderate surface influence was noticed for 5 µm sized grooves where cells differed in
terms of cytoskeleton orientation when random regions of samples were microscope
investigated (A). Similarly, no surface influence was detected when cells were cultivated
onto 30 µm sized grooves: cells cytoskeleton orientation was found to be randomly
different onto different samples areas (C).
Figure 24. Surface grooves influence on cells cytoskeleton orientation. Bar scale= 50µm at magnification 20x

Results and discussions
191
The extracellular matrix (ECM) deposition was investigated by means of collagen
deposition. Results are reported in Figure 108 and revealed no conspicuous differences
between different sized grooves samples. In fact, cells were able to correctly deposit
collagen independently from the surface grooves size. Therefore, cells extracellular
matrix (ECM) statement was not found to be related or influenced by the different size of
samples’ surface grooves. However, as prior showed by vimentin staining, also collagen
confirmed that cells were influenced by the presence of 10 µm grooves as also the ECM
was deposited following the substrate surface topography.
Figure 25. Cell matrix deposition onto grooved samples. Bar scale= 50µm at magnification of 20x
In general, HGFs were able to correct adhere and subsequently deposit collagen (stained
in green) onto all different grooved samples.

Results and discussions
192

193
CONCLUSIONS
The aim of this thesis work has been to carry out a superficial modification on the collars
of titanium dental implants, which is optimal both in promoting cell adhesion and in
preventing bacterial adhesion. To do this, we focused on four main aspects: the
topography, the surface coating in keratin, the treatment of the titanium surface to
stimulate the adhesion of the keratin coating and the enrichment with silver ions of this
coating. Regarding topography, commercially pure titanium (grade 2) samples have been
submitted to two types of treatment. The first consisted of making parallel grooves using
Electron Beam Welding (a process in which a high-speed electron beam is bombarded on
the material), at the Technical University of Graz. These samples were superficially
characterized by analysis of ζ potential, and the cytocompatibility against human gingival
fibroblasts (HGFs) and the antibacteriality against Staphylococcus Aureus bacteria were
evaluated. The superficial topography, with the grooves, turns out to be able to influence
the orientation of the cells. On the other hand, the second type of samples was subjected
to a superficial mechanical modification at the Polytechnic of Turin: the samples were
polished to a mirror (smooth) and on a part of them surface treatments were performed
such as plasma activation with oxygen, in order to make the surface more reactive to the
subsequently deposited nanofiber coating, while a second part has not been treated. Both
types of surfaces were coated with keratin nanofibers, deposited by the electrospinnig
technique. Some samples, only coated with nanofibers, underwent a post treatment with
UV irradiation in order to "activate" the surface and make the keratin coating more
adherent to the titanium substrate. The evaluation of the quality of the adhesion was made

Conclusions
194
by Tape Test, while the FT-IR and XPS analyzes of the samples used for the adhesion
study did not show distinctive and significant results depending on the type of surface
treatment applied to the surface in titanium. It can be concluded that this is due
exclusively to the high thickness of the keratin coating obtained during the deposition
phase. Instead, for the part of samples intended for antibacterial treatment, these were
immersed in a solution of silver nitrate at various concentrations (low, intermediate and
high) exploiting the ability of keratin to retain metal ions. The analyzes at FESEM have
shown that keratin is deposited on titanium in the form of nanofibers with an arrengment
in such a way as to form skeins. Unlike previous works, no sub-micrometric precipitates
of silver were observed on all samples. In addition, silver percentages were found on the
nanofibers, indicative of the fact that the antibacterial agent was retained by keratin, as
was expected. The high resolution XPS analysis confirmed the presence on all samples
of ionic silver, which in the case of higher concentration of silver directly binds to the
sulfur of keratin. The results of the bacterial adhesion test on these samples showed that
both the adhesion and the metabolism of the bacteria decrease with increasing silver
concentration. The images at FESEM and the spectrophotometric ones show that the
samples coated with keratin and enriched with silver at higher concentration have the best
antibacterial behavior. In addition, the results of cellular tests show good cell adhesion,
followed by spreading, on all samples, a sign that the silver has no cytotoxic effects. For
the group of samples treated with Eectron Beam Welding technique, with grooves of three
different sizes, 5μm, 10μm and 30 μm respectively, the wettability studies show a reduced
hydrophilicity compared to the smooth titanium surface, regardless of the groove size.
Biological tests on these samples revealed the anti-adhesive ability against bacteria, rather
than a bactericidal ability. This capacity increases with increasing grooves size. As for
cellular tests on these samples, the grooves encourage both cell adhesion and spreading,
favoring the orientation of the adherent cells to the substratum and favoring the deposition
of collagen by fibroblasts. In conclusion, it can be said that the grooves of 10μm and
above 30μm could be a valid alternative to mechanical surface treatment. Additional
future prospects could be those able to steer the keratin nanofibers parallel to the grooves,
in an attempt to increase the cellular response.

195
BIBLIOGRAPHY
1. Feughelman M 1997 Mechanical Properties and Structure of Alpha-Keratin Fibres: Wool Human
Hair and Related Fibres. University of New South Wales Press, Sydney;
2. Sun TT, Green H. Keratin filaments of cultured human epidermal cells. Formation of
intermolecular disulfide bonds during terminal differentiation, J Biol Chem. 1978; 253:2053–
2060;
3. Fraser R D B, MacRae T P, Rogers G E 1972 Keratins, Their Composition Structure and
Biosynthesis. CC Thomas Publishing, Springfield, MA;
4. Bowden PE, Quinlan RA, Breitkreutz D, Fusenig NE. Proteolytic modification of acidic and basic
keratins during terminal differentiation of mouse and human epidermis, Eur J Biochem. 1984;
142:29–36;
5. Marshall RC. Characterization of the proteins of human hair and nail by electrophoresis. J Invest
Dermatol. 1983; 80:519–524;
6. Hanukoglu I, Fuchs E. The cDNA sequence of a Type II cytoskeletal keratin reveals constant and
variable structural domains among keratins. Cell. 1983; 33:915–924;
7. H.H. Bragulla, D.G. Homberger, Structure and functions of keratin proteins in simple, stratified,
keratinized and cornified epithelia, Journal of Anatomy 214 (2009), pp 516-559;
8. Buschow, K.H. Jürgen Cahn, Robert W. Flemings, Merton C. Ilschner, Bernhard Kramer, Edward
J. Mahajan, Subhash, Encyclopedia of Materials Science and Technology, 2001, Volumes 1-11,
pp 4363-4368. Elsevier;
9. M. Feughelman, Mechanical Properties and Structure of Alpha-Keratin Fibres: Wool Human
Hair and Related Fibres, 1997, University of New South Wales Press, Sydney;
10. N. Eslahi, F. Dadashian, N. Hemmati Nejad, AN INVESTIGATION ON KERATIN EXTRACTION
FROM WOOL AND FEATHER WASTE BY ENZYMATIC HYDROLYSIS, Volume 43, 2013, issue
7, Preparative Biochemistry and Biotechnology, pp 624-648;
11. P. Kakkar, B. Madhan, G. Shanmugam, Extraction and characterization of keratin from bovine
hoof: A potential material for biomedical applications, Springerplus, 2014, pp 3:596;
12. http://www.cittastudi.org/flex/files/D.ab24f0d30c930be8056b/tesina_dotti.pdf;
13. N. Bhardwaj, S. C. Kundu, Electrospinning: A fascinating fiber fabrication technique, Volume
28, Issue 3, May–June 2010, pp 325–347;
14. Sutter, V. L. (1984). Anaerobes as normal oral flora. Reviews of infectious diseases. 6 Suppl 1:
S62–S66. PMID 6372039;
15. https://it.wikipedia.org/wiki/Batteri_Gram-positivi;
16. Rogers A H (editor). (2008). Molecular Oral Microbiology. Caister Academic Press. ISBN 978-
1-904455-24-0;

Bibliography
196
17. M. Sundaram, R. Legadevi, N. Afrin Banu, V. Gayathri, A. Palanisammy, A Study on Anti-
Bacterial Activity of Keratin Nanoparticles from Chicken Feather Waste Against Staphylococcus
aureus (Bovine Mastitis Bacteria) and its Anti-Oxidant Activity. European Journal of
Biotechnology and Bioscience, Volume: 3, Issue: 6, 01-05June 2015;
18. https://www.google.com/patents/US6214576;
19. F.H.M. Mikx, M.H. De Jong, Keratinolytic activity of cutaneous and oral bacteria, Infection and
Immunity 55 (1987), pp 621-625;
20. A. Riffel, A. Brandelli, Keratinolityc bacteria isolated from feather waste, Braz. J. Microbiol. Vol.
37, No. 3, July/Sept. 2006;
21. U. Samen, B.J. Eikmanns, D.J. Reinscheid, F. Borges, The Surface Protein Srr-1 of Streptococcus
agalactiae Binds Human Keratin 4 and Promotes Adherence to Epithelial HEp-2 Cells, Infect
Immun. 2007 Nov; 75(11): 5405–5414;
22. Batchelor, M., J. Guignot, A. Patel, N. Cummings, J. Cleary, S. Knutton, D. W. Holden, I.
Connerton, and G. Frankel. 2004. Involvement of the intermediate filament protein cytokeratin-
18 in actin pedestal formation during EPEC infection. EMBO Rep. 5:104–110;
23. “Fibroblast”. Genetics Home Reference. U.S. National Library of Medicine. 2014-05-05.
Retrieved 2014-05-10;
24. https://www.ncbi.nlm.nih.gov/pubmed/9553764;
25. http://www.acrobiosystems.com/A481-CD71--TFRC--TFR-Molecule.html;
26. https://www.ncbi.nlm.nih.gov/gene/942;
27. https://www.ncbi.nlm.nih.gov/gene/4267;
28. “The interrelationship between human gingival fibroblast differentiation and cultivating time”,
Tissue Engineering and Regenerative Medicine, April 2013, Volume 10, Issue 2, pp 60-64;
29. S. Wang, F. Taraballi, L. Poh, T.K. Woei, Human keratin hydrogels support fibroblast attachment
and proliferation in vitro, Cell Tissue Res (2012) 347, pp 795–802;
30. R.V. Zackroff, Isolation and Characterization of Keratin-like Proteins from Cultured Cells with
Fibroblastic Morphology, J Cell Biol. 1984 Apr;98(4), pp 1231-7;
31. A. Tachibana, Y. Furuta, H. Takeshima, T. Tanabe, K. Yamauchi, Fabrication of wool keratin
sponge scaffolds for long-term cell cultivation, Journal of Biotechnology 93 (2002), pp 165–170;
32. http://www.chimicamo.org/tutto-chimica/proprieta-antimicrobiche-dellargento.html;
33. I. Sondi, B. S. Sondi, Silver nanoparticles as antimicrobial agent: a case study on E. coli as a
model for Gram-negative bacteria, Journal of Colloid and Interface Science 275 (2004), pp 177–
182;
34. J. S. Kim, E. Kuk, K. N. Yu, J. Kim, Antimicrobial effects of silver nanoparticles, Nanomedicine:
Nanotechnology, Biology, and Medicine 3 (2007), pp 95– 101;
35. D. Yu, W. Tian, B. Sun, Y. Li, W. Wang, W. Tian, Preparation of silver-plated wool fabric with
antibacterial and anti-mould properties, Materials Letters 151 (2015), pp 1-4;
36. L. Hadad, N. Perkas, Y. Gofer, A. Ghule, A. Gedanken, Sonochemical Deposition of Silver
Nanoparticles on Wool Fibers, Wiley InterScience (2006);
37. Gedanken, A. Ultrason Sonochem 2004, 11, 47;

Bibliography
197
38. X. Lü, S. Cui, Wool keratin-stabilized silver nanoparticles, Bioresource Technology 101 (2010),
pp 4703–4707;
39. www.medeco.de/it/odontostomatologia;
40. Mupparapu M, Beideman R. Imaging for maxillofacial reconstruction and implantology. In:
Fonseca RJ, editor. Oral and maxillofacial surgery: reconstructive and implant surgery.
Philadelphia: Saunders; 2000. p. 17e34;
41. PI Branemark, Osseointegration and its experimental background. J Prosthet Dent 1983;
50:399e410;
42. PI Branemark, R. Adell, U Breine, BO Hansson, J Lindstrom, A. Ohlsson, Intraosseous anchorage
of dental prostheses. I. Experimental studies. Scand J PlastReconstr Surg 1969; 3:81e100;
43. A.D. Pye, D.E.A. Lockhart, M.P. Dawson, C.A. Murray, A.J. Smith, A review of dental implants
and infection, Journal of Hospital Infection (2009) 72, 104e110;
44. F. Signoriello, Università di Padova, Fallschussel G.K.H., Implantologia odontoiatrica: teoria e
pratica, Edinava, 1989;
45. http://www.treccani.it/enciclopedia/implantologia_(Dizionario-di-Medicina);
46. http://www.ing.unitn.it/~colombo/Materiali%20per%20l'implantologia%20dentale/9.%20L'impl
antologia%20dentale.htm;
47. F. Truffa Giachet, Politecnico di Torino, MODIFICHE MICROTOPOGRAFICHE E
DEPOSIZIONE DI NANOFIBRE DI CHERATINA PER OTTIMIZZARE LE INTERAZIONI
DEL TITANIO CON I TESSUTI MOLLI, 2014;
48. http://traveltodentist.com/it/servizi/implantologia-dentale/impianti-a-carico-immediato-o-
impianti-a-carico-differito/;
49. http://www.osstell.com/$-1/file/25045-00-it-isq-whitebook-lr.pdf;
50. Demetrescu I., Pirvu C., Mitran V., Effect of nano-topographical features of Ti/Tio2electrode
surface on cell response and electrochemical stability in artificial saliva. Bioelectrochemistry 79
(2010): 122 – 129;
51. M. Yoshinari, K. Matsuzaka, T. Inoue, Y. Oda, M. Shimono, Effects of multigrooved surfaces on
fibroblast behaviour. Biomed Mater Res 65A, 359-368, 2003;
52. Franco Bengazi, Jan L. Wennstrӧme Ulf Lekhom, Recession of the soft tissue margin at oral
implants. Clin Oral Imple Res 1996: 7: 303-310;
53. http://www.treccani.it/enciclopedia/periodonto/;
54. Redesigning Macrostructure of Dental Implant for Better Initial Stability & Reduction of Tissue
Recession, 6/22/2011;
55. C. Bruckmann, X. F. Walboomers, K. Matsuzaka, J. A. Jansen, Periodontal ligament and gingival
fibroblast adhesion to dentin-like textured surfaces, Biomaterials 26 (2005), 339-346;
56. Tesi cerone;
57. Buser D, Merickse-Stern R. Long term evaluation of nonsubmerged ITI implants. Part 1: 8-year
life table analysis of a prospective multicenter study with 2359 implants. Clin Oral Implant Res.
1997; 8:161–72;

Bibliography
198
58. Kolenbrander PE, Anderson RN, Blehart DS. Communications among oral bacteria. Microbiol
Mol Bio Rev. 2002; 66:486–05;
59. Hojo K, Nagaoka S, Oshima T. Bacterial interactions in dental biofilm development. J Dent Res.
2009; 88: 982–90;
60. Bassler BL, Wright M, Silverman MR. Multiple signaling systems controlling expressions of
luminescence in Vibrio harveyii: Sequence and function of genes encoding a secondary sensory
pathway. Mol Microbio. 1994; 13:273–86;
61. Mombelli A. Prevention and therapy of peri-implant infections. In: Lang NP, Karring T, Lindhe
J, editors. Proceedings of the 3rd European Workshop on Periodontology: implant dentistry.
Berlin: Quintessence; 1999. p. 281e303;
62. A.G. Gristina, Biomaterial-centered infection: microbial adhesion versus tissue integration.
Science 1987;237: 1588;
63. S. Manoj, D. K. Prasad, U.N. Sangeetha, C. Hedge, Platform Switching: A New Era in Implant
Dentistry, Int J of Oral Implantology and Clinical Reasearch, May-August 2010; 1(2): 61-65;
64. https://en.wikipedia.org/wiki/Platform_switching;
65. R. Vijayalakshmi, T. Ramakrishnan, Platform switch dental implants – Search for evidence: An
overview. SRM J Res Dent Sci 2016; 7:101-5;
66. R.J. Lazzara, S.S. Porter, Platform switching: A new concept in implant dentistry for controlling
postrestorative crestal bone levels, Int J Periodontics Restorative Dent 2006; 26:9-17;
67. B. Wagenberg, S.J. Froum, Propspective study of 94 platform-switched implants observed from
1992 to 2006, Int J Priodontics Restorative Dent 2010; 30: 9-17;
68. X. Rodriguez-Ciurana, X. Vela-Nebot, M. Segala-Torres, The effect of interimplant distance on
the heigh of the interimplant bone crest when using platform-switcheed implants. Int J Periodontics
Restorative Dent 2009; 29:141-151;
69. Yu, A short term clinical study of marginal bone level change around microthreaded and platform-
switched implants, J Periodontal Implant Sci. 2011 October; 41(5): 211-217;
70. C. Mangano, F. Mangano, J.A. Shibli, L. Tettamanti, M. Figliuzzi, S. d’Avila, R.L. Sammons, A.
Piattelli, Prospective Evaluation of 2,549 Morse Taper Connection Implants: 1- to 6-Year Data, J
Periodontol • January 2011;
71. Tesmer M, Wallet S, Koutouzis T, Lundgren T. Bacterial colonizationof the dental implant
fixture–abutment interface: An in vitro study. J Periodontol 2009; 80:1991–1997;
72. Merz BR, Hunenbart S, Belser UC. Mechanics of the implant–abutment connection: An 8-degree
taper compared to a butt joint connection. Int J Oral Maxillofac Implants 2000; 15:519–526;
73. C.M. Schmitt, G. Nogueira-Filho, H.C. Tenenbaum, J.Y. Lai, C. Brito, H. Doring, J. Nonhoff,
Performance of conical abutment (Morse Taper) connection implants: A systematic review, 2013;
74. D. LAURITANO, C.A. BIGNOZZI, D. PAZZI, F. CURA, F. CARINCI, Efficacy of a new coating
of implant-abutment connections in reducing bacterial loading: an in vitro study;
75. Yeo IS, Min S, Yang JH. An Influence of bioactive material coating of Ti dental implant surfaces
on early healing and osseointegration of bone. J Kor Phys Soc. 2010;57: 1717–20;

Bibliography
199
76. H.I. Nassar, M.F. Abdalla, Bacterial leakage of different internal implant/abutment connection,
future dental Journal I (2015) I-5;
77. Harder S, Dimaczek B, Acil Y, Terheyden H, Freitag-Wolf S, Kern M. Molecular leakage at
implant-abutment connectionein vitro investigation of tightness of internal conical implant-
abutment connections against endotoxin penetration. Clin Oral Investig 2010;14(4):427e32;
78. Cosyn J, Van Aelst L, Collaert B, Persson GR, De Bruyn H. The peri-implant sulcus compared
with internal implant and suprastructure components: a microbiological analysis. Clin Implant
Dent Relat Res 2011;13(4):286-95;
79. Steinebrunner L, Wolfart S, Bossmann K, Kern M. In vitro evaluation of bacterial leakage along
the implant-abutment interface of different implant systems. Int J Oral Maxillofac Implants
2005;20(6):875-81;
80. Hazel Assender, Valery Bliznyuk, Kyriakos Porfyrakis, How Surface Topography Relates to
Materials’ Properties, Science 297, 973 (2002);
81. A. Curtis, C. Wilkinson, Biomaterials 18, 1573 (1997);
82. Hazel Assender, Valery Bliznyuk, Kyriakos Porfyrakis, How Surface Topography Relates to
Materials’ Properties, Science 297, 973 (2002);
83. Albrektsson et al. 1981) (Albrektsson, T., Branemark, P.I., Hansson, H.A. & Lindstom, J. (1981)
Osseointegrated titanium implants. Acta Orthopaedica Scandinavica 52:155–170;
84. Stout, K.J., Davis, E.J.& Sullivan, P.J. (1990) Atlas of Machined Surfaces. Chapman and Hall:
London;
85. Albrektsson, T. & Wennerberg, A. (2004) Oral implant surfaces: part 1 – review focusing on
topographic and chemical properties of different surfaces and in vivo responses to them.
International Journal of Prosthodontics 17: 536–543;
86. Albrektsson T, Wennerberg A. (2004) Oral implant surfaces: part 2 – review focusing on clinical
knowledge of different surfaces. Int J Prosthodont 2004; 17:544–64;
87. Cochran DL. A comparison of endosseous dental implant surfaces. J Periodontol 1999; 70:1523–
39;
88. Gustavo Mendonça, Daniela B.S. Mendonça, Francisco J.L. Araga˜o, Lyndon F. Cooper,
Advancing dental implant surface technology – From micron to nano topography, Biomaterials 29
(2008) 3822–3835;
89. J. Chen, R.A. Bly, M.M. Saad, M.A. AlKhodary, R.M. El-Backly, D.J. Cohen, N. Kattamis, M.M.
Fatta, W.A. Moore, C.B. Arnold, M.K. Marei, W.O. Soboyejo, In-vivo study of adhesion and bone
growth around implanted laser groove/RGD-functionalized Ti-6Al-4V pins in rabbit femurs
Materials Science and Engineering C 31 (2011) 826–832;
90. Rickard Brånemark, MSc, PhD, MDa, Lena Emanuelsson, BSb, Anders Palmquist, MSc, PhDb,
⁎, Peter Thomsen, PhD, MDb, Bone response to laser-induced micro- and nano-size titanium
surface features, Nanomedicine: Nanotechnology, Biology, and Medicine 7 (2011) 220–227;
91. Milan Trtica, Biljana Gakovic b, Dimitri Batani c, Tara Desai c, Peter Panjan d, Bojan Radak,
Surface modifications of a titanium implant by a picosecond Nd: YAG laser operating at 1064 and
532 nm, Applied Surface Science 253 (2006) 2551–2556;

Bibliography
200
92. P. Kwasniak, et al., Laser and chemical surface modifications of titanium grade 2 for medical
application, Appl. Surf. Sci. (2014);
93. C. Bertrand, Y. le Petitcorps, L. Albingre, V. Dupuis, Optimization of operator and physical
parameters for laser welding of dental materials, BRITISH DENTAL JOURNAL VOLUME 196
NO. 7 APRIL 10, 2004;
94. P. Kwasniak, et al., Laser and chemical surface modifications of titanium grade 2 for medical
application, Appl. Surf. Sci. (2014);
95. Mohamed Ahmed Alkhodary, Laser micro-grooved, Arginine-Glycine-Apspartic acid (RGD)
coated dental implants, a 5 years radiographic follow-up, International Journal of Health Sciences,
Qassim University, Vol. 8, No. 4 (Oct-Dec 2014);
96. S. Kalpakjian, S. R. Schmid, Manufacturing Engineering and Technology, 6ªed., Pearson Prentice
Hall, 2010, p.777;
97. https://en.wikipedia.org/wiki/Electron-beam_technology;
98. C. Ramskogler, S. Mostofi, F. Warchomicka, A. Weinberg, C. Sommitsch, Surface structuring by
electron beam technique in titanium grade 2 and Ti6Al4V for biomedical application, TMS-The
Minerals, Metals & Materials Society, 2016;
99. http://www.techbriefs.com/component/content/article/9998?start=2&Itemid=690;
100. Anselme K., Davidson P., Popa A. M., Giazzon M., Liley M., Ploux L., The interaction of cells
and bacteria with surfaces structured at the nanometre scale. Acta Biomaterialia 6 (2010): 3824 –
3846;
101. Katrina J. Edwards a, Andrew D. Rutenberg Microbial response to surface microtopography: the
role of metabolism in localized mineral dissolution, Chemical Geology 180 2001 19–32;
102. Vi Khanh Truong, Vy T. H. Pham, Alexander Medvedev, Rimma Lapovok, Yuri Estrin, Terry C.
Lowe, Vladimir Baulin, Veselin Boshkovikj, Christopher J. Fluke, Russell J. Crawford, Elena P.
Ivanova, Self-organised nanoarchitecture of titanium surfaces influences the attachment of
Staphylococcus aureus and Pseudomonas aeruginosa bacteria Appl Microbiol Biotechnol DOI
10.1007/s00253-015-6572-7;
103. S.D. Puckett, E. Taylor, T. Raimondo, T.J. Webster, The relationship between the nanostructure
of titanium surfaces and bacterial attachment, Biomaterials 31 (2010): 706-713;
104. Fu G, Vary PS, Lin CT, Anatase TiO2 nanocomposites for antimicrobial coatings, Phys Chem
2005 May 12;109(18):8889-98;
105. Vi K. Truong, Rimma Lapovok, Yuri S. Estrin, Stuart Rundell b, James Y. Wang e, Christopher
J. Fluke f, Russell J. Crawford, Elena P. Ivanova, The influence of nano-scale surface roughness
on bacterial adhesion to ultrafine-grained titanium, Biomaterials 31 (2010) 3674–3683;
106. Scheuerman TR, Camper AK, Hamilton MA. Effects of substratum topography on bacterial
adhesion. J Colloid Interface Sci 1998; 208:23–33;
107. Harris LG, Richards RG, Staphylococcus aureus adhesion to different treated titanium surfaces. J
Mater Sci Mater Med 2004; 15:311–4;

Bibliography
201
108. Zamir E, Katz M, Posen Y, Erez N, Yamada KM, Katz BZ, Lin S, Lin DC, Bershdsky A, Kam Z,
Dynamics and segregation of cell-matrix adhesons in cultured fibroblasts. Nat Cell Biol. 2:191-
196;
109. John C. Grew, John L. Ricci, Harold Alexander, Connective-tissue responses to defined
biomaterial surfaces. II. Behavior of rat and mouse fibroblasts cultured on microgrooved
substrates. Journal of Biomedical Materials Research Part A;
110. A.M. Andersson, P. Olsson, U. Lidberg, D. Sutherland, The effects of continuous and
discontinuous groove edges on cell shape and alignment, Exp. Cell Res. 288 (2003) 177–188;
111. Teixeira A. I., Nealey P. F., Murphy C. J., Responses of human keratocytes to micro- and
nanostructured substrates. J Biomed Mater Res 2004; 71;
112. Hamilton D. W., Brunette D. M., “Gap guidance” of fibroblast and epithelial cells by
discontinuous edged surfaces. Experimentale Cell Research 309 (2005): 429-437;
113. Su-Yeon Kim, Namsik Oh, Myung-Hyun Lee, Sung-Eun Kim, Richard Leesungbok, Suk- Won
Lee, Surface microgrooves and acid etching on titanium substrata alter various cell behaviors of
cultured human gingival fibroblasts. Clin. Oral Impl. Res. 20, 2009; 262-272;
114. M. Nevins, M. Camelo, Connective Tissue Attachment to Laser-Microgrooved Abutments: A
Human Histologic Case Report, Volume 32, Issue 4 2012, 385-392;
115. Marco Wieland,1,2 Babak Chehroudi, Marcus Textor, Donald M. Brunette, Use of Ti-coated
replicas to investigate the effects on fibroblast shape of surfaces with varying roughness and
constant chemical composition, 2002 Wiley Periodicals, Inc.;
116. G. E. Pecora, DDS, MD, R. Ceccarelli, DDS, M. Bonelli, H. Alexander, J. L. Ricci, Clinical
Evaluation of Laser Microtexturing for Soft Tissue and Bone Attachment to Dental Implants,
IMPLANT DENTISTRY / VOLUME 18, NUMBER 1 2009;
117. John C. Grew, John L. Ricci, Harold Alexander, Connective-tissue responses to defined
biomaterial surfaces. II. Behavior of rat and mouse fibroblasts cultured on microgrooved
substrates, 2007 Wiley Periodicals, Inc.;
118. https://en.wikipedia.org/wiki/Plasma_activation;
119. https://it.scribd.com/doc/312685009/titanio-ti-6al-4v;
120. http://www.tecnotex.it/documenti/Pure-Health_brochure.pdf;
121. Jiang Chen, Ping Yang, Yuzhen Liao, Jinbiao Wang, Huiqing, Effect of the Duration of UV
Irradiation on the Anticoagulant Properties of Titanium Dioxide Films, ACS Appl. Mater.
Interfaces 2015, 7, 4423−4432;
122. Fuminori Iwasa, Norio Hori, Takeshi Ueno, Hajime Minamikawa, Masahiro Yamada, Takahiro
Ogawa, Enhancement of osteoblast adhesion to UV-photofunctionalized titanium via an
electrostatic mechanism, Biomaterials 31 (2010) 2717–2727;
123. N. Bhardwaj, S. C. Kundu, Electrospinning: A fascinating fiber fabrication technique, Volume
28, Issue 3, May–June 2010, pp 325–347;
124. Biella;
125. http://www.charfac.umn.edu/instruments/eds_on_sem_primer.pdf;
126. https://en.wikipedia.org/wiki/X-ray_photoelectron_spectroscopy;

Bibliography
202
127. http://www.casaxps.com/help_manual/manual_updates/xps_spectra.pdf;
128. http://biomateriali.files.wordpress.com/2012/12/ftir.pdf;
129. https://en.wikipedia.org/wiki/Wetting;
130. Nygard et al., 2002; Bohme et al., 2001;
131. Jendrik Hardesa, Helmut Ahrensa, Carsten Geberta Lack of toxicological side effects in silver-
coated megaprostheses in humans Biomaterials 28 (2007) 2869–2875;
132. https://webspectra.chem.ucla.edu/irtable.html;
133. A. Aluigi, A. corbellini, F. Rombaldoni, M. Zoccola, M. Canetti, Morphological and structural
investigation of wool derived keratin nanofibres crosslinked by thermal treatment, International
Journal of Biological Macromolecules 57 (2013) 30-37;
134. Zhang X., Ferraris S., Prenesti E., Vernè E., Surface functionalization of bioactive glasses with
natural molecules of biological significance, Part I: Gallic acid as model molecule. Applied
Surface Science 287 (2013) 329 – 340;
135. Patil K., Smith S. V., Rajkhowa R., Tsuzuki T., Wang X., Lin T., Milled cashmere guard hair
powders: Absorption properties to heavy metal ions. Powder Technology 218 (2012) 162 – 168;
136. http://www.xpsfitting.com;
137. Michael J. Richardson, James H. Johnston Sorption and binding of nanocrystalline gold by Merino
wool fibres—An XPS study, Journal of Colloid and Interface Science 310 (2007) 425–430;
138. R. Molina, J.P. Espino´s, F. Yubero, P. Erra, A.R. Gonza´lez-Elipe, XPS analysis of down-stream
plasma treated wool: Influence of the nature of the gas on the surface modification of wool,
Applied Surface Science 252 (2005) 1417–1429;
139. Aggingere xps O;
140. Kiran Patil, Suzanne V. Smith, Rangam Rajkhowa, Takuya Tsuzuki, Xungai Wang, Tong Lin,
Milled cashmere guard hair powders: Absorption properties to heavy metal ions, Powder
Technology 218 (2012) 162–168;
141. Xiangqin Zou, Haifeng Bao, Hongwei Guo, Lei Zhang, Li Qi, Junguang Jiang, Li Niu, Shaojun
Dong, Mercaptoethane sulfonate protected, water-soluble gold and silver nanoparticles:
Syntheses, characterization and their building multilayer films with polyaniline via ion–dipole
interactions, Journal of Colloid and Interface Science 295 (2006) 401–408;
142. A. Aluigi, A. corbellini, F. Rombaldoni, M. Zoccola, M. Canetti, Morphological and structural
investigation of wool derived keratin nanofibres crosslinked by thermal treatment, International
Journal of Biological Macromolecules 57 (2013) 30-37;
143. A. Aluigi, C. Tonetti, C. Vineis, C. Tonin, G. Mazzuchetti, Adsorption of copper (II) ions by
keratin/PA6 blend nanofibers, Eur. Polym. J., 2011, 47, 1756–1764;
144. AM Ferraria, AP Carapeto, AM Bothelho do Rego, X-ray photoelecton spectroscopy: silver salts
revisited, Vacuum 86(2012) 1988-1991;
145. L-K. Chau, M.D. Porter, Surface isoelectric point of evaporated silver films: Determination by
contact angle titration, Journal of Colloid and Interface Science 145, 1 (1991): 283 – 286;

Bibliography
203
IMAGES F1 Muhammad A Khosa and Aman, A Sustainable Role of Keratin Biopolymer in Green Chemistry:
A Review, Journal of Food Processing & Beverages, ISSN: 2332-4104;
F2 http://jpkc.qdu.edu.cn/fzclx/english%20course/pic/36.JPG;
F3 S. Wang, F. Taraballi, L. Poh, T.K. Woei, Human keratin hydrogels support fibroblast attachment
and proliferation in vitro, Cell Tissue Res (2012) 347, pp 795–802;
F4 S. Wang, F. Taraballi, L. Poh, T.K. Woei, Human keratin hydrogels support fibroblast attachment
and proliferation in vitro, Cell Tissue Res (2012) 347, pp 795–802;
F5 Tachibana, Y. Furuta, H. Takeshima, T. Tanabe, K. Yamauchi, Fabrication of wool keratin sponge
scaffolds for long-term cell cultivation, Journal of Biotechnology 93 (2002), pp 165–170;
F6 Tachibana, Y. Furuta, H. Takeshima, T. Tanabe, K. Yamauchi, Fabrication of wool keratin sponge
scaffolds for long-term cell cultivation, Journal of Biotechnology 93 (2002), pp 165–170;
F7 Sondi, B. S. Sondi, Silver nanoparticles as antimicrobial agent: a case study on E. coli as a model
for Gram-negative bacteria, Journal of Colloid and Interface Science 275 (2004), pp 177–182;
F8 L. Hadad, N. Perkas, Y. Gofer, A. Ghule, A. Gedanken, Sonochemical Deposition of Silver
Nanoparticles on Wool Fibers, Wiley InterScience (2006);
F9 http://www.easynotecards.com/uploads/365/29/593ab409_13673075871__8000_00000014.jpg;
F10 http://philschatz.com/anatomy-book/resources/2409_Tooth.jpg;
F11 https://pocketdentistry.com/wp-content/uploads/285/QE01_chapple_fig002a.jpg;
F12 http://ars.els-cdn.com/content/image/1-s2.0-S0002817714639635-gr1.jpg;
F13 http://www.dentalimplantskerala.com/wp-content/uploads/2011/08/implants-types.jpg;
F14 http://www.consumersdigest.com/images/made/images/uploads/article/Dental_Implants_chart_3
20_230_s_c1_c_t_0_0.jpg;
F15 http://1.bp.blogspot.com/CSfvIrcHH9g/TiRgG66T3pI/AAAAAAAAAnc/e343_Yz5l6U/s1600/i
mplant+parts.jpg;
F16 https://titaniumprocessingcenter.com/wp-content/uploads/2015/08/grades_ti_datasheet.png;
F17 http://www.trendsperioimplantresourcecenter.com/sites/default/files/3d7e70517504420e83534a5
70d616991-71.jpg;
F18 http://blog.medicalcanada.es/wp-content/uploads/2015/06/blog4.jpg;
F19 C. Mangano, F. Mangano, J.A. Shibli, L. Tettamanti, M. Figliuzzi, S. d’Avila, R.L. Sammons, A.
Piattelli, Prospective Evaluation of 2,549 Morse Taper Connection Implants: 1- to 6-Year Data, J
Periodontol, January 2011;
F20 D. LAURITANO, C.A. BIGNOZZI, D. PAZZI, F. CURA, F. CARINCI, Efficacy of a new coating
of implant-abutment connections in reducing bacterial loading: an in vitro study;
F21 H.I. Nassar, M.F. Abdalla, Bacterial leakage of different internal implant/abutment connection,
future dental Journal I (2015) I-5;
F22 Gustavo Mendonça, Daniela B.S. Mendonça, Francisco J.L. Araga˜o, Lyndon F. Cooper,
Advancing dental implant surface technology – From micron to nano topography, Biomaterials 29
(2008) 3822–3835;

Bibliography
204
F23 C. Bertrand, Y. le Petitcorps, L. Albingre, V. Dupuis, Optimization of operator and physical
parameters for laser welding of dental materials, BRITISH DENTAL JOURNAL VOLUME 196
NO. 7 APRIL 10, 2004;
F24 P. Kwasniak, et al., Laser and chemical surface modifications of titanium grade 2 for medical
application, Appl. Surf. Sci. (2014);
F25 P. Kwasniak, et al., Laser and chemical surface modifications of titanium grade 2 for medical
application, Appl. Surf. Sci. (2014);
F26 Mohamed Ahmed Alkhodary, Laser micro-grooved, Arginine-Glycine-Apspartic acid (RGD)
coated dental implants, a 5 years radiographic follow-up, International Journal of Health Sciences,
Qassim University, Vol. 8, No. 4 (Oct-Dec 2014);
F27 Mohamed Ahmed Alkhodary, Laser micro-grooved, Arginine-Glycine-Apspartic acid (RGD)
coated dental implants, a 5 years radiographic follow-up, International Journal of Health Sciences,
Qassim University, Vol. 8, No. 4 (Oct-Dec 2014);
F28 J. Chen, R.A. Bly, M.M. Saad, M.A. AlKhodary, R.M. El-Backly, D.J. Cohen, N. Kattamis, M.M.
Fatta, W.A. Moore, C.B. Arnold, M.K. Marei, W.O. Soboyejo, In-vivo study of adhesion and bone
growth around implanted laser groove/RGD-functionalized Ti-6Al-4V pins in rabbit femurs
Materials Science and Engineering C 31 (2011) 826–832;
F29 https://ebteccorp.com/app/uploads/2016/05/how_ebweld-1.jpg;
F30 C. Ramskogler, S. Mostofi, F. Warchomicka, A. Weinberg, C. Sommitsch, Surface structuring
by electron beam technique in titanium grade 2 and Ti6Al4V for biomedical application, TMS-
The Minerals, Metals & Materials Society, 2016;
F31 C. Ramskogler, S. Mostofi, F. Warchomicka, A. Weinberg, C. Sommitsch, Surface structuring
by electron beam technique in titanium grade 2 and Ti6Al4V for biomedical application, TMS-
The Minerals, Metals & Materials Society, 2016;
F32 C. Ramskogler, S. Mostofi, F. Warchomicka, A. Weinberg, C. Sommitsch, Surface structuring
by electron beam technique in titanium grade 2 and Ti6Al4V for biomedical application, TMS-
The Minerals, Metals & Materials Society, 2016;
F33 Vi Khanh Truong, Vy T. H. Pham, Alexander Medvedev, Rimma Lapovok, Yuri Estrin, Terry C.
Lowe, Vladimir Baulin, Veselin Boshkovikj, Christopher J. Fluke, Russell J. Crawford, Elena P.
Ivanova, Self-organised nanoarchitecture of titanium surfaces influences the attachment of
Staphylococcus aureus and Pseudomonas aeruginosa bacteria Appl Microbiol Biotechnol DOI
10.1007/s00253-015-6572-7;
F34 S.D. Puckett, E. Taylor, T. Raimondo, T.J. Webster, The relationship between the nanostructure
of titanium surfaces and bacterial attachment, Biomaterials 31 (2010): 706-713;
F35 Vi K. Truong, Rimma Lapovok, Yuri S. Estrin, Stuart Rundell b, James Y. Wang e, Christopher
J. Fluke f, Russell J. Crawford, Elena P. Ivanova, The influence of nano-scale surface roughness
on bacterial adhesion to ultrafine-grained titanium, Biomaterials 31 (2010) 3674–3683;
F36 Vi K. Truong, Rimma Lapovok, Yuri S. Estrin, Stuart Rundell b, James Y. Wang e, Christopher
J. Fluke f, Russell J. Crawford, Elena P. Ivanova, The influence of nano-scale surface roughness
on bacterial adhesion to ultrafine-grained titanium, Biomaterials 31 (2010) 3674–3683;

Bibliography
205
F37 Harris LG, Richards RG, Staphylococcus aureus adhesion to different treated titanium surfaces. J
Mater Sci Mater Med 2004; 15:311–4;
F38 Fujita S, Ohshima M, Iwata H. Time-lapse observation of cell alignment on nanogrooved patterns.
J R Soc Interface 2009; 6: S269–77;
F39 Teixeira A. I., Nealey P. F., Murphy C. J., Responses of human keratocytes to micro- and
nanostructured substrates. J Biomed Mater Res 2004; 71;
F40 Marco Wieland,1,2 Babak Chehroudi,1 Marcus Textor,2 Donald M. Brunette1 Use of Ti-coated
replicas to investigate the effects on fibroblast shape of surfaces with varying roughness and
constant chemical composition, 2002 Wiley Periodicals, Inc.;
F41 G. E. Pecora, DDS, MD, R. Ceccarelli, DDS, M. Bonelli, H. Alexander, PhD, and J. L. Ricci,
PhD, Clinical Evaluation of Laser Microtexturing for Soft Tissue and Bone Attachment to Dental
Implants, IMPLANT DENTISTRY / VOLUME 18, NUMBER 1 2009;
F42 John C. Grew, John L. Ricci, Harold Alexander, Connective-tissue responses to defined
biomaterial surfaces. II. Behavior of rat and mouse fibroblasts cultured on microgrooved
substrates, 2007 Wiley Periodicals, Inc.;
F43 John C. Grew, John L. Ricci, Harold Alexander, Connective-tissue responses to defined
biomaterial surfaces. II. Behavior of rat and mouse fibroblasts cultured on microgrooved
substrates, 2007 Wiley Periodicals, Inc.;
F44 https://commons.wikimedia.org/w/index.php?curid=19474487;
F45 https://commons.wikimedia.org/w/index.php?curid=5521755;
F46 https://encrypted-tbn0.gstatic.com/images?q=tbn:ANd9GcQPTFRB7LHrv4Q_-
artb9j8foZo_VWtimldSAfVEXjAknkD-K0j;
F47 http://www.charfac.umn.edu/instruments/eds_on_sem_primer.pdf;
F48 https://commons.wikimedia.org/wiki/File:XPS_PHYSICS.png#/media/File:XPS_PHYSICS.png;
F49 http://www.machinerylubrication.com/Read/30205/ftir-oil-analysis;
F50 http://lotusrock.com/wp-content/uploads/2015/05/Classification-of-Cross-Cut-Adhesion-Test-
Results.jpg;
F51 https://ndtesting.ru/wa-data/public/shop/products/23/44/4423/images/2047/2047.970.jpg;
F52 http://www.ramehart.com/contactangle.htm;
F53 http://wiki.anton-paar.com/wp-content/uploads/electric-double-layer.jpg;
F54 Nygard et al., 2002; Bohme et al., 2001;

Bibliography
206
TABLES T1 Microbiologia Orale, Dispense di Microbiologia, Università di Genova;
T2 M. Sundaram, R. Legadevi, N. Afrin Banu, V. Gayathri, A. Palanisammy, A Study on Anti-
Bacterial Activity of Keratin Nanoparticles from Chicken Feather Waste Against Staphylococcus
aureus (Bovine Mastitis Bacteria) and its Anti-Oxidant Activity. European Journal of
Biotechnology and Bioscience, Volume: 3, Issue: 6, 01-05June 2015;
T3 F.H.M. Mikx, M.H. De Jong, Keratinolytic activity of cutaneous and oral bacteria, Infection and
Immunity 55 (1987), pp 621-625;
T4 F. Truffa Giachet, Politecnico di Torino, MODIFICHE MICROTOPOGRAFICHE E
DEPOSIZIONE DI NANOFIBRE DI CHERATINA PER OTTIMIZZARE LE INTERAZIONI
DEL TITANIO CON I TESSUTI MOLLI, 2014;
T5 A.G. Gristina, Biomaterial-centered infection: microbial adhesion versus tissue integration.
Science 1987;237: 1588;
T6 http://www.camvaceng.com/assets/uploads/documents/EBW_versus_laser.pdf;
T7 Vi Khanh Truong, Vy T. H. Pham, Alexander Medvedev, Rimma Lapovok, Yuri Estrin, Terry C.
Lowe, Vladimir Baulin, Veselin Boshkovikj, Christopher J. Fluke, Russell J. Crawford, Elena P.
Ivanova, Self-organised nanoarchitecture of titanium surfaces influences the attachment of
Staphylococcus aureus and Pseudomonas aeruginosa bacteria Appl Microbiol Biotechnol DOI
10.1007/s00253-015-6572-7;
T8 Vi K. Truong a, Rimma Lapovok b, c, Yuri S. Estrin b, c, d, Stuart Rundell b, James Y. Wang e,
Christopher J. Fluke f, Russell J. Crawford a, Elena P. Ivanova a, The influence of nano-scale
surface roughness on bacterial adhesion to ultrafine-grained titanium, Biomaterials 31 (2010)
3674–3683;
T9 Harris LG, Richards RG, Staphylococcus aureus adhesion to different treated titanium surfaces. J
Mater Sci Mater Med 2004; 15:311–4;
T10 Harris LG, Richards RG, Staphylococcus aureus adhesion to different treated titanium surfaces. J
Mater Sci Mater Med 2004; 15:311–4;
T11 https://en.wikipedia.org/wiki/Wetting;

RINGRAZIAMENTI
Desidero ringraziare tutti coloro che mi hanno aiutato in questo lavoro. Ringrazio
innanzitutto le mie relatrici, la Prof.ssa Silvia Spriano e l’Ing. Sara Ferraris per la loro
disponibilità e i loro utili consigli. Un grazie particolare va a Sara, una presenza costante
durante la mia esperienza di laboratorio ed un punto di riferimento. Rivolgo i miei
ringraziamenti anche all’Istituto per lo Studio delle Macromolecole CNR-ISMAC
(Biella) e al Dipartimento di Scienze della Salute dell’Università del Piemonte Orientale
Amedeo Avogadro, che hanno gentilmente collaborato a questo lavoro. Infine, un grazie
pieno di affetto va a tutte le persone care che mi sono state accanto e a cui dedico questa
tesi. Grazie alla mia famiglia, alla quale devo tutta la mia esperienza universitaria, il
sostegno ricevuto in questi anni e alla quale sono infinitamente riconoscente per tutto. Al
mio ragazzo e ai miei amici semplicemente Grazie, ognuno di voi sa per cosa.