013 geography - necta
TRANSCRIPT
THE NATIONAL EXAMINATIONS COUNCIL OF TANZANIA
CANDIDATES’ ITEM RESPONSE ANALYSIS REPORTFOR THE CERTIFICATE OF SECONDARY EDUCATION
EXAMINATION (CSEE) 2015
013 GEOGRAPHY(For School Candidates)
THE NATIONAL EXAMINATIONS COUNCIL OF TANZANIA
CANDIDATES’ ITEM RESPONSE ANALYSIS REPORT FOR THE CERTIFICATE OF SECONDARY
EDUCATION EXAMINATION (CSEE) 2015
013 GEOGRAPHY (For School Candidates)
ii
Published by
The National Examinations Council of Tanzania,
P.O. Box 2624,
Dar es Salaam, Tanzania.
© The National Examinations Council of Tanzania, 2016
All rights reserved
iii
TABLE OF CONTENTS
FOREWORD ......................................................................................................................... iv
1.0 INTRODUCTION ....................................................................................................... 1
2.0 ANALYSIS OF THE CANDIDATES’ PERFORMANCE IN EACH QUESTION .. 2
2.1 SECTION A : PHYSICAL AND MATHEMATICAL GEOGRAPHY .................. 2
2.1.1 Question 1 : Multiple Choice Items ...................................................................... 2
2.1.2 Question 2 : Matching Items ................................................................................ 6
2.1.3 Question 3 : Physical Geography ......................................................................... 8
2.2 SECTION B: APPLICATION OF STATISTICS, INTRODUCTION TO
RESEARCH AND ELEMENTARY SURVEY AND MAP. .................................. 11
2.2.1 Question 4 : Application of Statistics ................................................................. 11
2.2.2 Question 5 : Introduction to Research ................................................................ 15
2.2.3 Question 6 : Elementary Surveying. ................................................................... 18
2.3 SECTION C: MAP READING AND PHOTOGRAPH INTERPRETATION ..... 20
2.2.1 Question 7: Map Reading and Interpretation ..................................................... 20
2.2.2 Question 8 : Photograph Reading and Interpretation ......................................... 27
2.4 SECTION D : PART 1: REGIONAL FOCAL STUDIES ..................................... 32
2.4.1 Question 9 : Agriculture ..................................................................................... 32
2.4.2 Question 10 : Water Management for Economic Development ......................... 36
PART 2: ENVIRONMENTAL ISSUES, POPULATION AND SETTLEMENTS ......... 39
2.4.3 Question 11 : Population Change ....................................................................... 39
2.4.4 Question 12 : Settlements ................................................................................... 43
3.0 PERFOMANCE OF CANDIDATES IN EACH TOPIC .......................................... 47
4.0 CONCLUSION .......................................................................................................... 48
5.0 RECOMMENDATIONS ........................................................................................... 48
Appendix ............................................................................................................................... 50
iv
FOREWORD
The National Examinations Council of Tanzania is pleased to issue this report on Items Response Analysis for the 2015 Certificate of Secondary Education Examination (CSEE) in Geography subject. The report provides feedback to students, teachers, parents, policy makers and the public in general, on the performance of the candidates and how well the instructional goals and objectives were met.
The Certificate of Secondary Education Examination marks the end of four years of secondary school education. It is a summative evaluation which, among other things, shows the effectiveness of the education system in general and education delivery system in particular. Essentially, the candidates’ responses to the examination question is a strong indicator of what the education system was able/unable to offer to students in their four years of Certificate of Secondary Education.
In this report, factors which contributed to the achievements and failure of candidates to answer questions correctly or incorrectly have been analysed. The analysis shows that the candidate with higher scores deserved these since they provided appropriate responses. They were able to understand the demand of the questions, had basic knowledge on the subject matter, possessed skills in computation and drawing as well as English Language proficiency and essay writing skills. However, the candidates with lower scores portrayed contrary to this.
The feedback provided is expected to enable the educational administrators, school managers, teachers and students to identify proper measures to be taken in order to improve candidates’ performance in future examinations administered by the Council.
The National Examinations Council of Tanzania will highly appreciate comments and suggestions from teachers, students and members of the public in general that can be used for improving future examiners’ reports. Finally, the Council is grateful to all stakeholders who provided valuable assistance in the preparation of this report.
Dr. Charles E. Msonde
THE EXECUTIVE SECRETARY
1
1.0 INTRODUCTION
This report analyses the performance of candidates in Geography examination for the Certificate of Secondary School Examination in November, 2015. The paper covered the 2010 syllabus and adhered to 2008 examination format. In this report the performance of the candidates is regarded as weak if the scores range from 0 to 29%, average if the scores range from 30 to 44% and good if the candidates scored from 45 to 100%. These categories of performance are indicated using special colours, whereas red denotes the weak performance, yellow stands for average performance and green colour indicates good performance.
The examination consisted of four (4) sections namely; A, B, C and D. Questions from section A to C were compulsory. Sections A and B had three questions each, section C had two (2) questions while section D comprised of four (4) essay type questions which were set into two parts (I and II) from which candidates were required to choose one question from each part. The candidates were instructed to attempt a total of 10 questions.
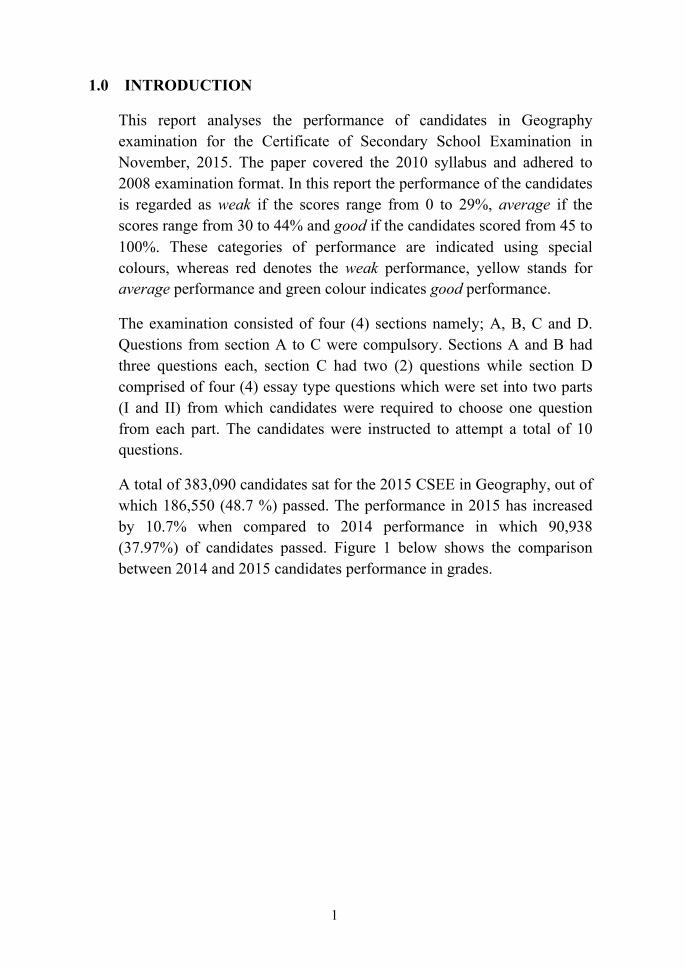
A total of 383,090 candidates sat for the 2015 CSEE in Geography, out of which 186,550 (48.7 %) passed. The performance in 2015 has increased by 10.7% when compared to 2014 performance in which 90,938 (37.97%) of candidates passed. Figure 1 below shows the comparison between 2014 and 2015 candidates performance in grades.
2
Figure 1: The Candidates’ Performances in Grades in the 2014 CSEE and in 2015 Geography.
This report presents the tasks of each question; the analysis of candidates’ good and poor responses; the sample of responses from candidates’ scripts have been inserted in respective sections to illustrate their responses. Finally, the report provides the performance of candidates in each topic, conclusion, recommendations and attachment which indicates the performance of the candidates in each topic.
2.0 ANALYSIS OF THE CANDIDATES’ PERFORMANCE IN EACH QUESTION
2.1 SECTION A: PHYSICAL AND MATHEMATICAL GEOGRAPHY
2.1.1 Question 1 : Multiple Choice Items
The question consisted of ten multiple choice items carrying a total of ten marks. The candidates were instructed to choose the correct answer among the given alternatives and each item was carrying one mark making a total of ten marks.
3
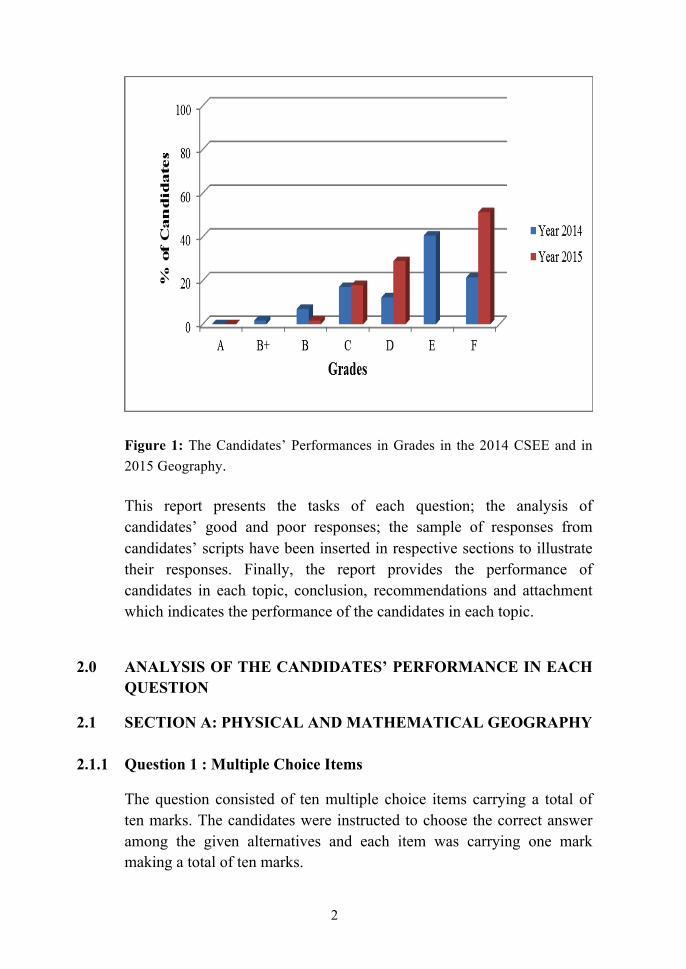
This question was attempted by all 383,090 the candidates from among whom 55.6% scored from 0 to 2 marks, and 8.3% scored a zero; 33.5 % scored from 3 to 4 marks and 10.9 % scored from 5 to 10 marks. This data indicates that the performance of candidates in this question was average as 44.4% of the candidates scored 30 marks and above as illustrates in Figure 2.
Figure 2: A trend of the Candidates’ Performance in Question 1.
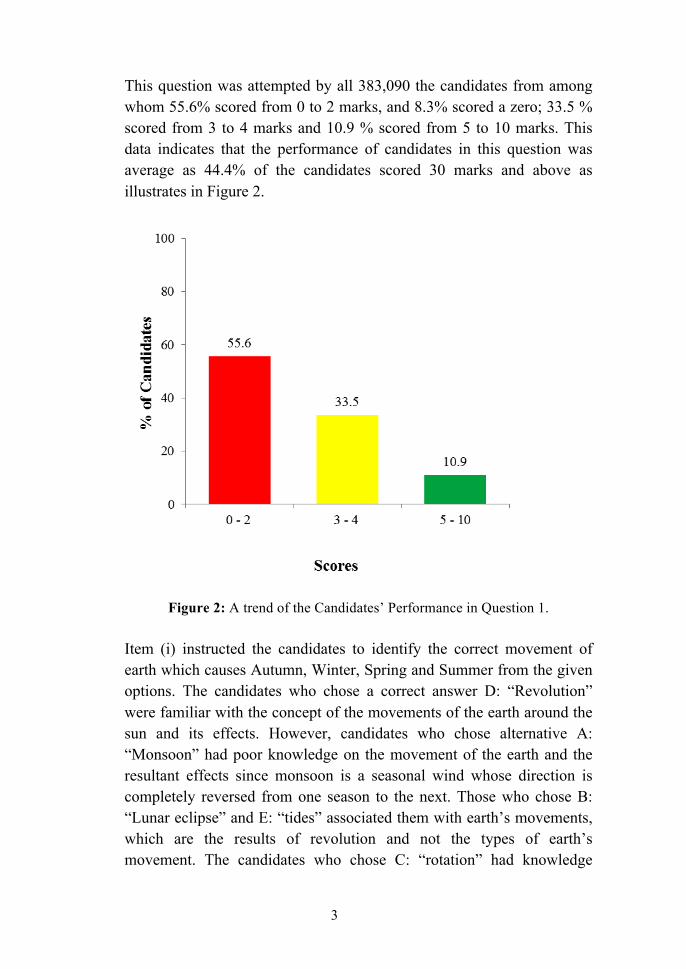
Item (i) instructed the candidates to identify the correct movement of earth which causes Autumn, Winter, Spring and Summer from the given options. The candidates who chose a correct answer D: “Revolution” were familiar with the concept of the movements of the earth around the sun and its effects. However, candidates who chose alternative A: “Monsoon” had poor knowledge on the movement of the earth and the resultant effects since monsoon is a seasonal wind whose direction is completely reversed from one season to the next. Those who chose B: “Lunar eclipse” and E: “tides” associated them with earth’s movements, which are the results of revolution and not the types of earth’s movement. The candidates who chose C: “rotation” had knowledge
4
about the earth’s movements and their results, but could not differentiate between rotation and revolution.
Item (ii) instructed the candidates to identify the substance which covers the large part of the Southern Hemisphere among the five given alternatives. The candidates who chose the correct answer C: “water masses” were aware that a large part of land mass is located in the Northern Hemisphere and not in the Southern Hemisphere. Other candidates who chose response A: “land mass, B: “volcanoes” and D: “dark clouds” were not aware of global distribution of land and large water masses. Those who were attracted to distractor E: “ice” associated the presence of large water bodies with the availability of ice in the Southern Hemisphere. Item (iii) instructed the candidates to identify the name of the shallow part of the sea that stretches out from the coast. The candidates who chose the correct answer A: “Continental shelf” knew that continental shelf is a shallow part of an ocean. The candidates who opted for distractor B “Continental slope”, C: “Oceanic ridge”, D: “Ocean trench” and E: “Island” had poor knowledge on the descriptions of physical characteristics of other features of the ocean. Item (iv) instructed the candidates to identify from among the given alternatives factors which do not influence the temperature of a place. The candidates who chose the correct answer D: “Eclipse” had knowledge that eclipse is a total or partial blockage of light received by one heavenly body by another body passing before it and is not a factor influencing temperature of a place. The candidates who opted for A: “Aspect”, B: “Oceanic current”, C: “Altitude” and E “Length of a day” were not knowledgeable on the factors which influence temperature of a place. Item (v) instructed the candidates to identify the name of sideways erosion which widens the V-shaped valley. The candidates, who chose the correct answer B: “lateral erosion”, were aware of the types of river erosion which erodes the sides of the river channels. The candidates who opted for A: “vertical erosion” and C: “headward erosion” were aware of the types of river erosion but they failed to identify the correct descriptions. These candidates did not know that vertical erosion deepen
5
the river valley while headward erosion tends to reverse the length of the river backwards. Those who opted for D: “hydraulic action” and E: “attrition” demonstrated ignorance of the types of river erosion because these distractors are river erosion processes. In item (vi) the candidates were instructed to identify the process responsible for the deposition of soil materials removed from one horizon to another. The candidates who chose the correct answer A: “illuviation” had good understanding of the concepts of soil translocation and soil forming processes. The candidates who opted for B: “weathering” were aware that weathering prepares material for erosion and deposition but it does not involve deposition process. The candidates who chose distractors C: “eluviation”, D: “organic sorting” and E “leaching” were knowledgeable on the processes responsible for movement of soil materials but they failed to identify the specific process responsible for the movement of soil materials when they are removed from one horizon to the other. Item (vii) instructed the candidates to identify results of the vertical movement within the earth’s crust among the given alternatives. The candidates who opted for the correct response B: “Block mountain, raised beaches and broad basins” had knowledge on features produced by vertical movements. However, candidates who chose, A: “Earthquake, faulting and volcanic eruptions”, C “Volcanic eruptions, rock fall and asymmetrical folds”, D: “Fold mountains, basins and asymmetrical folds” and E “Emerged coast, over fold and faulting” failed to understand that some of the features in these alternatives were formed by vertical movements others by horizontal movements and volcanic activities. Item (viii) instructed the candidates to identify the impact of water action in desert. The candidates who chose the correct answer B: “Gullies” knew that gullies is among of the impact of water action in the desert. Those who opted for alternative D: “Sink hole” confused gullies with sink holes which are depression formed in limestone region. The candidates who chose alternative A: “Yardangs”, C: “Badlands” and E: “Rock pedestal” had poor knowledge on the subject matter as they failed to differentiate features produced by wind action and those produced by water action in desert.
6
Item (ix) instructed the candidates to identify an active state of decomposition caused by soil micro-organism. The candidates who opted for the correct answer A: “organic matter” had knowledge on composition of organic matter, such as small organisms, bacteria, fungi, plants, animal waste and humus which are responsible for soil decomposition. The candidates who opted for B: “soil water”, C: “mineral matter” and D: “soil air” failed to understand that these are components of soil which does not involves micro-organism during the process of soil decomposition. Those who opted for E: “soil components” did not understand the demand of the question. Item (x) instructed the candidates to identify the concept which is associated with the magnitude of an earthquake. The candidates who chose the correct answer A: “Richter scale” were knowledgeable that the magnitude of the earthquakes is determined by Richter scale. The candidates who opted for B: “Seismography” were relating it with the intensity of an earthquake which is measured by an instrument called seismography. The candidates who chose C: “Focus” and D: “Epicenter” were attracted with those alternatives since all of them are associated with earthquake but the focus is a point at which earthquake originate and epicenter is the point on the earth surface immediately above the focus. Furthermore, the candidates who chose E “Tsunami” associated it with the extent of huge seismic sea wave produced by submarine earthquake or volcanic eruption.
2.1.2 Question 2 : Matching Items
This question instructed the candidates to match the items in list A: with responses in list B: by writing the corresponding letter to the correct response beside the item number. List “A:” had descriptions of concepts related to soil while List “B:” contained various concepts and terminologies used in soil studies. Each item was worth one mark, making a total of five marks.
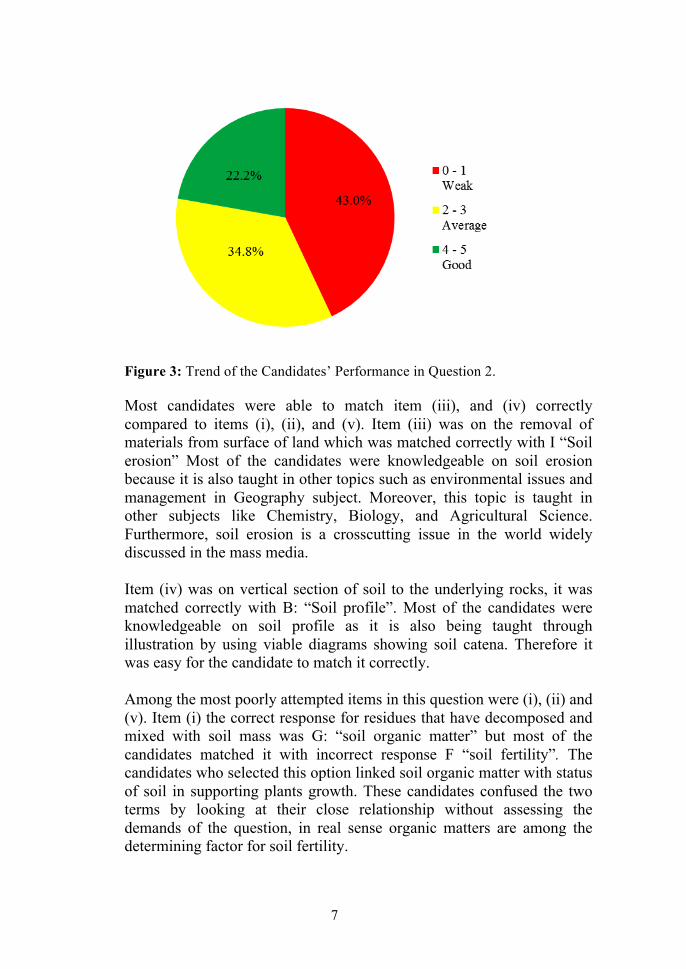
The question was attempted by 100% of all the candidates and the performance was such that, 43% scored from 0 to 1 mark, of which 21% scored a zero, 34.8% scored from 2 to 3 marks and 22.2% scored from 4 to 5 marks. The question had good performance as Figure 3 illustrates.
7
Figure 3: Trend of the Candidates’ Performance in Question 2. Most candidates were able to match item (iii), and (iv) correctly compared to items (i), (ii), and (v). Item (iii) was on the removal of materials from surface of land which was matched correctly with I “Soil erosion” Most of the candidates were knowledgeable on soil erosion because it is also taught in other topics such as environmental issues and management in Geography subject. Moreover, this topic is taught in other subjects like Chemistry, Biology, and Agricultural Science. Furthermore, soil erosion is a crosscutting issue in the world widely discussed in the mass media. Item (iv) was on vertical section of soil to the underlying rocks, it was matched correctly with B: “Soil profile”. Most of the candidates were knowledgeable on soil profile as it is also being taught through illustration by using viable diagrams showing soil catena. Therefore it was easy for the candidate to match it correctly. Among the most poorly attempted items in this question were (i), (ii) and (v). Item (i) the correct response for residues that have decomposed and mixed with soil mass was G: “soil organic matter” but most of the candidates matched it with incorrect response F “soil fertility”. The candidates who selected this option linked soil organic matter with status of soil in supporting plants growth. These candidates confused the two terms by looking at their close relationship without assessing the demands of the question, in real sense organic matters are among the determining factor for soil fertility.
8
In item (ii) which was on the status of soil with respect to amount of elements necessary for plants growth was matched with G: “soil organic matter” instead of F: “soil fertility”. These candidates confused it with status of soil in supporting plants growth in real sense fertile soil must have high content of organic matter. This indicates that majority of candidates lacked knowledge on the soil characteristics. Item (v) which was on fineness and coarseness of soil particles was to be matched with D: “soil texture” but most of the candidates matched it with E: “soil structure”. These candidates associated it with soil texture since all these terms are associated with soil particles but they failed to understand that they differ in the sense that soil structure expresses about the arrangement and shape of individual soil particle while soil texture is an important characteristic which depends on size of soil particles in terms of fineness or coarseness.
2.1.3 Question 3 : Physical Geography This question required the candidates to describe the internal structure of the earth with the aid of well labeled diagram. Total marks allocated for this question was 10.
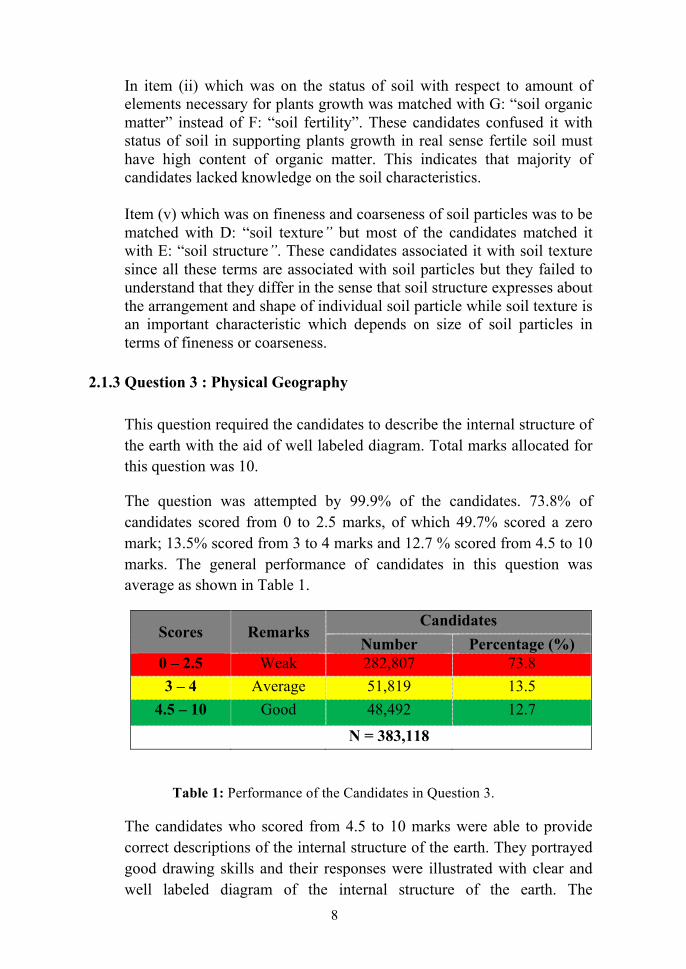
The question was attempted by 99.9% of the candidates. 73.8% of candidates scored from 0 to 2.5 marks, of which 49.7% scored a zero mark; 13.5% scored from 3 to 4 marks and 12.7 % scored from 4.5 to 10 marks. The general performance of candidates in this question was average as shown in Table 1.
Scores Remarks Candidates
Number Percentage (%) 0 – 2.5 Weak 282,807 73.8 3 – 4 Average 51,819 13.5
4.5 – 10 Good 48,492 12.7
N = 383,118
Table 1: Performance of the Candidates in Question 3.
The candidates who scored from 4.5 to 10 marks were able to provide correct descriptions of the internal structure of the earth. They portrayed good drawing skills and their responses were illustrated with clear and well labeled diagram of the internal structure of the earth. The
9
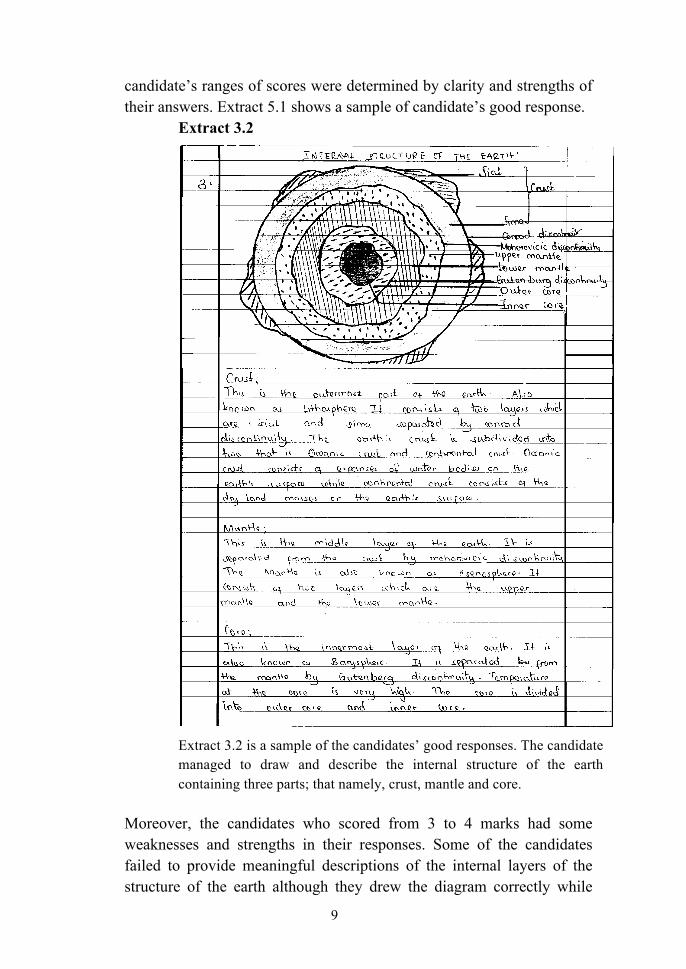
candidate’s ranges of scores were determined by clarity and strengths of their answers. Extract 5.1 shows a sample of candidate’s good response.
Extract 3.2
Extract 3.2 is a sample of the candidates’ good responses. The candidate managed to draw and describe the internal structure of the earth containing three parts; that namely, crust, mantle and core.
Moreover, the candidates who scored from 3 to 4 marks had some weaknesses and strengths in their responses. Some of the candidates failed to provide meaningful descriptions of the internal layers of the structure of the earth although they drew the diagram correctly while
10
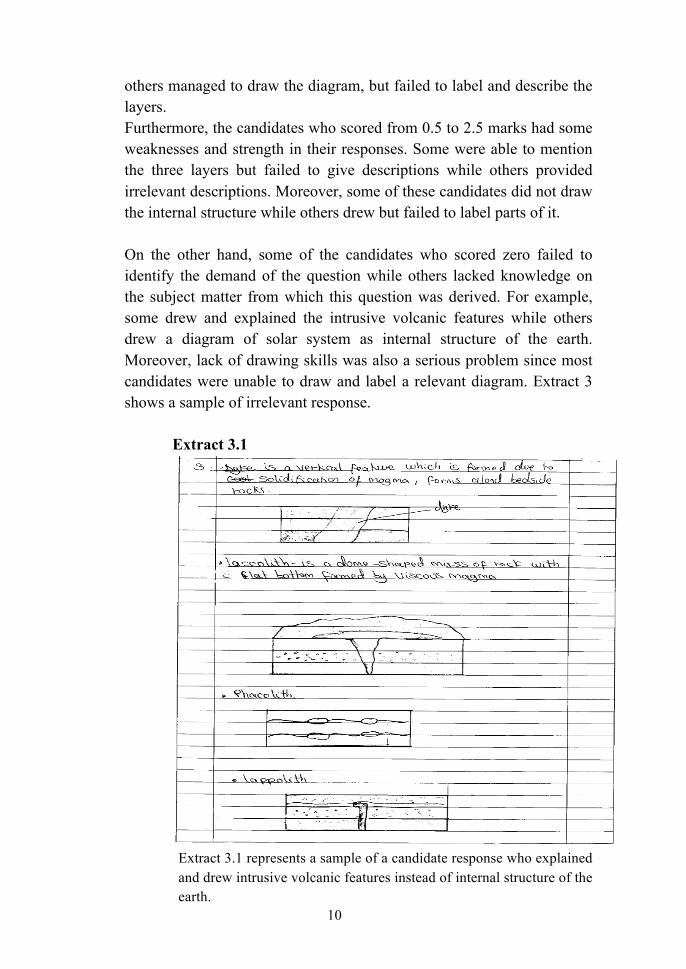
others managed to draw the diagram, but failed to label and describe the layers. Furthermore, the candidates who scored from 0.5 to 2.5 marks had some weaknesses and strength in their responses. Some were able to mention the three layers but failed to give descriptions while others provided irrelevant descriptions. Moreover, some of these candidates did not draw the internal structure while others drew but failed to label parts of it. On the other hand, some of the candidates who scored zero failed to identify the demand of the question while others lacked knowledge on the subject matter from which this question was derived. For example, some drew and explained the intrusive volcanic features while others drew a diagram of solar system as internal structure of the earth. Moreover, lack of drawing skills was also a serious problem since most candidates were unable to draw and label a relevant diagram. Extract 3 shows a sample of irrelevant response.
Extract 3.1
Extract 3.1 represents a sample of a candidate response who explained and drew intrusive volcanic features instead of internal structure of the earth.
11
2.2 SECTION B: APPLICATION OF STATISTICS, INTRODUCTION TO RESEARCH, ELEMENTARY SURVEY AND MAP
2.2.1 Question 4 : Application of Statistics
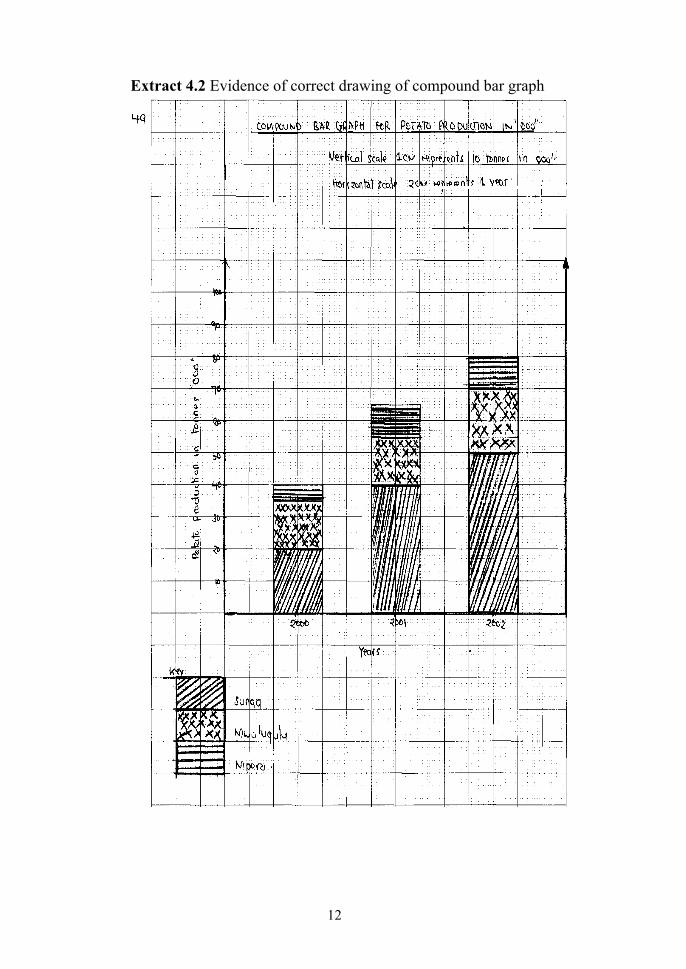
This question had three parts (a), (b), and (c). The candidates were instructed to: (a) construct a compound bar graph showing the production of Irish potatoes in three villages, namely Sunga, Mwalugulu and Mpera, (b) give three advantages and two disadvantages of the compound bar graph and (c) suggest any other three methods which could be used to represent the data provided in the table.
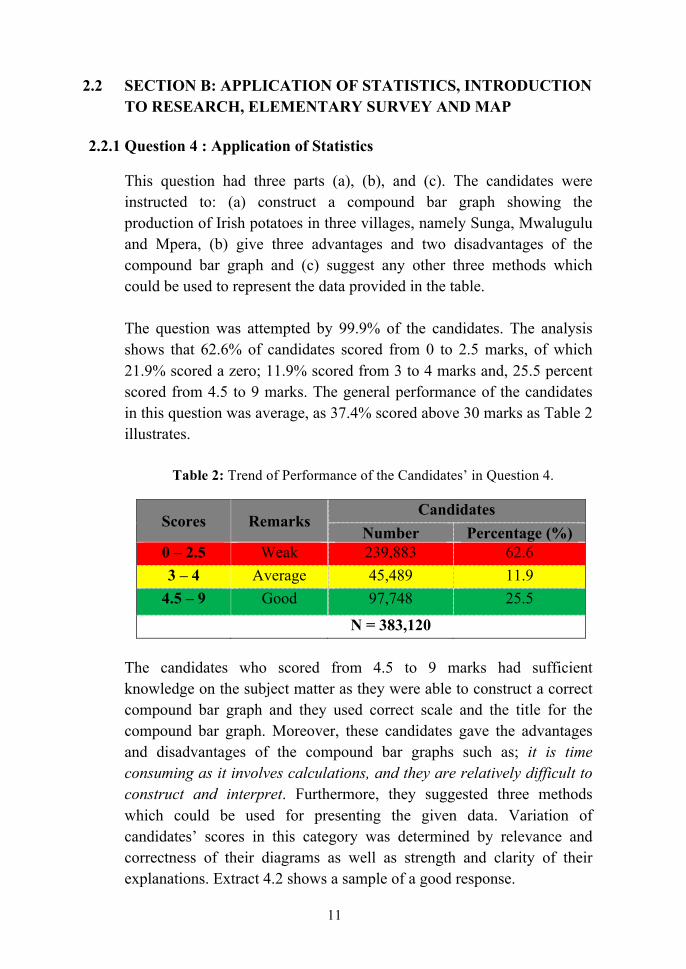
The question was attempted by 99.9% of the candidates. The analysis shows that 62.6% of candidates scored from 0 to 2.5 marks, of which 21.9% scored a zero; 11.9% scored from 3 to 4 marks and, 25.5 percent scored from 4.5 to 9 marks. The general performance of the candidates in this question was average, as 37.4% scored above 30 marks as Table 2 illustrates.
Table 2: Trend of Performance of the Candidates’ in Question 4.
Scores Remarks Candidates
Number Percentage (%) 0 – 2.5 Weak 239,883 62.6 3 – 4 Average 45,489 11.9
4.5 – 9 Good 97,748 25.5
N = 383,120
The candidates who scored from 4.5 to 9 marks had sufficient knowledge on the subject matter as they were able to construct a correct compound bar graph and they used correct scale and the title for the compound bar graph. Moreover, these candidates gave the advantages and disadvantages of the compound bar graphs such as; it is time consuming as it involves calculations, and they are relatively difficult to construct and interpret. Furthermore, they suggested three methods which could be used for presenting the given data. Variation of candidates’ scores in this category was determined by relevance and correctness of their diagrams as well as strength and clarity of their explanations. Extract 4.2 shows a sample of a good response.
12
Extract 4.2 Evidence of correct drawing of compound bar graph
13
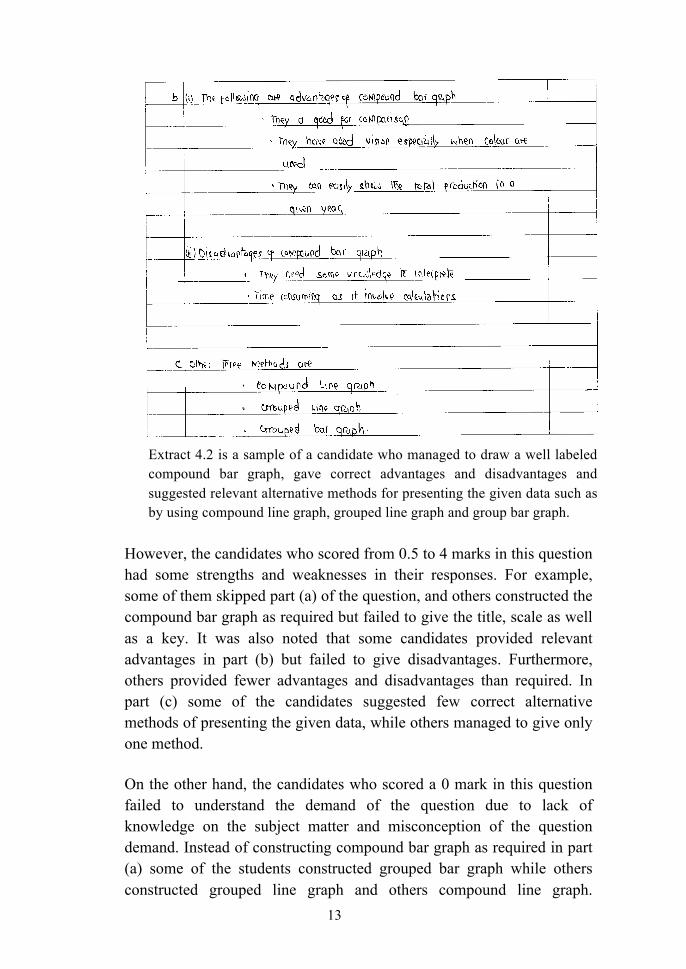
Extract 4.2 is a sample of a candidate who managed to draw a well labeled compound bar graph, gave correct advantages and disadvantages and suggested relevant alternative methods for presenting the given data such as by using compound line graph, grouped line graph and group bar graph.
However, the candidates who scored from 0.5 to 4 marks in this question had some strengths and weaknesses in their responses. For example, some of them skipped part (a) of the question, and others constructed the compound bar graph as required but failed to give the title, scale as well as a key. It was also noted that some candidates provided relevant advantages in part (b) but failed to give disadvantages. Furthermore, others provided fewer advantages and disadvantages than required. In part (c) some of the candidates suggested few correct alternative methods of presenting the given data, while others managed to give only one method.
On the other hand, the candidates who scored a 0 mark in this question failed to understand the demand of the question due to lack of knowledge on the subject matter and misconception of the question demand. Instead of constructing compound bar graph as required in part (a) some of the students constructed grouped bar graph while others constructed grouped line graph and others compound line graph.
14
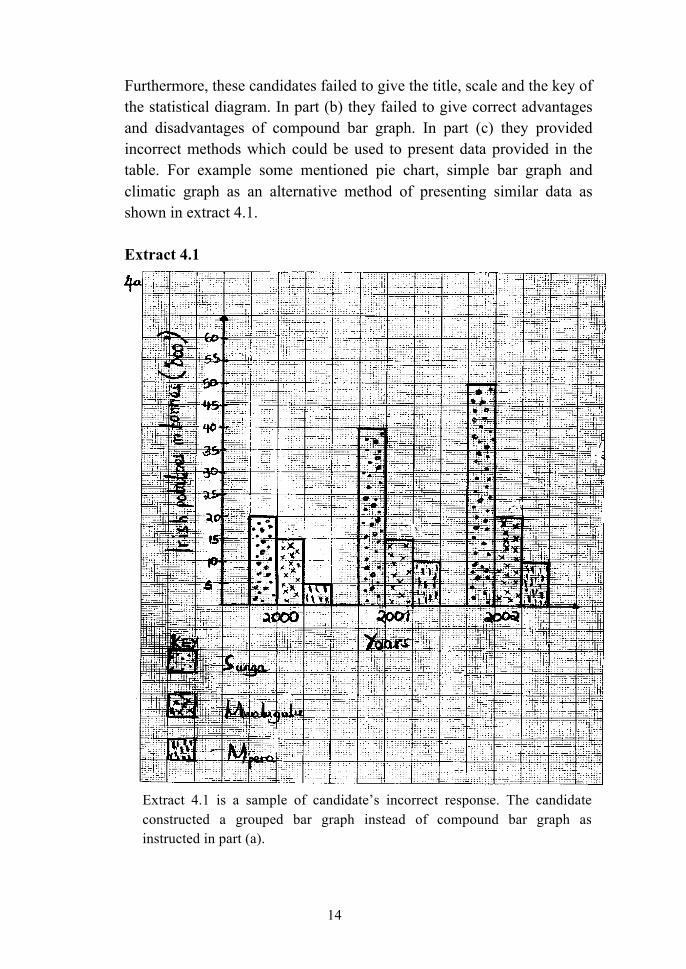
Furthermore, these candidates failed to give the title, scale and the key of the statistical diagram. In part (b) they failed to give correct advantages and disadvantages of compound bar graph. In part (c) they provided incorrect methods which could be used to present data provided in the table. For example some mentioned pie chart, simple bar graph and climatic graph as an alternative method of presenting similar data as shown in extract 4.1.
Extract 4.1
Extract 4.1 is a sample of candidate’s incorrect response. The candidate constructed a grouped bar graph instead of compound bar graph as instructed in part (a).
15
2.2.2 Question 5 : Introduction to Research
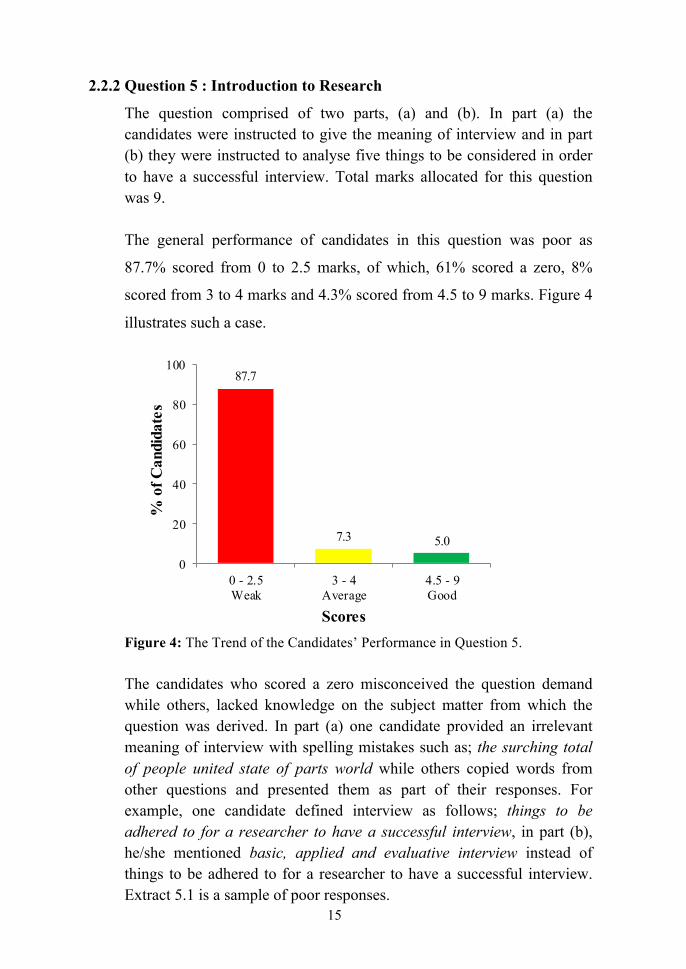
The question comprised of two parts, (a) and (b). In part (a) the candidates were instructed to give the meaning of interview and in part (b) they were instructed to analyse five things to be considered in order to have a successful interview. Total marks allocated for this question was 9. The general performance of candidates in this question was poor as
87.7% scored from 0 to 2.5 marks, of which, 61% scored a zero, 8%
scored from 3 to 4 marks and 4.3% scored from 4.5 to 9 marks. Figure 4
illustrates such a case.
87.7
7.3 5.0
0
20
40
60
80
100
0 - 2.5Weak
3 - 4Average
4.5 - 9Good
% o
f Can
dida
tes
Scores
Figure 4: The Trend of the Candidates’ Performance in Question 5.
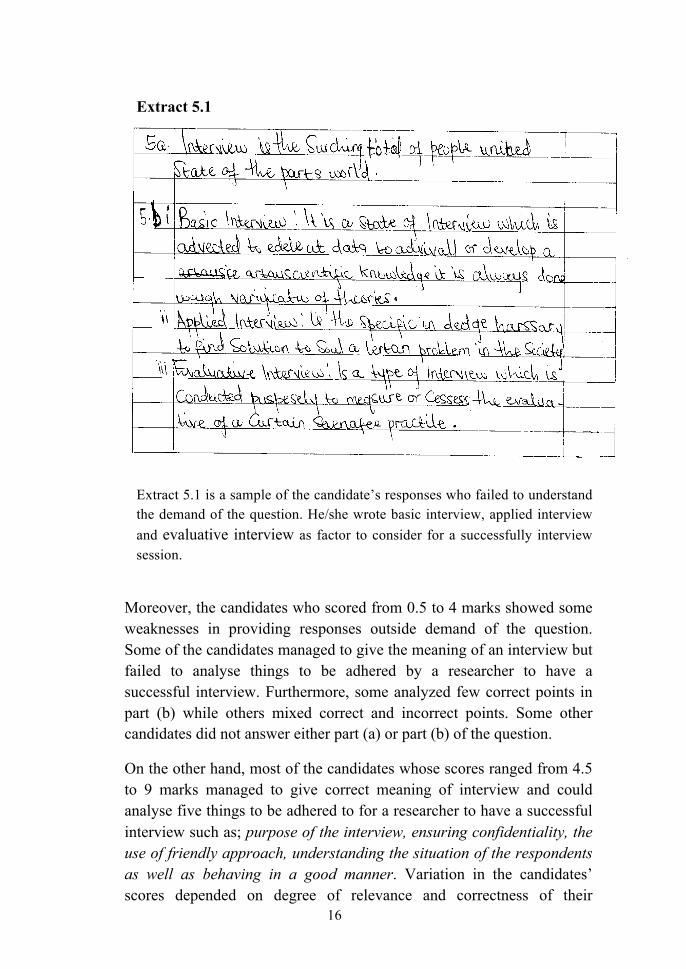
The candidates who scored a zero misconceived the question demand while others, lacked knowledge on the subject matter from which the question was derived. In part (a) one candidate provided an irrelevant meaning of interview with spelling mistakes such as; the surching total of people united state of parts world while others copied words from other questions and presented them as part of their responses. For example, one candidate defined interview as follows; things to be adhered to for a researcher to have a successful interview, in part (b), he/she mentioned basic, applied and evaluative interview instead of things to be adhered to for a researcher to have a successful interview. Extract 5.1 is a sample of poor responses.
16
Extract 5.1
Extract 5.1 is a sample of the candidate’s responses who failed to understand the demand of the question. He/she wrote basic interview, applied interview and evaluative interview as factor to consider for a successfully interview session.
Moreover, the candidates who scored from 0.5 to 4 marks showed some weaknesses in providing responses outside demand of the question. Some of the candidates managed to give the meaning of an interview but failed to analyse things to be adhered by a researcher to have a successful interview. Furthermore, some analyzed few correct points in part (b) while others mixed correct and incorrect points. Some other candidates did not answer either part (a) or part (b) of the question.
On the other hand, most of the candidates whose scores ranged from 4.5 to 9 marks managed to give correct meaning of interview and could analyse five things to be adhered to for a researcher to have a successful interview such as; purpose of the interview, ensuring confidentiality, the use of friendly approach, understanding the situation of the respondents as well as behaving in a good manner. Variation in the candidates’ scores depended on degree of relevance and correctness of their
17
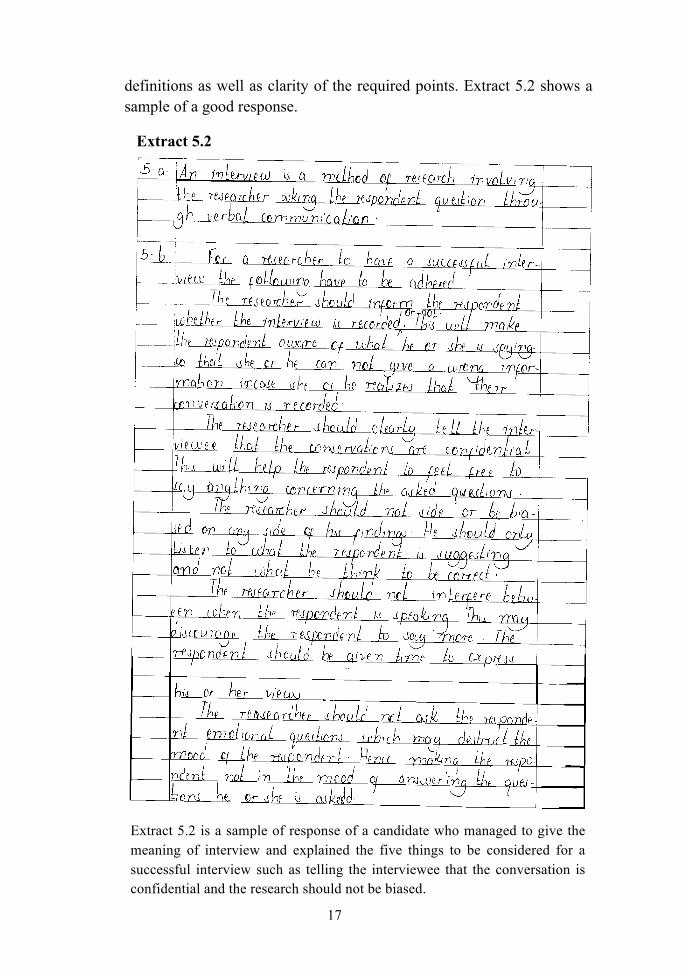
definitions as well as clarity of the required points. Extract 5.2 shows a sample of a good response.
Extract 5.2
Extract 5.2 is a sample of response of a candidate who managed to give the meaning of interview and explained the five things to be considered for a successful interview such as telling the interviewee that the conversation is confidential and the research should not be biased.
18
2.2.3 Question 6: Elementary Surveying
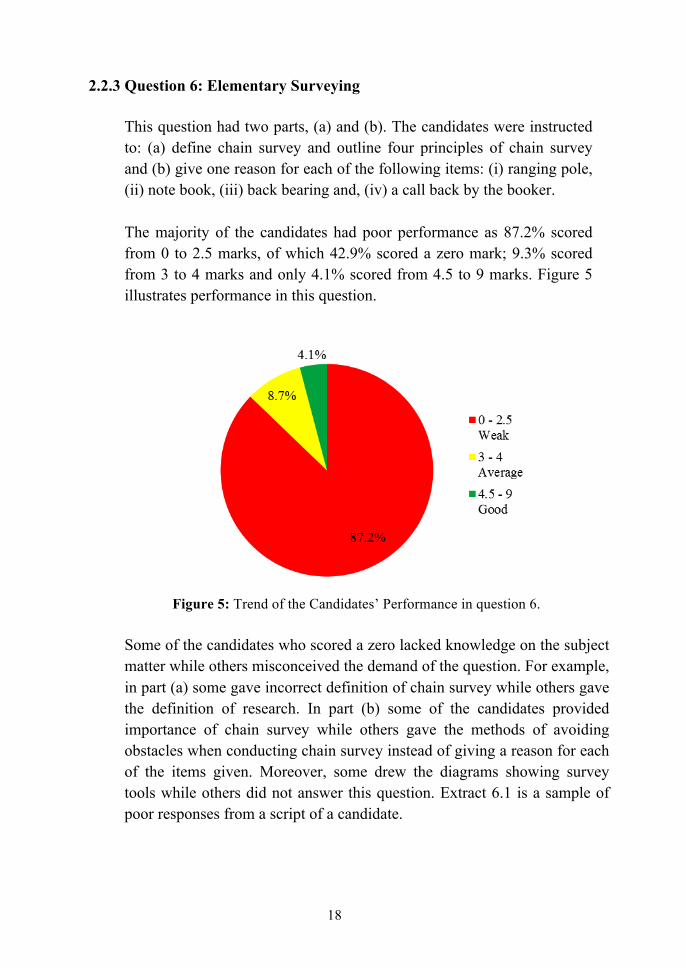
This question had two parts, (a) and (b). The candidates were instructed to: (a) define chain survey and outline four principles of chain survey and (b) give one reason for each of the following items: (i) ranging pole, (ii) note book, (iii) back bearing and, (iv) a call back by the booker. The majority of the candidates had poor performance as 87.2% scored from 0 to 2.5 marks, of which 42.9% scored a zero mark; 9.3% scored from 3 to 4 marks and only 4.1% scored from 4.5 to 9 marks. Figure 5 illustrates performance in this question.
Figure 5: Trend of the Candidates’ Performance in question 6.
Some of the candidates who scored a zero lacked knowledge on the subject matter while others misconceived the demand of the question. For example, in part (a) some gave incorrect definition of chain survey while others gave the definition of research. In part (b) some of the candidates provided importance of chain survey while others gave the methods of avoiding obstacles when conducting chain survey instead of giving a reason for each of the items given. Moreover, some drew the diagrams showing survey tools while others did not answer this question. Extract 6.1 is a sample of poor responses from a script of a candidate.
19
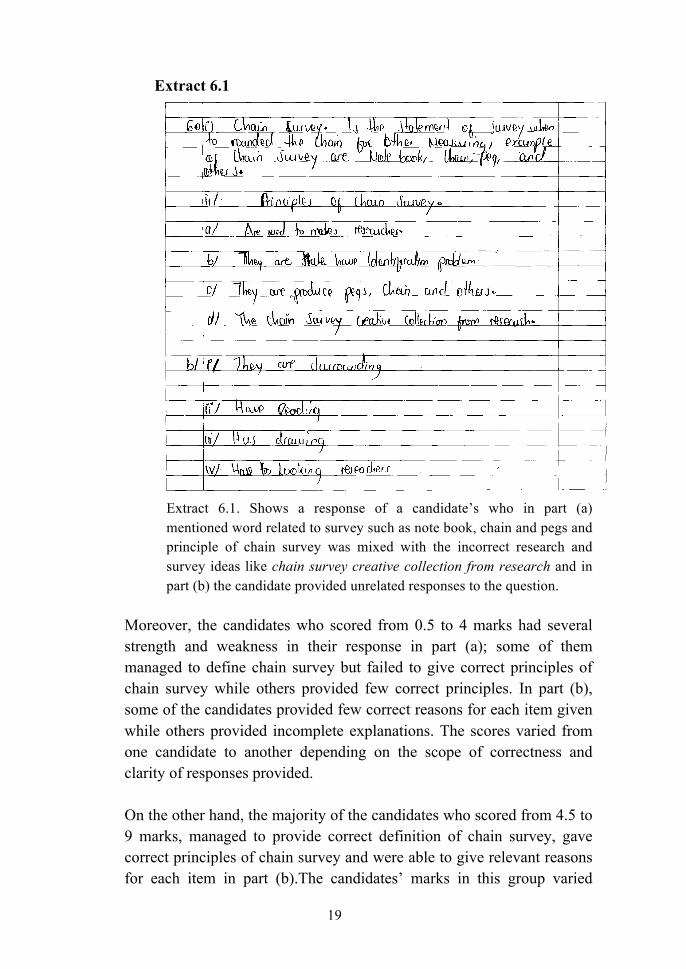
Extract 6.1
Extract 6.1. Shows a response of a candidate’s who in part (a) mentioned word related to survey such as note book, chain and pegs and principle of chain survey was mixed with the incorrect research and survey ideas like chain survey creative collection from research and in part (b) the candidate provided unrelated responses to the question.
Moreover, the candidates who scored from 0.5 to 4 marks had several strength and weakness in their response in part (a); some of them managed to define chain survey but failed to give correct principles of chain survey while others provided few correct principles. In part (b), some of the candidates provided few correct reasons for each item given while others provided incomplete explanations. The scores varied from one candidate to another depending on the scope of correctness and clarity of responses provided.
On the other hand, the majority of the candidates who scored from 4.5 to 9 marks, managed to provide correct definition of chain survey, gave correct principles of chain survey and were able to give relevant reasons for each item in part (b).The candidates’ marks in this group varied
20
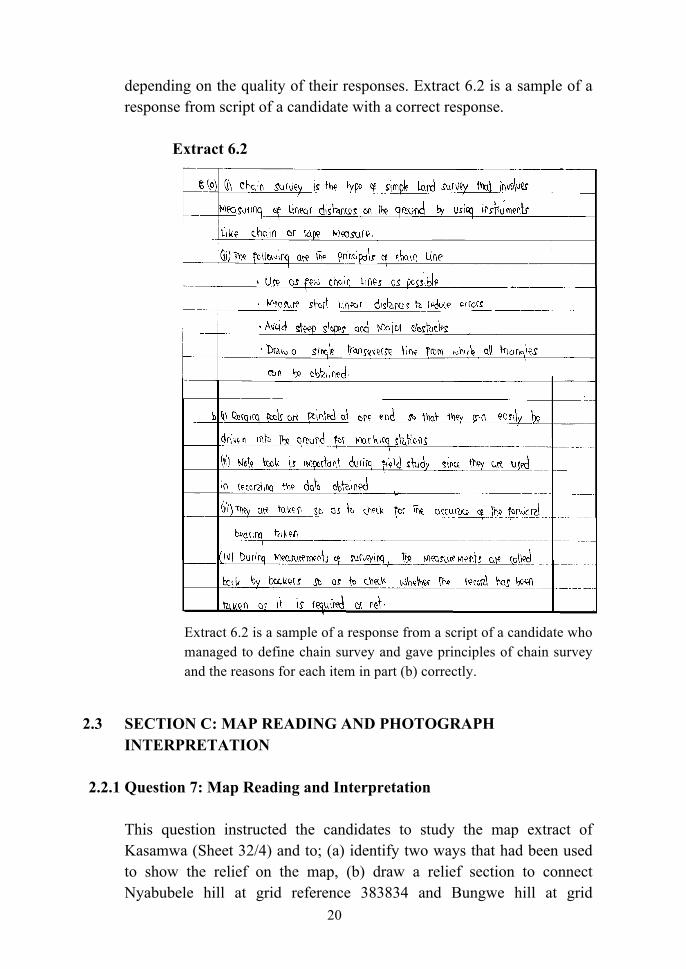
depending on the quality of their responses. Extract 6.2 is a sample of a response from script of a candidate with a correct response. Extract 6.2
Extract 6.2 is a sample of a response from a script of a candidate who managed to define chain survey and gave principles of chain survey and the reasons for each item in part (b) correctly.
2.3 SECTION C: MAP READING AND PHOTOGRAPH INTERPRETATION
2.2.1 Question 7: Map Reading and Interpretation
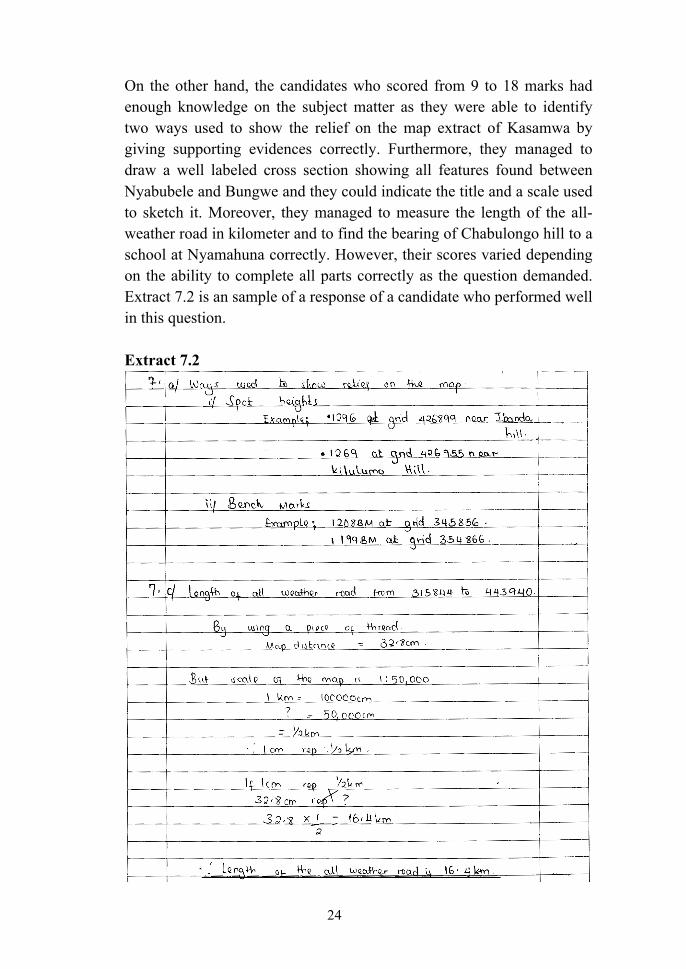
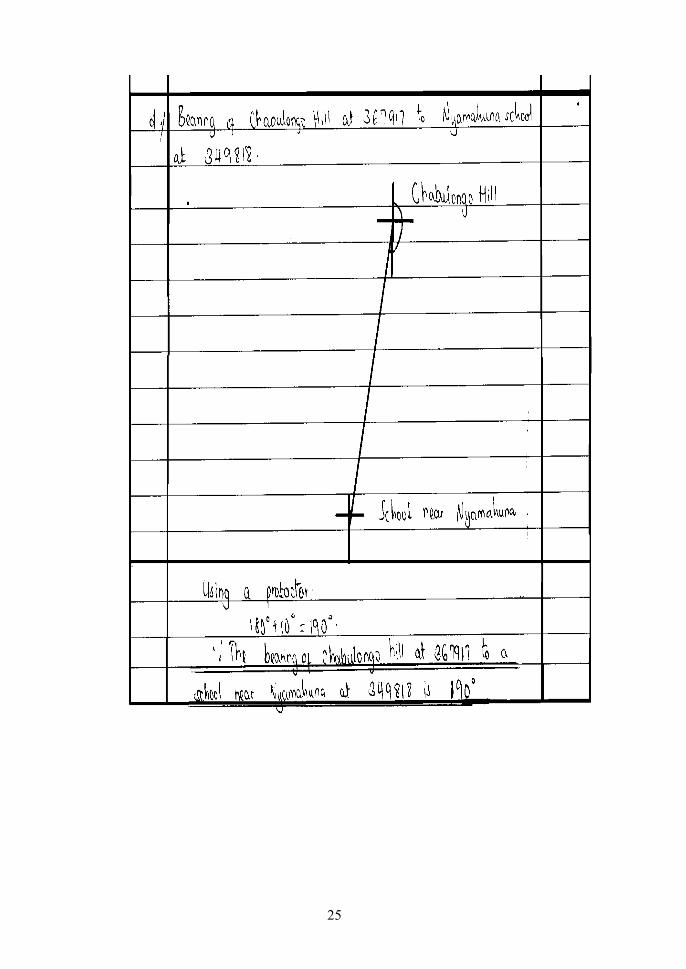
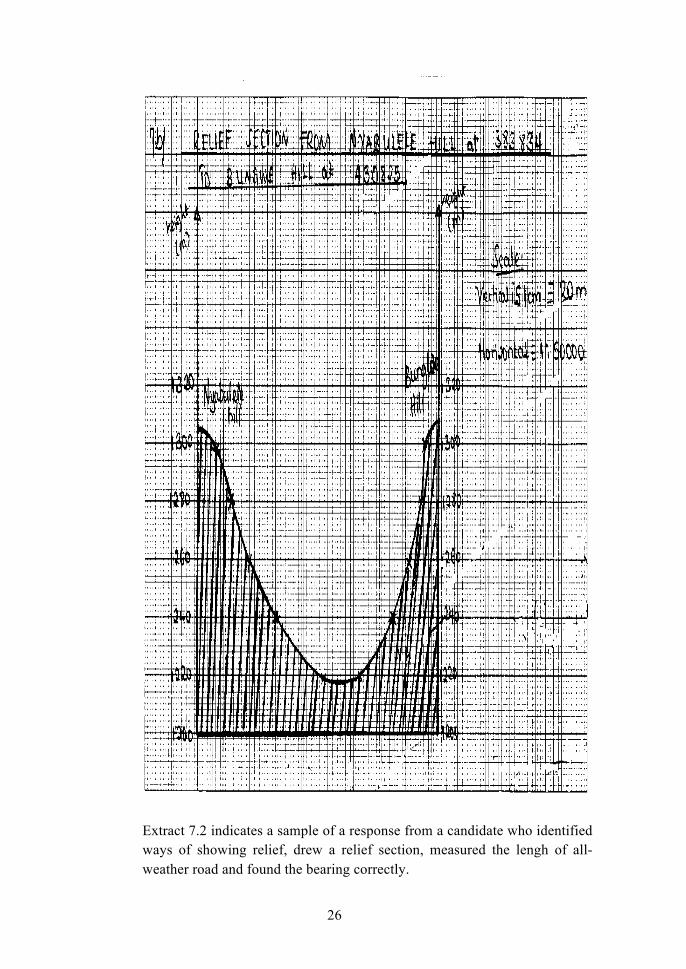
This question instructed the candidates to study the map extract of Kasamwa (Sheet 32/4) and to; (a) identify two ways that had been used to show the relief on the map, (b) draw a relief section to connect Nyabubele hill at grid reference 383834 and Bungwe hill at grid
21
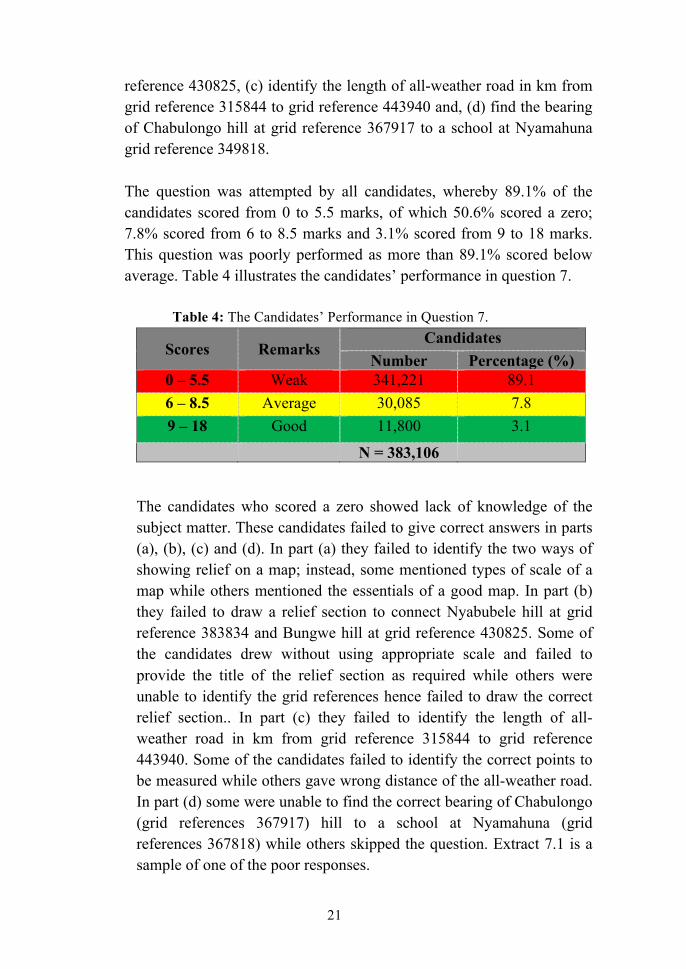
reference 430825, (c) identify the length of all-weather road in km from grid reference 315844 to grid reference 443940 and, (d) find the bearing of Chabulongo hill at grid reference 367917 to a school at Nyamahuna grid reference 349818. The question was attempted by all candidates, whereby 89.1% of the candidates scored from 0 to 5.5 marks, of which 50.6% scored a zero; 7.8% scored from 6 to 8.5 marks and 3.1% scored from 9 to 18 marks. This question was poorly performed as more than 89.1% scored below average. Table 4 illustrates the candidates’ performance in question 7. Table 4: The Candidates’ Performance in Question 7.
Scores Remarks Candidates
Number Percentage (%) 0 – 5.5 Weak 341,221 89.1 6 – 8.5 Average 30,085 7.8 9 – 18 Good 11,800 3.1
N = 383,106
The candidates who scored a zero showed lack of knowledge of the subject matter. These candidates failed to give correct answers in parts (a), (b), (c) and (d). In part (a) they failed to identify the two ways of showing relief on a map; instead, some mentioned types of scale of a map while others mentioned the essentials of a good map. In part (b) they failed to draw a relief section to connect Nyabubele hill at grid reference 383834 and Bungwe hill at grid reference 430825. Some of the candidates drew without using appropriate scale and failed to provide the title of the relief section as required while others were unable to identify the grid references hence failed to draw the correct relief section.. In part (c) they failed to identify the length of all-weather road in km from grid reference 315844 to grid reference 443940. Some of the candidates failed to identify the correct points to be measured while others gave wrong distance of the all-weather road. In part (d) some were unable to find the correct bearing of Chabulongo (grid references 367917) hill to a school at Nyamahuna (grid references 367818) while others skipped the question. Extract 7.1 is a sample of one of the poor responses.
22
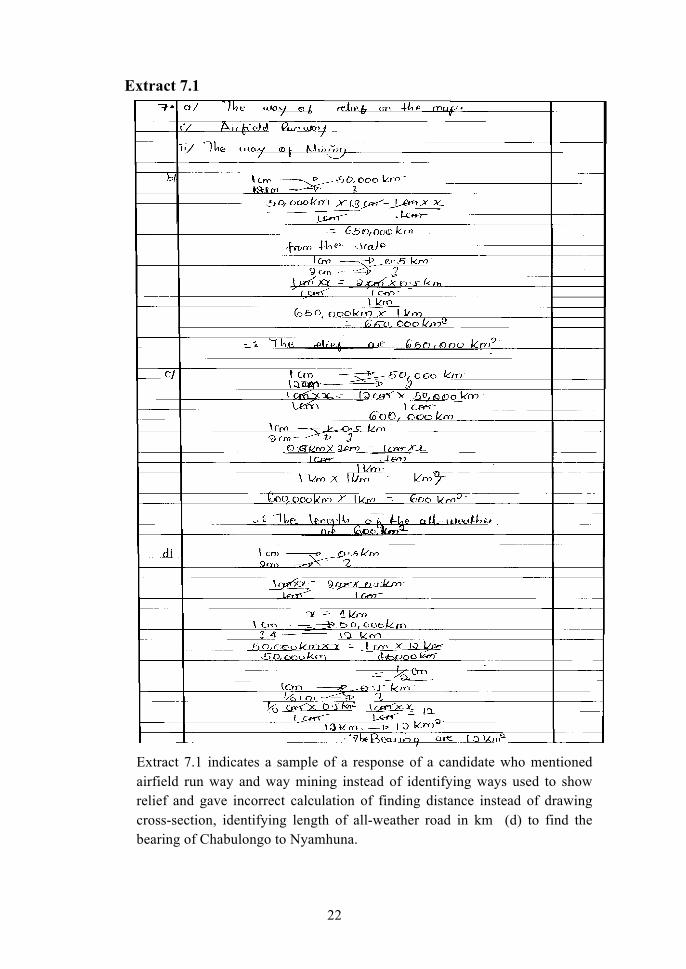
Extract 7.1
Extract 7.1 indicates a sample of a response of a candidate who mentioned airfield run way and way mining instead of identifying ways used to show relief and gave incorrect calculation of finding distance instead of drawing cross-section, identifying length of all-weather road in km (d) to find the bearing of Chabulongo to Nyamhuna.
23
The candidates who scored from 0.5 to 5.5 marks demonstrated several weakness and strengths. Some failed to score any marks in both parts of the question while others failed to give correct answers in some parts of the question. In part (a) some of the candidates failed to identify the two ways of showing relief on a map while others managed to score few marks. Moreover, some of them were able to give two ways that have been used to show relief on the map. In part (b) the majority of the candidates failed to draw the relief section connecting Nyabubele hill and Bungwe hill; instead, they sketched Nyabubele hill and Bungwe hill as shown from the given map of Kasamwa contray to the demand of the question. Other candidates sketched relief section but failed to give title and scale due to insufficient knowledge and skills of drawing a cross section. In part (c) some of the candidates misconceived the question as they calculated the area covered by Nyabubele and Bungwe hills instead of finding the length of all-weather road while others showed partial knowledge in measuring the length of all-weather road in kilometres from the given grid references and hence scored few marks in few correct procedure used to measure length. In part (d) some were unable to find the correct bearing of Chabulongo (grid references 367917) hill to a school at Nyamahuna (grid references 367818) while others provided the correct bearing but failed to provide the correct degrees.
Moreover, the candidates who scored from 6 to 8.5 marks had knowledge in some of the parts of this question. Some managed to identify ways used to show relief on the map but failed to draw a relief section to connect Nyabubele and Bungwe hills. In addtition to that, others were able draw a relief section correctly but failed to write title of the cross section and the scale used in sketching a cross-section. Furthermore, some managed to measure the length of all-weather road in centimeters but failed to change them into kilometers as the question demanded. Others managed to identify the length of all-weather road but failed to find the correct bearing of Chabulongo hill at grid reference 367917 to a school at Nyamahuna grid reference 349818.
24
On the other hand, the candidates who scored from 9 to 18 marks had enough knowledge on the subject matter as they were able to identify two ways used to show the relief on the map extract of Kasamwa by giving supporting evidences correctly. Furthermore, they managed to draw a well labeled cross section showing all features found between Nyabubele and Bungwe and they could indicate the title and a scale used to sketch it. Moreover, they managed to measure the length of the all-weather road in kilometer and to find the bearing of Chabulongo hill to a school at Nyamahuna correctly. However, their scores varied depending on the ability to complete all parts correctly as the question demanded. Extract 7.2 is an sample of a response of a candidate who performed well in this question. Extract 7.2
25
26
Extract 7.2 indicates a sample of a response from a candidate who identified ways of showing relief, drew a relief section, measured the lengh of all-weather road and found the bearing correctly.
27
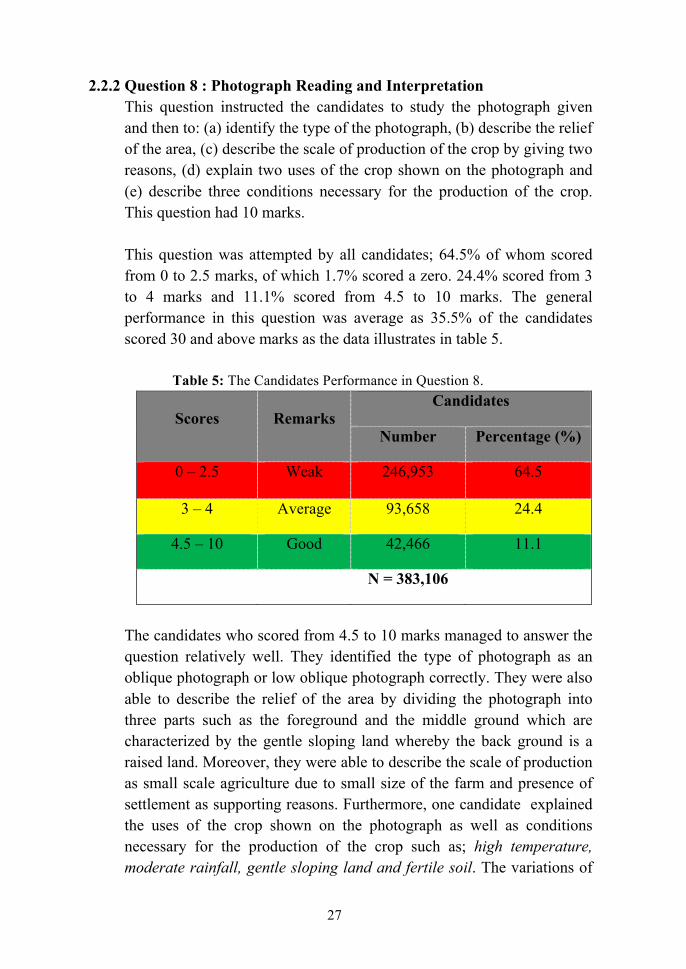
2.2.2 Question 8 : Photograph Reading and Interpretation This question instructed the candidates to study the photograph given and then to: (a) identify the type of the photograph, (b) describe the relief of the area, (c) describe the scale of production of the crop by giving two reasons, (d) explain two uses of the crop shown on the photograph and (e) describe three conditions necessary for the production of the crop. This question had 10 marks. This question was attempted by all candidates; 64.5% of whom scored from 0 to 2.5 marks, of which 1.7% scored a zero. 24.4% scored from 3 to 4 marks and 11.1% scored from 4.5 to 10 marks. The general performance in this question was average as 35.5% of the candidates scored 30 and above marks as the data illustrates in table 5.
Table 5: The Candidates Performance in Question 8.
Scores Remarks Candidates
Number Percentage (%)
0 – 2.5 Weak 246,953 64.5
3 – 4 Average 93,658 24.4
4.5 – 10 Good 42,466 11.1
N = 383,106
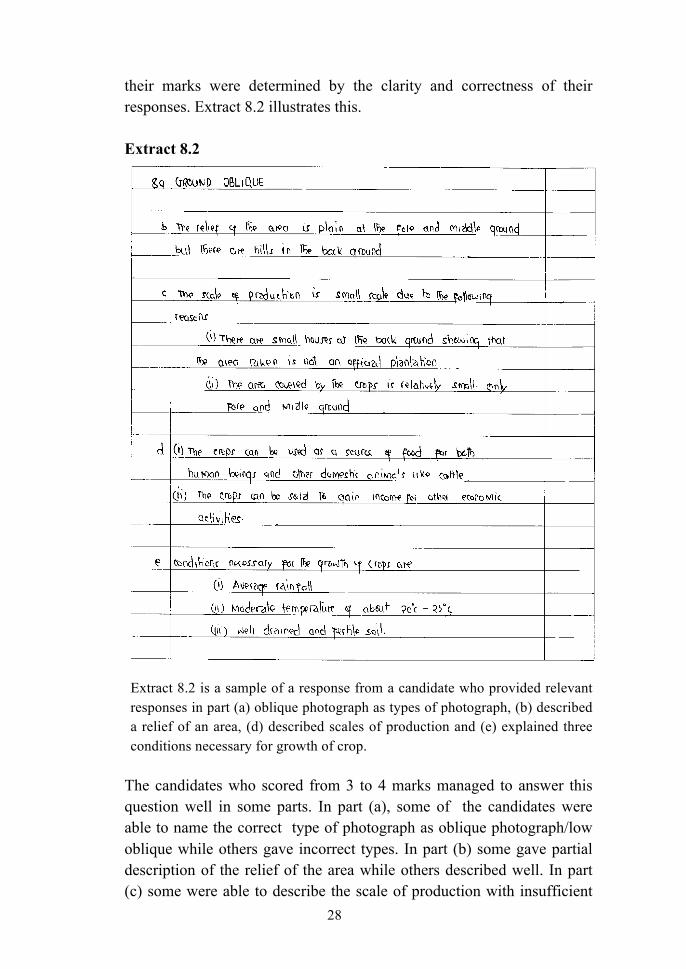
The candidates who scored from 4.5 to 10 marks managed to answer the question relatively well. They identified the type of photograph as an oblique photograph or low oblique photograph correctly. They were also able to describe the relief of the area by dividing the photograph into three parts such as the foreground and the middle ground which are characterized by the gentle sloping land whereby the back ground is a raised land. Moreover, they were able to describe the scale of production as small scale agriculture due to small size of the farm and presence of settlement as supporting reasons. Furthermore, one candidate explained the uses of the crop shown on the photograph as well as conditions necessary for the production of the crop such as; high temperature, moderate rainfall, gentle sloping land and fertile soil. The variations of
28
their marks were determined by the clarity and correctness of their responses. Extract 8.2 illustrates this.
Extract 8.2
Extract 8.2 is a sample of a response from a candidate who provided relevant responses in part (a) oblique photograph as types of photograph, (b) described a relief of an area, (d) described scales of production and (e) explained three conditions necessary for growth of crop.
The candidates who scored from 3 to 4 marks managed to answer this question well in some parts. In part (a), some of the candidates were able to name the correct type of photograph as oblique photograph/low oblique while others gave incorrect types. In part (b) some gave partial description of the relief of the area while others described well. In part (c) some were able to describe the scale of production with insufficient
29
reasons while others mentioned the scale without giving any description. In part (d) some of the candidates explained the uses of crop such as it is used as food for both people and animals, they are used as raw materials in manufacturing industries as well as its cobs can be used as a fuel if burnt. In part (e) some were able to describe few conditions necessary for the production of the crop such as average rainfall, well drained and fertile soil while others provided all the required points correctly. Moreover, some of the candidates’ skipped parts of the question which caused variation of their scores.
The candidates who scored from 0.5 to 2.5 showed insufficient knowledge in some parts of the question. In part (a), for example, some of the candidates were able to name the correct type of photograph while others named the type of photograph with supporting evidences. In part (b) some candidates answered the question by giving partial description of the relief of the area while others mentioned the observed physical features but failed to describe its location whether in the foreground, middle ground or the back ground. Moreover, in part (c) some candidates managed to point out the scale of production without giving reasons while others described only one point correctly. The main problem in this part was candidates’ inability to differentiate characteristics of small scale crop production from large scale crop production. In part (d) some of the candidates were able to explain few uses of the crop shown in the photograph while other mixed correct and incorrect uses of crop. In part (e) some of the candidates described few conditions necessary for the production of the crop while others failed to describe all the necessary condition for the production of the crop.
On the other hand, some of the candidates who scored a zero misconceived the demand of the question while others lacked knowledge on the subject matter hence failed to score any mark in both parts of the question. In part (a) some of the candidates gave the name of crop in the photograph instead of type of photograph while others named incorrect
30
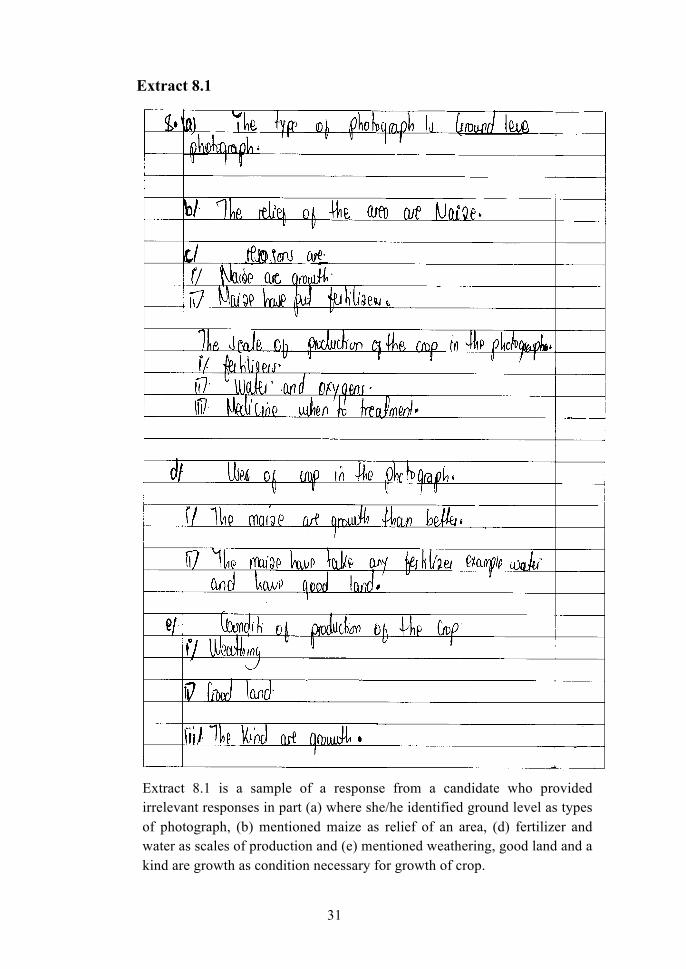
types of photographs such as, ground/horizontal photograph and vertical photograph instead of oblique photograph. In part (b), the candidates failed to describe the relief of the area shown on the photograph. Some of them mentioned the name of the crop shown in the photograph while others skipped the question. In part (c), the candidates failed to describe the scale of production of the crop with supporting reasons. These candidates wrote various incorrect responses. For example, some mentioned large scale agriculture while others described importance of agriculture instead of describing scale of production. In part (d), the candidates failed to explain the uses of the crop shown in the photograph. Some described the appearance of the crop in the photograph while others explained types of agriculture such as small scale agriculture and large scale agriculture instead of the uses of the crop seen in the photograph. In part (e) the candidates described incorrectly conditions necessary for the production of the crop; for example, some mentioned types of weathering such as mechanical and biological weathering while others explained the characteristics of small scale agriculture instead of the conditions necessary for growth of crop shown on the photograph. Extract 8.1 is a sample of a response of candidate with irrelevant answers.
31
Extract 8.1
Extract 8.1 is a sample of a response from a candidate who provided irrelevant responses in part (a) where she/he identified ground level as types of photograph, (b) mentioned maize as relief of an area, (d) fertilizer and water as scales of production and (e) mentioned weathering, good land and a kind are growth as condition necessary for growth of crop.
32
2.4: SECTION D: 2.4.1 PART 1: REGIONAL FOCAL STUDIES
2.4.1.1 Question 9: Agriculture
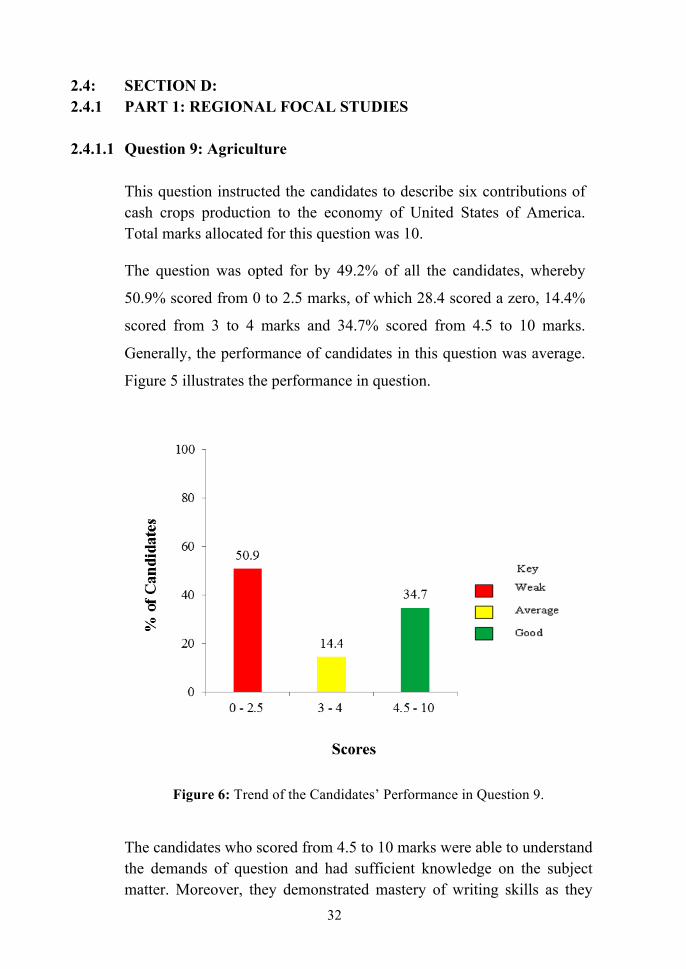
This question instructed the candidates to describe six contributions of cash crops production to the economy of United States of America. Total marks allocated for this question was 10.
The question was opted for by 49.2% of all the candidates, whereby
50.9% scored from 0 to 2.5 marks, of which 28.4 scored a zero, 14.4%
scored from 3 to 4 marks and 34.7% scored from 4.5 to 10 marks.
Generally, the performance of candidates in this question was average.
Figure 5 illustrates the performance in question.
Figure 6: Trend of the Candidates’ Performance in Question 9.
The candidates who scored from 4.5 to 10 marks were able to understand the demands of question and had sufficient knowledge on the subject matter. Moreover, they demonstrated mastery of writing skills as they
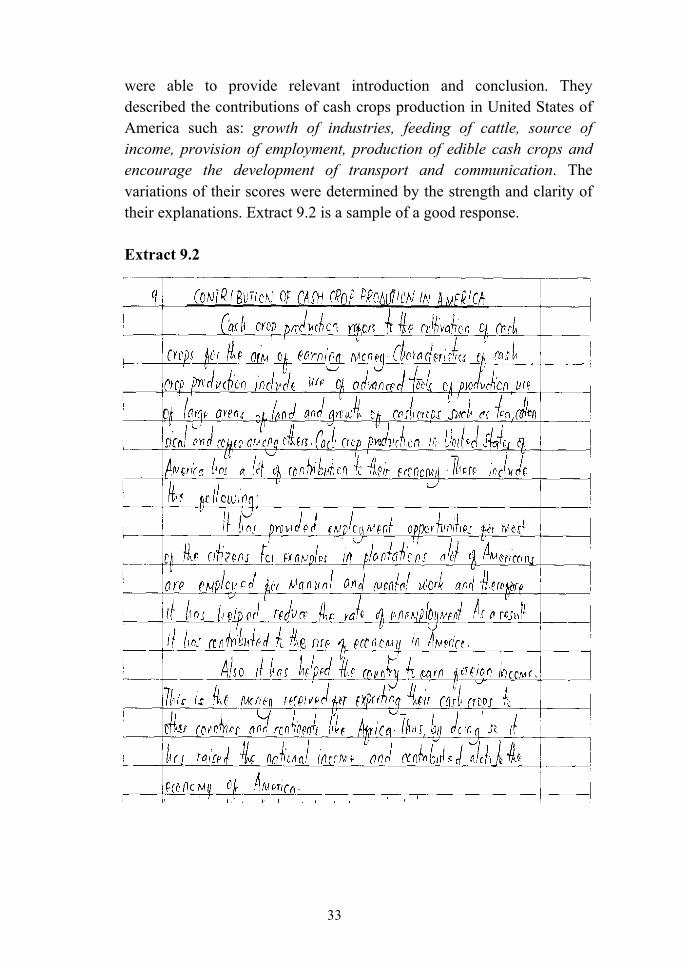
33
were able to provide relevant introduction and conclusion. They described the contributions of cash crops production in United States of America such as: growth of industries, feeding of cattle, source of income, provision of employment, production of edible cash crops and encourage the development of transport and communication. The variations of their scores were determined by the strength and clarity of their explanations. Extract 9.2 is a sample of a good response. Extract 9.2
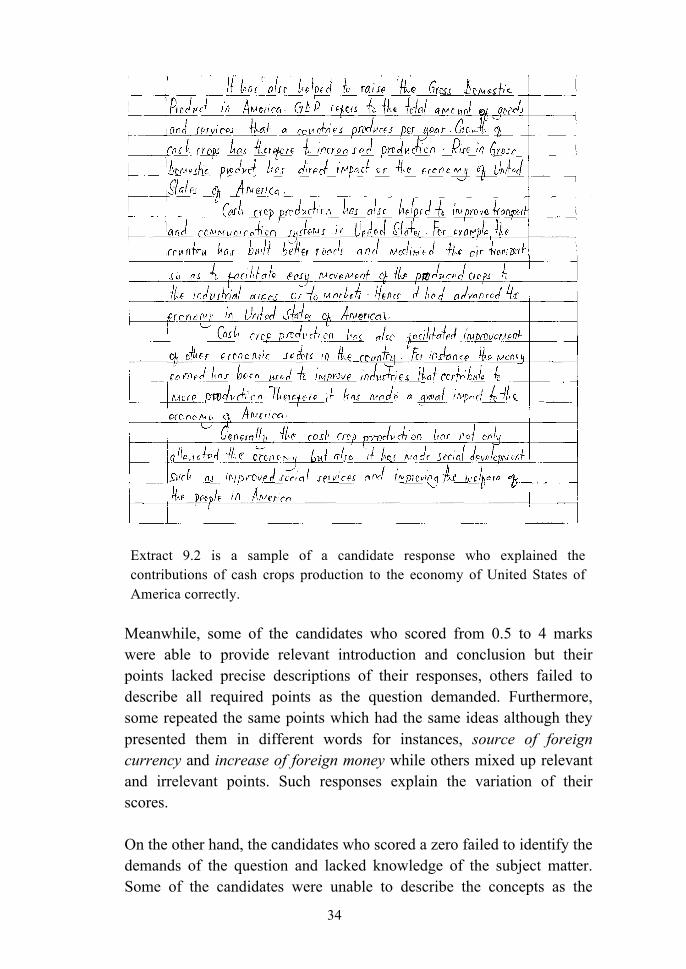
34
Extract 9.2 is a sample of a candidate response who explained the contributions of cash crops production to the economy of United States of America correctly.
Meanwhile, some of the candidates who scored from 0.5 to 4 marks were able to provide relevant introduction and conclusion but their points lacked precise descriptions of their responses, others failed to describe all required points as the question demanded. Furthermore, some repeated the same points which had the same ideas although they presented them in different words for instances, source of foreign currency and increase of foreign money while others mixed up relevant and irrelevant points. Such responses explain the variation of their scores. On the other hand, the candidates who scored a zero failed to identify the demands of the question and lacked knowledge of the subject matter. Some of the candidates were unable to describe the concepts as the
35
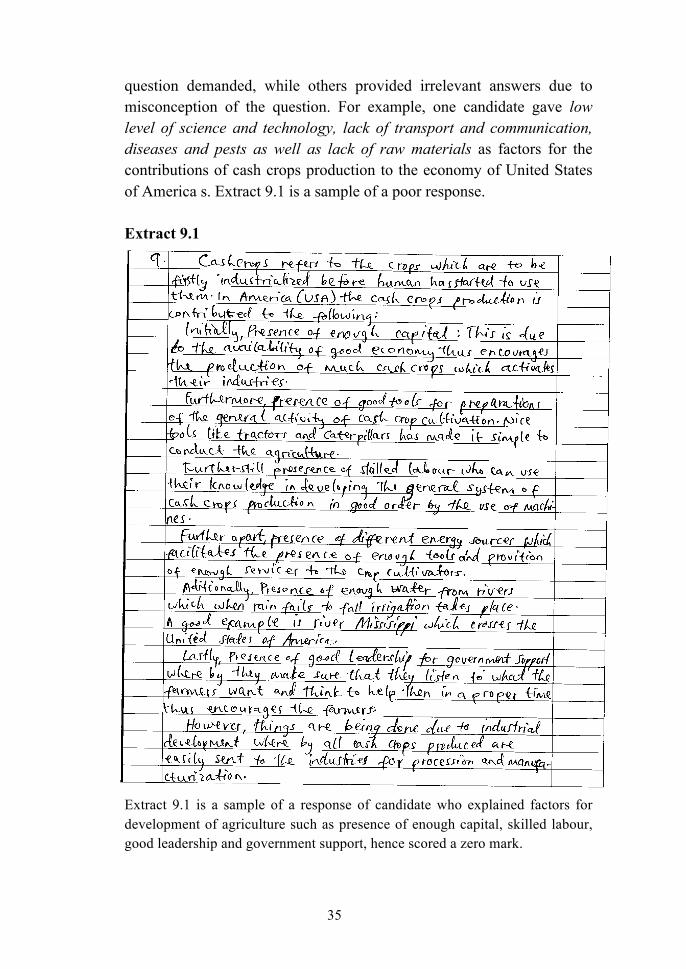
question demanded, while others provided irrelevant answers due to misconception of the question. For example, one candidate gave low level of science and technology, lack of transport and communication, diseases and pests as well as lack of raw materials as factors for the contributions of cash crops production to the economy of United States of America s. Extract 9.1 is a sample of a poor response.
Extract 9.1
Extract 9.1 is a sample of a response of candidate who explained factors for development of agriculture such as presence of enough capital, skilled labour, good leadership and government support, hence scored a zero mark.

36
2.4.1.2 Question 10 : Water Management for Economic Development
This question instructed the candidates to analyse six potentials of Rufiji river basin. Total marks allocated for this question was 10.
The question was attempted by 29.9% of the candidates, whereby 22.6% scored from 0 to 2.5 marks, of which 11.2 % scored a zero mark; 11.7% scored from 3 to 4 marks and 65.7% scored from 4.5 to 10 marks. Generally, the performance of candidates in this question was good, as 65.7% scored above average. Figure 6 give illustration.
22.6%
11.7%65.7%
0 - 2.5Weak3 - 4Average4.5 - 10Good
Figure 7: The Candidates’ Performance in Question 10.
The candidates who scored from 4.5 to 10 marks were able to give relevant introductions, conclusions, and they managed to analysed potentials of the Rufiji river basin. For example, one candidate analysed the correct points such as; generation of hydroelectric power, navigation, fishery activities, tourism activities, irrigation schemes and projects, and provision of employment opportunities. The variations of their responses were determined by the ability to clarify relevant points related to the tasks of the question. Extract 10.2 is a sample of a good response.
37
Extract 10.2
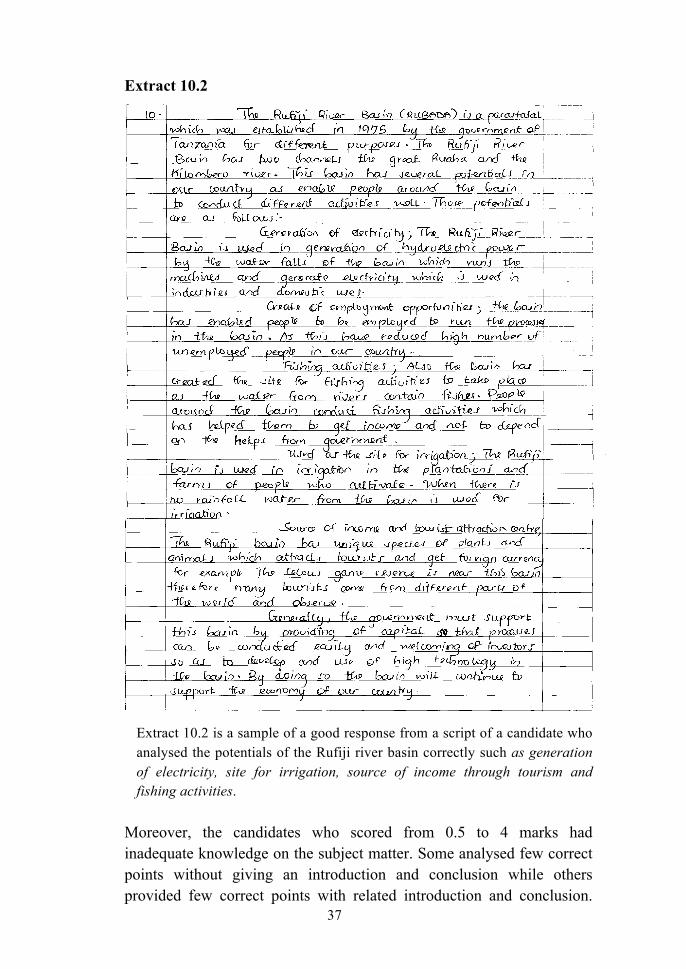
Extract 10.2 is a sample of a good response from a script of a candidate who analysed the potentials of the Rufiji river basin correctly such as generation of electricity, site for irrigation, source of income through tourism and fishing activities.
Moreover, the candidates who scored from 0.5 to 4 marks had inadequate knowledge on the subject matter. Some analysed few correct points without giving an introduction and conclusion while others provided few correct points with related introduction and conclusion.
38
However, others just mentioned potentials of the Rufiji river basin instead of analysing their points while others gave incomplete explanations which were characterized by poor writing skills. On the other hand, the candidate who scored a zero failed to understand the demands of the question and were unable to provide relevant introduction and conclusion. They could not analyse the potential of Rufiji river basin. For example, one candidate gave incorrect responses such as; low level of science and technology, lack of capital and poor infrastructures as potentials of Rufiji river basin Extract 10.1 illustrates this. Extract 10.1
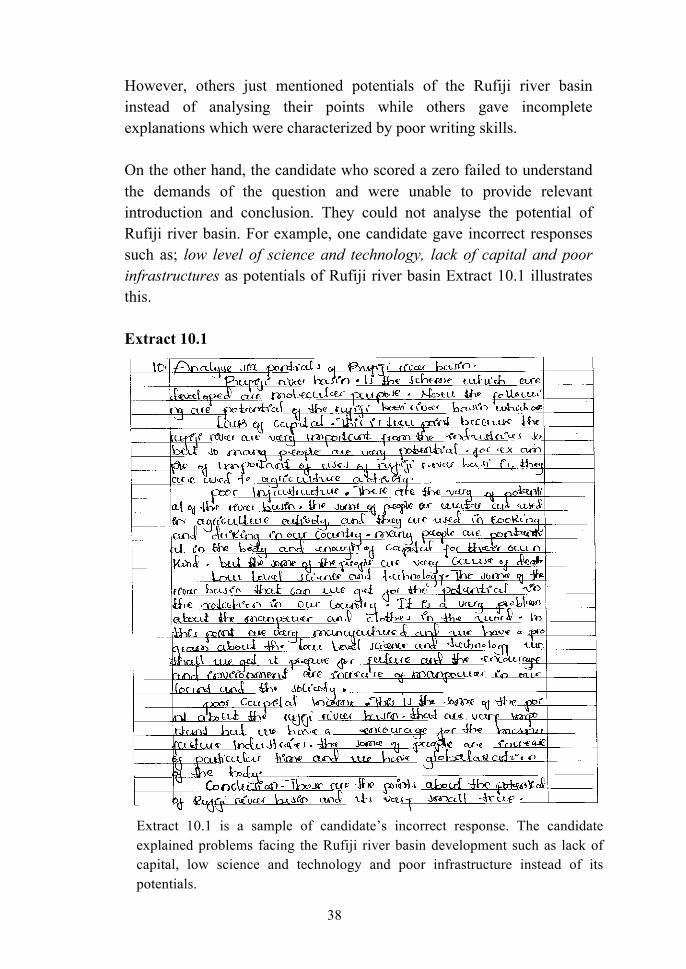
Extract 10.1 is a sample of candidate’s incorrect response. The candidate explained problems facing the Rufiji river basin development such as lack of capital, low science and technology and poor infrastructure instead of its potentials.

39
2.4.2 PART 2: ENVIRONMENTAL ISSUES, POPULATION AND SETTLEMENTS
2.4.2.1 Question 11 : Population Change
The question instructed the candidates to give reasons for decreasing death rates in many part of the world. Total marks allotted for this question was 10. The question was opted for by 20.2% of the candidates, whereby 57.1%
scored from 0 to 2.5 marks, of which 37.9% scored a zero, 13% scored
from 3 to 4 marks, and 29.9% scored from 4.5 to 10 of the allotted
marks. The general performance of the candidates in question was
average. Figure 7 illustrates the performance of candidates in this
question.
Figure 7: The Candidates’ Performance in Question 10.
The candidates who scored from 4.5 to 10 marks had adequate knowledge on the topic from which this question was derived. They managed to provide relevant introduction, explained the points with relevant examples to support their arguments and gave a clear and related conclusion. Such good responses could be attributed to the candidate’s ability to transfer classroom knowledge on the topic and relate it with their daily real life experiences because death is a common occurrence in their daily life for various reasons. For example, one
40
candidate provided correct responses such as; improved personal hygiene, improved medical care i.e. vaccinations, hospitals, doctors, new drugs and scientific investigation, provision of clean water supply, presence of peace and security, improved income of people and control of disasters and epidemics. However, the clarity and correctness of their responses resulted to variation of their scores. Extract 11.2 is a part of relevant responses.
Extract 11.2
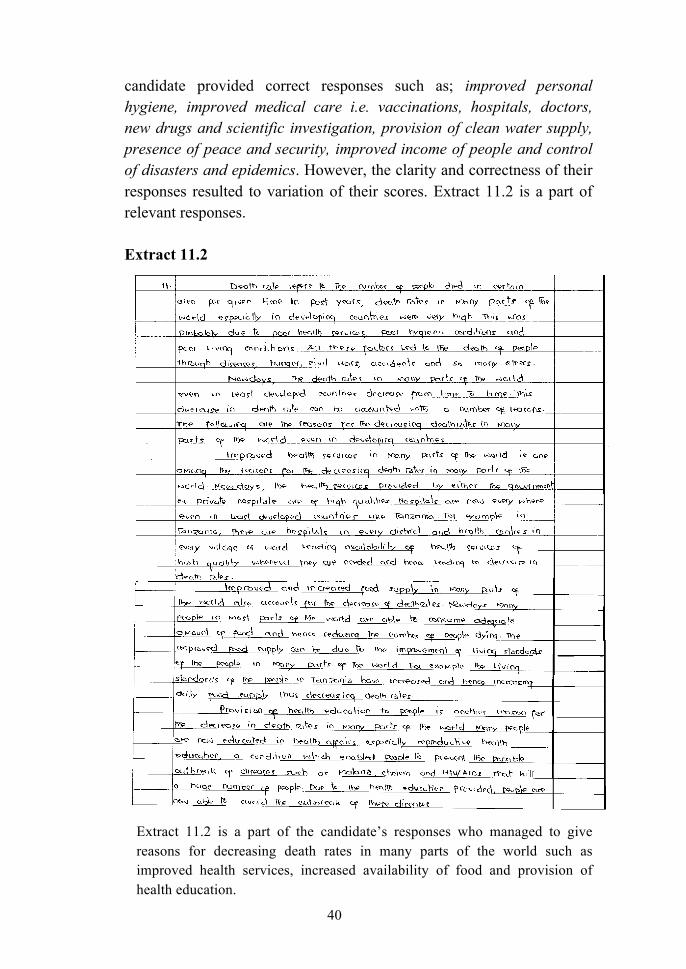
Extract 11.2 is a part of the candidate’s responses who managed to give reasons for decreasing death rates in many parts of the world such as improved health services, increased availability of food and provision of health education.
41
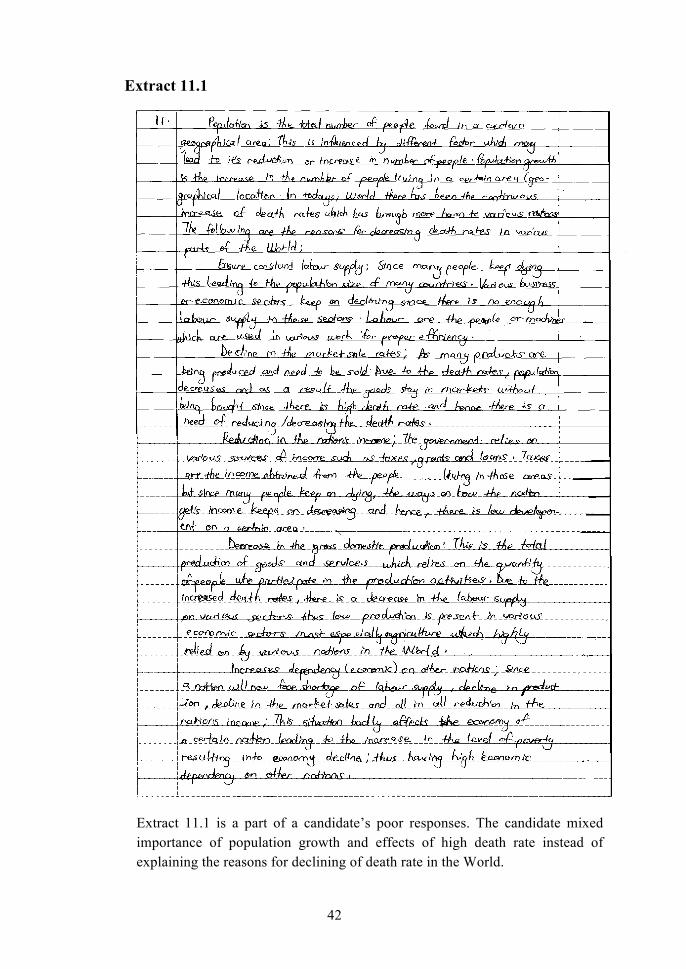
Moreover, the candidates who scored from 0.5 to 4 marks had insufficient knowledge on population issues. Some of the candidates in this group managed to provide relevant introduction and gave few correct reasons for the decreasing of death rate in many part of the world. While others, mentioned few correct points but failed to give relevant introductions and conclusions. The responses in this group varied depending on the ability of candidates to give relevant explanations. On other the hand, the candidates who scored a zero failed to understand the requirement of a question and lacked knowledge on the subject matter. Furthermore, some had poor language skills while others showed lack of skills in organising essay questions such as introduction, main body and a conclusion. Moreover, instead of giving reasons for decreasing death rates in many parts of the world, some provided irrelevant answers on effects of high population growth while others explained on importance of population growth. For example, one candidate provided incorrect answers such as; source of man power, source of government revenue, and providing market for the finished goods as Extract 11.1 illustrates instead of reasons for decreasing death rate.
42
Extract 11.1
Extract 11.1 is a part of a candidate’s poor responses. The candidate mixed importance of population growth and effects of high death rate instead of explaining the reasons for declining of death rate in the World.
43
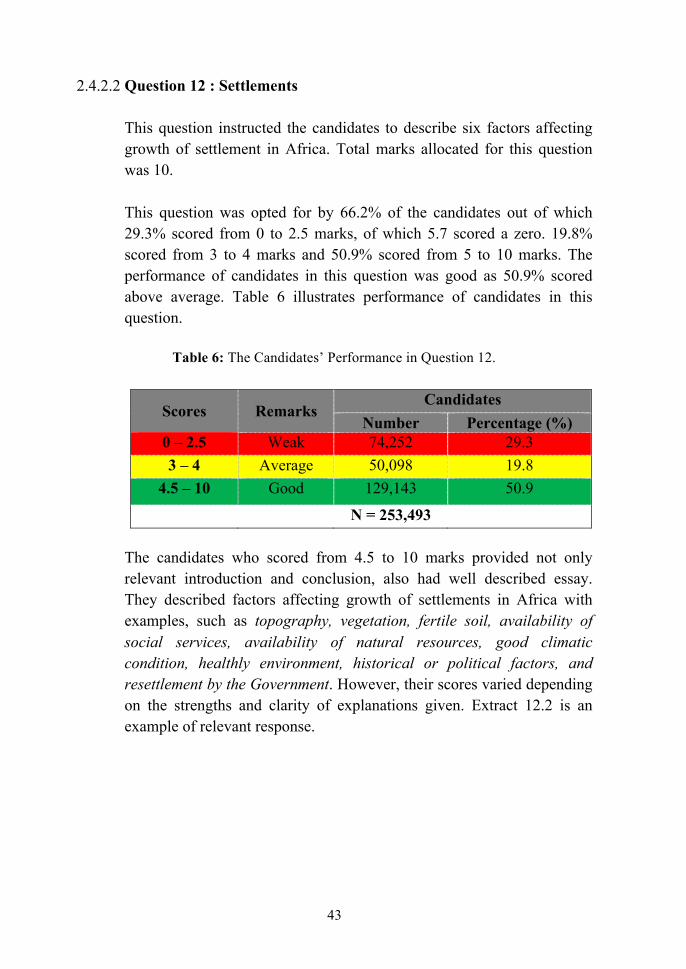
2.4.2.2 Question 12 : Settlements
This question instructed the candidates to describe six factors affecting growth of settlement in Africa. Total marks allocated for this question was 10. This question was opted for by 66.2% of the candidates out of which 29.3% scored from 0 to 2.5 marks, of which 5.7 scored a zero. 19.8% scored from 3 to 4 marks and 50.9% scored from 5 to 10 marks. The performance of candidates in this question was good as 50.9% scored above average. Table 6 illustrates performance of candidates in this question.
Table 6: The Candidates’ Performance in Question 12.
Scores Remarks Candidates
Number Percentage (%) 0 – 2.5 Weak 74,252 29.3 3 – 4 Average 50,098 19.8
4.5 – 10 Good 129,143 50.9
N = 253,493
The candidates who scored from 4.5 to 10 marks provided not only relevant introduction and conclusion, also had well described essay. They described factors affecting growth of settlements in Africa with examples, such as topography, vegetation, fertile soil, availability of social services, availability of natural resources, good climatic condition, healthly environment, historical or political factors, and resettlement by the Government. However, their scores varied depending on the strengths and clarity of explanations given. Extract 12.2 is an example of relevant response.
44
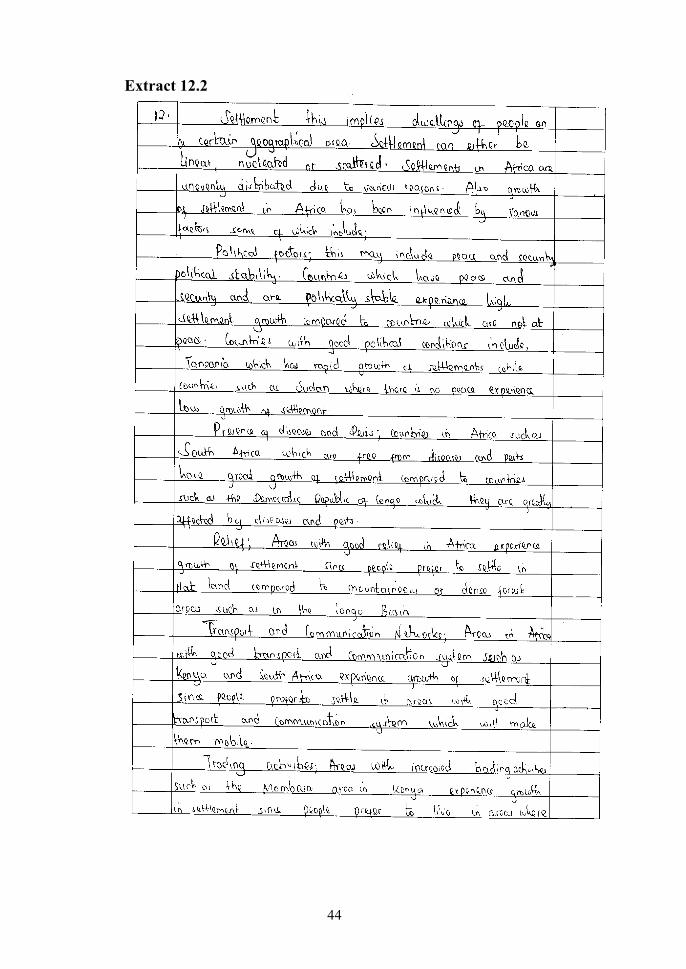
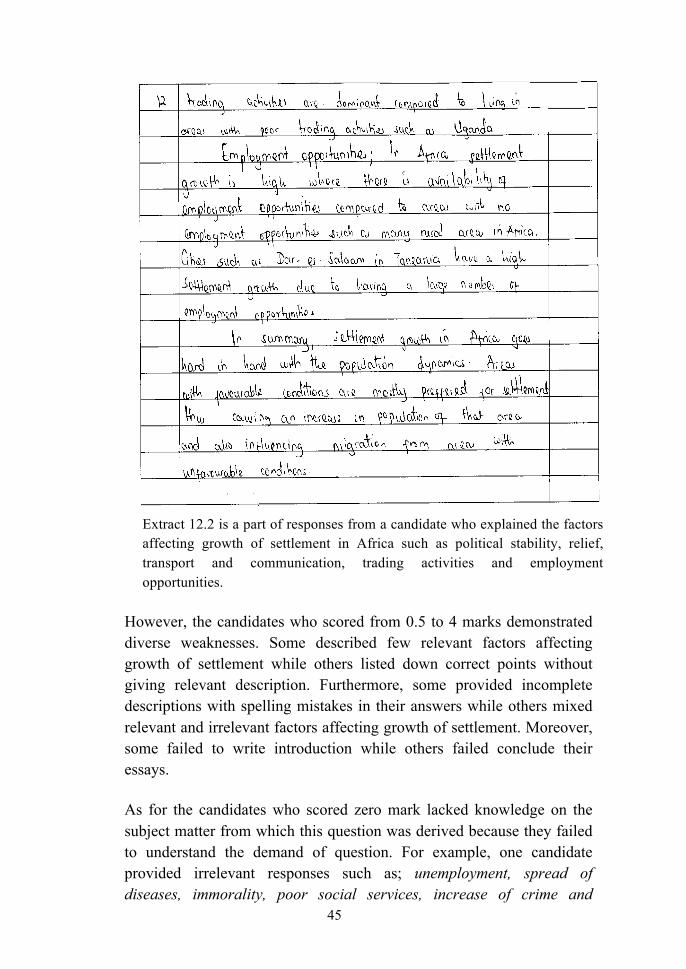
Extract 12.2
45
Extract 12.2 is a part of responses from a candidate who explained the factors affecting growth of settlement in Africa such as political stability, relief, transport and communication, trading activities and employment opportunities.
However, the candidates who scored from 0.5 to 4 marks demonstrated diverse weaknesses. Some described few relevant factors affecting growth of settlement while others listed down correct points without giving relevant description. Furthermore, some provided incomplete descriptions with spelling mistakes in their answers while others mixed relevant and irrelevant factors affecting growth of settlement. Moreover, some failed to write introduction while others failed conclude their essays.
As for the candidates who scored zero mark lacked knowledge on the subject matter from which this question was derived because they failed to understand the demand of question. For example, one candidate provided irrelevant responses such as; unemployment, spread of diseases, immorality, poor social services, increase of crime and
46
robbery and environment pollution which are correct response to impact of population growth. Moreover, some described other points which were irrelevant to the demand of the question while others just copied the question. Extract 12.1 is a sample of poor responses.
Extract 12.1
Extract 12.1 indicates a part of a candidate’s poor responses. The candidate explained on things related with problems facing manufacturing industries and factors for the establishment of industries such as availabilities of raw materials and market instead of factors affecting growth of settlement in Africa.
47
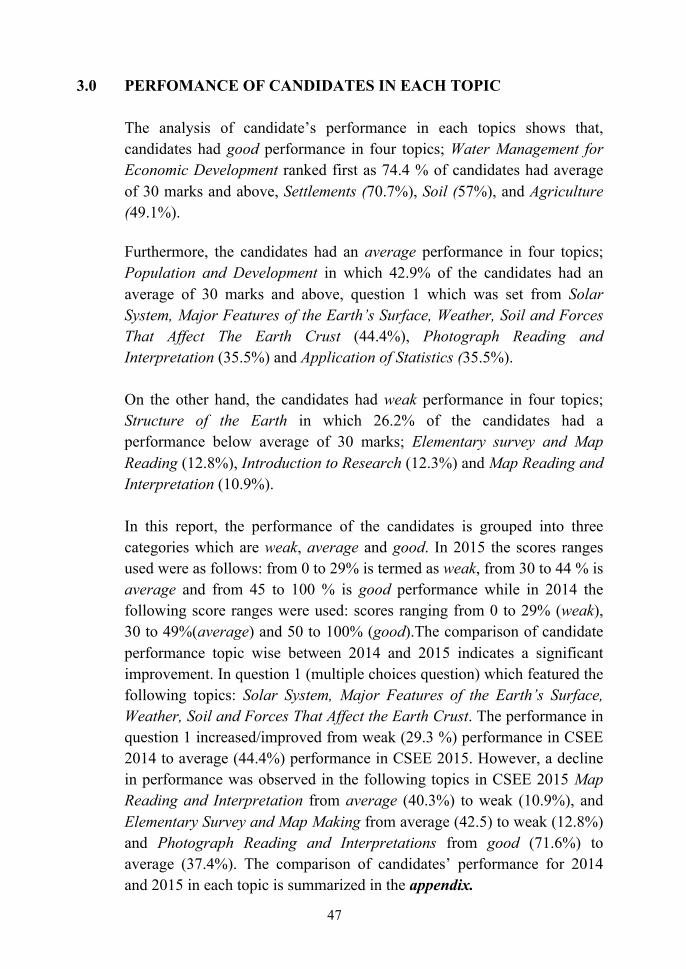
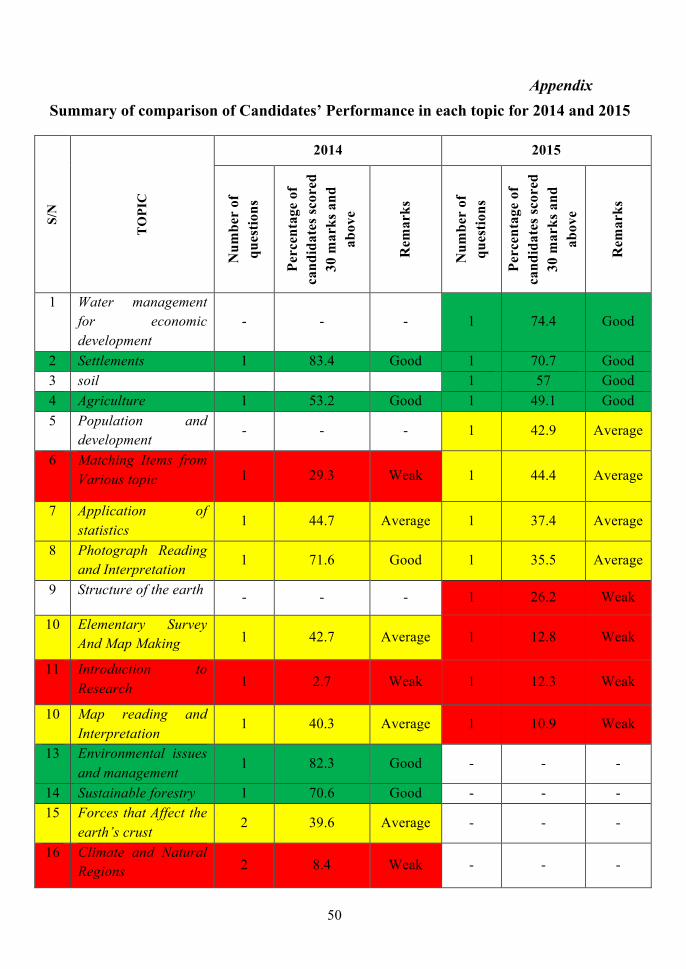
3.0 PERFOMANCE OF CANDIDATES IN EACH TOPIC The analysis of candidate’s performance in each topics shows that, candidates had good performance in four topics; Water Management for Economic Development ranked first as 74.4 % of candidates had average of 30 marks and above, Settlements (70.7%), Soil (57%), and Agriculture (49.1%). Furthermore, the candidates had an average performance in four topics; Population and Development in which 42.9% of the candidates had an average of 30 marks and above, question 1 which was set from Solar System, Major Features of the Earth’s Surface, Weather, Soil and Forces That Affect The Earth Crust (44.4%), Photograph Reading and Interpretation (35.5%) and Application of Statistics (35.5%).
On the other hand, the candidates had weak performance in four topics; Structure of the Earth in which 26.2% of the candidates had a performance below average of 30 marks; Elementary survey and Map Reading (12.8%), Introduction to Research (12.3%) and Map Reading and Interpretation (10.9%). In this report, the performance of the candidates is grouped into three categories which are weak, average and good. In 2015 the scores ranges used were as follows: from 0 to 29% is termed as weak, from 30 to 44 % is average and from 45 to 100 % is good performance while in 2014 the following score ranges were used: scores ranging from 0 to 29% (weak), 30 to 49%(average) and 50 to 100% (good).The comparison of candidate performance topic wise between 2014 and 2015 indicates a significant improvement. In question 1 (multiple choices question) which featured the following topics: Solar System, Major Features of the Earth’s Surface, Weather, Soil and Forces That Affect the Earth Crust. The performance in question 1 increased/improved from weak (29.3 %) performance in CSEE 2014 to average (44.4%) performance in CSEE 2015. However, a decline in performance was observed in the following topics in CSEE 2015 Map Reading and Interpretation from average (40.3%) to weak (10.9%), and Elementary Survey and Map Making from average (42.5) to weak (12.8%) and Photograph Reading and Interpretations from good (71.6%) to average (37.4%). The comparison of candidates’ performance for 2014 and 2015 in each topic is summarized in the appendix.
48
4.0 CONCLUSION The statistical data analysis shows that the candidates’ overall performance in Geography paper for the Certificate of Secondary Education Examination (CSEE) in 2015 was far better compared to 2014. A total of 383,090 candidates sat for the CSEE 2015 in Geography examination, out of which 186,550 (48.7 %) candidates passed. The performance in 2015 has increased by 10.7 % compared to 2014 performance whereby a total of 239,523 candidates sat for the examination of which 90,938 (37.97%) of candidates passed. The analysis shows that the candidates’ good performance may be attributed to their ability to identify the demand of the question, sufficient knowledge on the subject matter, proficiency in English Language as well as computation and drawing skills. However, the candidates with weak performance revealed lack of some of these factors.
5.0 RECOMMENDATIONS Based on the observations made through the analyses in this report, in order to improve performance of the prospective candidates in this subject the following should be recommended:
(a) The students should be encouraged to use English Language so as to improve their language skills. This can be done through various ways including the practice of speaking English inside and outside the classrooms, during their group discussions as well as the introduction of essay writing competitions in schools.
(b) Practical activities should be carried out in these topics; Introduction to Research, Elementary Survey and Map Making, Introduction to Statistics and Map Reading and Interpretation so as to improve students’ skills on drawings, measurements, calculating, observation and recording.
(c) The teacher should guide students to go through all the topics across the Geography syllabus to make a thorough revision. This is to ensure that they have enough knowledge and skills that are needed in answering the examination questions.

49
(d) The teachers should employ participatory teaching and learning techniques which nurture active students’ interest and impart diverse skills in the learning of Geography subject.
(e) The school libraries should be equipped with Geography subject resources such as books, internet, online studies, journals and magazine. This may facilitate the students’ extensive reading and self -study to equip them with reliable knowledge in geography contents.
50
Appendix Summary of comparison of Candidates’ Performance in each topic for 2014 and 2015
S/N
TO
PIC
2014 2015
Num
ber
of
ques
tions
Perc
enta
ge o
f ca
ndid
ates
scor
ed
30 m
arks
and
ab
ove
Rem
arks
Num
ber
of
ques
tions
Perc
enta
ge o
f ca
ndid
ates
scor
ed
30 m
arks
and
ab
ove
Rem
arks
1 Water management for economic development
- - - 1 74.4 Good
2 Settlements 1 83.4 Good 1 70.7 Good 3 soil 1 57 Good 4 Agriculture 1 53.2 Good 1 49.1 Good 5 Population and
development - - - 1 42.9 Average
6 Matching Items from Various topic 1 29.3 Weak 1 44.4 Average
7 Application of statistics
1 44.7 Average 1 37.4 Average
8 Photograph Reading and Interpretation
1 71.6 Good 1 35.5 Average
9 Structure of the earth - - - 1 26.2 Weak
10 Elementary Survey And Map Making 1 42.7 Average 1 12.8 Weak
11 Introduction to Research 1 2.7 Weak 1 12.3 Weak
10 Map reading and Interpretation
1 40.3 Average 1 10.9 Weak
13 Environmental issues and management
1 82.3 Good - - -
14 Sustainable forestry 1 70.6 Good - - - 15 Forces that Affect the
earth’s crust 2 39.6 Average - - -
16 Climate and Natural Regions 2 8.4 Weak - - -