contentsfrontier-reit.co.jp/site/file/tmp-ynxf2.pdf · mitsui fudosan frontier reit management inc....
TRANSCRIPT


1
Contents
1. Overview of FRIOverview of FRI ・・・・ 3Management strategy ・・・・ 4Portfolio map ・・・・ 5Portfolio asset categories ・・・・ 6Track record since listing ・・・・ 7Five-year summary ・・・・ 8
2. Financial results and forecastsSummary ・・・・ 11Steady distribution growth ・・・・ 1228th period results ・・・・ 1329th period forecast ・・・・ 14
3. Management highlightsManagement highlights ・・・・ 16FRI and the retail market ・・・・ 20Sound balance sheet ・・・・ 21Internal growth—financial ・・・・ 22Sustainability ・・・・ 23
4. Portfolio overviewPortfolio summary ・・・・ 27Rent revision and lease maturity schedules ・・・・ 29FRI’s portfolio in graphs ・・・・ 31
5. Appendix
All content in this document is provided solely forinformational purposes and is not intended to serve asan inducement or solicitation to trade in any productoffered by FRI. Investment decisions are made at theinvestors’ discretion and risk. FRI disclaims anyresponsibility or liability for the consequences ofinvesting in FRI.
Investment units issued by FRI are subject to pricefluctuations due to various factors, including: (1)volatility in the J-REIT market, interest rates and thereal estate market; (2) fluctuations in rental revenuesfrom properties; and (3) the occurrence of unexpectedlosses due to natural disasters. Accordingly, investmentin FRI entails the risk of incurring a loss. For moredetails, please also refer to a section titled “InvestmentRisk” presented in the Securities Registration Statement(Prospectus) and the Securities Report issued by FRI.
Information provided in this document contains suchforward-looking statements as business forecasts, whichshould not be construed as commitment to or guaranteeof future performance.
The information provided in this document was originallypublished in Japanese language form and has beentranslated for reference purposes only. FRI guaranteesneither the completeness nor the accuracy of thisEnglish translation. Please be advised that allinformation provided herein may be subject to changewithout prior notice.
Duplication or reproduction of any content presentedherein without the prior consent of FRI or its authorizedrepresentative is strictly prohibited.Asset management company:
Mitsui Fudosan Frontier REIT Management Inc. (Financial Instruments Business Registration No. 395; issued by Director-General of the
Kanto Finance Bureau based on the Financial Instruments and Exchange Law)
Disclaimer

1. Overview of FRI

3
Overview of FRI
Area4
Mitsui Outlet Park IRUMA
Mitsui Shopping Park LaLagarden KASUKABE
Mitsui Shopping ParkLaLaport SHIN-MISATO
SAKAE GLOBE
TokyoMetropolitan Area51.2%
Chubu15.8%
Kansai13.2%
Chugoku10.9%
Kyushu/Okinawa9.0%
Key properties
Property type4
Large-scale shopping centers45.0%
Medium-scaleshopping centers26.7%
Urban retailfacilities19.6%
Land interests8.7%
1. Loan-to-value ratio = (Borrowings and bonds + Leasehold and security deposits - Unrestricted cash and deposits ) / (Balance of total assets - Unrestricted cash and deposits); same shall apply to all succeeding occurrences of LTV
2. Interest-bearing debt ratio = (Borrowings and bonds - Unrestricted cash and deposits) / (Balance of total assets -Unrestricted cash and deposits); same shall apply to all succeeding occurrences of interest-bearing debt ratio
3. The distribution forecast for the 29th period given here is as announced in “Summary of Financial Results for the 28th Fiscal Period,” published August 15, 2018.
4. Calculated based on the annualized fixed rent (excluding common area maintenance charges) of lease contracts valid as of June 30, 2018. Variable rent is not taken into account.
Unrestricted cash and deposits = Cash and cash equivalents at the end of the period - distributions for the periodThe same applies hereinafter.
Corporate profile
Name Frontier Real Estate Investment Corporation ("FRI")
TSE Listing August 9, 2004 Securities code: 8964
Sponsor Mitsui Fudosan Co., Ltd.Changed from Japan Tobacco Inc. as of March 2008
Investment target Retail facilities
Fiscal period ends June 30, December 31
Investment units issued 496,000
Asset management company Mitsui Fudosan Frontier REIT Management Inc.(Wholly owned subsidiary of Mitsui Fudosan Co., Ltd.)
Portfolio
Asset size (based on acquisition prices)
¥304.7 billion; 35 properties
Geographic distribution Urban areas: 51.2%; Other: 48.8%
Occupancy rate 100%
Total leasable floor space1 1,442,351 m2
Financial indicators
LTV1 44.1%
Interest-bearing debt ratio2
32.2%
Ratings JCR: AA Stable; R&I: AA- Stable; S&P: A+ Stable
Distributions
28th period (June 2018) ¥10,194 per unit
29th period (Dec. 2018) forecast3
¥10,180 per unit
38.6%
6.4%8.5%
11.2%
7.0% Regional SCsOutlet mallsNeighborhood SCsGMSsSupermarkets/other
Inner ring

4
Management strategy
Turning fluctuating real estate revenue into steady distribution growth over the long term
External growth
Fully utilize the sponsor’s pipeline to continue acquiring excellent properties Selectively invest in non-sponsor properties utilizing the Asset Management Company’s unique network,
keeping a close eye on risk Carefully select properties for investment considering the certainty of cash flows and growth potential of the
surrounding retail zone Make acquisitions with an eye to maintaining the whole portfolio’s ratio of asset value to yield after
depreciation
Internal growth
Secure a foundation for stable earnings based on long-term fixed rent Adjust to changes in the environments surrounding properties, maintaining and enhancing competitiveness
through such measures as additional investment and tenant replacement Consider replacing properties that pose future uncertainties in order to further enhance portfolio quality
Financial strategy
Maintain sound financial standing through LTV control Execute capital procurement flexibly and strategically based on careful monitoring of the procurement
environment Level out repayment periods and amounts to increase financial stability

5
34
6
18
17
23
3
9
32
29
2
5
24
Ikebukuro Square
Desigual Harajuku
GINZA GLASSE
AEON STYLE Shinagawa Seaside
Kamiikedai Tokyu Store
Costco Wholesale Ware-house Iruma (land interest)
Mitsui Outlet Park IRUMA
Mitsui Shopping Park LaLagarden KASUKABE Costco Wholesale Warehouse Shin-Misato (land interest)
Mitsui Shopping Park LaLaport SHIN-MISATO Mitsui Shopping Park LaLaport SHIN-MISATO Annex
Ito-Yokado Higashi- Yamato AEON TOWN Tanashi-ShibakuboQueen’s Isetan Suginami-MomoiSummit Store Higashi-Nagasaki (land interest)
Shimura Shopping Center
Summit Store TakinogawaMomiji-Bashi
Super Viva Home Zama and Super Sanwa Zama Higashihara (land interest)Summit Store Yokohama Okano (land interest)
Kohnan Kawasaki- Odasakae Mall (land interest)
13
12
21
31
30
28
15
16
11
35
20
7
Portfolio map
Regional SC A large-scale shopping center that houses multiple specialty stores
Outlet mall A large-scale shopping center in which multiple outlet stores are concentrated
Neighborhood SC A medium-scale shopping center where the main tenants are a supermarket and specialty shops
General merchandisestore
A medium-scale shopping center where the main tenant typically stocks general merchandise and groceries
Supermarket/other A retail outlet that sells mainly food products or other facility
Urban retail facilities A store that faces onto a main street or a specialty store building in a prime urban location
Land interest Land interest in retail facilities
Don Quijote Fukuoka Tenjin
VIORO
Papillon Plaza
Frespo Tosu(land interest)
KOJIMA x BIC CAMERA Naha Store
Shinsaibashi Square
AEON MALL Ibaraki
Belltown TambaguchiEki-Mae Store
QANAT Rakuhoku
Kyushu/ Okinawa area
Chugoku area
Kansai area
Tokyo metropolitan area
SaitamaTokyo Kanagawa
25
14
19
1
4
34
35
32
JR Yamanote Line
35 properties Asset size: ¥304.7 billion (as of August 15, 2018)
26
8
10
Mitsui Shopping Park ALPARK (East Building) Home Center Kohnan Hiroshima Minami-Machi (land interest)
You Me Town Hiroshima
33
22
27
Omiya
Tachikawa
Yokohama
Large-scale SCs
Medium-scale SCs
Urban retail facilities
Land interests
Chubu area
SAKAE GLOBE
AEON MALL NAGOYADOME-MaeMitsui Shopping Park LaLaport IWATA

6
Costco Wholesale WarehouseShin-Misato (land interest)
Super Viva Home Zama andSuper Sanwa Zama
Higashihara(land interest)
Portfolio asset categories
* NOI yield is calculated by dividing NOI (property leasing operating income + depreciation) excluding extraordinary factors, by acquisition prices. Figures used in this calculation are as of June 30, 2018.
You Me Town Hiroshima
AEON MALL Ibaraki
12物件平均取得価格62億円NOI利回り:5.6%償却後利回り:3.5%
Large-scale shopping centers (regional SCs, outlet malls)
Urban retail facilities
Land interests
¥68.8 billion
¥30.5 billion
Outlet mallRegional SCs
AEON MALL NAGOYADOME-Mae
Kohnan Kawasaki-Odasakae Mall (land interest)
Frespo Tosu(land interest)
Costco WholesaleWarehouse Iruma
(land interest)Home Center Kohnan
Hiroshima Minami-Machi(land interest)
KOJIMA x BIC CAMERA Naha Store
Don QuijoteFukuoka Tenjin
VIORO Ikebukuro SquareGINZA GLASSE Shinsaibashi SquareDesigual Harajuku
AEON STYLE Shinagawa Seaside
Ito-Yokado Higashi-Yamato
Papillon Plaza Mitsui Shopping Park LaLagarden KASUKABE
QANAT Rakuhoku
Shimura Shopping Center
Queen’s IsetanSuginami-Momoi
Summit Store Takino-gawa Momiji-Bashi
AEON TOWN Tanashi-Shibakubo
Belltown TambaguchiEki-Mae Store
Kamiikedai TokyuStore
Neighborhood SCs GMSs
Urban retail facilities
Land interests
Total acquisition price: ¥130.3 billion
¥74.9 billion
Supermarkets/other
Summit Store Higashi-Nagasaki (land interest)
SAKAE GLOBE
Summit Store YokohamaOkano (land interest)
12 propertiesAverage acquisition price: ¥6.2 bn
NOI yield: 5.8%NOI yield after depreciation: 4.1%
7 propertiesAverage acquisition price: ¥9.8 bn
NOI yield: 4.4%NOI yield after depreciation: 3.6%
8 propertiesAverage acquisition price: ¥3.8 bn
NOI yield: 5.1%NOI yield after depreciation: 5.1%
8 propertiesAverage acquisition price: ¥16.2 bn
NOI yield: 5.8%NOI yield after depreciation: 4.0%
Medium-scale shopping centers
(neighborhood SCs, GMSs, supermarkets, other)
Mitsui Shopping ParkLaLaport IWATA
Mitsui Shopping Park ALPARK (East Building)
Mitsui Shopping ParkLaLaport SHIN-MISATO
Mitsui Outlet Park IRUMA
Mitsui Shopping Park LaLaport SHIN-MISATOAnnex

7
第1期
(04/12期)
第2期
(05/6期)
第3期
(05/12期)
第4期
(06/6期)
第5期
(06/12期)
第6期
(07/6期)
第7期
(07/12期)
第8期
(08/6期)
第9期
(08/12期)
第10期
(09/6期)
第11期
(09/12期)
第12期
(10/6期)
第13期
(10/12期)
第14期
(11/6期)
第15期
(11/12期)
第16期
(12/6期)
第17期
(12/12期)
第18期
(13/6期)
第19期
(13/12期)
第20期
(14/6期)
第21期
(14/12期)
第22期
(15/6期)
第23期
(15/12期)
第24期
(16/6期)
第25期
(16/12期)
第26期
(17/6期)
第27期
(17/12期)
第28期
(18/6期)
第29期
(予想)
(18/12期)
Track record since listing
Public offerings
Distribution
per unit (yen) 1Asset size
(million yen;
acquisition price basis)
LTV
スポンサーからの取得
スポンサー外からの取得
50.0%
40.0%
¥9,000
March 2008Third-party allotment
July 2008First
2,7391,231 1,596 1,743 1,780 2,068 2,212 2,458 2,7162,3701,780 2,212 2,592 2,678 2,659 2,831648 648 669 917 967 999948 2,831 3,04732,890
March 2013Fourth
1. FRI implemented a two-for-one split of its investment units effective January 1, 2014. Distributions before the split have been divided by two and truncated to the nearest yen.2. The distribution per unit (DPU) forecast for the 29th period given here is as announced in “Summary of Financial Results for the 28th Fiscal Period,” published August 15, 2018. The same applies hereinafter.3. The LTV and asset size forecasts for the 29th period given here are as presented under “Pre-Conditions and Assumptions for Operating Forecasts for the 29th Fiscal Period (July 1, 2018 to December 31, 2018)”
in “Summary of Financial Results for the 28th Fiscal Period.”
*2
2,890 2,934 3,047
Mitsui FudosanJapan Tobacco
July 2010Second
July 2012Third
Reached asset size of¥200.0 billion
Reached asset size of¥300.0 billion
¥10,000
14.3%8.3%9.3%
7,2186,0455,622
4,771
Approx. 44%3
10,1802
August 2004Listing
Property sales Property sale
1st 2nd 3rd 4th 5th 6th 7th 8th 9th 10th 11th 12th 13th 14th 15th 16th 17th 18th 19th 20th 21st 22nd 23rd 24th 25th 26th 27th 28th 29thDec.‘04 Jun.’05 Dec.‘05 Jun.’06 Dec.’06 Jun.’07 Dec.’07 Jun.’08 Dec.‘08 Jun.’09 Dec.’09 Jun.’10 Dec.’10 Jun.’11 Dec.’11 Jun.’12 Dec.’12 Jun.‘13 Dec.’13 Jun. ’14 Dec.‘14 Jun.‘15 Dec.’15 Jun.’16 Dec. ‘16 Jun.’17 Dec. ’17 Jun.’18 Dec.’18
Acquisitions from the sponsor
Acquisitions not from the sponsor
34.0%35.2% 35.9%
37.5% 41.0% 41.0% 45.5%46.2% 45.7%43.6%
46.8%46.3%
49.6%42.5% 41.0%
37.6%39.2%
38.0%41.7% 41.2%
39.1%42.3% 41.6% 42.2%
44.1%
8,648 8,846 8,922 8,980
9,220 9,274 9,368
9,294 9,097 9,239 9,299
9,991
9,191 9,173
9,405
10,211
9,707 9,360
9,695 9,694 9,903 10,022 10,146 10,194

8
9,173 10,194
7,000
8,000
9,000
10,000
11,000
第18期
(13/6月)
第28期
(18/6月)
Five-year summary
Property types DPU
NAV per unit
363,397
432,681
250,000
300,000
350,000
400,000
450,000
第18期
(13/6月)
第28期
(18/6月)
Distribution growth
+11.1%
NAV growth
+19.1%
0
0
18th 28th
(June ‘13) (June ’18)
1. The percentage of property types are calculated based on the annualized fixed rent (excluding common area maintenance charges) of lease contracts valid as of the end of each periods. Variable rent is not taken into account.
2. The sum of the acquisition prices of properties sold.
+¥60.6 bn acquiredLarge-scale
SCs¥23.7 bn
Urban retail facilities¥17.9 bn
Medium-scale SCs¥1.8 bn
Land interests¥17.1 bn
-¥27.6 bn sold2
Urban retail facilities¥7.3 bn
GMSs¥20.3 bn
¥271.6billion
¥304.7billion
Asset size
(yen)
(yen)
■Large-scale SCs ■Medium-scale SCs ■GMSs■Urban retail facilities ■Land interests
18th 28th
(June ‘13) (June ’18)
18th 28th
(June ‘13) (June ’18)
3.8%
18.6%
GMSs20.8%
37.3%
40.3%
8.7%
19.6%
GMSs11.2%
26.7%
45.0%


2. Financial results and forecasts

11
Summary
1
Conservative financial operations
3 Maintained conservative financial operations LTV 28th period end: 44.1% (including leasehold and security deposits) Interest-bearing debt ratio 28th period end: 32.2% (excluding leasehold and security deposits)
Simultaneously issued two series of bonds with maturities of over ten years,a first for a J-REIT
3rd Investment Corporation BondsAmount: ¥1.0 billionPeriod: 12 yearsAnnual interest rate: 0.68%
29th
28th
4th Investment Corporation Bonds Amount: ¥1.0 billionPeriod: 20 yearsAnnual interest rate: 1.00%
Paid a distribution per unit (DPU) of over ¥10,000 for a third consecutive period
28th 29th27th
28th
¥10,194 ¥10,180 (forecast)¥10,146(up ¥48 from the 27th period; ¥114 above forecast)
Steady distribution growth
Reached ¥300 billion in asset size through new property acquisitions Acquired SAKAE GLOBE (60% quasi co-ownership) from the sponsor in March 2018
(Nagoya City, Aichi) Acquisition price: ¥9,300 millionAppraisal value: ¥9,300 million
Acquired Summit Store Higashi-Nagasaki (land interest) from a third party in June 2018 (Toshima City, Tokyo)
Acquisition price: ¥2,022 millionAppraisal value: ¥2,330 million
Renovations undertaken by master lessees Mitsui Shopping Park LaLaport SHIN-MISATO (Begun March 2018) Mitsui Outlet Park IRUMA (Begun May 2018)
3Initiatives to strengthen the portfolio
2 SAKAE GLOBE(60% quasi co-ownership)
Summit Store Higashi-Nagasaki (land interest)
28th
28th

12
9,6949,903 10,022
10,14610,194 10,180
8,500
9,000
9,500
10,000
10,500
11,000
404,873 409,596
415,987 422,315
432,681
350,000
370,000
390,000
410,000
430,000
450,000
Steady distribution growth
(%)
(億円)
10,000
0
0
24th 25th 26th 27th 28th
June ‘16 Dec. ‘16 June ‘17 Dec. ‘17 June ‘18
39.1
42.3 41.6 42.2 44.1
(10.0)
0.0
10.0
20.0
30.0
40.0
50.0
1,000
1,500
2,000
2,500
3,000
3,500
4,000
3,000
0
273.9
289.0 289.0 293.4304.7
40.0
50.0LTV
Asset size
(yen)
24th 25th 26th 27th 28th 29th forecast
June ‘16 Dec. ‘16 June ‘17 Dec. ‘17 June ‘18 Dec. ‘18
Distribution per unit LTV and asset size (acquisition price basis)
NAV per unit
24th 25th 26th 27th 28th
June ‘16 Dec. ‘16 June ‘17 Dec. ‘17 June ‘18
(yen)
300
250
200
150
0
(billion yen)

13
28th period results
27th period(July 1, 2017 to
December 31, 2017)
28th period(January 1, 2018 to
June 30, 2018)Change
Operating revenue 10,135 10,240 +104 +1.0%
Expenses related to rent business(excluding depreciation)
2,090 2,106 +15
NOI 8,044 8,133 +89Depreciation 2,072 2,078 +6
Property leasing operating income
5,971 6,055 +83
Selling, general and administrative expenses*
640 643 +2
Operating income 5,331 5,411 +80 +1.5%
Non-operating income 1 6 +5
Non-operating expenses 299 286 -12
Ordinary income 5,033 5,131 +98 +1.9%
Extraordinary losses — 74 +74
Net income 5,032 5,056 +23 +0.5%
Distribution per unit (yen) 10,146 10,194 +48 +0.5%
Investment units issued and outstanding (units) 496,000 496,000 ―
LTV at period-end 42.2% 44.1% +1.9 pt
Interest-bearing debt ratio 29.8% 32.2% +2.4 pt
Number of properties 33 35 +2
(million yen) (million yen)
Note 1
Note 2
Note 2
Note 2
Major factors in changes
Note 1. Operating revenueOperation of 28th period acquisitions (SAKAE
GLOBE and Summit Store Higashi-Nagasaki) and full-period operation of 27th period acquisition (Super Viva Home Zama andSuper Sanwa Zama Higashihara)
+122
Sales-linked rent +14Income from utility expenses -24 Tenant change at Don Quijote Fukuoka Tenjin
(previously TSUTAYA BOOK STORE TENJIN)-20
Tenant change at VIORO (including lump-sumpayment)
+12
Note 2. Operating expensesProperty management expenses +20Utility expenses, etc. -27 Repairs and maintenance +1Property tax, city planning tax, etc. +20Depreciation and amortization +6Selling, general and administrative expenses +2
Note 3. Extraordinary lossesProvision for loss on disaster due to Northern
Osaka Earthquake+74
* Selling, general and administrative expenses = Asset custody fee + Administrative service fees + Directors’ compensation + Other operating expenses
Note 3

14
29th period forecast
28th period results(January 1, 2018 to
June 30, 2018)
29th period forecast*
(July 1, 2018 toDecember 31, 2018)
Change
Operating revenue 10,240 10,359 +119 +1.2%
Operating income 5,411 5,337 -74 -1.4%
Ordinary income 5,131 5,051 -80 -1.6%
Net income 5,056 5,050 -5 -0.1%
Distribution per unit (yen) 10,194 10,180 -14 -0.1%
(単位:百万円)
28th period results 29th period forecast*Investment units issued and outstanding (units) 496,000 496,000
LTV at period-end 44.1% Approx. 44%
Number of properties 35 35
(million yen) (million yen)Property tax, city planning tax, etc. 1,063 1,062
Repairs and maintenance 319 435
Depreciation and amortization 2,078 2,081
Non-operating expenses 286 286
Capital expenditures 47 309
* Forward-looking figures given here are as announced in “Summary of Financial Results for the 28th Fiscal Period,” published August 15, 2018.
Note 1
Note 2
Major factors in changes
Note 1. Operating revenueFull-period operation of 28th period acquisitions
(SAKAE GLOBE and Summit Store Higashi-Nagasaki)
+125
Sales-linked rent -15Income from utility expenses +25Land rent revisions +4Tenant change at VIORO (absence of lump-sumpayment)
-20
Note 2. Operating income(excluding difference in operating revenue)
Utility expenses -18Repairs and maintenance -116Depreciation and amortization -2
(million yen) (million yen)
Assumptions underlying operating results forecasts

3. Management highlights

16
Renovated by master lessee Mitsui Fudosan
Among the largest outlet malls in the Tokyo metropolitan area, with a large retail zone (237,000 people within a 5 km radius, 1,154,000 within 10 km, and 2,737,000 within 15 km)
Generates sales-linked rent every period
Renovated by master lessee Mitsui Fudosan
ららぽーと新三郷(リージョナルSC) 三井アウトレットパーク入間(アウトレットモール)リニューアル リニューアル
Location 3 Shin-Misato LaLaCity, Misato City, SaitamaOpened September 2009Stores Approx. 180Retail zone population* 3 km radius: 105,000; 5 km radius: 319,000Leased floor space 142,315.54 m2
FRI properties Logistics zoneCommercial zone Residential zone
Shin-Misato Sta.
Costco Shin-Misato
IKEAAnnex
JR Musashino LineLaLaCity
LaLaportSHIN-MISATO
Train-themed food sample cart by the kids’ space
(part of renovated common areas)
*Calculated using Basic Resident Register data as of April 1, 2016
Events to celebrate the property’s
10th anniversary
Remodeled break room, part of efforts to improve
employee satisfaction
LaLaport SHIN-MISATO (regional SC) Mitsui Outlet Park IRUMA (outlet mall)Renovation Renovation
2-stage openingin March
and April 2018
Openings fromMay to July 2018
Management highlights—Large-scale shopping centers
16 new stores and 15 remodeled stores opened, including well-known Japanese and overseas manufacturers, brands and
curated shops, to mark the facility’s 10th anniversary in April 2018
NEW!
etc.
23 new stores and 11 remodeled stores opened, all aimed at being
the No. 1 entertainment mall in the region,surpassing customer expectations
etc.
NEW!
Iruma StationInariyama KoenStation
Iruma City HallSeibuIkebukuroLine
Musashi Fujisawa Station
To Chichibu
Bushi Station
To OmeOtsumaWomen’sUniv.
Iruma IC
Mitsui Outlet Park IRUMA
Costco Wholesale WarehouseIruma (land interest)
Ken-OExpressway

17
We have been examining internal growth opportunities since the master lessee (H2O Asset Management) acquired an adjacent lot in August 2016
Reached a basic agreement with the master lessee on additional construction in May 2018→FRI to invest in the existing building, and moderate rent increase
expected; agreed to leave rent unchanged at January 2018 rent revision
Working with the tenant to enhance the entire facility’s competitiveness
Schedule of construction of new building
カナート洛北(ネイバーフッドSC)
2018 2019 202029th period(Jul.–Dec.)
30th period (Jan.–Jun.)
31st period(Jul.–Dec.)
32nd period(Jan.–Jun.)
August: Construction of new building beginsJanuary: Remodeling of existing building begins
December:Construction ends
内部成長
Concept illustration of the new building
Management highlights—Medium-scale shopping centers
Opened in 1993 to take advantage of a favorable location boasting direct access to main roads
Contract to reach maturity in April 2019
Now looking into future internal growth opportunities
Papillon Plaza (neighborhood SC)
*Calculated using Basic Resident Register data as of April 1, 2016
Yoshizuka Sta.
Internal growth
©2018 ZENRIN
Radius Population*2011–2016
growth
1 km 33,000 +15.3%
3 km 214,000 +14.7%
5 km 522,000 +11.9%
Papillon Plaza(Approx. 44,000m2)
3 min. toHakata station
QANAT Rakuhoku (neighborhood SC)Internal growth
Hakata Sta.

18
0
5,000
10,000
15,000
20,000
25,000
1980 1985 1990 1995 2000 2005 2010 2015
Features of FRI’s urban retail facilities
FRI owns stores with street level access and buildings that house specialty stores in prime urban locations with high liquidityFRI maintains a good balance of acquisitions from the sponsor
(sponsor-developed properties) and from third partiesGrowing demand from foreign tourists is positively affecting store sales
GINZA GLASSE roadside land price
Acquired using the sponsor’s pipeline
Street-level store on a corner lot on Nagoya’s Otsu-dori, the only street lined with major fashion brand stores in the Chubu region
Entire building leased by globally popular fashion brand ZARACutting-edge store features a interior and exterior with a bright and open design
SAKAE GLOBE (60% quasi co-ownership)
Source: National Tax Agency
External growth
Location 3 Sakae, Naka-ku, Nagoya City, Aichi
Acquisition price ¥9,300 million
Acquisition date March 28, 2018
Contract type Fixed-term building lease
Leased floor space 4,613.07 m2
Ikebukuro TenjinHarajukuGinzaAcquired from the sponsor Acquired from third parties
Shinsaibashi Sakae
2018
Management highlights—Urban retail facilities
(thousand yen/m2)

19
Agreed on new leasing contract for part of the property in May 2018
Costco Wholesale Japan Inc. to open a gas station
Land rent to increase 6.1% after gas station opening
Costco Wholesale Warehouse Shin-Misato (land interest)
Location 3 Shin-Misato LaLaCity, Misato City, SaitamaPeriod-end book value ¥3,854 millionScheduled opening September 2018
Acquired through the Asset ManagementCompany’s unique network
Faces a major road in a residential area, presenting unusual advantages as a roadside retail facility
Long term lease contract,providing stable revenue
Retail trading area population(2015 population census):
Summit Store Higashi-Nagasaki (land interest)
Site of gas station
External growth Internal growth
1 km
3 km
Ikebukuro Sta.
Higashi-Nagasaki Sta.
14,000
1,000
100
02050
300500
2,0003,0005,000
Location 5 Nagasaki, Toshima City, TokyoAcquisition price ¥2,022 millionAcquisition date June 8, 2018
Contract period Apr. 2013–Apr. 2033(fixed-term business-use land lease contract)
Leased floor space 3,952.10 m2
500 m
Within 500 m: 15,000; 1 km: 62,000
Management highlights—Land interests
Grid-square population analysis
Sources: The Regional Economy and Society Analyzing System(RESAS)and Grid Square Statistics of Population Census undertaken by Statistics Japan, the Ministry of Internal Affairs and Communications
LaLaport SHIN-MISATO
Costco Shin-Misato
Site of gas station
©2018 ZENRIN
Annex
Shin-Misato Sta.

20
-30%
-20%
-10%
0%
10%
20%
30%
2017
/07
2017
/08
2017
/09
2017
/10
2017
/11
2017
/12
2018
/01
2018
/02
2018
/03
2018
/04
2018
/05
2018
/06
SC FRI
5.6%4.8%
39.0%
11.0%
17.9%
6.4%3.2%
12.1%
北海道 東北 首都圏 中部 関西 中国 四国 九州・沖縄
Year-on-year comparison of monthly sales at FRI properties
FRI and the retail market
Annual retail product sales by region
1.4 2.0 3.5 3.7 4.4 0
1
2
3
4
5
6
2013 2014 2015 2016 2017 2020
Consumption by overseas tourists visiting Japan
(trillion yen)
51.2%
15.8%
13.2%
10.9%
9.0%
5.99 6.80 7.24 8.00 8.60
3.85%4.37%
4.75%5.43%
5.79%
0%
1%
2%
3%
4%
5%
6%
7%
0
3
6
9
12
2013 2014 2015 2016 2017
EC市場規模(左目盛) EC化率(右目盛)(trillion yen)
Annual retail
product sales by region
Distribution of FRI
properties*
■Hokkaido ■Tohoku ■Tokyo metropolitan area ■Chubu ■Kansai■Chugoku ■Shikoku ■Kyushu/Okinawa
BtoC e-commerce market size and e-commerce adoption rate (product sales)
* Calculated based on the annualized fixed rent (excluding common area maintenance charges) of lease contracts valid as of June 30, 2018. Variable rent is not taken into account.
Source: Data on 2017 retail sales volumes by regional Bureau of Economy, Trade and Industry, Ministry of Economy, Trade and Industry Source: Consumption Trend Survey for Foreigners Visiting Japan, Japan Tourism Agency
Government target:
¥8 trillion
E-commerce adoption rate(right axis)
E-commerce market size(left axis)
Source: Ministry of Economy, Trade and Industry FY2017 E-Commerce Market Survey Source: SC sales statistics report, Japan Council of Shopping Centers
* Calculated based on sales at properties for which comparisons with the previous year are possible.

21
LTV ratio 42.2% 44.1%
Interest-bearing debt ratio 29.8% 32.2%
Long-term debt ratio 86.3% 91.5%
27th(December 31, 2017)
28th(June 30, 2018)
Balance of borrowings and bonds ¥85,400 million ¥93,400 million
Balance of leasehold and security deposits* ¥33,105 million ¥33,027 million
Total balance of liabilities ¥118,505 million ¥126,427 million
Sound balance sheet
Unrealized gain based on appraisal value¥62.7 billion
(up ¥5.1 billion from 27th period)
NAV(billion yen)
Key financial indicators Unrealized gain based on appraisal value and NAV
* For an overview of leasehold and security deposits, please see p. 46
Cash and deposits, etc. ¥10.1 billion
Book value ofassets undermanagement¥270.7 billion
Net assets¥151.8 billion
Borrowings and bonds¥93.4 billion
Leasehold and security deposits
¥33.0 billion
Unrealized gain¥62.7 billion
¥333.4 billion(Appraisal value)
Other liabilities ¥2.6 billion
¥126.4 billion
¥432,681
70
60
50
40
30
20
10
0
(billion yen)
1st
2nd
3rd
4th
5th
6th
7th
8th
9th
10th
11th
12th
13th
14th
15th
16th
17th
18th
19th
20th
21st
22nd
23rd
24th
25th
26th
27th
28th
NAV growth +19.1%over five years
18th 19th 20th 21st 22nd 23rd 24th 25th 26th 27th 28th
250
200
150
100
50
0
Total assets: ¥280.9 billion (as of June 30, 2018)
¥214.6 billion(NAV)NAV per unit ¥432,681

22
400 385 376 381 369 358 339303 307
272 261
40,000
50,000
60,000
70,000
80,000
90,000
100,000
第18期 第19期 第20期 第21期 第22期 第23期 第24期 第25期 第26期 第27期 第28期200
250
300
350
400
450
500借入金等残高(左軸) 支払利息額(右軸)
3.58 3.70 3.64 3.703.93 4.04
4.32
4.84 4.83 4.635.03
1.08%1.09%1.07%1.05%0.98%
0.92%
0.84%0.72%
0.69% 0.62%0.52%
-0.20%
0.00%
0.20%
0.40%
0.60%
0.80%
1.00%
1.20%
2
3
4
5
6
7
8
第18期 第19期 第20期 第21期 第22期 第23期 第24期 第25期 第26期 第27期 第28期
残存年数(左軸) 調達コスト(右軸)
0
50
100
150
第29
期第
30期
第31
期第
32期
第33
期第
34期
第35
期第
36期
第37
期第
38期
第39
期第
40期
第41
期第
42期
第43
期第
44期
第45
期第
46期
第47
期第
48期
第49
期第
50期
第51
期第
52期
第53
期第
54期
第55
期第
56期
第57
期第
66期
第67
期第
68期
第69
期
Commitment line
7.06.0 5.6 6.1 7.0 6.3
5.27.5 6.8
11.6
8.05.2
7.3
0
4
8
12
第25期 第26期 第27期 第28期 第29期 第30期 第31期 第32期 第33期
1.98
0.43%
1.41
0.35%
1.23
0.21%
0.98
0.30%
1.04 0.78
0.58
0.95
0.63
0.20
0.80
1.40
2.00(%)
Internal growth—financial
(years)
(as of August 15, 2018)
第28期の長期借入分
(million yen) (million yen)
(years) (%)
Average, including leasehold and security
deposits:5.99 years
投資法人債第29期の長期借入分
Refinancing to reduce debt cost (excluding short-term loans)Average remaining loan/bond period and debt cost (at each period end)
Balance of borrowings and bonds and interest paid
短期借入金■Long-term borrowings ■Security deposits
■Investment corporation bonds ■Short-term borrowings □ Long-term funding procured in 28th □ Long-term funding procured in 29th
15
10
5
0
■Balance of borrowingsand bonds (left axis) ■Interest paid
(right axis)
Debt cost (right axis)Years remaining (left axis)Average, including
leasehold and security deposits:0.40%
Impact on DPU:+¥279
19th 20th 21st 22nd 23rd 24th 25th 26th 27th 28th
18th 19th 20th 21st 22nd 23rd 24th 25th 26th 27th 28th25th 26th 27th 28th 29th 30th 31st 32nd 33rd
Distribution of maturity dates
29th
30th
31st
32nd
33rd
34th
35th
36th
37th
38th
39th
40th
41st
42nd
43rd
44th
45th
46th
47th
48th
49th
50th
51th
52nd
53rd
54th
55th
56th
Average interest rate of newloans/bonds in each period
Average interest rate of repayments in each period
Average period ofrepaymentsin each period
Average periodof new loans/bondsin each period
(billion yen)
68th
69th
18th 19th 20th 21st 22nd 23rd 24th 25th 26th 27th 28th
23
Sustainability—Environmental initiatives
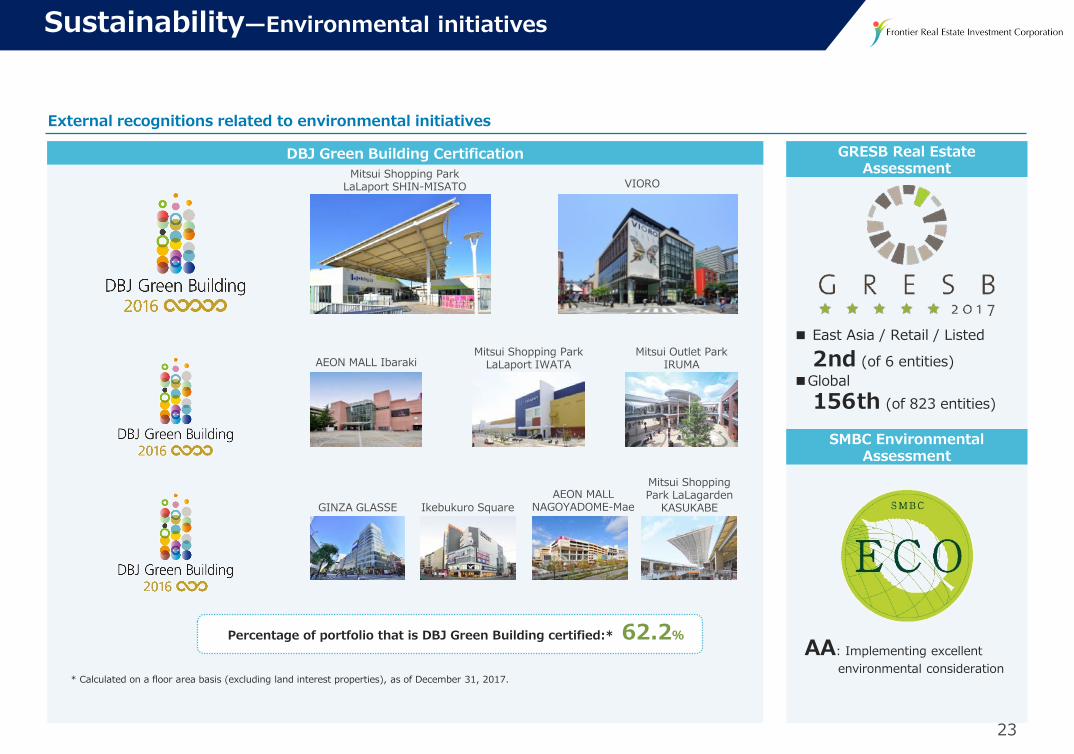
GRESB Real Estate Assessment
SMBC Environmental Assessment
External recognitions related to environmental initiatives
* Calculated on a floor area basis (excluding land interest properties), as of December 31, 2017.
AEON MALL IbarakiMitsui Shopping Park
LaLaport IWATAMitsui Outlet Park
IRUMA
AEON MALL NAGOYADOME-Mae
Mitsui Shopping Park LaLagarden
KASUKABEGINZA GLASSE Ikebukuro Square
DBJ Green Building Certification
VIOROMitsui Shopping Park
LaLaport SHIN-MISATO
■ East Asia / Retail / Listed
2nd (of 6 entities)■Global
156th (of 823 entities)
AA: Implementing excellent environmental consideration
Percentage of portfolio that is DBJ Green Building certified:* 62.2%

24
Reducing environmental burden Initiatives for employees
* Fiscal 2013 levels = 100%
Per-unit reductions from fiscal 2013 (Apr. 2013–Mar. 2014) levels
Results of events at FRI properties (May–Jun. 2018)
Per-unit consumption/
emissions% of previous
year Coverage*
Energy 23.165 kWh/㎡ 96.0% 98%
Water 0.074 m2/m2 92.0% 98%
Greenhouse gases 0.010 t-CO2/m2 91.7% 98%
Waste 1.152 kg/m2 91.4% 90%
Qualifications held by employees・Real estate broker・ARES Certified Master・Tax accountant・Securities analyst・etc.
Skill development
Feedback Evaluation
Supporting the long-term growth of Asset Management
Company employees
Initiatives for local communities
Facility Participants Clothing collected
Additional donations
LaLagarden KASUKABE 284 1,543 kg ¥15,501
LaLaport IWATA 335 1,835 kg ¥11,285
LaLaport SHIN-MISATO 242 1,038 kg ¥13,180
ALPARK 636 2,913 kg ¥34,247
Total 1,497 7,329 kg ¥74,213
→Asset Management Company employees also take part in running the project.
70%
80%
90%
100%
110%
FY2013 FY2014 FY2015 FY2016 FY2017
Energy Water Greenhouse gases Waste
Sustainability—Environmental and Social Initiatives
* Floor area basis, as of December 31, 2017, excluding land interest properties and properties for which data is unavailable.
Fiscal 2017 per-unit consumption/emissions and data coverage
Energy Greenhouse gasesWater3.8% 5.8%5.4% 6.8%Waste
Fiscal 2013–fiscal 2017 average annual reductions
Certified silver under Health and Productivity Management Organization Recognition Program*
(June 2018)認定 健銀第 312 号
* Certified by the Tokyo Association, National Federation of Health Insurance Societies

25
Investment Corporation/Asset Management Company Framework
Board ofDirectors:Consideration, approval
ComplianceCommittee:Consideration,approval
ManagementCommittee:Consideration,approval
ComplianceDivision GeneralManager:Screening
Sustainability—Governance Initiatives
Asset acquisition/disposition decision-making process
Relevantdivisions:Selection,proposal
Corporate Governance
Board of Directors:Deliberation,approval
ManagementCommittee:Screening, approval
Compliance DivisionGeneral Manager:Screening
Decision-making process for establishing and changing management guidelines and asset management plans
Proposal fromrelevant divisions
Investment management decision-making processes
Compliance Committee
Committee chair: CEO & Representative DirectorOther members: Two external expert members
Compliance Division General Manager
Ensuring appropriate asset management
Protects unitholders
Approval from FRI’s Board of Directors(for transactions
involving related parties)
General Meetingof Unitholders
Board of Directors
Executive DirectorTakao Iwadou
Supervisory DirectorsTakaaki OchiaiToshio Suzuki
Accounting Auditor
Ernst & Young ShinNihon
Investment Corporation
Board of Directors
CEO and Representative
Director
ManagementCommittee
Finance Division
CorporateAuditor
ComplianceCommittee
ComplianceDivision
InvestmentDivision
Planning andAdministration
Division
Asset Management CompanyMitsui Fudosan Frontier REIT Management Inc.
AssetManagementAgreement
General Meeting of
Shareholders

4. Portfolio overview

27
Portfolio summary
No. Property name Acquisition date Seller1 Acquisition
price Book value Appraisal value
Total leasablefloor space2
Occupancy rate2
Age3
(years) PML4
1 AEON STYLE Shinagawa Seaside Aug. 2004 JT 20,100 15,035 19,100 77,547m2 100% 15.7 14%2 AEON MALL Ibaraki5 Aug. 2004 JT 18,100 14,159 23,700 151,092m2 100% 17.6 13%
3 Papillon Plaza Aug. 2004 JT 4,810 4,488 5,560 17,095m2 100% 24.6 1%
4 Kamiikedai Tokyu Store Aug. 2004 JT 1,490 1,230 1,870 6,640m2 100% 16.3 11%
5 Belltown Tambaguchi Eki-Mae Store Aug. 2005 JT 2,130 1,862 2,950 11,176m2 100% 12.9 9%6 AEON MALL NAGOYADOME-Mae Mar. 2006 JT 24,800 20,674 25,100 154,766m2 100% 12.3 13%7 Summit Store Takinogawa Momiji-Bashi Sep. 2006 JT 3,100 2,836 3,770 6,455m2 100% 11.8 12%
8 Home Center Kohnan Hiroshima Minami-Machi(land interest)6 Apr. 2007 JT 1,940 1,754 2,540 6,055m2 100% — —
9 Frespo Tosu (land interest) Nov. 2007 JT 3,178 3,256 3,130 79,447m2 100% — —10 You Me Town Hiroshima Feb. 2008 JT 23,200 19,861 21,000 122,169m2 100% 10.4 10%11 Queen’s Isetan Suginami-Momoi Jul. 2008 MF, etc. 3,560 3,355 4,190 5,212m2 100% 13.6 12%12 Mitsui Outlet Park IRUMA Jul. 2008 MF, etc. 19,900 15,957 22,800 98,714m2 100% 10.3 14%13 Costco Wholesale Warehouse Iruma (land interest) Jul. 2008 MF, etc. 2,600 2,626 2,790 24,019m2 100% — —14 Desigual Harajuku7 Oct. 2008 Non-sponsor 3,100 2,898 3,500 1,149m2 100% 19.7 14%15 Ito-Yokado Higashi-Yamato Jan. 2009 Non-sponsor 11,600 9,729 11,200 53,374m2 100% 14.6 12%16 AEON TOWN Tanashi-Shibakubo Feb. 2009 MF, etc. 3,100 2,813 3,300 8,785m2 100% 13.3 11%17 Don Quijote Fukuoka Tenjin Dec. 2009 Non-sponsor 3,700 3,307 4,390 4,532m2 100% 11.0 2%18 Mitsui Shopping Park LaLaport IWATA Jul. 2010 MF, etc. 15,200 11,273 15,400 136,136m2 100% 9.1 16%19 GINZA GLASSE Jul. 2010 MF, etc. 13,600 12,849 15,500 5,174m2 100% 10.2 11%20 Shimura Shopping Center Jan. 2011 Non-sponsor 4,430 4,184 5,790 17,126m2 100% 17.6 14%21 Mitsui Shopping Park LaLagarden KASUKABE Feb. 2011 MF, etc. 10,000 8,605 11,400 63,415m2 100% 10.7 13%22 Summit Store Yokohama Okano (land interest) Feb. 2012 Non-sponsor 5,700 5,945 6,960 14,394m2 100% — —23 VIORO Feb. 2012 Non-sponsor 10,100 9,631 11,900 5,839m2 98.2% 11.8 1%24 QANAT Rakuhoku Jul. 2012 MF, etc. 8,800 7,889 8,640 48,303m2 100% 17.6 9%25 Ikebukuro Square Feb. 2013 MF, etc. 20,400 19,240 25,000 8,863m2 100% 5.6 14%
(million yen)

28
Portfolio summary
1. “MF, etc.” represents Mitsui Fudosan and its consolidated subsidiaries as well as special purpose companies in which Mitsui Fudosan has invested. 2. For properties for which pass-through type master lease contracts are concluded, the figures are as at June 30, 2018, calculated on an end tenant basis. 3. With the exclusion of land interests, the determination of property age is calculated using the weighted average method based on acquisition price. 4. PML represents the probable maximum loss in earthquake risk analysis. The values stated for AEON MALL Ibaraki and Mitsui Outlet Park IRUMA are for the store buildings. The figure for
Desigual Harajuku includes the portion of the building that was demolished as of October 29, 2012. The figure for Shinsaibashi Square is for the north tower. The value listed under Total represents the PML value at June 30, 2018 of the entire portfolio as a whole (properties from No. 1 to No. 35), not the average value of the properties in the portfolio.
5. The acquisition price is as at the time of acquisition and includes the price of a part of land sold to Ibaraki City on October 12, 2010 (Space: 118.86 m2; book value: ¥15 million; sales price: ¥19 million)
6. The acquisition price is as at the time of acquisition and includes the price of the building on the property at the time (¥208 million). Said building was demolished as announced on December 2, 2016. The value given for book value is that after the building’s demolition.
7. The acquisition price is as at the time of acquisition and includes a portion of the site sold on July 30, 2012 (cost of sales: ¥259 million). 8. FRI acquired a 16% co-ownership stake on April 1, 2015, and an additional 50% co-ownership stake on August 10, 2016, but the total leasable floor space presented here is that for the
entire property. The acquisition price presented is the total after the additional acquisition. 9. FRI acquired a 60% quasi co-ownership stake on March 28, 2018, but the total leasable floor space presented here is that for the entire property.
No. Property name Acquisition date Seller1 Acquisition
price Book value Appraisal value
Total leasablefloor space2
Occupancy rate2
Age3
(years) PML4
26 Mitsui Shopping Park ALPARK (East Building) Feb. 2013 MF, etc. 5,400 4,827 5,550 65,603m2 100% 28.2 12%27 Kohnan Kawasaki-Odasakae Mall (land interest) Jan. 2014 Non-sponsor 7,000 7,069 9,160 23,393m2 100% — —
28 Mitsui Shopping Park LaLaport SHIN-MISATO Annex Mar. 2014 MF, etc. 3,930 3,683 3,820 6,714m2 100% 6.2 12%
29 Shinsaibashi Square Mar. 2015 MF, etc. 8,620 8,652 10,000 1,750m2 100% 3.8 7%
30 Mitsui Shopping Park LaLaport SHIN-MISATO8 Apr. 2015Aug. 2016 MF, etc. 19,840 19,366 20,300 142,315m2 100% 8.9 11%
31 Costco Wholesale Warehouse Shin-Misato (land interest) Apr. 2015 MF, etc. 3,810 3,854 4,210 30,292m2 100% — —
32 KOJIMA x BIC CAMERA Naha Store Jan. 2016 Non-sponsor 1,850 1,913 2,500 7,301m2 100% 12.3 6%
33 Super Viva Home Zama and Super Sanwa Zama Higashihara (land interest) Jul. 2017 Non-sponsor 4,320 4,385 4,580 28,926m2 100% — —
34 SAKAE GLOBE9 Mar. 2018 MF, etc. 9,300 9,354 9,540 4,613m2 100% 1.0 9%
35 Summit Store Higashi-Nagasaki (land interest) Jun. 2018 Non-sponsor 2,022 2,130 2,340 3,952m2 100% — —
Total (35 properties, as of June 30, 2018) 304,730 270,705 333,480 1,442,351m2 100% 11.8 7.64%
(million yen)

29
Property name Main tenant1 Contract type2
Sales-linked rent
Percent-age of total
annual rent3
2018 2019 2020 2021 2022 Lease maturity 28th 29th 30th 31st 32nd 33rd 34th 35th 36th 37th
1 AEON STYLE Shinagawa Seaside AEON Retail ML T 7.4% Oct-22
2 AEON MALL Ibaraki AEON Retail ML F ✓ 7.6% Apr-35
3 Papillon Plaza Royal Home Center M/P4 F/T 2.0% Apr-19
4 Kamiikedai Tokyu Store Tokyu Store ML F 0.5% Mar-22
5 Belltown Tambaguchi Eki-Mae Store Matsumoto ML F 0.9% Aug-25
6 AEON MALL NAGOYADOME-Mae AEON Retail ML F 7.8% Mar-26
7 Summit Store Takinogawa Momiji-Bashi Summit S F 1.0% Sep-26
8 Home Center Kohnan Hiroshima Minami-Machi (land interest) Kohnan Shoji S F Undis-
closed Jul-37
9 Frespo Tosu (land interest) Daiwa Lease S F 1.2% Nov-27
10 You Me Town Hiroshima Izumi ML F 7.5% Feb-28
11 Queen’s Isetan Suginami-Momoi IM Food Style ML F ✓ 1.1% Dec-24
12 Mitsui Outlet Park IRUMA Mitsui Fudosan ML F ✓ 6.4% Jul-38
13 Costco Wholesale Warehouse Iruma(land interest) Costco S F 0.8% Apr-38
14 Desigual Harajuku INTS S F ✓ 0.7% Sep-22
15 Ito-Yokado Higashi-Yamato Ito-Yokado ML T 3.8% Nov-23
16 AEON TOWN Tanashi-Shibakubo AEON Town ML T ✓ 1.2% Mar-25
17 Don Quijote Fukuoka Tenjin Don Quijote S F Undis-closed Mar-38
18 Mitsui Shopping Park LaLaport IWATA Mitsui Fudosan ML F ✓ 6.0% Jun-30
19 GINZA GLASSE5 — P F/T 3.5% —
20 Shimura Shopping Center Summit ML T 1.6% Nov-20
21 Mitsui Shopping Park LaLagardenKASUKABE Mitsui Fudosan ML T ✓ 3.7% Feb-31
22 Summit Store Yokohama Okano (land interest) Summit S F 1.6% Nov-31
23 VIORO5 — P F ✓ 4.0% —
24 QANAT Rakuhoku H2O Asset Management ML T 2.8% Nov-20
25 Ikebukuro Square Round One M F 6.4% Dec-32
Rent revision and lease maturity schedules
Revision
Maturity
Revision
MaturityRevision
Revision
Maturity
Maturity
Maturity
Maturity

30
Property name Main tenant1 Contract type2
Sales-linked rent
Percent-age of total
annual rent3
2018 2019 2020 2021 2022 Lease maturity 28th 29th 30th 31st 32nd 33rd 34th 35th 36th 37th
26 Mitsui Shopping Park ALPARK (East Building) Mitsui Fudosan ML T ✓ 2.7% Feb-33
27 Kohnan Kawasaki-Odasakae Mall (land interest) Kohnan Shoji S F 2.1% Jan-36
28 Mitsui Shopping Park LaLaport SHIN-MISATO Annex FOREVER21 P F/T ✓ 1.2% Apr-22
29 Shinsaibashi Square Burberry Japan M F Undis-closed Undisclosed
30 Mitsui Shopping Park LaLaport SHIN-MISATO Mitsui Fudosan ML T ✓ 5.9% Mar-35
31 Costco Wholesale Warehouse Shin-Misato(land interest) Costco S F Undis-
closed Undisclosed
32 KOJIMA x BIC CAMERA Naha Store Kojima S F Undis-closed May-27
33 Super Viva Home Zama and Super Sanwa Zama Higashihara (land interest)
Sumitomo Mitsui Finance and Leasing S F Undis-
closed Jul-44
34 SAKAE GLOBE Zara Japan S F ✓ Undis-closed Undisclosed
35 Summit Store Higashi-Nagasaki (land interest) Undisclosed6 S F Undis-
closed Apr-33
Rent revision and lease maturity schedules
Maturity
1. For multi-tenant properties and properties for which pass-through type master lease contracts are concluded, the end tenant that leases the largest leased floor space is shown if they lease over 30% of the total.
2. ML: Master lease contract; P: Pass-through type master lease contract (in which the amount of rent that the master lessee pays FRI is the same as the amount of rent that end tenants are contracted to pay the master lessee); S: Contract with a single tenant; M: Contract with multiple tenants; F: Fixed-term lease; T: Traditional lease
3. Figures are calculated based on the annualized fixed rent (excluding common area maintenance charges) of lease contracts valid as of June 30, 2018.4. FRI has a direct lease contract with Royal Home Center and pass-through type master lease contracts with the other end tenants.5. The main tenant and the rent revision and lease maturity schedules are not disclosed as the status of contracts with end tenants varies significantly.6. Undisclosed, as FRI has not received permission from the tenant.

31
FRI’s portfolio in graphs
Large-scale SCs45.0%
Medium-scaleSCs26.7%
Urban retailfacilities
19.6%
Land interests8.7%
Sales-linked rent1.1%
Fixed rent98.9%5 to 10 years
41.1%3 to 5 years17.1%
3 years or less24.7%
Over 10 years46.8%
5 to 10 years28.2%
5 years or less25.0%
Over 10 years90.3%
5 to 10 years7.0%
5 years or less2.8%
AEON Group24.4%
Mitsui Fudosan3
24.7%
Izumi7.5%
Summit4.1%
Other39.3%
Buildingage2
5 years or less6.5%
Over 20 years3.7%
10 to 20years68.1%
Property type
Contract term
Remainingcontract
term
Period remaininguntil rentrevision4
Contract type
Master leasecontracts
66.7%
Single-tenantcontracts14.2%
Pass-throughmaster lease contracts 10.2%
Multi-tenant contracts8.9%
Tenants
Average contract term: 19.0 years
Average remaining contract term: 10.7 years
Average building age: 11.8 years
Over 10 years17.0%
1.All figures are calculated based on the annualized fixed rent (excluding common area maintenance charges) of lease contracts valid as of June 30, 2018. Variable rent is not taken into account. The ratio of fixed rent and sales-linked rent is that of the 28th fiscal period.
2.Based on acquisition price, excluding properties operated as land interests. 3.Excluding tenants under pass-through master lease contracts. 4.Balance of time remaining until the next rent revision date or contract maturity date, whichever is earlier.
Ratio of fixed rent and sales-linked rent
5 to 10years21.7%
Neighborhood SCs
Regional SCs GMSsOutlet malls Supermarkets/other
Inner ring
38.6%
6.4%8.5%
11.2%
7.0%

5. Appendix

33
27th period(July 1, 2017 to December
31, 2017)
28th period(January 1, 2018 to
June 30, 2018)Change Major factors in changes
Amount % of total Amount % of total Amount % changeOperating revenue1 10,135 100.0% 10,240 100.0% 104 1.0%
Rent revenue–real estate 10,110 10,185 74Rent revenue–other 24 55 30
Operating expenses 4,804 47.4% 4,828 47.2% 24 0.5%Expenses related to rent business 4,163 4,185 21
Property management expenses 488 509 20Property and other taxes 1,042 1,063 20Casualty insurance 13 13 -0Repairs and maintenance 317 319 1Depreciation 2,072 2,078 6Other expenses2 228 200 -27
Selling, general and administrative expenses 640 643 2
Asset management fee 504 497 -6Asset custody fee 13 13 -0Administrative service fees 21 23 2Directors' compensations 6 6 —Other 94 101 7
Operating income 5,331 52.6% 5,411 52.8% 80 1.5%Non-operating income 1 6 5Non-operating expenses 299 286 -12
Interest expenses 285 273 -12Other 13 13 0
Ordinary income 5,033 49.7% 5,131 50.1% 98 1.9%Extraordinary losses3 — — 74 0.7% 74Income before income taxes 5,033 49.7% 5,056 49.4% 23 0.5%Income taxes (after net adjustment) 0 0 -0Net income 5,032 49.7% 5,056 49.4% 23 0.5%Unappropriated retained earnings 5,032 49.7% 5,056 49.4% 23 0.5%
Statement of income
(million yen)
1Operation of 28th period acquisitions (SAKAE
GLOBE and Summit Store Higashi-Nagasaki) and full-period operation of 27th period acquisition (Super Viva Home Zama and Super Sanwa Zama Higashihara)
+122
Sales-linked rent +14Income from utility expenses -24 Tenant change at Don Quijote Fukuoka Tenjin
(previously TSUTAYA BOOK STORE TENJIN)-20
Tenant change at VIORO +12
2Utility expenses, etc. -27
3Provision for loss on disaster due to Northern
Osaka Earthquake+74

34
Balance sheet (assets)
27th Period(as of Dec. 31, 2017)
28th Period(as of June 30, 2018) Change Major factors in changes
Amount % of total Amount % of total Amount % change
Current assets 11,483 4.2% 10,168 3.6% -1,315 -11.5%
Cash and deposits1 7,623 5,975 -1,648
Cash and deposits in trust1 3,683 4,043 360
Other 176 148 -27Non-current assets(including deferred assets) 261,308 95.8% 270,788 96.4% 9,480 3.6%
Property, plant and equipment2 261,255 270,736 9,480
Buildings 36,987 35,982 -1,004
Structures 358 327 -31
Tools, furniture and fixtures 30 27 -3
Land 72,924 75,054 2,130
Buildings in trust 32,595 32,282 -312
Structures in trust 359 339 -20Machinery and equipment in trust 200 204 3Tools, furniture and fixtures in trust 41 37 -4
Land in trust 117,744 126,449 8,704Construction in progress in trust 12 30 18
Intangible assets 1 1 -0
Investments and other assets 51 51 -0
Total assets 272,792 100.0% 280,956 100.0% 8,164 3.0%
(million yen)
1.Borrowings +8,000Cash and deposits matching depreciation +2,078Property acquisitions during 28th period
(SAKAE GLOBE and Summit Store Higashi-Nagasaki)
-11,492
28th period capital expenditures -47Tenant leasehold and security deposits +383Partial return of security deposits -460Accrued consumption tax -21
2.Property acquisitions during 28th period
(SAKAE GLOBE and Summit Store Higashi-Nagasaki)
+11,492
28th period capital expenditures +47Depreciation and amortization -2,078
35
27th Period(as of Dec. 31, 2017)
28th Period(as of June 30, 2018) Change Major factors in changes
Amount % of total Amount % of total Amount % change
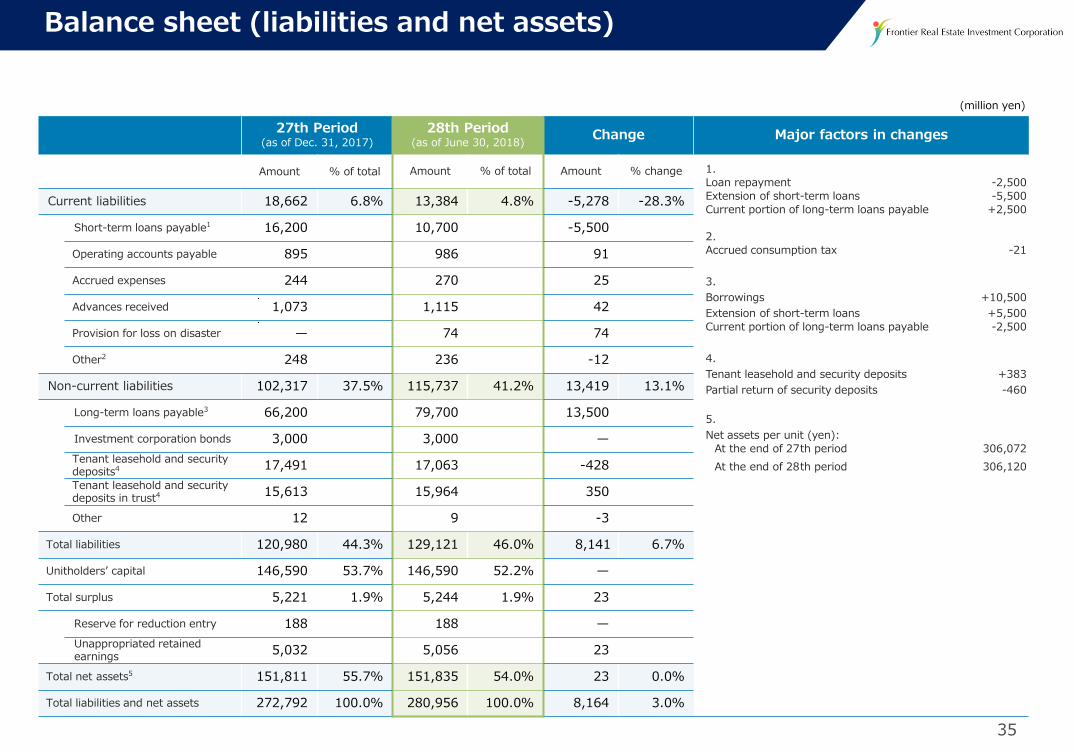
Current liabilities 18,662 6.8% 13,384 4.8% -5,278 -28.3%
Short-term loans payable1 16,200 10,700 -5,500
Operating accounts payable 895 986 91
Accrued expenses 244 270 25
Advances received 1,073 1,115 42
Provision for loss on disaster — 74 74
Other2 248 236 -12
Non-current liabilities 102,317 37.5% 115,737 41.2% 13,419 13.1%
Long-term loans payable3 66,200 79,700 13,500
Investment corporation bonds 3,000 3,000 —Tenant leasehold and security deposits4 17,491 17,063 -428Tenant leasehold and security deposits in trust4 15,613 15,964 350
Other 12 9 -3
Total liabilities 120,980 44.3% 129,121 46.0% 8,141 6.7%
Unitholders’ capital 146,590 53.7% 146,590 52.2% —
Total surplus 5,221 1.9% 5,244 1.9% 23
Reserve for reduction entry 188 188 —Unappropriated retained earnings 5,032 5,056 23
Total net assets5 151,811 55.7% 151,835 54.0% 23 0.0%
Total liabilities and net assets 272,792 100.0% 280,956 100.0% 8,164 3.0%
Balance sheet (liabilities and net assets)
(million yen)
1.Loan repayment -2,500Extension of short-term loans -5,500Current portion of long-term loans payable +2,500
2.Accrued consumption tax -21
3.Borrowings +10,500Extension of short-term loans +5,500Current portion of long-term loans payable -2,500
4.Tenant leasehold and security deposits +383Partial return of security deposits -460
5.Net assets per unit (yen):
At the end of 27th period 306,072At the end of 28th period 306,120

36
27th period(July 1, 2017 to
December 31, 2017)
28th period(January 1, 2018 to
June 30, 2018)Cash flows from operating activities
Income before income taxes 5,033 5,056
Depreciation and amortization 2,072 2,078
Other -317 295
Net cash provided by (used in) operating activities 6,788 7,430
Cash flows from investing activities
Purchase of property, plant and equipment -8 -2,137
Purchase of property, plant and equipment in trust -4,497 -9,483
Purchase of intangible assets — -0
Repayments of tenant leaseholds and security deposits -255 -455
Proceeds from tenant leasehold and security deposits 82 35
Repayments of tenant leasehold and security deposits in trust -728 -253
Proceeds from tenant leasehold and security deposits in trust 63 604
Payments of restricted bank deposits in trust -50 -25
Proceeds from reversal of restricted bank deposits in trust 216 —
Net cash provided by (used in) investment activities -5,179 -11,716
Cash flows from financing activities
Proceeds from short-term loans payable 31,500 30,000
Repayment of short-term loans payable -30,000 -28,500
Proceeds from long-term loans payable 3,500 16,000
Repayment of long-term loans payable -6,000 -9,500
Dividends paid -4,968 -5,027
Net cash provided by (used in) financing activities -5,968 2,972
Net increase (decrease) in cash and cash equivalents -4,359 -1,313
Cash and cash equivalents at beginning of period 15,194 10,834
Cash and cash equivalents at end of period 10,834 9,521
Statement of cash flows
(million yen)

37
6.3% 6.2% 6.3% 6.2% 6.1%
5.7% 5.6% 5.6% 5.5%5.4%
5.2% 5.2% 5.2% 5.0% 4.9%
2.0%
3.0%
4.0%
5.0%
6.0%
7.0%
第24期
(16/6月)
第25期
(16/12月)
第26期
(17/6月)
第27期
(17/12月)
第28期
(18/6月)
帳簿価額ベース 取得価格ベース 鑑定価額ベース
4.6% 4.5% 4.6% 4.6% 4.5%
4.2% 4.1% 4.1% 4.1% 4.0%
3.8% 3.8% 3.8% 3.7% 3.7%
2.0%
3.0%
4.0%
5.0%
6.0%
7.0%
第24期
(16/6月)
第25期
(16/12月)
第26期
(17/6月)
第27期
(17/12月)
第28期
(18/6月)
帳簿価額ベース 取得価格ベース 鑑定価額ベース
39.1%42.3% 41.6% 42.2% 44.1%
25.5%29.6% 28.8% 29.8%
32.2%
0%
10%
20%
30%
40%
50%
第24期
(16/6月)
第25期
(16/12月)
第26期
(17/6月)
第27期
(17/12月)
第28期
(18/6月)
LTV有利子負債比率
404,873 409,596 415,987 422,315 432,681
305,620 305,829 305,948 306,072 306,120
200,000
250,000
300,000
350,000
400,000
450,000
第24期
(16/6月)
第25期
(16/12月)
第26期
(17/6月)
第27期
(17/12月)
第28期
(18/6月)
一口当たりNAV一口当たりBPS
(yen)
NOI yield* Yield after depreciation*
LTV / Interest-bearing debt ratio NAV per unit / BPS per unit
Key indicators
24th(June ‘16)
25th(Dec. ’16)
26th(June ’17)
27th(Dec. ’17)
28th(June ’18)
24th(June ‘16)
25th(Dec. ’16)
26th(June ’17)
27th(Dec. ’17)
28th(June ’18)
24th(June ‘16)
25th(Dec. ’16)
26th(June ’17)
27th(Dec. ’17)
28th(June ’18)
24th(June ‘16)
25th(Dec. ’16)
26th(June ’17)
27th(Dec. ’17)
28th(June ’18)
Book valuebasis
Appraisalvalue basis
Acquisition price basis
Book value basis
Appraisalvalue basis
Acquisition price basis
NAV per unitBPS per unit
LTVInterest-bearing debt ratio
* The above figures are calculated excluding extraordinary factors.

38
Leasing income and expenses by property
Real estate rent revenue Expenses related to rent business Property leasing
operating income
NOI1NOI yield2
TotalRent
revenue –real estate
Rent revenue –
otherTotal
Property and other
taxes
Property management
expensesCasualty insurance
Repairs and maintenanceDepreciation Other
expenses(to acquisition
price)(to book value)
AEON STYLE Shinagawa Seaside
27th 742 737 4 405 87 38 1 57 214 4 336 551 5.5% 7.2%
28th 742 737 4 392 89 46 1 34 215 5 350 565 5.6% 7.5%
AEON MALL Ibaraki27th 776 771 5 267 96 16 0 5 146 1 509 656 7.2% 9.2%
28th 774 768 5 385 96 19 0 117 150 1 388 538 6.0% 7.6%
Papillon Plaza27th 222 222 0 90 32 37 0 1 17 1 132 149 6.2% 6.6%
28th 222 222 0 89 33 37 0 0 17 1 133 150 6.2% 6.7%
Kamiikedai Tokyu Store27th 53 53 — 17 5 1 0 — 10 0 35 46 6.2% 7.5%
28th 53 53 — 17 5 1 0 — 10 0 35 45 6.2% 7.5%
Belltown TambaguchiEki-Mae Store
27th 84 84 — 21 9 1 0 — 10 — 63 74 7.0% 7.9%
28th 84 84 — 21 9 1 0 — 10 — 63 73 6.9% 7.9%
AEON MALLNAGOYADOME-Mae
27th 773 773 — 258 91 15 1 3 146 — 515 661 5.3% 6.4%
28th 773 773 — 253 91 15 0 — 146 — 519 665 5.4% 6.4%
Summit StoreTakinogawa Momiji-Bashi
27th 99 99 — 20 6 1 0 — 12 — 78 90 5.9% 6.4%
28th 99 99 — 21 6 1 0 — 12 — 78 90 5.8% 6.4%
Home Center KohnanHiroshima Minami-Machi
(land interest)
27th Notdisclosed3 66 6.8% 7.6%
28th Notdisclosed3 66 6.8% 7.6%
Frespo Tosu (land interest)
27th 118 118 0 16 16 — — — — 0 101 101 6.4% 6.2%
28th 118 118 0 16 16 — — — — 0 102 102 6.4% 6.3%
You Me Town Hiroshima27th 745 745 0 247 89 14 0 — 142 — 497 640 5.5% 6.4%
28th 745 745 0 242 87 14 0 0 138 — 502 641 5.5% 6.5%
Queen’s Isetan Suginami-Momoi
27th 112 112 — 52 8 3 0 29 11 0 59 70 4.0% 4.2%
28th 112 112 — 55 8 3 0 31 11 0 56 68 3.8% 4.1%
Mitsui Outlet Park IRUMA27th 700 700 0 305 47 15 1 28 211 0 395 607 6.1% 7.5%
28th 716 716 0 286 46 15 1 12 211 0 429 641 6.4% 8.0%Costco Wholesale Warehouse Iruma
(land interest)
27th 78 78 0 4 4 — — — — — 73 73 5.7% 5.6%
28th 79 79 0 4 4 — — — — — 74 74 5.7% 5.7%
(million yen)

39
Leasing income and expenses by property
Real estate rent revenue Expenses related to rent business Property leasing
operating income
NOI1NOI yield2
TotalRent
revenue –real estate
Rent revenue –
otherTotal
Property and other
taxes
Property management
expensesCasualty insurance
Repairs and maintenanceDepreciation Other
expenses(to acquisition
price)(to book value)
Desigual Harajuku27th 66 66 — 12 7 1 0 — 3 0 53 57 3.7% 3.9%
28th 66 66 — 13 7 1 0 — 3 0 52 56 3.6% 3.9%
Ito-Yokado Higashi-Yamato
27th 380 380 — 166 41 8 0 1 115 0 213 328 5.7% 6.7%
28th 380 380 — 173 40 8 0 8 115 0 206 321 5.6% 6.6%
AEON TOWNTanashi-Shibakubo
27th 114 114 — 35 11 3 0 3 17 0 79 97 6.3% 6.9%
28th 114 114 — 34 11 3 0 2 17 0 80 98 6.3% 7.0%
Don Quijote FukuokaTenjin
27th Notdisclosed3 91 5.0% 5.5%
28th Notdisclosed3 96 5.2% 5.8%
Mitsui Shopping Park LaLaport IWATA
27th 600 600 0 370 71 13 0 19 265 0 229 495 6.5% 8.6%
28th 601 601 0 375 69 13 0 24 265 0 226 492 6.5% 8.7%
GINZA GLASSE27th 420 420 — 238 42 67 0 16 56 55 182 238 3.5% 3.7%
28th 412 411 1 227 45 65 0 8 56 51 184 241 3.5% 3.8%
Shimura Shopping Center27th 158 158 0 46 15 3 0 — 27 0 111 139 6.3% 6.6%
28th 158 158 0 47 15 3 0 0 27 0 110 138 6.2% 6.6%
Mitsui Shopping Park LaLagarden KASUKABE
27th 370 370 — 207 37 9 0 45 114 0 163 277 5.6% 6.4%
28th 370 370 — 166 36 7 0 6 114 0 204 318 6.4% 7.4%Summit Store
Yokohama Okano(land interest)
27th 154 147 7 10 10 — — — — — 144 144 5.1% 4.9%
28th 154 147 7 10 10 — — — — — 143 143 5.1% 4.8%
VIORO27th 532 526 5 327 39 116 0 20 52 97 204 257 5.1% 5.3%
28th 536 501 34 358 42 131 0 48 52 82 178 230 4.6% 4.8%
QANAT Rakuhoku27th 276 276 — 157 38 7 0 46 65 0 119 184 4.2% 4.6%
28th 276 276 — 114 37 6 0 4 65 0 161 226 5.2% 5.7%
Ikebukuro Square27th 697 697 0 269 39 63 0 0 120 44 427 548 5.4% 5.7%
28th 691 691 0 270 42 65 0 1 120 39 421 542 5.3% 5.6%
Mitsui Shopping Park ALPARK (East Building)
27th 264 264 — 152 56 5 2 1 85 — 111 197 7.3% 8.0%
28th 264 264 — 149 55 5 2 — 85 — 115 201 7.4% 8.3%
(million yen)

40
Leasing income and expenses by property
Real estate rent revenue Expenses related to rent business Property leasing
operating income
NOI1NOI yield2
TotalRent
revenue –real estate
Rent revenue –
otherTotal
Property and other
taxes
Property management
expensesCasualty insurance
Repairs and maintenanceDepreciation Other
expenses(to acquisition
price)(to book value)
Kohnan Kawasaki-Odasakae Mall (land interest)
27th 208 208 0 20 20 0 — — — 0 187 187 5.4% 5.3%
28th 208 208 0 21 21 0 — — — 0 186 186 5.3% 5.3%Mitsui Shopping Park
LaLaport SHIN-MISATO Annex
27th 145 145 0 74 7 14 0 — 34 18 70 104 5.3% 5.6%
28th 141 141 0 71 7 13 0 0 34 16 70 104 5.3% 5.7%
Shinsaibashi Square27th Not
disclosed3 174 4.0% 4.0%
28th Notdisclosed3 172 4.0% 4.0%
Mitsui Shopping Park LaLaport SHIN-MISATO
27th 586 586 — 232 60 12 1 15 142 0 353 496 5.0% 5.1%
28th 586 586 — 228 59 12 1 13 142 0 357 499 5.0% 5.2%
Costco Wholesale Warehouse Shin-Misato
(land interest)
27th Notdisclosed3 86 4.5% 4.5%
28th Notdisclosed3 86 4.5% 4.5%
KOJIMA x BIC CAMERA Naha Store
27th Notdisclosed3 70 7.6% 7.3%
28th Notdisclosed3 68 7.4% 7.2%
Super Viva Home Zama and Super Sanwa Zama
Higashihara (land interest)
27th Notdisclosed3 76 — —
28th Notdisclosed3 78 3.6% 3.6%
SAKAE GLOBE27th — — — — — — — — — — — — — —
28th Notdisclosed3 100 — —
Summit Store Higashi-Nagasaki (land interest)
27th — — — — — — — — — — — — — —
28th Notdisclosed3 4 — —
Total27th 10,135 10,110 24 4,163 1,042 488 13 317 2,072 228 5,972 8,044 5.5% 6.2%
28th 10,240 10,185 55 4,185 1,063 509 13 319 2,078 200 6,055 8,133 5.4% 6.1%
(million yen)
1. NOI = Property leasing operating income + Depreciation2. NOI yield is not shown for the properties acquired in the 27th and 28th period. Total NOI yield are calculated excluding extraordinary factors.3. Only NOI is disclosed, as FRI has not obtained the permission of the lessee to disclose other information.

41
Area Property name Acquisition date
Acquisition price
Book value at end of
28th period
28th period(June 30, 2018)
27th period(December 31, 2017) Changes
Appraisal value CR1 Appraisal
value CR1 Appraisal value CR1
Tokyo metropolitan area
AEON STYLE Shinagawa Seaside Aug. 2004 20,100 15,035 19,100 5.7% 19,100 5.7% 0 0.0%Kamiikedai Tokyu Store Aug. 2004 1,490 1,230 1,870 4.6% 1,860 4.7% +10 -0.1%Summit Store Takinogawa Momiji-Bashi Sep. 2006 3,100 2,836 3,770 4.8% 3,700 4.9% +70 -0.1%Queen’s Isetan Suginami-Momoi Jul. 2008 3,560 3,355 4,190 4.8% 4,110 4.9% +80 -0.1%Mitsui Outlet Park IRUMA Jul. 2008 19,900 15,957 22,800 5.4% 22,600 5.4% +200 0.0%Costco Wholesale Warehouse Iruma (land interest) Jul. 2008 2,600 2,626 2,790 5.4% 2,750 5.4% +40 0.0%Desigual Harajuku Oct. 2008 3,100 2,898 3,500 3.1% 3,400 3.2% +100 -0.1%Ito-Yokado Higashi-Yamato Jan. 2009 11,600 9,729 11,200 5.5% 11,100 5.5% +100 0.0%AEON TOWN Tanashi-Shibakubo Feb. 2009 3,100 2,813 3,300 5.6% 3,300 5.6% 0 0.0%GINZA GLASSE Jul. 2010 13,600 12,849 15,500 2.9% 15,100 3.0% +400 -0.1%Shimura Shopping Center Jan. 2011 4,430 4,184 5,790 4.5% 5,800 4.5% -10 0.0%Mitsui Shopping Park LaLagarden KASUKABE Feb. 2011 10,000 8,605 11,400 5.2% 11,200 5.3% +200 -0.1%Summit Store Yokohama Okano (land interest) Feb. 2012 5,700 5,945 6,960 (4.5%)4 6,800 (4.6%)4 +160 -0.1%Ikebukuro Square Feb. 2013 20,400 19,240 25,000 4.2% 24,700 4.3% +300 -0.1%Kohnan Kawasaki-Odasakae Mall (land interest) Jan. 2014 7,000 7,069 9,160 (4.4%)4 8,950 (4.5%)4 +210 -0.1%Mitsui Shopping Park LaLaport SHIN-MISATO Annex Mar. 2014 3,930 3,683 3,820 5.4% 3,980 5.2% -160 +0.2%
Mitsui Shopping Park LaLaport SHIN-MISATO2 Apr. 2015Aug. 2016 19,840 19,366 20,300 4.8% 20,200 4.8% +100 0.0%
Costco Wholesale Warehouse Shin-Misato (land interest) Apr. 2015 3,810 3,854 4,210 4.4% 3,950 4.4% +260 0.0%Super Viva Home Zama and Super Sanwa Zama Higashihara (land interest) Jul. 2017 4,320 4,385 4,580 - 4,560 — +20 —Summit Store Higashi-Nagasaki (land interest) Jun. 2018 2,022 2,130 2,340 (4.3%)4 2,3305 (4.3%)4, 5 +10 —
ChubuAEON MALL NAGOYADOME-Mae Mar. 2006 24,800 20,674 25,100 5.2% 25,200 5.2% -100 0.0%Mitsui Shopping Park LaLaport IWATA Jul. 2010 15,200 11,273 15,400 6.1% 15,300 6.1% +100 0.0%SAKAE GLOBE3 Mar. 2018 9,300 9,354 9,540 3.6% 9,3005 3.7%5 +240 -0.1%
Kansai
AEON MALL Ibaraki Aug. 2004 18,100 14,159 23,700 5.2% 23,800 5.2% -100 0.0%Belltown Tambaguchi Eki-Mae Store Aug. 2005 2,130 1,862 2,950 4.9% 2,870 5.0% +80 -0.1%QANAT Rakuhoku Jul. 2012 8,800 7,889 8,640 4.8% 8,640 4.8% 0 0.0%Shinsaibashi Square Mar. 2015 8,620 8,652 10,000 3.3% 9,500 3.5% +500 -0.2%
Chugoku
Home Center Kohnan Hiroshima Minami-Machi(land interest) Apr. 2007 1,940 1,754 2,540 5.2% 2,540 5.2% 0 0.0%You Me Town Hiroshima Feb.2008 23,200 19,861 21,000 6.3% 21,200 6.3% -200 0.0%Mitsui Shopping Park ALPARK (East Building) Feb.2013 5,400 4,827 5,550 6.5% 5,500 6.4% +50 +0.1%
Kyushu/Okinawa
Papillon Plaza Aug. 2004 4,810 4,488 5,560 4.8% 5,440 4.9% +120 -0.1%Frespo Tosu (land interest) Nov. 2007 3,178 3,256 3,130 6.5% 3,110 6.5% +20 0.0%Don Quijote Fukuoka Tenjin Dec. 2009 3,700 3,307 4,390 4.1% 4,290 4.2% +100 -0.1%VIORO Feb. 2012 10,100 9,631 11,900 3.8% 11,900 3.8% 0 0.0%KOJIMA x BIC CAMERA Naha Store Jan. 2016 1,850 1,913 2,500 5.5% 2,450 5.6% +50 -0.1%
Total 304,730 270,705 333,480 330,530 +2,950
Unrealized gain: ¥62.7 billion(up ¥5.1 billion from 27th period)
Appraisal value
(million yen)

42
Area Property name
28th period (June 30, 2018) 27th period (December 31, 2017)
Appraisal value
(million yen)
Direct reduction approach
Discounted cash flow approach
Appraisal value
(million yen)
Direct reduction approach
Discounted cash flow approach
CR1 DR6 TCR7 CR1 DR6 TCR7
Tokyo metropolitan area
AEON STYLE Shinagawa Seaside 19,100 5.7% 5.6% 6.1% 19,100 5.7% 5.6% 6.1%Kamiikedai Tokyu Store 1,870 4.6% 4.3% 4.7% 1,860 4.7% 4.4% 4.8%Summit Store Takinogawa Momiji-Bashi 3,770 4.8% 4.4% 4.9% 3,700 4.9% 4.5% 5.0%Queen’s Isetan Suginami-Momoi 4,190 4.8% 4.5% 4.9% 4,110 4.9% 4.6% 5.0%Mitsui Outlet Park IRUMA 22,800 5.4% 5.2% 5.6% 22,600 5.4% 5.2% 5.6%Costco Wholesale Warehouse Iruma (land interest) 2,790 5.4% 4.8% 5.7% 2,750 5.4% 4.8% 5.7%Desigual Harajuku 3,500 3.1% 2.9% 3.3% 3,400 3.2% 3.0% 3.4%Ito-Yokado Higashi-Yamato 11,200 5.5% 5.3% 5.7% 11,100 5.5% 5.3% 5.7%AEON TOWN Tanashi-Shibakubo 3,300 5.6% 5.3% 5.7% 3,300 5.6% 5.3% 5.7%GINZA GLASSE 15,500 2.9% 2.7% 3.1% 15,100 3.0% 2.8% 3.2%Shimura Shopping Center 5,790 4.5% 4.6% 4.7% 5,800 4.5% 4.6% 4.7%Mitsui Shopping Park LaLagarden KASUKABE 11,400 5.2% 5.0% 5.4% 11,200 5.3% 5.1% 5.5%Summit Store Yokohama Okano (land interest) 6,960 (4.5%)4 4.3% — 6,800 (4.6%)4 4.4% —Ikebukuro Square 25,000 4.2% 4.0% 4.4% 24,700 4.3% 4.1% 4.5%Kohnan Kawasaki-Odasakae Mall (land interest) 9,160 (4.4%)4 4.2% — 8,950 (4.5%)4 4.3% —Mitsui Shopping Park LaLaport SHIN-MISATO Annex 3,820 5.4% 5.2% 5.6% 3,980 5.2% 5.0% 5.4%Mitsui Shopping Park LaLaport SHIN-MISATO2 20,300 4.8% 4.5% 4.9% 20,200 4.8% 4.5% 4.9%Costco Wholesale Warehouse Shin-Misato (land interest) 4,210 4.4% 4.5% 4.3% 3,950 4.4% 4.5% 4.3%Super Viva Home Zama and Super Sanwa Zama Higashihara (land interest) 4,580 — 4.0% — 4,560 — 4.0% —Summit Store Higashi-Nagasaki (land interest) 2,340 (4.3%)4 3.8% — 2,3305 (4.3%)4, 5 3.8%5 —
ChubuAEON MALL NAGOYADOME-Mae 25,100 5.2% 4.9% 5.3% 25,200 5.2% 4.9% 5.3%Mitsui Shopping Park LaLaport IWATA 15,400 6.1% 5.9% 6.3% 15,300 6.1% 5.9% 6.3%SAKAE GLOBE3 9,540 3.6% 3.4% 3.8% 9,3005 3.7%5 3.5%5 3.9%5
Kansai
AEON MALL Ibaraki 23,700 5.2% 5.0% 5.4% 23,800 5.2% 5.0% 5.4%Belltown Tambaguchi Eki-Mae Store 2,950 4.9% 4.5% 4.9% 2,870 5.0% 4.6% 5.0%QANAT Rakuhoku 8,640 4.8% 4.5% 4.9% 8,640 4.8% 4.5% 4.9%Shinsaibashi Square 10,000 3.3% 3.1% 3.5% 9,500 3.5% 3.3% 3.7%
Chugoku
Home Center Kohnan Hiroshima Minami-Machi(land interest) 2,540 5.2% 4.8% — 2,540 5.2% 4.8% —You Me Town Hiroshima 21,000 6.3% 6.0% 6.4% 21,200 6.3% 6.0% 6.4%Mitsui Shopping Park ALPARK (East Building) 5,550 6.5% 6.3% 6.8% 5,500 6.4% 6.2% 6.7%
Kyushu/Okinawa
Papillon Plaza 5,560 4.8% 4.5% 4.9% 5,440 4.9% 4.6% 5.0%Frespo Tosu (land interest) 3,130 6.5% 7.2% — 3,110 6.5% 7.2% —Don Quijote Fukuoka Tenjin 4,390 4.1% 3.9% 4.3% 4,290 4.2% 4.0% 4.4%VIORO 11,900 3.8% 3.9% 4.0% 11,900 3.8% 3.9% 4.0%KOJIMA x BIC CAMERA Naha Store 2,500 5.5% 5.3% 5.7% 2,450 5.6% 5.4% 5.8%
Appraisal value (supplement)
1. CR = Cap rate determined by the direct reduction approach 2. The values shown are for FRI’s 66% co-ownership stake. 3. The values shown are for FRI’s 60% quasi co-ownership stake. 4. The cap rate for these properties is calculated using the residual land method.
5. The values shown for properties acquired in the 28th period are based on appraisal value determined at the time of acquisition.
6. DR = Discount rate determined by the discounted cash flow approach 7. TCR = Terminal cap rate determined by the discounted cash flow approach

43
Borrowings and bonds
Total amount
(million yen)Lender No. Amount
(million yen) Interest rate Drawdown date Maturity date Loan period (approximate) Remarks
Long-term borrowings
15,500 Sumitomo Mitsui Banking Corporation
1 2,000 0.27500% 7/2/2015 7/2/2019 4.0 years
Unsecured/Unguaranteed
2 3,000 1.16875% 2/20/2012 2/20/2020 8.0 years3 1,000 1.01125% 8/20/2012 8/20/2020 8.0 years4 1,500 0.60848% 5/19/2014 11/19/2020 6.5 years5 2,000 0.16830% 6/20/2017 6/21/2021 4.0 years6 1,000 0.13830% 8/29/2017 8/30/2021 4.0 years7 2,000 0.17700% 6/20/2018 6/20/2022 4.0 years8 3,000 1.15625% 2/1/2013 2/1/2023 10.0 years
14,000 MUFG Bank, Ltd. 9 1,500 0.99000% 2/24/2012 2/22/2019 7.0 years10 1,000 1.28625% 8/19/2011 8/19/2019 8.0 years11 2,500 0.82000% 2/1/2013 2/1/2021 8.0 years12 2,000 0.16700% 7/20/2018 7/20/2022 4.0 years13 1,500 0.54400% 3/2/2015 3/4/2024 9.0 years14 2,000 0.68500% 2/19/2015 2/19/2025 10.0 years15 1,500 0.62000% 3/2/2015 3/3/2025 10.0 years16 1,000 Note 4 0.88600% 7/2/2015 7/2/2027 12.0 years17 1,000 0.46130% 3/9/2016 3/9/2028 12.0 years
10,500 Development Bank of Japan Inc. 18 2,000 1.20875% 8/19/2013 8/21/2023 10.0 years19 1,500 1.17000% 3/17/2014 5/19/2025 11.2 years20 2,000 0.35880% 3/9/2016 3/9/2027 11.0 years 21 1,000 0.37190% 4/19/2016 7/20/2027 11.3 years 22 4,000 0.33415% 8/9/2016 2/9/2028 11.5 years
9,300 Mizuho Bank, Ltd. 23 1,500 0.21076% 7/19/2017 1/19/2022 4.5 years24 1,500 0.90500% 3/15/2013 3/15/2022 9.0 years25 1,300 Note 4 0.59750% 7/22/2014 7/19/2022 8.0 years26 1,500 0.27119% 2/28/2018 9/19/2024 6.6 years 27 2,000 0.33130% 2/28/2018 3/19/2026 8.1 years 28 1,500 0.36856% 5/21/2018 11/24/2026 8.5 years
Total amount
(million yen)Lender No. Amount
(million yen) Interest rate Drawdown date Maturity date Loan period (approximate) Remarks
Short-termborrowings
1,000 Mizuho Bank, Ltd. 1 1,000 0.08364% 7/19/2018 8/20/2018 1 month Unsecured/Unguaranteed1,000 The 77 Bank, Ltd. 2 1,000 0.07818% 6/19/2018 8/20/2018 2 months
Total short-term borrowings 2,000
Short-term borrowings
Long-term borrowings

44
Borrowings and bonds
Total amount
(million yen)Lender No. Amount
(million yen) Interest rate Drawdown date Maturity date Loan period (approximate) Remarks
Long-term borrowings
5,700 Sumitomo Mitsui Trust Bank, Limited
29 2,200 1.04125% 12/16/2011 12/14/2018 7.0 years
Unsecured/Unguaranteed
30 1,500 0.27500% 7/2/2015 7/2/2019 4.0 years31 2,000 0.30874% 11/30/2015 11/30/2021 6.0 years
5,000 Shinkin Central Bank 32 2,500 0.22500% 3/27/2018 3/27/2024 6.0 years 33 2,500 0.34721% 3/27/2018 2/19/2027 8.9 years
4,400 Mizuho Trust & Banking Co., Ltd. 34 2,500 0.69000% 2/1/2013 2/3/2020 7.0 years35 1,900 0.15380% 3/9/2016 3/11/2024 8.0 years
4,000 The Norinchukin Bank 36 2,000 0.77250% 7/18/2013 7/18/2019 6.0 years37 1,000 Note 4 0.33300% 1/7/2015 1/23/2023 8.0 years38 1,000 0.21750% 1/23/2018 1/23/2023 5.0 years
4,000 The Bank of Fukuoka, Ltd. 39 1,000 0.35630% 2/1/2018 2/19/2026 8.1 years40 1,000 0.33500% 11/21/2016 11/24/2026 10.0 years41 2,000 0.42500% 2/24/2017 2/24/2027 10.0 years
2,000 The Iyo Bank, Ltd. 42 1,000 0.09000% 11/21/2016 11/22/2021 5.0 years43 1,000 Note 4 0.61150% 4/1/2015 5/14/2025 10.1 years
2,000 The Daishi Bank, Ltd 44 1,000 Note 4 0.04805% 2/10/2016 2/10/2023 7.0 years 45 1,000 0.29785% 8/1/2017 2/19/2025 7.6 years
2,000 The Yamaguchi Bank, Ltd. 46 1,000 0.81125% 8/18/2014 8/19/2024 10.0 years47 1,000 0.56000% 6/19/2017 6/19/2029 12.0 years
1,000 The Musashino Bank, Ltd. 48 1,000 0.45333% 3/25/2014 5/27/2019 5.2 years1,000 The Gunma Bank, Ltd. 49 1,000 Note 4 0.27100% 12/16/2014 12/16/2020 6.0 years1,000 The Hiroshima Bank, Ltd. 50 1,000 Note 4 0.40250% 11/25/2014 11/25/2021 7.0 years1,000 The Hachijuni Bank, Ltd. 51 1,000 Note 4 0.25190% 11/19/2015 5/19/2022 6.5 years1,000 Resona Bank, Limited 52 1,000 Note 4 0.46490% 3/2/2015 3/4/2024 9.0 years1,000 The 77 Bank, Ltd. 53 1,000 0.41130% 12/22/2016 12/22/2026 10.0 years1,000 The Yamanashi Chuo Bank, Ltd. 54 1,000 0.40574% 6/19/2018 12/20/2027 9.5 years 1,000 Sumitomo Life Insurance Company 55 1,000 0.44130% 5/21/2018 5/22/2028 10.0 years
Total long-term borrowings 86,400
Investment corporation bondsTotal
amount (million yen)
Issue No. Amount (million yen) Interest rate Issue date Maturity date Period Remarks
Investment corporation
bonds5,000
2nd Investment corporation bonds 1 3,000 0.708% 11/25/2016 11/25/2031 15.0 years Unsecured/
Unguaranteed3rd Investment corporation bonds 2 1,000 0.680% 7/10/2018 7/10/2030 12.0 years 4th Investment corporation bonds 3 1,000 1.000% 7/10/2018 7/9/2038 20.0 years
Total investment corporation bonds 5,0001. All as of August 15, 2018.2. Repayment method is lump-sum repayment for all borrowings. 3. All interest rates on borrowings (except for those covered by note 4) are fixed rates.4. These borrowings have been swapped into fixed rates to avoid the risk of interest rate fluctuations. The rates indicated are those at the time the rate swap contracts were formed.
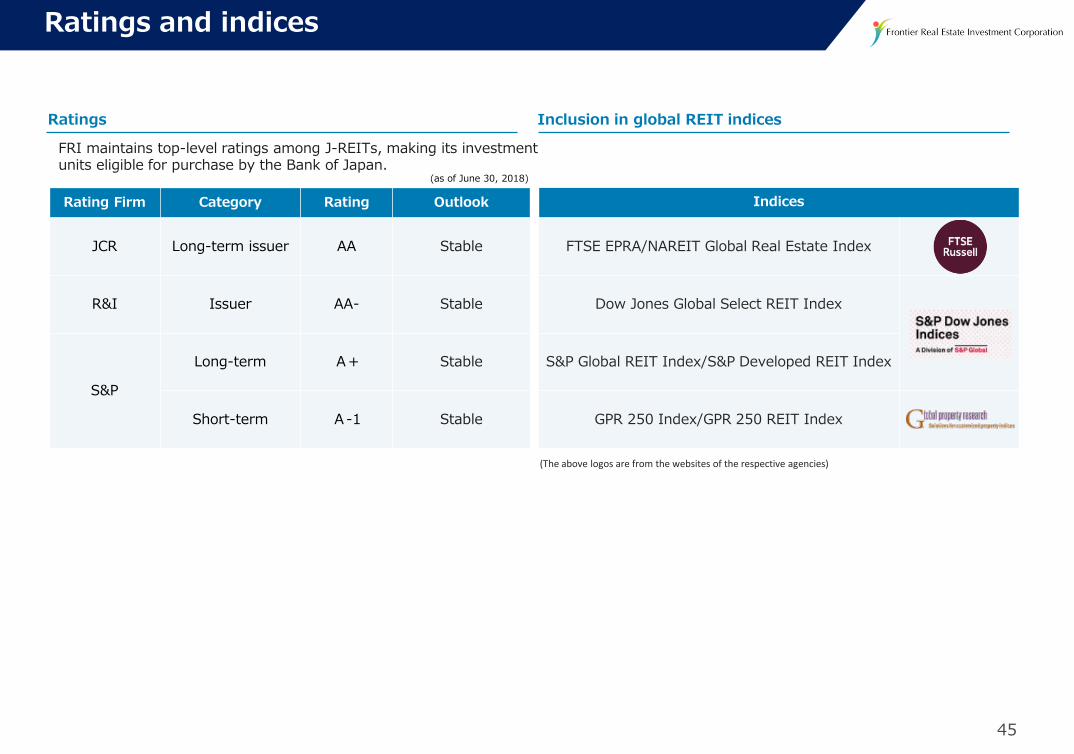
45
FRI maintains top-level ratings among J-REITs, making its investment units eligible for purchase by the Bank of Japan.
Ratings and indices
Rating Firm Category Rating Outlook
JCR Long-term issuer AA Stable
R&I Issuer AA- Stable
S&P
Long-term A+ Stable
Short-term A-1 Stable
Inclusion in global REIT indicesRatings
Indices
FTSE EPRA/NAREIT Global Real Estate Index
Dow Jones Global Select REIT Index
S&P Global REIT Index/S&P Developed REIT Index
GPR 250 Index/GPR 250 REIT Index
(as of June 30, 2018)
(The above logos are from the websites of the respective agencies)

46
0億円
10億円
20億円
2018年 2020年 2022年 2024年 2026年 2028年
Leasehold and security deposits and depreciation
(As of June 30, 2018)
Over 20 yrs2.8%
Remaining period until full repayment
Leasehold and security deposit features
Schedule of security deposit repayment
Since FRI contracts long-term leases, it can use leasehold and security deposits to procure significant long-term funding.
Since FRI holds many security deposits at zero interest, these deposits provide a source of low-cost funding.
Utilizing depreciation
Utilizing capital equivalent to each period’s depreciation enables aggressive strategic investment in addition to the repayment of security deposits.
■Property acquisition, etc. ■Large-scale
renovations ■Ordinary capital expenditure ■Return of
security deposits
Average remaining years until full repayment of leasehold andsecurity deposits: 8.7 years
Over 10years: Approx. 30%
Over 5years: Approx. 60%
(million yen)
2018 2020 2022 2024 2026 2028
2.0
1.0
0
(billion yen)
Repayment ends at You Me Town
Hiroshima
Repayment starts at You Me Town
Hiroshima Repayment ends at AEON Shinagawa Seaside
Repayment ends at NAGOYADOME-Mae
19th 20th 21st 22nd 23rd 24th 25th 26th 27th 28th 29th(forecast)
1,011 516 1,003 516 1,003 1,637 763 276 763 425 1,001
92
83
32
114
122
33
87
125
171
47
309 411
657
1,161
1,608
712 879 1,072
487
1,306
1,715
1,138
1,606
770
0
500
1,000
1,500
2,000
19th 20th 21st 22nd 23rd 24th 25th 26th 27th 28th 29th(fore-cast)
Dec.’13
June ‘14
Dec.‘14
June‘15
Dec.’15
June ’16
Dec.‘16
June’17
Dec.’17
June’18
Dec.’18
Within 5 yrs
37.3%
Over 5 yrs,up to 10 yrs
31.7%
Over 10 yrs,up to 15 yrs
6.3%
Over 15 yrs, up to 20 yrs
21.9%

47
Properties acquired from Mitsui Fudosan
SAKAE GLOBE (60%)¥ 9.3 billion
Assets acquired from the sponsor (Mitsui Fudosan)
Steady track record of property acquisitions via the sponsor’s robust pipeline
Average annual acquisitions: ¥14,095 million
Cumulative assets acquired from Mitsui Fudosan, etc.
Non-sponsor17.7%
JT33.8%
Mitsui Fudosan,etc. 48.6%
Acquisition resources
Total acquisition
price:¥304.7 billion
15 proper-
ties¥148.0
bn10 properties¥102.8 bn
10 properties¥53.8 bn
(As of August 15, 2018)
Mitsui Shopping Park LaLaport SHIN-MISATO
Annex¥3.9 billion
Queen’s Isetan Suginami-Momoi
¥3.5 billion
AEON TOWN Tanashi-Shibakubo
¥3.1 billion
GINZA GLASSE¥13.6 billion
Mitsui ShoppingPark LaLagarden
KASUKABE¥10.0 billion
QANAT Rakuhoku¥8.8 billion
Ikebukuro Square¥20.4 billion
Shinsaibashi Square¥8.6 billion
Mitsui Shopping Park LaLaport
SHIN-MISATO (50%)¥15.1 billion
Mitsui Outlet Park IRUMA
¥19.9 billion
Mitsui Shopping Park LaLaport IWATA
¥15.2 billion
Mitsui Shopping Park ALPARK (East Building)
¥5.4 billion
Mitsui Shopping Park LaLaportSHIN-MISATO (16%)
¥4.7 billion
Costco Wholesale Warehouse
Iruma (land interest)¥2.6 billion
Costco Wholesale WarehouseShinmisato (land interest)
¥3.8 billion
26,060 26,060 29,160
57,960 67,960 76,760 102,560 106,490
123,660 138,760 138,760
3,100
28,800
10,000 8,800
25,800
3,930 17,170
15,100 9,300
2008年6/12期 2009年6/12期 2010年6/12期 2011年6/12期 2012年6/12期 2013年6/12期 2014年6/12期 2015年6/12期 2016年6/12期 2017年6/12期 2018年6/12期2008 2009 2010 2011 2012 2013 2014 2015 2016 2017 2018(Jan.- June)

48
Overseas rental assets in operation12%
Mitsui Fudosan’s retail facility development
Prepared from data in Mitsui Fudosan’s “Investor Presentation August 2018”
Opening year Project name Location
2014
LaLaterrace Musashikosugi Kawasaki City, Kanagawa
Mitsui Outlet Park Sapporo Kita Hiroshima (2nd stage) Kitahiroshima City, Hokkaido
Mitsui Outlet Park Kisarazu (2nd stage) Kisarazu City, ChibaLaLaport Kashiwanoha (north building) Kashiwa City, Chiba
Akarenga TERRACE Sapporo City, Hokkaido
Iidabashi Sakura Terrace Chiyoda City, TokyoLaLaport Izumi Izumi City, Osaka
Shin Kawasaki Square Kawasaki City Kanagawa
2015
LaLaport Fujimi Fujimi City, Saitama
MITSUI OUTLET PARK KLIA SEPANG (1st stage) Selangor, Malaysia
Mitsui Outlet Park Hokuriku Oyabe Oyabe City, ToyamaMitsui Outlet Park Makuhari (3rd stage) Chiba City, ChibaLaLaport Ebina Ebina City, KanagawaLaLaport EXPOCITY Suita City, OsakaMitsui Outlet Park LINKOU New Taipei, Taiwan
2016 LaLaport SHONAN HIRATSUKA Hiratsuka City, Kanagawa
2017
SAKAE GLOBE Nagoya City, Aichi
KICHIJOJI SQUARE Musashino City, Tokyo
MITSUI OUTLET PARK JAZZ DREAM NAGASHIMA (5th stage) Kuwana City, Mie
MITSUI OUTLET PARK KLIA SEPANG (2nd stage) Selangor, Malaysia
2018
LaLaport NAGOYA minato AQULS Nagoya City, AichiMITSUI OUTLET PARK KISARAZU (3rd stage) Kisarazu City, ChibaShinsaibashi-suji 1-chome Project Osaka City, OsakaMITSUI OUTLET PARK TAICHUNG PORT Taichung, Taiwan
2019 LaLaport NUMAZU Numazu City, Shizuoka
2020 MITSUI OUTLET PARK YOKOHAMA BAYSIDE Reconstruction Plan Yokohama City, Kanagawa
2021MITSUI OUTLET PARK KLIA SEPANG (3rd stage) Selangor, Malaysia
LaLaport Kuala Lumpur Kuala Lumpur, Malaysia
TBD Retail Facility Development Project in Togocho, Aichi Aichi-gun, AichiMiyashita Park Project Shibuya City, Tokyo
Total:Approx.
¥941.2 billion
Retail facilities inoperation 13%
Planned & underdevelopment 46%
Office buildings in operation 16%
Rental housing in operation 6%
Logisticsfacilities inoperation 7%
As of March 31, 2018
Main retail facility projects under developmentBreakdown of Mitsui Fudosan’s inventory of property for sale to investors
REIT sponsored by the Mitsui Fudosan Group, etc.
Property sales to various investors
Institutional investors, corporations, etc.
Buyers commission property management
Mitsui Fudosan’s model for joint value creation with investors
Prepared from data in Mitsui Fudosan’s “Investor Presentation August 2018”
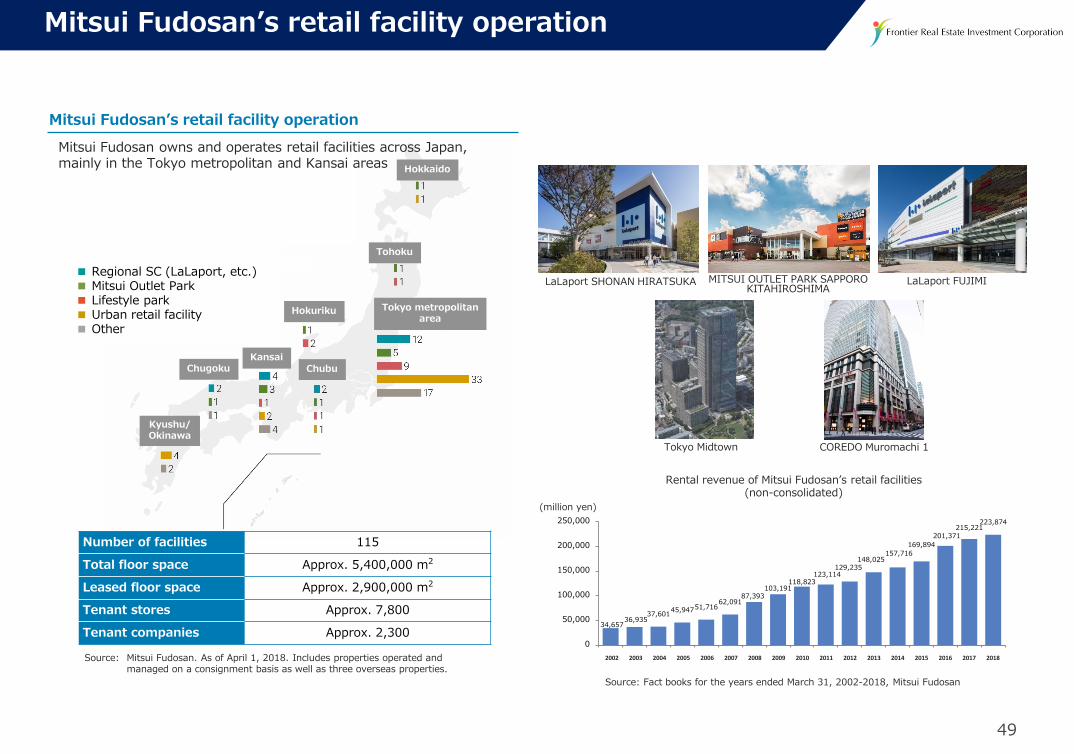
49
34,657 36,935
37,601 45,947 51,716 62,091
87,393 103,191
118,823 123,114
129,235 148,025
157,716 169,894
201,371 215,221
223,874
0
50,000
100,000
150,000
200,000
250,000
2002年3月期
2003年3月期
2004年3月期
2005年3月期
2006年3月期
2007年3月期
2008年3月期
2009年3月期
2010年3月期
2011年3月期
2012年3月期
2013年3月期
2014年3月期
2015年3月期
2016年3月期
2017年3月期
2018年3月期
Mitsui Fudosan’s retail facility operation
Number of facilities 115
Total floor space Approx. 5,400,000 m2
Leased floor space Approx. 2,900,000 m2
Tenant stores Approx. 7,800
Tenant companies Approx. 2,300
MITSUI OUTLET PARK SAPPORO KITAHIROSHIMALaLaport SHONAN HIRATSUKA LaLaport FUJIMI
COREDO Muromachi 1Tokyo Midtown
Mitsui Fudosan’s retail facility operation
Source: Mitsui Fudosan. As of April 1, 2018. Includes properties operated and managed on a consignment basis as well as three overseas properties.
Source: Fact books for the years ended March 31, 2002-2018, Mitsui Fudosan
2002 2003 2004 2005 2006 2007 2008 2009 2010 2011 2012 2013 2014 2015 2016 2017 2018
(million yen)
Rental revenue of Mitsui Fudosan’s retail facilities (non-consolidated)
Hokkaido
Tohoku
Tokyo metropolitanarea
ChubuKansai
Chugoku
Kyushu/ Okinawa
■ Regional SC (LaLaport, etc.)■ Mitsui Outlet Park■ Lifestyle park■ Urban retail facility■ Other
Hokuriku
Mitsui Fudosan owns and operates retail facilities across Japan, mainly in the Tokyo metropolitan and Kansai areas

50
Utilizing the support of the sponsor
Frontier REIT SC Management Co., Ltd.
Asset custodianshipPreventive maintenance of buildings/facilities, approval of construction by tenants, emergency response, etc.
Operation and managementManagement company supervision, reporting on operations/management
Accounting support
Retail facility operation/management
Specialized in the operation and management of properties owned by FRI
Support for external growth• Rich property pipeline
• Provides brokerage and information regarding properties held by third parties
Support for internal growth• Operation/management using the Mitsui Fudosan Group’s expertise
• Provides information on the retail market and tenant leasing
Comprehensive developer
Asset Management Company

51
0
1,000
2,000
3,000
4,000
5,000
6,000
7,000
8,000
0
100,000
200,000
300,000
400,000
500,000
600,000
700,000
出来高口数(右軸)
FRI投資口価格(左軸)
0.0%
1.0%
2.0%
3.0%
4.0%
5.0%
6.0%
7.0%
8.0%
9.0%
0%20%40%60%80%
100%120%140%160%180%200%220%240%
Investment unit price
Average trading volume 1,058 (28th period)Price at end of 28th period 445,000 (June 29, 2018)
Investment unit price (Aug. 9, 2004 – Jun. 30, 2018)
Price comparison (Aug. 9, 2004 – Jun. 30, 2018)
Source: QUICK(units)
Source: QUICK
FRI unit price (left axis) Distribution yield (right axis)TSE REIT Index (left axis)*For FRI unit price, the price upon IPO has been set at 100%*For TSE REIT Index, the closing value of August 9, 2004
has been set at 100%
* FRI implemented a two-for-one split of its investment units effective January 1, 2014. Accordingly, unit prices before December 25, 2013, have been divided by two.
(yen)
Volume (right axis)
2004/08 2005/06 2006/06 2007/06 2008/06 2009/06 2010/06 2011/06 2012/06 2013/06 2014/06 2015/06 2016/06 2017/06 2018/06
FRI unit price(left axis)
2004/08 2005/06 2006/06 2007/06 2008/06 2009/06 2010/06 2011/06 2012/06 2013/06 2014/06 2015/06 2016/06 2017/06 2018/06

52
25.5%
25.5%
26.5%
26.8%
25.5%
28.1%
26.4%
28.1%
26.3%
26.0%
45.8%
46.8%
44.3%
47.2%
46.0%
43.2%
45.0%
44.1%
42.8%
42.4%
7.3%
6.7%
7.0%
6.5%
6.9%
6.6%
6.5%
6.7%
7.4%
7.6%
8.6%
8.8%
8.8%
8.6%
8.7%
8.6%
8.5%
8.2%
8.4%
8.8%
12.7%
12.2%
13.5%
10.8%
12.9%
13.5%
13.5%
12.9%
15.1%
15.3%
0% 20% 40% 60% 80% 100%
第19期
(13/12月)
第20期
(14/6月)
第21期
(14/12月)
第22期
(15/6月)
第23期
(15/12期)
第24期
(16/6期)
第25期
(16/12期)
第26期
(17/6期)
第27期
(17/12期)
第28期
(18/6期)
金融機関 投信等 個人・その他 その他の国内法人 外国法人等
第26期(17/6期)
第25期(16/12期)
第24期(16/6期)
第23期(15/12月)
第22期(15/6月)
第21期(14/12月)
第20期(14/6月)
第19期(13/12月)
第18期(13/6月)
第27期(17/12月)
Unitholders
Name Units held Proportion
Japan Trustee Services Bank, Ltd. (Trust Account) 97,683 19.7 %
The Master Trust Bank of Japan, Ltd. (Trust Account) 71,496 14.4 %
Mitsui Fudosan Co., Ltd. 29,200 5.9 %
The Nomura Trust and Banking Co., Ltd. (Investment Trust Account) 21,128 4.3 %Trust & Custody Services Bank, Ltd. (Securities Investment Trust Account)
15,574 3.1 %DFA INTERNATIONAL REAL ESTATE. SECURITIES PORTFOLIO 6,379 1.3 %
The Yamanashi Chuo Bank, Ltd. 6,306 1.3 %
The Chugoku Bank, Ltd. 6,275 1.3 %
State Street Bank West Client - Treaty 505234 5,735 1.2 %State Street Bank-West Pension Fund Clients-Exempt 505233 5,241 1.1 %
Total 265,017 53.4%
* All as of June 30, 2018
Financial institutions*
Individuals, other
Other domestic
corporations
Overseas corporations and others
Total
28th period(June 2018) 190 8,353 210 206 8,959
27th period(Dec. 2017) 182 8,259 200 216 8,857
Change +8 +94 +10 -10 +102
Unitholders by type
Principal unitholders* (top 10)
28th June ‘18
27th Dec. ‘17
26th June ‘17
25th Dec. ‘16
24th June ’16
23rd Dec. ’15
22nd June ’15
21st Dec. ’14
20th June ’14
19th Dec. ‘13
*Includes mutual funds, etc.
■Financial institutions ■Mutual funds, etc. ■Individuals, other■Other domestic corporations ■Overseas corporations and others
Units held by unitholder type

53
Memo

54
Memo

Asset Management Company