mitsui fudosan integrated report 2020 financial …
TRANSCRIPT
INTEGRATED REPORT 2020MITSUI FUDOSAN
FINANCIAL SECTIONYear ended March 31, 2020
INTEGRATED REPORT 2020MITSUI FUDOSAN
FINANCIAL SECTIONYear ended March 31, 2020
Contents
Consolidated Financial Statements
Notes to Consolidated Financial Statements
Independent Auditor’s Report
Appendix
1. History
2. Mitsui Fudosan’s Businesses
3. Current Subsidiaries and Affiliates
4. Major Properties
5. Strategic Shareholdings
02
08
41
50
50
51
53
58
63
01Mitsui Fudosan Co., Ltd.
02 03Mitsui Fudosan Co., Ltd. Mitsui Fudosan Co., Ltd.
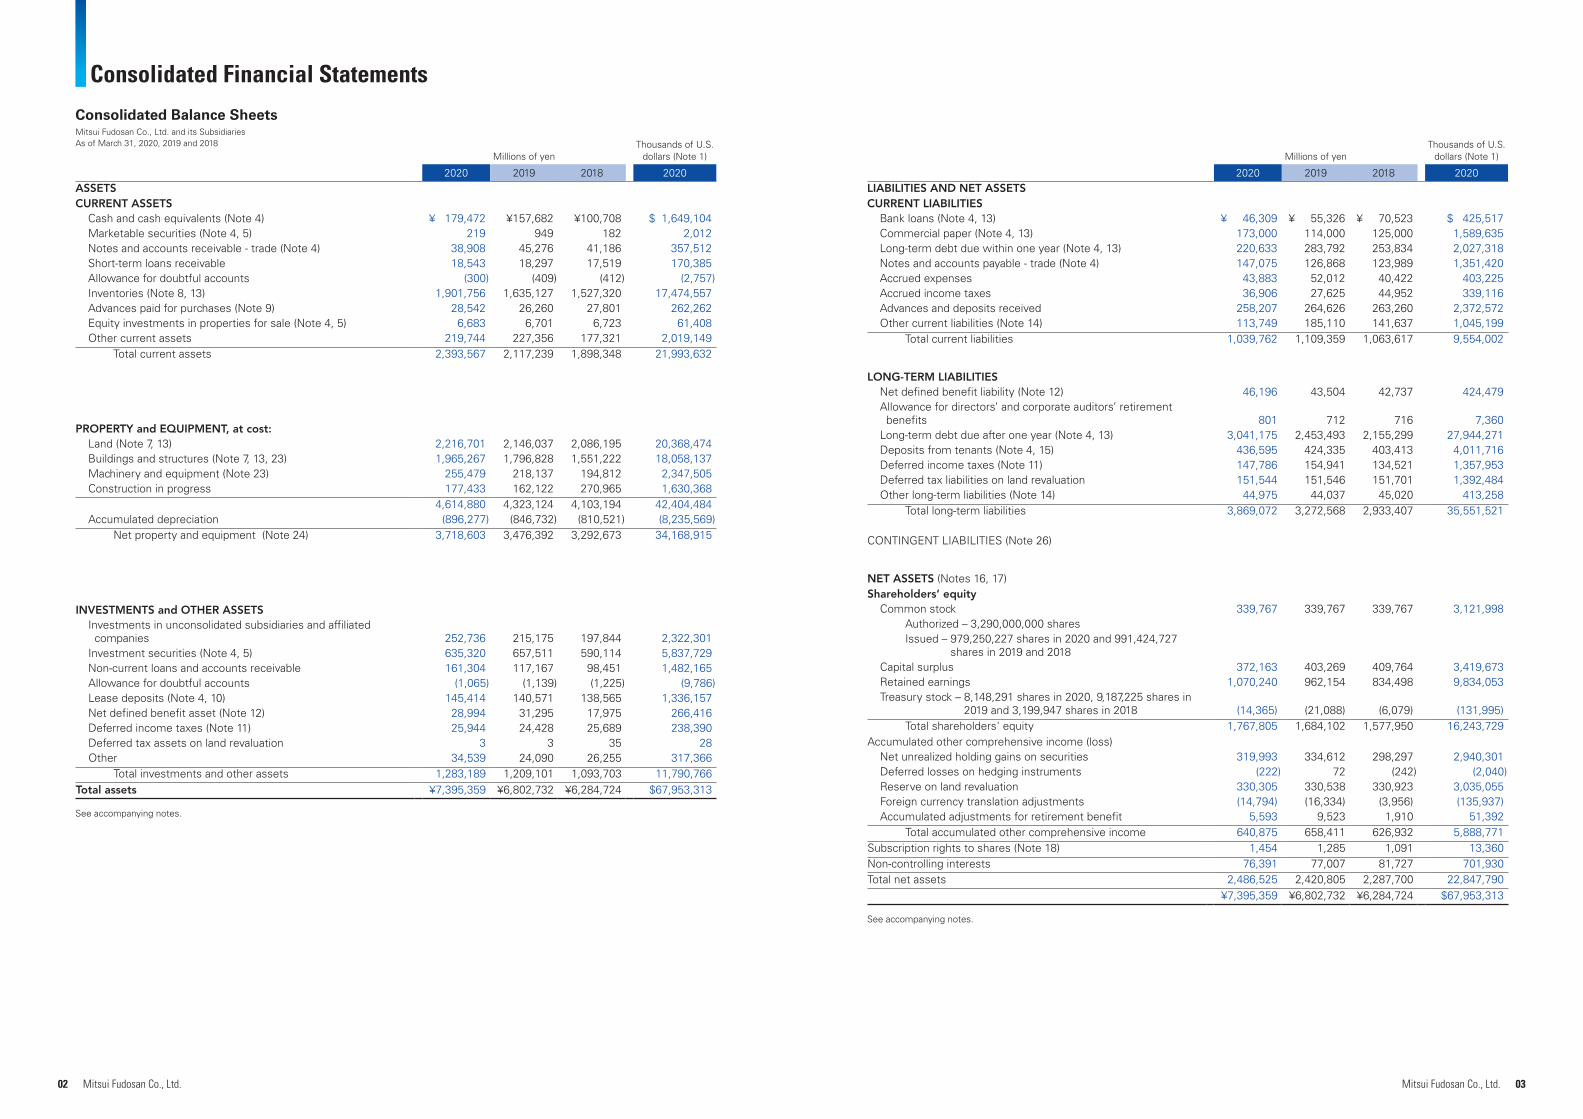
Consolidated Balance SheetsMitsui Fudosan Co., Ltd. and its Subsidiaries As of March 31, 2020, 2019 and 2018
Millions of yenThousands of U.S.
dollars (Note 1)
2020 2019 2018 2020ASSETSCURRENT ASSETS
Cash and cash equivalents (Note 4) ¥ 179,472 ¥157,682 ¥100,708 $ 1,649,104 Marketable securities (Note 4, 5) 219 949 182 2,012 Notes and accounts receivable - trade (Note 4) 38,908 45,276 41,186 357,512 Short-term loans receivable 18,543 18,297 17,519 170,385 Allowance for doubtful accounts (300) (409) (412) (2,757)Inventories (Note 8, 13) 1,901,756 1,635,127 1,527,320 17,474,557 Advances paid for purchases (Note 9) 28,542 26,260 27,801 262,262 Equity investments in properties for sale (Note 4, 5) 6,683 6,701 6,723 61,408 Other current assets 219,744 227,356 177,321 2,019,149
Total current assets 2,393,567 2,117,239 1,898,348 21,993,632
PROPERTY and EQUIPMENT, at cost:Land (Note 7, 13) 2,216,701 2,146,037 2,086,195 20,368,474 Buildings and structures (Note 7, 13, 23) 1,965,267 1,796,828 1,551,222 18,058,137 Machinery and equipment (Note 23) 255,479 218,137 194,812 2,347,505 Construction in progress 177,433 162,122 270,965 1,630,368
4,614,880 4,323,124 4,103,194 42,404,484 Accumulated depreciation (896,277) (846,732) (810,521) (8,235,569)
Net property and equipment (Note 24) 3,718,603 3,476,392 3,292,673 34,168,915
INVESTMENTS and OTHER ASSETSInvestments in unconsolidated subsidiaries and affiliated
companies 252,736 215,175 197,844 2,322,301 Investment securities (Note 4, 5) 635,320 657,511 590,114 5,837,729 Non-current loans and accounts receivable 161,304 117,167 98,451 1,482,165 Allowance for doubtful accounts (1,065) (1,139) (1,225) (9,786)Lease deposits (Note 4, 10) 145,414 140,571 138,565 1,336,157 Net defined benefit asset (Note 12) 28,994 31,295 17,975 266,416 Deferred income taxes (Note 11) 25,944 24,428 25,689 238,390 Deferred tax assets on land revaluation 3 3 35 28 Other 34,539 24,090 26,255 317,366
Total investments and other assets 1,283,189 1,209,101 1,093,703 11,790,766 Total assets ¥7,395,359 ¥6,802,732 ¥6,284,724 $67,953,313
See accompanying notes.
Consolidated Financial Statements
Millions of yenThousands of U.S.
dollars (Note 1)
2020 2019 2018 2020LIABILITIES AND NET ASSETSCURRENT LIABILITIES
Bank loans (Note 4, 13) ¥ 46,309 ¥ 55,326 ¥ 70,523 $ 425,517 Commercial paper (Note 4, 13) 173,000 114,000 125,000 1,589,635Long-term debt due within one year (Note 4, 13) 220,633 283,792 253,834 2,027,318Notes and accounts payable - trade (Note 4) 147,075 126,868 123,989 1,351,420Accrued expenses 43,883 52,012 40,422 403,225Accrued income taxes 36,906 27,625 44,952 339,116Advances and deposits received 258,207 264,626 263,260 2,372,572Other current liabilities (Note 14) 113,749 185,110 141,637 1,045,199
Total current liabilities 1,039,762 1,109,359 1,063,617 9,554,002
LONG-TERM LIABILITIESNet defined benefit liability (Note 12) 46,196 43,504 42,737 424,479Allowance for directors’ and corporate auditors’ retirement
benefits 801 712 716 7,360Long-term debt due after one year (Note 4, 13) 3,041,175 2,453,493 2,155,299 27,944,271Deposits from tenants (Note 4, 15) 436,595 424,335 403,413 4,011,716Deferred income taxes (Note 11) 147,786 154,941 134,521 1,357,953Deferred tax liabilities on land revaluation 151,544 151,546 151,701 1,392,484Other long-term liabilities (Note 14) 44,975 44,037 45,020 413,258
Total long-term liabilities 3,869,072 3,272,568 2,933,407 35,551,521
CONTINGENT LIABILITIES (Note 26)
NET ASSETS (Notes 16, 17)Shareholders’ equity
Common stock 339,767 339,767 339,767 3,121,998 Authorized – 3,290,000,000 shares Issued – 979,250,227 shares in 2020 and 991,424,727
shares in 2019 and 2018Capital surplus 372,163 403,269 409,764 3,419,673 Retained earnings 1,070,240 962,154 834,498 9,834,053 Treasury stock – 8,148,291 shares in 2020, 9,187,225 shares in
2019 and 3,199,947 shares in 2018 (14,365) (21,088) (6,079) (131,995)Total shareholders' equity 1,767,805 1,684,102 1,577,950 16,243,729
Accumulated other comprehensive income (loss)Net unrealized holding gains on securities 319,993 334,612 298,297 2,940,301 Deferred losses on hedging instruments (222) 72 (242) (2,040)Reserve on land revaluation 330,305 330,538 330,923 3,035,055 Foreign currency translation adjustments (14,794) (16,334) (3,956) (135,937)Accumulated adjustments for retirement benefit 5,593 9,523 1,910 51,392
Total accumulated other comprehensive income 640,875 658,411 626,932 5,888,771 Subscription rights to shares (Note 18) 1,454 1,285 1,091 13,360 Non-controlling interests 76,391 77,007 81,727 701,930 Total net assets 2,486,525 2,420,805 2,287,700 22,847,790
¥7,395,359 ¥6,802,732 ¥6,284,724 $67,953,313
See accompanying notes.
04 05Mitsui Fudosan Co., Ltd. Mitsui Fudosan Co., Ltd.
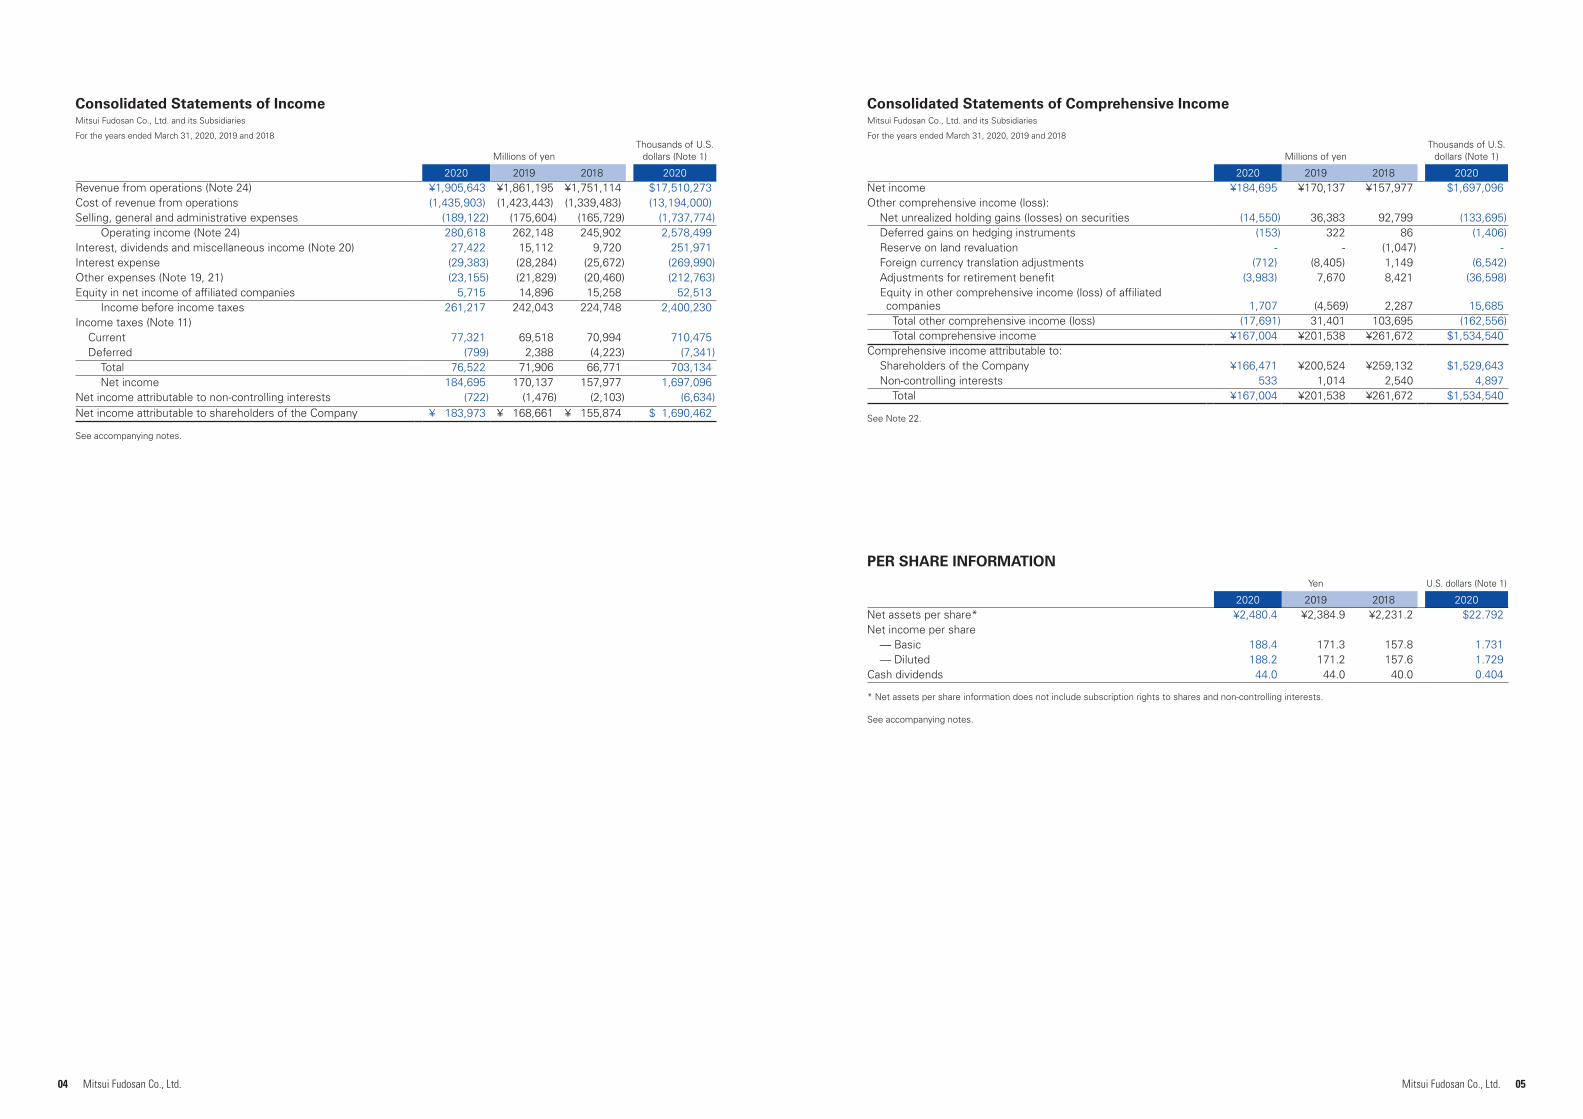
Consolidated Statements of IncomeMitsui Fudosan Co., Ltd. and its Subsidiaries
For the years ended March 31, 2020, 2019 and 2018
Millions of yenThousands of U.S.
dollars (Note 1)
2020 2019 2018 2020Revenue from operations (Note 24) ¥1,905,643 ¥1,861,195 ¥1,751,114 $17,510,273 Cost of revenue from operations (1,435,903) (1,423,443) (1,339,483) (13,194,000)Selling, general and administrative expenses (189,122) (175,604) (165,729) (1,737,774)
Operating income (Note 24) 280,618 262,148 245,902 2,578,499 Interest, dividends and miscellaneous income (Note 20) 27,422 15,112 9,720 251,971 Interest expense (29,383) (28,284) (25,672) (269,990)Other expenses (Note 19, 21) (23,155) (21,829) (20,460) (212,763)Equity in net income of affiliated companies 5,715 14,896 15,258 52,513
Income before income taxes 261,217 242,043 224,748 2,400,230 Income taxes (Note 11)
Current 77,321 69,518 70,994 710,475 Deferred (799) 2,388 (4,223) (7,341)
Total 76,522 71,906 66,771 703,134 Net income 184,695 170,137 157,977 1,697,096
Net income attributable to non-controlling interests (722) (1,476) (2,103) (6,634)Net income attributable to shareholders of the Company ¥ 183,973 ¥ 168,661 ¥ 155,874 $ 1,690,462
See accompanying notes.
Consolidated Statements of Comprehensive IncomeMitsui Fudosan Co., Ltd. and its Subsidiaries
For the years ended March 31, 2020, 2019 and 2018
PER SHARE INFORMATION
Millions of yenThousands of U.S.
dollars (Note 1)
2020 2019 2018 2020Net income ¥184,695 ¥170,137 ¥157,977 $1,697,096 Other comprehensive income (loss):
Net unrealized holding gains (losses) on securities (14,550) 36,383 92,799 (133,695)Deferred gains on hedging instruments (153) 322 86 (1,406)Reserve on land revaluation - - (1,047) - Foreign currency translation adjustments (712) (8,405) 1,149 (6,542)Adjustments for retirement benefit (3,983) 7,670 8,421 (36,598)Equity in other comprehensive income (loss) of affiliated
companies 1,707 (4,569) 2,287 15,685 Total other comprehensive income (loss) (17,691) 31,401 103,695 (162,556)Total comprehensive income ¥167,004 ¥201,538 ¥261,672 $1,534,540
Comprehensive income attributable to:Shareholders of the Company ¥166,471 ¥200,524 ¥259,132 $1,529,643 Non-controlling interests 533 1,014 2,540 4,897
Total ¥167,004 ¥201,538 ¥261,672 $1,534,540
See Note 22.
Yen U.S. dollars (Note 1)
2020 2019 2018 2020Net assets per share* ¥2,480.4 ¥2,384.9 ¥2,231.2 $22.792 Net income per share
— Basic 188.4 171.3 157.8 1.731— Diluted 188.2 171.2 157.6 1.729
Cash dividends 44.0 44.0 40.0 0.404
* Net assets per share information does not include subscription rights to shares and non-controlling interests.
See accompanying notes.
06 07Mitsui Fudosan Co., Ltd. Mitsui Fudosan Co., Ltd.
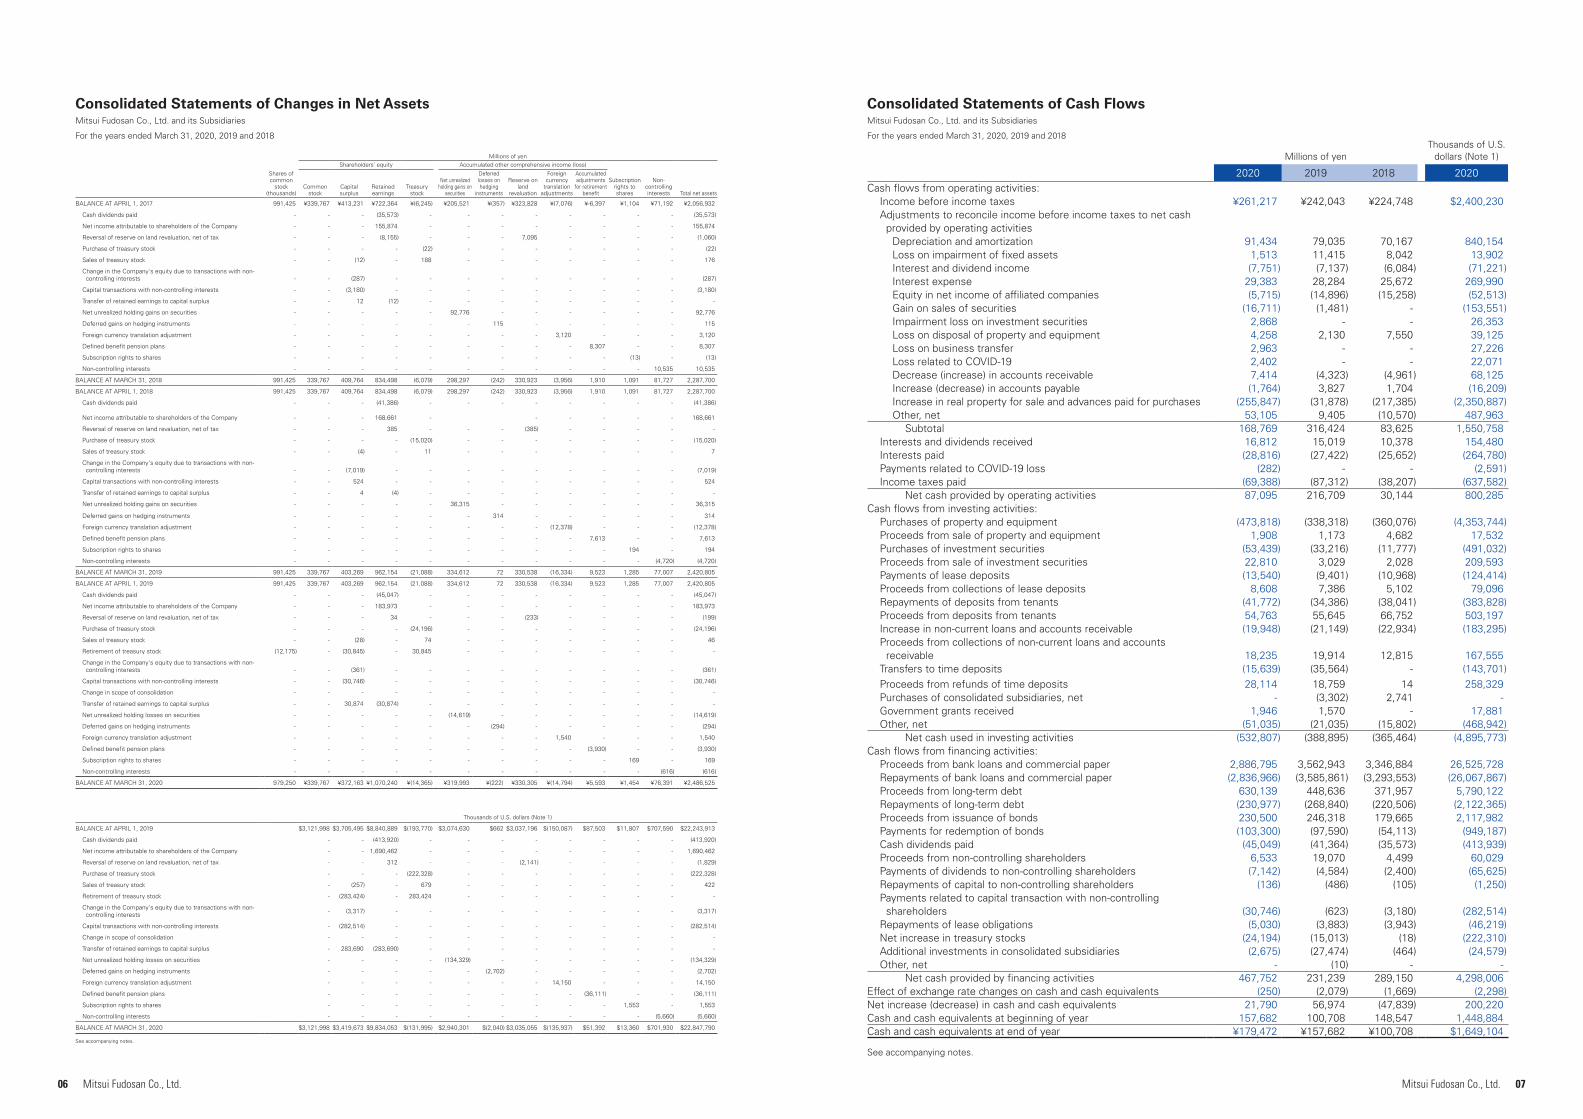
Consolidated Statements of Changes in Net AssetsMitsui Fudosan Co., Ltd. and its Subsidiaries
For the years ended March 31, 2020, 2019 and 2018
Millions of yenShareholders’ equity Accumulated other comprehensive income (loss)
Shares of common
stock (thousands)
Common stock
Capital surplus
Retained earnings
Treasury stock
Net unrealized holding gains on
securities
Deferred losses on hedging
instruments
Reserve on land
revaluation
Foreign currency
translation adjustments
Accumulated adjustments
for retirement benefit
Subscription rights to shares
Non- controlling interests Total net assets
BALANCE AT APRIL 1, 2017 991,425 ¥339,767 ¥413,231 ¥722,364 ¥(6,245) ¥205,521 ¥(357) ¥323,828 ¥(7,076) ¥-6,397 ¥1,104 ¥71,192 ¥2,056,932
Cash dividends paid - - - (35,573) - - - - - - - - (35,573)
Net income attributable to shareholders of the Company - - - 155,874 - - - - - - - - 155,874
Reversal of reserve on land revaluation, net of tax - - - (8,155) - - - 7,095 - - - - (1,060)
Purchase of treasury stock - - - - (22) - - - - - - - (22)
Sales of treasury stock - - (12) - 188 - - - - - - - 176
Change in the Company's equity due to transactions with non-controlling interests - - (287) - - - - - - - - - (287)
Capital transactions with non-controlling interests - - (3,180) - - - - - - - - - (3,180)
Transfer of retained earnings to capital surplus - - 12 (12) - - - - - - - - -
Net unrealized holding gains on securities - - - - - 92,776 - - - - - - 92,776
Deferred gains on hedging instruments - - - - - - 115 - - - - - 115
Foreign currency translation adjustment - - - - - - - - 3,120 - - - 3,120
Defined benefit pension plans - - - - - - - - - 8,307 - - 8,307
Subscription rights to shares - - - - - - - - - - (13) - (13)
Non-controlling interests - - - - - - - - - - - 10,535 10,535
BALANCE AT MARCH 31, 2018 991,425 339,767 409,764 834,498 (6,079) 298,297 (242) 330,923 (3,956) 1,910 1,091 81,727 2,287,700
BALANCE AT APRIL 1, 2018 991,425 339,767 409,764 834,498 (6,079) 298,297 (242) 330,923 (3,956) 1,910 1,091 81,727 2,287,700
Cash dividends paid - - - (41,386) - - - - - - - - (41,386)
Net income attributable to shareholders of the Company - - - 168,661 - - - - - - 168,661
Reversal of reserve on land revaluation, net of tax - - - 385 - - - (385) - - - - -
Purchase of treasury stock - - - - (15,020) - - - - - - - (15,020)
Sales of treasury stock - - (4) - 11 - - - - - - - 7
Change in the Company's equity due to transactions with non-controlling interests - - (7,019) - - - - - - - - - (7,019)
Capital transactions with non-controlling interests - - 524 - - - - - - - - - 524
Transfer of retained earnings to capital surplus - - 4 (4) - - - - - - - - -
Net unrealized holding gains on securities - - - - - 36,315 - - - - - - 36,315
Deferred gains on hedging instruments - - - - - - 314 - - - - - 314
Foreign currency translation adjustment - - - - - - - - (12,378) - - - (12,378)
Defined benefit pension plans - - - - - - - - - 7,613 - - 7,613
Subscription rights to shares - - - - - - - - - - 194 - 194
Non-controlling interests - - - - - - - - - - - (4,720) (4,720)
BALANCE AT MARCH 31, 2019 991,425 339,767 403,269 962,154 (21,088) 334,612 72 330,538 (16,334) 9,523 1,285 77,007 2,420,805
BALANCE AT APRIL 1, 2019 991,425 339,767 403,269 962,154 (21,088) 334,612 72 330,538 (16,334) 9,523 1,285 77,007 2,420,805
Cash dividends paid - - - (45,047) - - - - - - - - (45,047)
Net income attributable to shareholders of the Company - - - 183,973 - - - - - - - - 183,973
Reversal of reserve on land revaluation, net of tax - - - 34 - - - (233) - - - - (199)
Purchase of treasury stock - - - - (24,196) - - - - - - - (24,196)
Sales of treasury stock - - (28) - 74 - - - - - - - 46
Retirement of treasury stock (12,175) - (30,845) - 30,845 - - - - - - - -
Change in the Company's equity due to transactions with non-controlling interests - - (361) - - - - - - - - - (361)
Capital transactions with non-controlling interests - - (30,746) - - - - - - - - - (30,746)
Change in scope of consolidation - - - - - - - - - - - - -
Transfer of retained earnings to capital surplus - - 30,874 (30,874) - - - - - - - - -
Net unrealized holding losses on securities - - - - - (14,619) - - - - - - (14,619)
Deferred gains on hedging instruments - - - - - - (294) - - - - - (294)
Foreign currency translation adjustment - - - - - - - - 1,540 - - - 1,540
Defined benefit pension plans - - - - - - - - - (3,930) - - (3,930)
Subscription rights to shares - - - - - - - - - - 169 - 169
Non-controlling interests - - - - - - - - - - - (616) (616)
BALANCE AT MARCH 31, 2020 979,250 ¥339,767 ¥372,163 ¥1,070,240 ¥(14,365) ¥319,993 ¥(222) ¥330,305 ¥(14,794) ¥5,593 ¥1,454 ¥76,391 ¥2,486,525
Thousands of U.S. dollars (Note 1)
BALANCE AT APRIL 1, 2019 $3,121,998 $3,705,495 $8,840,889 $(193,770) $3,074,630 $662 $3,037,196 $(150,087) $87,503 $11,807 $707,590 $22,243,913
Cash dividends paid - - (413,920) - - - - - - - - (413,920)
Net income attributable to shareholders of the Company - - 1,690,462 - - - - - - - - 1,690,462
Reversal of reserve on land revaluation, net of tax - - 312 - - - (2,141) - - - - (1,829)
Purchase of treasury stock - - - (222,328) - - - - - - - (222,328)
Sales of treasury stock - (257) - 679 - - - - - - - 422
Retirement of treasury stock - (283,424) - 283,424 - - - - - - - -
Change in the Company's equity due to transactions with non-controlling interests - (3,317) - - - - - - - - - (3,317)
Capital transactions with non-controlling interests - (282,514) - - - - - - - - - (282,514)
Change in scope of consolidation - - - - - - - - - - - -
Transfer of retained earnings to capital surplus - 283,690 (283,690) - - - - - - - - -
Net unrealized holding losses on securities - - - - (134,329) - - - - - - (134,329)
Deferred gains on hedging instruments - - - - - (2,702) - - - - - (2,702)
Foreign currency translation adjustment - - - - - - - 14,150 - - - 14,150
Defined benefit pension plans - - - - - - - - (36,111) - - (36,111)
Subscription rights to shares - - - - - - - - - 1,553 - 1,553
Non-controlling interests - - - - - - - - - - (5,660) (5,660)
BALANCE AT MARCH 31, 2020 $3,121,998 $3,419,673 $9,834,053 $(131,995) $2,940,301 $(2,040) $3,035,055 $(135,937) $51,392 $13,360 $701,930 $22,847,790
See accompanying notes.
Millions of yenThousands of U.S.
dollars (Note 1)
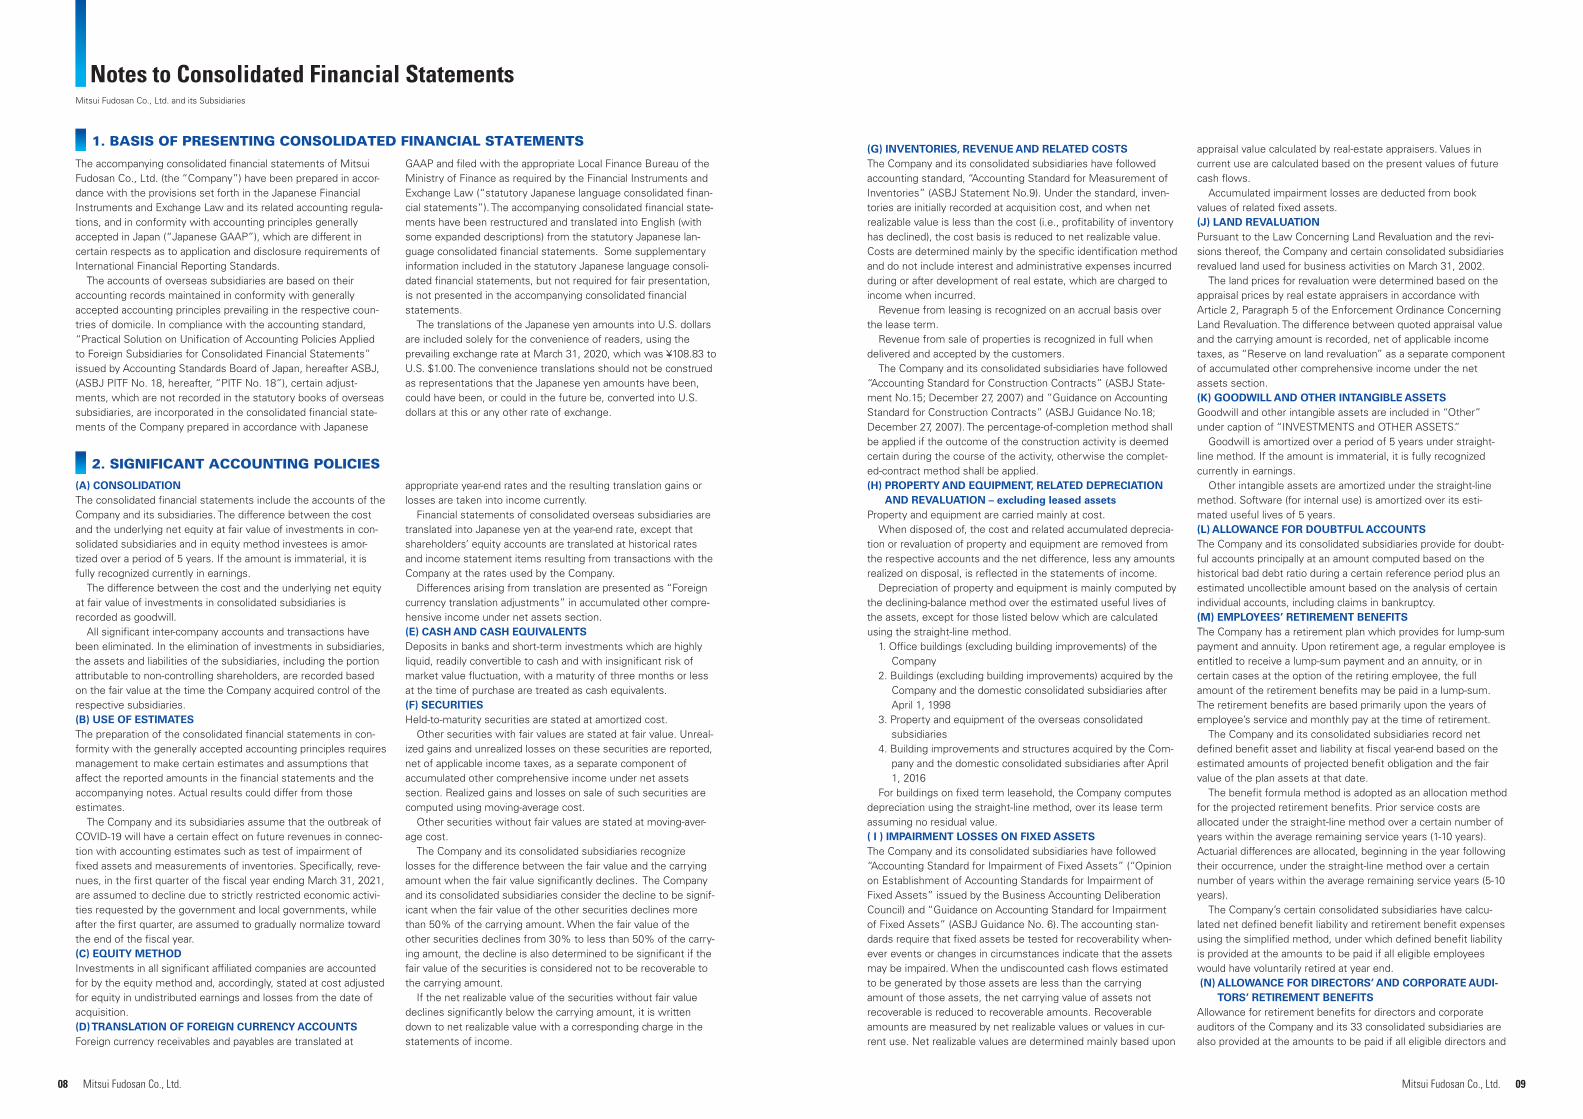
2020 2019 2018 2020Cash flows from operating activities:
Income before income taxes ¥261,217 ¥242,043 ¥224,748 $2,400,230Adjustments to reconcile income before income taxes to net cash
provided by operating activitiesDepreciation and amortization 91,434 79,035 70,167 840,154Loss on impairment of fixed assets 1,513 11,415 8,042 13,902Interest and dividend income (7,751) (7,137) (6,084) (71,221)Interest expense 29,383 28,284 25,672 269,990Equity in net income of affiliated companies (5,715) (14,896) (15,258) (52,513)Gain on sales of securities (16,711) (1,481) - (153,551)Impairment loss on investment securities 2,868 - - 26,353Loss on disposal of property and equipment 4,258 2,130 7,550 39,125Loss on business transfer 2,963 - - 27,226Loss related to COVID-19 2,402 - - 22,071Decrease (increase) in accounts receivable 7,414 (4,323) (4,961) 68,125Increase (decrease) in accounts payable (1,764) 3,827 1,704 (16,209)Increase in real property for sale and advances paid for purchases (255,847) (31,878) (217,385) (2,350,887)Other, net 53,105 9,405 (10,570) 487,963
Subtotal 168,769 316,424 83,625 1,550,758Interests and dividends received 16,812 15,019 10,378 154,480Interests paid (28,816) (27,422) (25,652) (264,780)Payments related to COVID-19 loss (282) - - (2,591)Income taxes paid (69,388) (87,312) (38,207) (637,582)
Net cash provided by operating activities 87,095 216,709 30,144 800,285Cash flows from investing activities:
Purchases of property and equipment (473,818) (338,318) (360,076) (4,353,744)Proceeds from sale of property and equipment 1,908 1,173 4,682 17,532Purchases of investment securities (53,439) (33,216) (11,777) (491,032)Proceeds from sale of investment securities 22,810 3,029 2,028 209,593Payments of lease deposits (13,540) (9,401) (10,968) (124,414)Proceeds from collections of lease deposits 8,608 7,386 5,102 79,096Repayments of deposits from tenants (41,772) (34,386) (38,041) (383,828)Proceeds from deposits from tenants 54,763 55,645 66,752 503,197Increase in non-current loans and accounts receivable (19,948) (21,149) (22,934) (183,295)Proceeds from collections of non-current loans and accounts
receivable 18,235 19,914 12,815 167,555Transfers to time deposits (15,639) (35,564) - (143,701)Proceeds from refunds of time deposits 28,114 18,759 14 258,329Purchases of consolidated subsidiaries, net - (3,302) 2,741 - Government grants received 1,946 1,570 - 17,881Other, net (51,035) (21,035) (15,802) (468,942)
Net cash used in investing activities (532,807) (388,895) (365,464) (4,895,773)Cash flows from financing activities:
Proceeds from bank loans and commercial paper 2,886,795 3,562,943 3,346,884 26,525,728Repayments of bank loans and commercial paper (2,836,966) (3,585,861) (3,293,553) (26,067,867)Proceeds from long-term debt 630,139 448,636 371,957 5,790,122Repayments of long-term debt (230,977) (268,840) (220,506) (2,122,365)Proceeds from issuance of bonds 230,500 246,318 179,665 2,117,982Payments for redemption of bonds (103,300) (97,590) (54,113) (949,187)Cash dividends paid (45,049) (41,364) (35,573) (413,939)Proceeds from non-controlling shareholders 6,533 19,070 4,499 60,029Payments of dividends to non-controlling shareholders (7,142) (4,584) (2,400) (65,625)Repayments of capital to non-controlling shareholders (136) (486) (105) (1,250)Payments related to capital transaction with non-controlling
shareholders (30,746) (623) (3,180) (282,514)Repayments of lease obligations (5,030) (3,883) (3,943) (46,219)Net increase in treasury stocks (24,194) (15,013) (18) (222,310)Additional investments in consolidated subsidiaries (2,675) (27,474) (464) (24,579)Other, net - (10) - -
Net cash provided by financing activities 467,752 231,239 289,150 4,298,006Effect of exchange rate changes on cash and cash equivalents (250) (2,079) (1,669) (2,298)Net increase (decrease) in cash and cash equivalents 21,790 56,974 (47,839) 200,220Cash and cash equivalents at beginning of year 157,682 100,708 148,547 1,448,884Cash and cash equivalents at end of year ¥179,472 ¥157,682 ¥100,708 $1,649,104
See accompanying notes.
Consolidated Statements of Cash FlowsMitsui Fudosan Co., Ltd. and its Subsidiaries
For the years ended March 31, 2020, 2019 and 2018
08 09Mitsui Fudosan Co., Ltd. Mitsui Fudosan Co., Ltd.
Mitsui Fudosan Co., Ltd. and its Subsidiaries
1. BASIS OF PRESENTING CONSOLIDATED FINANCIAL STATEMENTS
The accompanying consolidated financial statements of Mitsui Fudosan Co., Ltd. (the “Company”) have been prepared in accor-dance with the provisions set forth in the Japanese Financial Instruments and Exchange Law and its related accounting regula-tions, and in conformity with accounting principles generally accepted in Japan (“Japanese GAAP”), which are different in certain respects as to application and disclosure requirements of International Financial Reporting Standards.
The accounts of overseas subsidiaries are based on their accounting records maintained in conformity with generally accepted accounting principles prevailing in the respective coun-tries of domicile. In compliance with the accounting standard, “Practical Solution on Unification of Accounting Policies Applied to Foreign Subsidiaries for Consolidated Financial Statements” issued by Accounting Standards Board of Japan, hereafter ASBJ, (ASBJ PITF No. 18, hereafter, “PITF No. 18”), certain adjust-ments, which are not recorded in the statutory books of overseas subsidiaries, are incorporated in the consolidated financial state-ments of the Company prepared in accordance with Japanese
GAAP and filed with the appropriate Local Finance Bureau of the Ministry of Finance as required by the Financial Instruments and Exchange Law (“statutory Japanese language consolidated finan-cial statements”). The accompanying consolidated financial state-ments have been restructured and translated into English (with some expanded descriptions) from the statutory Japanese lan-guage consolidated financial statements. Some supplementary information included in the statutory Japanese language consoli-dated financial statements, but not required for fair presentation, is not presented in the accompanying consolidated financial statements.
The translations of the Japanese yen amounts into U.S. dollars are included solely for the convenience of readers, using the prevailing exchange rate at March 31, 2020, which was ¥108.83 to U.S. $1.00. The convenience translations should not be construed as representations that the Japanese yen amounts have been, could have been, or could in the future be, converted into U.S. dollars at this or any other rate of exchange.
2. SIGNIFICANT ACCOUNTING POLICIES
(A) CONSOLIDATIONThe consolidated financial statements include the accounts of the Company and its subsidiaries. The difference between the cost and the underlying net equity at fair value of investments in con-solidated subsidiaries and in equity method investees is amor-tized over a period of 5 years. If the amount is immaterial, it is fully recognized currently in earnings.
The difference between the cost and the underlying net equity at fair value of investments in consolidated subsidiaries is recorded as goodwill.
All significant inter-company accounts and transactions have been eliminated. In the elimination of investments in subsidiaries, the assets and liabilities of the subsidiaries, including the portion attributable to non-controlling shareholders, are recorded based on the fair value at the time the Company acquired control of the respective subsidiaries.(B) USE OF ESTIMATESThe preparation of the consolidated financial statements in con-formity with the generally accepted accounting principles requires management to make certain estimates and assumptions that affect the reported amounts in the financial statements and the accompanying notes. Actual results could differ from those estimates.
The Company and its subsidiaries assume that the outbreak of COVID-19 will have a certain effect on future revenues in connec-tion with accounting estimates such as test of impairment of fixed assets and measurements of inventories. Specifically, reve-nues, in the first quarter of the fiscal year ending March 31, 2021, are assumed to decline due to strictly restricted economic activi-ties requested by the government and local governments, while after the first quarter, are assumed to gradually normalize toward the end of the fiscal year.(C) EQUITY METHODInvestments in all significant affiliated companies are accounted for by the equity method and, accordingly, stated at cost adjusted for equity in undistributed earnings and losses from the date of acquisition.(D) TRANSLATION OF FOREIGN CURRENCY ACCOUNTSForeign currency receivables and payables are translated at
appropriate year-end rates and the resulting translation gains or losses are taken into income currently.
Financial statements of consolidated overseas subsidiaries are translated into Japanese yen at the year-end rate, except that shareholders’ equity accounts are translated at historical rates and income statement items resulting from transactions with the Company at the rates used by the Company.
Differences arising from translation are presented as “Foreign currency translation adjustments” in accumulated other compre-hensive income under net assets section.(E) CASH AND CASH EQUIVALENTSDeposits in banks and short-term investments which are highly liquid, readily convertible to cash and with insignificant risk of market value fluctuation, with a maturity of three months or less at the time of purchase are treated as cash equivalents.(F) SECURITIESHeld-to-maturity securities are stated at amortized cost.
Other securities with fair values are stated at fair value. Unreal-ized gains and unrealized losses on these securities are reported, net of applicable income taxes, as a separate component of accumulated other comprehensive income under net assets section. Realized gains and losses on sale of such securities are computed using moving-average cost.
Other securities without fair values are stated at moving-aver-age cost.
The Company and its consolidated subsidiaries recognize losses for the difference between the fair value and the carrying amount when the fair value significantly declines. The Company and its consolidated subsidiaries consider the decline to be signif-icant when the fair value of the other securities declines more than 50% of the carrying amount. When the fair value of the other securities declines from 30% to less than 50% of the carry-ing amount, the decline is also determined to be significant if the fair value of the securities is considered not to be recoverable to the carrying amount.
If the net realizable value of the securities without fair value declines significantly below the carrying amount, it is written down to net realizable value with a corresponding charge in the statements of income.
Notes to Consolidated Financial Statements
(G) INVENTORIES, REVENUE AND RELATED COSTSThe Company and its consolidated subsidiaries have followed accounting standard, “Accounting Standard for Measurement of Inventories” (ASBJ Statement No.9). Under the standard, inven-tories are initially recorded at acquisition cost, and when net realizable value is less than the cost (i.e., profitability of inventory has declined), the cost basis is reduced to net realizable value. Costs are determined mainly by the specific identification method and do not include interest and administrative expenses incurred during or after development of real estate, which are charged to income when incurred.
Revenue from leasing is recognized on an accrual basis over the lease term.
Revenue from sale of properties is recognized in full when delivered and accepted by the customers.
The Company and its consolidated subsidiaries have followed “Accounting Standard for Construction Contracts” (ASBJ State-ment No.15; December 27, 2007) and ”Guidance on Accounting Standard for Construction Contracts” (ASBJ Guidance No.18; December 27, 2007). The percentage-of-completion method shall be applied if the outcome of the construction activity is deemed certain during the course of the activity, otherwise the complet-ed-contract method shall be applied.(H) PROPERTY AND EQUIPMENT, RELATED DEPRECIATION
AND REVALUATION – excluding leased assetsProperty and equipment are carried mainly at cost.
When disposed of, the cost and related accumulated deprecia-tion or revaluation of property and equipment are removed from the respective accounts and the net difference, less any amounts realized on disposal, is reflected in the statements of income.
Depreciation of property and equipment is mainly computed by the declining-balance method over the estimated useful lives of the assets, except for those listed below which are calculated using the straight-line method.
1. Office buildings (excluding building improvements) of the Company
2. Buildings (excluding building improvements) acquired by the Company and the domestic consolidated subsidiaries after April 1, 1998
3. Property and equipment of the overseas consolidated subsidiaries
4. Building improvements and structures acquired by the Com-pany and the domestic consolidated subsidiaries after April 1, 2016
For buildings on fixed term leasehold, the Company computes depreciation using the straight-line method, over its lease term assuming no residual value.( I ) IMPAIRMENT LOSSES ON FIXED ASSETS The Company and its consolidated subsidiaries have followed “Accounting Standard for Impairment of Fixed Assets” (“Opinion on Establishment of Accounting Standards for Impairment of Fixed Assets” issued by the Business Accounting Deliberation Council) and “Guidance on Accounting Standard for Impairment of Fixed Assets” (ASBJ Guidance No. 6). The accounting stan-dards require that fixed assets be tested for recoverability when-ever events or changes in circumstances indicate that the assets may be impaired. When the undiscounted cash flows estimated to be generated by those assets are less than the carrying amount of those assets, the net carrying value of assets not recoverable is reduced to recoverable amounts. Recoverable amounts are measured by net realizable values or values in cur-rent use. Net realizable values are determined mainly based upon
appraisal value calculated by real-estate appraisers. Values in current use are calculated based on the present values of future cash flows.
Accumulated impairment losses are deducted from book values of related fixed assets.(J) LAND REVALUATIONPursuant to the Law Concerning Land Revaluation and the revi-sions thereof, the Company and certain consolidated subsidiaries revalued land used for business activities on March 31, 2002.
The land prices for revaluation were determined based on the appraisal prices by real estate appraisers in accordance with Article 2, Paragraph 5 of the Enforcement Ordinance Concerning Land Revaluation. The difference between quoted appraisal value and the carrying amount is recorded, net of applicable income taxes, as “Reserve on land revaluation” as a separate component of accumulated other comprehensive income under the net assets section.(K) GOODWILL AND OTHER INTANGIBLE ASSETSGoodwill and other intangible assets are included in “Other” under caption of “INVESTMENTS and OTHER ASSETS.”
Goodwill is amortized over a period of 5 years under straight-line method. If the amount is immaterial, it is fully recognized currently in earnings.
Other intangible assets are amortized under the straight-line method. Software (for internal use) is amortized over its esti-mated useful lives of 5 years.(L) ALLOWANCE FOR DOUBTFUL ACCOUNTSThe Company and its consolidated subsidiaries provide for doubt-ful accounts principally at an amount computed based on the historical bad debt ratio during a certain reference period plus an estimated uncollectible amount based on the analysis of certain individual accounts, including claims in bankruptcy.(M) EMPLOYEES’ RETIREMENT BENEFITSThe Company has a retirement plan which provides for lump-sum payment and annuity. Upon retirement age, a regular employee is entitled to receive a lump-sum payment and an annuity, or in certain cases at the option of the retiring employee, the full amount of the retirement benefits may be paid in a lump-sum. The retirement benefits are based primarily upon the years of employee’s service and monthly pay at the time of retirement.
The Company and its consolidated subsidiaries record net defined benefit asset and liability at fiscal year-end based on the estimated amounts of projected benefit obligation and the fair value of the plan assets at that date.
The benefit formula method is adopted as an allocation method for the projected retirement benefits. Prior service costs are allocated under the straight-line method over a certain number of years within the average remaining service years (1-10 years). Actuarial differences are allocated, beginning in the year following their occurrence, under the straight-line method over a certain number of years within the average remaining service years (5-10 years).
The Company’s certain consolidated subsidiaries have calcu-lated net defined benefit liability and retirement benefit expenses using the simplified method, under which defined benefit liability is provided at the amounts to be paid if all eligible employees would have voluntarily retired at year end. (N) ALLOWANCE FOR DIRECTORS’ AND CORPORATE AUDI-
TORS’ RETIREMENT BENEFITSAllowance for retirement benefits for directors and corporate auditors of the Company and its 33 consolidated subsidiaries are also provided at the amounts to be paid if all eligible directors and
10 11Mitsui Fudosan Co., Ltd. Mitsui Fudosan Co., Ltd.
corporate auditors would have retired at year end under the inter-nal guidelines.(O) ACCOUNTING FOR LEASE TRANSACTIONSThe Company and its consolidated subsidiaries have followed “Accounting Standard for Lease Transactions” (Statement No.13 originally issued by the First Committee of the Business Account-ing Council on June 17, 1993 and revised by ASBJ on March 30, 2007) and the “Implementation Guidance on Accounting Standard for Lease Transactions” (the Financial Accounting Standard Imple-mentation Guidance No.16 issued originally by the Accounting System Committee of the Japanese Institute of Certified Public Accountants on January 18,1994 and revised by ASBJ on March 30, 2007).
Those standards require finance leases to be accounted for in a manner similar to the accounting treatment for ordinary sales transactions. Lessees are required to record assets and liabilities regarding finance leases with recognition of depreciation and interest expenses. Capitalized leased assets are depreciated under the straight-line method, over the lease term assuming no residual value. Lessors are required to recognize lease receivables or investments in leased assets along with related lease (interest) income.
It should be noted that finance leases which do not transfer ownership of the leased assets to lessees whose commence-ment day falls on or prior to March 31, 2008 are accounted for as operating leases.(P) INCOME TAXESIncome taxes are provided for on the basis of income for financial statement purposes. The tax effect of temporary differences between the carrying amounts of assets and liabilities for finan-cial statements and income tax purposes is recognized as deferred income taxes.
The Company and its consolidated domestic subsidiaries are subject to a corporate tax of approximately 23%, an inhabitants tax of approximately 5% and a deductible enterprise tax of approximately 4%, which in the aggregate resulted in a statutory income tax rate of approximately 31% for the years ended March 31, 2020, 2019 and 2018.(Q) DERIVATIVES AND HEDGE ACCOUNTING1. Hedge accountingThe Company and its consolidated subsidiaries defer recognition of gains or losses resulting from changes in fair value of derivative financial instruments until the related losses or gains on the hedged items are recognized, if derivative financial instruments are used as hedges and meet certain hedging criteria.
However, in cases where forward foreign exchange contracts are used as hedges and meet certain hedging criteria, forward foreign exchange contracts and hedged items are accounted for in the following manner:
(1) If a forward foreign exchange contract is executed to hedge an existing foreign currency receivable or payable,(a) the difference, if any, between the Japanese yen amount
of the hedged foreign currency receivable or payable translated using the spot rate at the inception date of the contract and the book value of the receivable or payable is recognized in the income statements in the period which includes the inception date, and
(b) the discount or premium on the contract (that is, the difference between the Japanese yen amount of the contract translated using the contracted forward rate and that translated using the spot rate at the inception date of the contract) is recognized over the term of the contract.
(2) If a forward foreign exchange contract is executed to hedge a future transaction denominated in a foreign currency, the future transaction will be recorded using the contracted forward rate, and no gains or losses on the forward foreign exchange contract are recognized.
Also, if interest rate swap contracts are used as hedge and meet certain hedging criteria, the net amount to be paid or received under the interest rate swap contract is added to or deducted from the interest on the assets or liabilities for which the swap contract was executed.2. The following summarizes hedging derivative financial instru-ments used by the Company and its consolidated subsidiaries and items hedged:
Hedging instruments:Forward foreign exchange contractsForeign currency swap contractsInterest rate swap contracts
Hedged items:Expected foreign currency transactionsForeign currency debtBorrowings and debentures
3. Hedge policyThe Company and its consolidated subsidiaries use interest rate swap contracts to mitigate risk of fair value changes of borrow-ings due to fluctuating interest rates and risk of changes in cash flows. Exchange rate risk on borrowings made and debentures issued in non-functional currencies is hedged by utilizing currency swaps. Exchange rate risk on forecasted transactions to be set-tled in non-functional currencies is hedged by using forward foreign exchange contracts.4. Assessment of hedge effectivenessThe assessment of hedge effectiveness is omitted because sig-nificant terms of hedging instruments and those of the items hedged are the same and the risk of changes in foreign exchange rates and interest rates would be entirely eliminated.(R) EQUITY INVESTMENTS REGARDING REAL ESTATE SECU-
RITIZATION-RELATED BUSINESSEquity investments in tokumei-kumiai, or silent partnerships (“TK”), preferred securities issued by tokutei-mokuteki-kaisha, or specific purpose companies (“TMK”) and others regarding real estate securitization-related business (collectively, “equity invest-ments”) are presented in the balance sheets as follows.
Equity investments held for sale are presented as “Equity investments in properties for sale” under “CURRENT ASSETS” and those held other than for sale are presented as “Investment securities” under “INVESTMENTS and OTHER ASSETS.”(S) REVENUE FROM JAPANESE REAL ESTATE INVESTMENT
TRUST (J-REIT)Revenue from J-REIT is included in “Revenue from operations.”(T) DIRECTORS’ BONUSThe Company and its consolidated subsidiaries have followed the accounting standard, “Accounting Standard for Directors’ Bonus” (ASBJ Statement No.4). Directors’ bonuses are charged to income as selling, general and administrative expenses.(U) SHARE-BASED PAYMENTSThe Company and its consolidated subsidiaries have followed the accounting standards, “Accounting Standard for Share-Based Payment” (ASBJ Statement No.8) and the “Implementation Guidance for the Accounting Standard for Share-Based Payment” ASBJ Guidance No.11).
Those standards require that the cost of stock options be measured based on the grant-date fair value. Outstanding options
are presented as subscription rights to shares as a component of net assets in the balance sheet.(V) ASSET RETIREMENT OBLIGATIONSThe Company and its consolidated subsidiaries have followed “Accounting Standard for Asset Retirement Obligations” (ASBJ Statement No.18; March 31, 2008) and “Guidance on Accounting Standard for Asset Retirement Obligations” (ASBJ Guidance No.21; March 31, 2008). According to the standards, obligations associated with the retirement of tangible fixed assets are recorded as liabilities when those obligations are incurred, with the amount of the liability initially measured by discounting the future cash flows. The associated asset retirement costs are capitalized as part of the carrying amount of the fixed asset and allocated as period expenses.(W) ACCOUNTING CHANGES AND ERROR CORRECTIONSThe Company and its consolidated subsidiaries have followed “Accounting Standard for Accounting Changes and Error Correc-tions” (ASBJ Statement No.24, December 4, 2009) and “Guid-ance on Accounting Standard for Accounting Changes and Error Corrections” (ASBJ Guidance No.24, December 4, 2009). Those standards require that changes in accounting policies, changes in presentations and corrections of prior period errors be accounted for retrospectively, and changes in accounting estimates be accounted for prospectively.(X) EARNINGS PER SHAREBasic income per share is computed by dividing the net income available for distribution to shareholders of common stock by the weighted average number of shares of common stock outstand-ing during each year. Diluted net income per share reflects the potential dilution that could occur if securities or other contracts to issue common stock were exercised or converted into common stock.(Y) RECLASSIFICATIONSCertain prior years’ amounts have been reclassified to conform to the current presentation. (Z) CHANGES IN FINANCIAL STATEMENTS PRESENTATION
(1) Consolidated Statements of Changes in Net Assets – Capi-tal surplus“Capital transactions with non-controlling interests”, which was included in “change in the Company’s equity due to transactions with non-controlling interests” for the years ended March 31, 2019 and 2018, is independently presented for the year ended March 31, 2020 due to increase in its materiality.As a result, ¥(6,495) million of “change in the Company’s equity due to transactions with non-controlling interests” is reclassified to ¥(7,019) million of “change in the Company’s equity due to transactions with non-controlling interests” and ¥524 million of“capital transactions with non-controlling interests” for the year ended March 31, 2019, and ¥(3,467) million of “change in the Company’s equity due to transac-tions with non-controlling interests” is reclassified to ¥(288) million of “change in the Company’s equity due to transac-tions with non-controlling interests” and ¥(3,179) million of“capital transactions with non-controlling interests” for the year ended March 31, 2018 to conform to the current presentation.
(2) Consolidated Statements of Cash Flows(a) Net cash provided by operating activities
“Government grants income” and “advanced deprecia-tion on property and equipment” which were presented in the consolidated statements of cash flows for the year
ended March 31, 2019 are included in “other, net” due to their immateriality. As a result, ¥(3,973) million of“govern-ment grants income” and ¥3,960 of “advanced deprecia-tion on property and equipment” for the year ended March 31, 2019 are reclassified to “other, net” to conform to the current presentation.
(b) Net cash provided by financing activities“Payments related to capital transaction with non-con-trolling shareholders”, which was included in “payments of dividends to non-controlling shareholders” for the years ended March 31, 2019 and 2018, is independently presented for the year ended March 31, 2020 due to increase in its materiality.As a result, ¥(5,207) million of “payments of dividends to non-controlling shareholders” is reclassified to ¥(622) million of “payments related to capital transaction with non-controlling shareholders” and ¥(4,585) million of “payments of dividends to non-controlling shareholders” for the year ended March 31, 2019, and ¥(5,580) million of “change in the Company’s equity due to transactions with non-controlling interests” is reclassified to ¥(3,179) million of “payments related to capital transaction with non-con-trolling shareholders” and ¥(2,401) million of “payments of dividends to non-controlling shareholders” for the years ended March 31, 2018 to conform to the current presentation.
(AA) NEW ACCOUNTING STANDARDS NOT YET ADOPTED(1) The Company and its consolidated subsidiaries have not yet
adopted the following accounting standards: • “Accounting Standard for Revenue Recognition” (ASBJ
Statement No. 29, March 30, 2018) • “Implementation Guidance on Accounting Standard for
Revenue Recognition” (ASBJ Guidance No. 30, March 30, 2018).
The International Accounting Standards Board (IASB) and the Financial Accounting Standards Board (FASB) have jointly developed a converged accounting standard on revenue rec-ognition and issued “Revenue from Contracts with Custom-ers” (IFRS 15 by IASB and Accounting Standards Codification (ASC) Topic 606 by FASB) in May 2014. IFRS 15 is effective for annual reporting periods beginning on or after January 1, 2018 and Topic 606 is effective for annual reporting periods begin-ning on or after December 15, 2017. In this connection, the ASBJ developed a converged accounting standard on revenue recognition and issued the standard together with its imple-mentation guidance.The ASBJ followed two policies in developing accounting standard for revenue recognition. That is, to incorporate all basic IFRS 15 requirements to ensure comparability of finan-cial statements, but also to consider additional alternative treatments based on practices applied by Japanese compa-nies so that the standards would not significantly impair comparability.The Company and its consolidated subsidiaries will adopt the standards at the beginning of the year commencing on April 1, 2021. The effect that the adoption of the standards will have on the consolidated financial statements is currently under evaluation.
(2) The Company and its consolidated subsidiaries have not yet adopted the following accounting standards: • “Accounting Standard for Fair Value Measurement” (ASBJ
Statement No. 30, July 4, 2019)
12 13Mitsui Fudosan Co., Ltd. Mitsui Fudosan Co., Ltd.
• “Accounting Standard for Measurement of Inventories” (ASBJ Statement No. 9, Revised, July 4, 2019)
• “Accounting Standard for Financial Instruments” (ASBJ Statement No. 10, Revised, July 4, 2019)
• “Implementation Guidance on Accounting Standard for Fair Value Measurement” (ASBJ Guidance No. 31, July 4, 2019)
• “Implementation Guidance on Disclosures about Fair Value of Financial Instruments” (ASBJ Guidance No. 19, Revised, March 31, 2020)
The IASB and the FASB have established almost the same detailed guidance on fair value measurement (IFRS 13 “Fair Value Measurement” by IASB and ASC Topic 820 “Fair Value Measurement” by FASB). In this connection, the ASBJ devel-oped those standards to ensure Japanese GAAP to be consis-tent with international GAAP mainly on the guidance and disclosure regarding fair value of financial instruments.The ASBJ followed basic policy in developing accounting standard for fair value measurement to incorporate all basic IFRS 13 requirements to ensure comparability of financial statements by introducing unified measurement method, but also to set out other treatments based on practices applied by Japanese companies so that the standards would not signifi-cantly impair comparability.The Company and its consolidated subsidiaries will adopt the standards at the beginning of the year commencing on April 1, 2021. The effect that the adoption of the standards will have on the consolidated financial statements has not been determined.
(3) The Company and its consolidated subsidiaries have not yet adopted “Accounting Standard for Disclosure of Accounting Estimates” (ASBJ Statement No. 31, March 31, 2020)The ASBJ developed and published the standard in response to the proposal to consider disclosure under Japanese GAAP
of “sources of estimation uncertainty” which is required to be disclosed by paragraph 125 of International Accounting Stan-dard (IAS) No.1 “Presentation of Financial Statements” (“IAS 1”) issued by the International Accounting Standards Board (IASB) in 2003, as the disclosure would be highly useful for financial statements users.The ASBJ followed a basic policy in developing the standard, referencing to paragraph 125 of IAS 1, to show the principles (purpose of disclosure) rather than expanding individual notes. The standard requires entities to determine disclosures con-sidering the purpose of disclosure.The Company and its consolidated subsidiaries will adopt the standards at March 31, 2021.
(4) The Company and its consolidated subsidiaries have not yet adopted “Accounting Standard for Accounting Policy Disclo-sures, Accounting Changes and Error Corrections” (ASBJ Statement No. 24, Revised, March 31, 2020)The ASBJ made necessary revisions to the standard in response to the proposal to consider enhancing the note information regarding “principles and procedures of account-ing treatment adopted when the provisions of related accounting standards and guidance are not clear.” In enhancing the note information regarding “principles and procedures of accounting treatment adopted when the provi-sions of related accounting standards and guidance are not clear”, Note 1-2 (significant accounting policies) of Corporate Accounting Principles is to be taken over in order not to affect the accounting practice taken place for cases when the provi-sions of related accounting standards and guidance are clear.The Company and its consolidated subsidiaries will adopt the standards at March 31, 2021.
3. BUSINESS REORGANIZATIONS
There were no significant business reorganizations for the year ended March 31, 2020.
Significant business reorganizations for the year ended March 31, 2019 is described as follows:
The Company acquired Mitsui Home Co.,Ltd. through public tender offering and “Demand for Shares Cash-Out.”
(1) Outline of the transaction(a) Target company
Name of the company Mitsui Home Co.,Ltd.Business of the company New housing construction and
renovation, leasing management and sales of housing related parts and materials
(b) Date of the business combinationAcquisition through public tender offering on September 26, 2018 (deemed acquisition date: September 30, 2018)Acquisition through “Demand for Shares Cash-Out” on October 17, 2018 (deemed acquisition date: October 1, 2018)
(c) Legal form of the business combination
Purchase of stock paid in cash(d) Name of the company after the business combination
Mitsui Home Co.,Ltd. (hereafter “MH”)(e) Ownership percentage of the target company
Before the acquisition 57.53%After the public tender offering 94.83%After the “Demand for Shares Cash-Out” 100.00%
(f) Other mattersThe additional investment in the subsidiary aims to enhance collaboration between the Company and the other group companies, and MH.
(2) Accounting treatmentThe business combination is accounted for as transactions among entities under common control measured at cost in accordance with the “Accounting Standard for Business Combinations” (ASBJ Statement No.21, revised on Septem-ber 13, 2013) and “Guidance on Accounting Standard for Business Combinations and Accounting Standard for Busi-ness Divestitures” (ASBJ Guidance No.10, revised on Sep-tember 13, 2013).
(3) Acquisition cost and details of additional investment in the subsidiary (including acquisition through “Demand for Shares Cash-Out”) are summarized as below:
(4) Change in the Company's equity due to transactions with non-controlling interests
(a) Principal reason of change in capital surplusAdditional investments in subsidiary
(b) Amount of capital surplus decreased due to transactions
with non-controlling interests¥6,850 million
There were no significant business reorganizations for the year ended March 31, 2018.
4. FINANCIAL INSTRUMENTS
(1) Risk management policy regarding financial instrumentsa. Policy on financial instruments
The Company and its consolidated subsidiaries make fund procurements mainly through bank loans and issuance of bonds. The temporary surplus funds are invested in low-risk financial assets. Derivative instruments are used to mitigate risks referred to below, and the Company and its consolidated subsidiaries do not enter into speculative derivative transac-tions or transactions with high volatility on fair value.
b.Risk managementNotes and accounts receivable and lease deposits are subject to customers’ credit risk (risk related to customers’ failure to perform a contract). Each business division monitors due dates and balances for each counterparty to mitigate the risk of those receivables being uncollectible due to financial difficulties and other factors.Investment in equity securities is exposed to market-price risk. The securities are mainly those of companies with business relationships. The Company and its consolidated subsidiaries periodically monitor market prices and continuously review whether the securities should be held.Notes and accounts payable are mostly due within one year.Short-term debt is mainly used for funding working capital. Procurement from long-term debt and bonds payable, of which the maturities are due within 50 years from the balance sheet date, are mainly used for capital expenditures. Debt with float-ing interest rates is subject to interest-rate risk. The Company and its consolidated subsidiaries utilize derivatives (interest rate
swaps) as hedging instruments for some long-term debt with floating interest rates to fix the cash flows of interest pay-ments. Exchange rate risk on borrowings made in non-func-tional currencies are hedged by utilizing currency swaps. Refer to Note 2 (Q) for details on hedge accounting, hedge policy, assessment of hedge effectiveness and other matters.By using derivative instruments, the Company and its consoli-dated subsidiaries are exposed to counterparty’s credit risk and market risks such as interest rate risk and exchange rate risk. The Company and its consolidated subsidiaries manage the credit risk by carefully evaluating the financial positions of major financial institutions before entering into contracts. The derivative transactions are executed in compliance with proce-dures set forth in the policies established in each group com-pany, and transaction volumes and fair values are reported as appropriate to directors in charge.Payables, debt and deposits from customers are subject to liquidity risk (risk of being unable to pay on a due date). The risk is managed by preparing and updating monthly cash schedules and by preserving liquidity on hand.
Consideration Millions of yen
Cash (includes accounts payable) ¥27,575Total ¥27,575
14 15Mitsui Fudosan Co., Ltd. Mitsui Fudosan Co., Ltd.
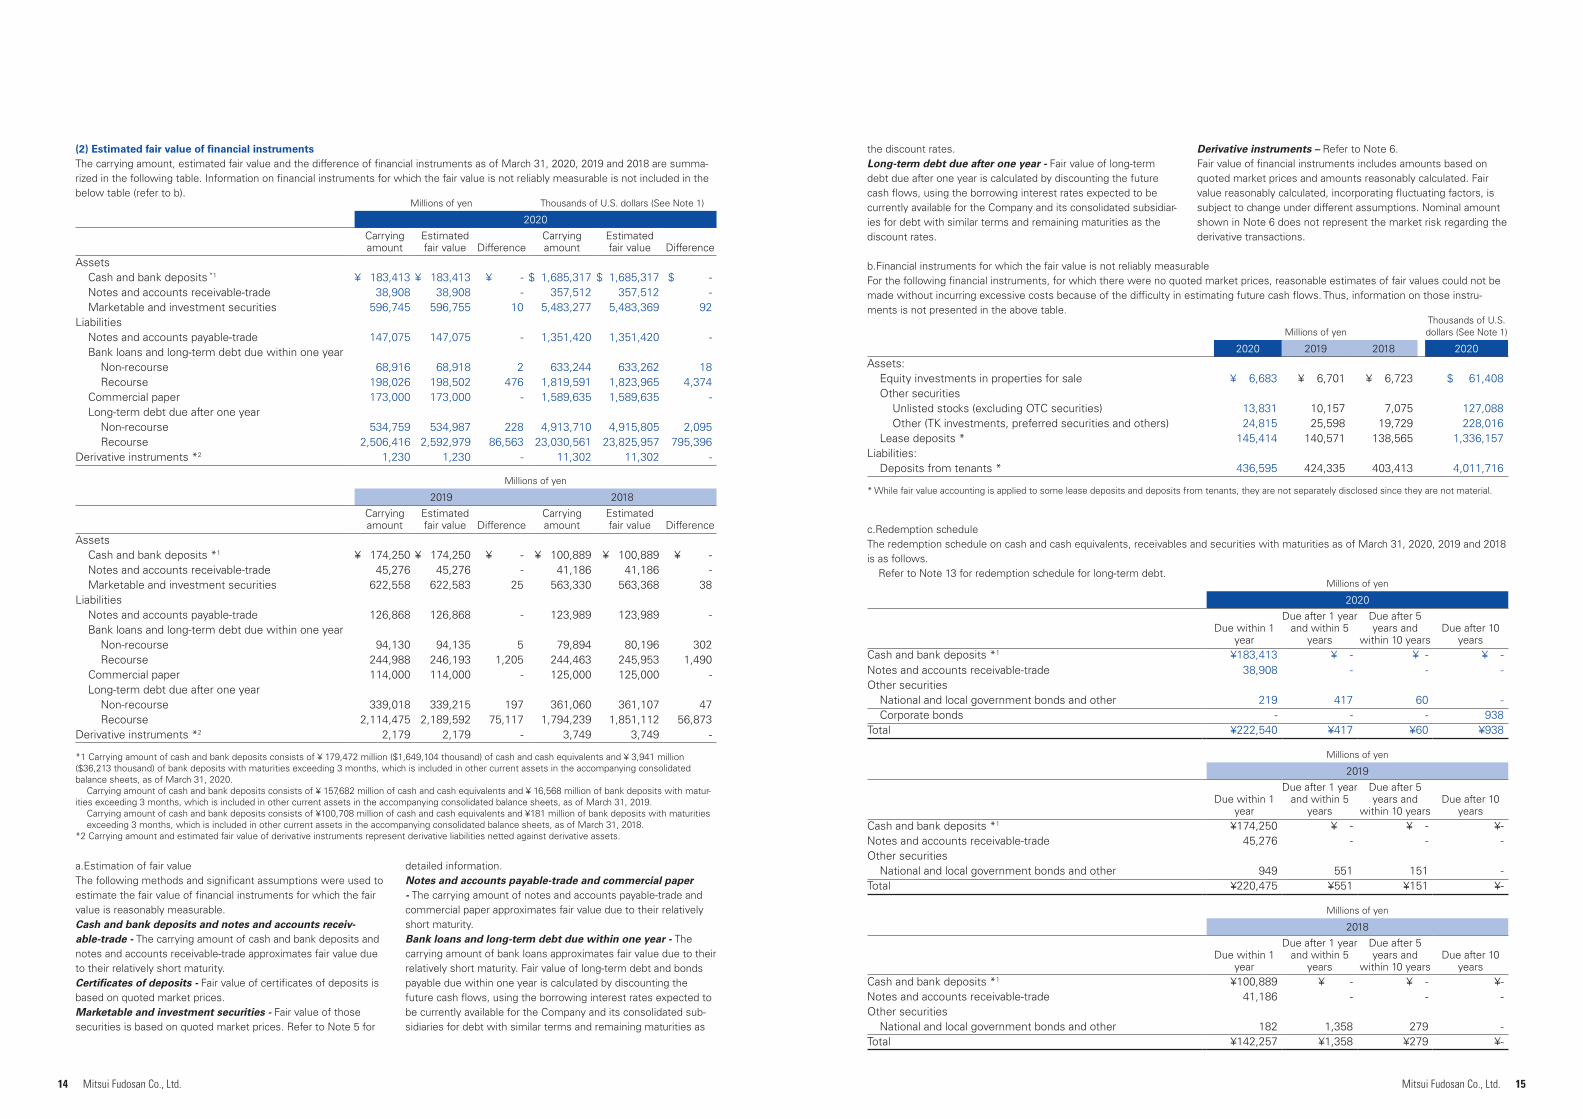
(2) Estimated fair value of financial instrumentsThe carrying amount, estimated fair value and the difference of financial instruments as of March 31, 2020, 2019 and 2018 are summa-rized in the following table. Information on financial instruments for which the fair value is not reliably measurable is not included in the below table (refer to b).
Millions of yen Thousands of U.S. dollars (See Note 1)
2020Carrying amount
Estimated fair value Difference
Carrying amount
Estimated fair value Difference
AssetsCash and bank deposits *1 ¥ 183,413 ¥ 183,413 ¥ - $ 1,685,317 $ 1,685,317 $ -Notes and accounts receivable-trade 38,908 38,908 - 357,512 357,512 -Marketable and investment securities 596,745 596,755 10 5,483,277 5,483,369 92
LiabilitiesNotes and accounts payable-trade 147,075 147,075 - 1,351,420 1,351,420 -Bank loans and long-term debt due within one year
Non-recourse 68,916 68,918 2 633,244 633,262 18Recourse 198,026 198,502 476 1,819,591 1,823,965 4,374
Commercial paper 173,000 173,000 - 1,589,635 1,589,635 -Long-term debt due after one year
Non-recourse 534,759 534,987 228 4,913,710 4,915,805 2,095Recourse 2,506,416 2,592,979 86,563 23,030,561 23,825,957 795,396
Derivative instruments *2 1,230 1,230 - 11,302 11,302 -
Millions of yen
2019 2018Carrying amount
Estimated fair value Difference
Carrying amount
Estimated fair value Difference
AssetsCash and bank deposits *1 ¥ 174,250 ¥ 174,250 ¥ - ¥ 100,889 ¥ 100,889 ¥ -Notes and accounts receivable-trade 45,276 45,276 - 41,186 41,186 -Marketable and investment securities 622,558 622,583 25 563,330 563,368 38
LiabilitiesNotes and accounts payable-trade 126,868 126,868 - 123,989 123,989 -Bank loans and long-term debt due within one year
Non-recourse 94,130 94,135 5 79,894 80,196 302Recourse 244,988 246,193 1,205 244,463 245,953 1,490
Commercial paper 114,000 114,000 - 125,000 125,000 -Long-term debt due after one year
Non-recourse 339,018 339,215 197 361,060 361,107 47Recourse 2,114,475 2,189,592 75,117 1,794,239 1,851,112 56,873
Derivative instruments *2 2,179 2,179 - 3,749 3,749 -
*1 Carrying amount of cash and bank deposits consists of ¥ 179,472 million ($1,649,104 thousand) of cash and cash equivalents and ¥ 3,941 million ($36,213 thousand) of bank deposits with maturities exceeding 3 months, which is included in other current assets in the accompanying consolidated balance sheets, as of March 31, 2020.
Carrying amount of cash and bank deposits consists of ¥ 157,682 million of cash and cash equivalents and ¥ 16,568 million of bank deposits with matur-ities exceeding 3 months, which is included in other current assets in the accompanying consolidated balance sheets, as of March 31, 2019.
Carrying amount of cash and bank deposits consists of ¥100,708 million of cash and cash equivalents and ¥181 million of bank deposits with maturities exceeding 3 months, which is included in other current assets in the accompanying consolidated balance sheets, as of March 31, 2018.
*2 Carrying amount and estimated fair value of derivative instruments represent derivative liabilities netted against derivative assets.
a.Estimation of fair valueThe following methods and significant assumptions were used to estimate the fair value of financial instruments for which the fair value is reasonably measurable.Cash and bank deposits and notes and accounts receiv-able-trade - The carrying amount of cash and bank deposits and notes and accounts receivable-trade approximates fair value due to their relatively short maturity.Certificates of deposits - Fair value of certificates of deposits is based on quoted market prices.Marketable and investment securities - Fair value of those securities is based on quoted market prices. Refer to Note 5 for
detailed information.Notes and accounts payable-trade and commercial paper - The carrying amount of notes and accounts payable-trade and commercial paper approximates fair value due to their relatively short maturity.Bank loans and long-term debt due within one year - The carrying amount of bank loans approximates fair value due to their relatively short maturity. Fair value of long-term debt and bonds payable due within one year is calculated by discounting the future cash flows, using the borrowing interest rates expected to be currently available for the Company and its consolidated sub-sidiaries for debt with similar terms and remaining maturities as
the discount rates.Long-term debt due after one year - Fair value of long-term debt due after one year is calculated by discounting the future cash flows, using the borrowing interest rates expected to be currently available for the Company and its consolidated subsidiar-ies for debt with similar terms and remaining maturities as the discount rates.
Derivative instruments – Refer to Note 6.Fair value of financial instruments includes amounts based on quoted market prices and amounts reasonably calculated. Fair value reasonably calculated, incorporating fluctuating factors, is subject to change under different assumptions. Nominal amount shown in Note 6 does not represent the market risk regarding the derivative transactions.
b.Financial instruments for which the fair value is not reliably measurableFor the following financial instruments, for which there were no quoted market prices, reasonable estimates of fair values could not be made without incurring excessive costs because of the difficulty in estimating future cash flows. Thus, information on those instru-ments is not presented in the above table.
c.Redemption schedule The redemption schedule on cash and cash equivalents, receivables and securities with maturities as of March 31, 2020, 2019 and 2018 is as follows.
Refer to Note 13 for redemption schedule for long-term debt.
Millions of yenThousands of U.S. dollars (See Note 1)
2020 2019 2018 2020Assets:
Equity investments in properties for sale ¥ 6,683 ¥ 6,701 ¥ 6,723 $ 61,408 Other securities
Unlisted stocks (excluding OTC securities) 13,831 10,157 7,075 127,088Other (TK investments, preferred securities and others) 24,815 25,598 19,729 228,016
Lease deposits * 145,414 140,571 138,565 1,336,157Liabilities:
Deposits from tenants * 436,595 424,335 403,413 4,011,716
* While fair value accounting is applied to some lease deposits and deposits from tenants, they are not separately disclosed since they are not material.
Millions of yen
2020
Due within 1 year
Due after 1 year and within 5
years
Due after 5 years and
within 10 yearsDue after 10
yearsCash and bank deposits *1 ¥183,413 ¥ - ¥ - ¥ -Notes and accounts receivable-trade 38,908 - - -Other securities
National and local government bonds and other 219 417 60 -Corporate bonds - - - 938
Total ¥222,540 ¥417 ¥60 ¥938
Millions of yen
2019
Due within 1 year
Due after 1 year and within 5
years
Due after 5 years and
within 10 yearsDue after 10
yearsCash and bank deposits *1 ¥174,250 ¥ - ¥ - ¥-Notes and accounts receivable-trade 45,276 - - -Other securities
National and local government bonds and other 949 551 151 -Total ¥220,475 ¥551 ¥151 ¥-
Millions of yen
2018
Due within 1 year
Due after 1 year and within 5
years
Due after 5 years and
within 10 yearsDue after 10
yearsCash and bank deposits *1 ¥100,889 ¥ - ¥ - ¥-Notes and accounts receivable-trade 41,186 - - -Other securities
National and local government bonds and other 182 1,358 279 -Total ¥142,257 ¥1,358 ¥279 ¥-
16 17Mitsui Fudosan Co., Ltd. Mitsui Fudosan Co., Ltd.
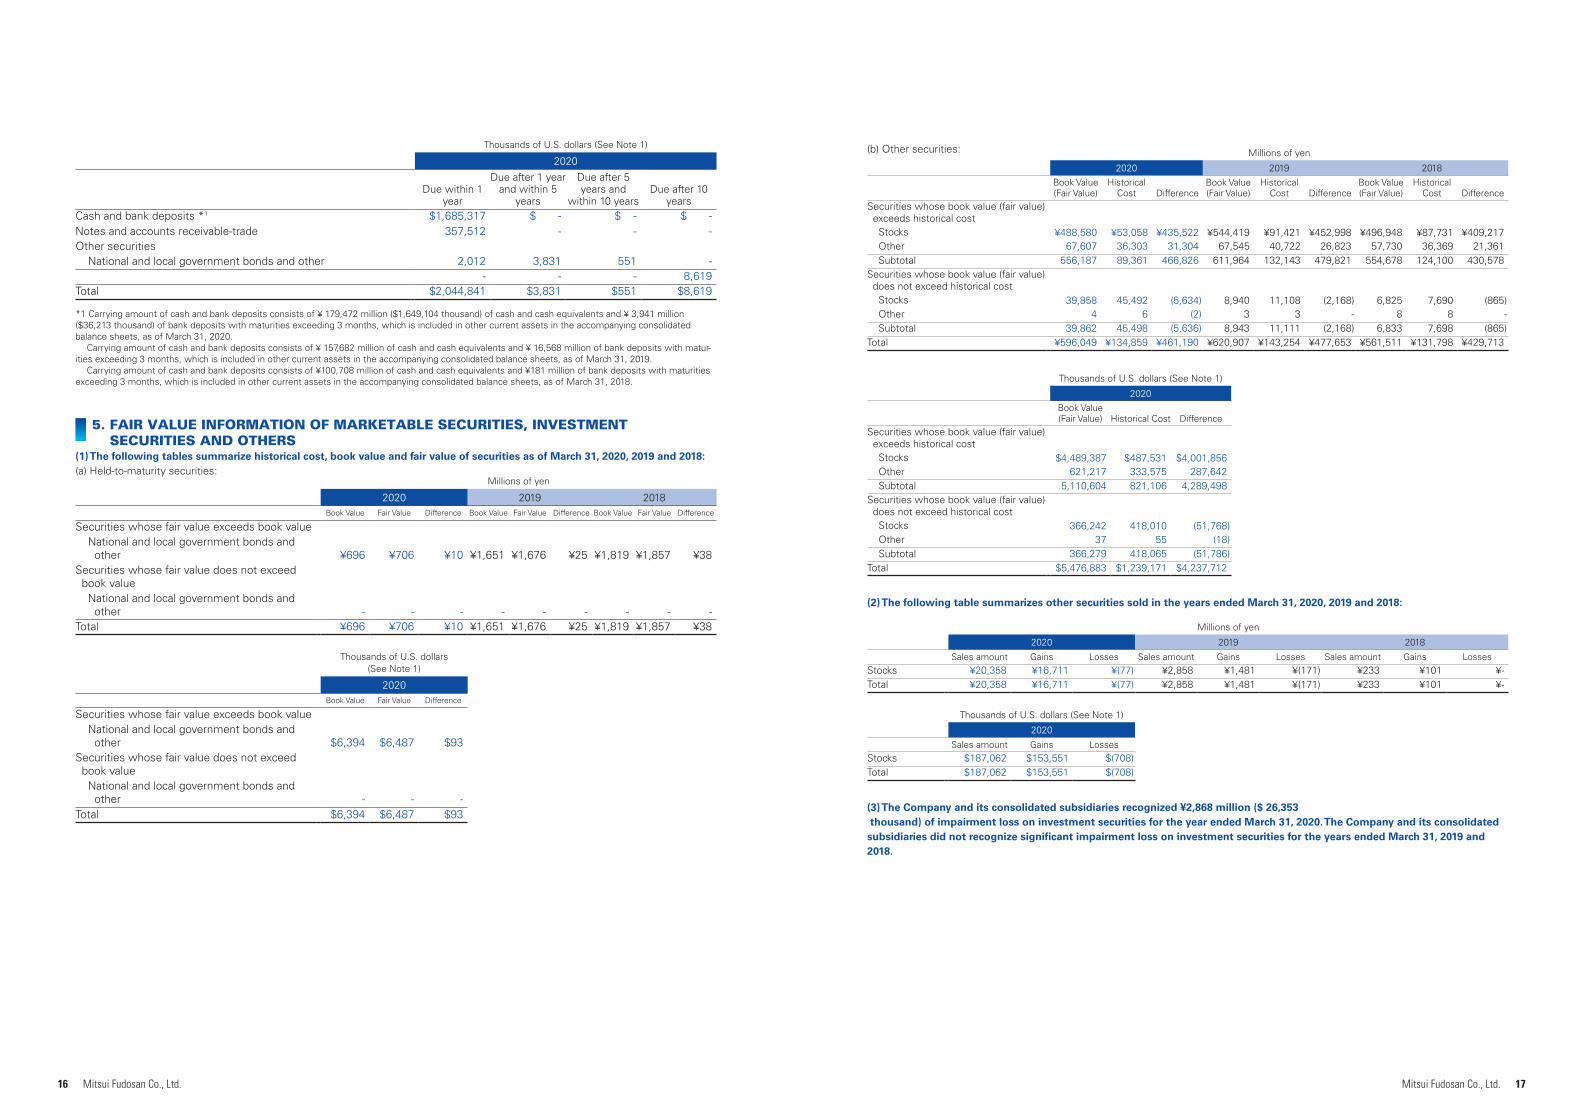
(1) The following tables summarize historical cost, book value and fair value of securities as of March 31, 2020, 2019 and 2018:(a) Held-to-maturity securities:
5. FAIR VALUE INFORMATION OF MARKETABLE SECURITIES, INVESTMENT SECURITIES AND OTHERS
Thousands of U.S. dollars (See Note 1)
2020
Due within 1 year
Due after 1 year and within 5
years
Due after 5 years and
within 10 yearsDue after 10
yearsCash and bank deposits *1 $1,685,317 $ - $ - $ -Notes and accounts receivable-trade 357,512 - - -Other securities
National and local government bonds and other 2,012 3,831 551 -- - - 8,619
Total $2,044,841 $3,831 $551 $8,619
*1 Carrying amount of cash and bank deposits consists of ¥ 179,472 million ($1,649,104 thousand) of cash and cash equivalents and ¥ 3,941 million ($36,213 thousand) of bank deposits with maturities exceeding 3 months, which is included in other current assets in the accompanying consolidated balance sheets, as of March 31, 2020.
Carrying amount of cash and bank deposits consists of ¥ 157,682 million of cash and cash equivalents and ¥ 16,568 million of bank deposits with matur-ities exceeding 3 months, which is included in other current assets in the accompanying consolidated balance sheets, as of March 31, 2019.
Carrying amount of cash and bank deposits consists of ¥100,708 million of cash and cash equivalents and ¥181 million of bank deposits with maturities exceeding 3 months, which is included in other current assets in the accompanying consolidated balance sheets, as of March 31, 2018.
Millions of yen
2020 2019 2018Book Value Fair Value Difference Book Value Fair Value Difference Book Value Fair Value Difference
Securities whose fair value exceeds book valueNational and local government bonds and
other ¥696 ¥706 ¥10 ¥1,651 ¥1,676 ¥25 ¥1,819 ¥1,857 ¥38 Securities whose fair value does not exceed
book valueNational and local government bonds and
other - - - - - - - - - Total ¥696 ¥706 ¥10 ¥1,651 ¥1,676 ¥25 ¥1,819 ¥1,857 ¥38
Thousands of U.S. dollars (See Note 1)
2020Book Value Fair Value Difference
Securities whose fair value exceeds book valueNational and local government bonds and
other $6,394 $6,487 $93 Securities whose fair value does not exceed
book valueNational and local government bonds and
other - - - Total $6,394 $6,487 $93
(b) Other securities:
(2) The following table summarizes other securities sold in the years ended March 31, 2020, 2019 and 2018:
(3) The Company and its consolidated subsidiaries recognized ¥2,868 million ($ 26,353 thousand) of impairment loss on investment securities for the year ended March 31, 2020. The Company and its consolidated subsidiaries did not recognize significant impairment loss on investment securities for the years ended March 31, 2019 and 2018.
Millions of yen
2020 2019 2018Book Value (Fair Value)
Historical Cost Difference
Book Value (Fair Value)
Historical Cost Difference
Book Value (Fair Value)
Historical Cost Difference
Securities whose book value (fair value) exceeds historical cost
Stocks ¥488,580 ¥53,058 ¥435,522 ¥544,419 ¥91,421 ¥452,998 ¥496,948 ¥87,731 ¥409,217Other 67,607 36,303 31,304 67,545 40,722 26,823 57,730 36,369 21,361Subtotal 556,187 89,361 466,826 611,964 132,143 479,821 554,678 124,100 430,578
Securities whose book value (fair value) does not exceed historical cost
Stocks 39,858 45,492 (5,634) 8,940 11,108 (2,168) 6,825 7,690 (865)Other 4 6 (2) 3 3 - 8 8 - Subtotal 39,862 45,498 (5,636) 8,943 11,111 (2,168) 6,833 7,698 (865)
Total ¥596,049 ¥134,859 ¥461,190 ¥620,907 ¥143,254 ¥477,653 ¥561,511 ¥131,798 ¥429,713
Millions of yen
2020 2019 2018
Sales amount Gains Losses Sales amount Gains Losses Sales amount Gains LossesStocks ¥20,358 ¥16,711 ¥(77) ¥2,858 ¥1,481 ¥(171) ¥233 ¥101 ¥- Total ¥20,358 ¥16,711 ¥(77) ¥2,858 ¥1,481 ¥(171) ¥233 ¥101 ¥-
Thousands of U.S. dollars (See Note 1)
2020
Sales amount Gains LossesStocks $187,062 $153,551 $(708)Total $187,062 $153,551 $(708)
Thousands of U.S. dollars (See Note 1)
2020Book Value (Fair Value) Historical Cost Difference
Securities whose book value (fair value) exceeds historical cost
Stocks $4,489,387 $487,531 $4,001,856 Other 621,217 333,575 287,642Subtotal 5,110,604 821,106 4,289,498
Securities whose book value (fair value) does not exceed historical cost
Stocks 366,242 418,010 (51,768)Other 37 55 (18)Subtotal 366,279 418,065 (51,786)
Total $5,476,883 $1,239,171 $4,237,712
18 19Mitsui Fudosan Co., Ltd. Mitsui Fudosan Co., Ltd.
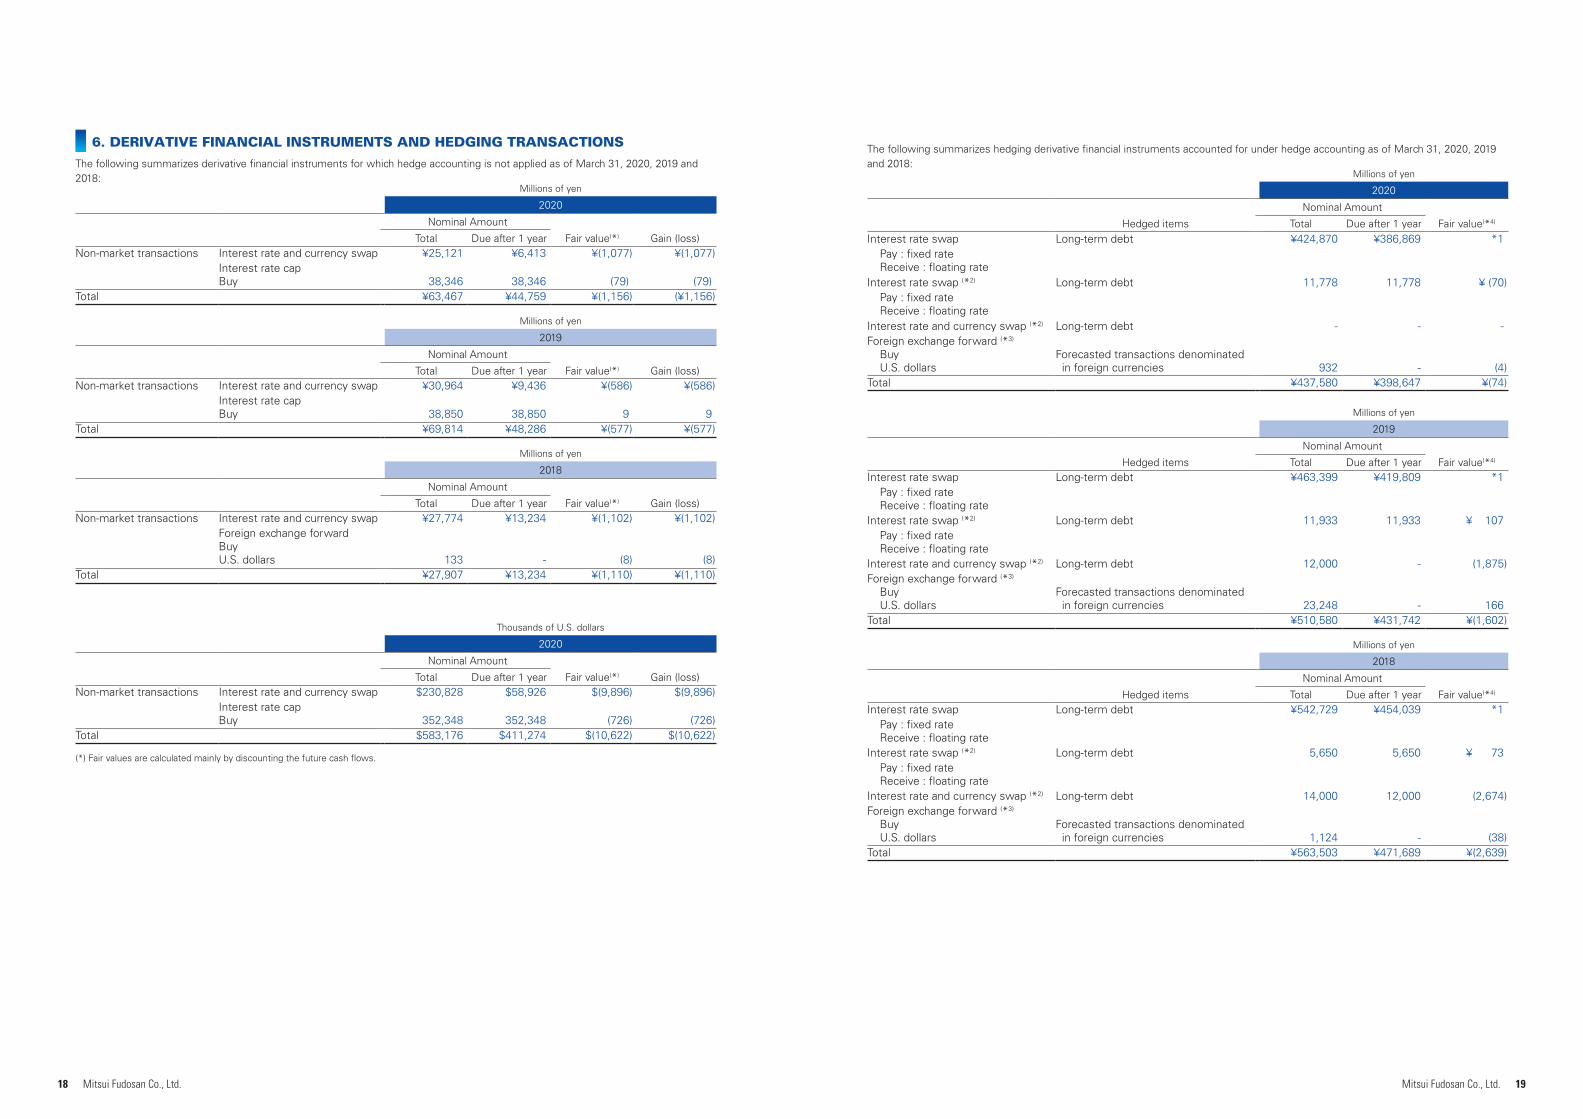
6. DERIVATIVE FINANCIAL INSTRUMENTS AND HEDGING TRANSACTIONS
The following summarizes derivative financial instruments for which hedge accounting is not applied as of March 31, 2020, 2019 and 2018:
Millions of yen
2020
Nominal Amount
Total Due after 1 year Fair value(*) Gain (loss)Non-market transactions Interest rate and currency swap ¥25,121 ¥6,413 ¥(1,077) ¥(1,077)
Interest rate capBuy 38,346 38,346 (79) (79)
Total ¥63,467 ¥44,759 ¥(1,156) (¥1,156)
Millions of yen
2019
Nominal Amount
Total Due after 1 year Fair value(*) Gain (loss)Non-market transactions Interest rate and currency swap ¥30,964 ¥9,436 ¥(586) ¥(586)
Interest rate capBuy 38,850 38,850 9 9
Total ¥69,814 ¥48,286 ¥(577) ¥(577)
Millions of yen
2018
Nominal Amount
Total Due after 1 year Fair value(*) Gain (loss)Non-market transactions Interest rate and currency swap ¥27,774 ¥13,234 ¥(1,102) ¥(1,102)
Foreign exchange forwardBuyU.S. dollars 133 - (8) (8)
Total ¥27,907 ¥13,234 ¥(1,110) ¥(1,110)
Thousands of U.S. dollars
2020
Nominal Amount
Total Due after 1 year Fair value(*) Gain (loss)Non-market transactions Interest rate and currency swap $230,828 $58,926 $(9,896) $(9,896)
Interest rate capBuy 352,348 352,348 (726) (726)
Total $583,176 $411,274 $(10,622) $(10,622)
(*) Fair values are calculated mainly by discounting the future cash flows.
The following summarizes hedging derivative financial instruments accounted for under hedge accounting as of March 31, 2020, 2019 and 2018:
Millions of yen
2020
Nominal Amount
Hedged items Total Due after 1 year Fair value(*4)
Interest rate swap Long-term debt ¥424,870 ¥386,869 *1Pay : fixed rateReceive : floating rate
Interest rate swap (*2) Long-term debt 11,778 11,778 ¥ (70)Pay : fixed rateReceive : floating rate
Interest rate and currency swap (*2) Long-term debt - - - Foreign exchange forward (*3)
BuyU.S. dollars
Forecasted transactions denominated in foreign currencies 932 - (4)
Total ¥437,580 ¥398,647 ¥(74)
Millions of yen
2019
Nominal Amount
Hedged items Total Due after 1 year Fair value(*4)
Interest rate swap Long-term debt ¥463,399 ¥419,809 *1Pay : fixed rateReceive : floating rate
Interest rate swap (*2) Long-term debt 11,933 11,933 ¥ 107Pay : fixed rateReceive : floating rate
Interest rate and currency swap (*2) Long-term debt 12,000 - (1,875)Foreign exchange forward (*3)
BuyU.S. dollars
Forecasted transactions denominated in foreign currencies 23,248 - 166
Total ¥510,580 ¥431,742 ¥(1,602)
Millions of yen
2018
Nominal Amount
Hedged items Total Due after 1 year Fair value(*4)
Interest rate swap Long-term debt ¥542,729 ¥454,039 *1Pay : fixed rateReceive : floating rate
Interest rate swap (*2) Long-term debt 5,650 5,650 ¥ 73Pay : fixed rateReceive : floating rate
Interest rate and currency swap (*2) Long-term debt 14,000 12,000 (2,674)Foreign exchange forward (*3)
BuyU.S. dollars
Forecasted transactions denominated in foreign currencies 1,124 - (38)
Total ¥563,503 ¥471,689 ¥(2,639)
20 21Mitsui Fudosan Co., Ltd. Mitsui Fudosan Co., Ltd.
Thousands of U.S. dollars (See Note 1)
2020
Nominal Amount
Hedged items Total Due after 1 year Fair value(*4)
Interest rate swap Long-term debt $3,903,978 $3,554,801 *1Pay : fixed rateReceive : floating rate
Interest rate swap (*2) Long-term debt 108,224 108,224 ($643)Pay : fixed rateReceive : floating rate
Interest rate and currency swap (*2) Long-term debt - - -Foreign exchange forward (*3)
BuyU.S. dollars
Forecasted transactions denominated in foreign currencies 8,564 - (37)
Total $4,020,766 $3,663,025 ($680)
*1: The net amount to be paid or received under the interest rate swap contract is added to or deducted from the interest on the assets or liabilities for which the swap contract was executed. Thus, the fair value of the interest rate swap is included in the fair value of long-term debt including those due within one year.
*2: Recognition of gains or losses resulting from changes in fair value of interest rate swap contracts and foreign currency swap contracts are deferred until the related losses or gains on the hedged items are recognized.
*3: Future transactions denominated in foreign currencies will be recorded using the contracted forward rate, and no gains and losses on the foreign exchange forward contract are recognized.
*4: Fair values are calculated mainly by discounting the future cash flows.
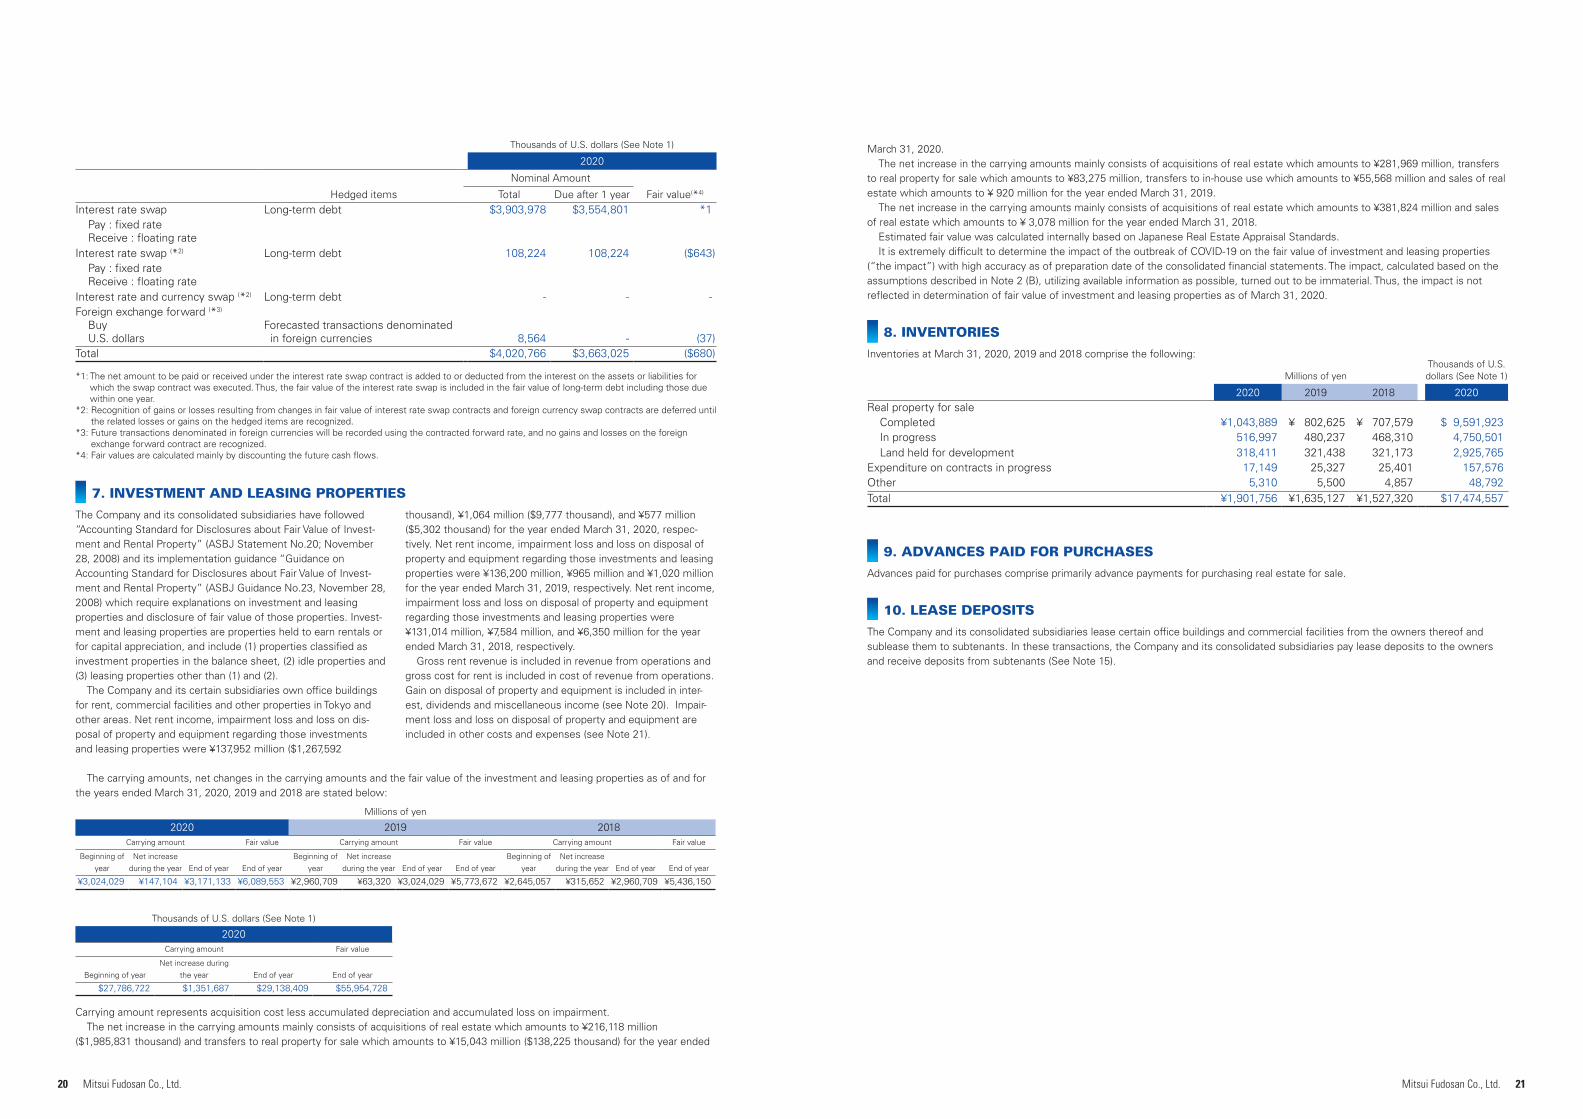
7. INVESTMENT AND LEASING PROPERTIES
The Company and its consolidated subsidiaries have followed “Accounting Standard for Disclosures about Fair Value of Invest-ment and Rental Property” (ASBJ Statement No.20; November 28, 2008) and its implementation guidance “Guidance on Accounting Standard for Disclosures about Fair Value of Invest-ment and Rental Property” (ASBJ Guidance No.23, November 28, 2008) which require explanations on investment and leasing properties and disclosure of fair value of those properties. Invest-ment and leasing properties are properties held to earn rentals or for capital appreciation, and include (1) properties classified as investment properties in the balance sheet, (2) idle properties and (3) leasing properties other than (1) and (2).
The Company and its certain subsidiaries own office buildings for rent, commercial facilities and other properties in Tokyo and other areas. Net rent income, impairment loss and loss on dis-posal of property and equipment regarding those investments and leasing properties were ¥137,952 million ($1,267,592
thousand), ¥1,064 million ($9,777 thousand), and ¥577 million ($5,302 thousand) for the year ended March 31, 2020, respec-tively. Net rent income, impairment loss and loss on disposal of property and equipment regarding those investments and leasing properties were ¥136,200 million, ¥965 million and ¥1,020 million for the year ended March 31, 2019, respectively. Net rent income, impairment loss and loss on disposal of property and equipment regarding those investments and leasing properties were ¥131,014 million, ¥7,584 million, and ¥6,350 million for the year ended March 31, 2018, respectively.
Gross rent revenue is included in revenue from operations and gross cost for rent is included in cost of revenue from operations. Gain on disposal of property and equipment is included in inter-est, dividends and miscellaneous income (see Note 20). Impair-ment loss and loss on disposal of property and equipment are included in other costs and expenses (see Note 21).
The carrying amounts, net changes in the carrying amounts and the fair value of the investment and leasing properties as of and for the years ended March 31, 2020, 2019 and 2018 are stated below:
Carrying amount represents acquisition cost less accumulated depreciation and accumulated loss on impairment.The net increase in the carrying amounts mainly consists of acquisitions of real estate which amounts to ¥216,118 million
($1,985,831 thousand) and transfers to real property for sale which amounts to ¥15,043 million ($138,225 thousand) for the year ended
Millions of yen
2020 2019 2018Carrying amount Fair value Carrying amount Fair value Carrying amount Fair value
Beginning of year
Net increase during the year End of year End of year
Beginning of year
Net increase during the year End of year End of year
Beginning of year
Net increase during the year End of year End of year
¥3,024,029 ¥147,104 ¥3,171,133 ¥6,089,553 ¥2,960,709 ¥63,320 ¥3,024,029 ¥5,773,672 ¥2,645,057 ¥315,652 ¥2,960,709 ¥5,436,150
Thousands of U.S. dollars (See Note 1)
2020Carrying amount Fair value
Beginning of yearNet increase during
the year End of year End of year
$27,786,722 $1,351,687 $29,138,409 $55,954,728
March 31, 2020.The net increase in the carrying amounts mainly consists of acquisitions of real estate which amounts to ¥281,969 million, transfers
to real property for sale which amounts to ¥83,275 million, transfers to in-house use which amounts to ¥55,568 million and sales of real estate which amounts to ¥ 920 million for the year ended March 31, 2019.
The net increase in the carrying amounts mainly consists of acquisitions of real estate which amounts to ¥381,824 million and sales of real estate which amounts to ¥ 3,078 million for the year ended March 31, 2018.
Estimated fair value was calculated internally based on Japanese Real Estate Appraisal Standards. It is extremely difficult to determine the impact of the outbreak of COVID-19 on the fair value of investment and leasing properties
(“the impact”) with high accuracy as of preparation date of the consolidated financial statements. The impact, calculated based on the assumptions described in Note 2 (B), utilizing available information as possible, turned out to be immaterial. Thus, the impact is not reflected in determination of fair value of investment and leasing properties as of March 31, 2020.
8. INVENTORIES
Inventories at March 31, 2020, 2019 and 2018 comprise the following:
9. ADVANCES PAID FOR PURCHASES
Advances paid for purchases comprise primarily advance payments for purchasing real estate for sale.
10. LEASE DEPOSITS
The Company and its consolidated subsidiaries lease certain office buildings and commercial facilities from the owners thereof and sublease them to subtenants. In these transactions, the Company and its consolidated subsidiaries pay lease deposits to the owners and receive deposits from subtenants (See Note 15).
Millions of yenThousands of U.S. dollars (See Note 1)
2020 2019 2018 2020Real property for sale
Completed ¥1,043,889 ¥ 802,625 ¥ 707,579 $ 9,591,923 In progress 516,997 480,237 468,310 4,750,501Land held for development 318,411 321,438 321,173 2,925,765
Expenditure on contracts in progress 17,149 25,327 25,401 157,576Other 5,310 5,500 4,857 48,792Total ¥1,901,756 ¥1,635,127 ¥1,527,320 $17,474,557
22 23Mitsui Fudosan Co., Ltd. Mitsui Fudosan Co., Ltd.
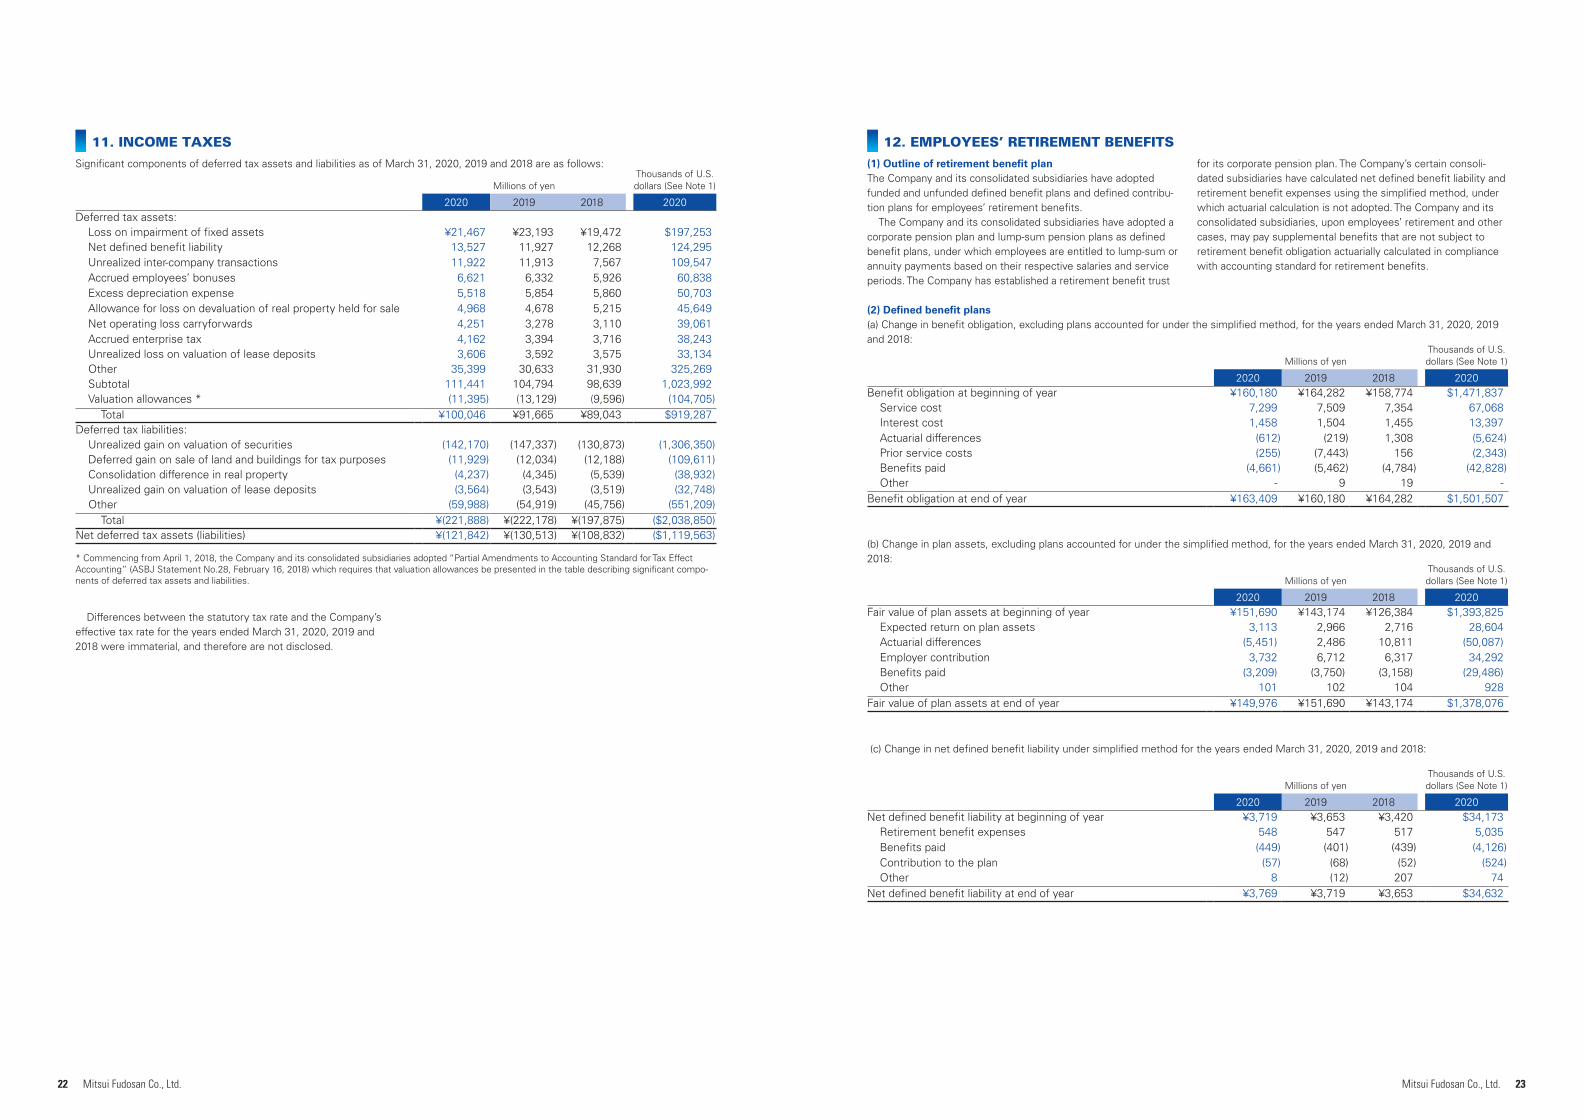
11. INCOME TAXES
Significant components of deferred tax assets and liabilities as of March 31, 2020, 2019 and 2018 are as follows:
Millions of yenThousands of U.S. dollars (See Note 1)
2020 2019 2018 2020Deferred tax assets:
Loss on impairment of fixed assets ¥21,467 ¥23,193 ¥19,472 $197,253 Net defined benefit liability 13,527 11,927 12,268 124,295Unrealized inter-company transactions 11,922 11,913 7,567 109,547Accrued employees’ bonuses 6,621 6,332 5,926 60,838Excess depreciation expense 5,518 5,854 5,860 50,703Allowance for loss on devaluation of real property held for sale 4,968 4,678 5,215 45,649Net operating loss carryforwards 4,251 3,278 3,110 39,061Accrued enterprise tax 4,162 3,394 3,716 38,243Unrealized loss on valuation of lease deposits 3,606 3,592 3,575 33,134Other 35,399 30,633 31,930 325,269Subtotal 111,441 104,794 98,639 1,023,992Valuation allowances * (11,395) (13,129) (9,596) (104,705)
Total ¥100,046 ¥91,665 ¥89,043 $919,287 Deferred tax liabilities:
Unrealized gain on valuation of securities (142,170) (147,337) (130,873) (1,306,350)Deferred gain on sale of land and buildings for tax purposes (11,929) (12,034) (12,188) (109,611)Consolidation difference in real property (4,237) (4,345) (5,539) (38,932)Unrealized gain on valuation of lease deposits (3,564) (3,543) (3,519) (32,748)Other (59,988) (54,919) (45,756) (551,209)
Total ¥(221,888) ¥(222,178) ¥(197,875) ($2,038,850)Net deferred tax assets (liabilities) ¥(121,842) ¥(130,513) ¥(108,832) ($1,119,563)
* Commencing from April 1, 2018, the Company and its consolidated subsidiaries adopted “Partial Amendments to Accounting Standard for Tax Effect Accounting” (ASBJ Statement No.28, February 16, 2018) which requires that valuation allowances be presented in the table describing significant compo-nents of deferred tax assets and liabilities.
Differences between the statutory tax rate and the Company’s effective tax rate for the years ended March 31, 2020, 2019 and 2018 were immaterial, and therefore are not disclosed.
Millions of yenThousands of U.S. dollars (See Note 1)
2020 2019 2018 2020Benefit obligation at beginning of year ¥160,180 ¥164,282 ¥158,774 $1,471,837
Service cost 7,299 7,509 7,354 67,068 Interest cost 1,458 1,504 1,455 13,397 Actuarial differences (612) (219) 1,308 (5,624)Prior service costs (255) (7,443) 156 (2,343)Benefits paid (4,661) (5,462) (4,784) (42,828)Other - 9 19 -
Benefit obligation at end of year ¥163,409 ¥160,180 ¥164,282 $1,501,507
Millions of yenThousands of U.S. dollars (See Note 1)
2020 2019 2018 2020Fair value of plan assets at beginning of year ¥151,690 ¥143,174 ¥126,384 $1,393,825
Expected return on plan assets 3,113 2,966 2,716 28,604 Actuarial differences (5,451) 2,486 10,811 (50,087)Employer contribution 3,732 6,712 6,317 34,292 Benefits paid (3,209) (3,750) (3,158) (29,486)Other 101 102 104 928
Fair value of plan assets at end of year ¥149,976 ¥151,690 ¥143,174 $1,378,076
(2) Defined benefit plans(a) Change in benefit obligation, excluding plans accounted for under the simplified method, for the years ended March 31, 2020, 2019 and 2018:
(b) Change in plan assets, excluding plans accounted for under the simplified method, for the years ended March 31, 2020, 2019 and 2018:
12. EMPLOYEES’ RETIREMENT BENEFITS
(1) Outline of retirement benefit planThe Company and its consolidated subsidiaries have adopted funded and unfunded defined benefit plans and defined contribu-tion plans for employees’ retirement benefits.
The Company and its consolidated subsidiaries have adopted a corporate pension plan and lump-sum pension plans as defined benefit plans, under which employees are entitled to lump-sum or annuity payments based on their respective salaries and service periods. The Company has established a retirement benefit trust
for its corporate pension plan. The Company’s certain consoli-dated subsidiaries have calculated net defined benefit liability and retirement benefit expenses using the simplified method, under which actuarial calculation is not adopted. The Company and its consolidated subsidiaries, upon employees’ retirement and other cases, may pay supplemental benefits that are not subject to retirement benefit obligation actuarially calculated in compliance with accounting standard for retirement benefits.
(c) Change in net defined benefit liability under simplified method for the years ended March 31, 2020, 2019 and 2018:
Millions of yenThousands of U.S. dollars (See Note 1)
2020 2019 2018 2020Net defined benefit liability at beginning of year ¥3,719 ¥3,653 ¥3,420 $34,173
Retirement benefit expenses 548 547 517 5,035 Benefits paid (449) (401) (439) (4,126)Contribution to the plan (57) (68) (52) (524)Other 8 (12) 207 74
Net defined benefit liability at end of year ¥3,769 ¥3,719 ¥3,653 $34,632
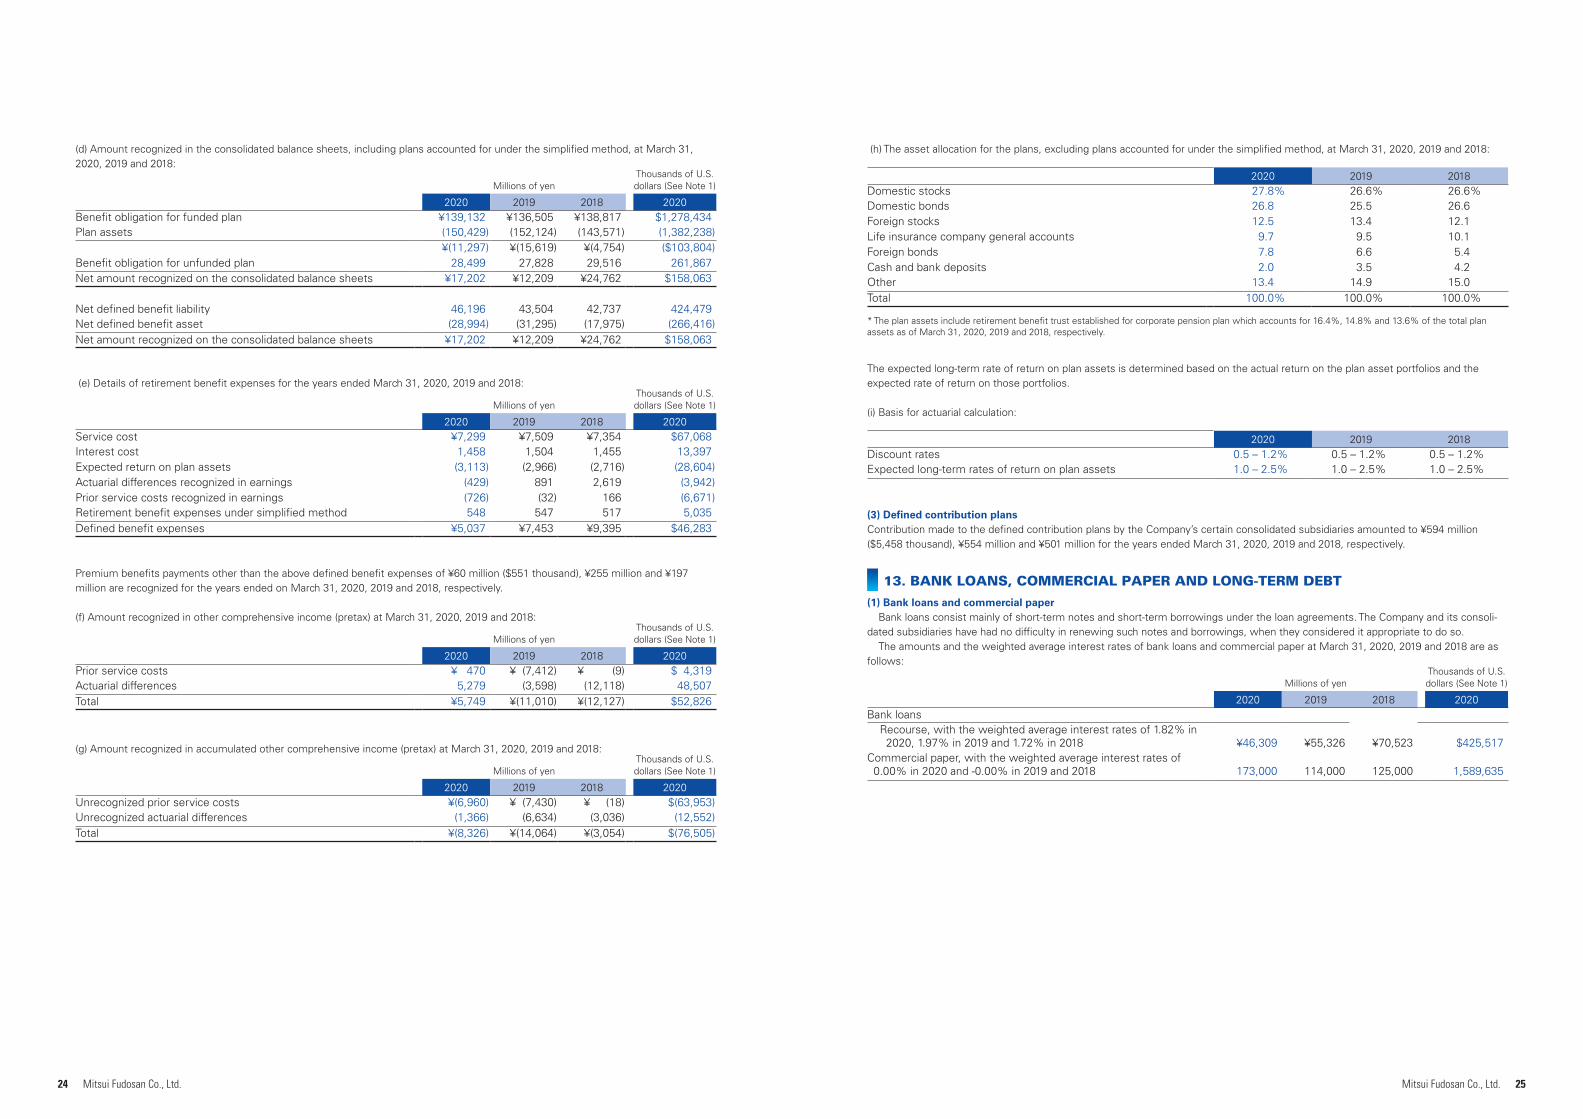
24 25Mitsui Fudosan Co., Ltd. Mitsui Fudosan Co., Ltd.
Millions of yenThousands of U.S. dollars (See Note 1)
2020 2019 2018 2020Benefit obligation for funded plan ¥139,132 ¥136,505 ¥138,817 $1,278,434 Plan assets (150,429) (152,124) (143,571) (1,382,238)
¥(11,297) ¥(15,619) ¥(4,754) ($103,804)Benefit obligation for unfunded plan 28,499 27,828 29,516 261,867 Net amount recognized on the consolidated balance sheets ¥17,202 ¥12,209 ¥24,762 $158,063
Net defined benefit liability 46,196 43,504 42,737 424,479 Net defined benefit asset (28,994) (31,295) (17,975) (266,416)Net amount recognized on the consolidated balance sheets ¥17,202 ¥12,209 ¥24,762 $158,063
(d) Amount recognized in the consolidated balance sheets, including plans accounted for under the simplified method, at March 31, 2020, 2019 and 2018:
Millions of yenThousands of U.S. dollars (See Note 1)
2020 2019 2018 2020Service cost ¥7,299 ¥7,509 ¥7,354 $67,068 Interest cost 1,458 1,504 1,455 13,397 Expected return on plan assets (3,113) (2,966) (2,716) (28,604)Actuarial differences recognized in earnings (429) 891 2,619 (3,942)Prior service costs recognized in earnings (726) (32) 166 (6,671)Retirement benefit expenses under simplified method 548 547 517 5,035 Defined benefit expenses ¥5,037 ¥7,453 ¥9,395 $46,283
Millions of yenThousands of U.S. dollars (See Note 1)
2020 2019 2018 2020Prior service costs ¥ 470 ¥ (7,412) ¥ (9) $ 4,319 Actuarial differences 5,279 (3,598) (12,118) 48,507 Total ¥5,749 ¥(11,010) ¥(12,127) $52,826
Millions of yenThousands of U.S. dollars (See Note 1)
2020 2019 2018 2020Unrecognized prior service costs ¥(6,960) ¥ (7,430) ¥ (18) $(63,953)Unrecognized actuarial differences (1,366) (6,634) (3,036) (12,552)Total ¥(8,326) ¥(14,064) ¥(3,054) $(76,505)
(e) Details of retirement benefit expenses for the years ended March 31, 2020, 2019 and 2018:
Premium benefits payments other than the above defined benefit expenses of ¥60 million ($551 thousand), ¥255 million and ¥197 million are recognized for the years ended on March 31, 2020, 2019 and 2018, respectively.
(f) Amount recognized in other comprehensive income (pretax) at March 31, 2020, 2019 and 2018:
(g) Amount recognized in accumulated other comprehensive income (pretax) at March 31, 2020, 2019 and 2018:
2020 2019 2018Domestic stocks 27.8% 26.6% 26.6%Domestic bonds 26.8 25.5 26.6Foreign stocks 12.5 13.4 12.1Life insurance company general accounts 9.7 9.5 10.1Foreign bonds 7.8 6.6 5.4Cash and bank deposits 2.0 3.5 4.2Other 13.4 14.9 15.0Total 100.0% 100.0% 100.0%
* The plan assets include retirement benefit trust established for corporate pension plan which accounts for 16.4%, 14.8% and 13.6% of the total plan assets as of March 31, 2020, 2019 and 2018, respectively.
2020 2019 2018Discount rates 0.5 – 1.2% 0.5 – 1.2% 0.5 – 1.2%Expected long-term rates of return on plan assets 1.0 – 2.5% 1.0 – 2.5% 1.0 – 2.5%
Millions of yenThousands of U.S. dollars (See Note 1)
2020 2019 2018 2020Bank loans
Recourse, with the weighted average interest rates of 1.82% in 2020, 1.97% in 2019 and 1.72% in 2018 ¥46,309 ¥55,326 ¥70,523 $425,517
Commercial paper, with the weighted average interest rates of 0.00% in 2020 and -0.00% in 2019 and 2018 173,000 114,000 125,000 1,589,635
(h) The asset allocation for the plans, excluding plans accounted for under the simplified method, at March 31, 2020, 2019 and 2018:
The expected long-term rate of return on plan assets is determined based on the actual return on the plan asset portfolios and the expected rate of return on those portfolios.
(i) Basis for actuarial calculation:
(3) Defined contribution plansContribution made to the defined contribution plans by the Company’s certain consolidated subsidiaries amounted to ¥594 million ($5,458 thousand), ¥554 million and ¥501 million for the years ended March 31, 2020, 2019 and 2018, respectively.
13. BANK LOANS, COMMERCIAL PAPER AND LONG-TERM DEBT
(1) Bank loans and commercial paperBank loans consist mainly of short-term notes and short-term borrowings under the loan agreements. The Company and its consoli-
dated subsidiaries have had no difficulty in renewing such notes and borrowings, when they considered it appropriate to do so.The amounts and the weighted average interest rates of bank loans and commercial paper at March 31, 2020, 2019 and 2018 are as
follows:
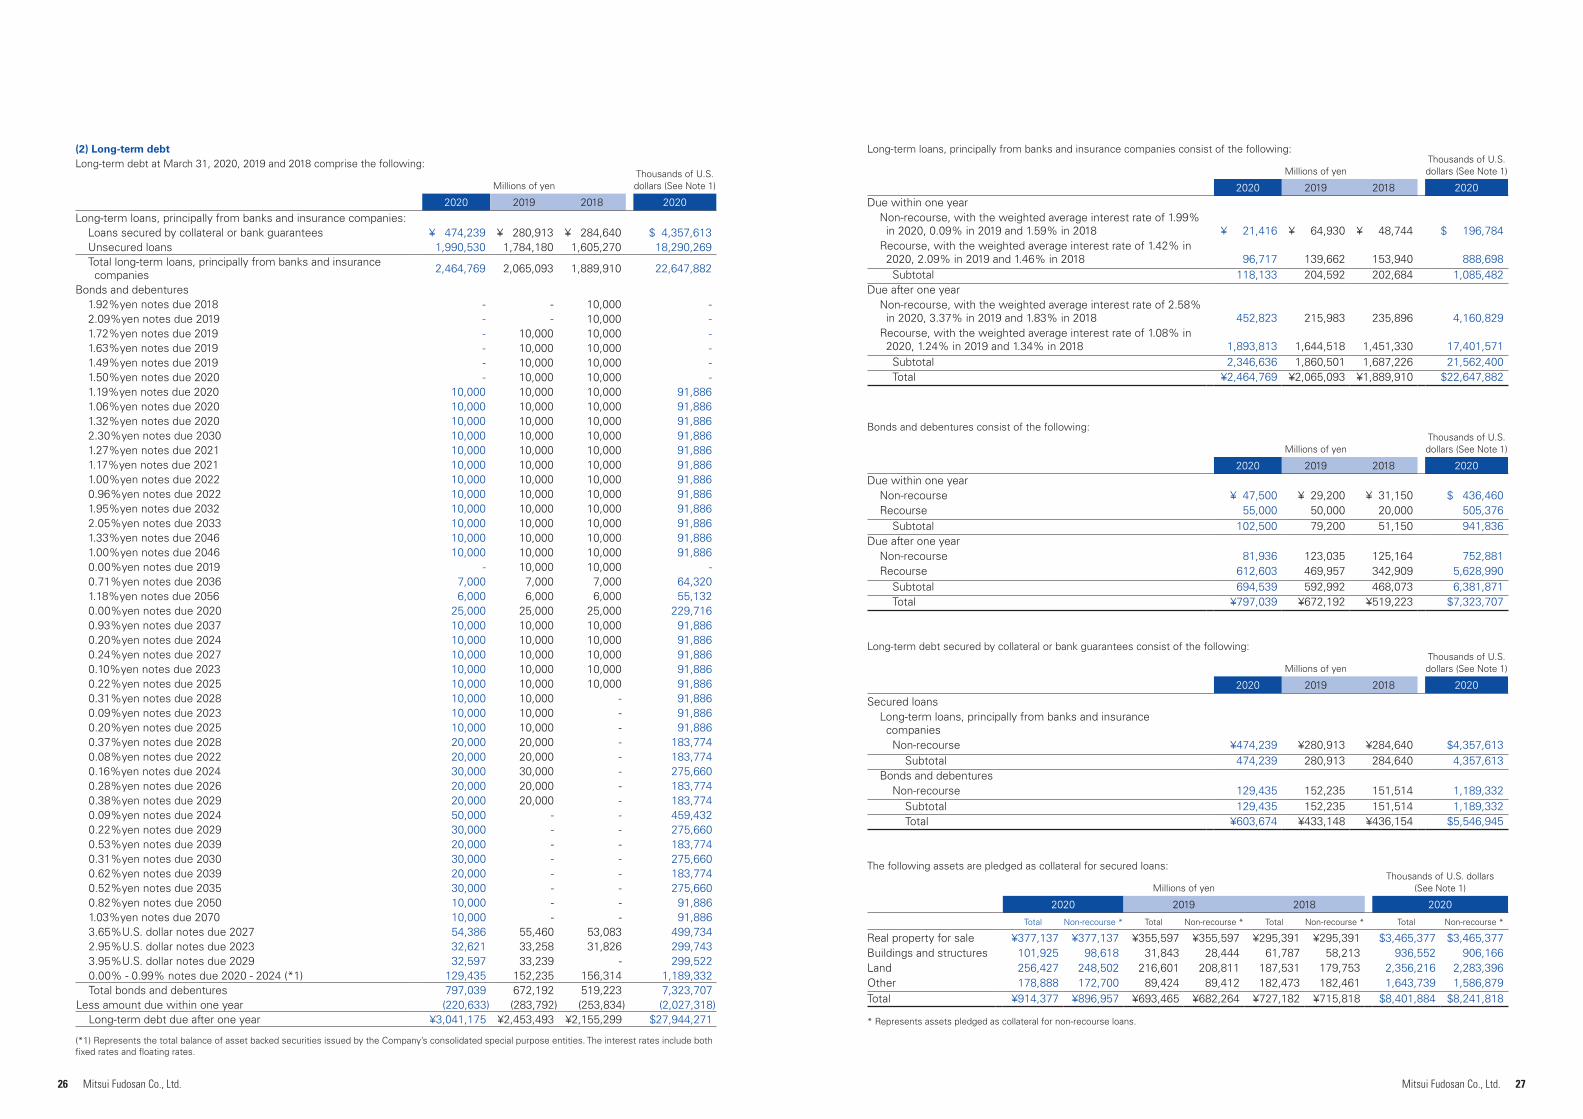
26 27Mitsui Fudosan Co., Ltd. Mitsui Fudosan Co., Ltd.
Millions of yenThousands of U.S. dollars (See Note 1)
2020 2019 2018 2020Long-term loans, principally from banks and insurance companies:
Loans secured by collateral or bank guarantees ¥ 474,239 ¥ 280,913 ¥ 284,640 $ 4,357,613 Unsecured loans 1,990,530 1,784,180 1,605,270 18,290,269 Total long-term loans, principally from banks and insurance
companies 2,464,769 2,065,093 1,889,910 22,647,882
Bonds and debentures1.92%yen notes due 2018 - - 10,000 -2.09%yen notes due 2019 - - 10,000 -1.72%yen notes due 2019 - 10,000 10,000 -1.63%yen notes due 2019 - 10,000 10,000 -1.49%yen notes due 2019 - 10,000 10,000 -1.50%yen notes due 2020 - 10,000 10,000 -1.19%yen notes due 2020 10,000 10,000 10,000 91,8861.06%yen notes due 2020 10,000 10,000 10,000 91,8861.32%yen notes due 2020 10,000 10,000 10,000 91,8862.30%yen notes due 2030 10,000 10,000 10,000 91,8861.27%yen notes due 2021 10,000 10,000 10,000 91,8861.17%yen notes due 2021 10,000 10,000 10,000 91,8861.00%yen notes due 2022 10,000 10,000 10,000 91,8860.96%yen notes due 2022 10,000 10,000 10,000 91,8861.95%yen notes due 2032 10,000 10,000 10,000 91,8862.05%yen notes due 2033 10,000 10,000 10,000 91,8861.33%yen notes due 2046 10,000 10,000 10,000 91,8861.00%yen notes due 2046 10,000 10,000 10,000 91,8860.00%yen notes due 2019 - 10,000 10,000 -0.71%yen notes due 2036 7,000 7,000 7,000 64,3201.18%yen notes due 2056 6,000 6,000 6,000 55,1320.00%yen notes due 2020 25,000 25,000 25,000 229,7160.93%yen notes due 2037 10,000 10,000 10,000 91,8860.20%yen notes due 2024 10,000 10,000 10,000 91,8860.24%yen notes due 2027 10,000 10,000 10,000 91,8860.10%yen notes due 2023 10,000 10,000 10,000 91,8860.22%yen notes due 2025 10,000 10,000 10,000 91,8860.31%yen notes due 2028 10,000 10,000 - 91,8860.09%yen notes due 2023 10,000 10,000 - 91,8860.20%yen notes due 2025 10,000 10,000 - 91,8860.37%yen notes due 2028 20,000 20,000 - 183,7740.08%yen notes due 2022 20,000 20,000 - 183,7740.16%yen notes due 2024 30,000 30,000 - 275,6600.28%yen notes due 2026 20,000 20,000 - 183,7740.38%yen notes due 2029 20,000 20,000 - 183,7740.09%yen notes due 2024 50,000 - - 459,4320.22%yen notes due 2029 30,000 - - 275,6600.53%yen notes due 2039 20,000 - - 183,7740.31%yen notes due 2030 30,000 - - 275,6600.62%yen notes due 2039 20,000 - - 183,7740.52%yen notes due 2035 30,000 - - 275,6600.82%yen notes due 2050 10,000 - - 91,8861.03%yen notes due 2070 10,000 - - 91,8863.65%U.S. dollar notes due 2027 54,386 55,460 53,083 499,7342.95%U.S. dollar notes due 2023 32,621 33,258 31,826 299,7433.95%U.S. dollar notes due 2029 32,597 33,239 - 299,5220.00% - 0.99% notes due 2020 - 2024 (*1) 129,435 152,235 156,314 1,189,332Total bonds and debentures 797,039 672,192 519,223 7,323,707
Less amount due within one year (220,633) (283,792) (253,834) (2,027,318)Long-term debt due after one year ¥3,041,175 ¥2,453,493 ¥2,155,299 $27,944,271
(*1) Represents the total balance of asset backed securities issued by the Company’s consolidated special purpose entities. The interest rates include both fixed rates and floating rates.
(2) Long-term debtLong-term debt at March 31, 2020, 2019 and 2018 comprise the following:
Millions of yenThousands of U.S. dollars (See Note 1)
2020 2019 2018 2020Due within one year
Non-recourse, with the weighted average interest rate of 1.99% in 2020, 0.09% in 2019 and 1.59% in 2018 ¥ 21,416 ¥ 64,930 ¥ 48,744 $ 196,784
Recourse, with the weighted average interest rate of 1.42% in 2020, 2.09% in 2019 and 1.46% in 2018 96,717 139,662 153,940 888,698
Subtotal 118,133 204,592 202,684 1,085,482Due after one year
Non-recourse, with the weighted average interest rate of 2.58% in 2020, 3.37% in 2019 and 1.83% in 2018 452,823 215,983 235,896 4,160,829
Recourse, with the weighted average interest rate of 1.08% in 2020, 1.24% in 2019 and 1.34% in 2018 1,893,813 1,644,518 1,451,330 17,401,571
Subtotal 2,346,636 1,860,501 1,687,226 21,562,400Total ¥2,464,769 ¥2,065,093 ¥1,889,910 $22,647,882
Millions of yenThousands of U.S. dollars (See Note 1)
2020 2019 2018 2020Due within one year
Non-recourse ¥ 47,500 ¥ 29,200 ¥ 31,150 $ 436,460Recourse 55,000 50,000 20,000 505,376
Subtotal 102,500 79,200 51,150 941,836Due after one year
Non-recourse 81,936 123,035 125,164 752,881Recourse 612,603 469,957 342,909 5,628,990
Subtotal 694,539 592,992 468,073 6,381,871Total ¥797,039 ¥672,192 ¥519,223 $7,323,707
Millions of yenThousands of U.S. dollars (See Note 1)
2020 2019 2018 2020
Secured loansLong-term loans, principally from banks and insurance
companiesNon-recourse ¥474,239 ¥280,913 ¥284,640 $4,357,613
Subtotal 474,239 280,913 284,640 4,357,613Bonds and debentures
Non-recourse 129,435 152,235 151,514 1,189,332Subtotal 129,435 152,235 151,514 1,189,332Total ¥603,674 ¥433,148 ¥436,154 $5,546,945
Millions of yenThousands of U.S. dollars
(See Note 1)
2020 2019 2018 2020
Total Non-recourse * Total Non-recourse * Total Non-recourse * Total Non-recourse *
Real property for sale ¥377,137 ¥377,137 ¥355,597 ¥355,597 ¥295,391 ¥295,391 $3,465,377 $3,465,377Buildings and structures 101,925 98,618 31,843 28,444 61,787 58,213 936,552 906,166Land 256,427 248,502 216,601 208,811 187,531 179,753 2,356,216 2,283,396Other 178,888 172,700 89,424 89,412 182,473 182,461 1,643,739 1,586,879Total ¥914,377 ¥896,957 ¥693,465 ¥682,264 ¥727,182 ¥715,818 $8,401,884 $8,241,818
* Represents assets pledged as collateral for non-recourse loans.
Long-term loans, principally from banks and insurance companies consist of the following:
Bonds and debentures consist of the following:
Long-term debt secured by collateral or bank guarantees consist of the following:
The following assets are pledged as collateral for secured loans:
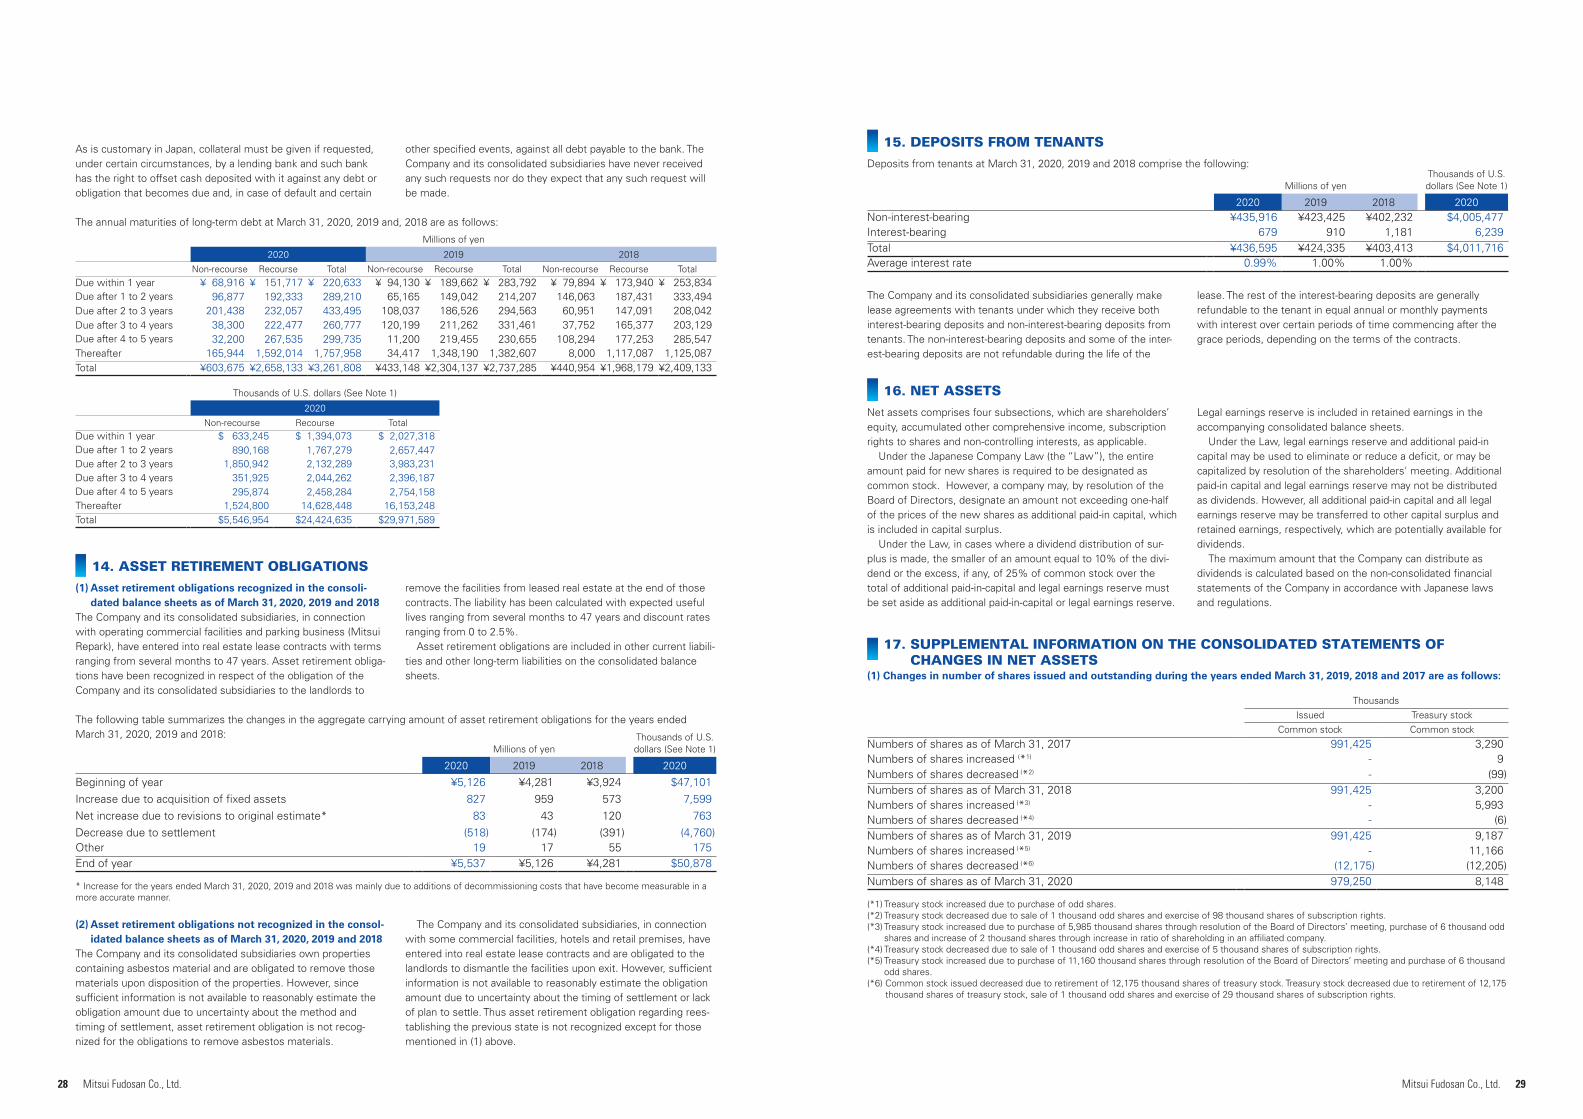
28 29Mitsui Fudosan Co., Ltd. Mitsui Fudosan Co., Ltd.
As is customary in Japan, collateral must be given if requested, under certain circumstances, by a lending bank and such bank has the right to offset cash deposited with it against any debt or obligation that becomes due and, in case of default and certain
other specified events, against all debt payable to the bank. The Company and its consolidated subsidiaries have never received any such requests nor do they expect that any such request will be made.
The annual maturities of long-term debt at March 31, 2020, 2019 and, 2018 are as follows:
The following table summarizes the changes in the aggregate carrying amount of asset retirement obligations for the years ended March 31, 2020, 2019 and 2018:
(2) Asset retirement obligations not recognized in the consol-idated balance sheets as of March 31, 2020, 2019 and 2018
The Company and its consolidated subsidiaries own properties containing asbestos material and are obligated to remove those materials upon disposition of the properties. However, since sufficient information is not available to reasonably estimate the obligation amount due to uncertainty about the method and timing of settlement, asset retirement obligation is not recog-nized for the obligations to remove asbestos materials.
The Company and its consolidated subsidiaries, in connection with some commercial facilities, hotels and retail premises, have entered into real estate lease contracts and are obligated to the landlords to dismantle the facilities upon exit. However, sufficient information is not available to reasonably estimate the obligation amount due to uncertainty about the timing of settlement or lack of plan to settle. Thus asset retirement obligation regarding rees-tablishing the previous state is not recognized except for those mentioned in (1) above.
Millions of yen
2020 2019 2018
Non-recourse Recourse Total Non-recourse Recourse Total Non-recourse Recourse TotalDue within 1 year ¥ 68,916 ¥ 151,717 ¥ 220,633 ¥ 94,130 ¥ 189,662 ¥ 283,792 ¥ 79,894 ¥ 173,940 ¥ 253,834 Due after 1 to 2 years 96,877 192,333 289,210 65,165 149,042 214,207 146,063 187,431 333,494Due after 2 to 3 years 201,438 232,057 433,495 108,037 186,526 294,563 60,951 147,091 208,042Due after 3 to 4 years 38,300 222,477 260,777 120,199 211,262 331,461 37,752 165,377 203,129Due after 4 to 5 years 32,200 267,535 299,735 11,200 219,455 230,655 108,294 177,253 285,547Thereafter 165,944 1,592,014 1,757,958 34,417 1,348,190 1,382,607 8,000 1,117,087 1,125,087Total ¥603,675 ¥2,658,133 ¥3,261,808 ¥433,148 ¥2,304,137 ¥2,737,285 ¥440,954 ¥1,968,179 ¥2,409,133
Thousands of U.S. dollars (See Note 1)
2020
Non-recourse Recourse TotalDue within 1 year $ 633,245 $ 1,394,073 $ 2,027,318 Due after 1 to 2 years 890,168 1,767,279 2,657,447Due after 2 to 3 years 1,850,942 2,132,289 3,983,231Due after 3 to 4 years 351,925 2,044,262 2,396,187Due after 4 to 5 years 295,874 2,458,284 2,754,158Thereafter 1,524,800 14,628,448 16,153,248Total $5,546,954 $24,424,635 $29,971,589
14. ASSET RETIREMENT OBLIGATIONS
(1) Asset retirement obligations recognized in the consoli-dated balance sheets as of March 31, 2020, 2019 and 2018
The Company and its consolidated subsidiaries, in connection with operating commercial facilities and parking business (Mitsui Repark), have entered into real estate lease contracts with terms ranging from several months to 47 years. Asset retirement obliga-tions have been recognized in respect of the obligation of the Company and its consolidated subsidiaries to the landlords to
remove the facilities from leased real estate at the end of those contracts. The liability has been calculated with expected useful lives ranging from several months to 47 years and discount rates ranging from 0 to 2.5%.
Asset retirement obligations are included in other current liabili-ties and other long-term liabilities on the consolidated balance sheets.
Millions of yenThousands of U.S. dollars (See Note 1)
2020 2019 2018 2020
Beginning of year ¥5,126 ¥4,281 ¥3,924 $47,101Increase due to acquisition of fixed assets 827 959 573 7,599 Net increase due to revisions to original estimate* 83 43 120 763 Decrease due to settlement (518) (174) (391) (4,760)Other 19 17 55 175 End of year ¥5,537 ¥5,126 ¥4,281 $50,878
* Increase for the years ended March 31, 2020, 2019 and 2018 was mainly due to additions of decommissioning costs that have become measurable in a more accurate manner.
The Company and its consolidated subsidiaries generally make lease agreements with tenants under which they receive both interest-bearing deposits and non-interest-bearing deposits from tenants. The non-interest-bearing deposits and some of the inter-est-bearing deposits are not refundable during the life of the
lease. The rest of the interest-bearing deposits are generally refundable to the tenant in equal annual or monthly payments with interest over certain periods of time commencing after the grace periods, depending on the terms of the contracts.
15. DEPOSITS FROM TENANTS
Deposits from tenants at March 31, 2020, 2019 and 2018 comprise the following:
(1) Changes in number of shares issued and outstanding during the years ended March 31, 2019, 2018 and 2017 are as follows:
17. SUPPLEMENTAL INFORMATION ON THE CONSOLIDATED STATEMENTS OF CHANGES IN NET ASSETS
16. NET ASSETS
Net assets comprises four subsections, which are shareholders’ equity, accumulated other comprehensive income, subscription rights to shares and non-controlling interests, as applicable.
Under the Japanese Company Law (the “Law”), the entire amount paid for new shares is required to be designated as common stock. However, a company may, by resolution of the Board of Directors, designate an amount not exceeding one-half of the prices of the new shares as additional paid-in capital, which is included in capital surplus.
Under the Law, in cases where a dividend distribution of sur-plus is made, the smaller of an amount equal to 10% of the divi-dend or the excess, if any, of 25% of common stock over the total of additional paid-in-capital and legal earnings reserve must be set aside as additional paid-in-capital or legal earnings reserve.
Legal earnings reserve is included in retained earnings in the accompanying consolidated balance sheets.
Under the Law, legal earnings reserve and additional paid-in capital may be used to eliminate or reduce a deficit, or may be capitalized by resolution of the shareholders' meeting. Additional paid-in capital and legal earnings reserve may not be distributed as dividends. However, all additional paid-in capital and all legal earnings reserve may be transferred to other capital surplus and retained earnings, respectively, which are potentially available for dividends.
The maximum amount that the Company can distribute as dividends is calculated based on the non-consolidated financial statements of the Company in accordance with Japanese laws and regulations.
Millions of yenThousands of U.S. dollars (See Note 1)
2020 2019 2018 2020Non-interest-bearing ¥435,916 ¥423,425 ¥402,232 $4,005,477 Interest-bearing 679 910 1,181 6,239 Total ¥436,595 ¥424,335 ¥403,413 $4,011,716 Average interest rate 0.99% 1.00% 1.00%
Thousands
Issued Treasury stock
Common stock Common stock
Numbers of shares as of March 31, 2017 991,425 3,290 Numbers of shares increased (*1) - 9Numbers of shares decreased (*2) - (99)Numbers of shares as of March 31, 2018 991,425 3,200Numbers of shares increased (*3) - 5,993Numbers of shares decreased (*4) - (6)Numbers of shares as of March 31, 2019 991,425 9,187Numbers of shares increased (*5) - 11,166 Numbers of shares decreased (*6) (12,175) (12,205)Numbers of shares as of March 31, 2020 979,250 8,148
(*1) Treasury stock increased due to purchase of odd shares.(*2) Treasury stock decreased due to sale of 1 thousand odd shares and exercise of 98 thousand shares of subscription rights.(*3) Treasury stock increased due to purchase of 5,985 thousand shares through resolution of the Board of Directors’ meeting, purchase of 6 thousand odd
shares and increase of 2 thousand shares through increase in ratio of shareholding in an affiliated company.(*4) Treasury stock decreased due to sale of 1 thousand odd shares and exercise of 5 thousand shares of subscription rights.(*5) Treasury stock increased due to purchase of 11,160 thousand shares through resolution of the Board of Directors’ meeting and purchase of 6 thousand
odd shares.(*6) Common stock issued decreased due to retirement of 12,175 thousand shares of treasury stock. Treasury stock decreased due to retirement of 12,175
thousand shares of treasury stock, sale of 1 thousand odd shares and exercise of 29 thousand shares of subscription rights.
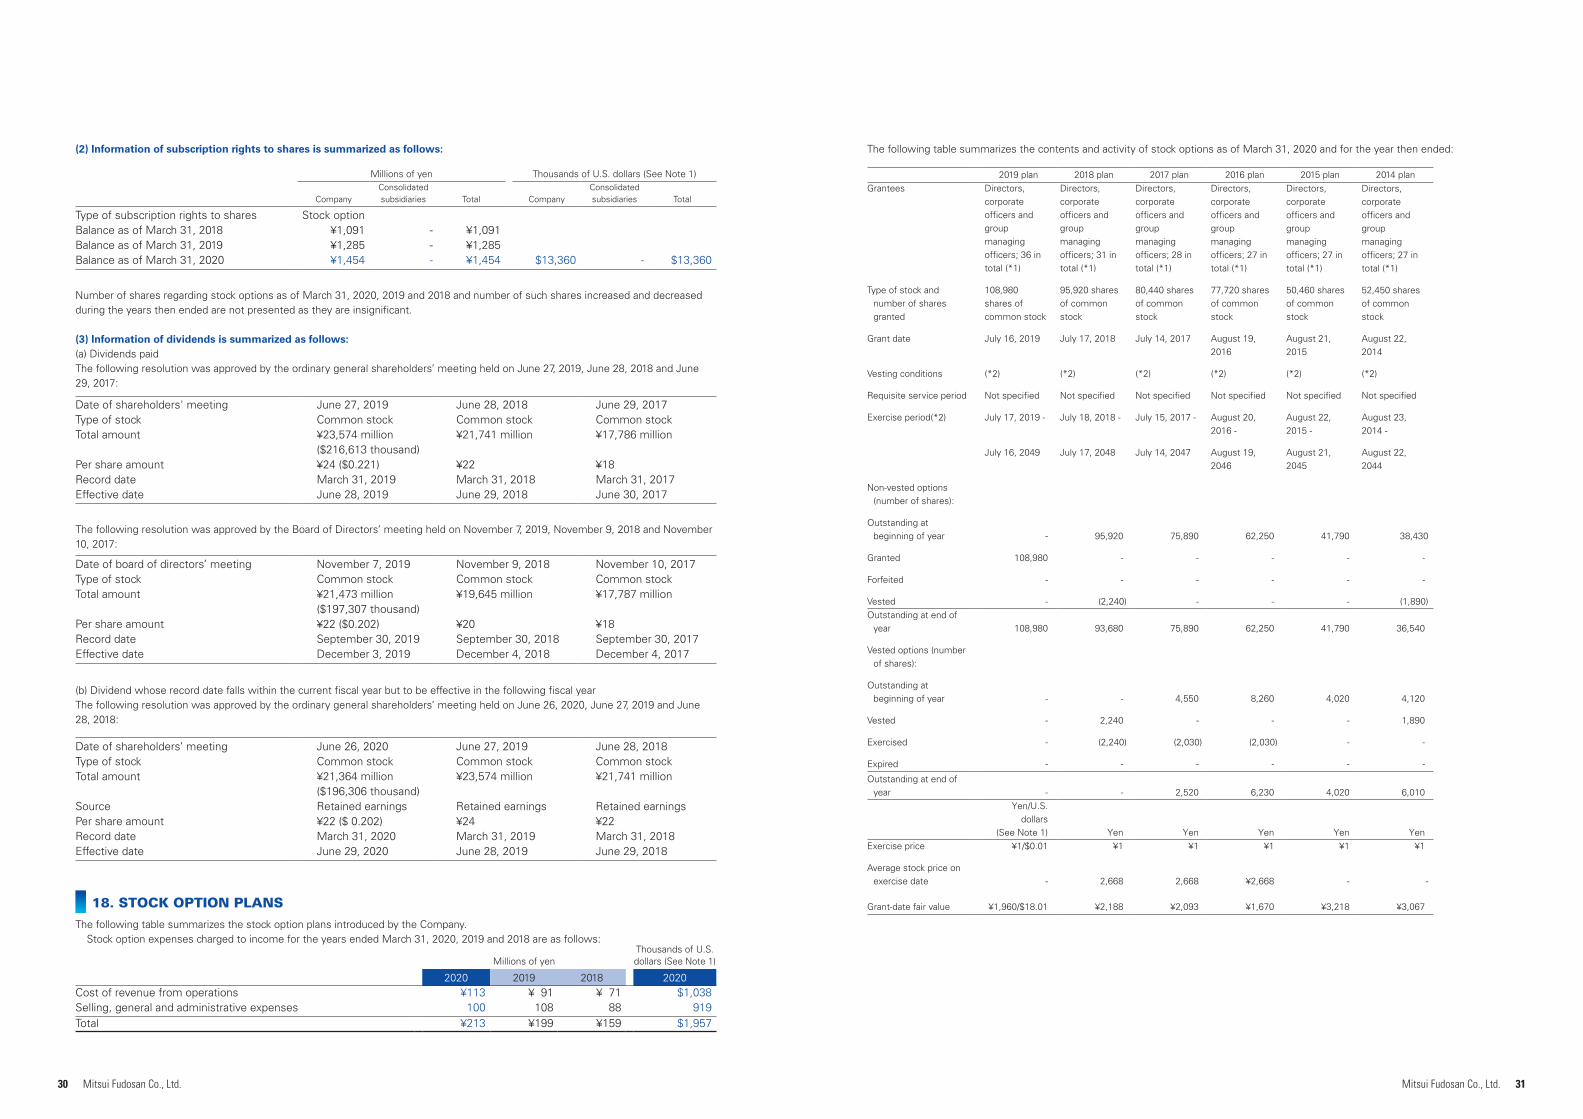
30 31Mitsui Fudosan Co., Ltd. Mitsui Fudosan Co., Ltd.
Millions of yen Thousands of U.S. dollars (See Note 1)
CompanyConsolidated subsidiaries Total Company
Consolidated subsidiaries Total
Type of subscription rights to shares Stock optionBalance as of March 31, 2018 ¥1,091 - ¥1,091Balance as of March 31, 2019 ¥1,285 - ¥1,285 Balance as of March 31, 2020 ¥1,454 - ¥1,454 $13,360 - $13,360
Date of shareholders' meeting June 27, 2019 June 28, 2018 June 29, 2017Type of stock Common stock Common stock Common stockTotal amount ¥23,574 million ¥21,741 million ¥17,786 million
($216,613 thousand) Per share amount ¥24 ($0.221) ¥22 ¥18Record date March 31, 2019 March 31, 2018 March 31, 2017Effective date June 28, 2019 June 29, 2018 June 30, 2017
Date of board of directors’ meeting November 7, 2019 November 9, 2018 November 10, 2017Type of stock Common stock Common stock Common stockTotal amount ¥21,473 million ¥19,645 million ¥17,787 million
($197,307 thousand)Per share amount ¥22 ($0.202) ¥20 ¥18Record date September 30, 2019 September 30, 2018 September 30, 2017Effective date December 3, 2019 December 4, 2018 December 4, 2017
Date of shareholders’ meeting June 26, 2020 June 27, 2019 June 28, 2018Type of stock Common stock Common stock Common stockTotal amount ¥21,364 million ¥23,574 million ¥21,741 million
($196,306 thousand)Source Retained earnings Retained earnings Retained earningsPer share amount ¥22 ($ 0.202) ¥24 ¥22 Record date March 31, 2020 March 31, 2019 March 31, 2018Effective date June 29, 2020 June 28, 2019 June 29, 2018
(2) Information of subscription rights to shares is summarized as follows:
Number of shares regarding stock options as of March 31, 2020, 2019 and 2018 and number of such shares increased and decreased during the years then ended are not presented as they are insignificant.
(3) Information of dividends is summarized as follows:(a) Dividends paidThe following resolution was approved by the ordinary general shareholders’ meeting held on June 27, 2019, June 28, 2018 and June 29, 2017:
The following resolution was approved by the Board of Directors’ meeting held on November 7, 2019, November 9, 2018 and November 10, 2017:
(b) Dividend whose record date falls within the current fiscal year but to be effective in the following fiscal yearThe following resolution was approved by the ordinary general shareholders’ meeting held on June 26, 2020, June 27, 2019 and June 28, 2018:
18. STOCK OPTION PLANS
The following table summarizes the stock option plans introduced by the Company.Stock option expenses charged to income for the years ended March 31, 2020, 2019 and 2018 are as follows:
Millions of yenThousands of U.S. dollars (See Note 1)
2020 2019 2018 2020Cost of revenue from operations ¥113 ¥ 91 ¥ 71 $1,038 Selling, general and administrative expenses 100 108 88 919Total ¥213 ¥199 ¥159 $1,957
The following table summarizes the contents and activity of stock options as of March 31, 2020 and for the year then ended:
2019 plan 2018 plan 2017 plan 2016 plan 2015 plan 2014 planGrantees Directors,
corporate officers and group managing officers; 36 in total (*1)
Directors, corporate officers and group managing officers; 31 in total (*1)
Directors, corporate officers and group managing officers; 28 in total (*1)
Directors, corporate officers and group managing officers; 27 in total (*1)
Directors, corporate officers and group managing officers; 27 in total (*1)
Directors, corporate officers and group managing officers; 27 in total (*1)
Type of stock and number of shares granted
108,980 shares of common stock
95,920 shares of common stock
80,440 shares of common stock
77,720 shares of common stock
50,460 shares of common stock
52,450 shares of common stock
Grant date July 16, 2019 July 17, 2018 July 14, 2017 August 19, 2016
August 21, 2015
August 22, 2014
Vesting conditions (*2) (*2) (*2) (*2) (*2) (*2)
Requisite service period Not specified Not specified Not specified Not specified Not specified Not specified
Exercise period(*2) July 17, 2019 - July 18, 2018 - July 15, 2017 - August 20, 2016 -
August 22, 2015 -
August 23, 2014 -
July 16, 2049 July 17, 2048 July 14, 2047 August 19, 2046
August 21, 2045
August 22, 2044
Non-vested options (number of shares):
Outstanding at beginning of year - 95,920 75,890 62,250 41,790 38,430
Granted 108,980 - - - - -
Forfeited - - - - - -
Vested - (2,240) - - - (1,890)Outstanding at end of
year 108,980 93,680 75,890 62,250 41,790 36,540
Vested options (number of shares):
Outstanding at beginning of year - - 4,550 8,260 4,020 4,120
Vested - 2,240 - - - 1,890
Exercised - (2,240) (2,030) (2,030) - -
Expired - - - - - -
Outstanding at end of year - - 2,520 6,230 4,020 6,010
Yen/U.S. dollars
(See Note 1) Yen Yen Yen Yen YenExercise price ¥1/$0.01 ¥1 ¥1 ¥1 ¥1 ¥1
Average stock price on exercise date - 2,668 2,668 ¥2,668 - -
Grant-date fair value ¥1,960/$18.01 ¥2,188 ¥2,093 ¥1,670 ¥3,218 ¥3,067
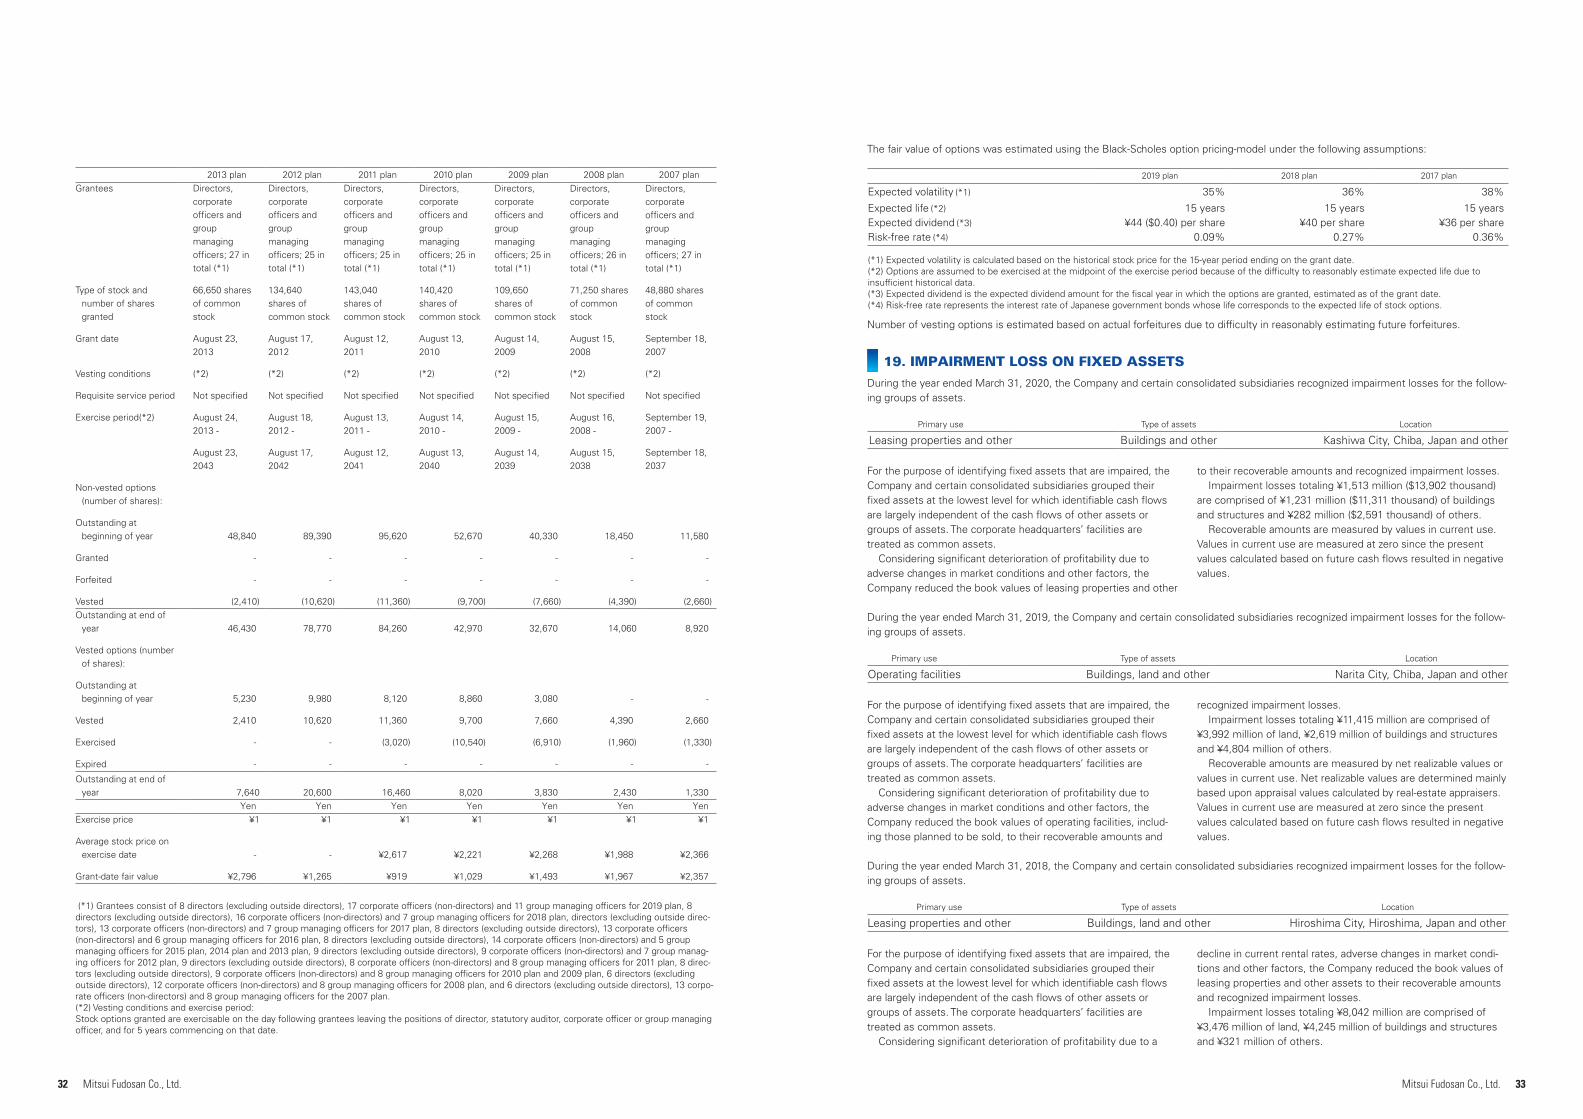
32 33Mitsui Fudosan Co., Ltd. Mitsui Fudosan Co., Ltd.
2019 plan 2018 plan 2017 plan
Expected volatility (*1) 35% 36% 38%
Expected life (*2) 15 years 15 years 15 yearsExpected dividend (*3) ¥44 ($0.40) per share ¥40 per share ¥36 per shareRisk-free rate (*4) 0.09% 0.27% 0.36%
(*1) Expected volatility is calculated based on the historical stock price for the 15-year period ending on the grant date.(*2) Options are assumed to be exercised at the midpoint of the exercise period because of the difficulty to reasonably estimate expected life due to insufficient historical data.(*3) Expected dividend is the expected dividend amount for the fiscal year in which the options are granted, estimated as of the grant date.(*4) Risk-free rate represents the interest rate of Japanese government bonds whose life corresponds to the expected life of stock options.
The fair value of options was estimated using the Black-Scholes option pricing-model under the following assumptions:
Number of vesting options is estimated based on actual forfeitures due to difficulty in reasonably estimating future forfeitures.
19. IMPAIRMENT LOSS ON FIXED ASSETS
During the year ended March 31, 2020, the Company and certain consolidated subsidiaries recognized impairment losses for the follow-ing groups of assets.
Primary use Type of assets Location
Leasing properties and other Buildings and other Kashiwa City, Chiba, Japan and other
Primary use Type of assets Location
Operating facilities Buildings, land and other Narita City, Chiba, Japan and other
Primary use Type of assets Location
Leasing properties and other Buildings, land and other Hiroshima City, Hiroshima, Japan and other
For the purpose of identifying fixed assets that are impaired, the Company and certain consolidated subsidiaries grouped their fixed assets at the lowest level for which identifiable cash flows are largely independent of the cash flows of other assets or groups of assets. The corporate headquarters’ facilities are treated as common assets.
Considering significant deterioration of profitability due to adverse changes in market conditions and other factors, the Company reduced the book values of leasing properties and other
to their recoverable amounts and recognized impairment losses.Impairment losses totaling ¥1,513 million ($13,902 thousand)
are comprised of ¥1,231 million ($11,311 thousand) of buildings and structures and ¥282 million ($2,591 thousand) of others.
Recoverable amounts are measured by values in current use. Values in current use are measured at zero since the present values calculated based on future cash flows resulted in negative values.
For the purpose of identifying fixed assets that are impaired, the Company and certain consolidated subsidiaries grouped their fixed assets at the lowest level for which identifiable cash flows are largely independent of the cash flows of other assets or groups of assets. The corporate headquarters’ facilities are treated as common assets.
Considering significant deterioration of profitability due to adverse changes in market conditions and other factors, the Company reduced the book values of operating facilities, includ-ing those planned to be sold, to their recoverable amounts and
recognized impairment losses.Impairment losses totaling ¥11,415 million are comprised of
¥3,992 million of land, ¥2,619 million of buildings and structures and ¥4,804 million of others.
Recoverable amounts are measured by net realizable values or values in current use. Net realizable values are determined mainly based upon appraisal values calculated by real-estate appraisers. Values in current use are measured at zero since the present values calculated based on future cash flows resulted in negative values.
For the purpose of identifying fixed assets that are impaired, the Company and certain consolidated subsidiaries grouped their fixed assets at the lowest level for which identifiable cash flows are largely independent of the cash flows of other assets or groups of assets. The corporate headquarters’ facilities are treated as common assets.
Considering significant deterioration of profitability due to a
decline in current rental rates, adverse changes in market condi-tions and other factors, the Company reduced the book values of leasing properties and other assets to their recoverable amounts and recognized impairment losses.
Impairment losses totaling ¥8,042 million are comprised of ¥3,476 million of land, ¥4,245 million of buildings and structures and ¥321 million of others.
During the year ended March 31, 2019, the Company and certain consolidated subsidiaries recognized impairment losses for the follow-ing groups of assets.
During the year ended March 31, 2018, the Company and certain consolidated subsidiaries recognized impairment losses for the follow-ing groups of assets.
2013 plan 2012 plan 2011 plan 2010 plan 2009 plan 2008 plan 2007 planGrantees Directors,
corporate officers and group managing officers; 27 in total (*1)
Directors, corporate officers and group managing officers; 25 in total (*1)
Directors, corporate officers and group managing officers; 25 in total (*1)
Directors, corporate officers and group managing officers; 25 in total (*1)
Directors, corporate officers and group managing officers; 25 in total (*1)
Directors, corporate officers and group managing officers; 26 in total (*1)
Directors, corporate officers and group managing officers; 27 in total (*1)
Type of stock and number of shares granted
66,650 shares of common stock
134,640 shares of common stock
143,040 shares of common stock
140,420 shares of common stock
109,650 shares of common stock
71,250 shares of common stock
48,880 shares of common stock
Grant date August 23, 2013
August 17, 2012
August 12, 2011
August 13, 2010
August 14, 2009
August 15, 2008
September 18, 2007
Vesting conditions (*2) (*2) (*2) (*2) (*2) (*2) (*2)
Requisite service period Not specified Not specified Not specified Not specified Not specified Not specified Not specified
Exercise period(*2) August 24, 2013 -
August 18, 2012 -
August 13, 2011 -
August 14, 2010 -
August 15, 2009 -
August 16, 2008 -
September 19, 2007 -
August 23, 2043
August 17, 2042
August 12, 2041
August 13, 2040
August 14, 2039
August 15, 2038
September 18, 2037
Non-vested options (number of shares):
Outstanding at beginning of year 48,840 89,390 95,620 52,670 40,330 18,450 11,580
Granted - - - - - - -
Forfeited - - - - - - -
Vested (2,410) (10,620) (11,360) (9,700) (7,660) (4,390) (2,660)Outstanding at end of
year 46,430 78,770 84,260 42,970 32,670 14,060 8,920
Vested options (number of shares):
Outstanding at beginning of year 5,230 9,980 8,120 8,860 3,080 - -
Vested 2,410 10,620 11,360 9,700 7,660 4,390 2,660
Exercised - - (3,020) (10,540) (6,910) (1,960) (1,330)
Expired - - - - - - -
Outstanding at end of year 7,640 20,600 16,460 8,020 3,830 2,430 1,330
Yen Yen Yen Yen Yen Yen YenExercise price ¥1 ¥1 ¥1 ¥1 ¥1 ¥1 ¥1
Average stock price on exercise date - - ¥2,617 ¥2,221 ¥2,268 ¥1,988 ¥2,366
Grant-date fair value ¥2,796 ¥1,265 ¥919 ¥1,029 ¥1,493 ¥1,967 ¥2,357
(*1) Grantees consist of 8 directors (excluding outside directors), 17 corporate officers (non-directors) and 11 group managing officers for 2019 plan, 8 directors (excluding outside directors), 16 corporate officers (non-directors) and 7 group managing officers for 2018 plan, directors (excluding outside direc-tors), 13 corporate officers (non-directors) and 7 group managing officers for 2017 plan, 8 directors (excluding outside directors), 13 corporate officers (non-directors) and 6 group managing officers for 2016 plan, 8 directors (excluding outside directors), 14 corporate officers (non-directors) and 5 group managing officers for 2015 plan, 2014 plan and 2013 plan, 9 directors (excluding outside directors), 9 corporate officers (non-directors) and 7 group manag-ing officers for 2012 plan, 9 directors (excluding outside directors), 8 corporate officers (non-directors) and 8 group managing officers for 2011 plan, 8 direc-tors (excluding outside directors), 9 corporate officers (non-directors) and 8 group managing officers for 2010 plan and 2009 plan, 6 directors (excluding outside directors), 12 corporate officers (non-directors) and 8 group managing officers for 2008 plan, and 6 directors (excluding outside directors), 13 corpo-rate officers (non-directors) and 8 group managing officers for the 2007 plan.(*2) Vesting conditions and exercise period:Stock options granted are exercisable on the day following grantees leaving the positions of director, statutory auditor, corporate officer or group managing officer, and for 5 years commencing on that date.
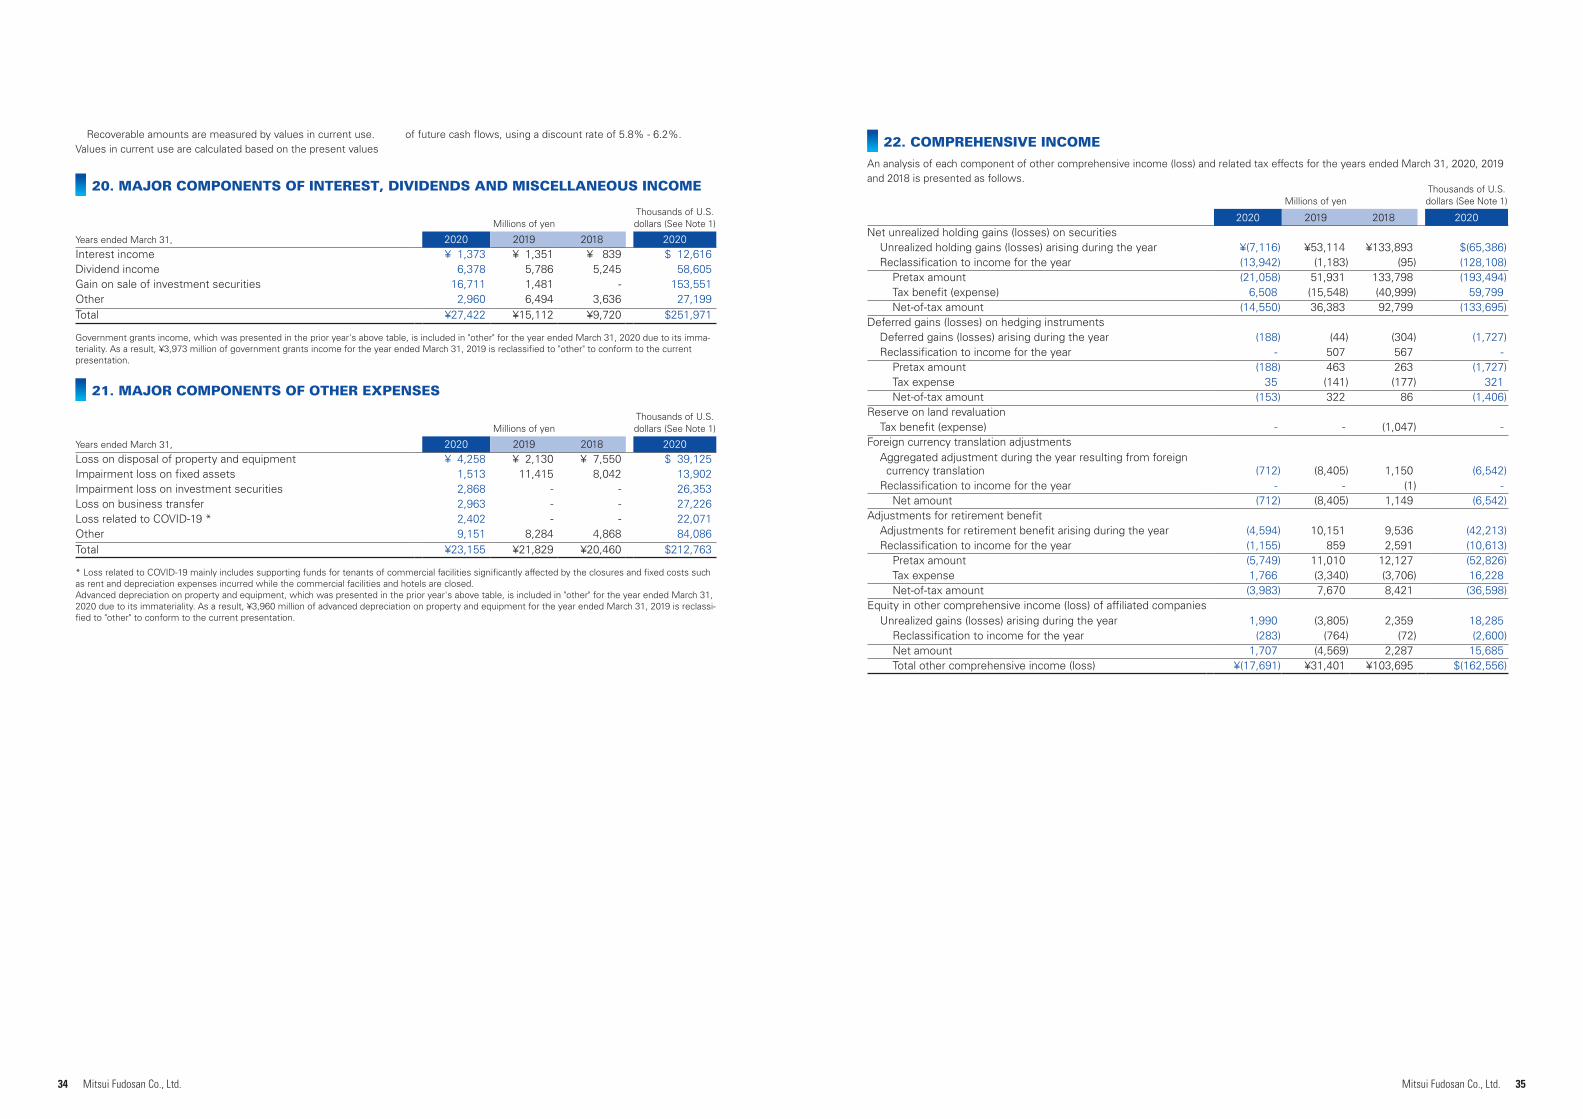
34 35Mitsui Fudosan Co., Ltd. Mitsui Fudosan Co., Ltd.
20. MAJOR COMPONENTS OF INTEREST, DIVIDENDS AND MISCELLANEOUS INCOME
21. MAJOR COMPONENTS OF OTHER EXPENSES
Millions of yenThousands of U.S. dollars (See Note 1)
Years ended March 31, 2020 2019 2018 2020Interest income ¥ 1,373 ¥ 1,351 ¥ 839 $ 12,616Dividend income 6,378 5,786 5,245 58,605Gain on sale of investment securities 16,711 1,481 - 153,551Other 2,960 6,494 3,636 27,199Total ¥27,422 ¥15,112 ¥9,720 $251,971
Government grants income, which was presented in the prior year's above table, is included in "other" for the year ended March 31, 2020 due to its imma-teriality. As a result, ¥3,973 million of government grants income for the year ended March 31, 2019 is reclassified to "other" to conform to the current presentation.
Millions of yenThousands of U.S. dollars (See Note 1)
Years ended March 31, 2020 2019 2018 2020Loss on disposal of property and equipment ¥ 4,258 ¥ 2,130 ¥ 7,550 $ 39,125Impairment loss on fixed assets 1,513 11,415 8,042 13,902Impairment loss on investment securities 2,868 - - 26,353Loss on business transfer 2,963 - - 27,226Loss related to COVID-19 * 2,402 - - 22,071Other 9,151 8,284 4,868 84,086Total ¥23,155 ¥21,829 ¥20,460 $212,763
* Loss related to COVID-19 mainly includes supporting funds for tenants of commercial facilities significantly affected by the closures and fixed costs such as rent and depreciation expenses incurred while the commercial facilities and hotels are closed.Advanced depreciation on property and equipment, which was presented in the prior year's above table, is included in "other" for the year ended March 31, 2020 due to its immateriality. As a result, ¥3,960 million of advanced depreciation on property and equipment for the year ended March 31, 2019 is reclassi-fied to "other" to conform to the current presentation.
22. COMPREHENSIVE INCOME
An analysis of each component of other comprehensive income (loss) and related tax effects for the years ended March 31, 2020, 2019 and 2018 is presented as follows.
Millions of yenThousands of U.S. dollars (See Note 1)
2020 2019 2018 2020Net unrealized holding gains (losses) on securities
Unrealized holding gains (losses) arising during the year ¥(7,116) ¥53,114 ¥133,893 $(65,386)Reclassification to income for the year (13,942) (1,183) (95) (128,108)
Pretax amount (21,058) 51,931 133,798 (193,494)Tax benefit (expense) 6,508 (15,548) (40,999) 59,799 Net-of-tax amount (14,550) 36,383 92,799 (133,695)
Deferred gains (losses) on hedging instrumentsDeferred gains (losses) arising during the year (188) (44) (304) (1,727)Reclassification to income for the year - 507 567 -
Pretax amount (188) 463 263 (1,727)Tax expense 35 (141) (177) 321 Net-of-tax amount (153) 322 86 (1,406)
Reserve on land revaluationTax benefit (expense) - - (1,047) -
Foreign currency translation adjustmentsAggregated adjustment during the year resulting from foreign
currency translation (712) (8,405) 1,150 (6,542)Reclassification to income for the year - - (1) -
Net amount (712) (8,405) 1,149 (6,542)Adjustments for retirement benefit
Adjustments for retirement benefit arising during the year (4,594) 10,151 9,536 (42,213)Reclassification to income for the year (1,155) 859 2,591 (10,613)
Pretax amount (5,749) 11,010 12,127 (52,826)Tax expense 1,766 (3,340) (3,706) 16,228 Net-of-tax amount (3,983) 7,670 8,421 (36,598)
Equity in other comprehensive income (loss) of affiliated companiesUnrealized gains (losses) arising during the year 1,990 (3,805) 2,359 18,285
Reclassification to income for the year (283) (764) (72) (2,600)Net amount 1,707 (4,569) 2,287 15,685 Total other comprehensive income (loss) ¥(17,691) ¥31,401 ¥103,695 $(162,556)
Recoverable amounts are measured by values in current use. Values in current use are calculated based on the present values
of future cash flows, using a discount rate of 5.8% - 6.2%.
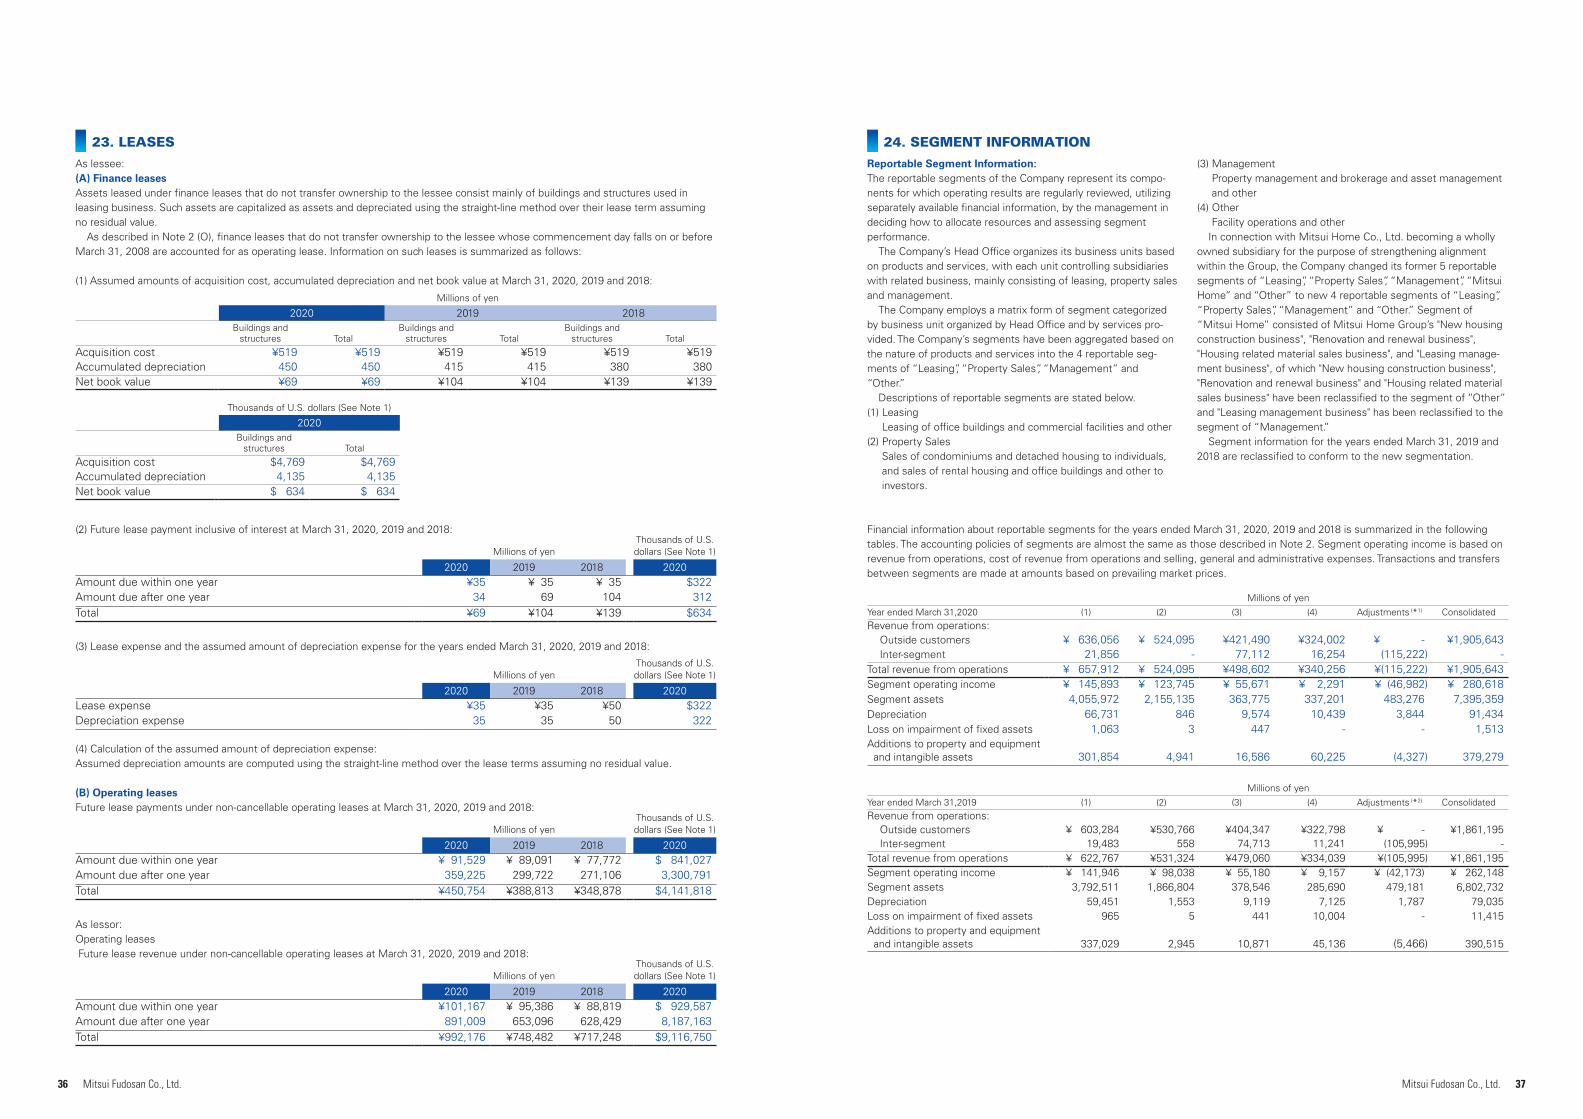
36 37Mitsui Fudosan Co., Ltd. Mitsui Fudosan Co., Ltd.
23. LEASES
As lessee:(A) Finance leasesAssets leased under finance leases that do not transfer ownership to the lessee consist mainly of buildings and structures used in leasing business. Such assets are capitalized as assets and depreciated using the straight-line method over their lease term assuming no residual value.
As described in Note 2 (O), finance leases that do not transfer ownership to the lessee whose commencement day falls on or before March 31, 2008 are accounted for as operating lease. Information on such leases is summarized as follows:
(1) Assumed amounts of acquisition cost, accumulated depreciation and net book value at March 31, 2020, 2019 and 2018:
Millions of yen
2020 2019 2018Buildings and
structures TotalBuildings and
structures TotalBuildings and
structures Total
Acquisition cost ¥519 ¥519 ¥519 ¥519 ¥519 ¥519Accumulated depreciation 450 450 415 415 380 380Net book value ¥69 ¥69 ¥104 ¥104 ¥139 ¥139
Thousands of U.S. dollars (See Note 1)
2020Buildings and
structures Total
Acquisition cost $4,769 $4,769 Accumulated depreciation 4,135 4,135Net book value $ 634 $ 634
(2) Future lease payment inclusive of interest at March 31, 2020, 2019 and 2018:
(3) Lease expense and the assumed amount of depreciation expense for the years ended March 31, 2020, 2019 and 2018:
(4) Calculation of the assumed amount of depreciation expense:Assumed depreciation amounts are computed using the straight-line method over the lease terms assuming no residual value.
As lessor:Operating leases Future lease revenue under non-cancellable operating leases at March 31, 2020, 2019 and 2018:
(B) Operating leasesFuture lease payments under non-cancellable operating leases at March 31, 2020, 2019 and 2018:
Millions of yenThousands of U.S. dollars (See Note 1)
2020 2019 2018 2020Amount due within one year ¥35 ¥ 35 ¥ 35 $322 Amount due after one year 34 69 104 312Total ¥69 ¥104 ¥139 $634
Millions of yenThousands of U.S. dollars (See Note 1)
2020 2019 2018 2020Amount due within one year ¥ 91,529 ¥ 89,091 ¥ 77,772 $ 841,027 Amount due after one year 359,225 299,722 271,106 3,300,791Total ¥450,754 ¥388,813 ¥348,878 $4,141,818
Millions of yenThousands of U.S. dollars (See Note 1)
2020 2019 2018 2020Amount due within one year ¥101,167 ¥ 95,386 ¥ 88,819 $ 929,587 Amount due after one year 891,009 653,096 628,429 8,187,163Total ¥992,176 ¥748,482 ¥717,248 $9,116,750
Millions of yenThousands of U.S. dollars (See Note 1)
2020 2019 2018 2020Lease expense ¥35 ¥35 ¥50 $322 Depreciation expense 35 35 50 322
24. SEGMENT INFORMATION
Reportable Segment Information:The reportable segments of the Company represent its compo-nents for which operating results are regularly reviewed, utilizing separately available financial information, by the management in deciding how to allocate resources and assessing segment performance.
The Company’s Head Office organizes its business units based on products and services, with each unit controlling subsidiaries with related business, mainly consisting of leasing, property sales and management.
The Company employs a matrix form of segment categorized by business unit organized by Head Office and by services pro-vided. The Company’s segments have been aggregated based on the nature of products and services into the 4 reportable seg-ments of “Leasing”, “Property Sales”, “Management” and “Other.”
Descriptions of reportable segments are stated below.(1) Leasing
Leasing of office buildings and commercial facilities and other(2) Property Sales
Sales of condominiums and detached housing to individuals, and sales of rental housing and office buildings and other to investors.
(3) Management Property management and brokerage and asset management and other
(4) Other Facility operations and other
In connection with Mitsui Home Co., Ltd. becoming a wholly owned subsidiary for the purpose of strengthening alignment within the Group, the Company changed its former 5 reportable segments of “Leasing”, “Property Sales”, “Management”, “Mitsui Home” and “Other” to new 4 reportable segments of “Leasing”, “Property Sales”, “Management” and “Other.” Segment of “Mitsui Home” consisted of Mitsui Home Group’s "New housing construction business", "Renovation and renewal business", "Housing related material sales business", and "Leasing manage-ment business", of which "New housing construction business", "Renovation and renewal business" and "Housing related material sales business" have been reclassified to the segment of “Other” and "Leasing management business" has been reclassified to the segment of “Management.”
Segment information for the years ended March 31, 2019 and 2018 are reclassified to conform to the new segmentation.
Financial information about reportable segments for the years ended March 31, 2020, 2019 and 2018 is summarized in the following tables. The accounting policies of segments are almost the same as those described in Note 2. Segment operating income is based on revenue from operations, cost of revenue from operations and selling, general and administrative expenses. Transactions and transfers between segments are made at amounts based on prevailing market prices.
Millions of yenYear ended March 31,2019 (1) (2) (3) (4) Adjustments (*2) ConsolidatedRevenue from operations:
Outside customers ¥ 603,284 ¥530,766 ¥404,347 ¥322,798 ¥ - ¥1,861,195 Inter-segment 19,483 558 74,713 11,241 (105,995) -
Total revenue from operations ¥ 622,767 ¥531,324 ¥479,060 ¥334,039 ¥(105,995) ¥1,861,195 Segment operating income ¥ 141,946 ¥ 98,038 ¥ 55,180 ¥ 9,157 ¥ (42,173) ¥ 262,148 Segment assets 3,792,511 1,866,804 378,546 285,690 479,181 6,802,732 Depreciation 59,451 1,553 9,119 7,125 1,787 79,035 Loss on impairment of fixed assets 965 5 441 10,004 - 11,415 Additions to property and equipment
and intangible assets 337,029 2,945 10,871 45,136 (5,466) 390,515
Millions of yenYear ended March 31,2020 (1) (2) (3) (4) Adjustments (*1) ConsolidatedRevenue from operations:
Outside customers ¥ 636,056 ¥ 524,095 ¥421,490 ¥324,002 ¥ - ¥1,905,643 Inter-segment 21,856 - 77,112 16,254 (115,222) -
Total revenue from operations ¥ 657,912 ¥ 524,095 ¥498,602 ¥340,256 ¥(115,222) ¥1,905,643 Segment operating income ¥ 145,893 ¥ 123,745 ¥ 55,671 ¥ 2,291 ¥ (46,982) ¥ 280,618 Segment assets 4,055,972 2,155,135 363,775 337,201 483,276 7,395,359 Depreciation 66,731 846 9,574 10,439 3,844 91,434 Loss on impairment of fixed assets 1,063 3 447 - - 1,513 Additions to property and equipment
and intangible assets 301,854 4,941 16,586 60,225 (4,327) 379,279
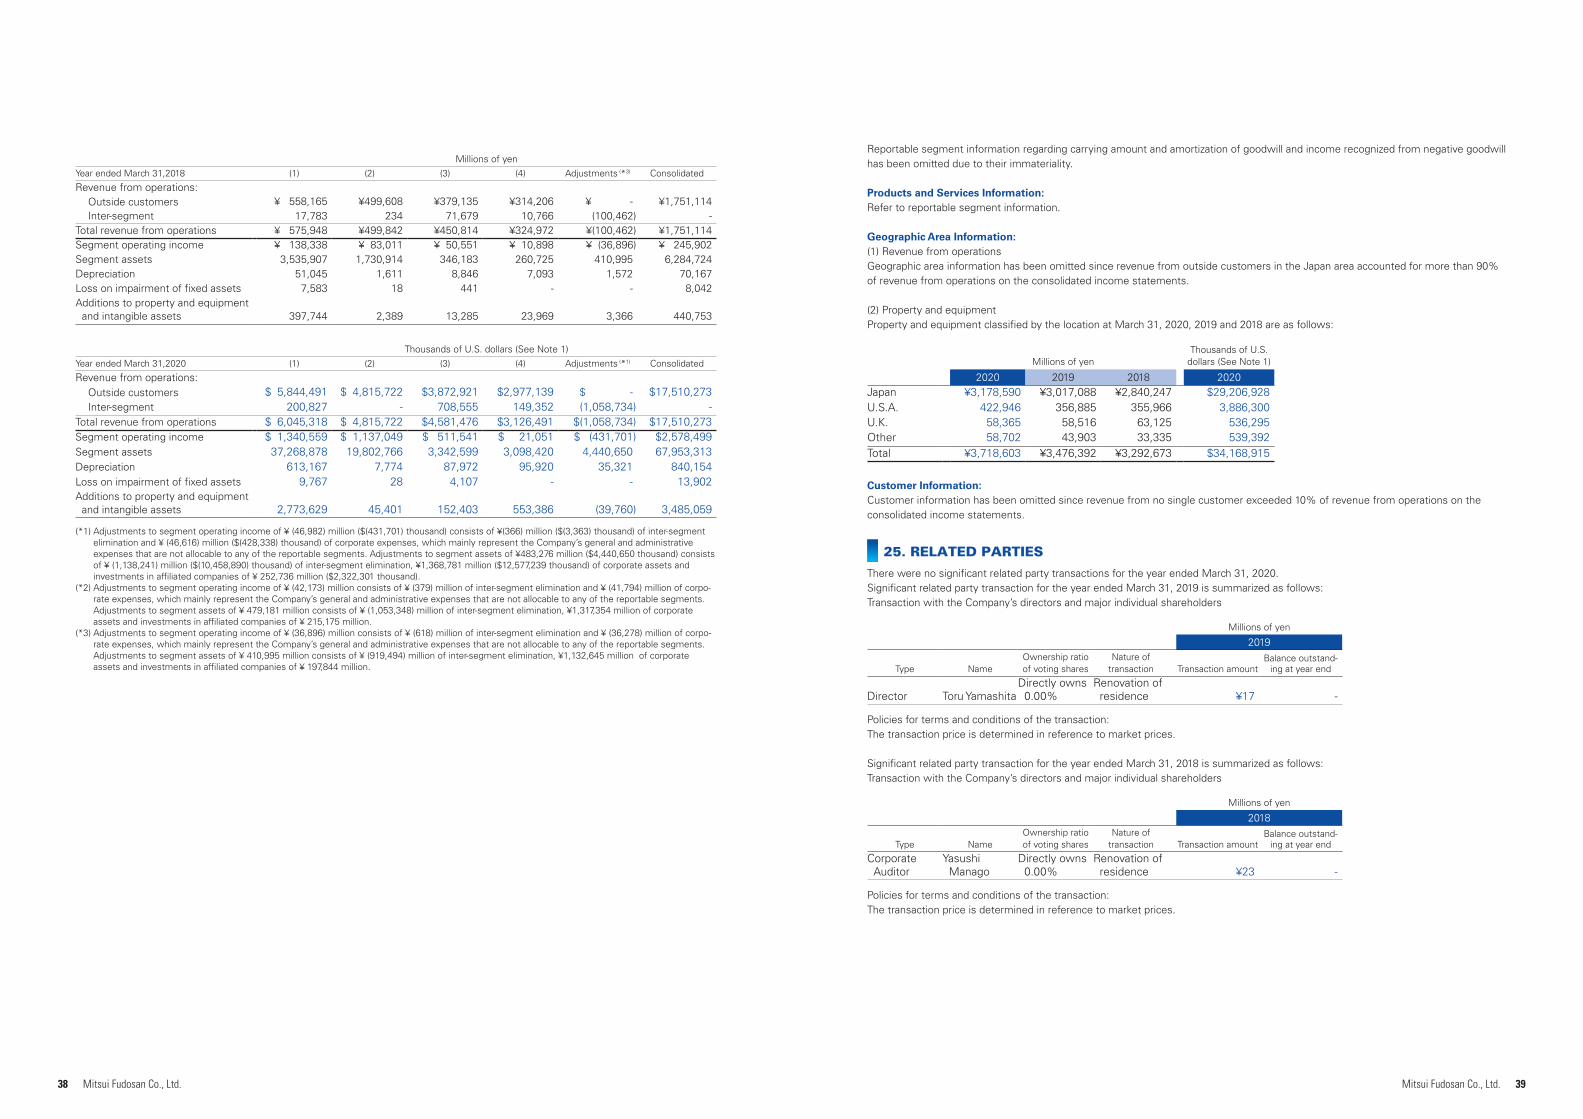
38 39Mitsui Fudosan Co., Ltd. Mitsui Fudosan Co., Ltd.
Millions of yenYear ended March 31,2018 (1) (2) (3) (4) Adjustments (*3) Consolidated
Revenue from operations:Outside customers ¥ 558,165 ¥499,608 ¥379,135 ¥314,206 ¥ - ¥1,751,114 Inter-segment 17,783 234 71,679 10,766 (100,462) -
Total revenue from operations ¥ 575,948 ¥499,842 ¥450,814 ¥324,972 ¥(100,462) ¥1,751,114 Segment operating income ¥ 138,338 ¥ 83,011 ¥ 50,551 ¥ 10,898 ¥ (36,896) ¥ 245,902 Segment assets 3,535,907 1,730,914 346,183 260,725 410,995 6,284,724 Depreciation 51,045 1,611 8,846 7,093 1,572 70,167 Loss on impairment of fixed assets 7,583 18 441 - - 8,042 Additions to property and equipment
and intangible assets 397,744 2,389 13,285 23,969 3,366 440,753
Thousands of U.S. dollars (See Note 1)Year ended March 31,2020 (1) (2) (3) (4) Adjustments (*1) Consolidated
Revenue from operations:Outside customers $ 5,844,491 $ 4,815,722 $3,872,921 $2,977,139 $ - $17,510,273 Inter-segment 200,827 - 708,555 149,352 (1,058,734) -
Total revenue from operations $ 6,045,318 $ 4,815,722 $4,581,476 $3,126,491 $(1,058,734) $17,510,273 Segment operating income $ 1,340,559 $ 1,137,049 $ 511,541 $ 21,051 $ (431,701) $2,578,499 Segment assets 37,268,878 19,802,766 3,342,599 3,098,420 4,440,650 67,953,313 Depreciation 613,167 7,774 87,972 95,920 35,321 840,154 Loss on impairment of fixed assets 9,767 28 4,107 - - 13,902 Additions to property and equipment
and intangible assets 2,773,629 45,401 152,403 553,386 (39,760) 3,485,059
(*1) Adjustments to segment operating income of ¥ (46,982) million ($(431,701) thousand) consists of ¥(366) million ($(3,363) thousand) of inter-segment elimination and ¥ (46,616) million ($(428,338) thousand) of corporate expenses, which mainly represent the Company’s general and administrative expenses that are not allocable to any of the reportable segments. Adjustments to segment assets of ¥483,276 million ($4,440,650 thousand) consists of ¥ (1,138,241) million ($(10,458,890) thousand) of inter-segment elimination, ¥1,368,781 million ($12,577,239 thousand) of corporate assets and investments in affiliated companies of ¥ 252,736 million ($2,322,301 thousand).
(*2) Adjustments to segment operating income of ¥ (42,173) million consists of ¥ (379) million of inter-segment elimination and ¥ (41,794) million of corpo-rate expenses, which mainly represent the Company’s general and administrative expenses that are not allocable to any of the reportable segments. Adjustments to segment assets of ¥ 479,181 million consists of ¥ (1,053,348) million of inter-segment elimination, ¥1,317,354 million of corporate assets and investments in affiliated companies of ¥ 215,175 million.
(*3) Adjustments to segment operating income of ¥ (36,896) million consists of ¥ (618) million of inter-segment elimination and ¥ (36,278) million of corpo-rate expenses, which mainly represent the Company’s general and administrative expenses that are not allocable to any of the reportable segments. Adjustments to segment assets of ¥ 410,995 million consists of ¥ (919,494) million of inter-segment elimination, ¥1,132,645 million of corporate assets and investments in affiliated companies of ¥ 197,844 million.
Reportable segment information regarding carrying amount and amortization of goodwill and income recognized from negative goodwill has been omitted due to their immateriality.
Products and Services Information:Refer to reportable segment information.
Geographic Area Information:(1) Revenue from operationsGeographic area information has been omitted since revenue from outside customers in the Japan area accounted for more than 90% of revenue from operations on the consolidated income statements.
(2) Property and equipmentProperty and equipment classified by the location at March 31, 2020, 2019 and 2018 are as follows:
Customer Information:Customer information has been omitted since revenue from no single customer exceeded 10% of revenue from operations on the consolidated income statements.
Millions of yenThousands of U.S.
dollars (See Note 1)
2020 2019 2018 2020Japan ¥3,178,590 ¥3,017,088 ¥2,840,247 $29,206,928 U.S.A. 422,946 356,885 355,966 3,886,300U.K. 58,365 58,516 63,125 536,295Other 58,702 43,903 33,335 539,392Total ¥3,718,603 ¥3,476,392 ¥3,292,673 $34,168,915
Policies for terms and conditions of the transaction:The transaction price is determined in reference to market prices.
Significant related party transaction for the year ended March 31, 2018 is summarized as follows:Transaction with the Company’s directors and major individual shareholders
Policies for terms and conditions of the transaction:The transaction price is determined in reference to market prices.
25. RELATED PARTIES
There were no significant related party transactions for the year ended March 31, 2020.Significant related party transaction for the year ended March 31, 2019 is summarized as follows:Transaction with the Company’s directors and major individual shareholders
Millions of yen
2018
Type NameOwnership ratio of voting shares
Nature of transaction Transaction amount
Balance outstand-ing at year end
Corporate Auditor
Yasushi Manago
Directly owns 0.00%
Renovation of residence ¥23 -
Millions of yen
2019
Type NameOwnership ratio of voting shares
Nature of transaction Transaction amount
Balance outstand-ing at year end
Director Toru YamashitaDirectly owns
0.00%Renovation of
residence ¥17 -
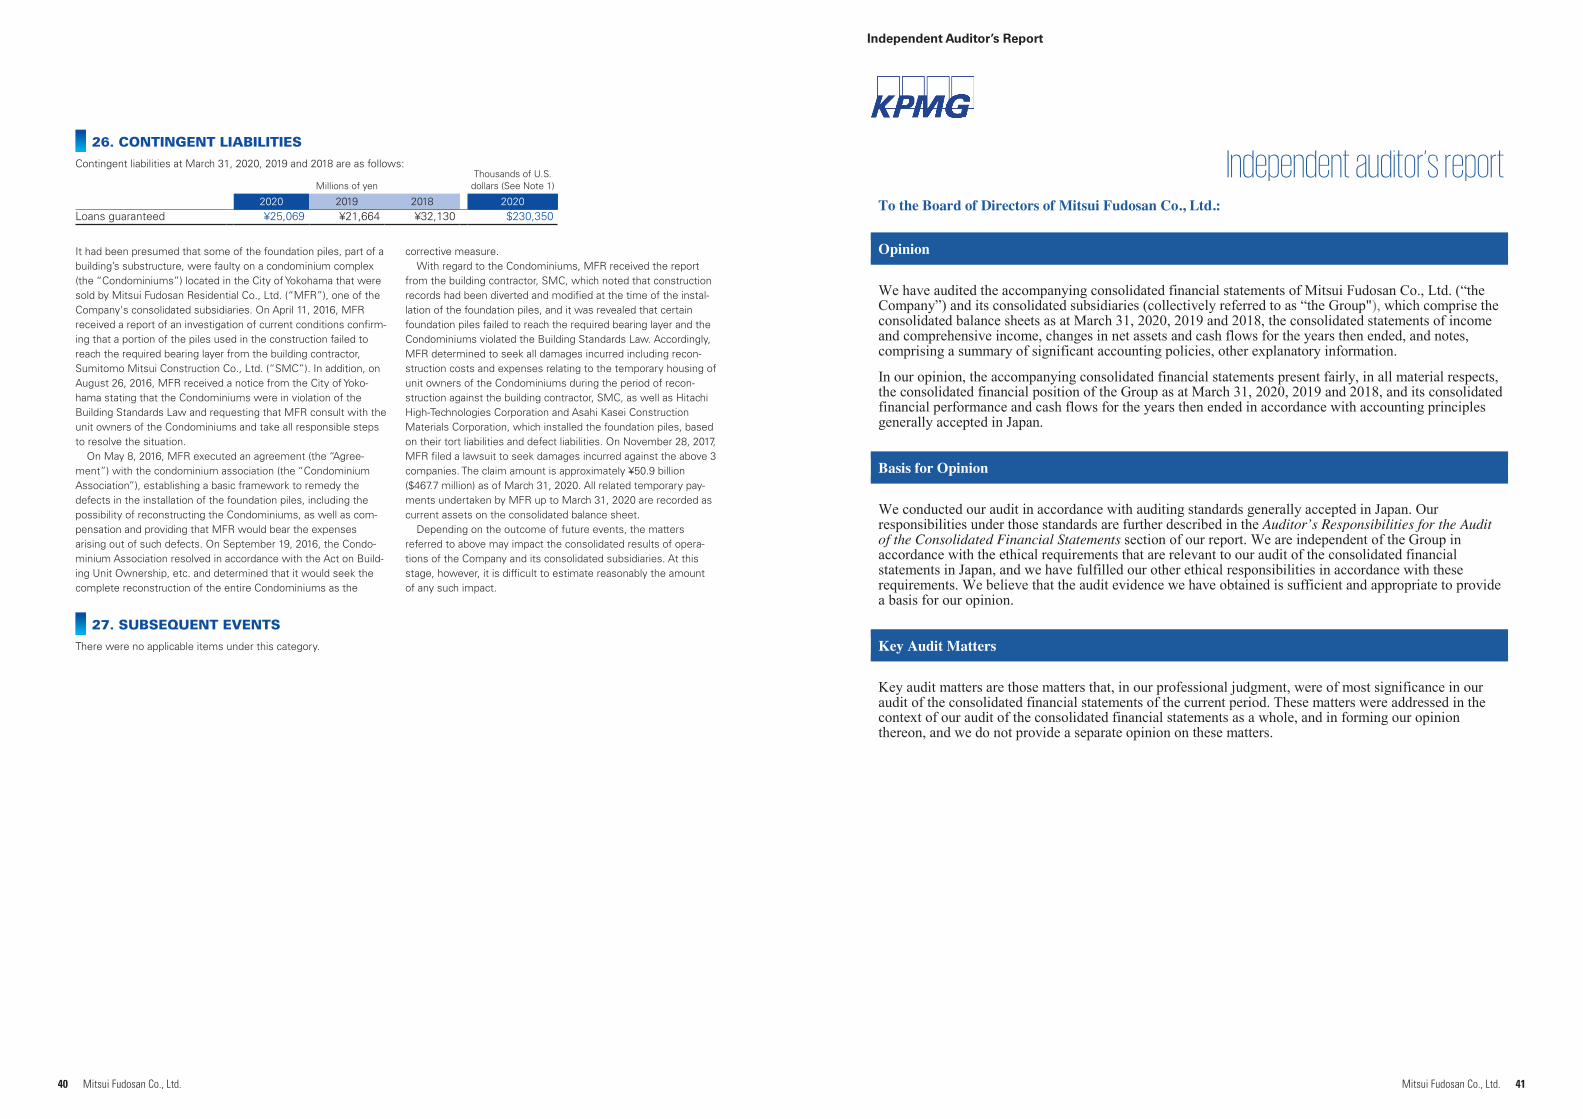
40 41Mitsui Fudosan Co., Ltd. Mitsui Fudosan Co., Ltd.
Independent Auditor’s Report
Independent auditor’s report To the Board of Directors of Mitsui Fudosan Co., Ltd.:
Opinion
We have audited the accompanying consolidated financial statements of Mitsui Fudosan Co., Ltd. (“the Company”) and its consolidated subsidiaries (collectively referred to as “the Group"), which comprise the consolidated balance sheets as at March 31, 2020, 2019 and 2018, the consolidated statements of income and comprehensive income, changes in net assets and cash flows for the years then ended, and notes, comprising a summary of significant accounting policies, other explanatory information.
In our opinion, the accompanying consolidated financial statements present fairly, in all material respects, the consolidated financial position of the Group as at March 31, 2020, 2019 and 2018, and its consolidated financial performance and cash flows for the years then ended in accordance with accounting principles generally accepted in Japan.
Basis for Opinion
We conducted our audit in accordance with auditing standards generally accepted in Japan. Our responsibilities under those standards are further described in the Auditor’s Responsibilities for the Audit of the Consolidated Financial Statements section of our report. We are independent of the Group in accordance with the ethical requirements that are relevant to our audit of the consolidated financial statements in Japan, and we have fulfilled our other ethical responsibilities in accordance with these requirements. We believe that the audit evidence we have obtained is sufficient and appropriate to provide a basis for our opinion.
Key Audit Matters
Key audit matters are those matters that, in our professional judgment, were of most significance in our audit of the consolidated financial statements of the current period. These matters were addressed in the context of our audit of the consolidated financial statements as a whole, and in forming our opinion thereon, and we do not provide a separate opinion on these matters.
It had been presumed that some of the foundation piles, part of a building’s substructure, were faulty on a condominium complex (the “Condominiums”) located in the City of Yokohama that were sold by Mitsui Fudosan Residential Co., Ltd. (“MFR”), one of the Company's consolidated subsidiaries. On April 11, 2016, MFR received a report of an investigation of current conditions confirm-ing that a portion of the piles used in the construction failed to reach the required bearing layer from the building contractor, Sumitomo Mitsui Construction Co., Ltd. (“SMC”). In addition, on August 26, 2016, MFR received a notice from the City of Yoko-hama stating that the Condominiums were in violation of the Building Standards Law and requesting that MFR consult with the unit owners of the Condominiums and take all responsible steps to resolve the situation.
On May 8, 2016, MFR executed an agreement (the “Agree-ment”) with the condominium association (the “Condominium Association”), establishing a basic framework to remedy the defects in the installation of the foundation piles, including the possibility of reconstructing the Condominiums, as well as com-pensation and providing that MFR would bear the expenses arising out of such defects. On September 19, 2016, the Condo-minium Association resolved in accordance with the Act on Build-ing Unit Ownership, etc. and determined that it would seek the complete reconstruction of the entire Condominiums as the
corrective measure.With regard to the Condominiums, MFR received the report
from the building contractor, SMC, which noted that construction records had been diverted and modified at the time of the instal-lation of the foundation piles, and it was revealed that certain foundation piles failed to reach the required bearing layer and the Condominiums violated the Building Standards Law. Accordingly, MFR determined to seek all damages incurred including recon-struction costs and expenses relating to the temporary housing of unit owners of the Condominiums during the period of recon-struction against the building contractor, SMC, as well as Hitachi High-Technologies Corporation and Asahi Kasei Construction Materials Corporation, which installed the foundation piles, based on their tort liabilities and defect liabilities. On November 28, 2017, MFR filed a lawsuit to seek damages incurred against the above 3 companies. The claim amount is approximately ¥50.9 billion ($467.7 million) as of March 31, 2020. All related temporary pay-ments undertaken by MFR up to March 31, 2020 are recorded as current assets on the consolidated balance sheet.
Depending on the outcome of future events, the matters referred to above may impact the consolidated results of opera-tions of the Company and its consolidated subsidiaries. At this stage, however, it is difficult to estimate reasonably the amount of any such impact.
Millions of yenThousands of U.S.
dollars (See Note 1)
2020 2019 2018 2020Loans guaranteed ¥25,069 ¥21,664 ¥32,130 $230,350
26. CONTINGENT LIABILITIES
Contingent liabilities at March 31, 2020, 2019 and 2018 are as follows:
27. SUBSEQUENT EVENTS
There were no applicable items under this category.
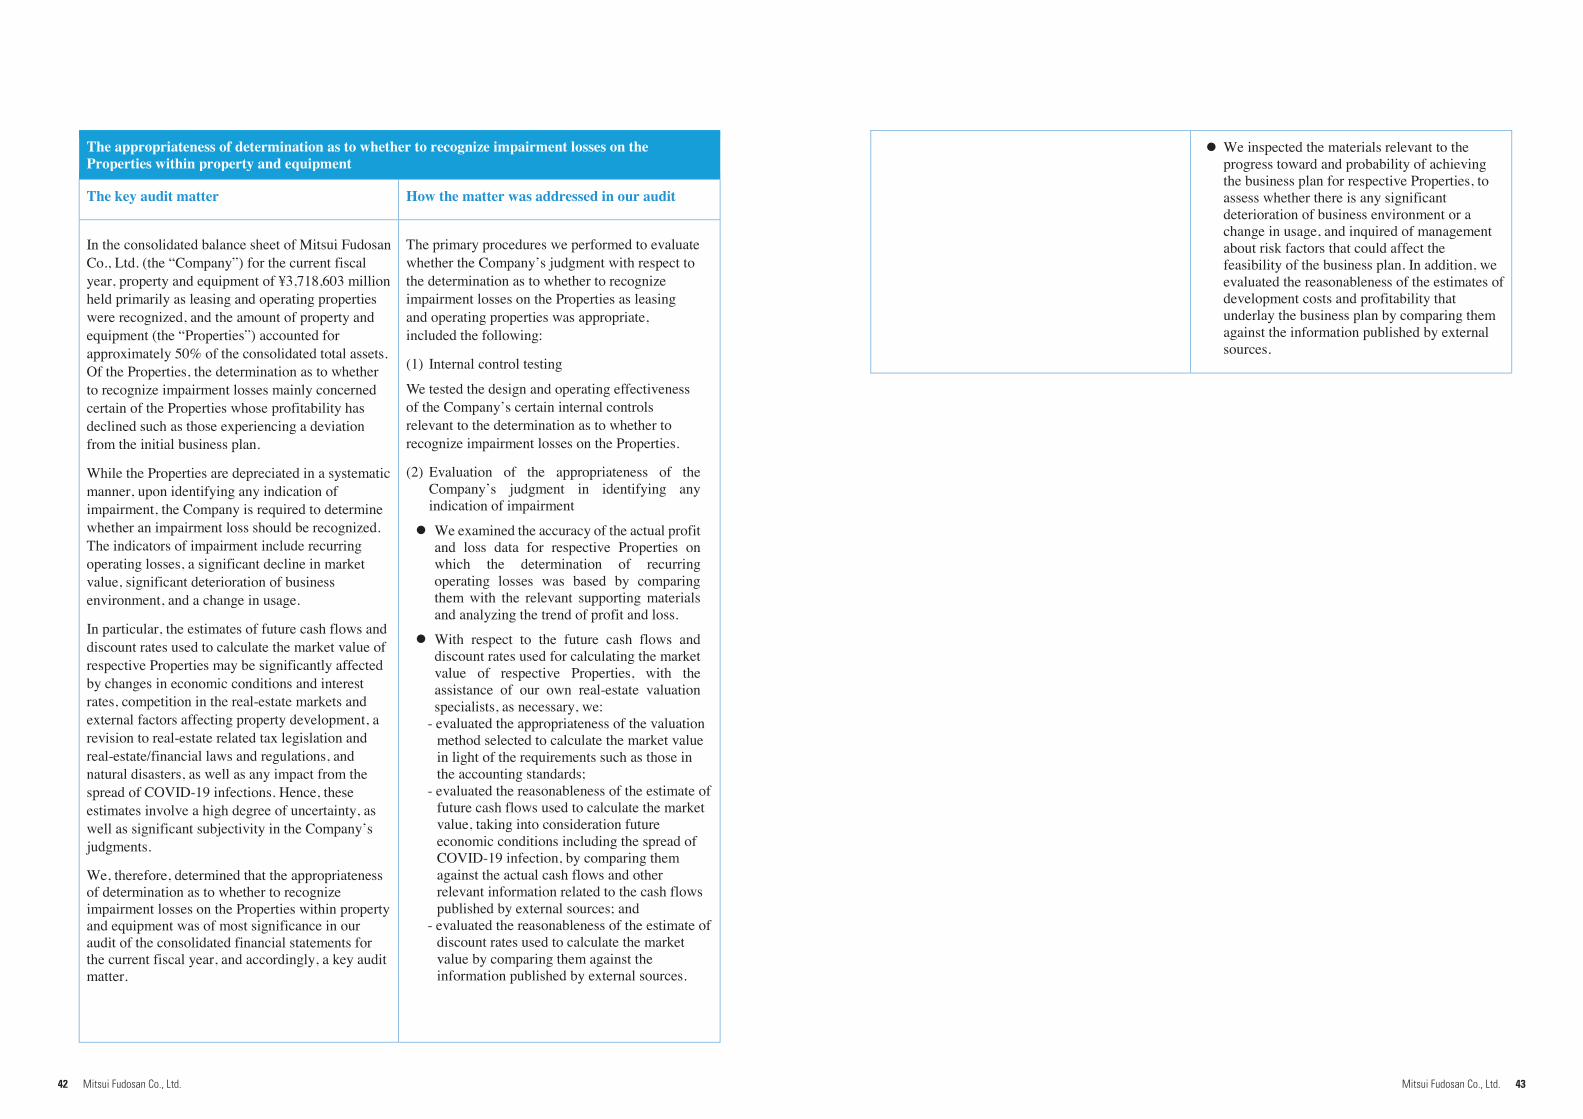
42 43Mitsui Fudosan Co., Ltd. Mitsui Fudosan Co., Ltd.
The appropriateness of determination as to whether to recognize impairment losses on the Properties within property and equipment
The key audit matter How the matter was addressed in our audit
In the consolidated balance sheet of Mitsui Fudosan Co., Ltd. (the “Company”) for the current fiscal year, property and equipment of ¥3,718,603 million held primarily as leasing and operating properties were recognized, and the amount of property and equipment (the “Properties”) accounted for approximately 50% of the consolidated total assets. Of the Properties, the determination as to whether to recognize impairment losses mainly concerned certain of the Properties whose profitability has declined such as those experiencing a deviation from the initial business plan.
While the Properties are depreciated in a systematic manner, upon identifying any indication of impairment, the Company is required to determine whether an impairment loss should be recognized.The indicators of impairment include recurring operating losses, a significant decline in market value, significant deterioration of business environment, and a change in usage.
In particular, the estimates of future cash flows and discount rates used to calculate the market value of respective Properties may be significantly affected by changes in economic conditions and interest rates, competition in the real-estate markets and external factors affecting property development, a revision to real-estate related tax legislation and real-estate/financial laws and regulations, and natural disasters, as well as any impact from the spread of COVID-19 infections. Hence, these estimates involve a high degree of uncertainty, as well as significant subjectivity in the Company’s judgments.
We, therefore, determined that the appropriateness of determination as to whether to recognize impairment losses on the Properties within property and equipment was of most significance in our audit of the consolidated financial statements for the current fiscal year, and accordingly, a key audit matter.
The primary procedures we performed to evaluate whether the Company’s judgment with respect to the determination as to whether to recognize impairment losses on the Properties as leasing and operating properties was appropriate, included the following:
(1) Internal control testing
We tested the design and operating effectiveness of the Company’s certain internal controls relevant to the determination as to whether to recognize impairment losses on the Properties.
(2) Evaluation of the appropriateness of the Company’s judgment in identifying any indication of impairment
We examined the accuracy of the actual profit and loss data for respective Properties on which the determination of recurring operating losses was based by comparing them with the relevant supporting materials and analyzing the trend of profit and loss.
With respect to the future cash flows and discount rates used for calculating the market value of respective Properties, with the assistance of our own real-estate valuationspecialists, as necessary, we:
- evaluated the appropriateness of the valuation method selected to calculate the market value in light of the requirements such as those in the accounting standards;
- evaluated the reasonableness of the estimate of future cash flows used to calculate the market value, taking into consideration future economic conditions including the spread of COVID-19 infection, by comparing them against the actual cash flows and other relevant information related to the cash flows published by external sources; and
- evaluated the reasonableness of the estimate of discount rates used to calculate the market value by comparing them against the information published by external sources.
We inspected the materials relevant to the progress toward and probability of achieving the business plan for respective Properties, to assess whether there is any significant deterioration of business environment or a change in usage, and inquired of management about risk factors that could affect the feasibility of the business plan. In addition, we evaluated the reasonableness of the estimates of development costs and profitability that underlay the business plan by comparing them against the information published by external sources.
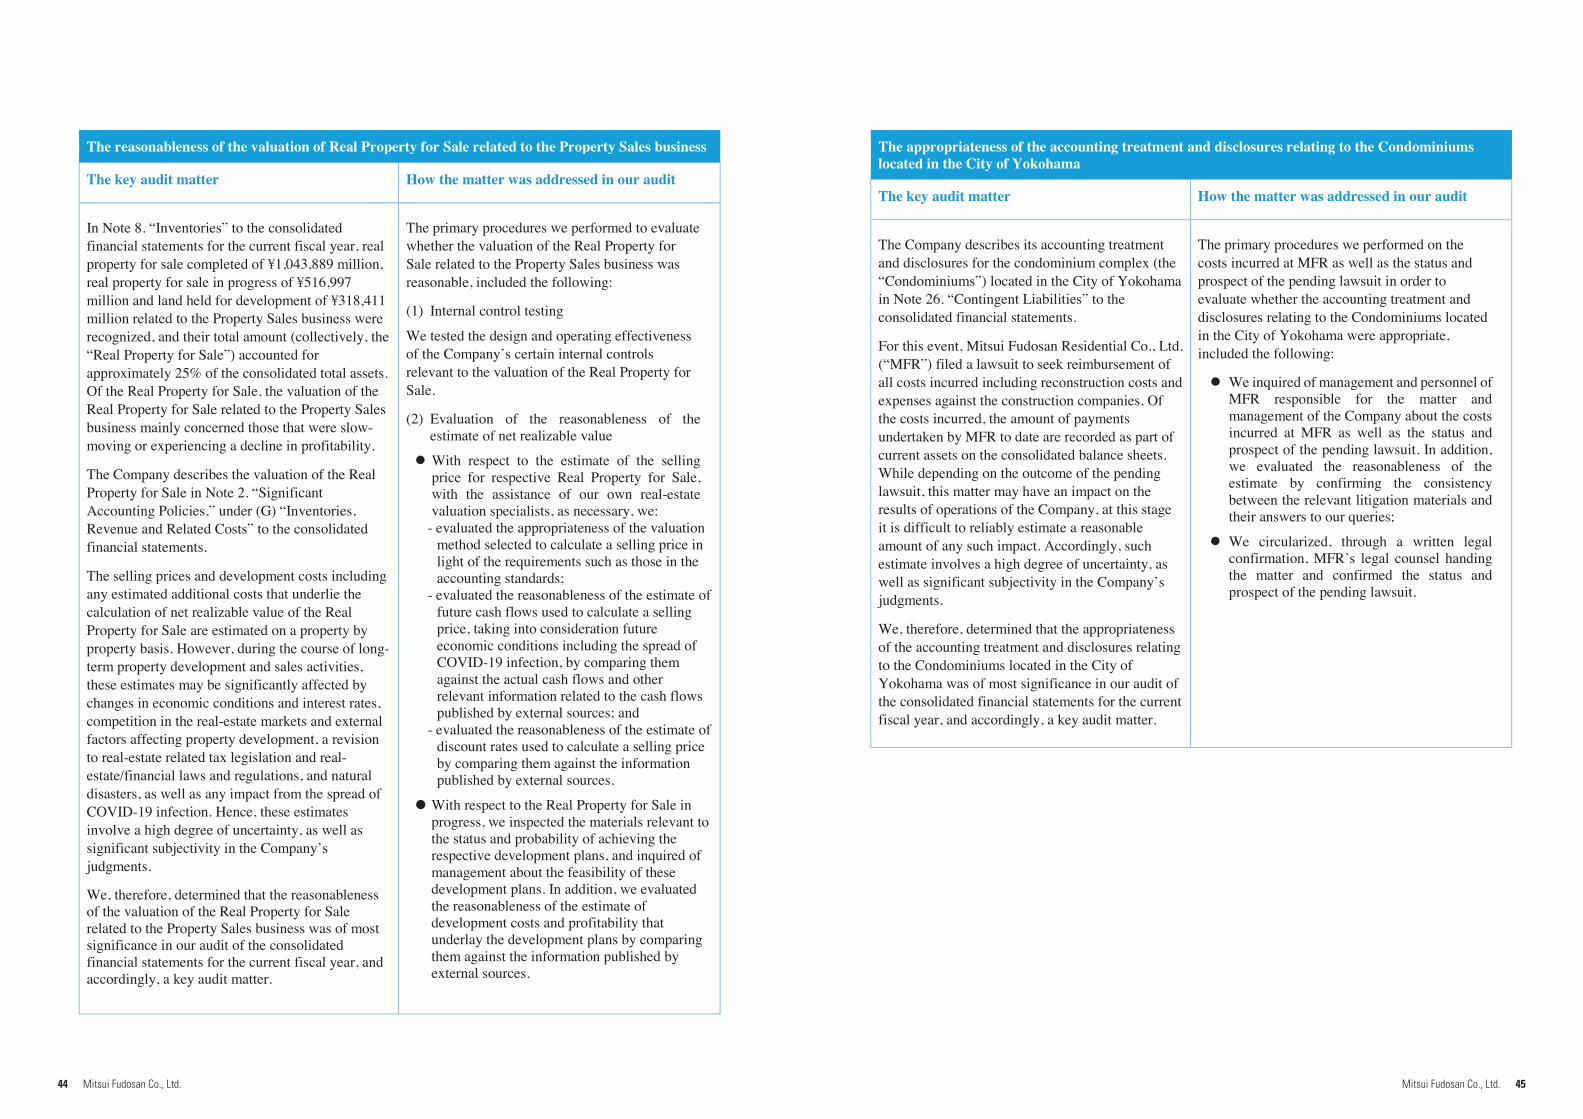
44 45Mitsui Fudosan Co., Ltd. Mitsui Fudosan Co., Ltd.
The reasonableness of the valuation of Real Property for Sale related to the Property Sales business
The key audit matter How the matter was addressed in our audit
In Note 8. “Inventories” to the consolidated financial statements for the current fiscal year, real property for sale completed of ¥1,043,889 million, real property for sale in progress of ¥516,997 million and land held for development of ¥318,411 million related to the Property Sales business were recognized, and their total amount (collectively, the “Real Property for Sale”) accounted for approximately 25% of the consolidated total assets. Of the Real Property for Sale, the valuation of the Real Property for Sale related to the Property Sales business mainly concerned those that were slow-moving or experiencing a decline in profitability.
The Company describes the valuation of the Real Property for Sale in Note 2. “Significant Accounting Policies,” under (G) “Inventories,Revenue and Related Costs” to the consolidated financial statements.
The selling prices and development costs including any estimated additional costs that underlie the calculation of net realizable value of the Real Property for Sale are estimated on a property by property basis. However, during the course of long-term property development and sales activities, these estimates may be significantly affected by changes in economic conditions and interest rates, competition in the real-estate markets and external factors affecting property development, a revision to real-estate related tax legislation and real-estate/financial laws and regulations, and natural disasters, as well as any impact from the spread of COVID-19 infection. Hence, these estimates involve a high degree of uncertainty, as well as significant subjectivity in the Company’s judgments.
We, therefore, determined that the reasonableness of the valuation of the Real Property for Sale related to the Property Sales business was of most significance in our audit of the consolidated financial statements for the current fiscal year, and accordingly, a key audit matter.
The primary procedures we performed to evaluate whether the valuation of the Real Property for Sale related to the Property Sales business was reasonable, included the following:
(1) Internal control testing
We tested the design and operating effectiveness of the Company’s certain internal controls relevant to the valuation of the Real Property for Sale.
(2) Evaluation of the reasonableness of the estimate of net realizable value
With respect to the estimate of the selling price for respective Real Property for Sale, with the assistance of our own real-estate valuation specialists, as necessary, we:
- evaluated the appropriateness of the valuation method selected to calculate a selling price in light of the requirements such as those in the accounting standards;
- evaluated the reasonableness of the estimate of future cash flows used to calculate a selling price, taking into consideration future economic conditions including the spread of COVID-19 infection, by comparing them against the actual cash flows and other relevant information related to the cash flows published by external sources; and
- evaluated the reasonableness of the estimate of discount rates used to calculate a selling price by comparing them against the information published by external sources.
With respect to the Real Property for Sale in progress, we inspected the materials relevant to the status and probability of achieving the respective development plans, and inquired of management about the feasibility of these development plans. In addition, we evaluated the reasonableness of the estimate of development costs and profitability that underlay the development plans by comparing them against the information published by external sources.
The appropriateness of the accounting treatment and disclosures relating to the Condominiums located in the City of Yokohama
The key audit matter How the matter was addressed in our audit
The Company describes its accounting treatment and disclosures for the condominium complex (the “Condominiums”) located in the City of Yokohama in Note 26. “Contingent Liabilities” to the consolidated financial statements.
For this event, Mitsui Fudosan Residential Co., Ltd. (“MFR”) filed a lawsuit to seek reimbursement of all costs incurred including reconstruction costs and expenses against the construction companies. Of the costs incurred, the amount of payments undertaken by MFR to date are recorded as part of current assets on the consolidated balance sheets. While depending on the outcome of the pending lawsuit, this matter may have an impact on the results of operations of the Company, at this stage it is difficult to reliably estimate a reasonable amount of any such impact. Accordingly, such estimate involves a high degree of uncertainty, as well as significant subjectivity in the Company’s judgments.
We, therefore, determined that the appropriateness of the accounting treatment and disclosures relating to the Condominiums located in the City of Yokohama was of most significance in our audit of the consolidated financial statements for the current fiscal year, and accordingly, a key audit matter.
The primary procedures we performed on the costs incurred at MFR as well as the status and prospect of the pending lawsuit in order to evaluate whether the accounting treatment and disclosures relating to the Condominiums located in the City of Yokohama were appropriate,included the following:
We inquired of management and personnel of MFR responsible for the matter and management of the Company about the costs incurred at MFR as well as the status and prospect of the pending lawsuit. In addition, we evaluated the reasonableness of the estimate by confirming the consistency between the relevant litigation materials and their answers to our queries;
We circularized, through a written legal confirmation, MFR’s legal counsel handing the matter and confirmed the status and prospect of the pending lawsuit.
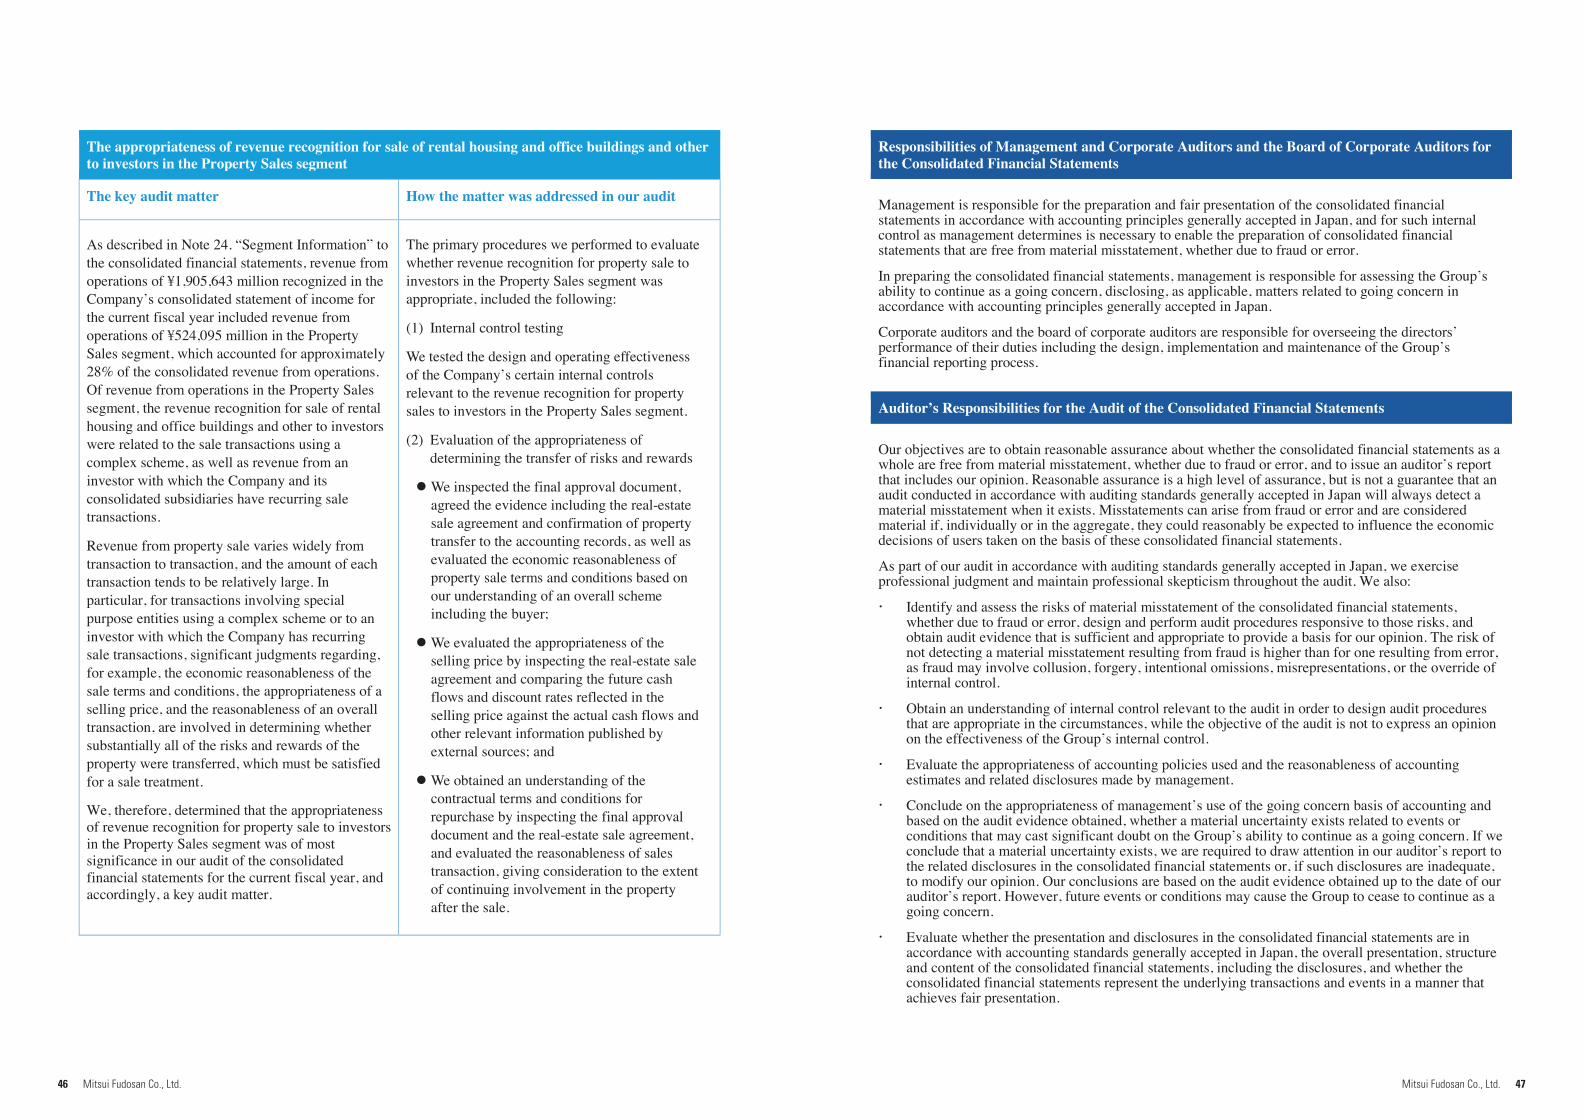
46 47Mitsui Fudosan Co., Ltd. Mitsui Fudosan Co., Ltd.
The appropriateness of revenue recognition for sale of rental housing and office buildings and other to investors in the Property Sales segment
The key audit matter How the matter was addressed in our audit
As described in Note 24. “Segment Information” to the consolidated financial statements, revenue from operations of ¥1,905,643 million recognized in the Company’s consolidated statement of income for the current fiscal year included revenue from operations of ¥524,095 million in the Property Sales segment, which accounted for approximately 28% of the consolidated revenue from operations. Of revenue from operations in the Property Sales segment, the revenue recognition for sale of rental housing and office buildings and other to investors were related to the sale transactions using a complex scheme, as well as revenue from an investor with which the Company and its consolidated subsidiaries have recurring sale transactions.
Revenue from property sale varies widely from transaction to transaction, and the amount of each transaction tends to be relatively large. In particular, for transactions involving special purpose entities using a complex scheme or to aninvestor with which the Company has recurring sale transactions, significant judgments regarding, for example, the economic reasonableness of the sale terms and conditions, the appropriateness of a selling price, and the reasonableness of an overall transaction, are involved in determining whether substantially all of the risks and rewards of the property were transferred, which must be satisfied for a sale treatment.
We, therefore, determined that the appropriateness of revenue recognition for property sale to investors in the Property Sales segment was of most significance in our audit of the consolidated financial statements for the current fiscal year, and accordingly, a key audit matter.
The primary procedures we performed to evaluate whether revenue recognition for property sale to investors in the Property Sales segment was appropriate, included the following:
(1) Internal control testing
We tested the design and operating effectiveness of the Company’s certain internal controls relevant to the revenue recognition for property sales to investors in the Property Sales segment.
(2) Evaluation of the appropriateness of determining the transfer of risks and rewards
We inspected the final approval document, agreed the evidence including the real-estate sale agreement and confirmation of property transfer to the accounting records, as well as evaluated the economic reasonableness of property sale terms and conditions based on our understanding of an overall scheme including the buyer;
We evaluated the appropriateness of the selling price by inspecting the real-estate sale agreement and comparing the future cash flows and discount rates reflected in the selling price against the actual cash flows and other relevant information published by external sources; and
We obtained an understanding of the contractual terms and conditions for repurchase by inspecting the final approval document and the real-estate sale agreement, and evaluated the reasonableness of sales transaction, giving consideration to the extent of continuing involvement in the property after the sale.
Responsibilities of Management and Corporate Auditors and the Board of Corporate Auditors for the Consolidated Financial Statements
Management is responsible for the preparation and fair presentation of the consolidated financial statements in accordance with accounting principles generally accepted in Japan, and for such internal control as management determines is necessary to enable the preparation of consolidated financial statements that are free from material misstatement, whether due to fraud or error.
In preparing the consolidated financial statements, management is responsible for assessing the Group’s ability to continue as a going concern, disclosing, as applicable, matters related to going concern in accordance with accounting principles generally accepted in Japan.
Corporate auditors and the board of corporate auditors are responsible for overseeing the directors’ performance of their duties including the design, implementation and maintenance of the Group’s financial reporting process.
Auditor’s Responsibilities for the Audit of the Consolidated Financial Statements
Our objectives are to obtain reasonable assurance about whether the consolidated financial statements as a whole are free from material misstatement, whether due to fraud or error, and to issue an auditor’s report that includes our opinion. Reasonable assurance is a high level of assurance, but is not a guarantee that an audit conducted in accordance with auditing standards generally accepted in Japan will always detect a material misstatement when it exists. Misstatements can arise from fraud or error and are considered material if, individually or in the aggregate, they could reasonably be expected to influence the economic decisions of users taken on the basis of these consolidated financial statements.
As part of our audit in accordance with auditing standards generally accepted in Japan, we exercise professional judgment and maintain professional skepticism throughout the audit. We also:
Identify and assess the risks of material misstatement of the consolidated financial statements, whether due to fraud or error, design and perform audit procedures responsive to those risks, and obtain audit evidence that is sufficient and appropriate to provide a basis for our opinion. The risk of not detecting a material misstatement resulting from fraud is higher than for one resulting from error, as fraud may involve collusion, forgery, intentional omissions, misrepresentations, or the override of internal control.
Obtain an understanding of internal control relevant to the audit in order to design audit procedures that are appropriate in the circumstances, while the objective of the audit is not to express an opinion on the effectiveness of the Group’s internal control.
Evaluate the appropriateness of accounting policies used and the reasonableness of accounting estimates and related disclosures made by management.
Conclude on the appropriateness of management’s use of the going concern basis of accounting and based on the audit evidence obtained, whether a material uncertainty exists related to events or conditions that may cast significant doubt on the Group’s ability to continue as a going concern. If we conclude that a material uncertainty exists, we are required to draw attention in our auditor’s report to the related disclosures in the consolidated financial statements or, if such disclosures are inadequate, to modify our opinion. Our conclusions are based on the audit evidence obtained up to the date of our auditor’s report. However, future events or conditions may cause the Group to cease to continue as a going concern.
Evaluate whether the presentation and disclosures in the consolidated financial statements are in accordance with accounting standards generally accepted in Japan, the overall presentation, structure and content of the consolidated financial statements, including the disclosures, and whether theconsolidated financial statements represent the underlying transactions and events in a manner that achieves fair presentation.
48 49Mitsui Fudosan Co., Ltd. Mitsui Fudosan Co., Ltd.
Obtain sufficient appropriate audit evidence regarding the financial information of the entities or business activities within the Group to express an opinion on the consolidated financial statements. We are responsible for the direction, supervision and performance of the group audit. We remain solely responsible for our audit opinion.
We communicate with corporate auditors and the board of corporate auditors regarding, among other matters, the planned scope and timing of the audit, significant audit findings, including any significant deficiencies in internal control that we identify during our audit.
We also provide corporate auditors and the board of corporate auditors with a statement that we have complied with relevant ethical requirements regarding independence, and communicate with them all relationships and other matters that may reasonably be thought to bear on our independence, and where applicable, related safeguards.
From the matters communicated with corporate auditors and the board of corporate auditors, we determine those matters that were of most significance in the audit of the consolidated financial statements of the current period and are therefore the key audit matters. We describe these matters in our auditor’s report unless law or regulation precludes public disclosure about the matter or when, in extremely rare circumstances, we determine that a matter should not be communicated in our report because the adverse consequences of doing so would reasonably be expected to outweigh the public interest benefits of such communication.
Convenience Translation
The U.S. dollar amounts in the accompanying consolidated financial statements with respect to the year ended March 31, 2020 are presented solely for convenience. Our audit also included the translation of yen amounts into U.S. dollar amounts and, in our opinion, such translation has been made on the basis described in Note 1 to the consolidated financial statements.
Interest required to be disclosed by the Certified Public Accountants Act of Japan
We do not have any interest in the Group which is required to be disclosed pursuant to the provisions of the Certified Public Accountants Act of Japan.
/S/Hiroyuki YamadaDesignated Engagement PartnerCertified Public Accountant
/S/Hiroyuki ItohDesignated Engagement PartnerCertified Public Accountant
/S/Hironori HashizumeDesignated Engagement PartnerCertified Public Accountant
KPMG AZSA LLCTokyo Office, JapanJune 26, 2020
Notes to the Reader of Independent Auditor’s Report:This is a copy of the Independent Auditor’s Report and the original copies are kept separately by the Company and KPMG AZSA LLC.
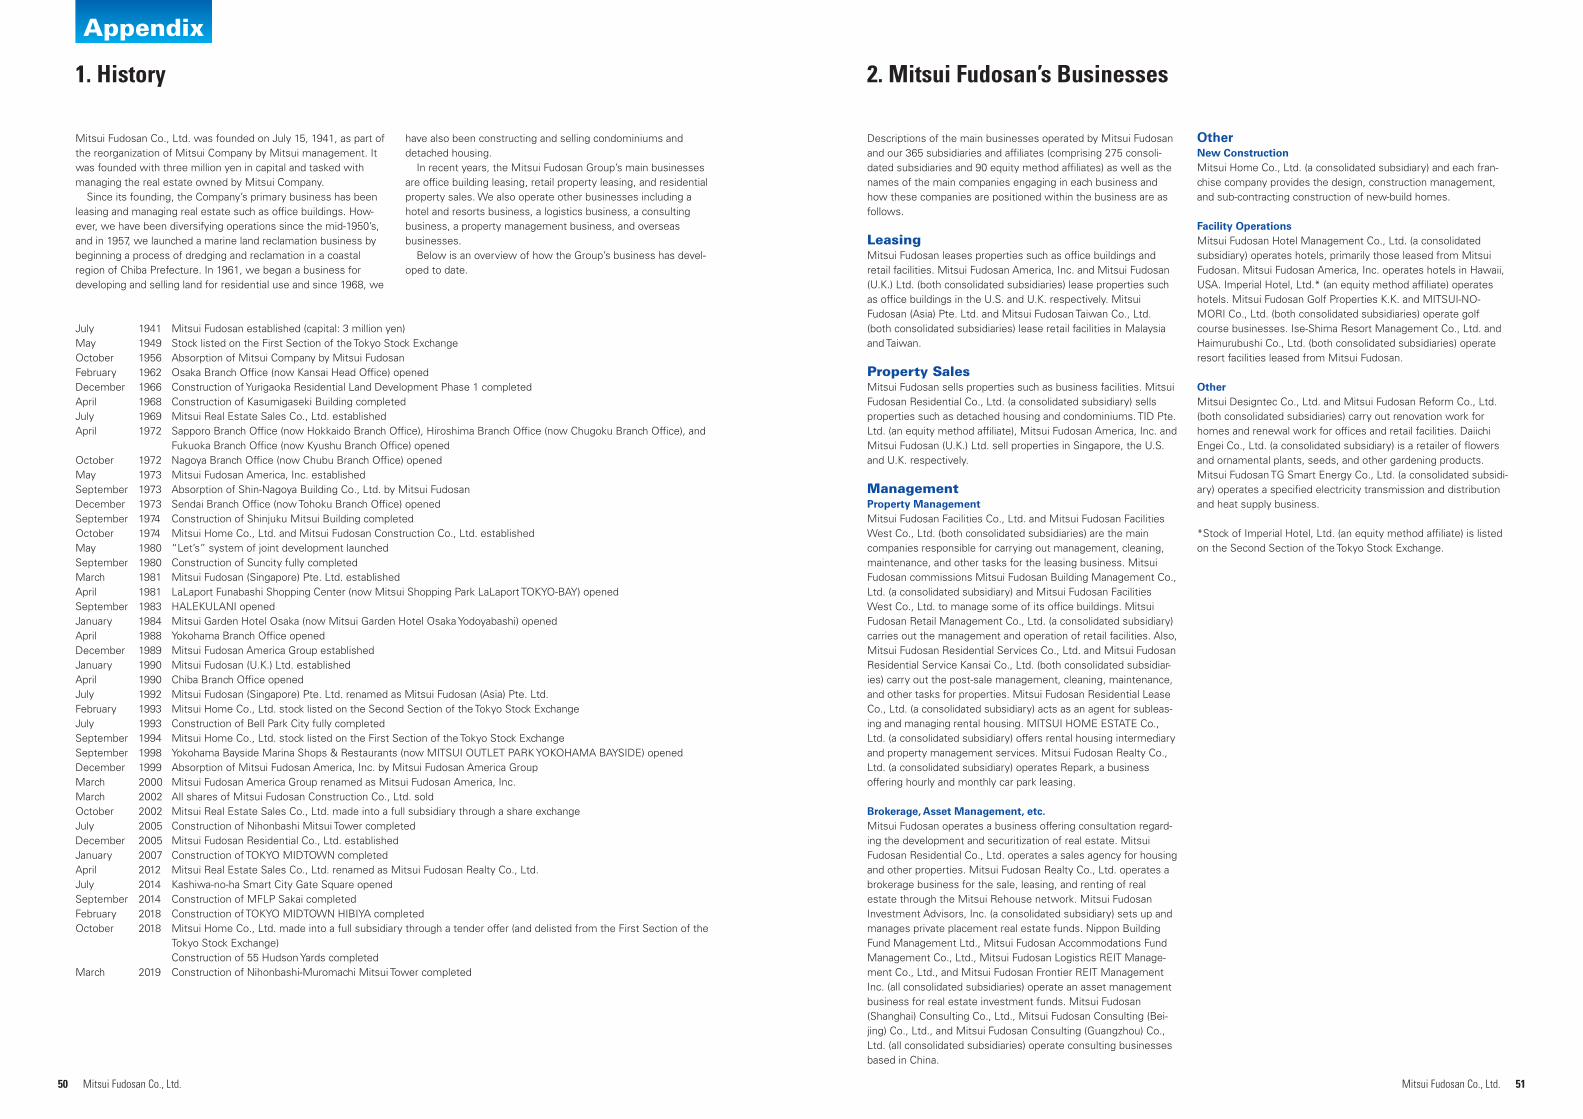
50 Mitsui Fudosan Co., Ltd.
Mitsui Fudosan Co., Ltd. was founded on July 15, 1941, as part of the reorganization of Mitsui Company by Mitsui management. It was founded with three million yen in capital and tasked with managing the real estate owned by Mitsui Company.
Since its founding, the Company’s primary business has been leasing and managing real estate such as office buildings. How-ever, we have been diversifying operations since the mid-1950’s, and in 1957, we launched a marine land reclamation business by beginning a process of dredging and reclamation in a coastal region of Chiba Prefecture. In 1961, we began a business for developing and selling land for residential use and since 1968, we
have also been constructing and selling condominiums and detached housing.
In recent years, the Mitsui Fudosan Group’s main businesses are office building leasing, retail property leasing, and residential property sales. We also operate other businesses including a hotel and resorts business, a logistics business, a consulting business, a property management business, and overseas businesses.
Below is an overview of how the Group’s business has devel-oped to date.
July 1941 Mitsui Fudosan established (capital: 3 million yen)May 1949 Stock listed on the First Section of the Tokyo Stock ExchangeOctober 1956 Absorption of Mitsui Company by Mitsui FudosanFebruary 1962 Osaka Branch Office (now Kansai Head Office) openedDecember 1966 Construction of Yurigaoka Residential Land Development Phase 1 completedApril 1968 Construction of Kasumigaseki Building completedJuly 1969 Mitsui Real Estate Sales Co., Ltd. established April 1972 Sapporo Branch Office (now Hokkaido Branch Office), Hiroshima Branch Office (now Chugoku Branch Office), and
Fukuoka Branch Office (now Kyushu Branch Office) openedOctober 1972 Nagoya Branch Office (now Chubu Branch Office) openedMay 1973 Mitsui Fudosan America, Inc. established September 1973 Absorption of Shin-Nagoya Building Co., Ltd. by Mitsui FudosanDecember 1973 Sendai Branch Office (now Tohoku Branch Office) openedSeptember 1974 Construction of Shinjuku Mitsui Building completed October 1974 Mitsui Home Co., Ltd. and Mitsui Fudosan Construction Co., Ltd. established May 1980 “Let’s” system of joint development launchedSeptember 1980 Construction of Suncity fully completed March 1981 Mitsui Fudosan (Singapore) Pte. Ltd. established April 1981 LaLaport Funabashi Shopping Center (now Mitsui Shopping Park LaLaport TOKYO-BAY) opened September 1983 HALEKULANI opened January 1984 Mitsui Garden Hotel Osaka (now Mitsui Garden Hotel Osaka Yodoyabashi) openedApril 1988 Yokohama Branch Office openedDecember 1989 Mitsui Fudosan America Group establishedJanuary 1990 Mitsui Fudosan (U.K.) Ltd. established April 1990 Chiba Branch Office openedJuly 1992 Mitsui Fudosan (Singapore) Pte. Ltd. renamed as Mitsui Fudosan (Asia) Pte. Ltd.February 1993 Mitsui Home Co., Ltd. stock listed on the Second Section of the Tokyo Stock ExchangeJuly 1993 Construction of Bell Park City fully completedSeptember 1994 Mitsui Home Co., Ltd. stock listed on the First Section of the Tokyo Stock ExchangeSeptember 1998 Yokohama Bayside Marina Shops & Restaurants (now MITSUI OUTLET PARK YOKOHAMA BAYSIDE) openedDecember 1999 Absorption of Mitsui Fudosan America, Inc. by Mitsui Fudosan America Group March 2000 Mitsui Fudosan America Group renamed as Mitsui Fudosan America, Inc.March 2002 All shares of Mitsui Fudosan Construction Co., Ltd. soldOctober 2002 Mitsui Real Estate Sales Co., Ltd. made into a full subsidiary through a share exchange July 2005 Construction of Nihonbashi Mitsui Tower completedDecember 2005 Mitsui Fudosan Residential Co., Ltd. establishedJanuary 2007 Construction of TOKYO MIDTOWN completedApril 2012 Mitsui Real Estate Sales Co., Ltd. renamed as Mitsui Fudosan Realty Co., Ltd.July 2014 Kashiwa-no-ha Smart City Gate Square openedSeptember 2014 Construction of MFLP Sakai completedFebruary 2018 Construction of TOKYO MIDTOWN HIBIYA completedOctober 2018 Mitsui Home Co., Ltd. made into a full subsidiary through a tender offer (and delisted from the First Section of the
Tokyo Stock Exchange) Construction of 55 Hudson Yards completed
March 2019 Construction of Nihonbashi-Muromachi Mitsui Tower completed
1. History
Appendix
51Mitsui Fudosan Co., Ltd.
Descriptions of the main businesses operated by Mitsui Fudosan and our 365 subsidiaries and affiliates (comprising 275 consoli-dated subsidiaries and 90 equity method affiliates) as well as the names of the main companies engaging in each business and how these companies are positioned within the business are as follows.
LeasingMitsui Fudosan leases properties such as office buildings and retail facilities. Mitsui Fudosan America, Inc. and Mitsui Fudosan (U.K.) Ltd. (both consolidated subsidiaries) lease properties such as office buildings in the U.S. and U.K. respectively. Mitsui Fudosan (Asia) Pte. Ltd. and Mitsui Fudosan Taiwan Co., Ltd. (both consolidated subsidiaries) lease retail facilities in Malaysia and Taiwan.
Property SalesMitsui Fudosan sells properties such as business facilities. Mitsui Fudosan Residential Co., Ltd. (a consolidated subsidiary) sells properties such as detached housing and condominiums. TID Pte. Ltd. (an equity method affiliate), Mitsui Fudosan America, Inc. and Mitsui Fudosan (U.K.) Ltd. sell properties in Singapore, the U.S. and U.K. respectively.
ManagementProperty ManagementMitsui Fudosan Facilities Co., Ltd. and Mitsui Fudosan Facilities West Co., Ltd. (both consolidated subsidiaries) are the main companies responsible for carrying out management, cleaning, maintenance, and other tasks for the leasing business. Mitsui Fudosan commissions Mitsui Fudosan Building Management Co., Ltd. (a consolidated subsidiary) and Mitsui Fudosan Facilities West Co., Ltd. to manage some of its office buildings. Mitsui Fudosan Retail Management Co., Ltd. (a consolidated subsidiary) carries out the management and operation of retail facilities. Also, Mitsui Fudosan Residential Services Co., Ltd. and Mitsui Fudosan Residential Service Kansai Co., Ltd. (both consolidated subsidiar-ies) carry out the post-sale management, cleaning, maintenance, and other tasks for properties. Mitsui Fudosan Residential Lease Co., Ltd. (a consolidated subsidiary) acts as an agent for subleas-ing and managing rental housing. MITSUI HOME ESTATE Co., Ltd. (a consolidated subsidiary) offers rental housing intermediary and property management services. Mitsui Fudosan Realty Co., Ltd. (a consolidated subsidiary) operates Repark, a business offering hourly and monthly car park leasing.
Brokerage, Asset Management, etc.Mitsui Fudosan operates a business offering consultation regard-ing the development and securitization of real estate. Mitsui Fudosan Residential Co., Ltd. operates a sales agency for housing and other properties. Mitsui Fudosan Realty Co., Ltd. operates a brokerage business for the sale, leasing, and renting of real estate through the Mitsui Rehouse network. Mitsui Fudosan Investment Advisors, Inc. (a consolidated subsidiary) sets up and manages private placement real estate funds. Nippon Building Fund Management Ltd., Mitsui Fudosan Accommodations Fund Management Co., Ltd., Mitsui Fudosan Logistics REIT Manage-ment Co., Ltd., and Mitsui Fudosan Frontier REIT Management Inc. (all consolidated subsidiaries) operate an asset management business for real estate investment funds. Mitsui Fudosan (Shanghai) Consulting Co., Ltd., Mitsui Fudosan Consulting (Bei-jing) Co., Ltd., and Mitsui Fudosan Consulting (Guangzhou) Co., Ltd. (all consolidated subsidiaries) operate consulting businesses based in China.
OtherNew ConstructionMitsui Home Co., Ltd. (a consolidated subsidiary) and each fran-chise company provides the design, construction management, and sub-contracting construction of new-build homes.
Facility OperationsMitsui Fudosan Hotel Management Co., Ltd. (a consolidated subsidiary) operates hotels, primarily those leased from Mitsui Fudosan. Mitsui Fudosan America, Inc. operates hotels in Hawaii, USA. Imperial Hotel, Ltd.* (an equity method affiliate) operates hotels. Mitsui Fudosan Golf Properties K.K. and MITSUI-NO-MORI Co., Ltd. (both consolidated subsidiaries) operate golf course businesses. Ise-Shima Resort Management Co., Ltd. and Haimurubushi Co., Ltd. (both consolidated subsidiaries) operate resort facilities leased from Mitsui Fudosan.
OtherMitsui Designtec Co., Ltd. and Mitsui Fudosan Reform Co., Ltd. (both consolidated subsidiaries) carry out renovation work for homes and renewal work for offices and retail facilities. Daiichi Engei Co., Ltd. (a consolidated subsidiary) is a retailer of flowers and ornamental plants, seeds, and other gardening products. Mitsui Fudosan TG Smart Energy Co., Ltd. (a consolidated subsidi-ary) operates a specified electricity transmission and distribution and heat supply business.
*Stock of Imperial Hotel, Ltd. (an equity method affiliate) is listed on the Second Section of the Tokyo Stock Exchange.
2. Mitsui Fudosan’s Businesses
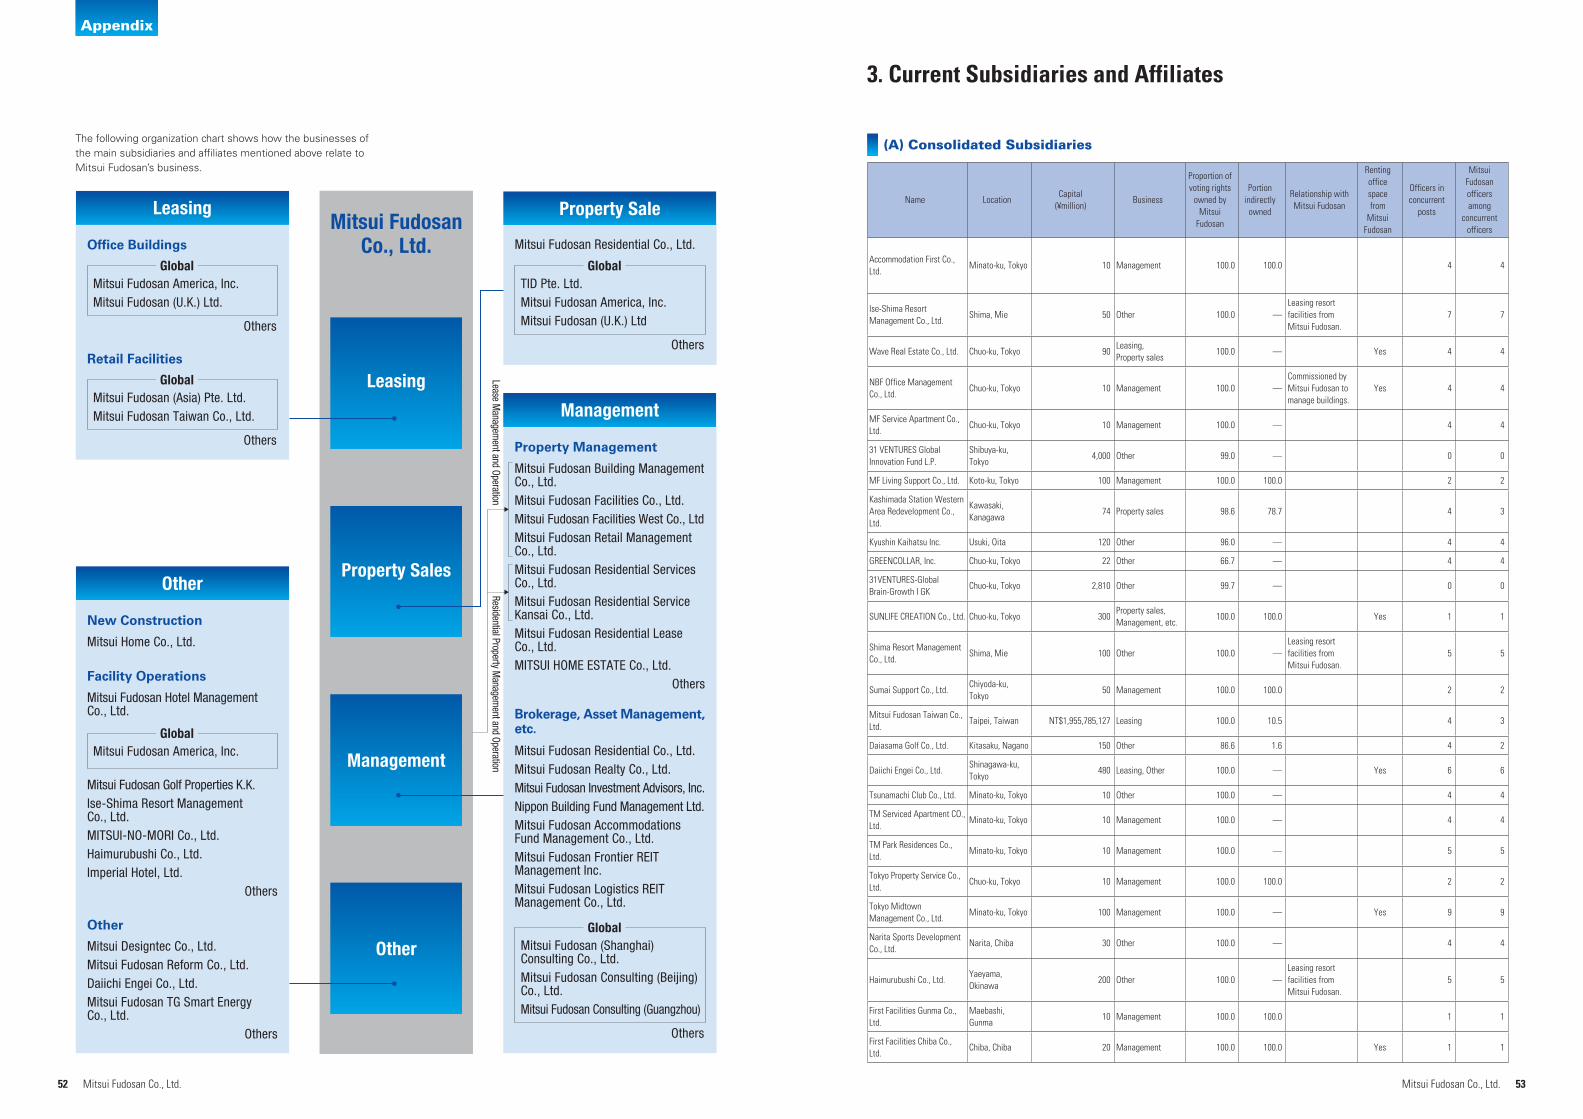
52 Mitsui Fudosan Co., Ltd.
Leasing
Property Sales
Management
Other
Mitsui FudosanCo., Ltd.
Leasing
Office Buildings
Mitsui Fudosan America, Inc.Mitsui Fudosan (U.K.) Ltd.
Others
Global
Retail Facilities
Mitsui Fudosan (Asia) Pte. Ltd.Mitsui Fudosan Taiwan Co., Ltd.
Others
Global
Other
New Construction
Mitsui Home Co., Ltd.
Other
Mitsui Designtec Co., Ltd.Mitsui Fudosan Reform Co., Ltd.Daiichi Engei Co., Ltd.Mitsui Fudosan TG Smart EnergyCo., Ltd. Others
Mitsui Fudosan Golf Properties K.K.Ise-Shima Resort ManagementCo., Ltd.MITSUI-NO-MORI Co., Ltd.Haimurubushi Co., Ltd.Imperial Hotel, Ltd. Others
Facility Operations
Mitsui Fudosan Hotel ManagementCo., Ltd.
Management
Property Management
Mitsui Fudosan Building ManagementCo., Ltd.Mitsui Fudosan Facilities Co., Ltd.Mitsui Fudosan Facilities West Co., LtdMitsui Fudosan Retail ManagementCo., Ltd.Mitsui Fudosan Residential ServicesCo., Ltd.Mitsui Fudosan Residential ServiceKansai Co., Ltd.Mitsui Fudosan Residential LeaseCo., Ltd.MITSUI HOME ESTATE Co., Ltd. Others
Brokerage, Asset Management, etc.
Mitsui Fudosan Residential Co., Ltd.Mitsui Fudosan Realty Co., Ltd.Mitsui Fudosan Investment Advisors, Inc.Nippon Building Fund Management Ltd.Mitsui Fudosan Accommodations Fund Management Co., Ltd.Mitsui Fudosan Frontier REIT Management Inc.Mitsui Fudosan Logistics REIT Management Co., Ltd.
Mitsui Fudosan America, Inc.Global
Property Sale
Mitsui Fudosan Residential Co., Ltd.
TID Pte. Ltd.Mitsui Fudosan America, Inc.Mitsui Fudosan (U.K.) Ltd
Others
Global
Mitsui Fudosan (Shanghai) Consulting Co., Ltd.Mitsui Fudosan Consulting (Beijing) Co., Ltd.Mitsui Fudosan Consulting (Guangzhou)
Others
Global
Lease Managem
ent and Operation Residential Property M
anagement and Operation
Appendix
53Mitsui Fudosan Co., Ltd.
Name LocationCapital
(¥million)Business
Proportion of voting rights
owned by Mitsui
Fudosan
Portion indirectly owned
Relationship with Mitsui Fudosan
Renting office space from
Mitsui Fudosan
Officers in concurrent
posts
Mitsui Fudosan officers among
concurrent officers
Accommodation First Co., Ltd.
Minato-ku, Tokyo 10 Management 100.0 100.0 4 4
Ise-Shima Resort Management Co., Ltd.
Shima, Mie 50 Other 100.0 —Leasing resort facilities from Mitsui Fudosan.
7 7
Wave Real Estate Co., Ltd. Chuo-ku, Tokyo 90Leasing,Property sales
100.0 — Yes 4 4
NBF Office Management Co., Ltd.
Chuo-ku, Tokyo 10 Management 100.0 —Commissioned by Mitsui Fudosan to manage buildings.
Yes 4 4
MF Service Apartment Co., Ltd.
Chuo-ku, Tokyo 10 Management 100.0 — 4 4
31 VENTURES Global Innovation Fund L.P.
Shibuya-ku, Tokyo
4,000 Other 99.0 — 0 0
MF Living Support Co., Ltd. Koto-ku, Tokyo 100 Management 100.0 100.0 2 2
Kashimada Station Western Area Redevelopment Co., Ltd.
Kawasaki, Kanagawa
74 Property sales 98.6 78.7 4 3
Kyushin Kaihatsu Inc. Usuki, Oita 120 Other 96.0 — 4 4
GREENCOLLAR, Inc. Chuo-ku, Tokyo 22 Other 66.7 — 4 4
31VENTURES-Global Brain-Growth I GK
Chuo-ku, Tokyo 2,810 Other 99.7 — 0 0
SUNLIFE CREATION Co., Ltd. Chuo-ku, Tokyo 300Property sales, Management, etc.
100.0 100.0 Yes 1 1
Shima Resort Management Co., Ltd.
Shima, Mie 100 Other 100.0 —Leasing resort facilities from Mitsui Fudosan.
5 5
Sumai Support Co., Ltd.Chiyoda-ku, Tokyo
50 Management 100.0 100.0 2 2
Mitsui Fudosan Taiwan Co., Ltd.
Taipei, Taiwan NT$1,955,785,127 Leasing 100.0 10.5 4 3
Daiasama Golf Co., Ltd. Kitasaku, Nagano 150 Other 86.6 1.6 4 2
Daiichi Engei Co., Ltd.Shinagawa-ku, Tokyo
480 Leasing, Other 100.0 — Yes 6 6
Tsunamachi Club Co., Ltd. Minato-ku, Tokyo 10 Other 100.0 — 4 4
TM Serviced Apartment CO., Ltd.
Minato-ku, Tokyo 10 Management 100.0 — 4 4
TM Park Residences Co., Ltd.
Minato-ku, Tokyo 10 Management 100.0 — 5 5
Tokyo Property Service Co., Ltd.
Chuo-ku, Tokyo 10 Management 100.0 100.0 2 2
Tokyo Midtown Management Co., Ltd.
Minato-ku, Tokyo 100 Management 100.0 — Yes 9 9
Narita Sports Development Co., Ltd.
Narita, Chiba 30 Other 100.0 — 4 4
Haimurubushi Co., Ltd.Yaeyama, Okinawa
200 Other 100.0 —Leasing resort facilities from Mitsui Fudosan.
5 5
First Facilities Gunma Co., Ltd.
Maebashi, Gunma
10 Management 100.0 100.0 1 1
First Facilities Chiba Co., Ltd.
Chiba, Chiba 20 Management 100.0 100.0 Yes 1 1
3. Current Subsidiaries and Affiliates
(A) Consolidated SubsidiariesThe following organization chart shows how the businesses of the main subsidiaries and affiliates mentioned above relate to Mitsui Fudosan’s business.
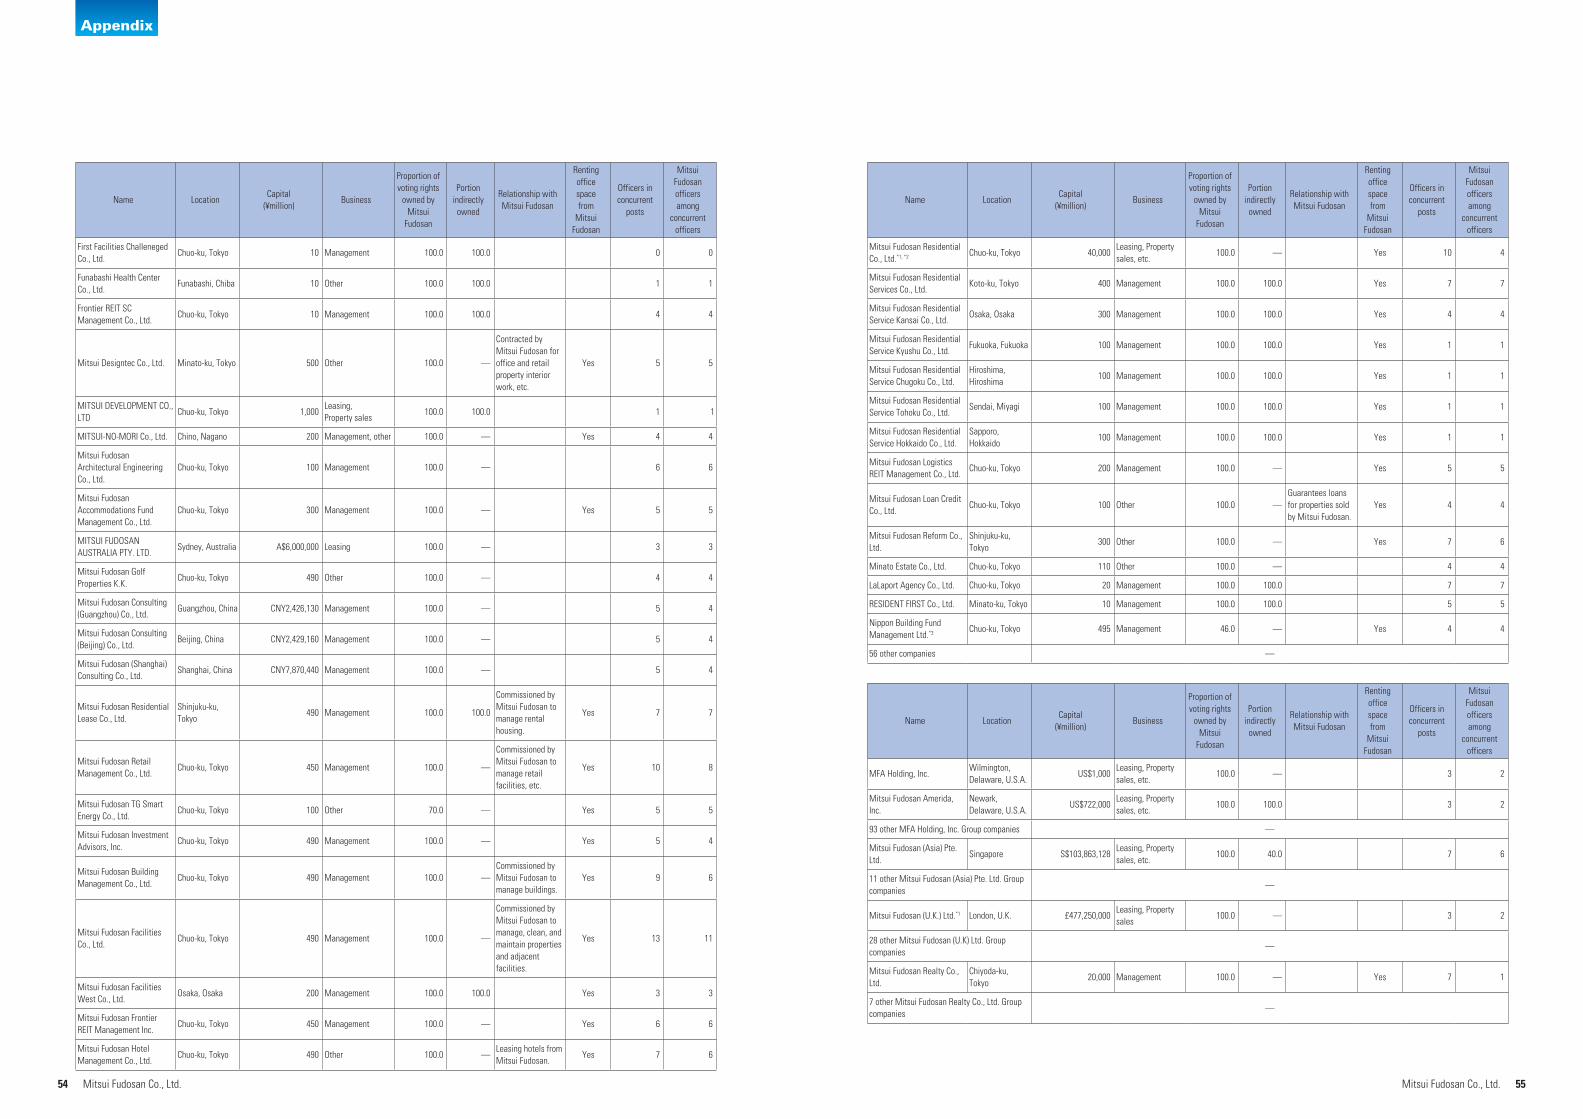
54 55Mitsui Fudosan Co., Ltd. Mitsui Fudosan Co., Ltd.
Appendix
Name LocationCapital
(¥million)Business
Proportion of voting rights
owned by Mitsui
Fudosan
Portion indirectly owned
Relationship with Mitsui Fudosan
Renting office space from
Mitsui Fudosan
Officers in concurrent
posts
Mitsui Fudosan officers among
concurrent officers
Mitsui Fudosan Residential Co., Ltd.*1, *2 Chuo-ku, Tokyo 40,000
Leasing, Property sales, etc.
100.0 — Yes 10 4
Mitsui Fudosan Residential Services Co., Ltd.
Koto-ku, Tokyo 400 Management 100.0 100.0 Yes 7 7
Mitsui Fudosan Residential Service Kansai Co., Ltd.
Osaka, Osaka 300 Management 100.0 100.0 Yes 4 4
Mitsui Fudosan Residential Service Kyushu Co., Ltd.
Fukuoka, Fukuoka 100 Management 100.0 100.0 Yes 1 1
Mitsui Fudosan Residential Service Chugoku Co., Ltd.
Hiroshima, Hiroshima
100 Management 100.0 100.0 Yes 1 1
Mitsui Fudosan Residential Service Tohoku Co., Ltd.
Sendai, Miyagi 100 Management 100.0 100.0 Yes 1 1
Mitsui Fudosan Residential Service Hokkaido Co., Ltd.
Sapporo, Hokkaido
100 Management 100.0 100.0 Yes 1 1
Mitsui Fudosan Logistics REIT Management Co., Ltd.
Chuo-ku, Tokyo 200 Management 100.0 — Yes 5 5
Mitsui Fudosan Loan Credit Co., Ltd.
Chuo-ku, Tokyo 100 Other 100.0 —Guarantees loans for properties sold by Mitsui Fudosan.
Yes 4 4
Mitsui Fudosan Reform Co., Ltd.
Shinjuku-ku, Tokyo
300 Other 100.0 — Yes 7 6
Minato Estate Co., Ltd. Chuo-ku, Tokyo 110 Other 100.0 — 4 4
LaLaport Agency Co., Ltd. Chuo-ku, Tokyo 20 Management 100.0 100.0 7 7
RESIDENT FIRST Co., Ltd. Minato-ku, Tokyo 10 Management 100.0 100.0 5 5
Nippon Building Fund Management Ltd.*3 Chuo-ku, Tokyo 495 Management 46.0 — Yes 4 4
56 other companies —
Name LocationCapital
(¥million)Business
Proportion of voting rights
owned by Mitsui
Fudosan
Portion indirectly
owned
Relationship with Mitsui Fudosan
Renting office space from
Mitsui Fudosan
Officers in concurrent
posts
Mitsui Fudosan officers among
concurrent officers
First Facilities Challeneged Co., Ltd.
Chuo-ku, Tokyo 10 Management 100.0 100.0 0 0
Funabashi Health Center Co., Ltd.
Funabashi, Chiba 10 Other 100.0 100.0 1 1
Frontier REIT SC Management Co., Ltd.
Chuo-ku, Tokyo 10 Management 100.0 100.0 4 4
Mitsui Designtec Co., Ltd. Minato-ku, Tokyo 500 Other 100.0 —
Contracted by Mitsui Fudosan for office and retail property interior work, etc.
Yes 5 5
MITSUI DEVELOPMENT CO., LTD
Chuo-ku, Tokyo 1,000Leasing,Property sales
100.0 100.0 1 1
MITSUI-NO-MORI Co., Ltd. Chino, Nagano 200 Management, other 100.0 — Yes 4 4
Mitsui Fudosan Architectural Engineering Co., Ltd.
Chuo-ku, Tokyo 100 Management 100.0 — 6 6
Mitsui Fudosan Accommodations Fund Management Co., Ltd.
Chuo-ku, Tokyo 300 Management 100.0 — Yes 5 5
MITSUI FUDOSAN AUSTRALIA PTY. LTD.
Sydney, Australia A$6,000,000 Leasing 100.0 — 3 3
Mitsui Fudosan Golf Properties K.K.
Chuo-ku, Tokyo 490 Other 100.0 — 4 4
Mitsui Fudosan Consulting (Guangzhou) Co., Ltd.
Guangzhou, China CNY2,426,130 Management 100.0 — 5 4
Mitsui Fudosan Consulting (Beijing) Co., Ltd.
Beijing, China CNY2,429,160 Management 100.0 — 5 4
Mitsui Fudosan (Shanghai) Consulting Co., Ltd.
Shanghai, China CNY7,870,440 Management 100.0 — 5 4
Mitsui Fudosan Residential Lease Co., Ltd.
Shinjuku-ku, Tokyo
490 Management 100.0 100.0
Commissioned by Mitsui Fudosan to manage rental housing.
Yes 7 7
Mitsui Fudosan Retail Management Co., Ltd.
Chuo-ku, Tokyo 450 Management 100.0 —
Commissioned by Mitsui Fudosan to manage retail facilities, etc.
Yes 10 8
Mitsui Fudosan TG Smart Energy Co., Ltd.
Chuo-ku, Tokyo 100 Other 70.0 — Yes 5 5
Mitsui Fudosan Investment Advisors, Inc.
Chuo-ku, Tokyo 490 Management 100.0 — Yes 5 4
Mitsui Fudosan Building Management Co., Ltd.
Chuo-ku, Tokyo 490 Management 100.0 —Commissioned by Mitsui Fudosan to manage buildings.
Yes 9 6
Mitsui Fudosan Facilities Co., Ltd.
Chuo-ku, Tokyo 490 Management 100.0 —
Commissioned by Mitsui Fudosan to manage, clean, and maintain properties and adjacent facilities.
Yes 13 11
Mitsui Fudosan Facilities West Co., Ltd.
Osaka, Osaka 200 Management 100.0 100.0 Yes 3 3
Mitsui Fudosan Frontier REIT Management Inc.
Chuo-ku, Tokyo 450 Management 100.0 — Yes 6 6
Mitsui Fudosan Hotel Management Co., Ltd.
Chuo-ku, Tokyo 490 Other 100.0 —Leasing hotels from Mitsui Fudosan.
Yes 7 6
Name LocationCapital
(¥million)Business
Proportion of voting rights
owned by Mitsui
Fudosan
Portion indirectly owned
Relationship with Mitsui Fudosan
Renting office space from
Mitsui Fudosan
Officers in concurrent
posts
Mitsui Fudosan officers among
concurrent officers
MFA Holding, Inc.Wilmington, Delaware, U.S.A.
US$1,000 Leasing, Property sales, etc.
100.0 — 3 2
Mitsui Fudosan Amerida, Inc.
Newark, Delaware, U.S.A.
US$722,000 Leasing, Property sales, etc.
100.0 100.0 3 2
93 other MFA Holding, Inc. Group companies —
Mitsui Fudosan (Asia) Pte. Ltd.
Singapore S$103,863,128Leasing, Property sales, etc.
100.0 40.0 7 6
11 other Mitsui Fudosan (Asia) Pte. Ltd. Group companies
—
Mitsui Fudosan (U.K.) Ltd.*1 London, U.K. £477,250,000Leasing, Property sales
100.0 — 3 2
28 other Mitsui Fudosan (U.K) Ltd. Group companies
—
Mitsui Fudosan Realty Co., Ltd.
Chiyoda-ku, Tokyo
20,000 Management 100.0 — Yes 7 1
7 other Mitsui Fudosan Realty Co., Ltd. Group companies
—
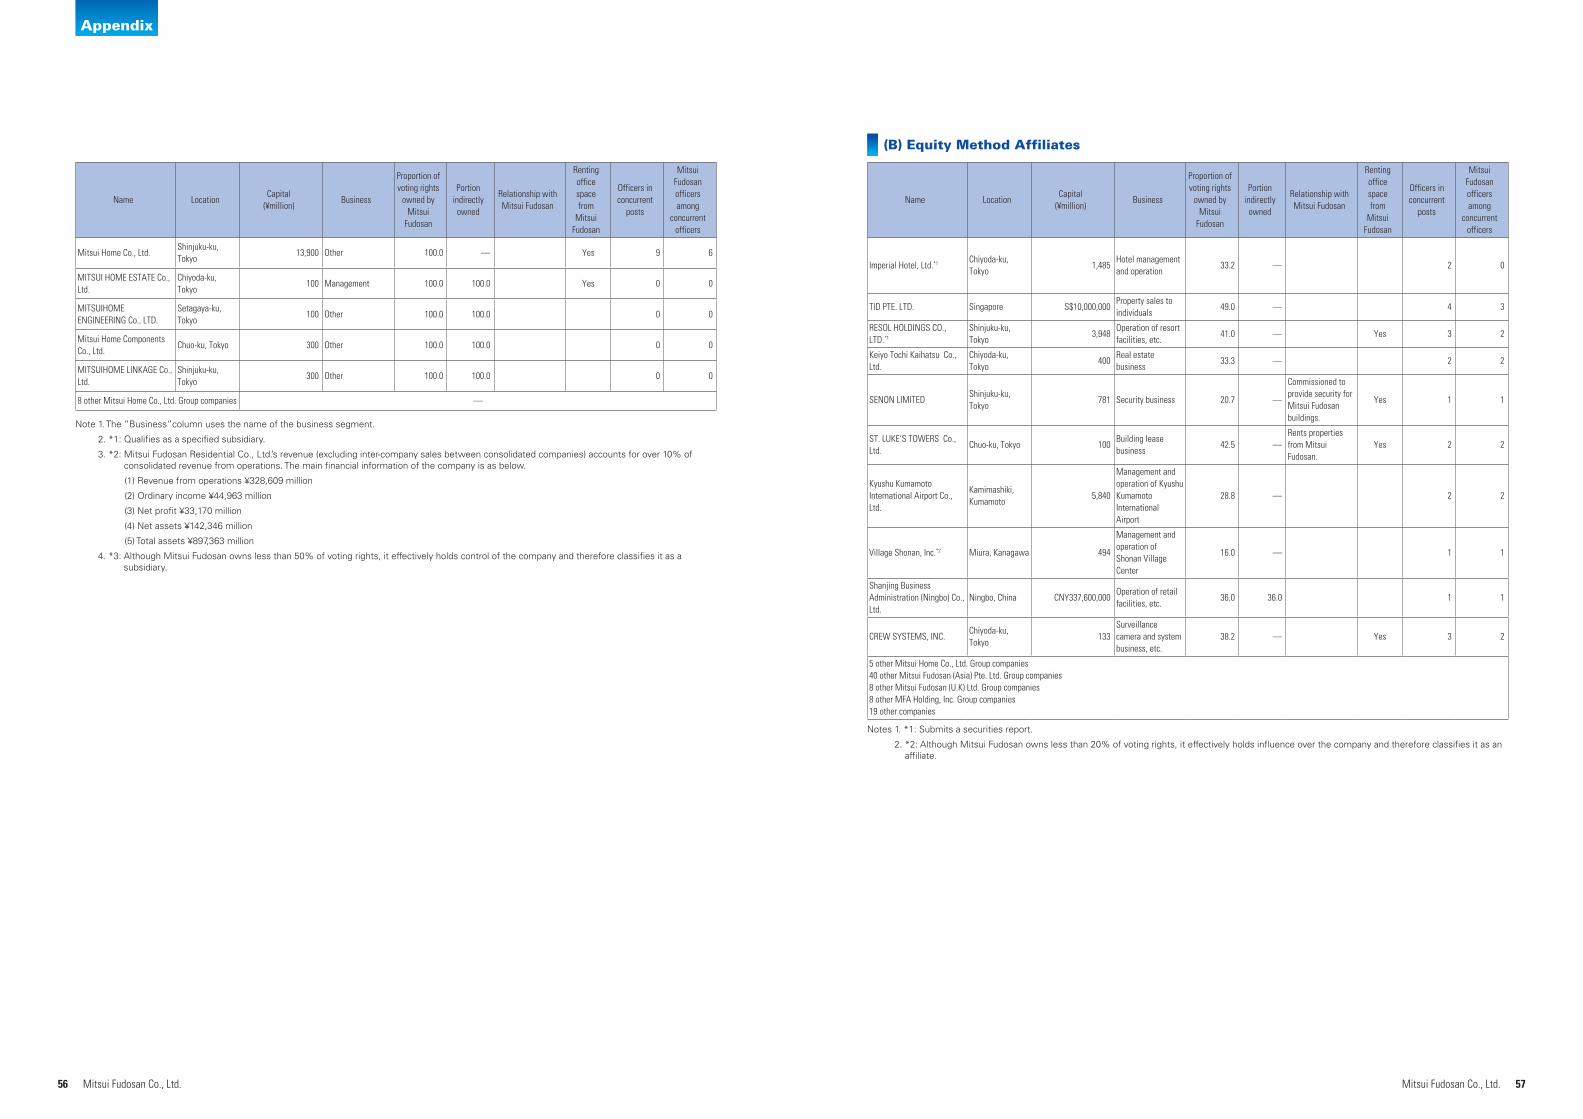
56 57Mitsui Fudosan Co., Ltd. Mitsui Fudosan Co., Ltd.
Appendix
Name LocationCapital
(¥million)Business
Proportion of voting rights
owned by Mitsui
Fudosan
Portion indirectly owned
Relationship with Mitsui Fudosan
Renting office space from
Mitsui Fudosan
Officers in concurrent
posts
Mitsui Fudosan officers among
concurrent officers
Imperial Hotel, Ltd.*1 Chiyoda-ku, Tokyo
1,485Hotel management and operation
33.2 — 2 0
TID PTE. LTD. Singapore S$10,000,000Property sales to individuals
49.0 — 4 3
RESOL HOLDINGS CO., LTD.*1
Shinjuku-ku, Tokyo
3,948Operation of resort facilities, etc.
41.0 — Yes 3 2
Keiyo Tochi Kaihatsu Co., Ltd.
Chiyoda-ku, Tokyo
400Real estate business
33.3 — 2 2
SENON LIMITEDShinjuku-ku, Tokyo
781 Security business 20.7 —
Commissioned to provide security for Mitsui Fudosan buildings.
Yes 1 1
ST. LUKE‘S TOWERS Co., Ltd.
Chuo-ku, Tokyo 100Building lease business
42.5 —Rents properties from Mitsui Fudosan.
Yes 2 2
Kyushu Kumamoto International Airport Co., Ltd.
Kamimashiki, Kumamoto
5,840
Management and operation of Kyushu Kumamoto International Airport
28.8 — 2 2
Village Shonan, Inc.*2 Miura, Kanagawa 494
Management and operation of Shonan Village Center
16.0 — 1 1
Shanjing Business Administration (Ningbo) Co., Ltd.
Ningbo, China CNY337,600,000Operation of retail facilities, etc.
36.0 36.0 1 1
CREW SYSTEMS, INC.Chiyoda-ku, Tokyo
133Surveillance camera and system business, etc.
38.2 — Yes 3 2
5 other Mitsui Home Co., Ltd. Group companies40 other Mitsui Fudosan (Asia) Pte. Ltd. Group companies8 other Mitsui Fudosan (U.K) Ltd. Group companies8 other MFA Holding, Inc. Group companies19 other companies
Notes 1. *1: Submits a securities report.
2. *2: Although Mitsui Fudosan owns less than 20% of voting rights, it effectively holds influence over the company and therefore classifies it as an affiliate.
(B) Equity Method Affiliates
Name LocationCapital
(¥million)Business
Proportion of voting rights
owned by Mitsui
Fudosan
Portion indirectly
owned
Relationship with Mitsui Fudosan
Renting office space from
Mitsui Fudosan
Officers in concurrent
posts
Mitsui Fudosan officers among
concurrent officers
Mitsui Home Co., Ltd.Shinjuku-ku, Tokyo
13,900 Other 100.0 — Yes 9 6
MITSUI HOME ESTATE Co., Ltd.
Chiyoda-ku, Tokyo
100 Management 100.0 100.0 Yes 0 0
MITSUIHOME ENGINEERING Co., LTD.
Setagaya-ku, Tokyo
100 Other 100.0 100.0 0 0
Mitsui Home Components Co., Ltd.
Chuo-ku, Tokyo 300 Other 100.0 100.0 0 0
MITSUIHOME LINKAGE Co., Ltd.
Shinjuku-ku, Tokyo
300 Other 100.0 100.0 0 0
8 other Mitsui Home Co., Ltd. Group companies —
Note 1. The ”Business”column uses the name of the business segment.
2. *1: Qualifies as a specified subsidiary.
3. *2: Mitsui Fudosan Residential Co., Ltd.’s revenue (excluding inter-company sales between consolidated companies) accounts for over 10% of consolidated revenue from operations. The main financial information of the company is as below.
(1) Revenue from operations ¥328,609 million
(2) Ordinary income ¥44,963 million
(3) Net profit ¥33,170 million
(4) Net assets ¥142,346 million
(5) Total assets ¥897,363 million
4. *3: Although Mitsui Fudosan owns less than 50% of voting rights, it effectively holds control of the company and therefore classifies it as a subsidiary.
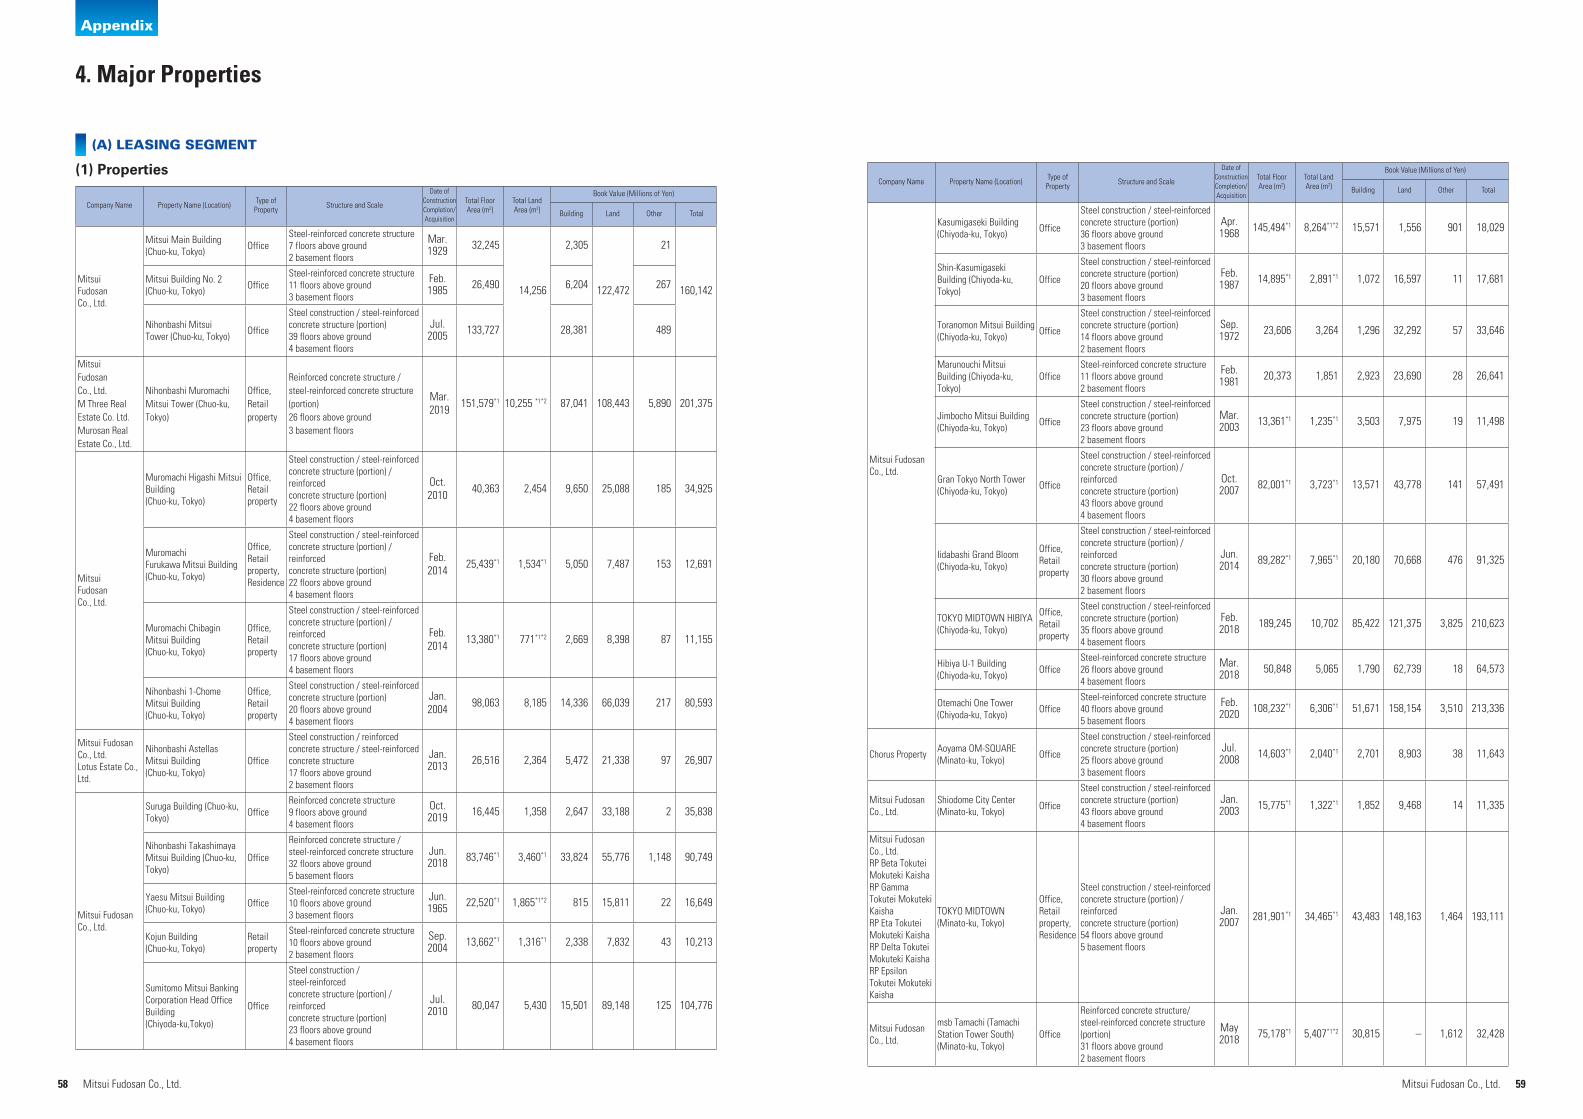
58 59Mitsui Fudosan Co., Ltd. Mitsui Fudosan Co., Ltd.
Appendix
Company Name Property Name (Location) Type of Property Structure and Scale
Date of Construction Completion/Acquisition
Total Floor Area (m2)
Total Land Area (m2)
Book Value (Millions of Yen)
Building Land Other Total
Mitsui Fudosan Co., Ltd.
Mitsui Main Building(Chuo-ku, Tokyo) Office
Steel-reinforced concrete structure7 floors above ground2 basement floors
Mar.1929 32,245
14,256
2,305
122,472
21
160,142Mitsui Building No. 2(Chuo-ku, Tokyo) Office
Steel-reinforced concrete structure11 floors above ground3 basement floors
Feb.1985 26,490 6,204 267
Nihonbashi Mitsui Tower (Chuo-ku, Tokyo) Office
Steel construction / steel-reinforcedconcrete structure (portion)39 floors above ground4 basement floors
Jul.2005 133,727 28,381 489
Mitsui Fudosan Co., Ltd.M Three Real Estate Co. Ltd.Murosan Real Estate Co., Ltd.
Nihonbashi Muromachi Mitsui Tower (Chuo-ku, Tokyo)
Office, Retail property
Reinforced concrete structure / steel-reinforced concrete structure (portion)26 floors above ground3 basement floors
Mar.2019 151,579*1 10,255 *1*2 87,041 108,443 5,890 201,375
Mitsui Fudosan Co., Ltd.
Muromachi Higashi MitsuiBuilding(Chuo-ku, Tokyo)
Office,Retailproperty
Steel construction / steel-reinforcedconcrete structure (portion) / reinforcedconcrete structure (portion)22 floors above ground4 basement floors
Oct.2010 40,363 2,454 9,650 25,088 185 34,925
MuromachiFurukawa Mitsui Building(Chuo-ku, Tokyo)
Office,Retailproperty,Residence
Steel construction / steel-reinforcedconcrete structure (portion) / reinforcedconcrete structure (portion)22 floors above ground4 basement floors
Feb.2014 25,439*1 1,534*1 5,050 7,487 153 12,691
Muromachi ChibaginMitsui Building(Chuo-ku, Tokyo)
Office,Retailproperty
Steel construction / steel-reinforcedconcrete structure (portion) / reinforcedconcrete structure (portion)17 floors above ground4 basement floors
Feb.2014 13,380*1 771*1*2 2,669 8,398 87 11,155
Nihonbashi 1-ChomeMitsui Building(Chuo-ku, Tokyo)
Office,Retailproperty
Steel construction / steel-reinforcedconcrete structure (portion)20 floors above ground4 basement floors
Jan.2004 98,063 8,185 14,336 66,039 217 80,593
Mitsui Fudosan Co., Ltd.Lotus Estate Co., Ltd.
Nihonbashi Astellas Mitsui Building(Chuo-ku, Tokyo)
Office
Steel construction / reinforcedconcrete structure / steel-reinforcedconcrete structure17 floors above ground2 basement floors
Jan.2013 26,516 2,364 5,472 21,338 97 26,907
Mitsui Fudosan Co., Ltd.
Suruga Building (Chuo-ku, Tokyo) Office
Reinforced concrete structure9 floors above ground4 basement floors
Oct.2019 16,445 1,358 2,647 33,188 2 35,838
Nihonbashi TakashimayaMitsui Building (Chuo-ku, Tokyo)
Office
Reinforced concrete structure / steel-reinforced concrete structure32 floors above ground5 basement floors
Jun.2018 83,746*1 3,460*1 33,824 55,776 1,148 90,749
Yaesu Mitsui Building(Chuo-ku, Tokyo) Office
Steel-reinforced concrete structure10 floors above ground3 basement floors
Jun.1965 22,520*1 1,865*1*2 815 15,811 22 16,649
Kojun Building(Chuo-ku, Tokyo)
Retailproperty
Steel-reinforced concrete structure10 floors above ground2 basement floors
Sep.2004 13,662*1 1,316*1 2,338 7,832 43 10,213
Sumitomo Mitsui BankingCorporation Head OfficeBuilding (Chiyoda-ku,Tokyo)
Office
Steel construction / steel-reinforcedconcrete structure (portion) / reinforcedconcrete structure (portion)23 floors above ground4 basement floors
Jul.2010 80,047 5,430 15,501 89,148 125 104,776
(1) Properties
4. Major Properties
(A) LEASING SEGMENT
Company Name Property Name (Location) Type of Property Structure and Scale
Date of Construction Completion/Acquisition
Total Floor Area (m2)
Total Land Area (m2)
Book Value (Millions of Yen)
Building Land Other Total
Mitsui Fudosan Co., Ltd.
Kasumigaseki Building(Chiyoda-ku, Tokyo) Office
Steel construction / steel-reinforcedconcrete structure (portion)36 floors above ground3 basement floors
Apr.1968 145,494*1 8,264*1*2 15,571 1,556 901 18,029
Shin-Kasumigaseki Building (Chiyoda-ku,Tokyo)
Office
Steel construction / steel-reinforcedconcrete structure (portion)20 floors above ground3 basement floors
Feb.1987 14,895*1 2,891*1 1,072 16,597 11 17,681
Toranomon Mitsui Building(Chiyoda-ku, Tokyo) Office
Steel construction / steel-reinforcedconcrete structure (portion)14 floors above ground2 basement floors
Sep.1972 23,606 3,264 1,296 32,292 57 33,646
Marunouchi Mitsui Building (Chiyoda-ku,Tokyo)
OfficeSteel-reinforced concrete structure11 floors above ground2 basement floors
Feb.1981 20,373 1,851 2,923 23,690 28 26,641
Jimbocho Mitsui Building(Chiyoda-ku, Tokyo) Office
Steel construction / steel-reinforcedconcrete structure (portion)23 floors above ground2 basement floors
Mar.2003 13,361*1 1,235*1 3,503 7,975 19 11,498
Gran Tokyo North Tower(Chiyoda-ku, Tokyo) Office
Steel construction / steel-reinforcedconcrete structure (portion) / reinforcedconcrete structure (portion)43 floors above ground4 basement floors
Oct.2007 82,001*1 3,723*1 13,571 43,778 141 57,491
Iidabashi Grand Bloom(Chiyoda-ku, Tokyo)
Office,Retail property
Steel construction / steel-reinforcedconcrete structure (portion) / reinforcedconcrete structure (portion)30 floors above ground2 basement floors
Jun.2014 89,282*1 7,965*1 20,180 70,668 476 91,325
TOKYO MIDTOWN HIBIYA(Chiyoda-ku, Tokyo)
Office,Retail property
Steel construction / steel-reinforcedconcrete structure (portion)35 floors above ground4 basement floors
Feb.2018 189,245 10,702 85,422 121,375 3,825 210,623
Hibiya U-1 Building(Chiyoda-ku, Tokyo) Office
Steel-reinforced concrete structure26 floors above ground4 basement floors
Mar.2018 50,848 5,065 1,790 62,739 18 64,573
Otemachi One Tower(Chiyoda-ku, Tokyo) Office
Steel-reinforced concrete structure40 floors above ground5 basement floors
Feb.2020 108,232*1 6,306*1 51,671 158,154 3,510 213,336
Chorus Property Aoyama OM-SQUARE(Minato-ku, Tokyo) Office
Steel construction / steel-reinforcedconcrete structure (portion)25 floors above ground3 basement floors
Jul.2008 14,603*1 2,040*1 2,701 8,903 38 11,643
Mitsui Fudosan Co., Ltd.
Shiodome City Center(Minato-ku, Tokyo) Office
Steel construction / steel-reinforcedconcrete structure (portion)43 floors above ground4 basement floors
Jan.2003 15,775*1 1,322*1 1,852 9,468 14 11,335
Mitsui Fudosan Co., Ltd.RP Beta Tokutei Mokuteki KaishaRP Gamma Tokutei Mokuteki KaishaRP Eta Tokutei Mokuteki KaishaRP Delta Tokutei Mokuteki KaishaRP Epsilon Tokutei Mokuteki Kaisha
TOKYO MIDTOWN(Minato-ku, Tokyo)
Office,Retail property,Residence
Steel construction / steel-reinforcedconcrete structure (portion) / reinforcedconcrete structure (portion)54 floors above ground5 basement floors
Jan.2007 281,901*1 34,465*1 43,483 148,163 1,464 193,111
Mitsui Fudosan Co., Ltd.
msb Tamachi (Tamachi Station Tower South)(Minato-ku, Tokyo)
Office
Reinforced concrete structure/ steel-reinforced concrete structure (portion)31 floors above ground2 basement floors
May2018 75,178*1 5,407*1*2 30,815 – 1,612 32,428

60 61Mitsui Fudosan Co., Ltd. Mitsui Fudosan Co., Ltd.
Appendix
Company Name Property Name (Location) Type of Property Structure and Scale
Date of Construction Completion/Acquisition
Total Floor Area (m2)
Total Land Area (m2)
Book Value (Millions of Yen)
Building Land Other Total
Mitsui Fudosan Co., Ltd.
Gate City Osaki(Shinagawa-ku, Tokyo) Office
Steel construction / steel-reinforcedconcrete structure (portion) / reinforcedconcrete structure (portion)24 floors above ground4 basement floors
Jan.1999 33,612*1 5,405*1 5,874 13,445 81 19,401
Shinjuku Mitsui Building(Shinjuku-ku, Tokyo) Office
Steel construction / reinforcedconcrete structure (portion)55 floors above ground3 basement floors
Sep.1974 179,697 14,449 15,267 186,668 1,182 203,118
Urban Dock LaLaportTOYOSU(Koto-ku, Tokyo)
Retail property
Steel construction / steel-reinforcedconcrete structure (portion)5 floors above ground1 basement floor
Aug.2006 164,525 67,499*2 8,742 20,199 785 29,727
Mitsui Fudosan Industrial Park Haneda(Ota-ku, Tokyo)
Logisticsfacility
Steel construction5 floors above ground
Jun.2019 81,030 36,213*2 11,542 16,362 1,056 28,960
LAZONA Kawasaki(Kawasaki, Kanagawa)
Retail property
Steel construction / reinforcedconcrete structure (portion)6 floors above ground1 basement floor
Sep.2006 69,081*1 72,013*2 3,849 26,022 558 30,430
Yokohama Mitsui Building(Yokohama, Kanagawa) Office
Steel construction / steel-reinforcedconcrete structure (portion) / reinforcedconcrete structure (portion)30 floors above ground2 basement floors
Feb.2012 90,356 7,799 16,272 7,068 410 23,751
Mitsui Fudosan Co., Ltd.Kamoi Properties Co., Ltd.
LaLaport YOKOHAMA(Yokohama, Kanagawa)
Retailproperty
Steel construction6 floors above ground1 basement floor
Feb.2007 244,154 102,030 11,777 17,073 512 29,363
Mitsui Fudosan Co., Ltd.
LaLaport EBINA(Ebina, Kanagawa)
Retailproperty
Steel construction4 floors above ground
Oct.2015 121,127 32,942*2 12,118 – 550 12,669
LaLaport Mitsui Building(Funabashi, Chiba) Office
Steel-reinforced concrete structure /steel construction (portion)14 floors above ground1 basement floor
Jun.1988 23,558
157,850
1,842
48,919
29
74,820
LaLaport TOKYO-BAY(Funabashi, Chiba)
Retailproperty
Reinforced concrete structure / steelconstruction (portion) / steel-reinforcedconcrete structure (portion)10 floors above ground1 basement floor
Apr.1981 280,529 20,987 3,041
Mitsui Fudosan LogisticsPark Funabashi I(Funabashi, Chiba)
Logisticsfacility
Reinforced concrete structure / steelconstruction (portion)8 floors above ground
Oct.2016 202,156 51,000 25,805 4,425 1,344 31,575
GATE SQUARE(Kashiwa, Chiba)
Office,Retail property,Residence
Shop & OfficeSteel-reinforced concrete structure7 floors above ground 1 basement floorHotel & ResidenceReinforced concrete structure14 floors above ground 1 basement floor
Apr.2014 48,166 20,871 8,533 4,858 649 14,041
Park City Kashiwa-no-ha Campus The Gate Tower West(Kashiwa, Chiba)
Residence,Retailproperty
Steel-reinforced concrete structure36 floors above ground
Jan.2018 38,771 6,095 9,985 2,823 680 13,488
LaLaport FUJIMI(Fujimi, Saitama)
Retail property
RetailSteel construction4 floors above groundParking TowerSteel construction5 floors above ground
Feb.2015 183,858 152,055 18,257 10,365 1,202 29,826
Company Name Property Name (Location) Type of Property Structure and Scale
Date of Construction Completion/Acquisition
Total Floor Area (m2)
Total Land Area (m2)
Book Value (Millions of Yen)
Building Land Other Total
Mitsui Fudosan Co., Ltd.
LaLaport NUMAZU(Numazu, Shizuoka)
Retail property
RetailSteel construction4 floors above groundParking TowerSteel construction5 floors above ground
Aug.2019 164,353 119,816*2 23,455 – 2,950 26,405
Otemachi TatemonoNagoya Station Building(Nagoya, Aichi)
Office,Retail property
Steel-reinforced concrete structure11 floors above ground2 basement floors
Aug.2007 37,834 2,976 258 14,242 2 14,504
LaLaPort NAGOYA minato AQULS (Nagoya, Aichi)
Retail property
Steel construction4 floors above ground(6 floors above ground in part)
Sep.2018 171,815 83,200*2 20,555 – 2,260 22,816
Nakanoshima Mitsui Building(Osaka, Osaka)
Office
Steel construction / steel-reinforcedconcrete structure (portion)31 floors above ground2 basement floors
Aug.2002 71,269 4,456 8,408 12,131 528 21,067
Yodoyabashi Mitsui Building(Osaka, Osaka)
Office,Retail property
Steel construction / steel-reinforcedconcrete structure (portion) / reinforcedconcrete structure (portion)16 floors above ground3 basement floors
Mar.2008 38,838**1 3,087*1 5,197 14,556 62 19,816
EXPOCITY (Suita, Osaka)
Retail property
Steel construction1-3 floors above ground
Nov.2015 222,506 172,240*2 19,381 – 2,093 21,475
MITSUI OUTLET PARKMARINE PIA KOBE(Kobe, Hyogo)
Retail property
Factory OutletSteel construction3 floors above groundAnnexSteel construction2 floors above ground
Jul.1999 61,961 78,205 1,483 11,096 708 13,288
MITSUI OUTLET PARKSHIGA RYUO(Gamo, Shiga)
Retail property
1st StageSteel construction2 floors above ground2nd StageSteel construction3 floors above ground
Jul.2010 91,831 174,231*2 5,568 2,550*2 901 9,019
Sapporo Mitsui JPBuilding(Sapporo, Hokkaido)
Office,Retail property
Steel construction / steel-reinforcedconcrete structure (portion) / reinforcedconcrete structure (portion)20 floors above ground3 basement floors
Aug.2014 47,714*1 3,861*1 9,126 6,707 148 15,982
Mitsui Fudosan America, Inc.(Overseas subsidiary)
1251 Avenue of theAmericas (New York, New York, U.S.A.)
OfficeSteel construction54 floors above ground4 basement floors
Dec.1986 215,308 9,232 31,263 24,325 15 55,604
527 Madison Avenue(New York, New York, U.S.A.)
OfficeSteel construction26 floors above ground1 basement floor
Sep.2008 19,472 1,082 14,477 12,218 – 26,695
55 Hudson Yards (New York, New York, U.S.A.)
OfficeReinforced concrete structure51 floors above ground2 basement floor
Oct.2018 117,585*1 3,718*1 70,850 46,363 – 117,213
Mitsui Fudosan (U.K.) Ltd.(Overseas subsidiary)
5 Hanover Square(London, U.K.) Office
Reinforced concrete structure7 floors above ground1 basement floor
Mar.2012 7,957 1,122 3,222 8,721 422 12,366
8-10 Moorgate(London, U.K.) Office
Steel construction / reinforcedconcrete structure (portion)9 floors above ground1 basement floor
May2014 16,750 2,040*2 4,432 5,409*2 1,575 11,418
1 Angel Court(London, U.K.) Office
Steel construction / reinforcedconcrete structure (portion)27 floors above ground2 basement floor
Mar.2017 45,384 3,925*2 14,525 11,941*2 8,103 34,570
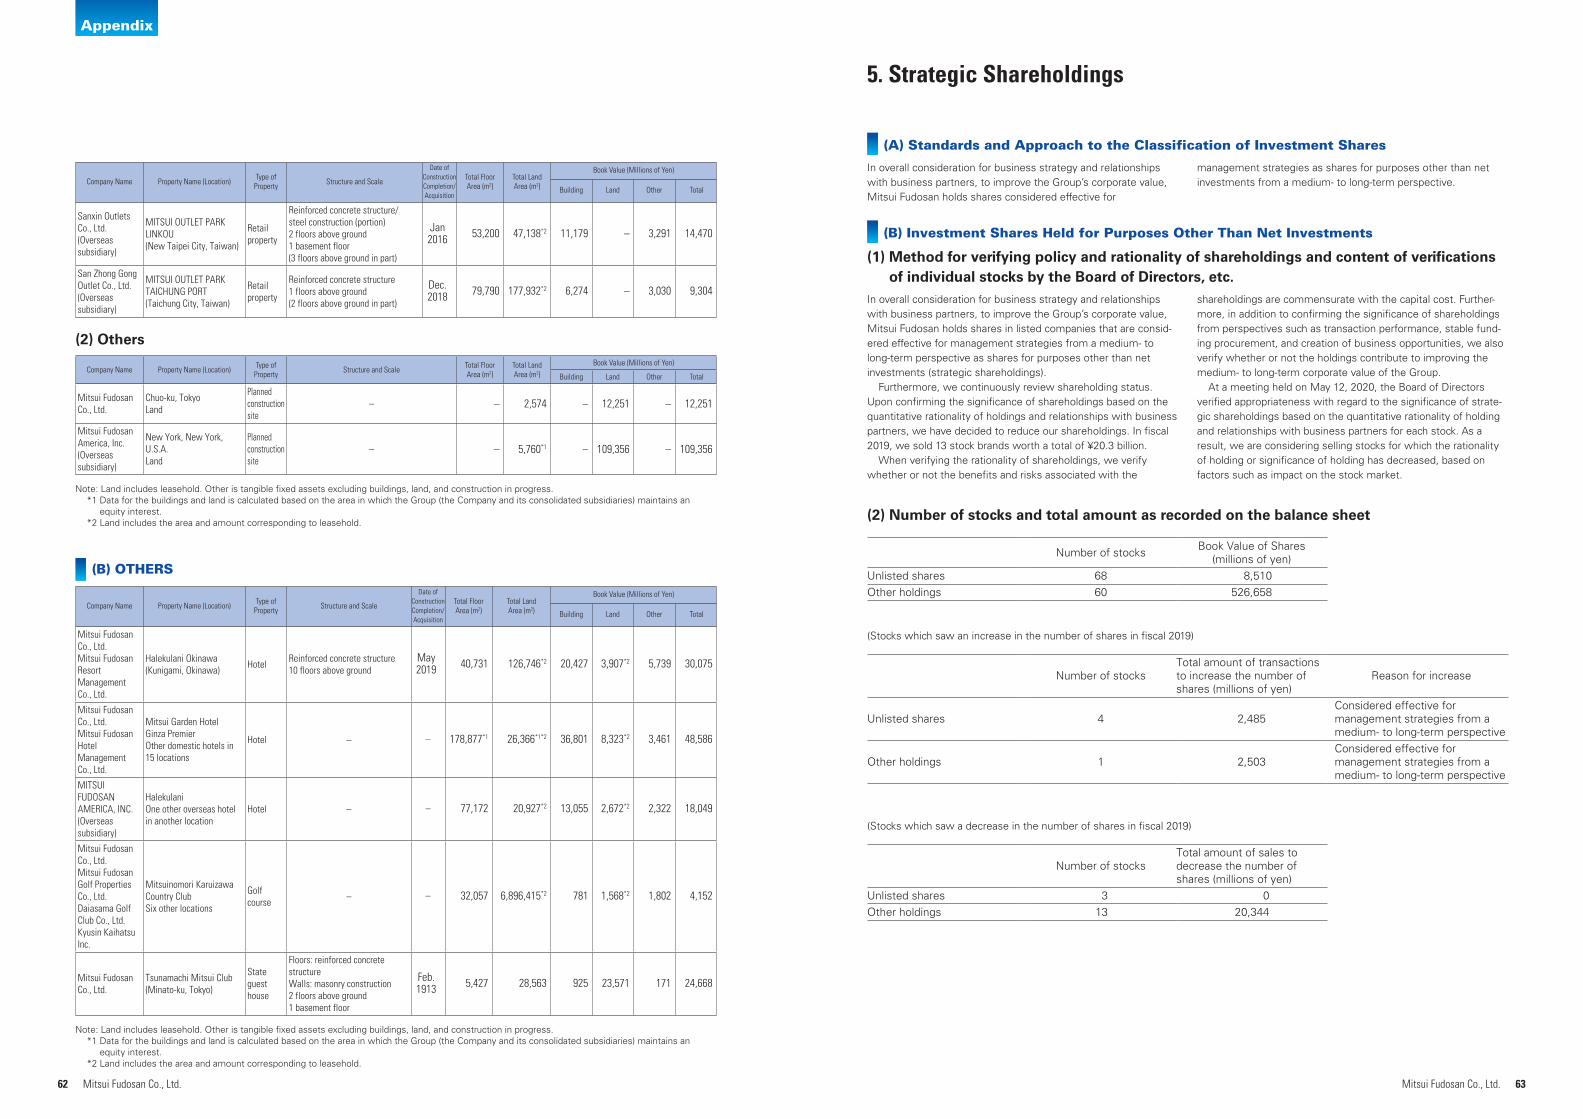
62 Mitsui Fudosan Co., Ltd.
Appendix
Company Name Property Name (Location) Type of Property Structure and Scale Total Floor
Area (m2)Total Land Area (m2)
Book Value (Millions of Yen)
Building Land Other Total
Mitsui Fudosan Co., Ltd.
Chuo-ku, TokyoLand
Plannedconstructionsite
– – 2,574 – 12,251 – 12,251
Mitsui FudosanAmerica, Inc.(Overseas subsidiary)
New York, New York, U.S.A.Land
Plannedconstructionsite
– – 5,760*1 – 109,356 – 109,356
Note: Land includes leasehold. Other is tangible fixed assets excluding buildings, land, and construction in progress.*1 Data for the buildings and land is calculated based on the area in which the Group (the Company and its consolidated subsidiaries) maintains an
equity interest.*2 Land includes the area and amount corresponding to leasehold.
(2) Others
Company Name Property Name (Location) Type of Property Structure and Scale
Date of Construction Completion/Acquisition
Total Floor Area (m2)
Total Land Area (m2)
Book Value (Millions of Yen)
Building Land Other Total
Mitsui Fudosan Co., Ltd.Mitsui Fudosan Resort Management Co., Ltd.
Halekulani Okinawa (Kunigami, Okinawa) Hotel Reinforced concrete structure
10 floors above groundMay2019 40,731 126,746*2 20,427 3,907*2 5,739 30,075
Mitsui Fudosan Co., Ltd.Mitsui Fudosan Hotel Management Co., Ltd.
Mitsui Garden HotelGinza PremierOther domestic hotels in15 locations
Hotel – – 178,877*1 26,366*1*2 36,801 8,323*2 3,461 48,586
MITSUI FUDOSANAMERICA, INC.(Overseas subsidiary)
HalekulaniOne other overseas hotelin another location
Hotel – – 77,172 20,927*2 13,055 2,672*2 2,322 18,049
Mitsui Fudosan Co., Ltd.Mitsui Fudosan Golf Properties Co., Ltd.Daiasama Golf Club Co., Ltd.Kyusin Kaihatsu Inc.
Mitsuinomori KaruizawaCountry ClubSix other locations
Golf course – – 32,057 6,896,415*2 781 1,568*2 1,802 4,152
Mitsui Fudosan Co., Ltd.
Tsunamachi Mitsui Club(Minato-ku, Tokyo)
State guesthouse
Floors: reinforced concrete structureWalls: masonry construction2 floors above ground1 basement floor
Feb.1913 5,427 28,563 925 23,571 171 24,668
Note: Land includes leasehold. Other is tangible fixed assets excluding buildings, land, and construction in progress.*1 Data for the buildings and land is calculated based on the area in which the Group (the Company and its consolidated subsidiaries) maintains an
equity interest.*2 Land includes the area and amount corresponding to leasehold.
Company Name Property Name (Location) Type of Property Structure and Scale
Date of Construction Completion/Acquisition
Total Floor Area (m2)
Total Land Area (m2)
Book Value (Millions of Yen)
Building Land Other Total
Sanxin Outlets Co., Ltd.(Overseas subsidiary)
MITSUI OUTLET PARK LINKOU(New Taipei City, Taiwan)
Retailproperty
Reinforced concrete structure/steel construction (portion)2 floors above ground1 basement floor(3 floors above ground in part)
Jan2016 53,200 47,138*2 11,179 – 3,291 14,470
San Zhong Gong Outlet Co., Ltd.(Overseas subsidiary)
MITSUI OUTLET PARK TAICHUNG PORT (Taichung City, Taiwan)
Retail property
Reinforced concrete structure1 floors above ground(2 floors above ground in part)
Dec.2018 79,790 177,932*2 6,274 – 3,030 9,304
(B) OTHERS
63Mitsui Fudosan Co., Ltd.
5. Strategic Shareholdings
(A) Standards and Approach to the Classification of Investment Shares
In overall consideration for business strategy and relationships with business partners, to improve the Group’s corporate value, Mitsui Fudosan holds shares considered effective for
management strategies as shares for purposes other than net investments from a medium- to long-term perspective.
(B) Investment Shares Held for Purposes Other Than Net Investments
In overall consideration for business strategy and relationships with business partners, to improve the Group’s corporate value, Mitsui Fudosan holds shares in listed companies that are consid-ered effective for management strategies from a medium- to long-term perspective as shares for purposes other than net investments (strategic shareholdings).
Furthermore, we continuously review shareholding status. Upon confirming the significance of shareholdings based on the quantitative rationality of holdings and relationships with business partners, we have decided to reduce our shareholdings. In fiscal 2019, we sold 13 stock brands worth a total of ¥20.3 billion.
When verifying the rationality of shareholdings, we verify whether or not the benefits and risks associated with the
shareholdings are commensurate with the capital cost. Further-more, in addition to confirming the significance of shareholdings from perspectives such as transaction performance, stable fund-ing procurement, and creation of business opportunities, we also verify whether or not the holdings contribute to improving the medium- to long-term corporate value of the Group.
At a meeting held on May 12, 2020, the Board of Directors verified appropriateness with regard to the significance of strate-gic shareholdings based on the quantitative rationality of holding and relationships with business partners for each stock. As a result, we are considering selling stocks for which the rationality of holding or significance of holding has decreased, based on factors such as impact on the stock market.
(1) Method for verifying policy and rationality of shareholdings and content of verifications of individual stocks by the Board of Directors, etc.
(2) Number of stocks and total amount as recorded on the balance sheet
Number of stocks Book Value of Shares(millions of yen)
Unlisted shares 68 8,510Other holdings 60 526,658
Number of stocksTotal amount of transactions to increase the number of shares (millions of yen)
Reason for increase
Unlisted shares 4 2,485Considered effective for management strategies from a medium- to long-term perspective
Other holdings 1 2,503Considered effective for management strategies from a medium- to long-term perspective
Number of stocksTotal amount of sales to decrease the number of shares (millions of yen)
Unlisted shares 3 0Other holdings 13 20,344
(Stocks which saw an increase in the number of shares in fiscal 2019)
(Stocks which saw a decrease in the number of shares in fiscal 2019)
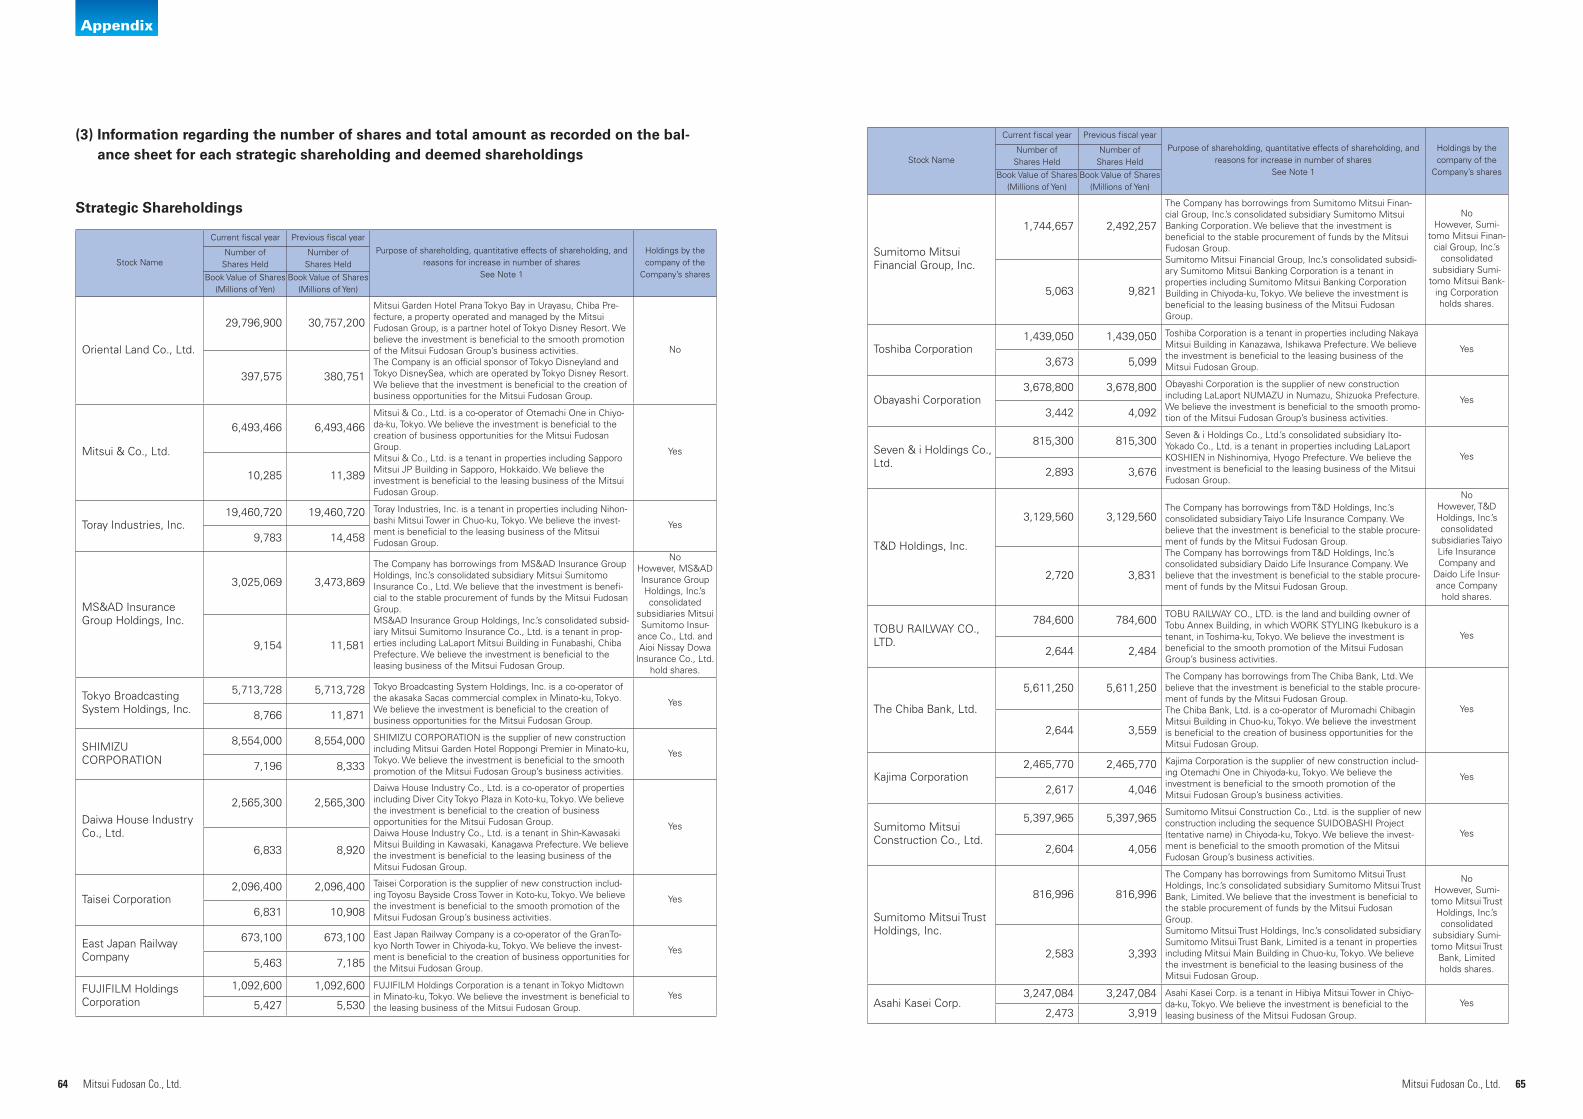
64 65Mitsui Fudosan Co., Ltd. Mitsui Fudosan Co., Ltd.
Appendix
Stock Name
Current fiscal year Previous fiscal year
Purpose of shareholding, quantitative effects of shareholding, and reasons for increase in number of shares
See Note 1
Holdings by the company of the
Company’s shares
Number of Shares Held
Number of Shares Held
Book Value of Shares (Millions of Yen)
Book Value of Shares (Millions of Yen)
Sumitomo Mitsui Financial Group, Inc.
1,744,657 2,492,257
The Company has borrowings from Sumitomo Mitsui Finan-cial Group, Inc.’s consolidated subsidiary Sumitomo Mitsui Banking Corporation. We believe that the investment is beneficial to the stable procurement of funds by the Mitsui Fudosan Group.Sumitomo Mitsui Financial Group, Inc.’s consolidated subsidi-ary Sumitomo Mitsui Banking Corporation is a tenant in properties including Sumitomo Mitsui Banking Corporation Building in Chiyoda-ku, Tokyo. We believe the investment is beneficial to the leasing business of the Mitsui Fudosan Group.
NoHowever, Sumi-
tomo Mitsui Finan-cial Group, Inc.’s
consolidated subsidiary Sumi-
tomo Mitsui Bank-ing Corporation holds shares.
5,063 9,821
Toshiba Corporation1,439,050 1,439,050 Toshiba Corporation is a tenant in properties including Nakaya
Mitsui Building in Kanazawa, Ishikawa Prefecture. We believe the investment is beneficial to the leasing business of the Mitsui Fudosan Group.
Yes3,673 5,099
Obayashi Corporation3,678,800 3,678,800 Obayashi Corporation is the supplier of new construction
including LaLaport NUMAZU in Numazu, Shizuoka Prefecture. We believe the investment is beneficial to the smooth promo-tion of the Mitsui Fudosan Group’s business activities.
Yes3,442 4,092
Seven & i Holdings Co., Ltd.
815,300 815,300 Seven & i Holdings Co., Ltd.’s consolidated subsidiary Ito-Yokado Co., Ltd. is a tenant in properties including LaLaport KOSHIEN in Nishinomiya, Hyogo Prefecture. We believe the investment is beneficial to the leasing business of the Mitsui Fudosan Group.
Yes
2,893 3,676
T&D Holdings, Inc.
3,129,560 3,129,560The Company has borrowings from T&D Holdings, Inc.’s consolidated subsidiary Taiyo Life Insurance Company. We believe that the investment is beneficial to the stable procure-ment of funds by the Mitsui Fudosan Group.The Company has borrowings from T&D Holdings, Inc.’s consolidated subsidiary Daido Life Insurance Company. We believe that the investment is beneficial to the stable procure-ment of funds by the Mitsui Fudosan Group.
NoHowever, T&D Holdings, Inc.’s consolidated
subsidiaries Taiyo Life Insurance Company and
Daido Life Insur-ance Company
hold shares.
2,720 3,831
TOBU RAILWAY CO., LTD.
784,600 784,600 TOBU RAILWAY CO., LTD. is the land and building owner of Tobu Annex Building, in which WORK STYLING Ikebukuro is a tenant, in Toshima-ku, Tokyo. We believe the investment is beneficial to the smooth promotion of the Mitsui Fudosan Group’s business activities.
Yes
2,644 2,484
The Chiba Bank, Ltd.
5,611,250 5,611,250The Company has borrowings from The Chiba Bank, Ltd. We believe that the investment is beneficial to the stable procure-ment of funds by the Mitsui Fudosan Group.The Chiba Bank, Ltd. is a co-operator of Muromachi Chibagin Mitsui Building in Chuo-ku, Tokyo. We believe the investment is beneficial to the creation of business opportunities for the Mitsui Fudosan Group.
Yes
2,644 3,559
Kajima Corporation2,465,770 2,465,770 Kajima Corporation is the supplier of new construction includ-
ing Otemachi One in Chiyoda-ku, Tokyo. We believe the investment is beneficial to the smooth promotion of the Mitsui Fudosan Group’s business activities.
Yes2,617 4,046
Sumitomo Mitsui Construction Co., Ltd.
5,397,965 5,397,965 Sumitomo Mitsui Construction Co., Ltd. is the supplier of new construction including the sequence SUIDOBASHI Project (tentative name) in Chiyoda-ku, Tokyo. We believe the invest-ment is beneficial to the smooth promotion of the Mitsui Fudosan Group’s business activities.
Yes
2,604 4,056
Sumitomo Mitsui Trust Holdings, Inc.
816,996 816,996
The Company has borrowings from Sumitomo Mitsui Trust Holdings, Inc.’s consolidated subsidiary Sumitomo Mitsui Trust Bank, Limited. We believe that the investment is beneficial to the stable procurement of funds by the Mitsui Fudosan Group.Sumitomo Mitsui Trust Holdings, Inc.’s consolidated subsidiary Sumitomo Mitsui Trust Bank, Limited is a tenant in properties including Mitsui Main Building in Chuo-ku, Tokyo. We believe the investment is beneficial to the leasing business of the Mitsui Fudosan Group.
NoHowever, Sumi-
tomo Mitsui Trust Holdings, Inc.’s consolidated
subsidiary Sumi-tomo Mitsui Trust
Bank, Limited holds shares.
2,583 3,393
Asahi Kasei Corp.3,247,084 3,247,084 Asahi Kasei Corp. is a tenant in Hibiya Mitsui Tower in Chiyo-
da-ku, Tokyo. We believe the investment is beneficial to the leasing business of the Mitsui Fudosan Group.
Yes2,473 3,919
Stock Name
Current fiscal year Previous fiscal year
Purpose of shareholding, quantitative effects of shareholding, and reasons for increase in number of shares
See Note 1
Holdings by the company of the
Company’s shares
Number of Shares Held
Number of Shares Held
Book Value of Shares (Millions of Yen)
Book Value of Shares (Millions of Yen)
Oriental Land Co., Ltd.
29,796,900 30,757,200
Mitsui Garden Hotel Prana Tokyo Bay in Urayasu, Chiba Pre-fecture, a property operated and managed by the Mitsui Fudosan Group, is a partner hotel of Tokyo Disney Resort. We believe the investment is beneficial to the smooth promotion of the Mitsui Fudosan Group’s business activities.The Company is an official sponsor of Tokyo Disneyland and Tokyo DisneySea, which are operated by Tokyo Disney Resort. We believe that the investment is beneficial to the creation of business opportunities for the Mitsui Fudosan Group.
No
397,575 380,751
Mitsui & Co., Ltd.
6,493,466 6,493,466Mitsui & Co., Ltd. is a co-operator of Otemachi One in Chiyo-da-ku, Tokyo. We believe the investment is beneficial to the creation of business opportunities for the Mitsui Fudosan Group.Mitsui & Co., Ltd. is a tenant in properties including Sapporo Mitsui JP Building in Sapporo, Hokkaido. We believe the investment is beneficial to the leasing business of the Mitsui Fudosan Group.
Yes
10,285 11,389
Toray Industries, Inc.19,460,720 19,460,720 Toray Industries, Inc. is a tenant in properties including Nihon-
bashi Mitsui Tower in Chuo-ku, Tokyo. We believe the invest-ment is beneficial to the leasing business of the Mitsui Fudosan Group.
Yes9,783 14,458
MS&AD Insurance Group Holdings, Inc.
3,025,069 3,473,869
The Company has borrowings from MS&AD Insurance Group Holdings, Inc.’s consolidated subsidiary Mitsui Sumitomo Insurance Co., Ltd. We believe that the investment is benefi-cial to the stable procurement of funds by the Mitsui Fudosan Group.MS&AD Insurance Group Holdings, Inc.’s consolidated subsid-iary Mitsui Sumitomo Insurance Co., Ltd. is a tenant in prop-erties including LaLaport Mitsui Building in Funabashi, Chiba Prefecture. We believe the investment is beneficial to the leasing business of the Mitsui Fudosan Group.
NoHowever, MS&AD Insurance Group Holdings, Inc.’s consolidated
subsidiaries Mitsui Sumitomo Insur-
ance Co., Ltd. and Aioi Nissay Dowa
Insurance Co., Ltd. hold shares.
9,154 11,581
Tokyo Broadcasting System Holdings, Inc.
5,713,728 5,713,728 Tokyo Broadcasting System Holdings, Inc. is a co-operator of the akasaka Sacas commercial complex in Minato-ku, Tokyo. We believe the investment is beneficial to the creation of business opportunities for the Mitsui Fudosan Group.
Yes8,766 11,871
SHIMIZU CORPORATION
8,554,000 8,554,000 SHIMIZU CORPORATION is the supplier of new construction including Mitsui Garden Hotel Roppongi Premier in Minato-ku, Tokyo. We believe the investment is beneficial to the smooth promotion of the Mitsui Fudosan Group’s business activities.
Yes7,196 8,333
Daiwa House Industry Co., Ltd.
2,565,300 2,565,300Daiwa House Industry Co., Ltd. is a co-operator of properties including Diver City Tokyo Plaza in Koto-ku, Tokyo. We believe the investment is beneficial to the creation of business opportunities for the Mitsui Fudosan Group.Daiwa House Industry Co., Ltd. is a tenant in Shin-Kawasaki Mitsui Building in Kawasaki, Kanagawa Prefecture. We believe the investment is beneficial to the leasing business of the Mitsui Fudosan Group.
Yes
6,833 8,920
Taisei Corporation2,096,400 2,096,400 Taisei Corporation is the supplier of new construction includ-
ing Toyosu Bayside Cross Tower in Koto-ku, Tokyo. We believe the investment is beneficial to the smooth promotion of the Mitsui Fudosan Group’s business activities.
Yes6,831 10,908
East Japan Railway Company
673,100 673,100 East Japan Railway Company is a co-operator of the GranTo-kyo North Tower in Chiyoda-ku, Tokyo. We believe the invest-ment is beneficial to the creation of business opportunities for the Mitsui Fudosan Group.
Yes5,463 7,185
FUJIFILM Holdings Corporation
1,092,600 1,092,600 FUJIFILM Holdings Corporation is a tenant in Tokyo Midtown in Minato-ku, Tokyo. We believe the investment is beneficial to the leasing business of the Mitsui Fudosan Group.
Yes5,427 5,530
Strategic Shareholdings
(3) Information regarding the number of shares and total amount as recorded on the bal-ance sheet for each strategic shareholding and deemed shareholdings
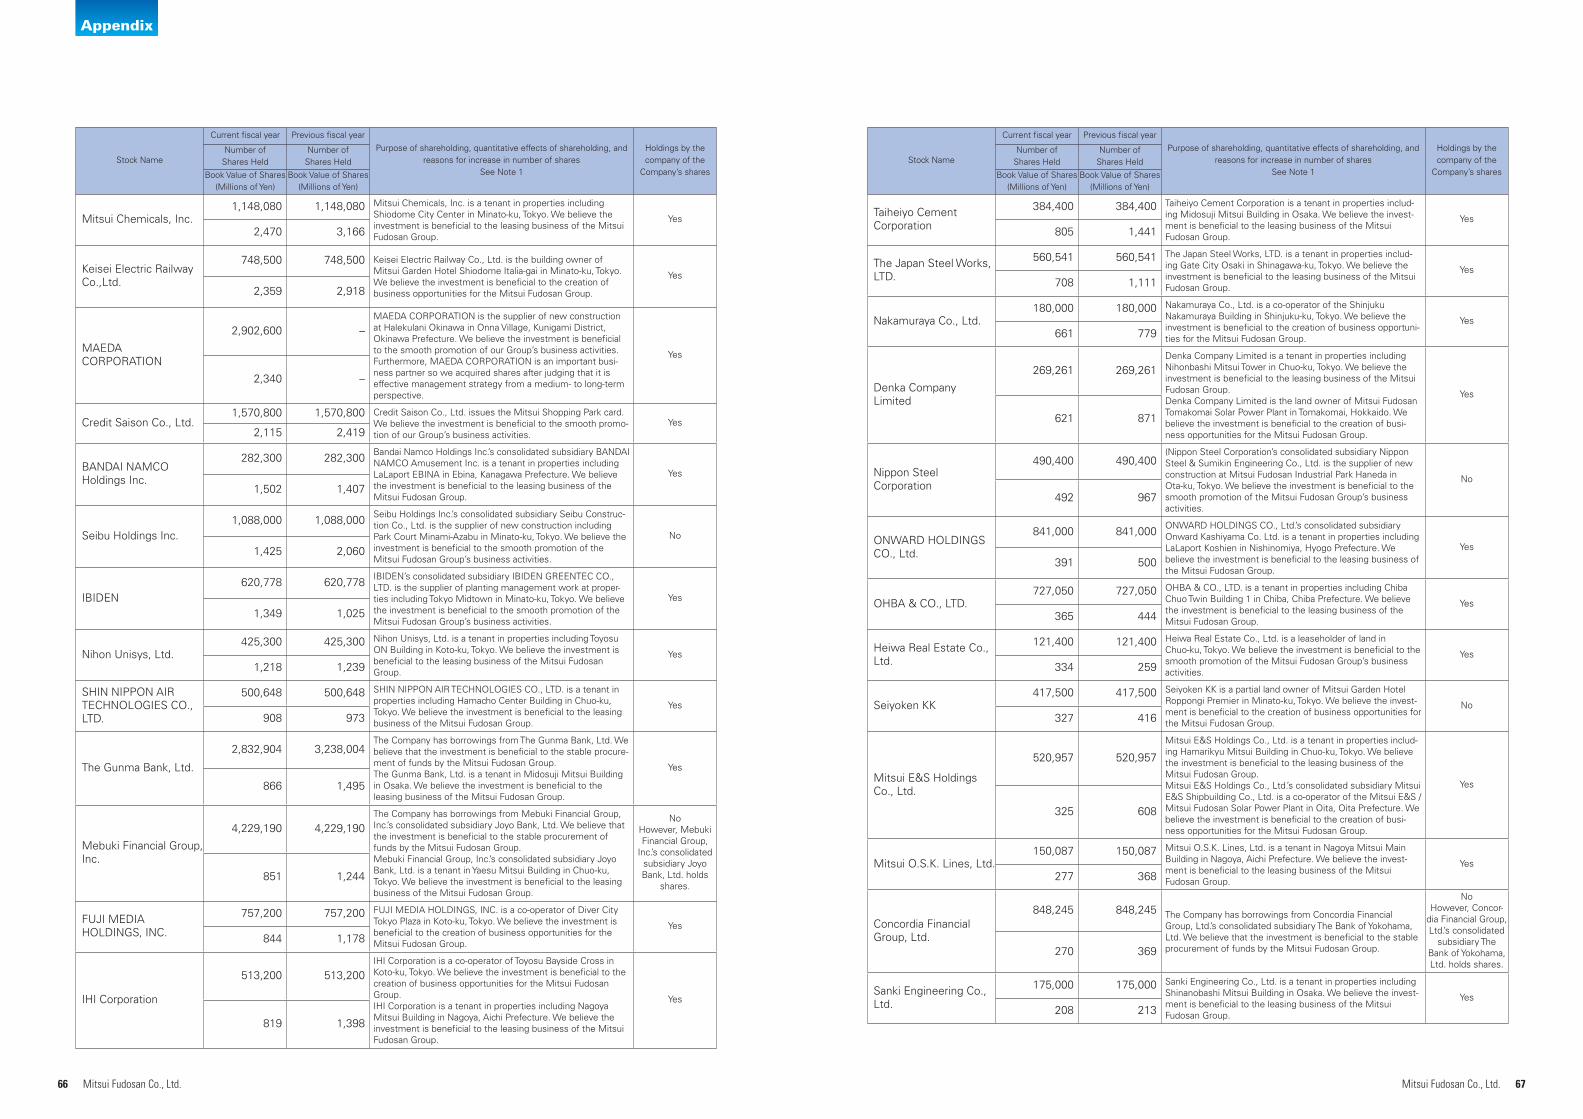
66 67Mitsui Fudosan Co., Ltd. Mitsui Fudosan Co., Ltd.
Appendix
Stock Name
Current fiscal year Previous fiscal year
Purpose of shareholding, quantitative effects of shareholding, and reasons for increase in number of shares
See Note 1
Holdings by the company of the
Company’s shares
Number of Shares Held
Number of Shares Held
Book Value of Shares (Millions of Yen)
Book Value of Shares (Millions of Yen)
Taiheiyo Cement Corporation
384,400 384,400 Taiheiyo Cement Corporation is a tenant in properties includ-ing Midosuji Mitsui Building in Osaka. We believe the invest-ment is beneficial to the leasing business of the Mitsui Fudosan Group.
Yes805 1,441
The Japan Steel Works, LTD.
560,541 560,541 The Japan Steel Works, LTD. is a tenant in properties includ-ing Gate City Osaki in Shinagawa-ku, Tokyo. We believe the investment is beneficial to the leasing business of the Mitsui Fudosan Group.
Yes708 1,111
Nakamuraya Co., Ltd.180,000 180,000 Nakamuraya Co., Ltd. is a co-operator of the Shinjuku
Nakamuraya Building in Shinjuku-ku, Tokyo. We believe the investment is beneficial to the creation of business opportuni-ties for the Mitsui Fudosan Group.
Yes661 779
Denka Company Limited
269,261 269,261Denka Company Limited is a tenant in properties including Nihonbashi Mitsui Tower in Chuo-ku, Tokyo. We believe the investment is beneficial to the leasing business of the Mitsui Fudosan Group.Denka Company Limited is the land owner of Mitsui Fudosan Tomakomai Solar Power Plant in Tomakomai, Hokkaido. We believe the investment is beneficial to the creation of busi-ness opportunities for the Mitsui Fudosan Group.
Yes
621 871
Nippon Steel Corporation
490,400 490,400(Nippon Steel Corporation’s consolidated subsidiary Nippon Steel & Sumikin Engineering Co., Ltd. is the supplier of new construction at Mitsui Fudosan Industrial Park Haneda in Ota-ku, Tokyo. We believe the investment is beneficial to the smooth promotion of the Mitsui Fudosan Group’s business activities.
No
492 967
ONWARD HOLDINGS CO., Ltd.
841,000 841,000 ONWARD HOLDINGS CO., Ltd.’s consolidated subsidiary Onward Kashiyama Co. Ltd. is a tenant in properties including LaLaport Koshien in Nishinomiya, Hyogo Prefecture. We believe the investment is beneficial to the leasing business of the Mitsui Fudosan Group.
Yes
391 500
OHBA & CO., LTD.727,050 727,050 OHBA & CO., LTD. is a tenant in properties including Chiba
Chuo Twin Building 1 in Chiba, Chiba Prefecture. We believe the investment is beneficial to the leasing business of the Mitsui Fudosan Group.
Yes365 444
Heiwa Real Estate Co., Ltd.
121,400 121,400 Heiwa Real Estate Co., Ltd. is a leaseholder of land in Chuo-ku, Tokyo. We believe the investment is beneficial to the smooth promotion of the Mitsui Fudosan Group’s business activities.
Yes334 259
Seiyoken KK417,500 417,500 Seiyoken KK is a partial land owner of Mitsui Garden Hotel
Roppongi Premier in Minato-ku, Tokyo. We believe the invest-ment is beneficial to the creation of business opportunities for the Mitsui Fudosan Group.
No327 416
Mitsui E&S Holdings Co., Ltd.
520,957 520,957
Mitsui E&S Holdings Co., Ltd. is a tenant in properties includ-ing Hamarikyu Mitsui Building in Chuo-ku, Tokyo. We believe the investment is beneficial to the leasing business of the Mitsui Fudosan Group.Mitsui E&S Holdings Co., Ltd.’s consolidated subsidiary Mitsui E&S Shipbuilding Co., Ltd. is a co-operator of the Mitsui E&S / Mitsui Fudosan Solar Power Plant in Oita, Oita Prefecture. We believe the investment is beneficial to the creation of busi-ness opportunities for the Mitsui Fudosan Group.
Yes
325 608
Mitsui O.S.K. Lines, Ltd.150,087 150,087 Mitsui O.S.K. Lines, Ltd. is a tenant in Nagoya Mitsui Main
Building in Nagoya, Aichi Prefecture. We believe the invest-ment is beneficial to the leasing business of the Mitsui Fudosan Group.
Yes277 368
Concordia Financial Group, Ltd.
848,245 848,245 The Company has borrowings from Concordia Financial Group, Ltd.’s consolidated subsidiary The Bank of Yokohama, Ltd. We believe that the investment is beneficial to the stable procurement of funds by the Mitsui Fudosan Group.
NoHowever, Concor-
dia Financial Group, Ltd.’s consolidated
subsidiary The Bank of Yokohama, Ltd. holds shares.
270 369
Sanki Engineering Co., Ltd.
175,000 175,000 Sanki Engineering Co., Ltd. is a tenant in properties including Shinanobashi Mitsui Building in Osaka. We believe the invest-ment is beneficial to the leasing business of the Mitsui Fudosan Group.
Yes208 213
Stock Name
Current fiscal year Previous fiscal year
Purpose of shareholding, quantitative effects of shareholding, and reasons for increase in number of shares
See Note 1
Holdings by the company of the
Company’s shares
Number of Shares Held
Number of Shares Held
Book Value of Shares (Millions of Yen)
Book Value of Shares (Millions of Yen)
Mitsui Chemicals, Inc.1,148,080 1,148,080 Mitsui Chemicals, Inc. is a tenant in properties including
Shiodome City Center in Minato-ku, Tokyo. We believe the investment is beneficial to the leasing business of the Mitsui Fudosan Group.
Yes2,470 3,166
Keisei Electric Railway Co.,Ltd.
748,500 748,500 Keisei Electric Railway Co., Ltd. is the building owner of Mitsui Garden Hotel Shiodome Italia-gai in Minato-ku, Tokyo. We believe the investment is beneficial to the creation of business opportunities for the Mitsui Fudosan Group.
Yes
2,359 2,918
MAEDA CORPORATION
2,902,600 –MAEDA CORPORATION is the supplier of new construction at Halekulani Okinawa in Onna Village, Kunigami District, Okinawa Prefecture. We believe the investment is beneficial to the smooth promotion of our Group’s business activities.Furthermore, MAEDA CORPORATION is an important busi-ness partner so we acquired shares after judging that it is effective management strategy from a medium- to long-term perspective.
Yes
2,340 –
Credit Saison Co., Ltd.1,570,800 1,570,800 Credit Saison Co., Ltd. issues the Mitsui Shopping Park card.
We believe the investment is beneficial to the smooth promo-tion of our Group’s business activities.
Yes2,115 2,419
BANDAI NAMCO Holdings Inc.
282,300 282,300 Bandai Namco Holdings Inc.’s consolidated subsidiary BANDAI NAMCO Amusement Inc. is a tenant in properties including LaLaport EBINA in Ebina, Kanagawa Prefecture. We believe the investment is beneficial to the leasing business of the Mitsui Fudosan Group.
Yes
1,502 1,407
Seibu Holdings Inc.1,088,000 1,088,000 Seibu Holdings Inc.’s consolidated subsidiary Seibu Construc-
tion Co., Ltd. is the supplier of new construction including Park Court Minami-Azabu in Minato-ku, Tokyo. We believe the investment is beneficial to the smooth promotion of the Mitsui Fudosan Group’s business activities.
No
1,425 2,060
IBIDEN620,778 620,778 IBIDEN’s consolidated subsidiary IBIDEN GREENTEC CO.,
LTD. is the supplier of planting management work at proper-ties including Tokyo Midtown in Minato-ku, Tokyo. We believe the investment is beneficial to the smooth promotion of the Mitsui Fudosan Group’s business activities.
Yes
1,349 1,025
Nihon Unisys, Ltd.425,300 425,300 Nihon Unisys, Ltd. is a tenant in properties including Toyosu
ON Building in Koto-ku, Tokyo. We believe the investment is beneficial to the leasing business of the Mitsui Fudosan Group.
Yes1,218 1,239
SHIN NIPPON AIR TECHNOLOGIES CO., LTD.
500,648 500,648 SHIN NIPPON AIR TECHNOLOGIES CO., LTD. is a tenant in properties including Hamacho Center Building in Chuo-ku, Tokyo. We believe the investment is beneficial to the leasing business of the Mitsui Fudosan Group.
Yes908 973
The Gunma Bank, Ltd.
2,832,904 3,238,004The Company has borrowings from The Gunma Bank, Ltd. We believe that the investment is beneficial to the stable procure-ment of funds by the Mitsui Fudosan Group.The Gunma Bank, Ltd. is a tenant in Midosuji Mitsui Building in Osaka. We believe the investment is beneficial to the leasing business of the Mitsui Fudosan Group.
Yes
866 1,495
Mebuki Financial Group, Inc.
4,229,190 4,229,190The Company has borrowings from Mebuki Financial Group, Inc.’s consolidated subsidiary Joyo Bank, Ltd. We believe that the investment is beneficial to the stable procurement of funds by the Mitsui Fudosan Group.Mebuki Financial Group, Inc.’s consolidated subsidiary Joyo Bank, Ltd. is a tenant in Yaesu Mitsui Building in Chuo-ku, Tokyo. We believe the investment is beneficial to the leasing business of the Mitsui Fudosan Group.
NoHowever, Mebuki Financial Group,
Inc.’s consolidated subsidiary Joyo Bank, Ltd. holds
shares.851 1,244
FUJI MEDIA HOLDINGS, INC.
757,200 757,200 FUJI MEDIA HOLDINGS, INC. is a co-operator of Diver City Tokyo Plaza in Koto-ku, Tokyo. We believe the investment is beneficial to the creation of business opportunities for the Mitsui Fudosan Group.
Yes844 1,178
IHI Corporation
513,200 513,200IHI Corporation is a co-operator of Toyosu Bayside Cross in Koto-ku, Tokyo. We believe the investment is beneficial to the creation of business opportunities for the Mitsui Fudosan Group.IHI Corporation is a tenant in properties including Nagoya Mitsui Building in Nagoya, Aichi Prefecture. We believe the investment is beneficial to the leasing business of the Mitsui Fudosan Group.
Yes
819 1,398
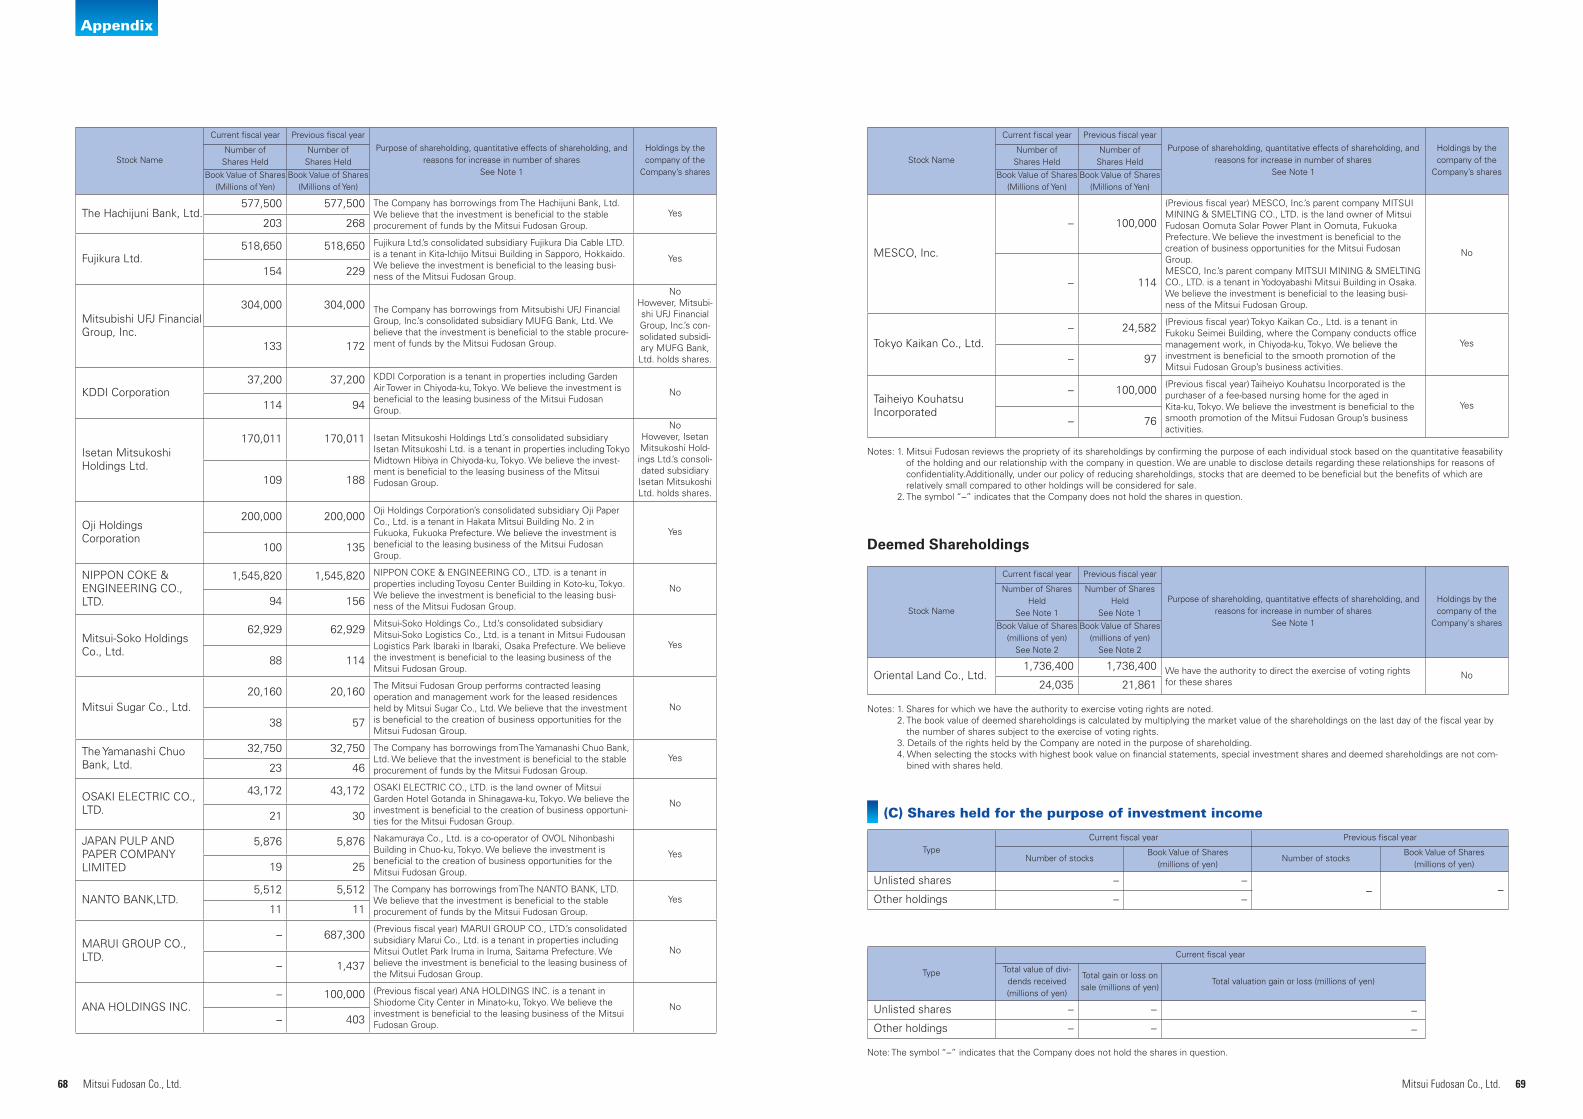
68 69Mitsui Fudosan Co., Ltd. Mitsui Fudosan Co., Ltd.
Appendix
Deemed Shareholdings
Stock Name
Current fiscal year Previous fiscal year
Purpose of shareholding, quantitative effects of shareholding, and reasons for increase in number of shares
See Note 1
Holdings by the company of the
Company's shares
Number of Shares Held
See Note 1
Number of Shares Held
See Note 1
Book Value of Shares (millions of yen)
See Note 2
Book Value of Shares (millions of yen)
See Note 2
Oriental Land Co., Ltd.1,736,400 1,736,400 We have the authority to direct the exercise of voting rights
for these sharesNo
24,035 21,861
Notes: 1. Shares for which we have the authority to exercise voting rights are noted. 2. The book value of deemed shareholdings is calculated by multiplying the market value of the shareholdings on the last day of the fiscal year by
the number of shares subject to the exercise of voting rights. 3. Details of the rights held by the Company are noted in the purpose of shareholding. 4. When selecting the stocks with highest book value on financial statements, special investment shares and deemed shareholdings are not com-
bined with shares held.
TypeCurrent fiscal year Previous fiscal year
Number of stocksBook Value of Shares
(millions of yen)Number of stocks
Book Value of Shares(millions of yen)
Unlisted shares – –– –
Other holdings – –
Type
Current fiscal year
Total value of divi-dends received (millions of yen)
Total gain or loss on sale (millions of yen)
Total valuation gain or loss (millions of yen)
Unlisted shares – – –
Other holdings – – –
Note: The symbol “–” indicates that the Company does not hold the shares in question.
Stock Name
Current fiscal year Previous fiscal year
Purpose of shareholding, quantitative effects of shareholding, and reasons for increase in number of shares
See Note 1
Holdings by the company of the
Company’s shares
Number of Shares Held
Number of Shares Held
Book Value of Shares (Millions of Yen)
Book Value of Shares (Millions of Yen)
MESCO, Inc.
– 100,000
(Previous fiscal year) MESCO, Inc.’s parent company MITSUI MINING & SMELTING CO., LTD. is the land owner of Mitsui Fudosan Oomuta Solar Power Plant in Oomuta, Fukuoka Prefecture. We believe the investment is beneficial to the creation of business opportunities for the Mitsui Fudosan Group.MESCO, Inc.’s parent company MITSUI MINING & SMELTING CO., LTD. is a tenant in Yodoyabashi Mitsui Building in Osaka. We believe the investment is beneficial to the leasing busi-ness of the Mitsui Fudosan Group.
No
– 114
Tokyo Kaikan Co., Ltd.– 24,582 (Previous fiscal year) Tokyo Kaikan Co., Ltd. is a tenant in
Fukoku Seimei Building, where the Company conducts office management work, in Chiyoda-ku, Tokyo. We believe the investment is beneficial to the smooth promotion of the Mitsui Fudosan Group’s business activities.
Yes
– 97
Taiheiyo Kouhatsu Incorporated
– 100,000 (Previous fiscal year) Taiheiyo Kouhatsu Incorporated is the purchaser of a fee-based nursing home for the aged in Kita-ku, Tokyo. We believe the investment is beneficial to the smooth promotion of the Mitsui Fudosan Group’s business activities.
Yes
– 76
Notes: 1. Mitsui Fudosan reviews the propriety of its shareholdings by confirming the purpose of each individual stock based on the quantitative feasability of the holding and our relationship with the company in question. We are unable to disclose details regarding these relationships for reasons of confidentiality.Additionally, under our policy of reducing shareholdings, stocks that are deemed to be beneficial but the benefits of which are relatively small compared to other holdings will be considered for sale.
2. The symbol “–” indicates that the Company does not hold the shares in question.
(C) Shares held for the purpose of investment income
Stock Name
Current fiscal year Previous fiscal year
Purpose of shareholding, quantitative effects of shareholding, and reasons for increase in number of shares
See Note 1
Holdings by the company of the
Company’s shares
Number of Shares Held
Number of Shares Held
Book Value of Shares (Millions of Yen)
Book Value of Shares (Millions of Yen)
The Hachijuni Bank, Ltd.577,500 577,500 The Company has borrowings from The Hachijuni Bank, Ltd.
We believe that the investment is beneficial to the stable procurement of funds by the Mitsui Fudosan Group.
Yes203 268
Fujikura Ltd.518,650 518,650 Fujikura Ltd.’s consolidated subsidiary Fujikura Dia Cable LTD.
is a tenant in Kita-Ichijo Mitsui Building in Sapporo, Hokkaido. We believe the investment is beneficial to the leasing busi-ness of the Mitsui Fudosan Group.
Yes154 229
Mitsubishi UFJ Financial Group, Inc.
304,000 304,000 The Company has borrowings from Mitsubishi UFJ Financial Group, Inc.’s consolidated subsidiary MUFG Bank, Ltd. We believe that the investment is beneficial to the stable procure-ment of funds by the Mitsui Fudosan Group.
NoHowever, Mitsubi-shi UFJ Financial Group, Inc.’s con-solidated subsidi-ary MUFG Bank, Ltd. holds shares.
133 172
KDDI Corporation37,200 37,200 KDDI Corporation is a tenant in properties including Garden
Air Tower in Chiyoda-ku, Tokyo. We believe the investment is beneficial to the leasing business of the Mitsui Fudosan Group.
No114 94
Isetan Mitsukoshi Holdings Ltd.
170,011 170,011 Isetan Mitsukoshi Holdings Ltd.’s consolidated subsidiary Isetan Mitsukoshi Ltd. is a tenant in properties including Tokyo Midtown Hibiya in Chiyoda-ku, Tokyo. We believe the invest-ment is beneficial to the leasing business of the Mitsui Fudosan Group.
NoHowever, Isetan Mitsukoshi Hold-ings Ltd.’s consoli-dated subsidiary
Isetan Mitsukoshi Ltd. holds shares.
109 188
Oji Holdings Corporation
200,000 200,000 Oji Holdings Corporation’s consolidated subsidiary Oji Paper Co., Ltd. is a tenant in Hakata Mitsui Building No. 2 in Fukuoka, Fukuoka Prefecture. We believe the investment is beneficial to the leasing business of the Mitsui Fudosan Group.
Yes
100 135
NIPPON COKE & ENGINEERING CO., LTD.
1,545,820 1,545,820 NIPPON COKE & ENGINEERING CO., LTD. is a tenant in properties including Toyosu Center Building in Koto-ku, Tokyo. We believe the investment is beneficial to the leasing busi-ness of the Mitsui Fudosan Group.
No94 156
Mitsui-Soko Holdings Co., Ltd.
62,929 62,929 Mitsui-Soko Holdings Co., Ltd.’s consolidated subsidiary Mitsui-Soko Logistics Co., Ltd. is a tenant in Mitsui Fudousan Logistics Park Ibaraki in Ibaraki, Osaka Prefecture. We believe the investment is beneficial to the leasing business of the Mitsui Fudosan Group.
Yes
88 114
Mitsui Sugar Co., Ltd.20,160 20,160 The Mitsui Fudosan Group performs contracted leasing
operation and management work for the leased residences held by Mitsui Sugar Co., Ltd. We believe that the investment is beneficial to the creation of business opportunities for the Mitsui Fudosan Group.
No
38 57
The Yamanashi Chuo Bank, Ltd.
32,750 32,750 The Company has borrowings fromThe Yamanashi Chuo Bank, Ltd. We believe that the investment is beneficial to the stable procurement of funds by the Mitsui Fudosan Group.
Yes23 46
OSAKI ELECTRIC CO., LTD.
43,172 43,172 OSAKI ELECTRIC CO., LTD. is the land owner of Mitsui Garden Hotel Gotanda in Shinagawa-ku, Tokyo. We believe the investment is beneficial to the creation of business opportuni-ties for the Mitsui Fudosan Group.
No21 30
JAPAN PULP AND PAPER COMPANY LIMITED
5,876 5,876 Nakamuraya Co., Ltd. is a co-operator of OVOL Nihonbashi Building in Chuo-ku, Tokyo. We believe the investment is beneficial to the creation of business opportunities for the Mitsui Fudosan Group.
Yes19 25
NANTO BANK,LTD.5,512 5,512 The Company has borrowings fromThe NANTO BANK, LTD.
We believe that the investment is beneficial to the stable procurement of funds by the Mitsui Fudosan Group.
Yes11 11
MARUI GROUP CO., LTD.
– 687,300 (Previous fiscal year) MARUI GROUP CO., LTD.’s consolidated subsidiary Marui Co., Ltd. is a tenant in properties including Mitsui Outlet Park Iruma in Iruma, Saitama Prefecture. We believe the investment is beneficial to the leasing business of the Mitsui Fudosan Group.
No
– 1,437
ANA HOLDINGS INC.– 100,000 (Previous fiscal year) ANA HOLDINGS INC. is a tenant in
Shiodome City Center in Minato-ku, Tokyo. We believe the investment is beneficial to the leasing business of the Mitsui Fudosan Group.
No– 403