christine thomas - university of southern...
TRANSCRIPT
MYRES 2004
Seismic Constraints on Boundary Layers
Christine Thomas

Outline
Seismic constraints: • what can we resolve?• how can we detect seismic structures?• how well can we resolve these structures?
(resolution issues)
Boundary layers in the mantle:
• core-mantle boundary• D”• mantle transition zone (660-410) • upper mantle discontinuities• other discontinuities in the mantle?

Overview - seismic phases:source
Direct waves: travel through layers without reflection (e.g. P, S)
Depth phases: travel first to the surface, then through layers (with or without reflections), e.g. sS, pP, sP
Multiples: wave that arrives at surface, reflects and travels through Earth again, (SS, PP, PPP etc)

Overview - seismic phases:Names of phases: Different layers of the Earth are denoted by
different letters:
K - transmission through core (P-waves)c - reflection from core-mantle boundary (CMB) – P and SI - transmission through inner core (P-wave)i - reflection from inner core boundary (ICB) – P and SJ - transmission of S-wave through inner core
PcP or ScS
PKPor SKS Also: PKIKP, SKIKS
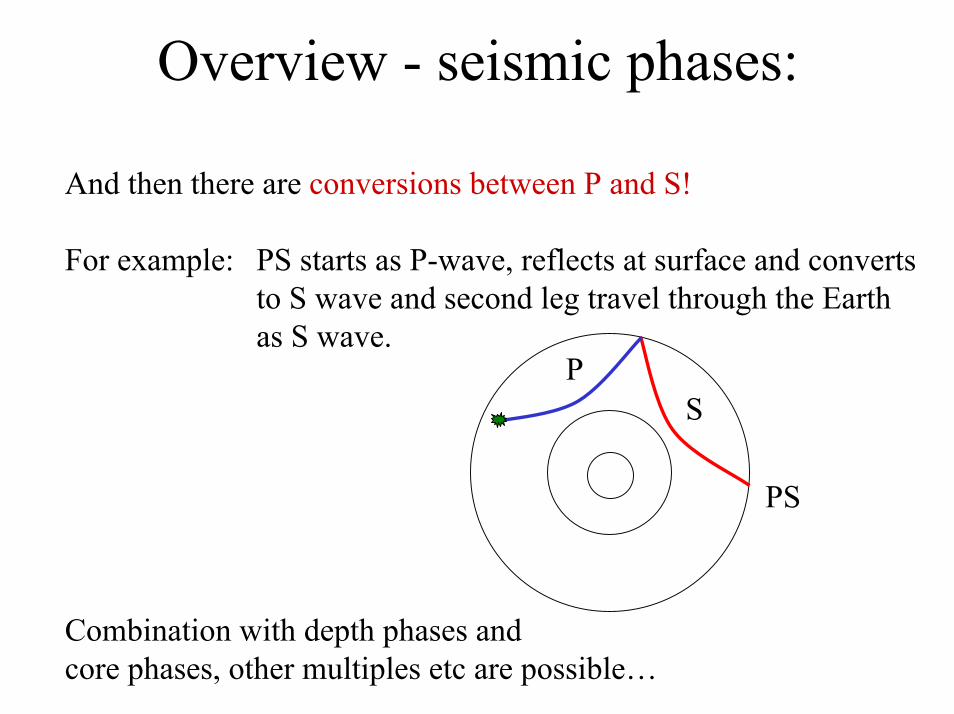
Overview - seismic phases:
And then there are conversions between P and S!
For example: PS starts as P-wave, reflects at surface and convertsto S wave and second leg travel through the Earthas S wave.
PS
Combination with depth phases andcore phases, other multiples etc are possible…
PS

A simple Earth
If the Earth only had mantle, outer and inner core (no other layers):
(higher order multiples and depth phasesnot shown)

A not quite so simple EarthReal seismograms show that the Earth is more complex:

More layers in our simple EarthIf we add more layers to the simple Earth, we expect more arrivalsin the seismogram:

More layers in our simple EarthIntroducing upper mantle discontinuities
(660 km and 410 km discontinuities):
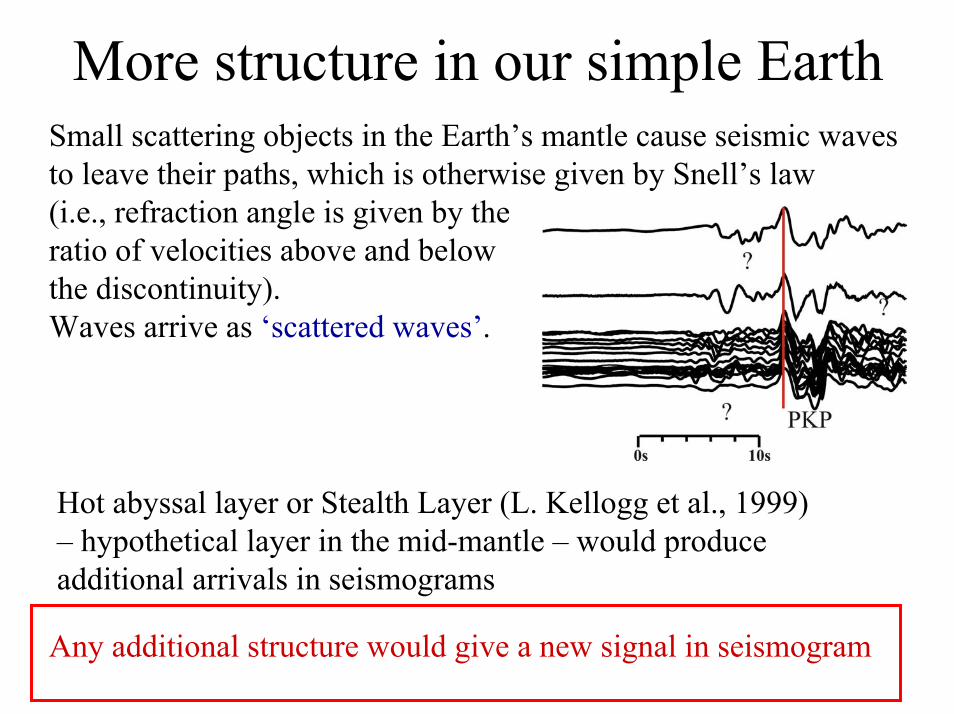
More structure in our simple EarthSmall scattering objects in the Earth’s mantle cause seismic wavesto leave their paths, which is otherwise given by Snell’s law (i.e., refraction angle is given by the ratio of velocities above and below the discontinuity). Waves arrive as ‘scattered waves’.
Hot abyssal layer or Stealth Layer (L. Kellogg et al., 1999)– hypothetical layer in the mid-mantle – would produce additional arrivals in seismograms
Any additional structure would give a new signal in seismogram

Ways to analyse data• Waveform modelling• Travel times (raytracing)• Global stacking• Differential travel times• Array seismology
Can either concentrate on arrival times or waveformsor both
Trav
el ti
me
[s]
Distance [deg]
P
PcP
PKPPP
Travel times studies rely on ‘Travel time curves’

Analysing Data• Waveform modelling – looking at a wave that arrives at station.
if not the same as predicted by Earth model: change model,compare waveforms again …
• Travel times/differential travel times – additional arrivals in seismograms. Arrival time can give indication of depth and place of structure
Travel time of known phases – can give indication of velocities on path (Tomography)
• Global stacking – search for global differences in reflections orpresence or absence of waves.
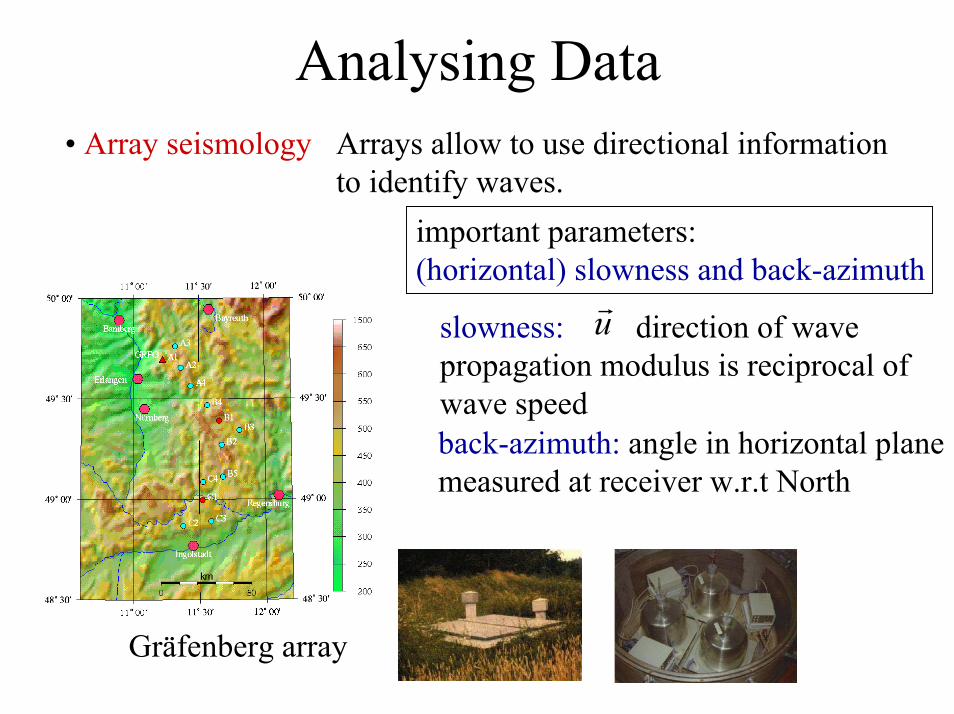
Analysing Data• Array seismology Arrays allow to use directional information
to identify waves.important parameters: (horizontal) slowness and back-azimuth
slowness: direction of wave propagation modulus is reciprocal of wave speed
ur
back-azimuth: angle in horizontal planemeasured at receiver w.r.t North
Gräfenberg array
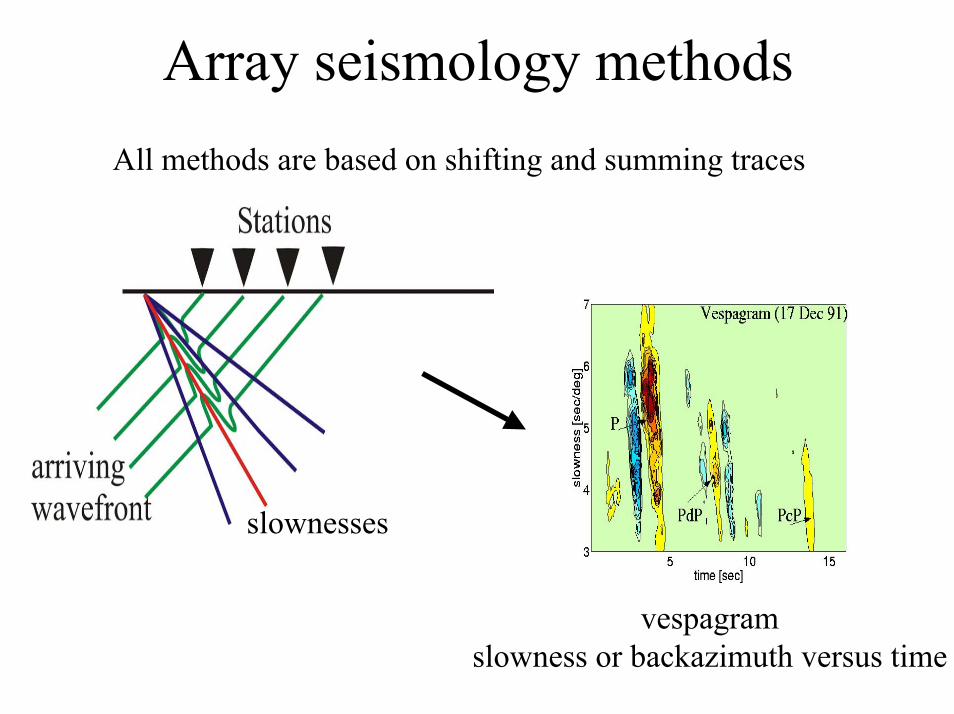
Array seismology methodsAll methods are based on shifting and summing traces
vespagramslowness or backazimuth versus time
slownesses

Resolution – Fresnel zone
Volume around ray contributes to signal:Fresnel volume.At reflector this volume (in 1D) is the Fresnel zone.
Size of Fresnel zone depends on:frequency, depth of reflector, andseismic velocity (⇒ wavelength).view from top

Resolution – Fresnel ZoneWhat does that mean? If we deal with a strictly layered (1D) Earthour resolution is only as good as the size of the Fresnel zone!
e.g.: P-waves reflected at D”: 2 x 4 degrees (1Hz)S-waves reflected at D”: 3.5 x 7 degrees (6 s)
(1 degree ~60km at the CMB)
But PP precursors have a different Fresnel zone:

Resolution – what can we resolve?
Does that mean we don’t see scatteringin all other places? NO
Does it mean we haven’t been able tolook in other places? YES
We need suitable source receiver combinations to study differentstructures. This is not always possible for all the regions of the Earth!

Boundary layers in the mantle
2) Transition zone
1) D” region 3) possible mid-mantle reflectors?
after Strohbach

D” regionFor a long time it has been recognised that the D” region in the Earth’s mantle is different from the rest of the lower mantle
e.g. Earth models such as JB, PREM, IASPEI91 etc contain a region of different velocity gradients in D”.

Tomography in the lowermost mantle
from Grand et al 1997
fast velocities around Pacific, slow velocities under Africa, Mid-Pacific
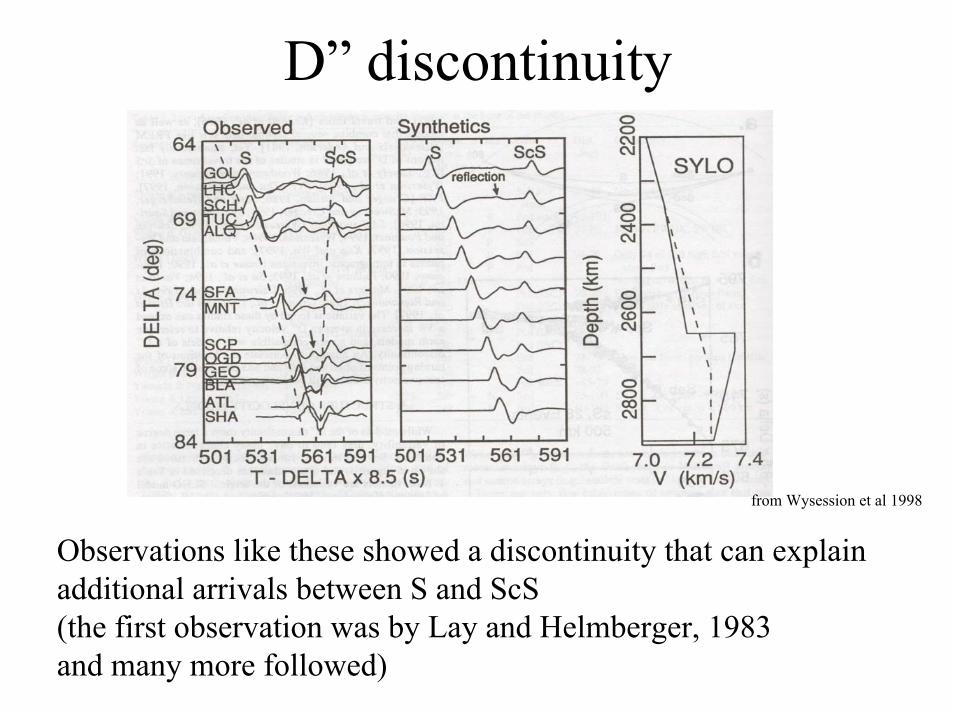
D” discontinuity
from Wysession et al 1998
Observations like these showed a discontinuity that can explainadditional arrivals between S and ScS (the first observation was by Lay and Helmberger, 1983 and many more followed)

D” discontinuity
Using arrays we can use slowness information to detect coherent arrivalsless ambiguously.
But how do we know it’s a wave that’s reflected in the lowermost mantle?

D” discontinuityThe slowness gives the angle of incidence at the array. Shooting a ray back with thisangle gives the endpoint of the ray – should be the same placeas P and PcP…
To make the raysend at the same point we need a reflector in thelowermost mantle

D” discontinuityvelocity increasesin S- and P-wavemodels but not observed globally
model from Grand et al 1997
Data from: Lay and Helmberger, 1983, Weber and co-workers, 1990s, Kendall and co-wokers,Scherbaum et al, 1997, Lay and co-workers, Houard and Nataf 1990s, Wysession et al., 1998,and many more.

D” discontinuity – fine-scale
upper (positive)reflector
lower (negative)reflector
under Eurasia
under Caribbeanpositive
negative
These results have been obtained using array methods, especially migration

Other D” features - anisotropy
In anisotropic regionS wave splits in fastand slow component.
For layered medium thiswould produce a time delaybetween radial and transversecomponents in a seismogram.

Other D” features - anisotropy(V)TI:(vertical) transverse isotropy(vertical symmetryaxis - e.g. horizontallylayered medium)
under Central Pacific:azimuthal anisotropyand not clear
under South Pacific:no anisotropy observed
Data from: Lay and co-workers, Garnero and co-workers, Kendall and Silver 1998, Thomas and Kendall, 2002, Heesom 2001, Fouch et al 2001, etc.

Other D” features – anisotropy
weak anisotropy inregions with moderate velocity decreaseintermittent azimuthal anisotropy below Central Pacific
model from Grand et al 1997
circum Pacific:mostly VTIstrong in regions with high velocities
Explanation could be slab in D”. (for example: sheared zones of partial melt)

Other D” features – scatterers
model from Karason &van der Hilst, 2001
PKP-data from Wen and Helmberger (1998), Thomas et al. (1999), Vidale and Hedlin (1998), Haddon and co-workers (1970s), Doornbos and co-workers (1970s), etcother scatterers (D” phases): Freybourger et al. 2001, Braňa and Helffrich (2003), Wallace and Thomas (2003)
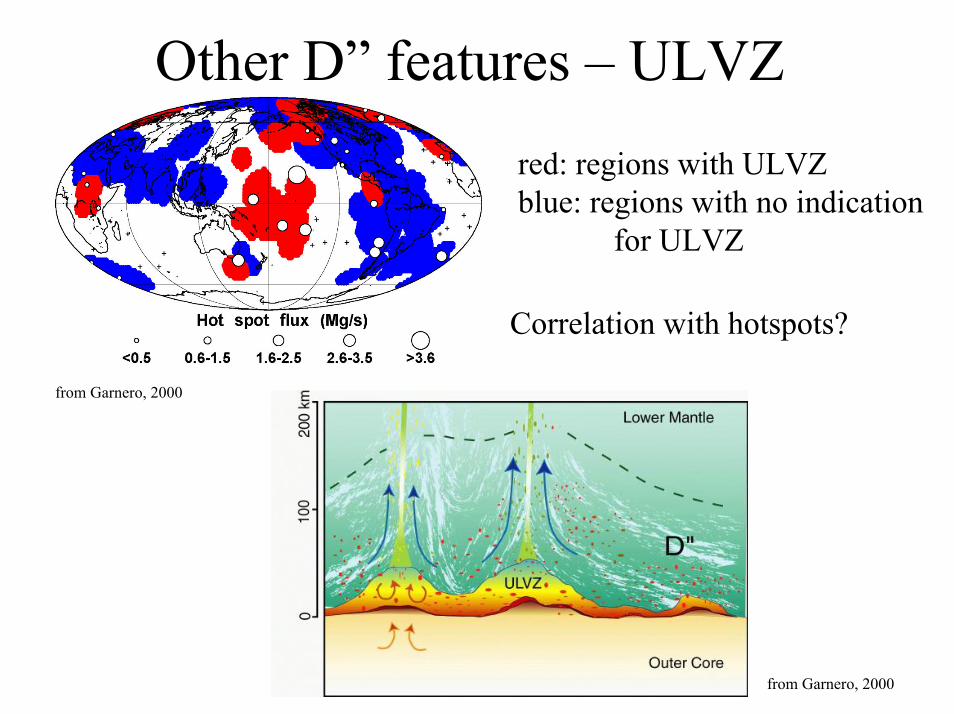
Other D” features – ULVZred: regions with ULVZblue: regions with no indication
for ULVZ
Correlation with hotspots?
from Garnero, 2000
from Garnero, 2000

What is D”As the lower boundary layer in the Earth’s mantle, D” could be:
thermal transition zone, chemical reaction zone, chemically distinct layer, resting place of slabs, origin of plumes, mineral phase change

Mantle Transition ZoneUpper mantle transition zone: 410 to 670 km
marked by discontinuities in seismic velocity.
Detection of 410 km and670 km discontinuity.(olivin-spinel-perovskite)
In some areas, detection of520 km discontinuity.Not globally detected yet.

Seismic Structure of TZ410 km: P-vel. increase 5-6% S-vel. increase 4-7%
first order discontinuity sharp: 2-4km beneath oceans35 km beneath continentsrecently: complex: gradient and sharp transition
α to β sp exothermic with positive Clapeyron slope 3MPa/K
520 km: Controversial discussion of existenceartefact? There in some regions, absent in others? few seismological observationscontrasts ∆vp = 1% ∆vs=0.8-1.5% ∆ρ = 2.5-3%
base of garnet layer?

Seismic Structure of TZ
670 km: maybe barrier to convection?increase in velocity and density: 6-11%could be explained by phase change or change in chemicalcomposition.if chemical: either: Fe content or Al contentγ-sp to pv and mw same T, P range as gt to pv=> discontinuity complex
P’P’ observations => <4km but long period P-SV conversions: 20-30 km
Clapeyron slope negative, endothermic, depression of 670 disc.may hinder convection
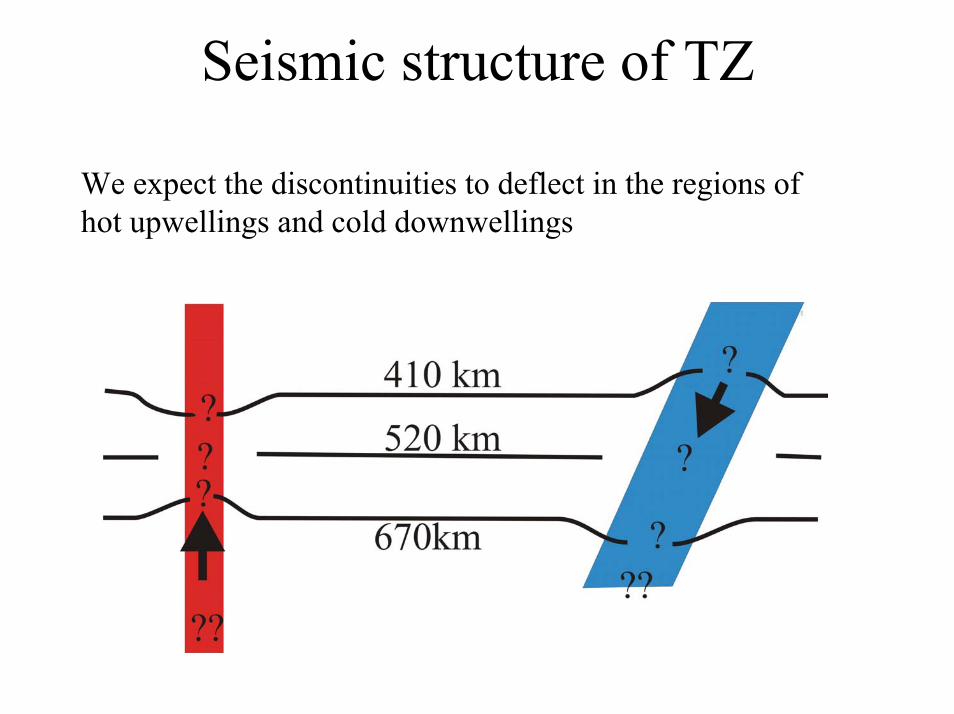
Seismic structure of TZ
We expect the discontinuities to deflect in the regions of hot upwellings and cold downwellings

Observations of TZ discontinuities670 km: variation of depth of 30 to 40 km (using different
seismological methods and phases)P670P is not observed but S670S is: velocity jump across 670 must be smaller than in global models (Estabrook and Kind, 1996)=> ∆vp=2%, ∆vs=4.8%, ∆ρ=5.2% (Shearer and Flanagan, 1999)
(PREM: ∆vp=4.6%, ∆vs=6.5%, ∆ρ=9.3% )
410 km: sharp discontinuity with moderate variation (e.g. Benz and Vidale 1993,Vinnik 1997 and many others)but up to 70 km elevated in subduction zones (Collier et al 2001).
520 km: observed in a few regions, not in others, splitting of the discontinuity? (Deuss and Woodhouse 2001, Rost 2000)

Other boundaries in the mid-mantle?Other layers in the mid-mantle have been proposed, at 900 km,1200 km, one of the most recent one was the Stealth layer (HAL, Kellogg layer)
from Kellogg et al. 1999
enriched layer in lower mantle (from 1500 km to CMB); topography;density contrast +1% more than adiabatic; velocity contrast (S) –5%?
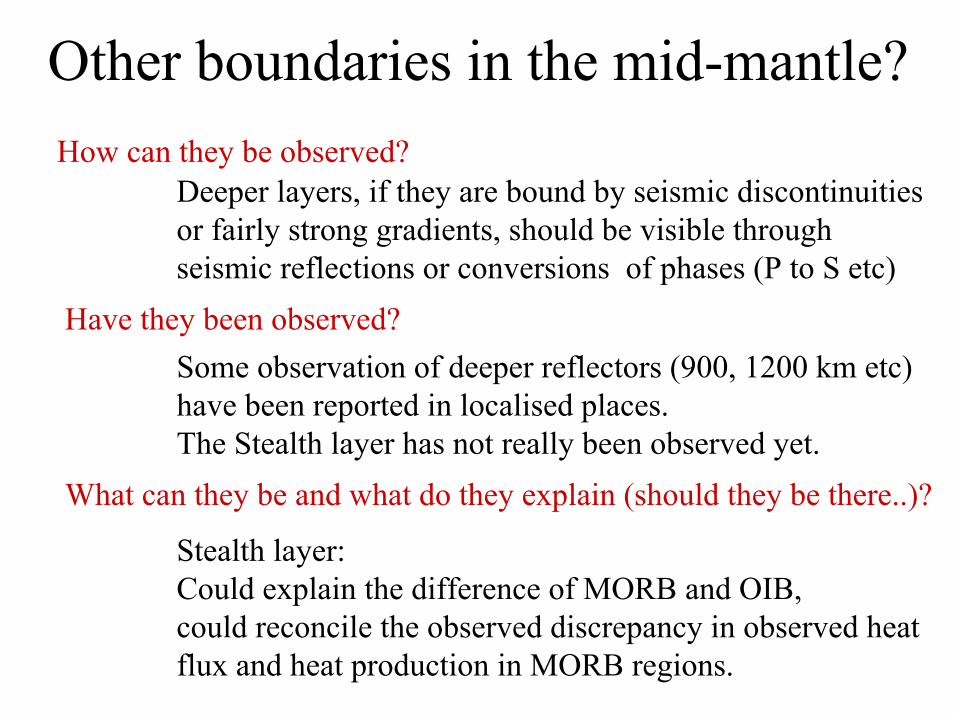
Other boundaries in the mid-mantle?How can they be observed?
Deeper layers, if they are bound by seismic discontinuities or fairly strong gradients, should be visible through seismic reflections or conversions of phases (P to S etc)
Have they been observed? Some observation of deeper reflectors (900, 1200 km etc)have been reported in localised places. The Stealth layer has not really been observed yet.
What can they be and what do they explain (should they be there..)?
Stealth layer: Could explain the difference of MORB and OIB, could reconcile the observed discrepancy in observed heat flux and heat production in MORB regions.

Conclusions•Seismology (especially array seismology) helps to detect structure in the Earth that can give information on processes. Resolution issues have to be kept in mind.
•D” layer shows small- and large-scale structure and seems to beconsistent with thermo-chemical layer, possibly including slab graveyards, plume origins
•Mantle transition zone shows difference in thickness but morestudies are needed to have a more global picture.
•Additional layers (Stealth layer, other mantle transition zones) have not been observed globally with seismological methods.