chapter 4 results & discussion
TRANSCRIPT

52
CHAPTER 4
RESULTS AND DISCUSSION
4.1 Introduction
Sasol’s FT technology has dominated the petrochemical industry locally and to a
lesser extent internationally since the 1950’s. In the FT process, coal and/or
natural gas are converted to an array of hydrocarbon products over cobalt or iron
catalysts. In many instances, oxygenated products such as carboxylic acids are
also formed.
Various refinery operations downstream of FT synthesis involve hydrotreating.
Unsulfided nickel catalysts are the preferred catalysts of choice for hydrotreating
operations. However, the presence of organic acids in the FT product stream
precludes the use of these catalysts as they result in acid leaching of the nickel
catalyst. It is therefore desirable to find catalysts that can decarbonylate the
organic acids prior to hydrotreating.
In an initiative undertaken at Sasol, scientists have been engaged in studies to
establish the best possible candidates for commercial decarbonylation catalysts.
It has been suggested that metal carboxylate interactions could be used to
narrow the field in search of commercial decarbonylation catalysts1. Metals that
yield carboxylates that decompose at low temperatures may also be capable of
decomposing carboxylic acids at low temperature. Many metal carboxylates have
thus been synthesized and their physical properties and thermal decomposition
behaviour explored.

53
More recently it has also become crucial to investigate the physical properties of
cobalt carboxylates since such species could potentially form under FT operating
conditions where cobalt catalysts are employed. This project describes a study of
cobalt carboxylates, ranging from the acetate (C2) to decanoate (C10). The
synthesis, purity of the samples and their thermal decomposition behaviour will
be discussed in this chapter.
4.2 Synthesis of Materials
Various synthetic methods were attempted to synthesize the compounds. The
fusion method, which involves refluxing an aqueous solution of the metal salt
(carbonate, oxide or hydroxide) with a molar equivalent of carboxylic acid2, was
used extensively in this project.
Although only partially soluble in water, CoCO3 dissolved readily at elevated
temperatures. Stoichiometric quantities of each respective acid (C2 – C9) were
added to the CoCO3 solutions. The solutions were then refluxed. The solubility of
the acids in water also decreased with increasing chain length, however the
higher temperatures and longer reaction times proved to be sufficient for the
acids to react with the carbonate, as was evident by the formation of dark purple
solids (product).
Products formed were mostly insoluble in water and precipitated out of solution
upon cooling. The acetate, propionate and to a lesser extent the butyrate, were
soluble in water and the products were isolated by reducing the volume of the
solvent until the solution became saturated and the solids began to crystallize
out. The solubility of the products in various solvents was tested, revealing that
the shorter chain compounds are soluble in polar solvents such as water, ethanol
and acetone. Upon shifting to longer chain compounds, solubility in polar solvents
is decreased and non-polar solvents such as hexane and petroleum ether are

54
favoured. The products ranged from ruby red to violet in colour but upon drying,
formed amorphous lilac powders.
A variety of solvents were used, including ethanol, water and hexane, in an effort
to obtain crystals suitable for X-ray analysis. Slow evaporation under ambient
conditions was the preferred method tested. However, other methods such as
seeding and evaporation under vacuum were also attempted. Despite numerous
attempts to obtain crystals, none suitable for X-ray diffraction could be obtained.
Infrared spectra of these compounds revealed that the synthesis reactions were
successful since the two characteristic COO- absorption bands associated with
carboxylates were evident in all cases. Elemental analysis and thermogravimetric
analyses provided further evidence that synthesis reactions were successful and
that compounds formed were pure. No NMR spectra were recorded due to the
paramagnetic nature of cobalt(II).
Some experiments were repeated using CoCl2 as a source of cobalt(II). Following
the same methodology discussed in the previous paragraph, aqueous solutions of
CoCl2 were refluxed with the appropriate molar ratio of carboxylic acid (C2 – C8).
Unlike the carbonate, CoCl2 is highly soluble in water but heating was still
required to dissolve the acids which are generally insoluble in water. Acetone was
used as a solvent for the longer chain acids.
Products arising from the CoCl2 syntheses were ruby red in colour but became
pink-purple and flaky in nature after drying. These products had limited solubility
in most solvents and would not readily dissolve unless heated.

55
Infrared spectra of the samples revealed very broad, undefined peaks which could
not be assigned. On the basis of the poor infrared data it was decided that the
CoCl2 syntheses were unsuccessful and samples were not analyzed any further.
A different approach was used for the decanoate: Stoichiometric amounts of
NaOH and decanoic acid were refluxed in hot aqueous solution. A molar
equivalent of CoCl2 was added to this solution after some time and the solution
was heated until a purple product precipitated out3. The product was filtered,
washed and dried, yielding a violet amorphous powder.
The infrared spectrum of this compound revealed the two characteristic COO-
peaks associated with carboxylates, confirming that this reaction was successful.
Additional analyses conducted on this sample provided evidence to support the
conclusion that the product formed was pure.
4.3 Characterisation of Materials
4.3.1 Elemental analysis
Elemental analysis data for selected cobalt carboxylates is summarized in Table
4.1. The data reveals fair agreement between the expected C- and H- values and
the actual C- and H- values. The larger variance in the %C values could be an
indication that some residual CoCO3 is present in the samples.
Table 4.1 Elemental analysis data for cobalt carboxylates
Compound % C % H
Cobalt acetate Obs. 22.7
Calc. 22.5
Obs. 4.6
Calc. 4.7
Cobalt propionate Obs. 32.1
Calc. 35.1
Obs. 4.8
Calc. 4.9

56
Cobalt valerate Obs. 43.0
Calc. 46.0
Obs. 6.6
Calc. 6.9
Cobalt nonanoate Obs. 54.6
Calc. 57.9
Obs. 8.7
Calc. 9.2
Cobalt decanoate Obs. 56.7
Calc. 59.8
Obs. 9.5
Calc. 9.5
4.3.2 Infrared spectroscopy
Infrared spectroscopy is a useful tool for studying the structure of transition
metal carboxylates.
As discussed previously, the two carbon-oxygen bonds in the carboxylate group
exhibit delocalization. Since the degree of interaction between a cationic centre
(metal) and the coordinated carboxylate ligand affects the delocalization and
hence the stretching frequencies of the carboxylate ion appreciably, the
importance of infrared spectroscopy becomes clearer.
The carbon-oxygen stretching frequencies of the carboxylate ion can to some
extent be related to the bonding modes of the carboxylate ligand. Nakamoto and
co-workers proposed that the differences between the symmetric and asymmetric
stretching frequencies for the COO- ion could be used to indicate the carboxylate
bonding mode4.
In this study, infrared spectroscopy was used for three purposes. The first was to
confirm that a reaction had taken place in each case. The second was to check if
starting materials were removed during purification. Spectra of the prepared
samples are compared with those of their precursors (i.e. the pure acids and
cobalt carbonate) and used to confirm the purity of each product. Table 4.2
summarizes the characteristic infrared signals for a typical carboxylic acid,

57
CH3COOH. Figs. 4.1 - 4.2 show the spectra of CH3COOH and cobalt carbonate,
two of the starting materials.
A third function of infrared spectroscopy in this study was to make inferences
about the carboxylate bonding mode in each compound by applying the idea that
the difference between the symmetric and asymmetric stretching frequencies for
the COO- ion could be used as an indication of the carboxylate bonding mode4.
The infrared spectrum of a typical acid, CH3COOH, is shown in Fig. 4.1 and the
various peaks associated with CH3COOH are summarized in Table 4.2.
Table 4.2 Characteristic infrared signals of CH3COOH4
Frequency (cm-1) Assignment
3100 (broad) O-H stretch
1714 C=O stretch
1405, 1310 O-H bend
1000 C-O stretch
The characteristic C=O stretch of the free carboxylic acids is observed at around
1715 cm-1. C-O and O-H stretches are also observed within their characteristic
ranges at 1294 cm-1 and a broad band at 3000 cm-1 respectively.

58
Fig. 4.1 Infrared spectrum of CH3COOH (liquid film) 5
The spectrum for cobalt carbonate is shown in Fig. 4.2 (see p. 59).
A small peak is observed at 3351 cm-1 suggesting that the sample contained
some moisture. An intense peak is observed at ~1397 cm-1, which is most likely
associated with CO2. Two small peaks at 2166 cm-1 and 2025 cm-1 were
established to be an artifact of the analysis and are not related to the sample.
Two smaller peaks are observed at 861 cm-1 and 736 cm-1. These arise due to O-
C-O interactions (rocking and bending modes)4.
1714 cm-1; C=O stretch

59
30
40
50
60
70
80
90
100
550105015502050255030503550
Wavenumbers (cm-1)
Tra
nsm
itta
nce
(%
)3351
2166 2026
1397
861
736
Fig. 4.2 Infrared spectrum of CoCO3 (KBr)
Initially spectra were recorded in Nujol. However, interpretation of the results is
complicated unnecessarily due to interference from the Nujol (C-C and C-H
vibrations) and it was thus decided to record all spectra in KBr. Spectra for both
sets of products i.e. products obtained from the CoCl2 syntheses and CoCO3
syntheses were recorded. Examination of the data revealed that the CoCl2
syntheses were unsuccessful since the characteristic COO- peaks associated with
carboxylates were not observed. Therefore all further discussions in this chapter
are based on the products of the CoCO3 synthesis reactions*. Assignments of
infrared absorptions for the compounds prepared in this project were made using
standard infrared absorption tables and charts4.
*Additional spectra of the CoCl2 derived products can be viewed in Appendix A
60
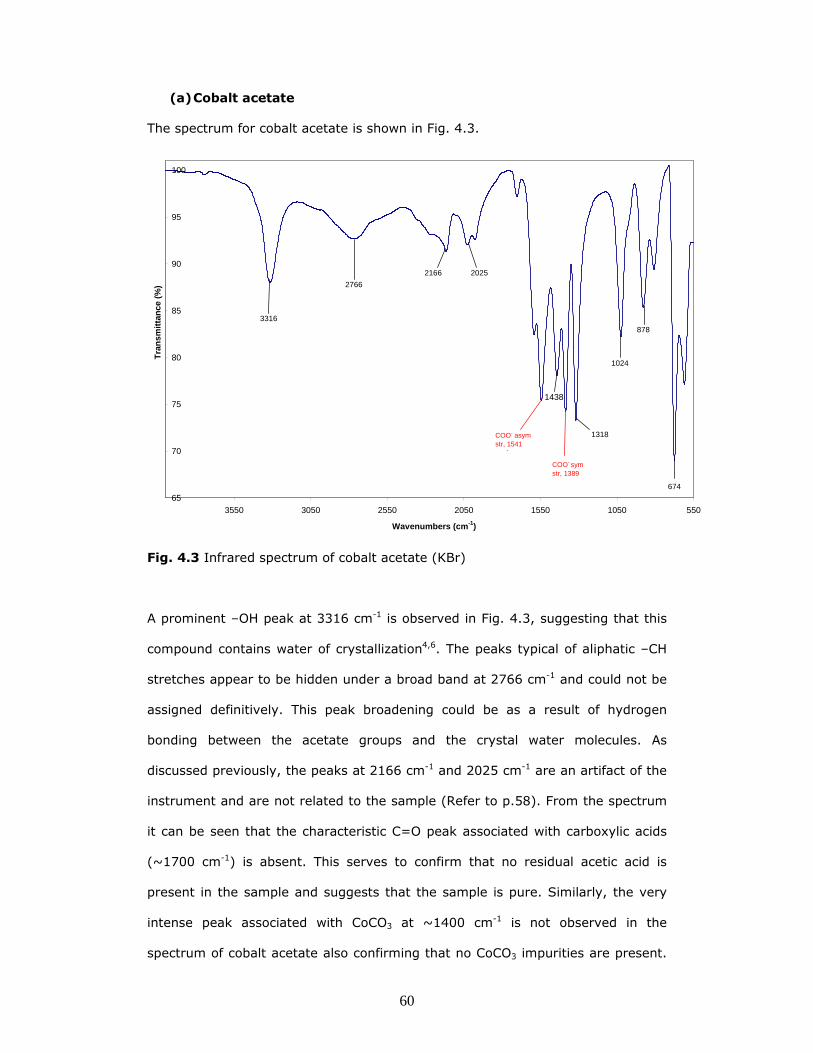
(a) Cobalt acetate
The spectrum for cobalt acetate is shown in Fig. 4.3.
65
70
75
80
85
90
95
100
550105015502050255030503550
Wavenumbers (cm-1)
Tra
nsm
itta
nce
(%
)
COO- asym str, 1541
cm-1
COO- sym str, 1389
-1
3316
2766
2166
1024
878
674
1318
2025
1438
Fig. 4.3 Infrared spectrum of cobalt acetate (KBr)
A prominent –OH peak at 3316 cm-1 is observed in Fig. 4.3, suggesting that this
compound contains water of crystallization4,6. The peaks typical of aliphatic –CH
stretches appear to be hidden under a broad band at 2766 cm-1 and could not be
assigned definitively. This peak broadening could be as a result of hydrogen
bonding between the acetate groups and the crystal water molecules. As
discussed previously, the peaks at 2166 cm-1 and 2025 cm-1 are an artifact of the
instrument and are not related to the sample (Refer to p.58). From the spectrum
it can be seen that the characteristic C=O peak associated with carboxylic acids
(~1700 cm-1) is absent. This serves to confirm that no residual acetic acid is
present in the sample and suggests that the sample is pure. Similarly, the very
intense peak associated with CoCO3 at ~1400 cm-1 is not observed in the
spectrum of cobalt acetate also confirming that no CoCO3 impurities are present.

61
The characteristic twin peaks for the symmetric and asymmetric COO- stretches
are observed in the spectrum of cobalt acetate at 1389 cm-1 and 1541 cm-1
respectively. The presence of a small shoulder peak on the asymmetric COO-
peak suggests that there is a possibility that two different types of carboxylate
coordination may occur in this compound7. The various peaks observed below 800
cm-1 arise from COO- rocking and bending modes. Unfortunately the Co-O
stretches which are typically found below 500 cm-1(4), could not be observed in
any of the spectra.
The infrared assignments discussed above are summarized in Table 4.3 below:
Table 4.3 Infrared assignments of cobalt acetate
Band (cm-1) Assignment
3316 -OH stretch
2766 region Aliphatic -CH stretches
1541 Asymmetric COO- stretch
1438 Aliphatic –CH bend
1389 Symmetric COO- stretch
1318 Aliphatic –CH bend
1024 Aliphatic -CH rock
878 C-C stretch
674 COO- bend
Nickolov & Stoilova reported values of 1394 cm-1 and 1559 cm-1 for the
symmetric and asymmetric COO- stretches for cobalt acetate respectively6.
Haywards and Edwards also reported similar results in an independent study,
where they found values of 1405 cm-1 and 1590 cm-1 for the symmetric and
asymmetric COO- peaks respectively8.

62
When the spectrum observed for cobalt acetate (Fig. 4.3) is compared to the
spectra obtained by Nickolov and Stoilova in their studies6, Fig. 4.4, many
similarities become evident between the spectrum for cobalt acetate dihydrate
(CADH) and our spectrum. In both of these spectra a very intense –OH peak is
observed at ~3400 cm-1 as opposed to the much weaker –OH peak observed for
cobalt acetate tetrahydrate (CATH). Furthermore the COO- peaks observed in
CADH resemble the COO- peaks observed in our spectrum more closely in terms
of shape and intensity than those of CATH. These similarities would seem to
suggest that the product formed in this project is CADH as opposed to CATH. The
results of the elemental analyses confirm this idea, as the hydrogen percentage
observed (4.6%) corresponds to that expected for a dihydrated product (4.7%
vs. 5.7% for a tetrahydrated product).
Fig. 4.4 Infrared spectra of CADH and CATH (KBr)6

63
(b) Cobalt propionate
Fig. 4.5 shows the spectrum obtained for cobalt propionate.
45
55
65
75
85
95
550105015502050255030503550
Wavenumbers (cm-1)
Tra
nsm
itta
nce
(%
)
2970
COO- asym
str 1567cm-1
1289
1076
653
890
810
COO- sym
str 1403 cm-
Fig. 4.5 Infrared spectrum of cobalt propionate (KBr)
There is no carbonyl peak evident (~1700 cm-1), suggesting that all propionic
acid residues were removed during purification and the characteristic peak
associated with CoCO3 (1397 cm-1) appears to be absent, although a slight
shoulder is observed on the symmetric COO- stretch which may be associated
with traces of CoCO3. No –OH peaks are observed in this spectrum which
indicates that this sample does not contain water of crystallization. Weak peaks
are observed for the aliphatic –CH stretches in the 2970 cm-1 region. The
characteristic COO- stretches are clearly visible at 1567 cm-1 for the asymmetric
stretch and 1403 cm-1 for the symmetric stretch. Typical COO- interactions
(bending and rocking modes) are observed below 890 cm-1. Data are summarized
in Table 4.4.

64
Table 4.4 Infrared assignments of cobalt propionate
Band (cm-1) Assignment
2970 region Aliphatic –CH stretches
1567 Asymmetric COO- stretch
1403 Symmetric COO- stretch
1289 Aliphatic –CH bend
1076 Aliphatic -CH rock
890 C-C stretch
810 COO- bend
653 COO- rock
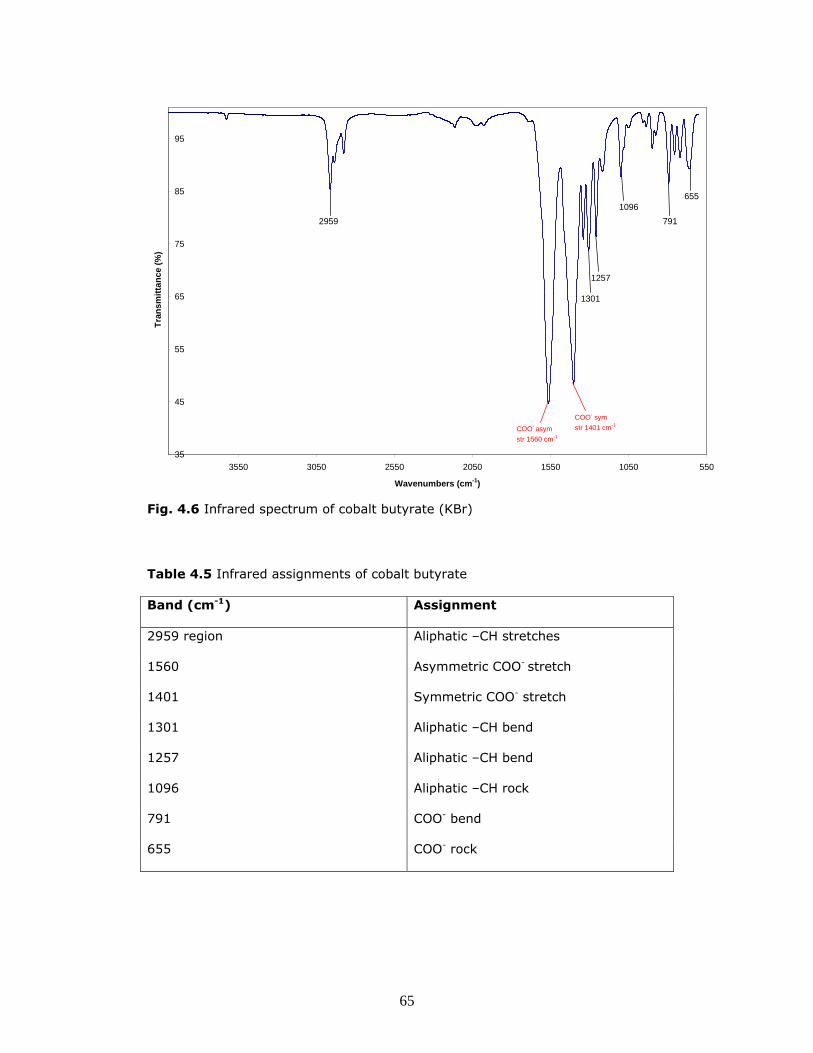
(c) Cobalt butyrate
Fig. 4.6 shows the infrared spectrum of cobalt butyrate. Data are summarized in
Table 4.5.
This compound appears to be pure as no C=O peaks are observed and the
characteristic peak associated with CoCO3 at 1397cm-1 is not discernable. No –OH
peaks are observed indicating that this compound does not contain water of
crystallization. As expected, aliphatic –CH stretches are observed at 2959 cm-1.
Strong peaks are observed for both the asymmetric and symmetric COO-
stretches at 1560 cm-1 and 1401 cm-1 respectively. A number of COO- bending
and rocking interactions are observed below 800 cm-1.
65
35
45
55
65
75
85
95
550105015502050255030503550
Wavenumbers (cm-1)
Tra
nsm
itta
nce
(%
)
2959
655
791
1096
1301
1257
COO- asym
str 1560 cm-1
COO- sym
str 1401 cm-1
Fig. 4.6 Infrared spectrum of cobalt butyrate (KBr)
Table 4.5 Infrared assignments of cobalt butyrate
Band (cm-1) Assignment
2959 region Aliphatic –CH stretches
1560 Asymmetric COO- stretch
1401 Symmetric COO- stretch
1301 Aliphatic –CH bend
1257 Aliphatic –CH bend
1096 Aliphatic –CH rock
791 COO- bend
655 COO- rock

66
(d) Cobalt valerate
The infrared spectrum of cobalt valerate is shown below in Fig. 4.7 and the data
is summarized in Table 4.6.
35
45
55
65
75
85
95
550105015502050255030503550
Wavenumbers (cm-1)
Tra
nsm
itta
nce
(%
)
2956
COO- asym str
1551 cm-1
COO- sym str
1404 cm-1
1310
1105
932
752
Fig. 4.7 Infrared spectrum of cobalt valerate (KBr)
Table 4.6 Infrared assignments of cobalt valerate
Band (cm-1) Assignment
2956 region Aliphatic –CH stretches
1551 Asymmetric COO- stretch
1404 Symmetric COO- stretch
1310 Aliphatic –CH bend
1105 Aliphatic -CH rock
932 C-C stretch
752 COO- bend

67
No peaks associated with the starting materials, CoCO3 and valeric acid, are
observed confirming that the material is pure. Aliphatic –CH stretches are
observed at 2956 cm-1. The asymmetric COO- stretch is evident at 1551 cm-1 and
the symmetric COO- stretch is observed at 1404 cm-1. Additional COO-
interactions (rocking and bending) are observed at lower frequencies. No –OH
peaks are observed confirming that this compound contains no crystal water.
(e) Cobalt hexanoate
Fig. 4.8 illustrates the infrared spectrum obtained for cobalt hexanoate.
35
45
55
65
75
85
95
550105015502050255030503550
Wavenumbers (cm-1)
Tra
nsm
itta
nce
(%
)
2963
6561103
1299
1267
COO- asym
str 1563 cm-1
COO- sym
str 1406 cm-1
Fig. 4.8 Infrared spectrum of cobalt hexanote (KBr)
No –OH stretches are evident in the 3500cm-1 region confirming that this
compound contains no water of crystallization. Aliphatic –CH stretches are
observed in the region of ~2960 cm-1. Asymmetric and symmetric COO- stretches
are observed at 1563 cm-1 and 1406 cm-1 respectively. No C=O stretches are

68
observed and the peak associated with CoCO3 is absent, confirming the purity of
this sample. (Refer to Table 4.7 for summary of the data). COO- bending modes
are observed at 656 cm-1.
Table 4.7 Infrared assignments of cobalt hexanoate
Band (cm-1) Assignment
2963 Aliphatic –CH stretches
1563 Asymmetric COO- stretch
1406 Symmetric COO- stretch
1299 Aliphatic –CH bend
1267 C-O stretch
1103 Aliphatic –CH rock
656 COO- bend
(f) Cobalt heptanoate
The infrared spectrum for cobalt heptanoate is shown in Fig. 4.9.
The compound appears to be pure as no peaks associated with the starting
materials are observed. No –OH peaks are present and the sample does not
contain water of crystallization. Three peaks are observed for the –CH stretches
in the 2952 cm-1 region. The characteristic COO- peaks are observed at 1548 cm-1
and 1402 cm-1 for the asymmetric and symmetric stretches respectively.
A summary of the data can be found in Table 4.8.

69
35
45
55
65
75
85
95
550105015502050255030503550
Wavenumbers (cm-1)
Tra
nsm
itta
nce
(%
)
2952
COO- asym str
1548 cm-1
COO- sym str
1402 cm-1
1311
1108
932
750
Fig. 4.9 Infrared spectrum of cobalt heptanoate (KBr)
Table 4.8 Infrared assignments of cobalt heptanoate
Band (cm-1) Assignment
2952 Aliphatic –CH stretches
1548 Asymmetric COO- stretch
1402 Symmetric COO- stretch
1311 Aliphatic –CH bend
1108 C-O stretch
932 C-C stretch
750 COO- bend

70
(g) Cobalt octanoate
Shown below in Fig. 4.10 is the spectrum obtained for cobalt octanoate.
35
45
55
65
75
85
95
550105015502050255030503550
Wavenumbers (cm-1)
Tra
nsm
itta
nce
(%
)
2922
645
789
1095
1298
1247
COO- asym
str 1552 cm-1
COO- sym
str 1414 cm-1
2871
Fig. 4.10 Infrared spectrum of cobalt octanoate (KBr)
No C=O stretches are evident (1700 cm-1) confirming that the sample contains no
free acid. Similarly the peak associated with CoCO3 is not evident indicating that
this sample is pure. The compound appears to be anhydrous as no –OH
absorptions are observed. Strong aliphatic –CH stretches are observed at ~2922
cm-1 and 2871 cm-1. This is not surprising considering the length of the aliphatic
carbon chain in this compound. The COO- peaks are still clearly present at 1552
cm-1 and 1414 cm-1. As with the other samples, no peaks were observed below
500 cm-1 for the Co-O stretches but COO- bending and rocking modes are evident
below 790 cm-1. Data are summarized in Table 4.9.

71
Table 4.9 Infrared assignments of cobalt octanoate
Band (cm-1) Assignment
2922, 2871 Aliphatic –CH stretches
1552 Asymmetric COO- stretch
1414 Symmetric COO- stretch
1298, 1247 Aliphatic –CH bends
1095 Aliphatic –CH rock
789 COO- bend
645 COO- bend
(h) Cobalt nonanoate
The spectrum of cobalt nonanoate is illustrated in Fig. 4.11.
Various peaks are observed in the –OH band suggesting that this compound does
contain some water of crystallization. The fact that there are multiple absorptions
in this area could suggest that more than one type of water molecule is bound to
the carboxylate7. Due to the longer aliphatic carbon chain of the carboxylate,
prominent –CH stretches are observed at around 2920 cm-1. The asymmetric
COO- peak occurs at 1543 cm-1. The asymmetric stretch is seen at 1406 cm-1. No
C=O absorptions or peaks associated with CoCO3 are observed and the sample
appears to be pure. The data is summarized in Table 4.10.

72
50
60
70
80
90
100
550105015502050255030503550
Wavenumbers (cm-1)
Tra
nsm
itta
nce
(%
)
2920
2850
COO- asym str
1543 cm-1
COO- sym str
1406 cm-1
1317
1110
721
3375 3157
3510
Fig. 4.11 Infrared spectrum of cobalt nonanoate (KBr)
Table 4.10 Infrared assignments of cobalt nonanoate
Band (cm-1) Assignment
3510, 3375 -OH stretches
2920, 2850 Aliphatic –CH stretches
1543 Asymmetric COO- stretch
1406 Symmetric COO- stretch
1317 Aliphatic –CH bend
1110 Aliphatic –CH rock
721 COO- bend

73
(i) Cobalt decanoate
The infrared spectrum of cobalt decanoate is shown in Fig. 4.12.
50
60
70
80
90
100
550105015502050255030503550
Wavenumbers (cm-1)
Tra
nsm
itta
nce
(%
)
2920
2852
COO- asym str
1550 cm-1
COO- sym
str 1410 cm-
1
1299
1112
716
Fig. 4.12 Infrared spectrum of cobalt decanoate (KBr)
Cobalt decanoate does not appear to contain any water of crystallization since no
–OH absorptions are observed in the infrared spectrum of this compound. Strong
aliphatic –CH stretches are observed at 2920 and 2852 cm-1. These are to be
expected due to the long length of the carbon chain in the carboxylate ligand.
When compared to the infrared spectrum for pure decanoic acid (Fig. 4.13), it
becomes evident that no decanoic acid is present in the sample as none of the
characteristic absorptions of decanoic acid are seen in the product spectrum
(especially the C=O absorption at 1700 cm-1). Strong asymmetric and symmetric
COO- stretches are observed at 1550 cm-1 and 1410 cm-1 respectively. COO-
bending modes are observed at 716 cm-1. Table 4.11 summarizes the data.

74
Fig. 4.13 Infrared spectrum of decanoic acid (KBr)9
Table 4.11 Infrared assignments of cobalt decanoate
Band (cm-1) Assignment
2920, 2852 Aliphatic –CH stretches
1550 Asymmetric COO- stretch
1410 Symmetric COO- stretch
1299 Aliphatic –CH bend
1112 Aliphatic –CH rock
716 COO- bend
An interesting feature observed for the cobalt carboxylates is the breadth of the
COO- peaks. When our spectra are compared to spectra of various other
carboxylates reported in the literature, the COO- peaks appear broader than
observed for many other compounds. This could indicate the formation of
C=O stretch
1700 cm-1

75
polymeric structures or also possibly that multiple carboxylate bonding modes are
found within the same structure7.
The separation of the asymmetric and symmetric COO- stretching frequencies
(∆v) was determined for each compound and used to generate information about
the possible carboxylate bonding modes in each compound. The proposed
structures are based on the findings of a comprehensive study by Stoilova et al6
of a range of metal acetates. The authors suggested that a separation of 105 –
140 cm-1 could be associated with monodentate bonding, 145 – 185 cm-1 could be
associated with bidentate chelate bonding and 180 – 190 cm-1 could be an
indication of bidentate bridging bonding, although values as high as 200 cm-1
have been observed. These values were only proposed for acetates and it is
important to note that in this study we have extended these ideas to the higher
carboxylates.
Table 4.12 shows the values of ∆v for the compounds and their proposed
structure as per Stoilova’s proposals6.
Table 4.12 ∆v for cobalt carboxylates
Compound vCOO-asym
(cm-1)
vCOO-sym
(cm-1)
∆v (cm-1) Proposed structure
Acetate 1541 1389 152 Chelating
Propionate 1567 1403 164 Chelating
Butyrate 1560 1401 159 Chelating
Valerate 1551 1404 147 Chelating
Hexanoate 1563 1406 157 Chelating
Heptanoate 1548 1402 146 Chelating
Octanoate 1552 1414 138 Monodentate/Chelating

76
Nonanoate 1543 1406 137 Monodentate/Chelating
Decanoate 1550 1410 140 Monodentate/Chelating
The data suggests that a chelating mode of coordination is favoured by the
shorter chain cobalt carboxylates (C2 – C7). The heavier cobalt carboxylates (C8 –
C10) are on the threshold to give monodentate rather than chelating bonding
modes. However based on the trend observed for the shorter cobalt carboxylates,
it seems more likely that these compounds exhibit chelating coordination. Thus it
appears that the general preference amongst the cobalt carboxylates is chelating
coordination.
The structure of cobalt acetate has however been confirmed as monodentate10.
This contradiction of our findings proves that Stoilova’s ideas should be
interpreted with caution when applied to our data. Ideally the proposed structures
could be confirmed using single crystal X-ray diffraction. However, no crystals
suitable for X-ray diffraction analysis could be obtained during the project (as
discussed in section 4.2).
4.3.3 Thermal analysis
The thermal decomposition behaviour of the cobalt carboxylates has been
explored using a combination of thermogravimetric analysis (TGA), differential
scanning calorimetry (DSC) and mass spectrometry (MS).
TGA evaluates mass changes as a function of temperature and DSC in turn shows
changes in heat flow (or energy) as a function of temperature. The combination
of these two techniques yields a powerful tool for thermal characterization. TGA
can confirm which peaks in the DSC thermograms correspond to decompositions
and which are unrelated to decomposition. The additional peaks in the DSC
77
thermograms could indicate phase changes, which in many cases for the
carboxylates, is quite complex due to their phase rich behaviour7.
Mass spectrometry coupled to TGA (often abbreviated TG-MS) is a very useful
tool to aid in the identification of decomposition products obtained when a
compound is heated. Molecular ions and fragments that are evolved upon heating
can be identified by their mass to charge ratio, or m/z value. This can help to
shed light on the possible mechanisms of decomposition of the compound in
question. However, elucidating exact decomposition mechanisms based on this
information alone can be quite difficult. This is largely due to two reasons: (1)
further degradation of organic molecules occurs in transit from the TG furnace to
the mass spectrometer leading to break up of the molecular ions before they can
be identified (2) mass fragments arising from the break up of molecular species
often share common m/z values and it is impossible to determine how much of a
particular fragment arises from which parent molecule without prior separation of
the components.
(a) Cobalt acetate
Fig. 4.14 shows the TG and DTG profiles of cobalt acetate (dihydrate).
The TG profile (Fig. 4.14a) of cobalt acetate dihydrate in argon, shows that this
compound decomposes via a three step process: In the first step, the acetate
begins to lose its water of crystallization at ~101oC to yield an anhydrous
intermediate. The second and third mass loss steps of 12.1% and 34%
respectively yield a black powdery product. Gravimetric calculations (refer to
appendix B for all gravimetric calculations) suggest that this product is CoO, as
confirmed by literature8,11,.

78
(b)
(a)
1
2
3
1 - 18.1%
2 - 12.1%
3 - 34.0%
124°C275°C
361°C101°C
263°C
350°C
Onset temp 1:
Onset temp 2:
Onset temp 3:
-5
0
5
10
15
20
Der
iv. W
eigh
t (%
/min
)
20
40
60
80
100
120
Wei
ght (
%)
0 100 200 300 400 500
Temperature (°C) Universal V3.2B TA Instruments
Fig. 4.14 (a) TG and (b) DTG profiles of cobalt acetate dihydrate (argon)
There is literature to suggest that acetic acid and acetic anhydride are evolved
during the decomposition process, yielding two intermediate crystalline products
Co6O(CH3COO)10 and Co3O(CH3COO)4 which ultimately decompose to CoO12.
Other workers have suggested that acetaldehyde is liberated, forming a cobalt
acetate hydroxide intermediate which then further decomposes to yield CoO and
acetic acid as the main volatile product11.
The mass spectrum obtained when cobalt acetate is heated in argon is shown in
Fig. 4.15. The mass spectrum shows a plot of the ion current for various mass
fragments against relative time in seconds. The mass fragments evaluated were
chosen based on the possible decomposition products that may arise when cobalt
acetate is heated and are summarized in Table 4.13. This data can be correlated
to the temperatures on the TG profile since the number and frequency of cycles

79
recorded by the mass spectrometer correlates to the heating rate used on the
TGA.
1.00E-12
1.00E-11
1.00E-10
1.00E-09
0 500 1000 1500 2000 2500 3000 3500
Relative time (s)
Ion
cu
rren
t (n
A)
m/e 18
m/e 28
m/e 29
m/e 31
m/e 43
m/e 44
m/e 45
m/e 46
m/e 58
m/e 60
130oC
370oC
280oCH2O
CO2
Organic fragments
Fig. 4.15 Mass spectrum for cobalt acetate dihydrate heated at 10oC/min (argon)
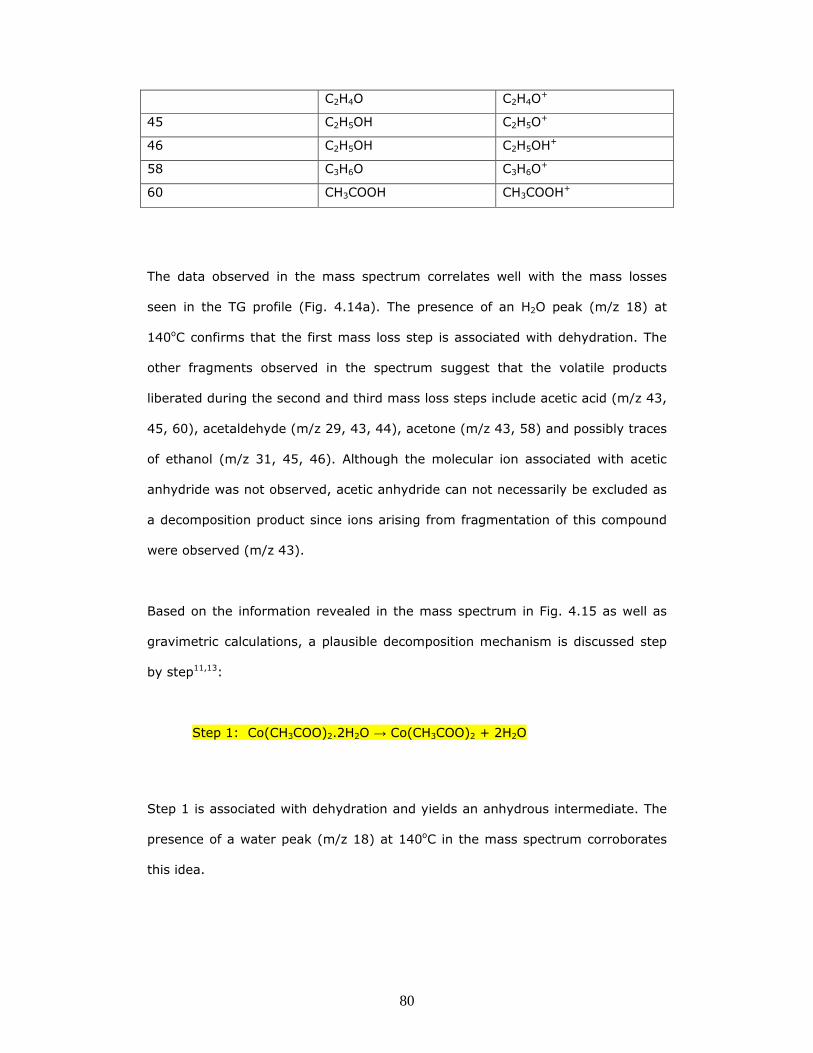
Table 4.13 Mass fragments evaluated for cobalt acetate dihydrate
Mass number (m/z) Probable parent
molecule
Key fragment
18 H2O H2O+
28 N2 N2+
CO CO+
CO2 CO+
29 CxHy C2H5+
C2H4O CHO+
31 C2H5OH CH2OH+
43 C2H4O C2H3O+
C3H6O C2H3O+
CH3COOH C2H3O+
44 CO2 CO2+
80
C2H4O C2H4O+
45 C2H5OH C2H5O+
46 C2H5OH C2H5OH+
58 C3H6O C3H6O+
60 CH3COOH CH3COOH+
The data observed in the mass spectrum correlates well with the mass losses
seen in the TG profile (Fig. 4.14a). The presence of an H2O peak (m/z 18) at
140oC confirms that the first mass loss step is associated with dehydration. The
other fragments observed in the spectrum suggest that the volatile products
liberated during the second and third mass loss steps include acetic acid (m/z 43,
45, 60), acetaldehyde (m/z 29, 43, 44), acetone (m/z 43, 58) and possibly traces
of ethanol (m/z 31, 45, 46). Although the molecular ion associated with acetic
anhydride was not observed, acetic anhydride can not necessarily be excluded as
a decomposition product since ions arising from fragmentation of this compound
were observed (m/z 43).
Based on the information revealed in the mass spectrum in Fig. 4.15 as well as
gravimetric calculations, a plausible decomposition mechanism is discussed step
by step11,13:
Step 1: Co(CH3COO)2.2H2O → Co(CH3COO)2 + 2H2O
Step 1 is associated with dehydration and yields an anhydrous intermediate. The
presence of a water peak (m/z 18) at 140oC in the mass spectrum corroborates
this idea.

81
In steps 2 and 3 the anhydrous intermediate, Co(CH3COO)2, undergoes a set of
parallel-consecutive reactions with the water generated in step 1.
Step 2: 3Co(CH3COO)2 [+2H2O] → Co3(CH3COO)5.OH + H20 + CH3COOH
Step 3: 2Co(CH3COO)2 [+2H2O] → Co(CH3COCH2COO)2 + Co(OH)2 + 2H2O
Step 2 shows the formation of a cobalt acetate hydroxide intermediate,
Co3(CH3COO)5.OH, liberating water and acetic acid13. Step 3 shows the formation
of an acetyl cobalt acetate intermediate, Co(CH3COCH2COO)2, liberating water11.
There is evidence in the mass spectrum (Fig. 4.15) that supports the idea that
both water (m/z 18) and acetic acid (m/z 43, 45, 60) is released in the second
decomposition step observed at ~280oC.
The intermediate products, cobalt acetate hydroxide and acetyl cobalt acetate,
then decompose via another set of parallel-consecutive reactions (steps 4 and 5).
Step 4: Co3(CH3COO)5.OH → 3CoO + 8H2 + 8CO2 + 2C
Step 5: Co(CH3COCH2COO)2 → CoO + 2CH3CHO + H2O + 2CO + 2C
Step 4 shows the decomposition of cobalt acetate hydroxide to CoO, H2 and
CO213. A large CO2 peak (m/z 44) observed in the mass spectrum, corresponding
to the third decomposition step at 370oC, supports this theory. Step 5 shows the
parallel decomposition of the acetyl cobalt acetate intermediate to yield CoO,
acetaldehyde, water and CO11. The presence of water (m/z 18), CO (m/z 28) and
acetaldehyde (m/z 29, 43) peaks in the mass spectrum for this step observed at
370oC provide evidence in support of this theory.
82
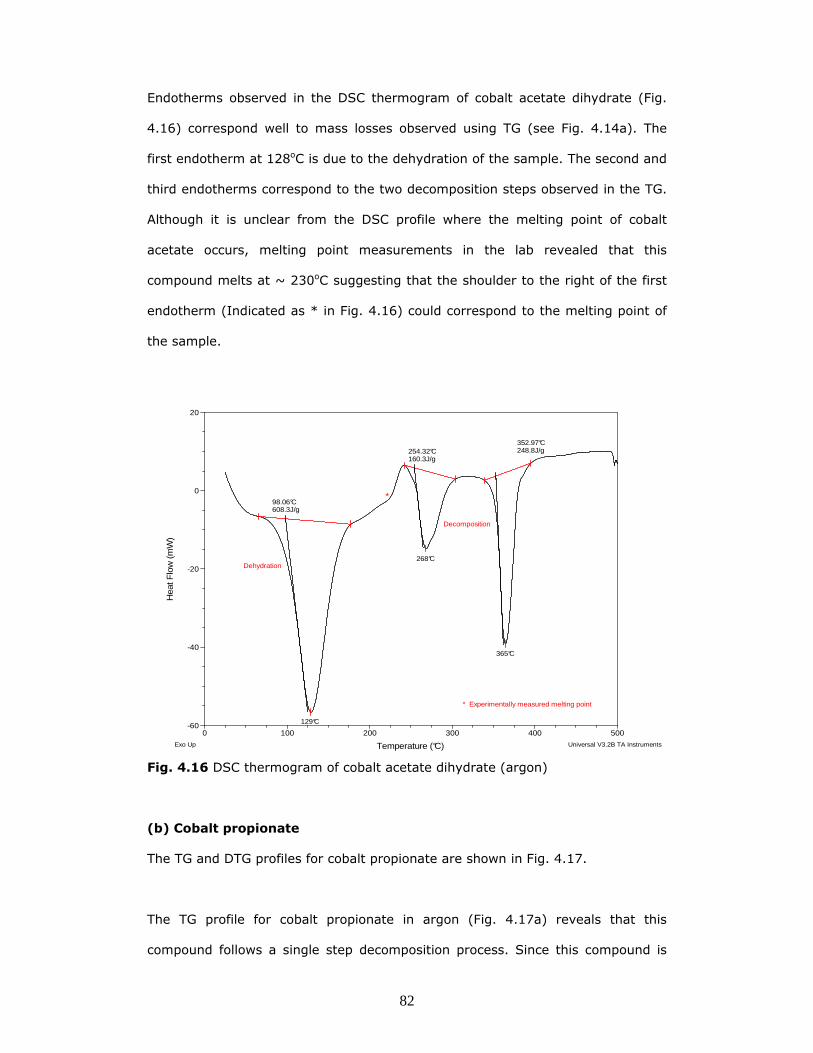
Endotherms observed in the DSC thermogram of cobalt acetate dihydrate (Fig.
4.16) correspond well to mass losses observed using TG (see Fig. 4.14a). The
first endotherm at 128oC is due to the dehydration of the sample. The second and
third endotherms correspond to the two decomposition steps observed in the TG.
Although it is unclear from the DSC profile where the melting point of cobalt
acetate occurs, melting point measurements in the lab revealed that this
compound melts at ~ 230oC suggesting that the shoulder to the right of the first
endotherm (Indicated as * in Fig. 4.16) could correspond to the melting point of
the sample.
129°C
98.06°C608.3J/g
*
Dehydration268°C
254.32°C160.3J/g
365°C
352.97°C248.8J/g
Decomposition
* Experimentally measured melting point
-60
-40
-20
0
20
Hea
t Flo
w (
mW
)
0 100 200 300 400 500
Temperature (°C)Exo Up Universal V3.2B TA Instruments
Fig. 4.16 DSC thermogram of cobalt acetate dihydrate (argon)
(b) Cobalt propionate
The TG and DTG profiles for cobalt propionate are shown in Fig. 4.17.
The TG profile for cobalt propionate in argon (Fig. 4.17a) reveals that this
compound follows a single step decomposition process. Since this compound is

83
anhydrous, the mass loss expected for the formation of CoO is 63.4% and that
for metallic cobalt 71.2%. Since the observed mass loss of 72.2% correlates
closely with the mass loss expected for the formation of metallic cobalt, it
appears that metallic cobalt is formed during this reaction.
(a)
(b)
1
1 - 72.2%
269°COnset temp:
304°C
-5
0
5
10
15
20
Der
iv. W
eigh
t (%
/min
)
20
40
60
80
100
120
Wei
ght (
%)
0 100 200 300 400 500
Temperature (°C) Universal V3.2B TA Instruments
Fig. 4.17 (a) TG and (b) DTG profiles of cobalt propionate (argon)
The formation of metallic cobalt in inert atmosphere is unexpected since, firstly
the acetate formed CoO under the same conditions and secondly, there are
reports that cobalt propionate yields CoO under inert conditions14.
Heating in a reducing atmosphere such as hydrogen would yield cobalt metal as a
decomposition product, as confirmed in the literature11. One possible explanation
is that, assuming the decomposition mechanism of cobalt propionate is similar to
that of cobalt acetate (refer to p. 79 – 80), H2 is generated as a gas product

84
during the decomposition process in inert conditions and may then facilitate the
reduction of CoO to Co as a secondary process13.
Since decomposition in air would not generate H2 as a product, the plausibility of
this theory was explored by performing an additional experiment: heating cobalt
propionate in air. The TG and DTG profiles are shown in Fig. 4.18.
(a)
(b)
215°C
306°C
1
2
1 - 3.5%
2 - 60.8%
-5
0
5
10
15
Der
iv. W
eigh
t (%
/min
)20
40
60
80
100
120
Wei
ght (
%)
0 100 200 300 400 500
Temperature (°C) Universal V3.2B TA Instruments
Fig. 4.18 (a) TG and (b) DTG profiles of cobalt propionate (air)
Fig. 4.18 reveals that when heated in air, the total mass loss observed for cobalt
propionate is 64.3% which correlates well with the mass loss expected to
accompany the formation of CoO (63.4%). The fact that our sample formed
cobalt oxide in air supports the idea that metallic cobalt formation under argon
may be a secondary process caused by the reduction of CoO by H2 formed during
the decomposition process.

85
Another possible explanation to account for the formation of metallic cobalt is
based on claims that cobalt carboxylate species yield metallic cobalt when heated
rapidly in either a limited air supply or under nitrogen15. To determine whether
this idea could account for our findings, additional TG data was obtained using
slower heating rates of 2 and 5oC/min (Fig. 4.19a and b). In both instances the
final mass loss observed was consistent with the mass loss observed when the
sample was originally heated at 10oC/min. This result would seem to suggest that
the heating rate does not have a marked effect on the final decomposition
product.
Based on the results observed, it would seem that the more plausible explanation
to account for the formation of metallic cobalt in cobalt propionate is that CoO is
reduced in a secondary process by H2 formed during decomposition.
a b c d
a - 69.7%b - 72.1 %c - 74.2%d - 74.0%
20
40
60
80
100
120
Wei
ght (
%)
0 100 200 300 400 500
Temperature (°C) Universal V3.2B TA Instruments
Fig. 4.19 TG profiles of cobalt propionate heated at (a) 2oC/min, (b) 5oC/min, (c)
15oC/min and (d) 20oC/min (argon)

86
Two additional TG experiments were undertaken using a heating rate of 15 and
20oC/min (See Fig. 4.19c and d). The average mass loss observed for the five
experiments was 72.4%. The DTG profiles for each experiment were consistent
with the DTG profile observed when cobalt propionate was heated at 10oC/min
(Fig. 4.17b) i.e. single peaks and as expected the Tmax values are shifted to
higher values as the heating rate is increased.
The data from these five thermal experiments was used to estimate the activation
energy for the decomposition of cobalt propionate using the Kissinger method16.
The Kissinger equation:
Ea β (RTmax2) = Ae-Ea/RTmax (1)
Where: A = Frequency factor
β = Heating rate (K/min)
Ea = Activation energy (J.mol-1)
R = Gas constant (8.315 J.K-1.mol-1)
Tmax = Corresponding temperature at DTG peak maxima (See Fig 4.16b)
Can be converted by taking the natural logarithm of equation (1):
ln (β/Tmax2) = -ln (AR/Ea) + Ea/RTmax (2)
Thus the activation energy, Ea, can be obtained by plotting ln (β/Tmax2) against
1/Tmax, where the slope of the straight line is equal to –Ea/R.
Data for our thermal experiments are summarized in Table 4.14 and the
corresponding kinetic plot is illustrated in Fig. 4.20.

87
Table 4.14 Data for non-isothermal TG experiments of cobalt propionate
β (K/min) Tmax (K) 1/Tmax (K-1) ln(β/Tmax
2)
2 551 1.81 x 10⁻³ - 11.93
5 563 1.78 x 10⁻³ - 11.06
10 579 1.73 x 10⁻³ - 10.42
15 589 1.70 x 10⁻³ - 10.05
20 593 1.69 x 10⁻³ - 9.77
y = -16511x + 18.117
R2 = 0.9726
-13
-12
-11
-10
-9
-8
-7
1.68E-03 1.70E-03 1.72E-03 1.74E-03 1.76E-03 1.78E-03 1.80E-03 1.82E-03
1/Tmax (K-1)
ln(B
/Tm
ax2 )
Fig. 4.20 Kinetic plot for the decomposition of cobalt propionate
As stated previously, the slope of the straight line is used to calculate the
activation energy, Ea, using the following relationship:
Slope = -Ea/R
Thus: Ea = - (Slope x R)

88
Ea = - (-16 511 K x 8.315 J.K-1.mol-1)
Ea = 1.373 x 10⁵ J.mol-1≡ 137.3 kJ.mol-1
The activation energy for the decomposition of cobalt propionate is ~137.3
kJ.mol-1. This large value suggests that cobalt propionate has a high thermal
stability.
The DSC thermogram of cobalt propionate is shown in Fig. 4.21
238°C
211.07°C85.80J/g
313°C
288.38°C272.1J/g
367°C
364.18°C1.978J/g
Melting
Decomposition
-40
-30
-20
-10
0
Hea
t Flo
w (
mW
)
50 150 250 350 450
Temperature (°C)Exo Up Universal V3.2B TA Instruments
Fig. 4.21 DSC thermogram of cobalt propionate (argon)
Four endotherms are observed in the DSC thermogram of cobalt propionate. The
first peaks correspond to the melting point of the compound. Separate
determination of the melting point for cobalt propionate using a melting point
apparatus, revealed a gradual phase change commencing at ~228oC. The second
larger endotherm at 313oC corresponds to the mass loss observed in the TG
89
profile, confirming that this endotherm corresponds to decomposition. A third
significantly smaller endotherm at 367oC does not correspond to any measurable
mass loss. This could be a phase change of metallic cobalt to a high temperature
cubic form as cobalt is known to exhibit complex polytypic behaviour17.
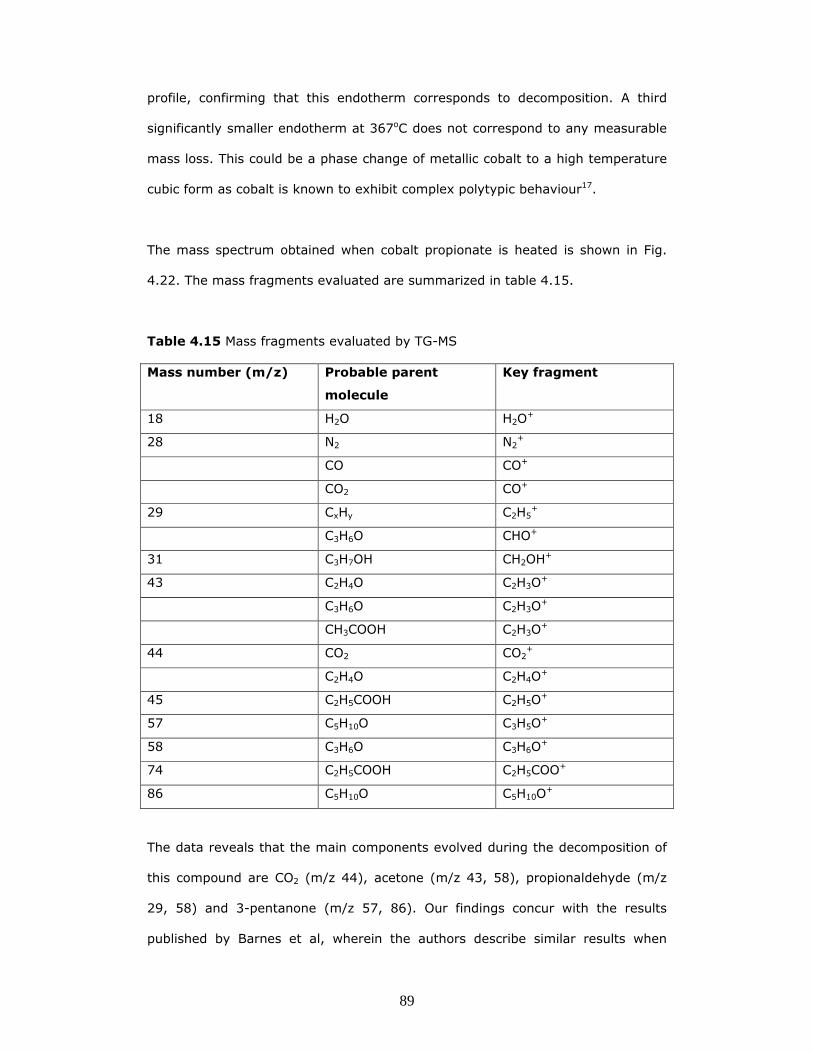
The mass spectrum obtained when cobalt propionate is heated is shown in Fig.
4.22. The mass fragments evaluated are summarized in table 4.15.
Table 4.15 Mass fragments evaluated by TG-MS
Mass number (m/z) Probable parent
molecule
Key fragment
18 H2O H2O+
28 N2 N2+
CO CO+
CO2 CO+
29 CxHy C2H5+
C3H6O CHO+
31 C3H7OH CH2OH+
43 C2H4O C2H3O+
C3H6O C2H3O+
CH3COOH C2H3O+
44 CO2 CO2+
C2H4O C2H4O+
45 C2H5COOH C2H5O+
57 C5H10O C3H5O+
58 C3H6O C3H6O+
74 C2H5COOH C2H5COO+
86 C5H10O C5H10O+
The data reveals that the main components evolved during the decomposition of
this compound are CO2 (m/z 44), acetone (m/z 43, 58), propionaldehyde (m/z
29, 58) and 3-pentanone (m/z 57, 86). Our findings concur with the results
published by Barnes et al, wherein the authors describe similar results when
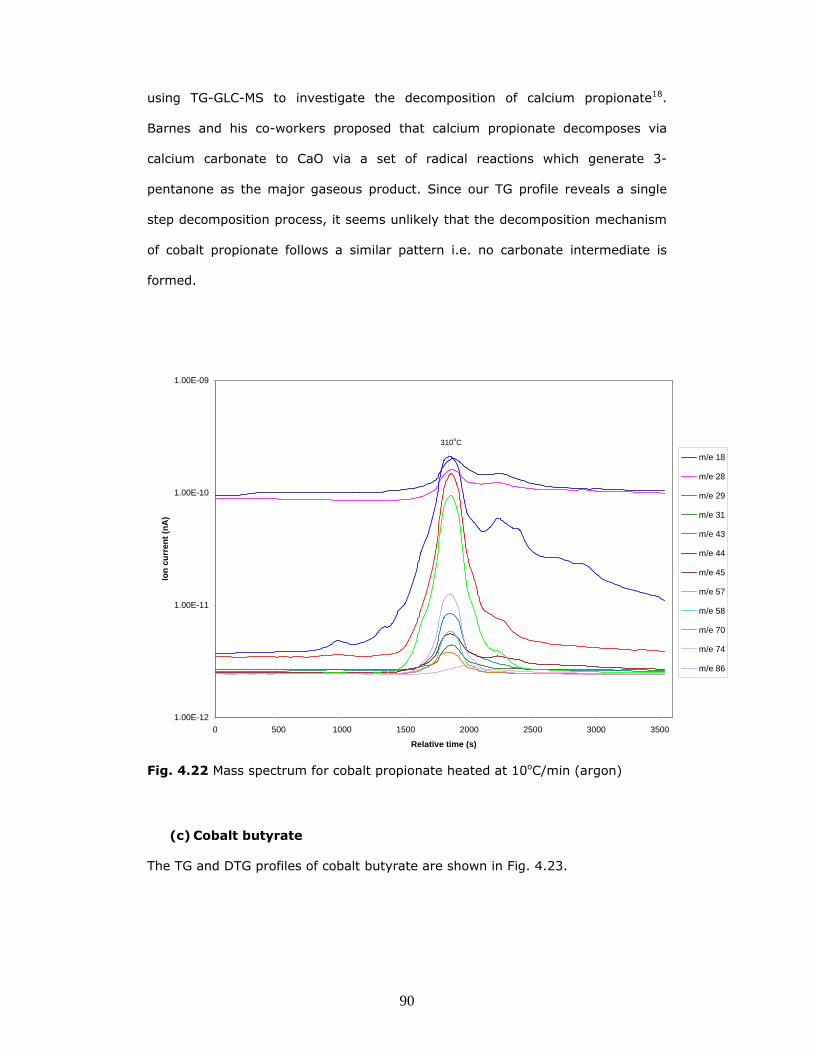
90
using TG-GLC-MS to investigate the decomposition of calcium propionate18.
Barnes and his co-workers proposed that calcium propionate decomposes via
calcium carbonate to CaO via a set of radical reactions which generate 3-
pentanone as the major gaseous product. Since our TG profile reveals a single
step decomposition process, it seems unlikely that the decomposition mechanism
of cobalt propionate follows a similar pattern i.e. no carbonate intermediate is
formed.
1.00E-12
1.00E-11
1.00E-10
1.00E-09
0 500 1000 1500 2000 2500 3000 3500
Relative time (s)
Ion
cu
rren
t (n
A)
m/e 18
m/e 28
m/e 29
m/e 31
m/e 43
m/e 44
m/e 45
m/e 57
m/e 58
m/e 70
m/e 74
m/e 86
310oC
Fig. 4.22 Mass spectrum for cobalt propionate heated at 10oC/min (argon)
(c) Cobalt butyrate
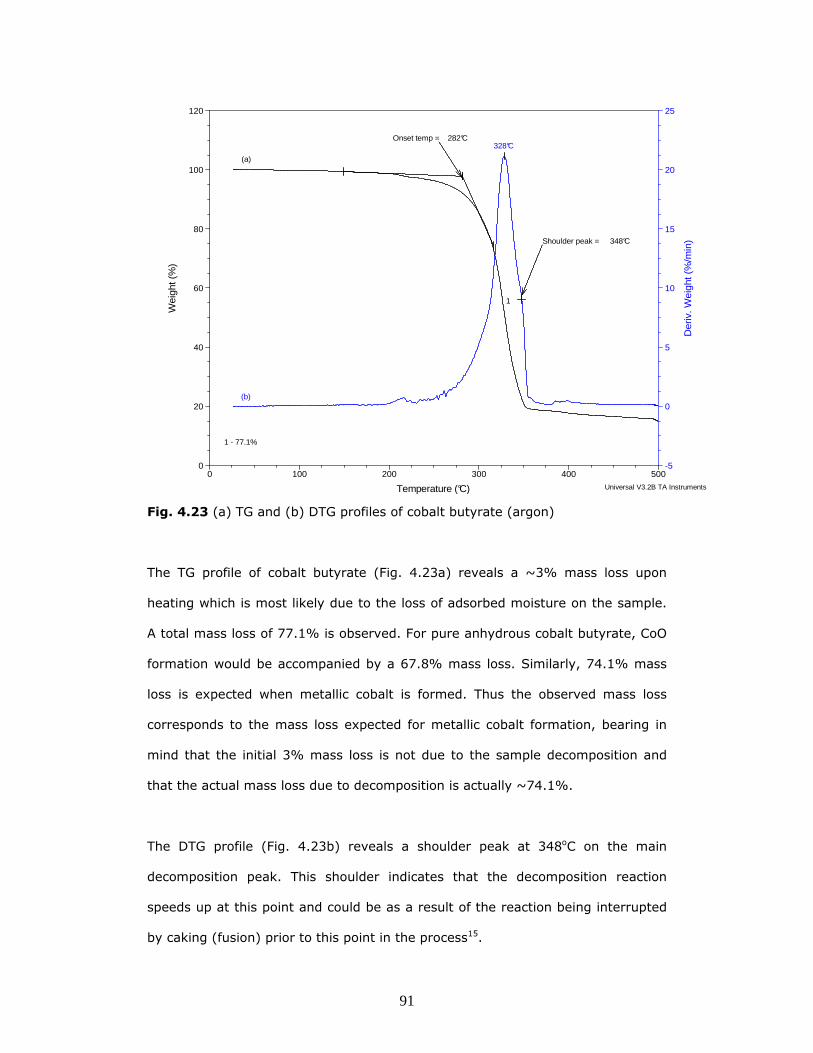
The TG and DTG profiles of cobalt butyrate are shown in Fig. 4.23.
91
282°C
(a)
(b)
1
1 - 77.1%
328°C
Shoulder peak = 348°C
Onset temp =
-5
0
5
10
15
20
25
Der
iv. W
eigh
t (%
/min
)
0
20
40
60
80
100
120
Wei
ght (
%)
0 100 200 300 400 500
Temperature (°C) Universal V3.2B TA Instruments
Fig. 4.23 (a) TG and (b) DTG profiles of cobalt butyrate (argon)
The TG profile of cobalt butyrate (Fig. 4.23a) reveals a ~3% mass loss upon
heating which is most likely due to the loss of adsorbed moisture on the sample.
A total mass loss of 77.1% is observed. For pure anhydrous cobalt butyrate, CoO
formation would be accompanied by a 67.8% mass loss. Similarly, 74.1% mass
loss is expected when metallic cobalt is formed. Thus the observed mass loss
corresponds to the mass loss expected for metallic cobalt formation, bearing in
mind that the initial 3% mass loss is not due to the sample decomposition and
that the actual mass loss due to decomposition is actually ~74.1%.
The DTG profile (Fig. 4.23b) reveals a shoulder peak at 348oC on the main
decomposition peak. This shoulder indicates that the decomposition reaction
speeds up at this point and could be as a result of the reaction being interrupted
by caking (fusion) prior to this point in the process15.

92
No mass spectrum was recorded for this compound but in an article published by
Leicester and Redman, the authors reported that the condensable products of
cobalt butyrate decomposition are mainly butyrone CO(C3H7)2 and a little butyric
acid15. They claim that the high yield of ketone results from the breakdown of
acid or acid anhydride in the presence of the solid decomposition residue.
Fig. 4.24 shows the DSC thermogram obtained for cobalt butyrate.
225°C
206.35°C84.85J/g
333°C
312.23°C169.0J/g
Melting
Decomposition
-15
-5
5
Hea
t Flo
w (
mW
)
50 100 150 200 250 300 350 400
Temperature (°C)Exo Up Universal V3.2B TA Instruments
Fig. 4.24 DSC thermogram of cobalt butyrate (argon)
The DSC thermogram shows two endothermic peaks. The first endotherm at
225oC is the confirmed melting point of the compound (measured at ~220oC with
a melting point apparatus). At 333oC decomposition takes place as indicated by
the second slightly larger endotherm which correlates with the 77% mass loss
observed in the TG profile (see Fig. 4.23a).
93
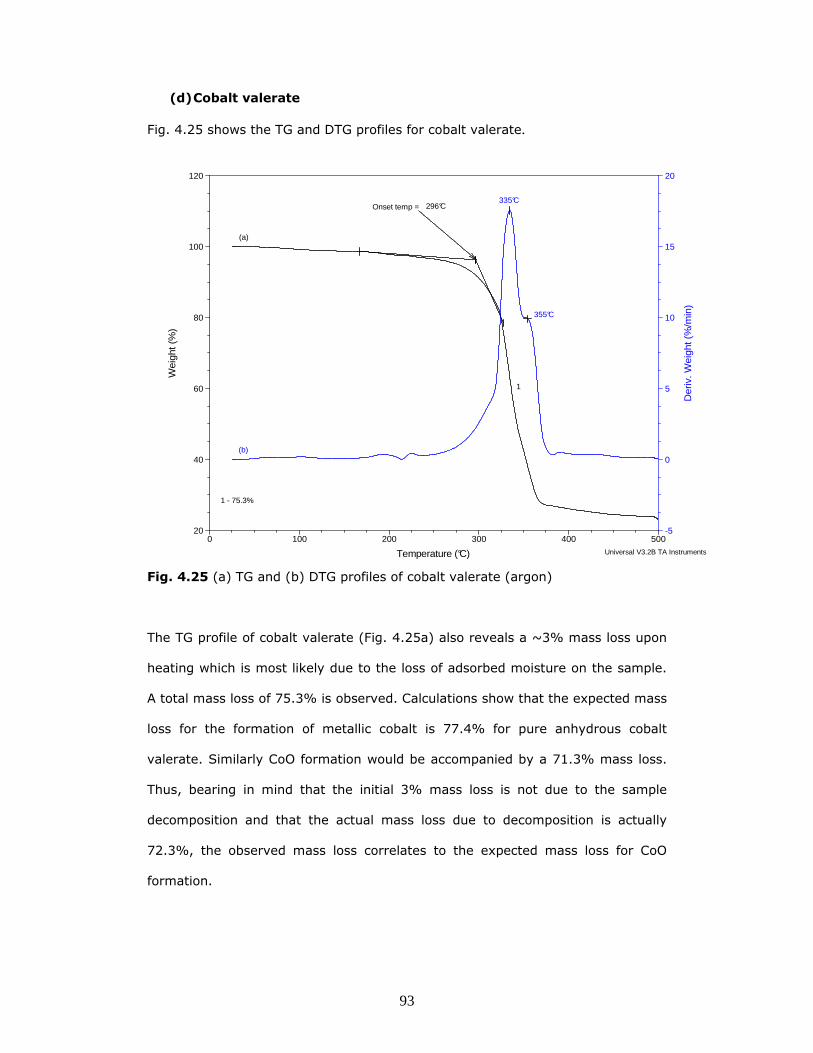
(d) Cobalt valerate
Fig. 4.25 shows the TG and DTG profiles for cobalt valerate.
(a)
(b)
1 - 75.3%
1
296°C335°C
355°C
Onset temp =
-5
0
5
10
15
20
Der
iv. W
eigh
t (%
/min
)
20
40
60
80
100
120W
eigh
t (%
)
0 100 200 300 400 500
Temperature (°C) Universal V3.2B TA Instruments
Fig. 4.25 (a) TG and (b) DTG profiles of cobalt valerate (argon)
The TG profile of cobalt valerate (Fig. 4.25a) also reveals a ~3% mass loss upon
heating which is most likely due to the loss of adsorbed moisture on the sample.
A total mass loss of 75.3% is observed. Calculations show that the expected mass
loss for the formation of metallic cobalt is 77.4% for pure anhydrous cobalt
valerate. Similarly CoO formation would be accompanied by a 71.3% mass loss.
Thus, bearing in mind that the initial 3% mass loss is not due to the sample
decomposition and that the actual mass loss due to decomposition is actually
72.3%, the observed mass loss correlates to the expected mass loss for CoO
formation.

94
The DTG profile (Fig. 4.25b) shows a two step decomposition process. Two peaks
are observed at 335 and 355oC. The splitting of the DTG peak may be due to the
formation of short-lived unstable intermediates which subsequently decompose to
CoO. It could also be a result of complex physical behaviour exhibited by the
compound as there have been reports in literature indicating that cobalt
carboxylates tend to cake badly when heated15 i.e. fusion occurs forming a crust
or diffusional layer that results in interruptions in the decomposition process.
Fig. 4.26 shows the DSC thermogram for cobalt valerate
191°C
169.37°C81.78J/g
320°C
304.08°C156.7J/g
Melting
Decomposition
-12
-2
Hea
t Flo
w (
mW
)
50 100 150 200 250 300 350 400
Temperature (°C)Exo Up Universal V3.2B TA Instruments
Fig. 4.26 DSC thermogram of cobalt valerate (argon)
Four endotherms are identified in the DSC thermogram of cobalt valerate. Melting
point measurements done in the lab showed that this compound melts at ~192oC,
confirming that the first peak at 191oC corresponds to melting of the compound.
The breadth of this peak as well as the fact that the peak is split suggests that

95
this compound melts gradually, alluding to the idea that the cobalt carboxylates
cake when heated15. The second endotherm at 320oC corresponds to the 71 %
mass loss observed in the TG profile (Fig. 4.25a), confirming that this
corresponds to decomposition. A shoulder observed on this peak correlates with
the peaks observed in the DTG profile (Fig. 4.25b), confirming that decomposition
takes place in two steps.
The mass spectrum obtained when cobalt valerate is heated is shown in Fig. 4.27.
From the mass fragments observed in the mass spectrum, it becomes evident
that cobalt valerate decomposes to yield primarily valeraldehyde (m/z 27, 29, 58,
57, 55) and some 2-pentanone (m/z 43, 58, 71) and 3-pentanone (m/z 29, 57).
Traces of valeric acid also present. A large quantity of CO2 is liberated. No
literature is available on the decomposition of valerates for comparative
purposes.
1.00E-12
1.00E-11
1.00E-10
1.00E-09
0 1000 2000 3000 4000 5000 6000
Relative time (s)
Ion
cu
rren
t (n
A)
m/e 18
m/e 27
m/e 29
m/e 43
m/e 44
m/e 55
m/e 57
m/e 58
m/e 60
m/e 71
335oC
H2O
CO2Organic fragments
Fig. 4.27 Mass spectrum of cobalt valerate heated at 10oC/min (argon)

96
(e) Cobalt hexanoate
The TG and DTG profiles for cobalt hexanoate are illustrated in Fig. 4.28.
351°C
1
1 - 71.0%
300°COnset temp =
-5
0
5
10
15
Der
iv. W
eigh
t (%
/min
)
20
40
60
80
100
120
Wei
ght (
%)
0 100 200 300 400 500
Temperature (°C) Universal V3.2B TA Instruments
Fig. 4.28 (a) TG and (b) DTG profiles of cobalt hexanoate (argon)
This compound decomposes via a single step and appears to contain no adsorbed
moisture or water of crystallization. The mass loss expected when metallic cobalt
is formed is 79.6%. Since this value does not correlate with the observed mass
loss of 71%, it seems more likely that cobalt hexanoate forms CoO upon
decomposition (expected mass loss = 74%). This analysis was repeated in
triplicate to verify the findings and all three TG experiments were in good
agreement. The average mass loss observed was 71% (as indicated in Fig. 4.28).
The DSC thermogram for cobalt hexanoate is shown in Fig. 4.29.

97
195°C
186.73°C31.79J/g
340°C
303.31°C236.5J/g
Melting
Decomposition
-30
-20
-10
0
Hea
t Flo
w (
mW
)
50 150 250 350 450
Temperature (°C)Exo Up Universal V3.2B TA Instruments
Fig. 4.29 DSC thermogram of cobalt hexanoate (argon)
The DSC thermogram of cobalt hexanoate (Fig. 4.29) shows two endothermic
events. The first thermal event at 195oC corresponds to the melting point of this
compound, as revealed via separate melting point measurements (~201oC). The
second thermal event at 340oC corresponds to the observed mass loss in the TG
profile (see Fig. 4.28a), confirming that this is the decomposition endotherm.
(f) Cobalt heptanoate
The TG and DTG profiles of cobalt heptanoate are shown in Fig. 4.30.

98
0
20
40
60
80
100
120
25 125 225 325 425 525
Temperature (oC)
Mas
s p
erce
nt
(%)
-2
0
2
4
6
8
10
12
14
Der
ivat
ive
mas
s p
erce
nt
(%/m
in)
1
1
Onset temp = 286oC
1 = 73.2%2 = ~2%
(a)
(b)
323oC
345oC
299oC
434oC~120oC 2
Fig. 4.30 (a) TG and (b) DTG profiles of cobalt heptanoate (argon)
The TG profile of this compound (Fig. 4.30a) reveals a small mass loss of ~2%
upon heating which corresponds to a small peak in the DTG profile (Fig. 4.30b) at
120oC. This could be attributed to some residual moisture in the sample. Two
mass loss steps are observed: 73.2% commencing at 286oC and ~2% at 434oC.
The total mass loss observed is 77.2%. According to gravimetric calculations this
mass loss correlates with the mass loss expected to accompany CoO formation
(76.4%).
The DTG curve of this compound (Fig. 4.30b) displays multiple peaks. This
information suggests that a number of intermediate species may be formed
during the decomposition process. Alternatively these spikes in the DTG profile
could result from the release of gaseous decomposition products from the
bubbling melt that forms as the sample is heated18. A third possibility, as
discussed previously, is caking of the sample15 and if in fact the TG experiments
99
are stopped at various intervals during the heating cycle, the sample reveals that
clumps of solid material are mixed with the melt. This observation supports the
idea that caking occurs in these samples.
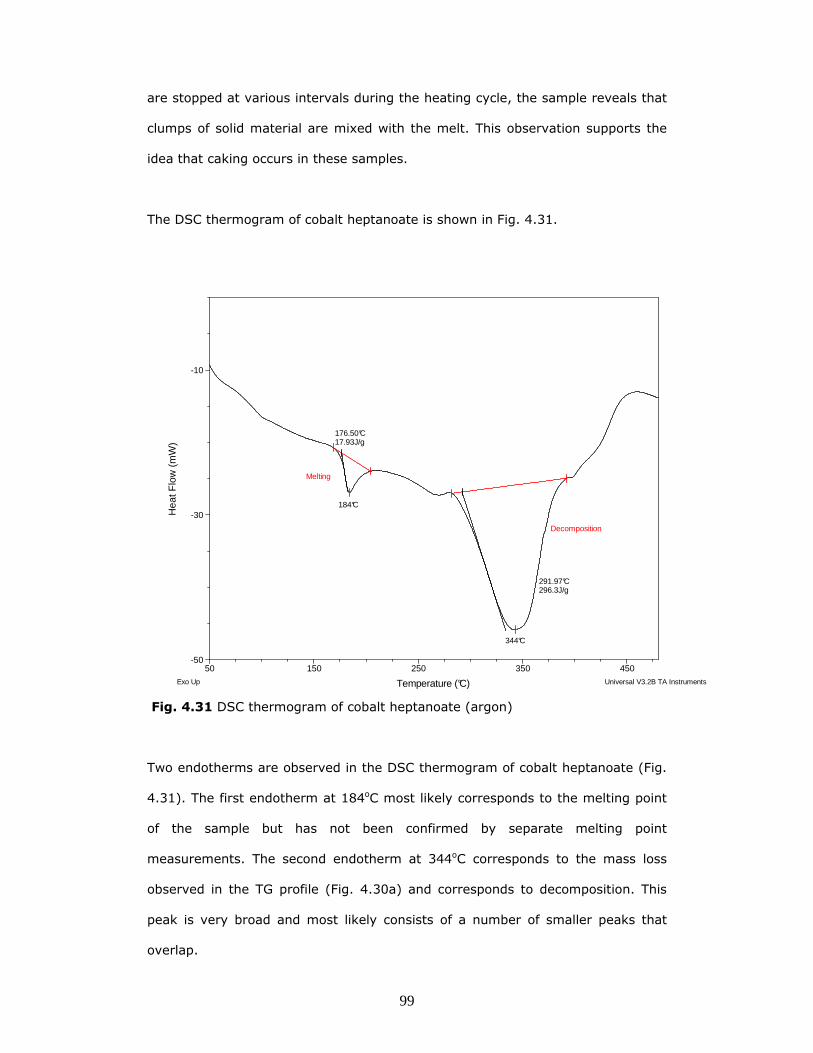
The DSC thermogram of cobalt heptanoate is shown in Fig. 4.31.
184°C
176.50°C17.93J/g
Decomposition
Melting
344°C
291.97°C296.3J/g
-50
-30
-10
Hea
t Flo
w (
mW
)
50 150 250 350 450
Temperature (°C)Exo Up Universal V3.2B TA Instruments
Fig. 4.31 DSC thermogram of cobalt heptanoate (argon)
Two endotherms are observed in the DSC thermogram of cobalt heptanoate (Fig.
4.31). The first endotherm at 184oC most likely corresponds to the melting point
of the sample but has not been confirmed by separate melting point
measurements. The second endotherm at 344oC corresponds to the mass loss
observed in the TG profile (Fig. 4.30a) and corresponds to decomposition. This
peak is very broad and most likely consists of a number of smaller peaks that
overlap.

100
(g) Cobalt octanoate
Fig. 4.32 shows the TG and DTG profiles of cobalt octanoate.
(a)
(b)
1
2
141°C
354°C
1 - 3.6 %
2 - 67.6 %
310°COnset temperature =
-5
0
5
10
15
Der
iv. W
eigh
t (%
/min
)
20
40
60
80
100
120W
eigh
t (%
)
0 100 200 300 400 500
Temperature (°C) Universal V3.2B TA Instruments
Fig. 4.32 (a) TG and (b) DTG profiles of cobalt octanoate (argon)
The TG profile of cobalt octanoate shows a gradual mass loss of ~4% as heating
is commenced. This mass loss is attributed to one mole of water. A further mass
loss of 68% is observed, commencing at 310oC. For pure cobalt octanoate a mass
loss of 78.3% corresponds to CoO formation. Thus the total mass loss of ~72%
observed for this sample could suggest that a minor impurity is present in the
sample. Since no traces of residual acid were evident from the infrared spectrum
of the sample, the impurity is most likely CoCO3. It is however tricky to assign
the principal band for CoCO3 definitively as it occurs in the same region as the
symmetrical COO- stretch.
Fig. 4.33 illustrates the DSC thermogram for cobalt octanoate.

101
168°C
161.33°C8.998J/g
354°C
312.37°C273.0J/g
Decomposition
78°C
55.64°C19.50J/g
Dehydration
Phase change
-10
-5
0
5
10H
eat F
low
(m
W)
45 145 245 345 445
Temperature (°C)Exo Up Universal V3.2B TA Instruments
Fig. 4.33 DSC thermogram of cobalt octanoate (argon)
The DSC profile of cobalt octanoate (Fig. 4.33) reveals three endothermic peaks.
The first peak at 78oC is associated with the dehydration of the sample. The
second at 168oC most likely corresponds to a phase change, possibly the melting
point and the largest endotherm at 354oC corresponds to the mass loss step
observed in the TG profile (Fig. 4.32a) and is associated with decomposition.
(h) Cobalt nonanoate
The TG and DTG profiles of cobalt nonanoate are shown in Fig. 4.34.

102
(a)
(b)
338°C
362°C
315°C
1
1 - 77.8%
284°COnset temp =
-5
0
5
10
15
20
Der
iv. W
eigh
t (%
/min
)
0
20
40
60
80
100
120
Wei
ght (
%)
0 100 200 300 400 500
Temperature (°C) Universal V3.2B TA Instruments
Fig. 4.34 (a) TG and (b) DTG profiles of cobalt nonanoate (argon)
The TG profile for the nonanoate (Fig. 4.34a) reveals that a small amount (~2%)
of surface adsorbed water was removed upon heating. A mass loss of 77.8% is
observed between 284 and 400oC. For the pure compound, the expected mass
loss for CoO formation is 79.9% versus 84.2% for metallic cobalt formation.
Therefore the corresponding mass loss of 78% is an indication that CoO is the
final decomposition product.
The DTG curve (Fig. 4.34b) once again shows multiple peaks. These peaks may
indicate the formation of intermediates during decomposition or could be the
result of physical processes such as caking15 or rapid evolution of gases from the
melted sample18.
The DSC profile for cobalt nonanoate is shown in Fig. 4.35.

103
341°C
310.41°C131.6J/g
102°C
86.21°C11.53J/g
Decomposition
150°C
142.20°C3.670J/g
Phase changes
-10
-5
0
5
10
Hea
t Flo
w (
mW
)
50 150 250 350 450
Temperature (°C)Exo Up Universal V3.2B TA Instruments
Fig. 4.35 DSC thermogram of cobalt nonanoate (argon)
Three endotherms are observed. The first two smaller endotherms do not
correspond to any measurable mass loss in the TG profile (Fig. 4.34a) and most
likely correspond to phase changes. The first process at 102oC could also be
associated with the desorption of surface moisture. No additional melting point
data was collected to confirm whether the second endotherm is the sample’s
melting point. This is unlikely though since the temperature is somewhat lower
than would be anticipated for a compound containing such long hydrocarbon
chains and more likely represents a solid-solid phase change7. The third large
endotherm at 341oC corresponds to decomposition of the compound.
(i) Cobalt decanoate
The TG and DTG profiles of cobalt decanoate are shown in Fig. 4.36.

104
296°C
1
1 = 82.2 %
Onset temperature =
329°C
(a)
(b)
-5
0
5
10
15
Der
iv. W
eigh
t (%
/min
)
0
20
40
60
80
100
120
Wei
ght (
%)
0 100 200 300 400 500
Temperature (°C) Universal V3.2B TA Instruments
Fig. 4.36 (a) TG and (b) DTG profiles of cobalt decanoate (argon)
The TG profile of cobalt decanoate (Fig. 4.36a) reveals an 82.2% mass loss.
Gravimetric calculations reveal that for pure cobalt decanoate, metallic cobalt
formation is expected to be accompanied by an 85.3% mass loss and 81.3%
mass loss is expected for CoO formation. A total mass loss of 82.2% thus
suggests that this compound most likely decomposes to CoO.
The spikes observed in the DTG profile (Fig. 4.36b) may arise as gaseous
decomposition products are released from the sample in the melt form18.
Additional experiments were completed on cobalt decanoate using heating rates
of 2, 5, 15 and 20oC/min. The TG profiles for these experiments can be seen in
Fig. 4.37. In all instances the mass loss observed was consistent, averaging

105
82.6%. The DTG profiles for these experiments are consistent with the DTG
profile shown in Fig. 4.36b i.e. spikes are observed for all heating rates. As
expected, the spikes become larger and more prominent as the heating rate is
increased because the rate of decomposition and gas evolution increases as the
heating rate is increased.
ab c d
a - 81.2%b - 82.2%c - 83.9%d - 83.5%
0
20
40
60
80
100
120
Wei
ght (
%)
0 100 200 300 400 500
Temperature (°C) Universal V3.2B TA Instruments
Fig. 4.37 TG profiles of cobalt decanaote heated at (a) 2oC/min, (b) 5oC/min, (c)
15oC/min and (d) 20oC/min (argon)
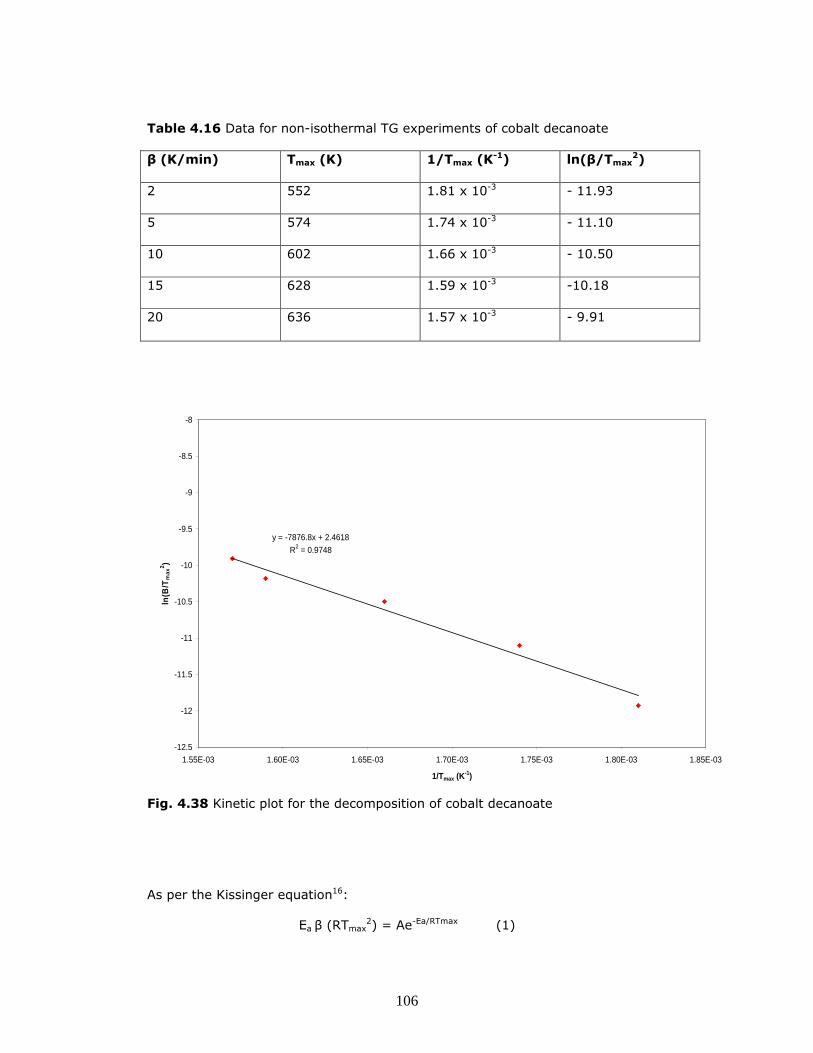
The data obtained from the five TG experiments was used to estimate the
activation energy for the decomposition of this compound using the Kissinger
method, as discussed in more detail earlier in chapter 4. Table 4.16 summarises
the data for our thermal experiments and the corresponding kinetic plot is
illustrated in Fig. 4.38.
106
Table 4.16 Data for non-isothermal TG experiments of cobalt decanoate
β (K/min) Tmax (K) 1/Tmax (K-1) ln(β/Tmax
2)
2 552 1.81 x 10⁻³ - 11.93
5 574 1.74 x 10⁻³ - 11.10
10 602 1.66 x 10⁻³ - 10.50
15 628 1.59 x 10⁻³ -10.18
20 636 1.57 x 10⁻³ - 9.91
y = -7876.8x + 2.4618
R2 = 0.9748
-12.5
-12
-11.5
-11
-10.5
-10
-9.5
-9
-8.5
-8
1.55E-03 1.60E-03 1.65E-03 1.70E-03 1.75E-03 1.80E-03 1.85E-03
1/Tmax (K-1)
ln(B
/Tm
ax2 )
Fig. 4.38 Kinetic plot for the decomposition of cobalt decanoate
As per the Kissinger equation16:
Ea β (RTmax2) = Ae-Ea/RTmax (1)
107
Where: A = Frequency factor
β = Heating rate (K/min)
Ea = Activation energy (J.mol-1)
R = Gas constant (8.315 J.K-1.mol-1)
Tmax = Corresponding temperature at DTG peak maxima (See Fig 4.34b)
Taking the natural logarithm of equation (1):
ln (β/Tmax2) = -ln (AR/Ea) + Ea/RTmax (2)
Thus activation energy, Ea, can be obtained by plotting ln (β/Tmax2) against
1/Tmax, where the slope of the straight line is equal to –Ea/R.
Thus: Ea = - (Slope x R)
Ea = - (-7876.8 K x 8.315 J.K-1.mol-1)
Ea = 6.550 x 10⁴ J.mol-1≡ 65.5 kJ.mol-1
The activation energy for the decomposition of cobalt decanoate is 65.5 kJ.mol-1.
This value is significantly lower than the activation energy determined for the
decanoate’s shorter chain counter part, cobalt propionate. A possible explanation
is steric effects. The shorter propionate chains may be able to adopt a much more
tightly packed configuration around the central cobalt atom as there will be less
steric interaction between the chains. The longer decanoate chains cannot pack
as tightly around the cobalt atom as they are much larger, resulting in increased
interaction (i.e. repulsion) between the chains. These repulsive forces between
the chains decrease the overall stability of the molecule, lowering the activation
energy required for decomposition.
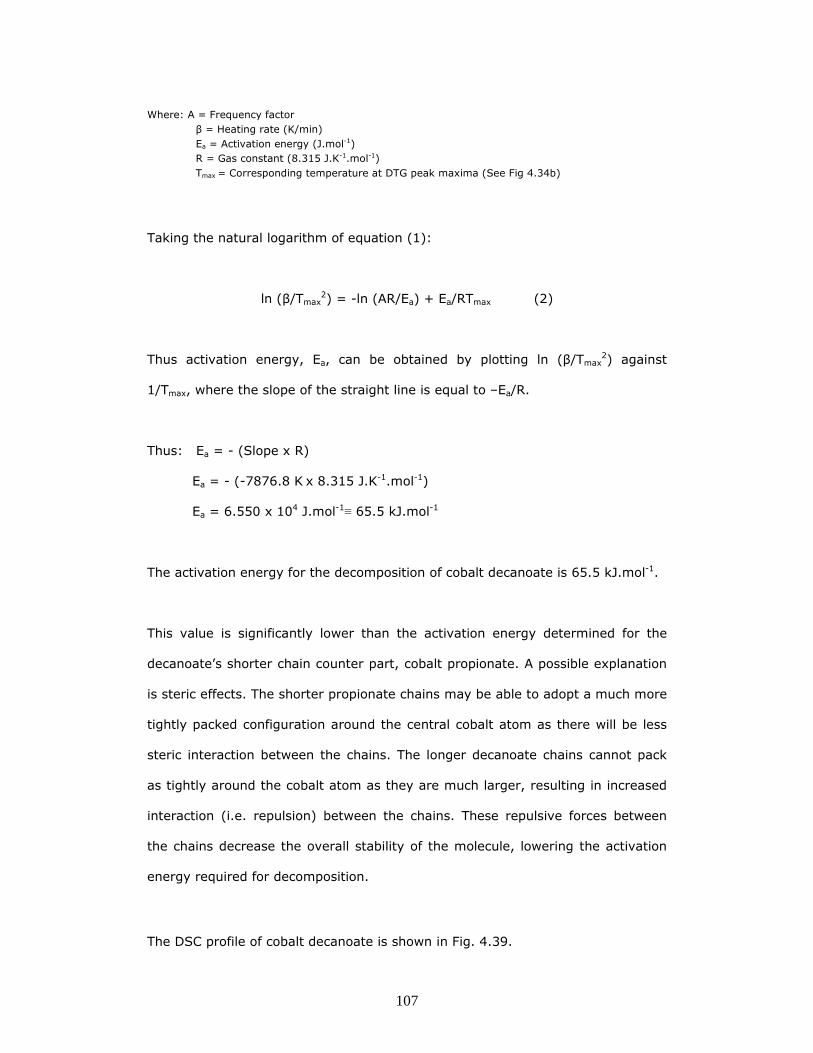
The DSC profile of cobalt decanoate is shown in Fig. 4.39.

108
137°C
131.22°C12.85J/g
317°C
295.06°C112.9J/g
Decomposition
-17.5
-12.5
-7.5
Hea
t Flo
w (
mW
)
45 145 245 345 445
Temperature (°C)Exo Up Universal V3.2B TA Instruments
Fig. 4.39 DSC thermogram of cobalt decanoate (argon)
Two endotherms are observed. The first endotherm does not correspond to any
measurable mass loss and is most likely associated with a phase change. Since
the temperature is relatively low (137oC), it may be a solid-solid phase change
which is not uncommon amongst carboxylates7. This hypothesis could be
confirmed by examination of the sample under a hot stage microscope. The
second endotherm corresponds to mass losses observed in the TG profile (Fig.
4.38a) and represents decomposition.
Thermal data for the cobalt carboxylates is summarised in Table 4.17. Observed
mass losses are compared to mass losses determined from gravimetric
calculations and used to determine which residues were formed during
decomposition. The onset temperature for each decomposition reaction can be
defined as the temperature at which decomposition commences and was

109
determined mathematically by finding the point of intersection formed by two
lines drawn tangentially to the TG profiles, one vertical and one horizontal. Tmax
values are the peak maxima values on the DTG profiles and indicate the point at
which decomposition proceeds most rapidly for each reaction.
Table 4.17 TGA data for cobalt carboxylates
Compound Observed mass
loss (%)*
Residue(s) Onset temp.
(oC)
Tmax (oC)
Acetate 64.2 (64.8) CoO 101
263
350
124
275
361
Propionate 72.4 (71.2) Co 269 304
Butyrate 77.1 (74.1) Co 282 328
Valerate 75.3 (77.4) CoO 296 335, 355
Hexanoate 71.0 ( 74.1) CoO 300 351
Heptanoate 75.2 (76.4) CoO 286 323, 345
Octanoate 71.2 ( 78.3) CoO 310 354
Nonanoate 77.8 (79.9) CoO 284 338
Decanoate 82.2 (81.3) CoO 298 329
* Expected values in brackets
From Table 4.17 it becomes clear that in the lower carboxylates there is a gradual
increase in thermal stability as the length of the carboxylate chain is increased
i.e. increases in the decomposition onset temperatures are observed.
Interestingly though, from the valerate (C5) upwards it would seem that
carboxylates that contain an even number of carbon atoms in their carboxylate
chains (hereafter referred to as even members) have a higher thermal stability
than their counterparts containing an odd number of carbon atoms in their
carboxylate chains (hereafter referred to as odd members), since their onset

110
temperatures of decomposition are higher. The trends described above are
illustrated in Fig. 4.40.
260
270
280
290
300
310
320
0 2 4 6 8 10 12
Cn
On
set
tem
p (
oC
)
Fig. 4.40 Variation in decomposition onset temperature with increasing number
of carbon atoms (Cn) for cobalt carboxylates
Although the exact reason for this observation is unclear, the most plausible
explanation is based on differences in “packing effects” between odd members
and their even counterparts19. Boese and co-workers determined that for the
heavier analogues (Cn≥5) in a series of n-alkanes, the odd members cannot pack
as closely as the even members, or they are forced to take up torsional strain due
to their geometry and therefore have lower melting points20. They developed a
geometrical model to illustrate odd-even effects in these heavier analogues. The
model is based on molecular symmetry and shape and requires that: (i)
molecules are arranged into layers, (ii) –CH2 groups of successive molecules are
interlinked to form columnar stacks and (iii) end groups can only interact with
other end groups20. The model does not apply to lower members since there is

111
significant interference between the end groups and –CH2 groups of adjacent
molecules resulting in entirely different structures.
Their model showed that the intermolecular distances between the end groups,
i.e. –CH3 groups, are responsible for the differences observed in the melting
points of n-alkanes. Odd members cannot approach as closely as even members
making them less dense and lowering their melting points19. Fig. 4.41 reveals a
simplified geometrical description (in planar 2-D view) to explain this finding.
Fig. 4.41 Schematic representation of the packing of even-numbered (left) and
odd-numbered (right) n-alkanes19

112
The shape of an even member can be described in the plane of the carbon
skeleton as a parallelogram, that of an odd member as a trapezoid (Fig. 4.41a). If
close packing of parallelograms is required, a pattern may result as shown in Fig.
4.41b. However an analogous packing is also possible for the trapezoids (Fig.
4.41c).
If the main axis of the molecules is increased i.e. an additional –CH2 group is
added to the chain, it is expected that the area (or in 3-D case the volume)
increases by similar proportions (Fig. 4.41c). Such a packing would lead to a
monotonic increase in the density because a parallelogram and a trapezoid have
the same area with the same length of the centre line and height. However the –
CH3 groups situated opposite each other try to adopt a staggered conformation
(as seen in Fig.4.41b). Thus the columns of the parallelograms have to be shifted
with respect to each other so as to achieve the staggered arrangement of –CH3
groups (Fig. 4.41d left). A similar shift is possible for the trapezoid pattern only
on one side, on the other side the shift results in very long distances and the –
CH3 groups are not really situated opposite each other (Fig. 4.41d right). This
arrangement has large gaps (shaded in black), compared to the right and centre
layer.
Thus even-numbered alkanes have optimal intermolecular contacts at both ends
where as the odd members possess these at one end only and at the other end
the distances are longer. This leads to a less dense packing for the odd members
and as a consequence lower melting points19.
Similar studies have been conducted on a series of n-alkyl carboxylic acids21.
Alternating melting points can be rationalised using a similar 2-D model, however
molecules form hydrogen-bonded dimers that are arranged into bilayers. The
packing density within bilayers is comparable between different acids and it is

113
believed that differences in the packing densities between bilayers gives rise to
the trends observed in the melting points of the acids21.
The information in Table 4.17 also reveals that the cobalt carboxylates considered
in this project are stable below 200oC. Decomposition occurs in the range 265 -
400oC and proceeds rapidly to yield CoO. This observation was expected since
there are numerous accounts describing this result2,8,11,12,15. In the case of the
propionate and butyrate where metallic cobalt was formed, it is possible that H2 is
generated as a gas product during the decomposition process which may then
facilitate the reduction of CoO to metallic cobalt as a secondary process13.
Due to the relatively high thermal stability of the cobalt carboxylates, cobalt may
not necessarily be a suitable candidate to pursue as a commercial
decarbonylation catalyst. Since the majority of these compounds only decompose
above 300oC, it would be expensive to utilize them on the plant. To elaborate on
this statement, two primary methods of supplying energy for plant processes are
discussed briefly.
Steam heaters are commonly used to supply the energy required for plant
processes. These units generate superheated steam in large quantities which
supplies energy for process-heating22. Since steam has a definite pressure for
each fixed boiling or condensing temperature, the desired temperature for a
process can be controlled by choosing the steam pressure23. When higher
temperatures are needed, the higher corresponding steam pressure becomes
important in the design of the process equipment and both economic and safety
considerations become critical. The use of steam heating is thus usually limited to
pressures ≤ 2.2 MPa or ~180oC23. When temperatures in excess of 180 – 205oC
are needed, other heating media are preferred.
114
Much of the energy required in petrochemical industries is introduced into the
process through fired heaters or furnaces24. The energy input for a process
results from the heat liberated by the combustion of fuel within an internally
insulated chamber of the fired heater. Higher temperatures can be maintained in
these units however their operation is far more energy intensive24. Satisfactory
combustion requires adequate mixing of the fuel source with air and careful
consideration must be given to the design of the system as well as the
stoichiometry of the components put into the system24. CO2 emissions from fired
heater units are substantial.
Therefore the use of steam heaters over fired heaters is advantageous for two
reasons: (i) economically they are less expensive to operate than fired heaters
and (ii) environmentally they pose less risk as opposed to fired heaters which
generate large amounts of the greenhouse gas CO2.
4.4 Conclusions
In summary, the data revealed that the physical and chemical properties of the
cobalt carboxylates are very similar and it would appear that the difference in
chain length of the carboxylate moiety has only a limited effect on the behaviour
of these compounds.
IR data revealed that the compounds were of a sufficient purity for investigation.
The two characteristic bands typical of carboxylate ions were observed for all the
compounds and the separation of these two bands (∆v) was determined for each
compound and used to make inferences about the possible carboxylate bonding
mode in each case. However, this method of assigning structures based on the ∆v
values was originally developed using a series of metal acetates only and we have
extended this method to the longer chain carboxylates. Unfortunately no crystals

115
suitable for X-ray diffraction analysis could be obtained and the proposed
structures could not be confirmed.
Examination of the thermal data shows that the cobalt carboxylates considered in
this project are stable below 200oC. Decomposition occurs in the range 265 -
400oC and proceeds rapidly to yield CoO. Metallic cobalt formation is suspected
in some cases and the reason for this observation could be H2 facilitated reduction
of CoO to Co as a secondary process during decomposition13.
An interesting feature observed in the DTG profiles of some compounds is the
occurrence of multiple peaks observed over the mass loss step. This would seem
to imply that the compounds exhibit more complex decomposition behaviour than
the single step in the TG profiles suggest. The possibility that the compounds
decompose via multiple reactions to yield unstable intermediates that
immediately decompose further can not be ruled out. However there are
literature reports that suggest that cobalt carboxylates tend to “cake” when
heated15 i.e. fusion occurs forming a crust or diffusional layer that results in
apparent discontinuities in the decomposition process. If TG experiments are
stopped at various intervals during the heating cycle, examination of the samples
reveal that clumps of solid material are formed in the melt. It is thus probable
that the cobalt carboxylates are subject to physical rather than chemical effects
when heated.
More intensive examination of the thermal data reveals that cobalt carboxylates
containing an even number of carbon atoms in the carboxylate chain appear to be
thermally more stable than their odd carbon counterparts, as their onset of
decompositions are at higher temperatures. This result is not unexpected since it
is a well documented fact that differences exist in the packing of odd-numbered
and even-numbered alkanes and alkane derivatives19,20. The geometry that can
116
be achieved in even-numbered derivatives is conducive to much more efficient
close packing of molecules leading to increased densities and hence higher
thermal stabilities than their odd-numbered analogues.
Cobalt carboxylates exhibit relatively high thermal stability and decompose
between 265 – 400oC. They are not necessarily good candidates to be used as
commercial decarbonylation catalysts as the higher temperatures required to
decompose these compounds would result in the need for fired heaters on the
plant. Fired heaters are expensive and have a larger environmental footprint.

4.5 References
1 P. Mars, Adv. in Catal., 14 (1963) 35 2 R.C. Mehrotra and R. Bohra, Metal carboxylates, Academic Press, London, 1983
3 Kirk-Othmer Encyclopedia of chemical technology Vol. 8 (3rd ed.), Wiley & Sons,
New York, 1991 4 K. Nakamoto, Infrared spectroscopy of inorganic and coordination compounds,
Wiley, New York, 1970 5 http://www.aist.go.jp/RIODB/db004/img/ir (22/06/2008) 6 Zh. Nickolov, G. Georgiev, D Stoilova and I. Ivanov, J. Molec. Struc.., 354 (1995)
119 7 MSc dissertation of A.D. Pienaar, University of Stellenbosch (2005) 8 D.A. Edwards and R.N. Hayward, Can. J. Chem., 46 (1968) 3443 9 http://www.riodb01.ibase.aist.go.jp/sdbs (26/11/2008) 10 J.N. van Niekerk and F.R.L. Scheoning, Acta Cryst., 6 (1953) 609 11 M.A. Mohamed, S.A. Halaway, M.M. Ebrahim, J. Therm. Anal., 41 (1994) 387 12 M.E. Brown and A.K. Galwey, Thermal decomposition of ionic solids: Chemical
properties and reactivities of ionic crystalline phases, Elsevier, 1999 13 E. Inger-Stocka and A. Grabowska, J. Therm. Anal., 54 (1998) 115 14 P.S. Bassi, H.S. Jamwal and B.S. Randhawa, Thermochim. Acta, 71 (1983) 15 15 J. Leicester and M.J. Redman, J. Appl. Chem., 12 (1962) 357 16 H.E. Kissinger, Anal. Chem., 29 (1957) 1702 17 Shriver and Atkins, Inorganic Chemistry (3rd ed.), Oxford University Press, 1999
p.39 18 P. A. Barnes, G. Stephenson and S. B. Warrington, J. Therm. Anal., 25 (1982) 299 19 R. Boese, H. Weiss and D. Bläser, Angew. Chem. Int. Ed., 38 (1999) 988 20 V.R. Thalladi and R. Boese, New J. Chem., 24 (2000) 579 21 A. D. Bond, New J. Chem., 28 (2004) 104 22 J. J. McKetta, Encyclopedia of chemical processing and design Vol. 53, Marcel
Dekker Inc., New York, 1995 23 Kirk-Othmer Encyclopedia of chemical technology Vol. 21 (3rd ed.), Wiley & Sons,
New York, 1983

24 J. J. McKetta, Encyclopedia of chemical processing and design Vol. 18, Marcel
Dekker Inc., New York, 1983