chapter 4 results and discussion - um students'...
TRANSCRIPT
34
CHAPTER 4
RESULTS AND DISCUSSION
4.1 TOTAL PROTEIN DETERMINED USING BRADFORD ANALYSIS
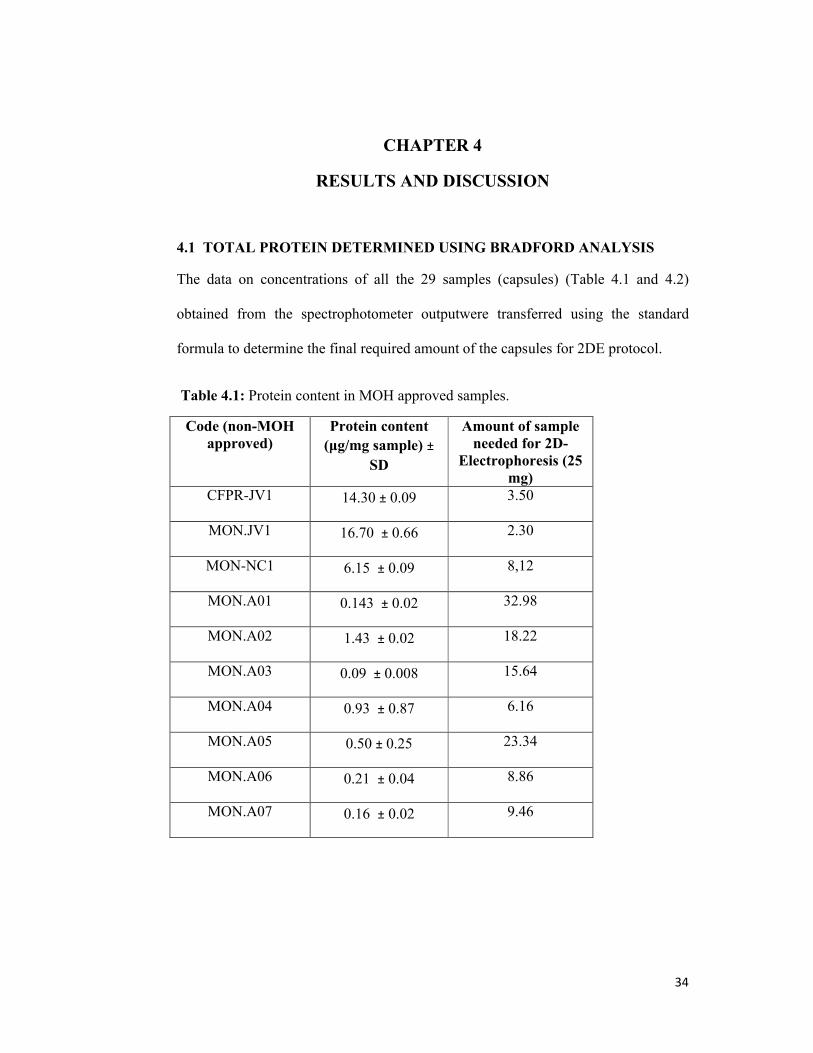
The data on concentrations of all the 29 samples (capsules) (Table 4.1 and 4.2)
obtained from the spectrophotometer outputwere transferred using the standard
formula to determine the final required amount of the capsules for 2DE protocol.
Table 4.1: Protein content in MOH approved samples.
Code (non-MOH approved)
Protein content (μg/mg sample) ±
SD
Amount of sample needed for 2D-
Electrophoresis (25 mg)
CFPR-JV1 14.30 ± 0.09 3.50
MON.JV1 16.70 ± 0.66 2.30
MON-NC1 6.15 ± 0.09 8,12
MON.A01 0.143 ± 0.02 32.98
MON.A02 1.43 ± 0.02 18.22
MON.A03 0.09 ± 0.008 15.64
MON.A04 0.93 ± 0.87 6.16
MON.A05 0.50 ± 0.25 23.34
MON.A06 0.21 ± 0.04 8.86
MON.A07 0.16 ± 0.02 9.46

35
Table 4.1: Protein content in MOH approved samples (continued)
Code (non-MOH approved)
Protein content (μg/mg sample) ±
SD
Amount of sample needed for 2D-
Electrophoresis (25 mg)
MON.A08 11.28 ±0.20 4.43
MON.A09 4.43 ±0.28 11.20
MON.A10 4.38 ±0.22 11.40
MON.A11 6.90 ±0.81 7.24
MON.A12 7.02 ± 0.31 7.11
MON.A13 2.27 ± 0.30 22.0
MON.A14 5.05 ± 0.30 9.88
MON.A15 1.55 ± 0.21 32.2
MON.A16 2.47 ± 0.24 20.26
MON.A17 8.11 ± 0.25 6.16
MON.A18 6.24 ± 0.47 8.00
MON.A19 4.50 ± 0.38 11.1
MON.A20 7.18 ± 0.85 6.95
MON.A21 6.89 ± 0.09 7.25
MON.22 5.56 ± 0.14 8.98
MON.A23 3.65 ± 0.14 13.67
36
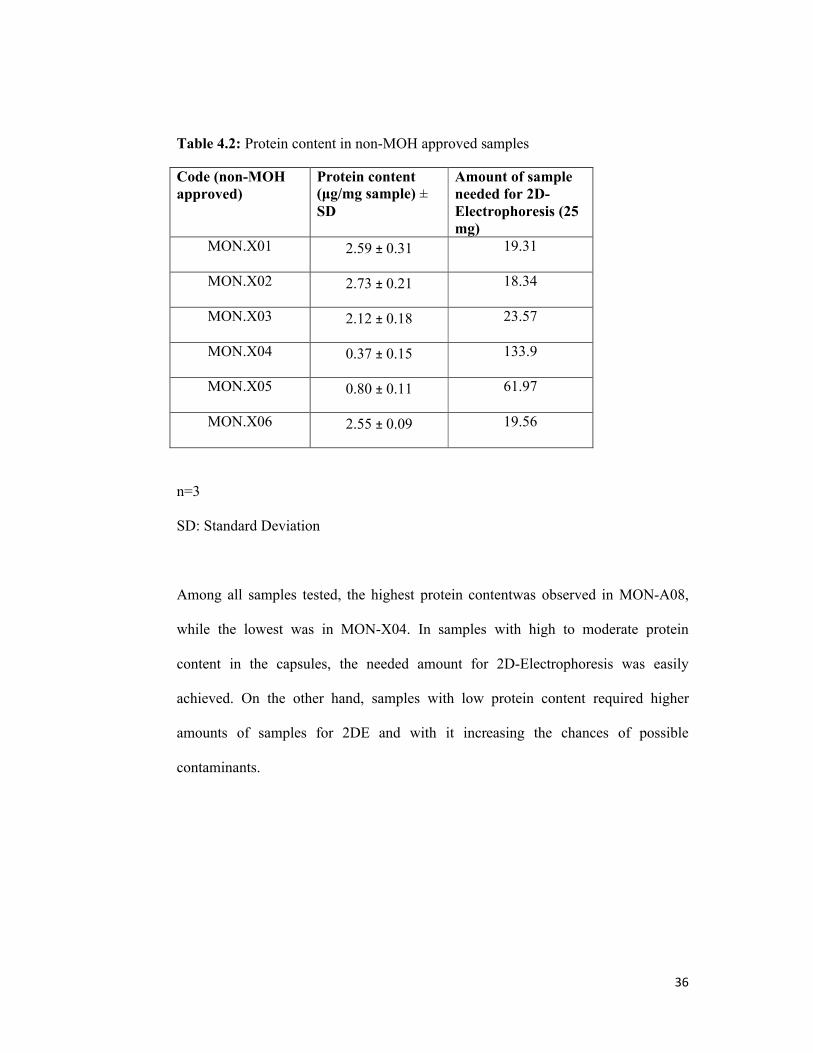
Table 4.2: Protein content in non-MOH approved samples
Code (non-MOH approved)
Protein content (μg/mg sample) ± SD
Amount of sample needed for 2D-Electrophoresis (25 mg)
MON.X01 2.59 ± 0.31 19.31
MON.X02 2.73 ± 0.21 18.34
MON.X03 2.12 ± 0.18 23.57
MON.X04 0.37 ± 0.15 133.9
MON.X05 0.80 ± 0.11 61.97
MON.X06 2.55 ± 0.09 19.56
n=3
SD: Standard Deviation
Among all samples tested, the highest protein contentwas observed in MON-A08,
while the lowest was in MON-X04. In samples with high to moderate protein
content in the capsules, the needed amount for 2D-Electrophoresis was easily
achieved. On the other hand, samples with low protein content required higher
amounts of samples for 2DE and with it increasing the chances of possible
contaminants.

37
4.2 VALIDATION OF BIOMARKERS
In this protocolwe were looking for 2 biomarkers (A and B) at 14.4 kDa molecular
weights on polyacrylamide gel. What we could observe in CFPR-JV1 which were
used as a positive control and provided from FRIM (a standardized Tongkat Ali
extract), clear and reproducible spots of biomarker A and B (Fig 4.1). The second
positive control was MON-JV1 which was extracted in our laboratory and it as well
showed both biomarkers clearly to be present (Fig 4.2).While MON-NC was the
negative control used and accordingly it did not display any spots for biomarkers A
and B (Fig 4.3).
Clear and reproducible spots of Tongkat Ali biomarkers are presented in Figure 3.6.
These spots came from a product with only Tongkat Ali (MON-A15) (not mixed
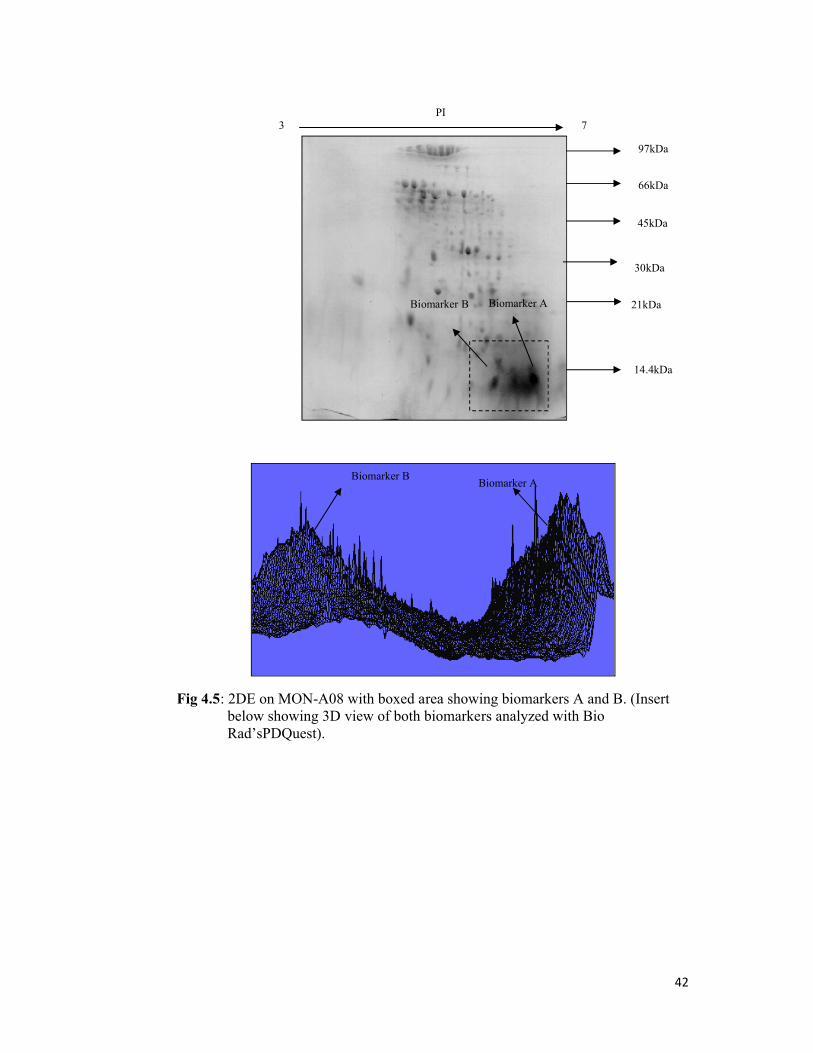
with other herbs). Whereas,clear, A and B spots and many other spots were observed
from another Tongkat Ali product stated to be mixed with other herbs (MON-A08)
(Figure 4.5). Figure 3.8 showed product MON-A09 having no spots of interest to
represent as an example of product having no Tongkat Ali active ingredient.
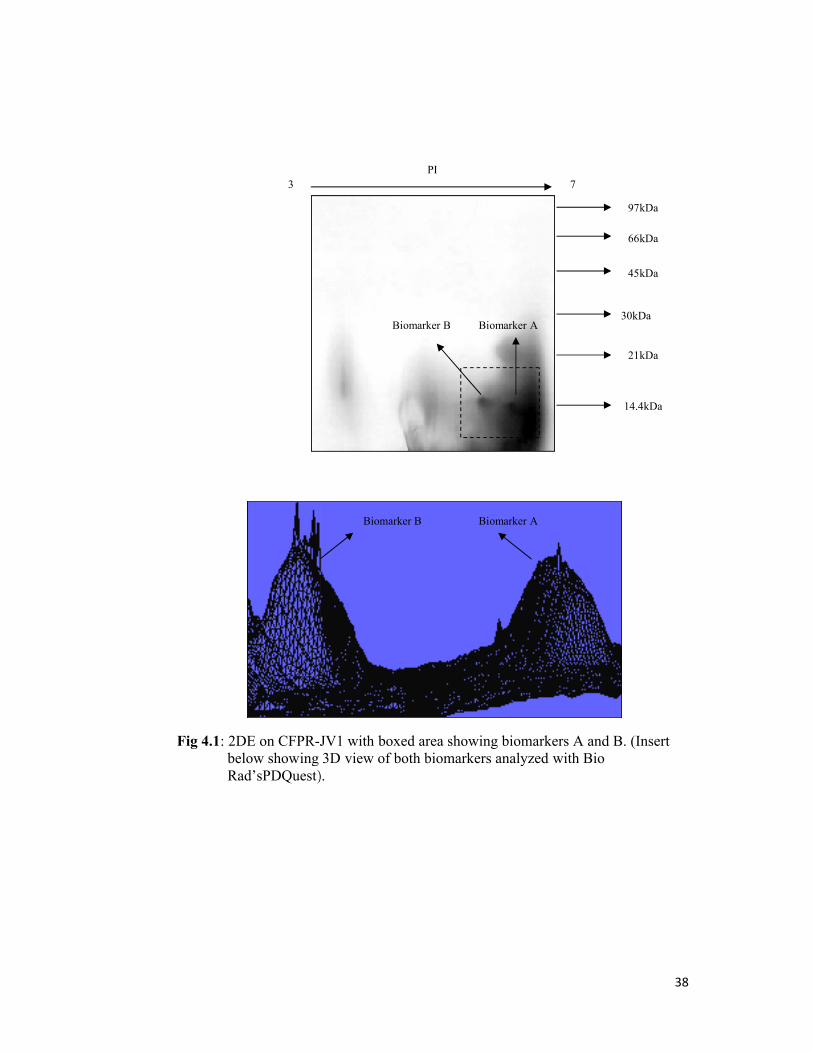
Fig 4.1: 2DE on CFPR-JV1 with boxed area showing biomarkers A and B. (Insert below showing 3D view of both biomarkers analyzed with Bio Rad’sPDQuest).
3
JV1 with boxed area showing biomarkers A and B. (Insert below showing 3D view of both biomarkers analyzed with Bio Rad’sPDQuest).
Biomarker ABiomarker B
7PI
Biomarker ABiomarker B
38
JV1 with boxed area showing biomarkers A and B. (Insert below showing 3D view of both biomarkers analyzed with Bio
14.4kDa
21kDa
30kDa
45kDa
66kDa
97kDa

39
Fig 4.2: 2DE on MON-JV1 with boxed area showing biomarkers A and B. (Insert below showing 3D view of both biomarkers analyzed with Bio Rad’sPDQuest).
14.4kDa
21kDa
45kDa
66kDa
97kDa
73
30kDa
PI
Biomarker ABiomarker B
Biomarker A
Biomarker B

40
Fig 4.3: 2DE on MON-NC with boxed area showing where the biomarkers A and B should be. (Insert below showing 3D view with Bio Rad’sPDQuest).
97kDa
66kDa
45kDa
30kDa
21kDa
14.4kDa
3 7PI

41
Fig 4.4: 2DE on MON-A15 with boxed area showing biomarkers A and B. (Insert below showing 3D view of both biomarkers analyzed with Bio Rad’sPDQuest).
14.4kDa
21kDa
30kDa
45kDa
66kDa
97kDa
73PI
Biomarker A
Biomarker B
Biomarker ABiomarker B
42
Fig 4.5: 2DE on MON-A08 with boxed area showing biomarkers A and B. (Insert below showing 3D view of both biomarkers analyzed with Bio Rad’sPDQuest).
97kDa
66kDa
45kDa
30kDa
21kDa
14.4kDa
73PI
Biomarker ABiomarker B
Biomarker ABiomarker B

43
Fig 4.6: 2DE on MON-A09 with boxed area showing where the biomarkers A and B should be. (Insert below showing 3D view with Bio Rad’sPDQuest).
97kDa
66kDa
45kDa
30kDa
21kDa
14.4kDa
73PI
44
4.3 SUMMARY ON THE SCREENING FOR MARKERS
The investigation was focused on using proteomic for detecting the biomarkers
which caused aphrodisiac activity in Tongkat Ali extracts. As noted previously, 29
products were evaluated in this study (Table 4.3). The 29 products, comprised of two
groups, where 23 products were MOH approved (Table 4.1), while the other 6
products non-MOH approved (Table 4.2). Out of the 29 tested, eighteen
productsshowed clear presence of Tongkat Ali biomarkers A and B (MON-A02,
MON-A04, MON-A05,MON-A06,MON-A07, MON-A08, MON-A11.MON-
A13,MON-A15, MON-A16, MON-A18, MON-A20, MON-A22,MON-A23, MON-
X01, MON-X02,MON-X03, MON-X05) (group A) (Appendix B). While eleven
products (MON-A01, MON-A03, MON-A09, MON-A10, MON-A12, MON-A14,
MON-A17, MON-A19,MON-A21, MON-X04, MON-X06) (group B) (Appendix C)
did not show any biomarker spots.
The group A products verified the usage of proteomics by detecting the protein
biomarkers within them. In the case of group B, despite trials with various
treatments, did not show any positive results. Samples MON-A10, MON-A12 and
MON-A17 showed no positive result for the biomarkers, although they were
repeated 3 times. In the last one the samples were left over night in IEF with 50V
voltage then followed by the usual protocol (Table 3.2). This could be due to the fact
all these three samples were a form of Maajun (a dark colored intoxicating
confection, commonly sold in bazaars in India and Indonesia) (Fig 4.7)which could
have been mixed with other plants. A mixture of plant extracts could interfere with
the focusing in IEF to reachthe desired voltage (5000 V). It is important to reach

45
high voltage in IEF as it is relevant to move the protein to its respective pI. Salt
contamination (ionic constituents) could be one of the reasons for this problem. The
presence of salts could be due to contaminants from other plants. It was known in
2DE, DNA or certain macromolecules such as phenolic components could aggregate
proteins thus disturbing the IEF. It was noticed however, that several of these
products (MON-A03, MON-A09, MON-A14, MON-A19, MON-A21) had no
problems in running 2DE (able to reach high voltage in the last phase) and they were
mixed with other plants.
MON-A01 manufactured in Malaysia which did not show existence of the markers
A and B, is the most famous product from Malaysia and Indonesia, and it was the
only product with claims of US and EURO patent numbers. This product was pure
(Tongkat Ali) and it was repeated 3 times with the same negative results In the third
run the protocol was changed and the sample was left over night in IEF with low
voltage (50V) for 10 hours followed by the usual protocol (Table 3.2). Nevertheless,
neither of the treatments resulted in any biomarker spots. It is likely that the special
extraction technique claimed to be used for this product may have an effect.
MON-X04 and MON-X05 contained very low protein content based on Bradford
assay. In order to accommodate more than 25 mg load, the dry weight content of the
capsule needed to be increased. As such this was an inevitable limitation that did not
allow running of 2DE with higher protein load (eg 50 mg). The load of 25 mg gave
negative results for MON-X04 while for MON-X05 faint spots for both biomarkers
were observed.

46
The last sample MON-X06 did not show any spots. This product from Indonesia was
like a small tough ball which needed to be crashed using pestle and mortar. It was
not possible to run using 50 mg protein samples as the powder became semi solid
upon adding the rehydration buffer, making it very difficult to transfer with a pipette.
This is maybe attributed to the method of preparation of the product.
Figure 4.7: Maajun product (a dark colored intoxicating confection, commonly sold
in bazaars in India and Indonesia).
MON-A12MON-A10
47
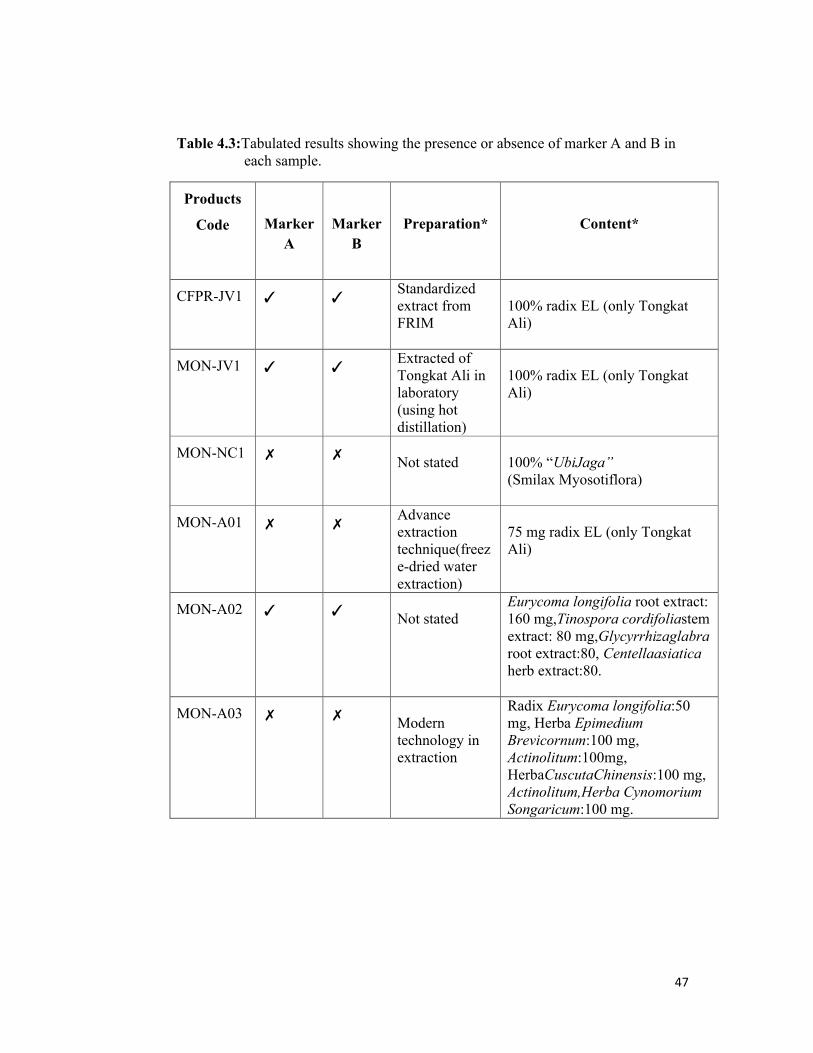
Table 4.3:Tabulated results showing the presence or absence of marker A and B in each sample.
Products
Code Marker A
Marker B
Preparation* Content*
CFPR-JV1 ✓ ✓Standardized extract from FRIM
100% radix EL (only Tongkat Ali)
MON-JV1 ✓ ✓Extracted of Tongkat Ali in laboratory(using hot distillation)
100% radix EL (only Tongkat Ali)
MON-NC1 ✗ ✗ Not stated 100% “UbiJaga”(Smilax Myosotiflora)
MON-A01 ✗ ✗Advance extraction technique(freeze-dried water extraction)
75 mg radix EL (only Tongkat Ali)
MON-A02 ✓ ✓ Not statedEurycoma longifolia root extract: 160 mg,Tinospora cordifoliastem extract: 80 mg,Glycyrrhizaglabraroot extract:80, Centellaasiaticaherb extract:80.
MON-A03 ✗ ✗ Modern technology in extraction
Radix Eurycoma longifolia:50 mg, Herba Epimedium Brevicornum:100 mg, Actinolitum:100mg, HerbaCuscutaChinensis:100 mg, Actinolitum,Herba Cynomorium Songaricum:100 mg.
48
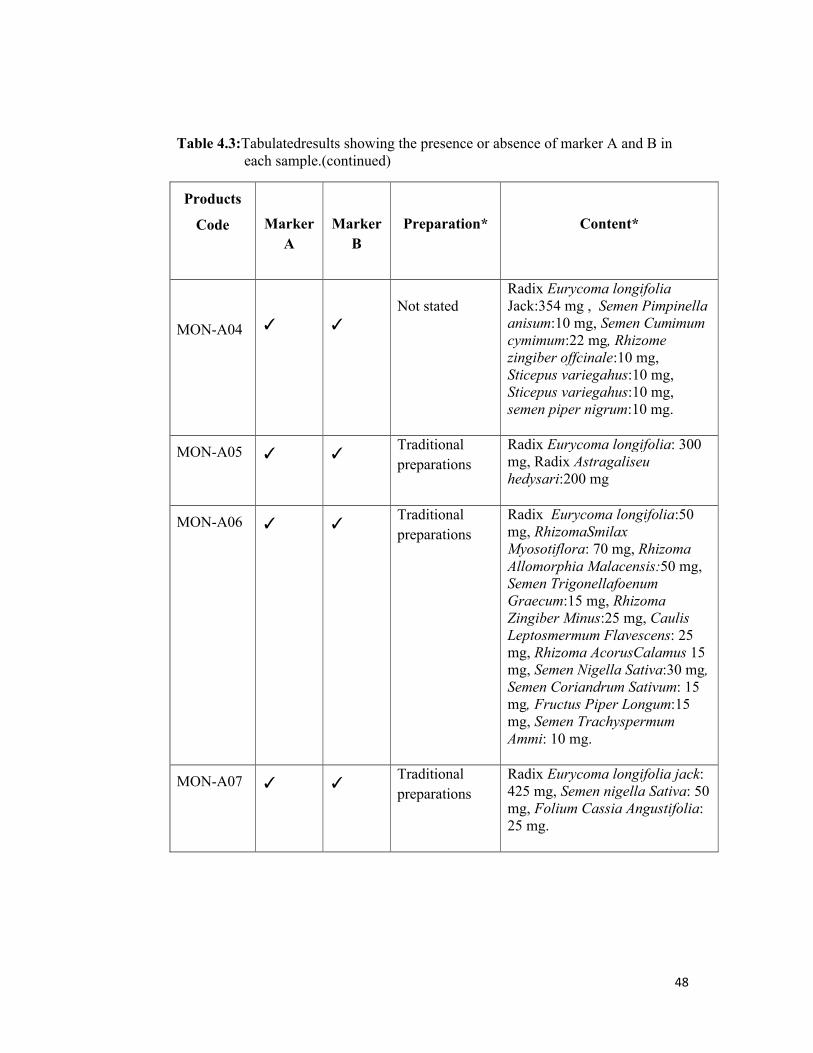
Table 4.3:Tabulatedresults showing the presence or absence of marker A and B in each sample.(continued)
Products
Code Marker A
Marker B
Preparation* Content*
MON-A04 ✓ ✓Not stated
Radix Eurycoma longifoliaJack:354 mg , Semen Pimpinella anisum:10 mg, Semen Cumimumcymimum:22 mg, Rhizome zingiber offcinale:10 mg, Sticepus variegahus:10 mg, Sticepus variegahus:10 mg, semen piper nigrum:10 mg.
MON-A05 ✓ ✓Traditional preparations
Radix Eurycoma longifolia: 300 mg, Radix Astragaliseu hedysari:200 mg
MON-A06 ✓ ✓Traditional preparations
Radix Eurycoma longifolia:50 mg, RhizomaSmilaxMyosotiflora: 70 mg, RhizomaAllomorphia Malacensis:50 mg, Semen Trigonellafoenum Graecum:15 mg, RhizomaZingiber Minus:25 mg, Caulis Leptosmermum Flavescens: 25 mg, Rhizoma AcorusCalamus 15 mg, Semen Nigella Sativa:30 mg, Semen Coriandrum Sativum: 15 mg, Fructus Piper Longum:15 mg, Semen TrachyspermumAmmi: 10 mg.
MON-A07 ✓ ✓Traditional preparations
Radix Eurycoma longifolia jack: 425 mg, Semen nigella Sativa: 50 mg, Folium Cassia Angustifolia: 25 mg.

49
Table 4.3:Tabulated results showing the presence or absence of marker A and B in each sample(continued).
Products
Code Marker A
Marker B
Preparation* Content*
MON-A08 ✓ ✓Not stated
Eurycoma longifolia: 120 mg, Nigella sativa: 100 mg, GlobiaPendula: 50 mg, Curcuma domestica:10 mg, Piper nigri fructus:50 mg.
MON-A09 ✗ ✗Not stated
Root Tongkat Ali Powder Extract:60 mg, Fructus Saw Palmetto Power extract: 120 mg, Pumpkin Seed Powder Extract: 30 mg, Fructus Tribulusterrestrispowder extract: 30 mg, Root muriapuama powder extract:60 mg.
MON-A10✗ ✗
Traditional preparations
Not stated for Tongkat Ali,Herbs coriondrum Sativum: 1.67 gm, Radix Smilax Myositiflora: 0.34 gm, Herb Pimpenella Anisum:0.33 gm, Herbs Cuminum Cyminum:0.33 gm, Seed Nigella Sativa:0.33 gm, Rizom Alpinia Galanga:0.33 gm, Rizom Curcuma Domestica:0.25 gm, Honey:2.59 gm, Sesame oil:0.24 gm, Rizom ZIngeber Officinal:0.25 gm, Flos Eugenia Aromatica: 0.33 gm, HelicteresIsora: 0.17 gm, FructusMyristica Fragrans:0.17 mg, Seed Piper Nigrum:0.17 gm, Semen Tracchyspermum Ammi:0.25 gm.

50
Table 4.3:Tabulated results showing the presence or absence of marker A and B in each sample(continued).
Products
Code Marker A
Marker B
Preparation* Content*
MON-A11 ✓ ✓Not stated
Radix Eurycoma longifolia: 80 mg, Angulliaangullia: 150 mg, Radix Striga Asiatica:100 mg, Zingiber Officinale Rhizome:70 mg, Radix Smilax MyositifloraZingiber :50 mg, Bulbus Allium Sativum:50 mg.
MON-A12✗ ✗
Traditional preparations
Radix Eurycoma longifolia:0.125g , Honey:0.25g, bean oil: 0.175g, Rhizomazingiber officinale:0.025g, Flos Eugenia Aromatica:0.00375g, Herba piper nigrum:0.05g, Herbacroton Caudatum:0.025g, HerbaCoriandrum Sativum:0.0375, Herba Nigella Sativa:0.0125g, Fructus Pimpinella Anisum:0.0125g, Stichopus Variegatus:0.0125g, Morinda Citrifolia:0.125g.
MON-A13 ✓ ✓Traditional preparations
EL 500mg (only Tongkat Ali)
MON-A14 ✗ ✗Traditional preparations
Tongkat Ali water soluble extract: 119.85 mg, Macaextarct/RhizomaLipidummeyenii: 119.85 mg.American Ginseng extract: 119.85 mg.Ginkgo BilobaPowder: 109.51 mg.

51
Table 4.3:Tabulated results showing the presence or absence of marker A and B in each sample(continued).
Products
Code Marker A
Marker B
Preparation* Content*
MON-A15 ✓ ✓ Not statedTongkat Ali water soluble extract: 50 mg (only Tongkat Ali)
MON-A16 ✓ ✓
Traditional preparations
Radix Tongkat Ali: 130.41 mg, Radix achyranthesbindentata: 18.63, mg,Cortexeucommia ulmoides:18.63 mg, radix astrogalus membranaceus bge:18.63 mg.
MON-A17
✗ ✗
Traditional preparations
Radix Eurycoma longifolia jack:2.56g , EuginiaCaryaphylata Fructus:0.105g, Radix Curcumae Zadoarria:0.215g, ZingiberOfficinale roscope:0.215g, Rhizome Cuminum Cyminum:0.125g Semen Piper Nigrum:0.105g, Rhizome Alpina galanga:0.105g, SemenPimpinella Anisum:0.215g , Semencariandrum sativum:065g, Semen nigella sativa:0.6g, Cortexcinnamomum zeylanicum:0.6g, Fructusmyristica fragrans:0.09g.
52
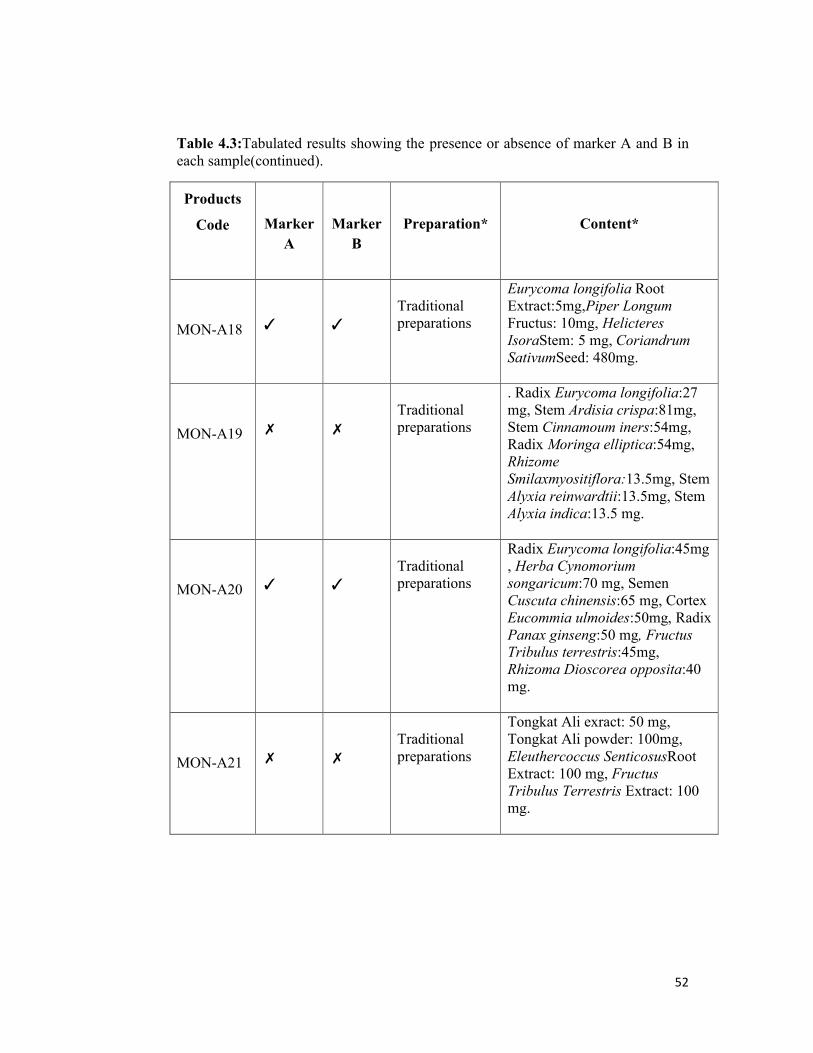
Table 4.3:Tabulated results showing the presence or absence of marker A and B in each sample(continued).
Products
Code Marker A
Marker B
Preparation* Content*
MON-A18 ✓ ✓
Traditional preparations
Eurycoma longifolia Root Extract:5mg,Piper LongumFructus: 10mg, HelicteresIsoraStem: 5 mg, CoriandrumSativumSeed: 480mg.
MON-A19 ✗ ✗
Traditional preparations
. Radix Eurycoma longifolia:27 mg, Stem Ardisia crispa:81mg, Stem Cinnamoum iners:54mg, Radix Moringa elliptica:54mg, Rhizome Smilaxmyositiflora:13.5mg, Stem Alyxia reinwardtii:13.5mg, Stem Alyxia indica:13.5 mg.
MON-A20 ✓ ✓Traditional preparations
Radix Eurycoma longifolia:45mg , Herba Cynomorium songaricum:70 mg, SemenCuscuta chinensis:65 mg, Cortex Eucommia ulmoides:50mg, Radix Panax ginseng:50 mg, FructusTribulus terrestris:45mg, Rhizoma Dioscorea opposita:40 mg.
MON-A21 ✗ ✗
Traditional preparations
Tongkat Ali exract: 50 mg, Tongkat Ali powder: 100mg, Eleuthercoccus SenticosusRoot Extract: 100 mg, FructusTribulus Terrestris Extract: 100 mg.
53
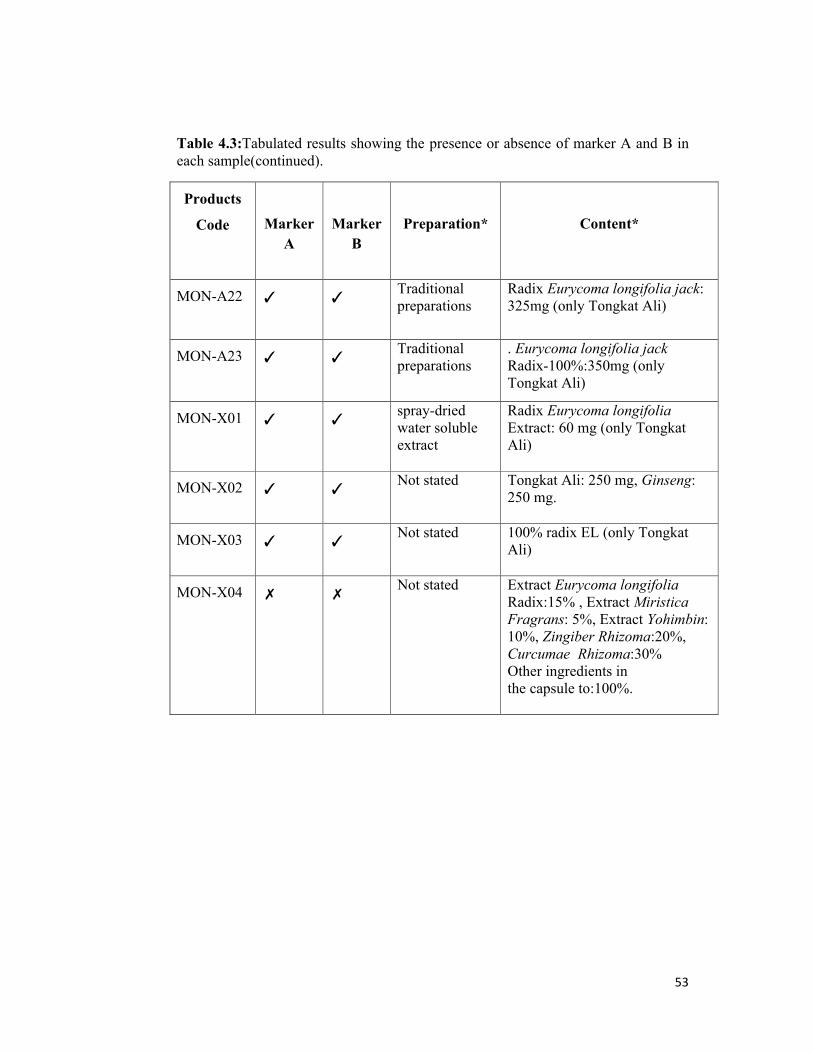
Table 4.3:Tabulated results showing the presence or absence of marker A and B in each sample(continued).
Products
Code Marker A
Marker B
Preparation* Content*
MON-A22 ✓ ✓Traditional preparations
Radix Eurycoma longifolia jack: 325mg (only Tongkat Ali)
MON-A23 ✓ ✓Traditional preparations
. Eurycoma longifolia jackRadix-100%:350mg (only Tongkat Ali)
MON-X01 ✓ ✓spray-dried water soluble extract
Radix Eurycoma longifoliaExtract: 60 mg (only Tongkat Ali)
MON-X02 ✓ ✓Not stated Tongkat Ali: 250 mg, Ginseng:
250 mg.
MON-X03 ✓ ✓Not stated 100% radix EL (only Tongkat
Ali)
MON-X04 ✗ ✗Not stated Extract Eurycoma longifolia
Radix:15% , Extract MiristicaFragrans: 5%, Extract Yohimbin: 10%, Zingiber Rhizoma:20%, Curcumae Rhizoma:30% Other ingredients in the capsule to:100%.

54
Table 4.3:Tabulated results showing the presence or absence of marker A and B in each sample(continued).
Products
Code Marker A
Marker B
Preparation* Content*
MON-X05 ✓ ✓
Not statedRadix EL: 40%, Pantrocinum:10%, Syngnathoides biaculeatus:10%, Panax Ginseng Radix:10%, Yohimbehae:10%, Ganaderma:10%, Hypocampus:10% in the form ofextract.
MON-X06 ✗ ✗Not stated Tongkat Ali Akbar,Some kinds
of flower seeds and herb.
✓: Presence of marker
✗: Absence of marker
*note: as stated within product description on the bottle.
55
4.4 ESI MS/MS ANALYSIS
LC MS/MS was performed on the reduced gel band (biomarker A, approximate
MW: 10 – 14kDa, pI: 7 -10 with silver staining). Using Mascot database search,
peptide mass finger printing results obtained concluded no match. This was expected
as the available database for this species (Eurycoma longifolia) was only four
proteins, which were related to photosynthetic mechanism and none of these proteins
were linked to aphrodisiac activity. Due to insufficient library information, we found
no match to the proteins at these spots. As such we concluded the protein is a novel
one yet to be identified. The service provider suggested de novo sequencing for
selected ions. Sequence coverage of nano LC ESI MS/MS for a gel spot depends on
the amount of protein in the spot, tryptic peptide size, and the peptide ionization
efficiency. It was unlikely toobtain the full amino acid sequence coverage of the
whole protein. The full sequence of certain ions upon de novo sequencing could be
helpful for designing primers.
In general, the ESI-MS/MS run led to fragmentation data on peptides of sufficient
quality to undergo de novo sequence. It was found that a total of ten peptides had
significant fragmentation and could be sequenced well enough (Fig 4.8 to 4.17).
APAF performed the Mascot search for the MS/MS data on all ten peptides and they
suggested these peptides appeared to proteins shown in Table 3.7 and with higher
chances to match to rubber elongation protein. This was confirmed by MS/MS of
1157.6404 peak which had a sequence of DASIQVVSAIR. The ions score was 71
with matched of 26/106 fragment ions using 38 most intense peaks.

56
Nevertheless it was unlikely this protein could be a match to marker A of Eurycoma
longifolia even though it is from a plant species commonly found in Malaysia that is
Hevea brasiliensis (Rubber tree). Nevertheless the sequence of its peptide as well as
others will be useful for future application. De novo sequenced data and the peptides
found in the unassigned peptides list are included in the appendix C.
57
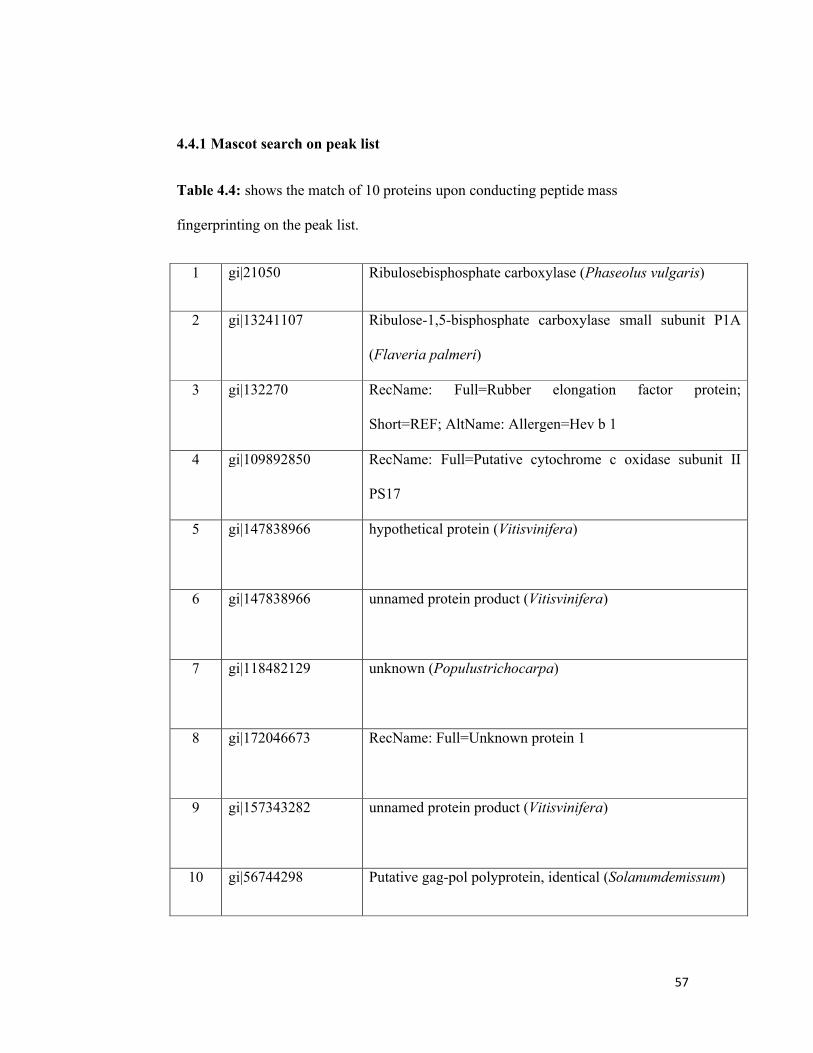
4.4.1 Mascot search on peak list
Table 4.4: shows the match of 10 proteins upon conducting peptide mass
fingerprinting on the peak list.
1 gi|21050 Ribulosebisphosphate carboxylase (Phaseolus vulgaris)
2 gi|13241107 Ribulose-1,5-bisphosphate carboxylase small subunit P1A
(Flaveria palmeri)
3 gi|132270 RecName: Full=Rubber elongation factor protein;
Short=REF; AltName: Allergen=Hev b 1
4 gi|109892850 RecName: Full=Putative cytochrome c oxidase subunit II
PS17
5 gi|147838966 hypothetical protein (Vitisvinifera)
6 gi|147838966 unnamed protein product (Vitisvinifera)
7 gi|118482129 unknown (Populustrichocarpa)
8 gi|172046673 RecName: Full=Unknown protein 1
9 gi|157343282 unnamed protein product (Vitisvinifera)
10 gi|56744298 Putative gag-pol polyprotein, identical (Solanumdemissum)
58
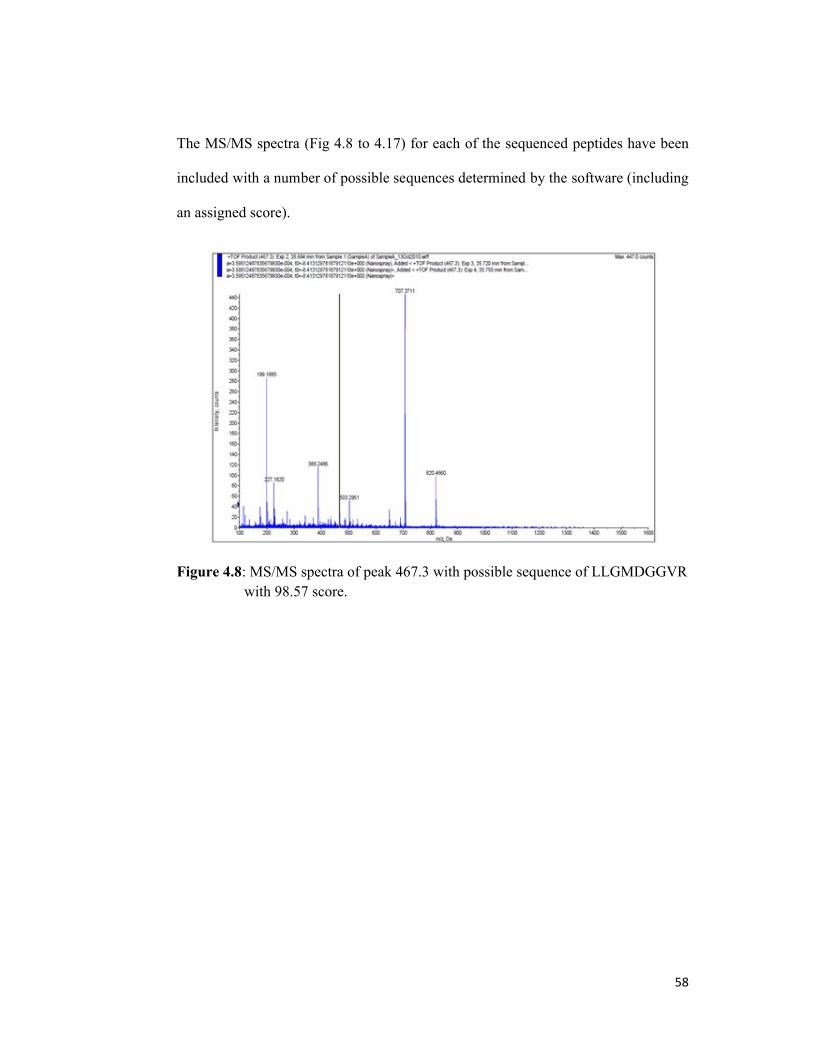
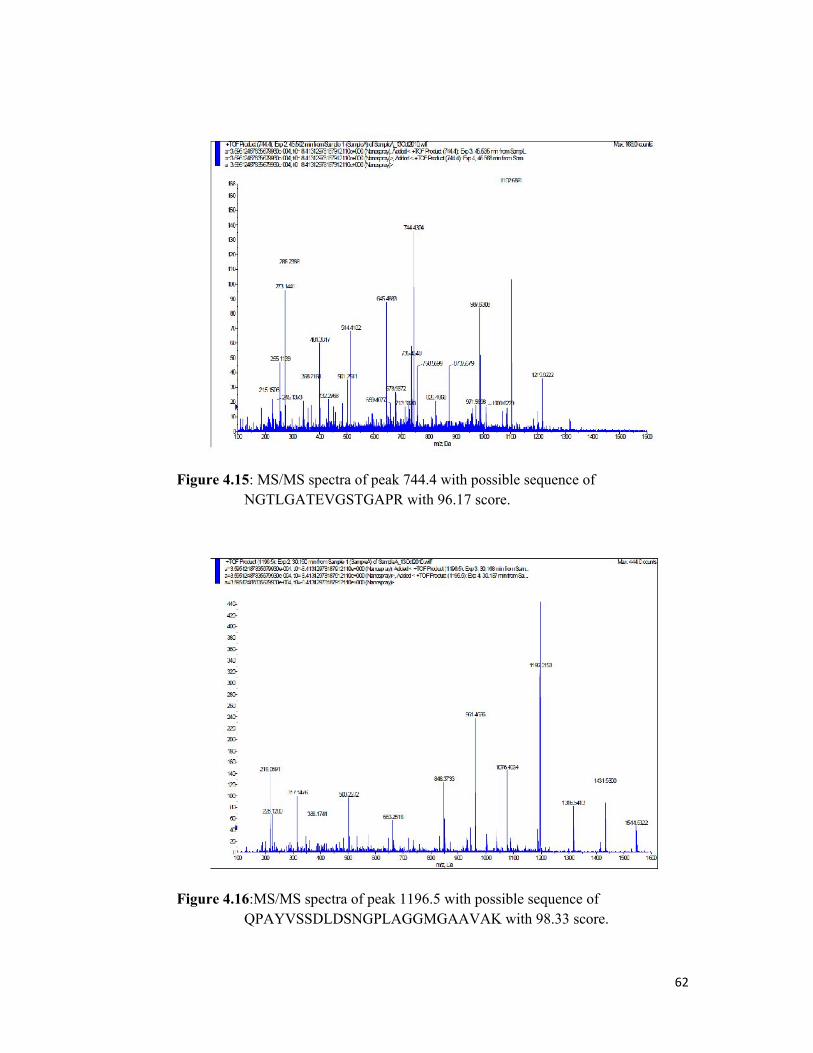
The MS/MS spectra (Fig 4.8 to 4.17) for each of the sequenced peptides have been
included with a number of possible sequences determined by the software (including
an assigned score).
Figure 4.8: MS/MS spectra of peak 467.3 with possible sequence of LLGMDGGVR with 98.57 score.

59
Figure 4.9: MS/MS spectra of peak 530.8 with possible sequence of TLLDDAGLDK with 98.15 score.
Figure 4.10: MS/MS spectra of peak 590.3 with possible sequence of YEELGALTAGR with 99.44 score.

60
Figure 4.11: MS/MS spectra of peak 613.6 with possible sequence ofYDCPNGGALASGFGAAVAK with 100.00 score.
Figure 4.12: MS/MS spectra of peak 627.8 with possible sequence ofDMSGAGGAGMAVAK with 91.69 score.

61
Figure 4.13: MS/MS spectra of peak 711.3 with possible sequence of TQGASMYGMTLMGYGPGYAK with 97.61 score.
Figure 4.14:MS/MS spectra of peak 742.4 with possible sequence ofTSAAHHVTEGEGGGEGAMLGGAGR with 100.00 score.
62
Figure 4.15: MS/MS spectra of peak 744.4 with possible sequence of NGTLGATEVGSTGAPR with 96.17 score.
Figure 4.16:MS/MS spectra of peak 1196.5 with possible sequence ofQPAYVSSDLDSNGPLAGGMGAAVAK with 98.33 score.

63
Figure 4.17:MS/MS spectra of peak 1204.5 with possible sequence of QGPGGSSGGYEVCLPTAGGDSGSVAK with 96.13 score.
64
4.5 DISCUSSION AND CONCLUSSION
There were very significant difference in protein content among the samples
ranging from the highest 11.2840μg protein per mg sample (MON-A08) to the
lowest 0.3734 μg protein per mg sample (MON-X04) (Table 4.1). These differences
could be one of the reasons why some samples produce markers while others do not.
Some samples, MON-X04 for instance was found to have a low protein content and
hence it is not surprising that the markers were not detected at all in 2D-GE, though
it is equally possible that the markers are not present. Nevertheless, for the sake of
product evaluation, these products can be safely ‘rejected’ because it may not have
pharmaceutical affects whatsoever since the active constituents are present only in
negligible amounts. Levels of each product in E. longifolia extract varied
significantly (Table 4.3). Hence for some product, there is a possibility that the
markers are present in minute amounts even though the protein content is high. For
all products that did not show presence of any marker when 25 µg of protein was
used, further investigation was performed with 50 µg of protein. Again however, it
remains questionable whether such a low quantity of biomarkers can really elicit any
aphrodisiac effect on the capsules taken. Further evaluation was required in the event
the biomarker is detected at 25 µg protein load, whether the product will show
efficacy on humans.
Among the 23 MOH approved products, 14 showed presence of marker A
and B. The same markers appeared in 4 out of the 6 MOH unapproved products
tested. This means, 60.9% of the approved products and 66.7% of the unapproved
products contained the markers. Overall 62.1% of all tested samples (excluding

65
positive and negative controls) had the markers. In terms of irregularities, MON-A10
was a product labelled as E. longifolia herbal supplement, but did not have E.
longifolia in its ingredient information. This questions the role of MOH in the
control of E. longifolia products in the market. A surprising 37.9% of the approved
and marketed products did not have the markers, and possibly there are many more
products which do not contain E. longifolia thatmay have been given the green light
by MOH and sold in pharmacies all around the country as well as exported to other
countries in the world. There are currently 224 E. longifolia MOH approved
products that are registered under Malaysian National Pharmaceutical Control
Bureau (NPCB), which is a body under MOH that is responsible in the regulation of
pharmaceutical products in the country (NPCB, 2011). It is likely that NPCB has no
real means of validating the presence of E. longifolia in the products other than
assessing the application forms filled by the manufactures and investigating the lead
load and microbial content in the products. Therefore, the markers will be very
useful in this case, to help in the screening of products for the presence or absence of
E. longifolia extract. With these biomarkers, NPCB can quickly reject any new
product alleged to contain E. longifolia extract, but do not show the presence of
markers A and B in 2DE.
The markers are only meant for E. longifolia. It is nevertheless possible
though for products lacking in the biomarkers to still show aphrodisiac activity due
to incorporation of other ingredients. Plants with aphrodisiac activity such as S.
myosotiflora, E.brevicornum, C.songaricum, Yohimbine, etc have been known to be
included in some of the products, possibly to enhance the power and potency of the
concoction (Burkill, 1966; Yonezawaet al, 2005; Chen and Chiu, 2006; Damayanthi

66
et al, 2011andHuipinget al, 2011). Besides that, there is a possibility that
manufacturers may have used immature E. longifolia root and even bark in their
products (Cash, 2010). Doubts on the authenticity of the materials used may arise
because E. longifoliaare not cultured and harvested as an agricultural crop. Their
quantities are not obtained in bulk and their supply is not consistant. They are
generally found in the jungle as rare plants (especially mature ones). It is also
possible for certain unscrupulous manufacturers to incorporate acetildenafil into their
E. longifolia products (Becoat, 2006). Acetildenafil is a sildenafil analogue which
has not undergone human testing yet.
It must be noted that the sample size of the unapproved products was small
compared to the approved ones because of the difficulty to obtain them. The
unapproved products were not available in any registered pharmacy. However, we
still managed to get samples from small roadside and market stalls. Though the
sampling size was relatively small, however quite a number of the unapproved
products contained the markers as well. Despite the lack of quality control and
regulation by pharmaceutical bodies, most of the MOH unapproved products still
retained the biomarkers. The efficacy of these unapproved products might match or
be even better than the approved ones, although there are still risks of other
contaminants (fungi and bacteria and heavy metals) which are supposed to be tightly
regulated by NPCB. The reason why most MOH unapproved products contains the
biomarkers can be due to the fact that E. longifolia extract can be obtained easily
with little processing. This was demonstrated by the positive results with MON-JV1
which was extracted in our laboratory.
67
Markers A and B always appear together, but in most cases, the former is
more prominent and conspicuous (especially when the protein spots are faint)
compared to the latter (Fig 4.1- Fig 4.5). Hence, it appears that marker A is the more
suitable biomarker that can be used for E. longifolia validation purposes by NPCB.
For this reason, marker A was chosen for further characterization and analysis.
Marker A was isolated as a gel plug and was sent to APAF for 1D nanoLC ESI
MS/MS run. The results were somehow as predicted. Owning to the fact that there
are only four protein entries from the plant E. longifolia in the NCBI database (Tee
and Azimahtol, 2005),it is therefore not surprising that the peptide fingerprint did not
match any of the four proteins (all of which are related to the chloroplast and nuclear
phylogenetic marker including AtpB, Ribulose-1,5-bisphosphate
carboxylase/oxygenase subunit, PhyC and Maturase K). Hence, there is a high
probability that this protein is novel, at the very least, for this plant. However, it was
matched to an unrelated protein (rubber elongation factor protein) from the plant
Heveabrasiliensisand several other plant proteins such as the ribulosebisphosphate
carboxylase and Putative cytochrome c oxidase subunit II PS17(Table 4.4). Hence,
there is a high probability that marker A is a novel and unreported protein. It also has
the potential to be one of the bioactive proteins that is responsible for E. longifolia
aphrodisiac activity. Whether the protein within marker A has similarities to the
Eurypeptide reported in the media is difficult to ascertain as no records on the
sequence can be obtained for comparison (Sambandanet al., 2004). It is difficult to
obtain a full protein sequence based on gel plugs.
2DE is the ideal method for the study of E. longifolia proteome. Firstly, due
to reporteds suggesting that the active constituent for aphrodisiac activity of E.
68
longifolia being protein related, and hence the choice for the use of 2DE
(Sambandan et al., 2004).Secondly, 2DE has a high separation resolution. Being able
to separate proteins based on their charge and size, that is, it helps in the separation
of marker A, B and other proteins in herbal products. Otherwise, they will remain
together if they were to be separated by SDS-PAGE alone. Besides that, the chosen
method was relatively quick and cheap.
Future research work should include the isolation of marker A and B by
utilizing conventional chromatography technique generally used to purify proteins
(size-exclusion, ion-exchange, or hydrophobic interaction chromatography) and
establishing their full sequence. Both of these will be useful in elucidating their
function. The isolated proteins can then be tested on mice. The information will be
useful in validating more products, especially the MOH unapproved ones to further
support the findings of this study [i.e. that most MOH approved and unapproved
products do contain the markers and the extraction of E. longifolia root extract is
indeed simple and its proteins are not easily denatured through high temperature
processing (> 80 °C)]. Somatic embryogenesis and direct plant regeneration
techniques need to be further exploited to culture and produce this plant in large
quantities. This would help in reducing the price of E. longifolia so that its
pharmacological goodness can be enjoyed by all, while preserving natural forest
resources.