chapter 5 analysis of results and discussion 5.0 …
TRANSCRIPT
137
Chapter 5 ANALYSIS OF RESULTS AND DISCUSSION
5.0 Introduction
The mainstream research methodology, views reality is understood by empirical and
analytical methods. Hence, following previous chapter (Chapter 4) that explains on the
research design and method of analytical procedures, this chapter discusses the analysis
from both proxies of financial reporting quality (fraudulent financial reporting and
earnings management). This chapter explains each analysis of each proxies starting
with the univariate analysis and followed by the multivariate analysis. Subsequently,
will be followed with discussion on findings, and summary of findings at the end of the
chapter.
5.1. Fraudulent Financial Reporting
5.1.1 Descriptive Analysis
Descriptive analysis uses the paired t-tests to determine whether there are any
significant differences for the sample and the control sample. The analysis includes the
univariate tests and Pearson‟s correlation tests between the dependent variable (fraud
and no fraud companies) and independent variables consisted of AC members with
professional accounting affiliations, AC members with senior managerial experience,
AC members with postgraduate qualifications, audit committee size, board‟s size, audit
committee independence, agelisted, leverage, firm size, and management ownership.

138
5.1.1.1 Sectors in Sample
Table 5.1, shows the sectors that are involved under the sample, and findings are
consistent with Ismail et al. (2008). Where highest occurrences are in Trading and
Services sector at 28.6 percent for current study, and 25.9 percent for Ismail et al.
(2008)13
.
Table 5.1 Sectors in Fraud Sample
Sectors This Study
Frequency (%)
Ismail et al.
(2008)
(%)
Construction 8 (7.1) 10 (9.3)
Consumer Products 15 (13.4) 8 (7.4)
Finance 7 (6.3) 20 (18.5)
Industrial Products 25 (22.3) 22 (20.4)
Plantations 9 (8.0) 12 (11.1)
Properties 4 (3.6) 8 (7.4)
Technology 12 (10.7) Nil
Trading and Services 32 (28.6) 28 (25.9)
N 112 108
Table 5.2 Fraud Frequency for 2001-2007
Year Frequency Total Firms’
Population
Percentage
(%)
2001
4
812
0.49
2002 4 868 0.46
2003 5 906 0.55
2004 4 963 0.41
2005 2 1021 0.19
2006 6 1027 0.58
2007 3 987 0.30
TOTAL 28
13 Ismail et al. (2008) measures corporate reporting quality from the companies selected in the NACRA (National Annual Corporate
Report Award) for having good financial reporting.
139
Table 5.2, shows the frequency of fraud occurrences from 2001-2007, with the total of
28 fraud cases and giving final sample at 112. This is consistent with Sharma et al.
(2009) who has final sample of 96 firm years in examining determinants of audit
committee meetings in New Zealand, and Owens-Jackson et al. (2009) that show small
number of fraud firms according to the SEC AAER from 1994 to 2001, when they
recorded 50 fraud firms. The percentage of fraud occurences since 2001, consistent
with many previous research in fraud (see Beasley, 1996, Owens-Jackson et al., 2009
and O‟Connor et al., 2006). The relative infrequency of fraudulent financial reporting
consistent with O‟Connor et al. (2006) that reported in the US, 65 fraud firms from
9600 US public companies.
5.1.1.2 Univariate Analysis
Table 5.3 shows univariate analysis. Panel A represents whole sample, and Panel B
shows the descriptive of mean, standard deviation, median, minimum and maximum.
Assets are in Ringgit Malaysian (RM)14
.
Panel A shows that mean for audit committee members with senior managerial
experience, EXP, is higher than those with accounting affiliations (ACC) and
postgraduate qualifications (PG). Board size has a mean of 7, consistent with Zhang et
al. (2007), and Abbott et al. (2004) at 6.98, but slightly lower than Abdullah (2004)
who recorded at 7.68 in a year 1996 sample of main board companies prior the regional
asian crisis in 1997-1998, and Rahman and Ali (2006) at 8.89. Consequently, the
average board size in this study is consistent with other studies in the US and Malaysia.
Audit committee independence (ACINDP) reached the required 2/3 majority of
independence as proposed in the MCCG, and a mean of 0.6914, which is consistent
14 As at 31st December 2009, Malaysia Ringgit to US dollar is, RM1.00=USD 0.292.

140
with Bliss et al. (2007) at 0.64, that utilised Malaysian companies too. However, it is
lower than Zhang et al. (2007) at 0.92, because the former utilises US companies that
may have stronger legal requirements. LEVERAGE‟s mean is 0.5556 which is
consistent with Bliss et al. (2007), but higher than Sharma et al. (2009) and Rahman
and Ali (2006). FIRMSIZE is recorded at 11.985, higher than Rahman and Ali (2006) at
6.25.

141
Table 5.3 Univariate Analysis for Fraud Sample
Panel A : Overall Sample
N = 112
Variable Mean Standard
deviation
Minimum Median Maximum Mean
difference
F tests p value
FRAUD 0.25 0.435 0 0 1
ACC 0.3403 0.1674 0 0.3333 1 -0.089 1.148 0.286
EXP 0.8403 0.2279 0 1 1 0.064 1.909 0.170
PG 0.2699 0.2414 0 0.3333 1 0.028 3.319 0.071*
ACSIZE 3.24 0.651 2 3 5 -0.024 0.364 0.547
MGTOWN 16.9384 19.8225 0 8.002 88.76 -9.455 6.675 0.011**
BODSIZE 7.17 1.907 3 7 12 -0.369 0.005 0.944
ACINDP 0.6914 0.1177 0.33 0.6914 1 -0.009 6.446 0.013**
AGELIST 11.1339 10.864 0 9 51 -0.131 0.010 0.922
FIRMSIZE 11.9852 2.3871 0 11.9747 16.15 -0.887 1.514 0.221
LEV 0.5556 0.9195 0 0.3707 7.31 0.202 0.535 0.466
**,*, significant at 5% and 10% level. Note : ACSIZE=Number of AC member; BODSIZE=Number of directors on board; ACINDP=Proportion of independent AC members to size of AC;
AGELIST=Total number of years the company had been listed; LEV=Total liabilities to total assets; FIRMSIZE=Natural log of firm‟ total assets;
MGTOWN=Percentage of shares owned by directors; ACC=Proportion of AC members with professional accounting affiliations; EXP=Proportion of AC members
with senior managerial experience; PG=Proportion of AC members with postgraduate qualifications.

142
For the t-test as in Table 5.3, the ACINP has a significant p value at 5 percent level,
suggesting there is a difference between fraud and non-fraud firms where audit
committees independence, is concerned. This is consistent with Abbott et al. (2004),
and Bronson et al. (2009) that show significant audit committee independence between
going concern reports and clean reports firms. Audit committee independence shows
differences in the minimum and maximum values. Where the fraud sample ranges from
0.60 to 0.80. Whereas the non-fraud sample shows a wider range from 0.33 to 1.
Suggesting that the fraud firms audit committee independence is limited between 60 to
80 percent of the audit committee size only, as compared to the control sample that has
a more flexible dispersion of independent audit committees.
MGTOWN is significant, where, the mean differences between fraud and non-fraud
firms show that fraud firms have lower managerial ownership at 9.85 percent, as
compared to the control firms at 19.3 percent. This may suggest that the control firms or
non-fraud firms have higher management ownership than the fraud firms, which is
consistent with Abbott et al. (2004) and Abdullah (2006) that documented a significant
difference between non-distressed and distressed firms in 2001, where the managerial
ownership showed 28.17 and 14.59 consecutively for non-distressed and distressed
firms. The result shows a non-significant board size and firms‟ size between fraud and
non-fraud firms‟ consistent with Carcello and Nagy (2004a). Suggesting that board‟s
size has no influence on FFR.

143
Table 5.4 Univariate Analysis for Fraud and Non Fraud Firms
Fraud = 28, Non Fraud = 84
Variables
Mean Std Dev Median Minimum Maximum
ACC
Fraud
Non-fraud
0.273
0.363
0.139
0.171
0.333
0.333
0
0
0.67
0.67
EXP
Fraud
Non-fraud
0.889
0.824
0.220
0.229
1
1
0
0
1
1
PG
Fraud
Non-fraud
0.292
0.263
0.294
0.223
0.292
0.333
0
0
1
0.75
ACSIZE
Fraud
Non-fraud
3.32
3.35
0.612
0.668
3
3
3
2
5
5
MGTOWN
Fraud
Non-fraud
9.847
19.30
16.108
20.456
4.1
11.31
0
20.456
75
88.76
BODSIZE
Fraud
Non-fraud
6.89
7.26
1.912
1.908
7
7
4
3
10
12
ACINDP
Fraud
Non-fraud
0.684
0.694
0.042
0.133
0.667
0.667
0.60
0.33
0.80
1
AGELIST
Fraud
Non-fraud
11.036
11.167
10.727
10.972
7.5
9
0
0
45
51
FIRMSIZE
Fraud
Non-fraud
11.324
12.211
3.328
1.942
11.772
12.204
0
0
15.18
16.15
LEV
Fraud
Non-fraud
0.707
0.505
1.013
0.887
0.493
0.327
0
0
5.11
7.31
Note : ACC=Proportion of AC members with professional accounting affiliations; EXP=Proportion of
AC members with senior managerial experience; PG=Proportion of AC members with postgraduate
qualifications; ACSIZE=Number of AC member; BODSIZE=Number of directors on board;
ACINDP=Proportion of independent AC members to size of AC; AGELIST=Total number of years the
company had been listed; LEV=Total liabilities to total assets; FIRMSIZE=Natural log of firm‟ total
assets; MGTOWN=Percentage of shares owned by directors.

144
5.1.1.3 Correlation
Test of correlation is used to test the degree of relationships between the variables under
study. The objective of the test is to see if there are any multicollinearity problems
among the variables. The problem exists if independent variables are highly correlated
at each other with correlation values exceeding 0.9 according to Tabachnick and Fidell
(2007). However, none of the variables found to be more than 0.5.
Table 5.5, shows the correlation matrix between fraud and other variables. From the
table, ACC has a negative and significant association with fraud, suggesting that audit
committee with professional qualification is negatively associated with fraud, or the
higher the number of accounting affiliated audit committees, the lower the incidence of
fraud. This association helps to answer the second research question on the association
of audit committee experts with financial reporting quality. However, ACC is positively
significant with management ownership, suggesting as management ownership
increases, the number of accounting affiliated audit committees increases too.
ACSIZE, is positive and significantly associated to board size, consistent with Baxter
and Cotter (2009). This is because as the number of board size increases, the number of
audit committee increases too since, audit committee members are also among the board
members. MGTOWN has a negative and significant relationship with fraud, firmsize
and age listed in public, consistent with Mitra et al. (2007) that managers with high
ownership interest are less likely to misreport financial results. This may also suggest
that, higher number of management ownership may help to reduce the likelihood of
fraud and is consistent with the t-test shown in Table 5.3, that management ownership
is lower on fraud firms, as compared to their control firms.

145
Table 5.5 Pearson’s Correlation for Fraud Sample
*,**significant at 5% level (2-tailed and 1% level (2-tailed). Note : ACSIZE=Number of AC member; BODSIZE=Number of directors on board; ACINDP=Proportion of independent AC members to size of AC;
AGELIST=Total number of years the company had been listed; LEV=Total liabilities to total assets; FIRMSIZE=Natural log of firm‟ total assets;
MGTOWN=Percentage of shares owned by directors; ACC=Proportion of AC members with professional accounting affiliations; EXP=Proportion of AC members
with senior managerial experience; PG=Proportion of AC members with postgraduate qualifications.
FRAUD ACSIZE BODSIZE ACINDP AGELIST LEV FIRMSIZ
E
MGTOW
N
ACC EXP PG
FRAUD
1 -0.016 -0.084 -0.037 -0.005 0.0096 -0.163 -0.207* -0.233** 0.123 0.052
ACSIZE
1 0.417** -0.067 0.324* 0.019 0.084 -0.127 -0.271** -0.017 0.117
BODSIZE
1 0.154 0.026 -0.178 0.123 -0.003 -0.178 -0.143 0.043
ACINDP
1 0.079 0.068 -0.003 0.042 -0.079 0.111 0.172
AGELIST
1 0.022 0.180 -0.240* -0.169 0.164 0.159
LEV
1 -0.017 -0.044 0.085 0.045 0.0094
FIRMSIZE
1 -0.209* -0.002 -0.030 -0.136
MGTOWN
1 0.195* 0.117 -0.047
ACC
1 0.014 -0.169
EXP
1 0.308**
PG
1

146
5.1.2 Multivariate Analysis
In order to determine if the results of the univariate tests adequately distinguished
between the fraud and non-fraud firms when alternative control mechanisms are
considered. A series of logistic regression of the sample on the control variables are
conducted. A binary logistic regression is performed on fraud as the outcome, with ten
predictors namely, accounting affiliates AC, AC with postgraduate qualification, AC
with experience at senior managerial position, boardsize, leverage, firm‟s size, age
listed, management ownership, audit committee size, and audit committee
independence. The analytical procedure is applied to answer the second research
question on the association or relationship of the audit committee experts on financial
reporting quality, and to test the following hypotheses:
H1: Firms with a higher proportion of audit committee members with professional
accounting affiliations, are less likely to experience fraudulent financial reporting.
H2: Firms with a higher proportion of audit committee members with postgraduate
qualification, are less likely to experience fraudulent financial reporting.
H3: Firms with audit committee members who have experiences in senior
managerial positions, are less likely to experience fraudulent financial reporting.
Table 5.6, shows the logistic regression analysis for the fraudulent financial reporting.
Pseudo R square for Model 1 and Model 2, are 0.173 and 0.198 respectively, consistent
with prior studies Krishnan and Lee (2009) at 0.083, Raghunandan and Rama (2007) at
0.08, Aier et al. (2005) at 0.0533 and Carcello and Nagy (2004a) at 0.13. The Hosmer
and Lemeshow Test show all models with non significant results indicating that the
models are good models (Tabachnick and Fidell, 2007), consistent with Carcello and
Nagy (2004a; 2004b). Model 1 and 2 are correctly classified at 78.2 percent.

147
Model 1, shows the control variables with the variables of interest, i.e. ACC, EXP and
PG. Four variables are significant. Other than MGTOWN and FIRMSIZE, ACC and
EXP are significant. ACC, audit committee members with professional accounting
affiliates is negatively significant at 5 percent level, consistent with Abbott et al. (2004).
While, EXP, audit committee members with managerial experiences is positively
significant at 10 percent level.
Model 2, introduces the interaction variables of the variables of interests namely the
ACC, EXP and PG. MGTOWN and FIRMSIZE continue to be significant. Management
ownership is significant, consistent with Chen et al. (2006) that document management
ownership to be a significant determinant of corporate performance, where management
ownership is negative and significant to corporate performance. The ACC variables are
found to be negatively correlated and significant at 10 percent level with the incidence
of fraudulent financial reporting in both models, consistent with Abbott et al. (2007),
Abbott et al. (2004) and Lin et al. (2006). ACC denotes for accounting affiliated
directors, are significant, thus supports the hypothesis (H1) that firms with higher
proportion of audit committee members with professional accounting affiliations, are
less likely to experience financial reporting.
Board size is negatively correlated though not significant, with fraudulent financial
reporting, consistent with Karamonou and Vafeas (2005), and Beasley (1996) that noted
certain characteristics of outside directors and board size, significantly affect the
likelihood of fraudulent financial reporting. Larger boards may suggest that they acquire
more diverse skills and opinions among its members, and are better equipped to acquire
and evaluate information about the firm (Amason and Sapienza, 1997). While age listed
has a negative association with the likelihood of fraud, consistent with Beasley (1996),

148
Carcello and Nagy (2004a) and Abbott et al. (2004). And leverage has a positive
relationship, consistent with the coefficients in Owens-Jackson et al. (2009),
Raghunandan and Rama (2007) and Aier et al. (2005).

149
Table 5.6 Logistic Regression Analysis of Audit Committee Expertise Composition
and Fraudulent Financial Reporting
Regression Model
Model 1 : FRAUD = α + β1ACSIZE + β2BOARDSIZE + β3ACINDP + β4AGELIST +
β5LEVERAGE + β6FIRMSIZE + β7MGTOWN + γ1ACC + γ2EXP + γ3PG + εi
Model 2 : FRAUD = α + β1ACSIZE + β2BOARDSIZE + β3ACINDP + β4AGELIST +
β5LEVERAGE + β6FIRMSIZE + β7MGTOWN + γ1ACC + γ2EXP + γ3PG + γ4ACC*EXP +
γ5ACC*PG + γ6 EXP*PG + εi
Predicted
Relation
Model 1 Model 2
Independent Variable Coef. p-value Coef. p-value
Intercept None 3.8579 0.1540 5.3870 0.0842
ACSIZE - -0.2264 0.6206 -0.1035 0.8267
BOARDSIZE - -0.0456 0.7776 -0.0505 0.7648
ACINDP - -1.6995 0.4378 -0.9866 0.6541
AGELIST - -0.0205 0.4184 -0.0202 0.4230
LEVERAGE - 0.2714 0.2630 0.3259 0.2085
FIRMSIZE - -0.2008 0.0460**
-0.2109 0.0347**
MGTOWN - -0.0408 0.0252**
-0.0394 0.0288**
ACC - -4.4256 0.0174**
-12.909 0.0985*
EXP - 2.2434 0.0723*
-1.2749 0.6215
PG - -0.7396 0.4801 -2.854 0.6402
ACC*EXP - 12.266 0.1642
ACC*PG - -6.7558 0.3400
EXP*PG - 4.3463 0.5149
N 112 112
Pseudo R
0.173 0.198
Hosmer and Lemeshow
test
0.847 0.564
Correct prediction 78.2% 78.2%
**, * significant at 5% , 10% level (2-tailed).
Dependent variable =1, if fraudulent financial reporting, 0 otherwise.
Note : ACSIZE=Number of AC member; BODSIZE=Number of directors on board;
ACINDP=Proportion of independent AC members to size of AC; AGELIST=Total number of years the
company had been listed; LEV=Total liabilities to total assets; FIRMSIZE=Natural log of firm‟ total
assets; MGTOWN=Percentage of shares owned by directors; ACC=Proportion of AC members with
professional accounting affiliations; EXP=Proportion of AC members with senior managerial experience;
PG=Proportion of AC members with postgraduate qualifications.

150
Model 2 shows interactions among the variables of interests, showing that the
interactions of ACC and EXP is marginally significant. (Difference between the fraud
and non-fraud on one treatment variable varied depending on the level of the second
treatment variable.) A partial F test is carried out on the coefficients of ACC, EXP and
the interaction of ACC and EXP (Dielman, 2006; Hair et al., 2006).
FRAUD = α + β1ACSIZE + β2BODSIZE + β3ACINDP + β4AGELIST + β5LEV +
β6FIRMSIZE + β7MGTOWN + γ1ACC + γ2EXP + γ3PG + γ4ACC.EXP +
γ5ACC.PG + γ6EXP.PG + εi
To find out if ACC has a significant effect on the probability of fraud, thus the
differentiation is :
Hence, to test if the coefficients are significantly different than zero;
H0 : γ1 + γ4 EXP + γ5 PG = 0
FRAUD = α + β1ACSIZE + β2BODSIZE + β3ACINDP + β4AGELIST +
β5LEV + β6FIRMSIZE + β7MGTOWN + γ1ACC + γ2EXP + γ3PG +
γ4ACC.EXP + γ5ACC.PG + γ6EXP.PG + εi
δFRAUD = γ1 + γ4 EXP + γ5 PG
δACC

151
Table 5.7 Coefficents Test (Wald Test)
Test Statistic Value df Probability
F-statistic 5.429725 (1, 96) 0.0219
Chi-square 5.429725 1 0.0198
Null Hypothesis Summary:
Normalized Restriction (= 0) Value Std. Err.
β1+ 0.8403*γ1 + 0.2699*γ2 -4.425497 1.899211
From Table 5.7, using the mean values (e.g. Gul et al., 2009) of EXP = 0.8403 and PG
= 0.2699, it is found that the coefficients are significant and negatively different than
zero (p-value = 0.0219), suggesting that ACC with the presence of EXP, under the
average number of directors with EXP and PG, has a small diminishing effect on the
probability of fraud (value = -4.42549). The findings are robust to the different ways of
measuring ACC, similar to Zhang et al. (2007) supported by Qin (2006), where
accounting literate professionals are related to good quality of reported earnings.
The expected change in fraud might be lower for firms with more ACC. Without the
interaction it is assumed that ACC had a constant effect on fraud, but the interaction
term tells that this relationship changes depending on EXP. It does not mean that the
effects of ACC or EXP by themselves are unimportant, but instead the interaction term
complements their explanation of fraud.

152
Additionally, to find out if EXP has any significant effect on the probability of fraud,
thus the differentiation is :
Hence, to test if the coefficients are significantly different than zero;
H0 : γ2 + γ4 ACC + γ6 PG = 0
Table 5.8 Coefficents Test (Wald Test)
Test Statistic Value df Probability
F-statistic 0.175763 (1, 96) 0.6760
Chi-square 0.175763 1 0.6750
Null Hypothesis Summary:
Normalized Restriction (= 0) Value Std. Err.
0.3403*C(9) + C(10) +
0.2699*C(11) -2.925589 6.978308
Restrictions are linear in coefficients.
From Table 5.8, using the mean values (e.g. Gul et al., 2009) of ACC = 0.3403 and PG
= 0.2699, it is found that the coefficients are not significantly different than zero (p-
FRAUD = α + β1ACSIZE + β2BODSIZE + β3ACINDP + β4AGELIST +
β5LEV + β6FIRMSIZE + β7MGTOWN + γ1ACC + γ2EXP + γ3PG
+ γ4ACC.EXP + γ5ACC.PG + γ6EXP.PG + εi
δFRAUD = γ2 + γ4 ACC + γ6 PG
δEXP
153
value = 0.676), suggesting that EXP, under the average number of directors with ACC
and PG, has no effect on the probability of fraud.
5.1.2.1 Supplementary Analysis
Table 5.9 and Table 5.10, are supplementary analysis performed for 28 fraud firms
matched with 28 non-fraud firms, matched at 1:1 similar to Beasley (1996). In Table
5.9, management ownership, audit committee independence and leverage are
significant, suggesting that there are differences between the fraud and non-fraud firms.
Two of these variables, i.e. management ownership and audit committee independence,
are also significant in the 1:3 sample as shown in Table 5.3. Therefore, suggesting that
these variables are robust whether they are matched at 1:1 or 1:3 procedures.
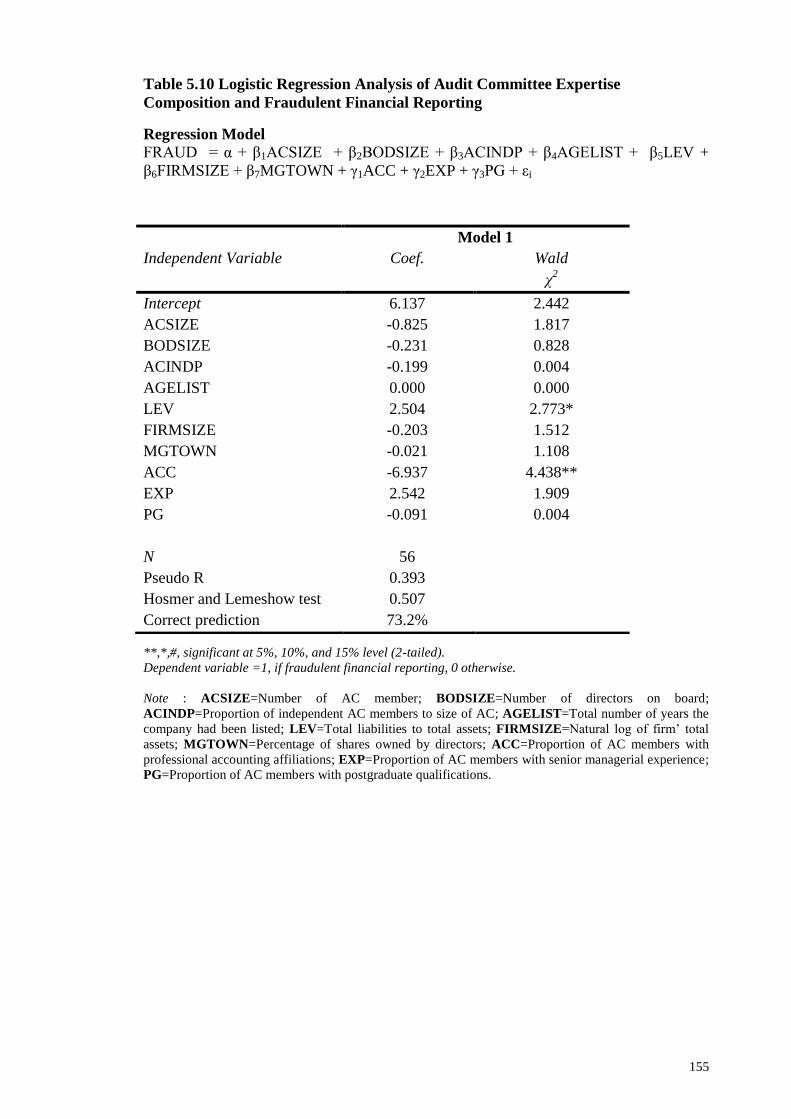
Table 5.10 shows the regression analysis performed for 28 fraud firms with 28 control
firms. The model is correctly predicted at 73.2 percent. The results show that leverage
and accounting affiliates audit committee are significant, hence are important
determinants to the likelihood of fraud. The negative coefficient of ACC, predicts that
the higher the number of accounting affiliated audit committees, the lower the incidence
of fraud. This is also consistent with results shown in Table 5.6, that ACC are
negatively significant with FFR. Consequently suggests ACC, that denotes for
accounting affiliated audit committees measurement is prevalent and consistent whether
the match pairs is performed 1:1 or 1:3. In addition to Table 5.10, leverage is positive
and significant. It is consistent with the result in the t-test shown in Table 5.9 where
leverage is significant. The regression analysis explains further, as the leverage is larger,
the higher the likelihood of fraud. However, leverage is not significant in Table 5.6
regression analysis for the 1:3 sampling procedure.

154
Table 5.9 Univariate Analysis for Fraud Sample
Panel A : Overall Sample
N = 56
*,**, significant at 10% and 5% level. Note : ACC=Proportion of AC members with professional accounting affiliations; EXP=Proportion of AC members with senior managerial experience;
PG=Proportion of AC members with postgraduate qualifications; ACSIZE=Number of AC member; BODSIZE=Number of directors on board; ACINDP=Proportion
of independent AC members to size of AC; AGELIST=Total number of years the company had been listed; LEV=Total liabilities to total assets; FIRMSIZE=Natural
log of firm‟ total assets; MGTOWN=Percentage of shares owned by directors.
Variable Mean Standard
deviation
Minimum Median Maximum Mean
difference
F tests p value
FRAUD 0.5 0.505 0 0 1
ACC 0.315 0.159 0 0.3333 0.67 0.0845 0.682 0.412
EXP 0.875 0.195 0 1 1 0.0268 0.02 0.968
PG 0.277 0.254 0 0.3333 1 0.0286 2.746 0.103
ACSIZE 3.38 0.648 3 3 5 -0.107 1.072 0.305
MGTOWN 14.31 19.384 0 5.96 75 -8.923 6.532 0.013**
BODSIZE 7.05 1.752 4 7 10 -0.321 0.808 0.373
ACINDP 0.684 0.094 0.33 0.667 1 -0.0006 4.121 0.047**
AGELIST 10.786 10.03 0 8 45 0.50 0.435 0.512
FIRMSIZE 11.819 2.599 0 11.927 16.15 -0.990 1.172 0.284
LEV 0.527 0.757 0 0.4025 5.11 0.360 3.269 0.076*
155
Table 5.10 Logistic Regression Analysis of Audit Committee Expertise
Composition and Fraudulent Financial Reporting
Regression Model
FRAUD = α + β1ACSIZE + β2BODSIZE + β3ACINDP + β4AGELIST + β5LEV +
β6FIRMSIZE + β7MGTOWN + γ1ACC + γ2EXP + γ3PG + εi
**,*,#, significant at 5%, 10%, and 15% level (2-tailed).
Dependent variable =1, if fraudulent financial reporting, 0 otherwise.
Note : ACSIZE=Number of AC member; BODSIZE=Number of directors on board;
ACINDP=Proportion of independent AC members to size of AC; AGELIST=Total number of years the
company had been listed; LEV=Total liabilities to total assets; FIRMSIZE=Natural log of firm‟ total
assets; MGTOWN=Percentage of shares owned by directors; ACC=Proportion of AC members with
professional accounting affiliations; EXP=Proportion of AC members with senior managerial experience;
PG=Proportion of AC members with postgraduate qualifications.
Model 1
Independent Variable Coef. Wald
χ2
Intercept 6.137 2.442
ACSIZE -0.825 1.817
BODSIZE -0.231 0.828
ACINDP -0.199 0.004
AGELIST 0.000 0.000
LEV 2.504 2.773*
FIRMSIZE -0.203 1.512
MGTOWN -0.021 1.108
ACC -6.937 4.438**
EXP 2.542 1.909
PG -0.091 0.004
N 56
Pseudo R
0.393
Hosmer and Lemeshow test 0.507
Correct prediction 73.2%

156
5.1.3 Discussion on Fraudulent Financial Reporting
Table 5.3, shows the univariate tests for 112 firms or fraud and non-fraud firms,
showing that postgraduate qualification of audit committee members, management
ownership and audit committee independence are significant to differentiate between
the sample and control sample. However, postgraduate qualification and audit
committee independence are not significant in the regression analysis. While, the
univariate tests of the 56 firms show leverage, management ownership and audit
committee independence, are significant. The correlation analysis supports the
univariate analysis for management ownership and accounting affiliated audit
committees where, they are found to be negative and significantly related to fraud.
Subsequently, in both the regression models for 112 firms and 56 firms, for 1:3 and 1:1
sampling procedure, management ownership and accounting affiliated directors
continue to have negative and significant relationships with fraudulent financial
reporting. Thus consistent with the expectation on the control variables that is utilised
on the number of management ownership and it‟s association with the incidence of
fraudulent financial reporting. When more managers own more shares or stocks, they
may help to alleviate fraud because of the interest they have with the company. Hence,
to maintain the good name of the company, managers feel responsible to overcome any
incidence that might lead to fraud. The result also lends support to earlier research by
Baek et al. (2009) that the level of managerial ownership influences the level of
discretionary disclosure activities of the firm, and O‟Connor et al. (2006), where large
CEO stock option grants were sometimes associated with a lower incidence of
fraudulent financial reporting, and Morck et al. (1988) where firms‟ market value
increases when board ownership increases.

157
In addition to Jensen and Meckling (1976) that posited higher level of managerial
ownership aligns the interests of managers and shareholders, lowers the agency costs
and increases the firm‟s value. The result also lends support to prior researches such as
O‟Connor et al. (2006), Chen, Guo and Mande (2006), Gul et al. (2003) and Gul and
Tsui (2001). Whereby, Gul et al. (2003) show a negative and significant interaction
between discretionary accruals (DAC) and management ownership. Thus suggesting
that the positive association between DAC and audit fee is weaker from firms with
higher management ownership, and supported by Chen, Guo and Mande (2006) that
document corporate value is impacted by management ownership. The study also
supports earlier study by Gul and Tsui (2001) that document management ownership is
negative and significant when there is interaction between free cash flow and directors
ownership of shares, suggesting that directors ownership is an important variable that
mitigates the agency cost of free cash flow. Additionally, the study complements prior
study such as Abdullah (2006) that document a significant difference between non-
distressed and distressed firms in Malaysia, where distressed firms was shown to have
lower managerial ownership percentage. The study shows that, with higher management
ownership, incidence of fraudulent financial reporting could be lowered. This could be
because the larger shares they owned, the more they feel at risk if the value of the shares
dropped because of FFR. Hence, in order to secure the value of these shares, managers
will try to reduce any incidence of fraud that might occur in the organisation.
The ACC variables, or audit committee with accounting affiliations found to be
negatively correlated with the incidence of fraudulent financial reporting in all the
models. This supports the hypothesis (H1) that theorise firms with higher proportion of
audit committee members with professional accounting affiliations, are less likely to
experience fraudulent financial reporting. Consequently provide answers to second

158
research questions, that there is a relationship between the audit committee expertise
and financial reporting quality. Subsequently, confirms that resource dependence theory
(RDT) and behavioural decision theory (BDT), that professional qualification may act
as external resources to the firm (RDT), that are identified as skills and knowledge
(BDT). The application of these two theories, in addition to the dominant agency theory
(AT), help to explain that the accounting affiliated audit committee experts, can act as
an effective monitoring mechanism to have lower incidence of fraudulent financial
reporting.
The significant p-value of ACC is consistent with Abbott et al. (2007), Abbott et al.
(2004) and Lin et al. (2006). It also lends support to earlier study by Beasley (1996),
Defond et al. (2006), Qin (2006), Gendron and Bedard (2006) and Krishnan and
Visvanathan (2009), where accountants have the responsibility to identify situations
where financial statement fraud has a greater likelihood of occurring (Beasley, 1996).
Supported by Qin (2006) that accounting literate expert is more likely to secure high
quality of reported earnings than without such expertise. It also confirms the theory in
Defond et al. (2005) if the specialised skills possessed by accounting financial experts
make directors more effective, in executing the audit committee‟s primary
responsibilities of ensuring high quality financial reporting, market would react
favourably to the appointments. Consequently, supports a recent research by Krishnan
and Visvanathan (2009), where they documented accounting expertise contributes to
greater monitoring by the audit committee, and Gendron and Bedard (2006), that
document the more professional accountants on audit committees, the more effective is
the audit committee is the audit committee in terms of adhering to best practices. The
results also support prior literature such as Bonner and Lewis (1990), that an expert is at
least required to have general domain knowledge and subspecialty knowledge, such as

159
the accounting and auditing fundamentals and the professional recognition from
professional accounting bodies, supported by Chen et al. (2008) that noted reliable
accounting and financial reporting could aid society in allocating resources efficiently.
Subsequently, conforms prior study by Sharma et al. (2009) that accounting experts on
audit committee have an important role in monitoring, and better financial reporting
quality (Jaggi and Leung, 2007). It may be conclude that accounting affiliated audit
committee is an important factor to financial reporting quality. It supports the theories
applied, agency theory, RDT and BDT. Audit committee as monitoring mechanism that
had acquired skills and expertise as qualified accountants, helped the organisation with
better monitoring skills by being more vigilant and effective.
5.2 Earnings Management
5.2.1 Descriptive Statistics
Table 5.11, provides the descriptive statistics for the variables in the model. Panel A
shows the financial variables used in the calculation of the discretionary accruals. It
gives the summary of the statistical properties of the model‟s coefficients. The β2
coefficient (change in revenues) on average positive as expected. The β3 (property, plant
and equipment) is negative as expected. Thus, consistent with Davidson et al. (2005).
Therefore, it appears that the model is well specified and has produced plausible
estimates for partitioning total accruals into their discretionary and non discretionary
components.

160
Table 5.11 Univariate Analysis for Discretionary Accruals
Panel A : Descriptive statistics for estimated regression coefficients
N=267
Cash flow
approach
Mean Standard
deviation
Minimum Median Maximum
Α -0.1301 0.1554 -0.3240 -0.117 0.2620
β1 0.1252 0.1163 -0.1650 0.1950 0.2640
β2 -0.1219 0.0789 -0.3730 -0.1320 0.0580
Panel B : Financial variables
Variable Mean Standard
deviation
Minimum Median Maximum
Total assets
(RM‟000)
1285578.5 4084205.1 35145.62 306113 32780741
Net income (before
extraordinary items)
(RM‟000)
93887.803 311262.87 -75894.69 17476.5 2399256.1
Cash flow from
operations
(RM‟000)
72901.04 272919.27 -273773.6 11912.5 1940350.1
Property, plant and
equipment (net)
(RM‟000)
458284.04 1494351.1 1203.56 89885.5 11852838
Discretionary
Accruals
0.0374 0.1365 -0.59 0.029 0.75

161
5.2.1.1 Univariate Analysis
Table 5.12, shows the sector representation of the earnings management sample. The
sample for earnings management is consistent with Hashim (2009), where the study is
at 267, and the former at 277, and Baxter and Cotter (2009) at 283. Table 5.13, shows
the univariate analysis of the sample. The study finds that average number of board is
between 7 to 8 boards which is consistent with Ning et al. (2007) and Raghunandan and
Rama (2007). And mean size for audit committee at 3.36 members consistent with
Raghunandan and Rama (2007), that document a mean for audit committee size at 3.6
members that utilised US companies. The average board size and audit committee size
for developed nation such as in the US is almost similar to Malaysia an emerging
economy.
The mean for audit committee financial expert is 0.0425, while the accounting financial
expert at 0.2521 higher than Krishnan and Visvanathan (2008). But the latter has
maximum of 0.67 percentage of financial expert, higher than the study at 0.40. Which
tells that nearly two third of their sample consist of financial expert, consistent with the
companies that they utilised are from US companies, from a develop nation. As
compared to this study, Malaysia is an emerging economy where pool of resources are
limited as compared to the US as shown in Table 2.6.

162
Table 5.12 Sectors in Earnings Management
Sectors Frequency Percentage
Construction 16 6
Consumer Products 49 18.4
Industrial Products 68 25.5
Plantations 18 6.7
Properties 34 12.7
Trading and Services 74 27.7
Technology and Infrastructure 8 3
Total 267 100
Table 5.13 Univariate Analysis for Earnings Management
Continuous regression variables
N=267
Variable Mean Standard
deviation
Minimum Median Maximum
DAC 0.0604 0.1146 -0.156 0.050 0.522
A 0.0425 0.1089 0.00 0.00 0.40
B 0.2521 0.2132 0.00 0.2500 1.00
C 0.0284 0.08761 0.00 0.00 0.33
D 0.1977 0.2085 0.00 0.2500 0.75
ACSIZE 3.36 0.617 1 3 6
BODSIZE 7.87 1.873 5 8 13
INED 0.4410 0.1167 0.2 0.4286 0.83
ROA 0.1056 0.125 -0.05 0.0799 1.58
FIRMSIZE 13.78 1.186 11.69 13.62 17.2
LEV 0.0969 0.1553 0 0.0151 1.01
AGELIST 18.86 13.337 2 14 47
MGTOWN 9.048 14.799 0 1.13 56.44
Note: A=Proportion of AC members with accounting professional affiliation, postgraduate qualification,
and managerial experience; B=Proportion of AC members with accounting professional affiliation and
managerial experience; C=Proportion of AC members with any professional affiliation qualification,
postgraduate qualification and managerial experience; D=Proportion of AC members without any
professional affiliation, but only postgraduate qualification and managerial experience;
ACSIZE=Number of AC member; BODSIZE=Number of directors on board; INED=Proportion of
independent directors to size board; ROA= Earnings before interest and taxes divided by total assets;
FIRMSIZE=Natural log of firm‟ total assets; LEV=Total liabilities to total assets; AGELIST=Total
number of years the company had been listed; MGTOWN=Percentage of shares owned by directors.
163
5.2.1.2 Correlation
Table 5.14, shows the correlation of the variables with discretionary accruals. It shows
that discretionary accruals is negative and significantly correlated to accounting expert,
consistent with Lin et al. (2006) that has negative association between financial expert
and restatement as a proxy to earnings management.
The type A, audit committee financial expert is negatively and significantly correlated
with accounting expert and leverage, suggesting that lower leverage may be associated
with the presence of financial experts on board. On the other hand, type B, accounting
expert is significantly and negatively correlated with type C and D, the non-accounting
experts, consistent with Baxter and Cotter (2009), accounting experts have negative
association with audit committee size. However, non-accounting experts are found to
have positive and significant relationship with audit committee size and firm‟s size,
consistent with Baxter and Cotter (2009). Thus the result suggests that larger audit
committee size may consist of more non-accounting experts, than the accounting
experts.
Consistent with Baxter and Cotter (2009), audit committee size has a positive
association with leverage. And also larger firms are significant positively correlated
with leverage and age listed in the market, suggesting older firms have larger assets.
Consistent with Baxter and Cotter (2009), Davidson et al. (2005) and Rahman and Ali
(2006), but contradicts with Jaggi et al. (2009) and Saleh et al. (2005). All the experts
(A, B, C and D) are positively correlated to independence, consistent with Karamanou
and Vafeas (2005) document board independence and committee expertise to be
positively related to voluntary financial disclosure practices, suggesting these measures
as complements in disciplining management.
164
Management ownership is negative and significant with firms‟ size and agelist.
Suggesting that higher management‟s ownership is more prevalent in smaller firms and
the percentage of ownership reduces as firms‟ are listed longer in the market. However,
board independence is positive but non significant to ROA. This is similar to Abdullah
(2004) that found positive and significant correlations between board independence and
ROA, suggesting that board independence is associated with firms‟ high performance.

165
Table 5.14 Pearson Correlation for Earnings Management
**,*, significant at 1% and 5% level (2-tailed).
Note: A=Proportion of AC members with accounting professional affiliation, postgraduate qualification, and managerial experience; B=Proportion of AC members
with accounting professional affiliation and managerial experience; C=Proportion of AC members with any professional affiliation qualification, postgraduate
qualification and managerial experience; D=Proportion of AC members without any professional affiliation, but only postgraduate qualification and managerial
experience; ACSIZE=Number of AC member; BODSIZE=Number of directors on board; INED=Proportion of independent directors to size board; ROA= Earnings
before interest and taxes divided by total assets; FIRMSIZE=Natural log of firm‟ total assets; LEV=Total liabilities to total assets; AGELIST=Total number of years
the company had been listed; MGTOWN=Percentage of shares owned by directors.
DAC A B C D ACSIZE BODSIZE INED ROA FIRMSIZ
E
LEV AGELIST MGTOW
N
DAC
1 0.080 -0.122* 0.035 -0.079 0.097 -0.005 -0.028 0.089 0.053 0.115 -0.074 0.067
A
1 -0.276** -0.043 -0.043 -0.061 -0.166** 0.049 0.153* -0.086 -0.016 -0.039 -0.008
B
1 -0.171** -0.171** -0.112 0.079 0.048 -0.075 0.082 0.064 0.031 0.065
C
1 -0.091 0.038 -0.005 0.083 -0.069 0.066 0.131* -0.031 0.141*
D
1 0.201** 0.045 0.074 -0.031 0.174** 0.017 0.086 -0.156*
ACSIZE
1 0.322** 0.046 -0.021 0.209** 0.108 0.075 -0.115
BODSIZE
1 -0.280** -0.013 0.275** -0.027 0.060 -0.095
INED
1 0.030 -0.019 0.085 0.090 -0.011
ROA
1 -0.155* -0.089 -0.122* -0.030
FSIZE 1 0.091 0.320** -0.261**
LEV
1
-0.074
0.033
AGELIST
1 -0.178**
MGTOWN 1

166
5.2.2 Multivariate Analysis
Multivariate analysis or multiple regresion, is performed to this sample that consists of
267 listed companies. The sample size at 267 is considered large, because it is more
than 200, and concerns about nonnormal variables can be relaxed (Hair et al., 2006),
where the detrimental effects of nonnormality is negligible. This multiple regression
analysis helps to answer the second research question, on the association of audit
committee expertise with financial reporting quality (FRQ), where FRQ is proxied by
earnings management and to tests the following hypotheses:
H4 : Firms with audit committee members with type A are negatively related to
earnings management.
H5 : Firms with audit committee members with type B are negatively related to
earnings management.
H6 : Firms with audit committee members with type C are negatively related to
earnings management.
H7 : Firms with audit committee members with type D are negatively related to
earnings management.
Table 5.15 shows the results from the multiple regression on earnings management. The
adjusted R2 are 0.017 and 0.031 in Model 1 and Model 2 respectively, consistent with
Baxter and Cotter (2009) at 0.033, Raghunandan and Rama (2007) at 0.08 and Aier et
al. (2005) at 0.0533. The F values are significant at 1.648 and 1.781 for Model 1 and 2,
almost similar to Baxter and Cotter (2009) at 1.977.
Model 1, shows that type B audit committees is found to be negative and significant at 5
percent level, consistent with Qin (2006) that documents firms with accounting literate
professionals are likely to have high quality of reported earnings than firms without

167
these experts. Type D audit committees is also found to be significant and negatively
related to DAC. Hence, the results support the hypotheses that theorise; (1) firms with
audit committee members with type B, are negatively related to earnings management
(H5) and (2) firms with audit committee members with type D are negatively related to
earnings management (H7). Type B denotes for proportion of AC members with
accounting professional affiliation and managerial experience, whilst type D denotes for
proportion of AC members without any professional affiliation, but only postgraduate
qualification and managerial experience.

168
Table 5.15 Regression Analysis With Discretionary Accruals
Model 1 :
DAC = α + γ1B + γ2C + γ3D + β1ACSIZE + β2BODSIZE + β3INED + β4ROA +
β5FIRMSIZE + β6LEV + β7AGELIST + β8MGTOWN + βjDUMINDUSTRY + ε i
Model 2 :
DAC = α + γ1A + γ2B + γ3C + γ4D + γ5A*B + β1ACSIZE + β2BODSIZE + β3INED +
β4ROA + β5FIRMSIZE + β6LEV + β7AGELIST + β8MGTOWN + βjDUMINDUSTRY
+ εi
**, *,# significant at 5% , 10% and 15% level (2 tailed). Dependent variable, DAC.
Note: A=Proportion of AC members with accounting professional affiliation, postgraduate qualification,
and managerial experience; B=Proportion of AC members with accounting professional affiliation and
managerial experience; C=Proportion of AC members with any professional affiliation qualification,
postgraduate qualification and managerial experience; D=Proportion of AC members without any
professional affiliation, but only postgraduate qualification and managerial experience;
ACSIZE=Number of AC member; BODSIZE=Number of directors on board; INED=Proportion of
independent directors to size board; ROA= Earnings before interest and taxes divided by total assets;
FIRMSIZE=Natural log of firm‟ total assets; LEV=Total liabilities to total assets; AGELIST=Total
number of years the company had been listed; MGTOWN=Percentage of shares owned by directors.
Model 1 Model 2
Variables Prediction Coef. t-stat Coef. t-stat
Intercept
-1.034
-0.928
Independent Variables
A - -0.047 -0.623
B - -0.139 -2.196** -0.177 -2.555**
C - -0.011 -0.168 -0.003 -0.051
D - -0.120 -1.864* -0.105 -1.633#
A*B - 0.156 2.170**
Control Variables
ACSIZE - 0.100 1.475# 0.091 1.356
BOSIZE - -0.048 -0.686 -0.044 -0.632
INED - -0.032 -0.493 -0.042 -0.654
ROA + 0.101 1.625# 0.101 1.625
#
FIRMSIZE 0.128 1.806* 0.126 1.800*
LEV 0.108 1.718* 0.105 1.694*
AGELIST -0.061 -0.936 -0.056 -0.866
MGTOWN -0.086 1.322 0.087 1.343
DUMINDUSTRY Yes Yes
N 267 267
Adj. R2 0.031 0.042
F value 1.648* 1.781**

169
ROA is positively correlated to DAC, consistent with Wahab et al. (2007) that
document a positive and significant ROA with stock performance. While board size is
negatively associated to DAC but non significant, consistent to Xie et al. (2003) that
document lower level of earnings management is associated with greater board
independence. Srinivasan (2005) document a negative relation of board‟s size with
income-increasing sample companies with accounting restatements.
ACSIZE is found to be marginally significant and positively related to DAC. LEV and
FIRMSIZE are positive and significant at 10 percent level. Thus, suggesting that, audit
committee size is important only when there is an insufficient audit committee financial
experts or accounting experts. Eventhough, there is a presence of type C experts, but the
presence is not significantly related to DAC. Subsequently, suggesting that presence of
audit committees with accounting affiliations or type B, are sufficient to reduce the
magnitude of earnings management. In addition, the presence of non accounting and
non-affiliated directors on audit committee (type D audit committees), with prior senior
managerial experiences and postgraduate qualifications, has significant effect and
negative association to the magnitude of earnings management. Consistent with
Krishnan and Visvanathan (2009) who document presence of non-accounting experts
with the existing financial experts may reduce the magitude of earnings management.
Hence, suggesting that tertiary or continuing education on human capital on audit
committee, improves the quality of financial reporting. Thus, gives support to the
behavioural decision theory that is applied to measure experts.
The Model 2, shows interactions between type A and B audit committees experts. While
other control variables continue to be positive and significant (ROA, FIRMSIZE and
LEV), but ACSIZE becomes non significant, suggesting that, with the presence of

170
accounting affiliates audit committee, with and without postgraduate qualification can
be relaxed, consistent with Qin (2006) and Bedard et al. (2004). The type B audit
committees continue to be significant at 5 percent level, consistent with prior studies
(see Krishnan and Visvanathan, 2009; Mangena and Tauringana, 2008, and Qin, 2006),
and also the interaction between accounting affiliates and accounting affiliates with
postgraduate qualifications (A*B) is significant at 5 percent level, consistent with
Baxter and Cotter (2009). Subsequently the interaction suggests that the presence of
experts as prior studies had adopted are sufficient on those directors with accounting
affiliations. The results show that accounting affiliated audit committees, without any
postgraduate qualification, is sufficient to contribute to the financial reporting quality.
Type D audit committees is negative and significant in all models, suggesting that this
measure for non-accounting experts is robust, and complement prior studies on audit
committees‟ expert such as Baxter and Cotter (2009), Krishnan and Lee (2009) and Aier
et al. (2004).
5.2.2.1 Supplementary Analysis
In Model 2, the interaction terms are significant, thus to find out if type A complements
type B experts in the interaction terms, a partial F test is carried out on the coefficients
of B and A*B. The expected change in discretionary accruals (DAC) might be lower for
firms with more Bs. Without the interaction it is assumed that type B audit committees
had a constant effect on DAC, but the interaction term tells that this relationship
changes depending on type A. It does not mean that the effects of B or A by themselves
are unimportant, but instead the interaction term complements their explanation of
DAC.

171
To find out if type B audit committees has significant effect on the magnitude of
discretionary accruals, thus the differentiation is :
Hence, to test if the coefficients are significantly different than zero;
H0 : γ2 + γ5A = 0
Table 5.16 Partial F Test on Coefficients Type B
Test Statistic Value df Probability
F-statistic 3.378334 (1, 251) 0.0672
Chi-square 3.378334 1 0.0661
Null Hypothesis Summary:
Normalized Restriction (= 0) Value Std. Err.
C(12) +
0.042500000000000012*C(15) -0.064907 0.035314
Using the mean values of A= 0.0425, it is found that the coefficients are significantly
different than zero (Table 5.16), suggesting that type B, with the average number of
type A, has a negative effect (value = -0.0649) on the magnitude of earnings
management, whereby at the presence of average A (audit committees with accounting
EM = α + γ1A + γ2B + γ3C + γ4D + γ5A*B + β1ACSIZE + β2BOARDSIZE +
β3INED + β4ROA + β5FIRMSIZE + β6LEV + β7AGELIST +
β8MGTOWN + βjDUMINDUSTRY + ε i
δEM = γ2 + γ5A
δB

172
affiliations and postgraduate qualifications) with B on board, had a diminishing effect to
the magnitude of earnings management and mitigate the agency problem. Thus, it may
be conclude that the presence of both directors in the audit committees may help to
reduce the earnings management. Subsequently improve the quality of financial
reporting, consistent with Beasley et al. (2009) that document audit committee with
accounting background are more likely to state their audit committee drives the content
of information and discusses alternative accounting treatment under GAAP, and
discusses specific judgment, estimates and assumptions involved in implementing new
accounting policy.
5.2.3 Discussion on Earnings Management
In Table 5.15, three control variables show consistent behaviour with discretionary
accruals: ROA, firms‟ size and leverage. All are positive and significant with the
dependent variable. However, they are not significant in the correlation analysis, though
are positively correlated. ROA and leverage supports the hypothesis, where they are
expected to have a positive association with DAC. But firms‟size is inversely associated
with DAC, unexpectedly. Suggesting that firms with greater leverage and higher growth
are associated to higher magnitude of earnings management. While, FIRMSIZE
suggests that smaller firms are not associated to the magnitude of earnings management,
as has been theorised by many studies in earnings management literature (Gul et al.,
2002; Klein, 2002b; Krishnan, 2003; Balsam et al., 2003; Xie et al., 2003).
ROA, a proxy for firms‟ performance shows a positive coefficient, suggesting that firms
that performed better are likely to be engaged in earnings management, which is
consistent with Gul et al. (2009) that document positive but non significant relationship
to discretionary accruals, and Lee et al. (2006) that show positive and significant to

173
restated earnings. FIRMSIZE, which is positive and significant to the dependent
variables, is in contrast with prior literature that suggest a negative association with
DAC (Xie et al., 2003; Krishnan, 2003; Balsam et al., 2003; Gul et al., 2002). However
the positive coefficient of firms size is consistent with Bauwhede et al. (2003) and Saleh
and Ahmed (2005), suggesting larger firms are likely to engage in earnings
management. This inconsistency could be due to the nature of the sample utilised in the
study. In Bauwhede et al. (2003), the study utilised Belgium companies, while Saleh
and Ahmed (2005) utilised Malaysian companies. As suggested in the political cost
theory (Watts and Zimmerman, 1978) it argues corporate sector that is vulnerable to
wealth redistribution, have incentive to employ devices to avoid attention from various
parties. Therefore, earnings management can arise from managements‟ discretion over
accounting procedures because the numbers are generated by those procedures are used
to evaluate and reward management (Watts, 1988). Thus, under the strict regulation
(Bursa Malaysia Listing Rules, SIA 1983, SCA 1993, CMSA 2007) and government
intervention in Malaysia such as Corporate Debt Restructuring Committee (CDRC) and
Pengurusan Danaharta Nasional Berhad, larger companies are more susceptible into
earnings management perhaps due to the amount of pressure they faced.
Leverage, has shown to be prevalent under the two models, where they are consistent to
be positive and significant to discretionary accruals suggesting that, higher leverage
increases the magnitude of earnings management. Consistent with Loebbecke et al.
(1989) that show poor financial performance increases the likelihood of management to
engage in actions that require restatement. The result supports earlier studies such as
Dechow et al. (1996), Palmrose (1987), Klein (2002b), Lee et al. (2006), and
Loebbecke et al. (1989) that firms with greater leverage are more likely to involve in
earnings management.

174
Another interesting control variable is audit committee size, it is positive and marginally
significant to discretionary accruals, are consistent with Saleh et al. (2007) that noted
audit committee size has a significant impact on the monitoring of earnings
management, and Baxter and Cotter (2009). The result fails to support the hypothesis
that theorised a negative association of audit committee size with discretionary accruals.
Thus, contradicts with prior studies such as Yang and Krishnan (2005), and Lin et al.
(2006) where audit committee size has a negative association with earnings
management. The result here suggests that, larger audit committee size might not be
appropriate, therefore in agreement with Rahman and Ali (2006) that board‟s size to be
positively related to earnings management. Subsequently, the results support Jensen
(1993) that board‟s size influence the ability of board to monitor and control
management, hence explain why larger boards are inefficient. The results also confirms
Cheng (2008) that document larger boards might have communication or coordination
problems and agency problem. However, interestingly, audit committee size is not
significant when there are presence of both the financial experts and accounting experts
in the audit committee as shown in Table 5.15, of Model 2. When there exists financial
experts and accounting experts, in the committee, the size of audit committee is not
important. Perhaps the presence of at least one of them is merely to fulfill the
requirements by the authority, and adherence to the Bursa Malaysia Listing Rules
Chapter 15. Where, the audit committee must be composed of no fewer than three
members, and a member of one of the associations of accountants specified in Part II of
the 1st Schedule of the Accountants Act 1967.
The results show that accounting affiliated audit committee members are negative and
significant to discretionary accruals, thus supports the second hypothesis (H5) that firms
175
with accounting affiliated directors and managerial experiences, are negatively related
to the magnitude of earnings management. Hence provide the answer to the second
research question; there is a negative relationship between the audit committee experts
and financial reporting quality. This suggest that higher number of accounting affiliated
audit committees on board, may help to reduce the magnitude of earnings management.
Thus, confirms the agency theory (AT) that explains audit committee as a monitoring
mechanism in the organisation. More importantly, the results confirm the resource
dependence theory (RDT) and behavioural decision theory (BDT) that are applied to
explain that audit committee accounting experts bridge the organisation with the
knowledge, skills and experience acquired from external resources or outside the
organisation. The acquired skills and experience made these audit committees experts
to become effective monitoring mechanism.
Subsequently, the results are similar to few studies such as, Abbott et al., (2004), Aier et
al. (2005) and Lin et al. (2006) that document accounting affiliated audit committees
are associated to better financial reporting quality, and Defond et al. (2005) and
Krishnan and Visvanathan (2009), that accounting expertise contributes to greater
monitoring by the audit committee. Eventhough the introduction of academic
qualification as one of the financial experts‟ criteria is not supported, but the results
support the theory on the presence of experienced and academically qualified non-
accounting directors on audit committee, it is negative and significant to the dependent
variable. Hence, this lends support to Kim et al. (2006) that advanced education and
managerial experience are significantly associated with entrepreneurial attempts, where
here the entrepreneurial attempts is looked upon being a successful mitigating factor to
reduce the agency problems. The result suggests that, non-qualified non-accounting
directors but with some background in managerial experience and postgraduate studies,

176
are also an important factor to financial reporting quality. These directors are associated
with lower earnings management, signifies that their knowledge, experise and
experience, helped to mitigate any agency conflicts that may present.
Furthermore, the significant and negative coefficient of type D experts to DAC, support
prior literature on experts‟ studies that document, work experience as among the
attributes of expert, such as Bonner and Lewis (1990), Abdolmohammadi and Shantaeu
(1992), Choo (1996), Hertz and Schulz (1999) and McAulay et al. (1999). This
complements Fich (2005) that document CEOs are also sources of unique expertise,
whereby the result shows that senior managerial experience, is relevant to be used as an
expert‟s criteria. Therefore, confirms the information processing view of the BDT, that
experiences is a measurement for an expert.
Consequently, the significant coefficients of type B and D audit committees experts,
confirm that education is important to an individuals‟ ability. Therefore, confirms that
BDT can be applied in measuring experts and education is also a relevant criteria for an
expert. This is also documented in Anderson and Keys (2007), where education
contributes significantly to future earning capacity (B and D audit committees, both
have minimum qualification of a tertiary education). Therefore, it may be conclude that
audit committee should be composed of highly efficient directors with relevant
expertise, supported by Dalton et al. (1999) that board should be ideally of sufficient
size to be comprised of members with various expertise and skills.

177
5.3 Conclusion
The univariate tests of FFR, have pointed out the areas where differences exist between
the fraud and non-fraud firms. It showed that management ownership, postgraduate
qualifications and audit committee independence, have significant differences between
the sample and the control firms. However, in the multivariate analysis as shown in
Table 5.16, management ownership and firmsize are found to be an important
determinants to the likelihood of fraudulent financial reporting, in addition to
accounting affiliated audit committee that shows negative and significant association to
fraud. Most importantly, the findings extend prior literature, and support that accounting
affiliated audit committee is important to reduce the incidence of fraud.
Additionally, in the second proxy (i.e. earnings management), guided by prior
literatures, control variables are introduced in the empirical model for potential
influences that are likely to affect the audit committees experts‟ composition. Three
control variables are prevalent in a series of regression as shown in the Table 5.16,
namely, leverage, ROA and firms‟ size where they are shown to be positive and
significant to discretionary accruals. Leverage and firm‟s performance or growth (ROA)
are consistent with the hypothesis. However, firms‟ size is significant but inversely
related to DAC, not as expected and suggested by prior literature. But is consistent with
prior studies carried out in a Malaysian and Belgium context (see Saleh and Ahmed,
2005; Bauwhede et al., 2003). Perhaps, a possible explanation because Malaysia, an
emerging economy has other factors such as politically connected firms, and ethinicity
and culture influences on the economies, as compared to most prior studies that were
related to developed countries such as Australia, UK and US. In Malaysia, political
influences exist in the corporate sectors that is also influencing the internal mechanism
and ownership structure of the companies. This is substantiated further with

178
concentrated ownership that may suggest why Malaysian has different results than the
developing nations. Furthermore, under a different economic environment, managers
are pressured to expropriate assets for the benefit of controlling stockholders.
Table 5.17 Summary of Findings
Dependent
Variables
Fraudulent Financial
Reporting
(coefficient)
Earnings Management
(coefficient)
Independent
Variables
(H1) Accounting Affiliates Audit
Committee (negative)
(H6) Type B Audit Committees
(negative)
(H8) Type D Audit Committees
(negative)
Control
Variables
Managerial Ownership (negative)
Firms‟ Size (negative)
Leverage (positive)
Perform (positive)
Firms‟ Size (positive)*
*inversely related to dependent variable.