chapter 4: results & discussion 4.0 public survey
TRANSCRIPT

68
CHAPTER 4: RESULTS & DISCUSSION
4.0 Public Survey
The public survey conducted on awareness and habit, within Klang Valley region covered
both residential and commercial area. The survey was conducted between February 2012 and
April 2012. Based on the validity and reliability test carried out, total number of 200
respondents were determined based on 95% confidence level. The respondents interviewed came
from various backgrounds depending on the demographic details as stated in the questionnaire
(see Appendix A).
By looking at the overall responses for each question, survey results were analyzed and
compared according to gender, age, respondents salary, occupation, education level and race.
The comparisons were done using percentages, due to diversity among demographics.
Demography of respondents have been stated in Table 4.1. Based on the table, there were more
female respondents compared to males with just a difference of 38. Most of the respondents
were between the age of 22-34 years old, comprising of mostly students in their tertiary level of
education as well as employees in private sectors. They consists of Malays with a total of 68 of
them and in terms of income level, most of the respondents have an income between RM1001-
3000. The following is a summary of the survey results.

69
Table 4.1 : Respondents Demography
No. Question No. of
Respondents
%
1 Gender
Male 81 40
Female 119 60
2 Age
Below 21 years 11 6
22 - 34 years old 71 35
35 - 44 years old 62 31
45-54 years old 44 22
55 years and above 12 6
3 Respondents salary
Less than RM1,000 24 11
RM1,001 – RM3,000 58 29
RM3,001 – RM5,000 55 28
RM5,001 and above 38 19
No income 25 13
4 Education
Primary School 0 0
Secondary School 26 13
STPM/Diploma 45 23
Bachelor’s Degree 79 39
Master’s Degree/PhD 50 25
No Formal education 0 0
5
Occupation
Government 40 20
Private 70 35
Student 67 34
Unemployed 13 6
Self-employed 10 5
6 Race
Malay 68 34
Chinese 59 30
Indian 48 24
Others 25 12
7 Nationality
Malaysian 185 92
Non-Malaysian 15 8
70
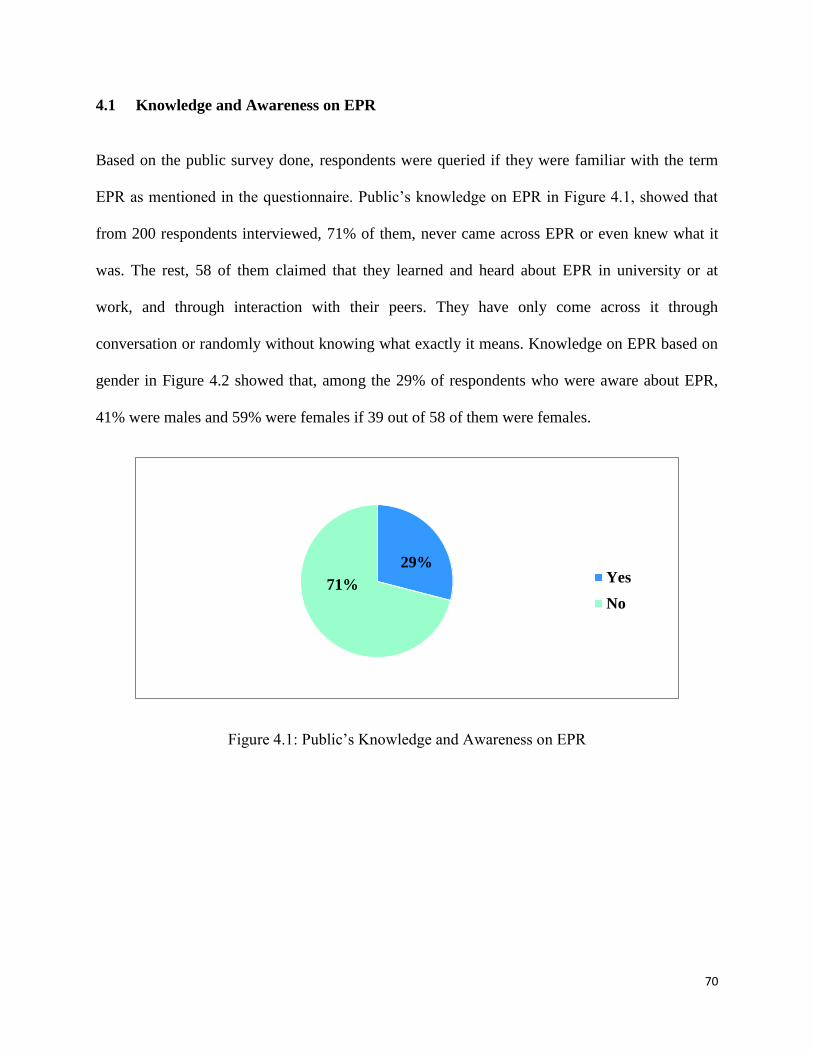
4.1 Knowledge and Awareness on EPR
Based on the public survey done, respondents were queried if they were familiar with the term
EPR as mentioned in the questionnaire. Public’s knowledge on EPR in Figure 4.1, showed that
from 200 respondents interviewed, 71% of them, never came across EPR or even knew what it
was. The rest, 58 of them claimed that they learned and heard about EPR in university or at
work, and through interaction with their peers. They have only come across it through
conversation or randomly without knowing what exactly it means. Knowledge on EPR based on
gender in Figure 4.2 showed that, among the 29% of respondents who were aware about EPR,
41% were males and 59% were females if 39 out of 58 of them were females.
Figure 4.1: Public’s Knowledge and Awareness on EPR
29%
71% Yes
No

71
Figure 4.2: Knowledge on EPR based on Gender
Figure 4.3 shows the percentage of respondents aware on EPR based on different age range.
Those who were aware about EPR or heard about it come from the age group of 22-34 years old
(22 of them) with the highest percentage of 38%. They consist of people who are still in
university or colleges. Some had just started working and are in the early years of their careers.
These generation are more exposed to technology and consume it the most in market. Second
highest, with 28% of respondents aware on EPR, came from the age group of 35-44 years old.
These are also people in the working environment (Chi et al., 2011). While the respondents who
are 55 years and above are the least to be exposed towards EPR with a difference of 18% from
the highest value.
41%
59%
Gender
Male Female

72
Figure 4.3: Knowledge on EPR based on age
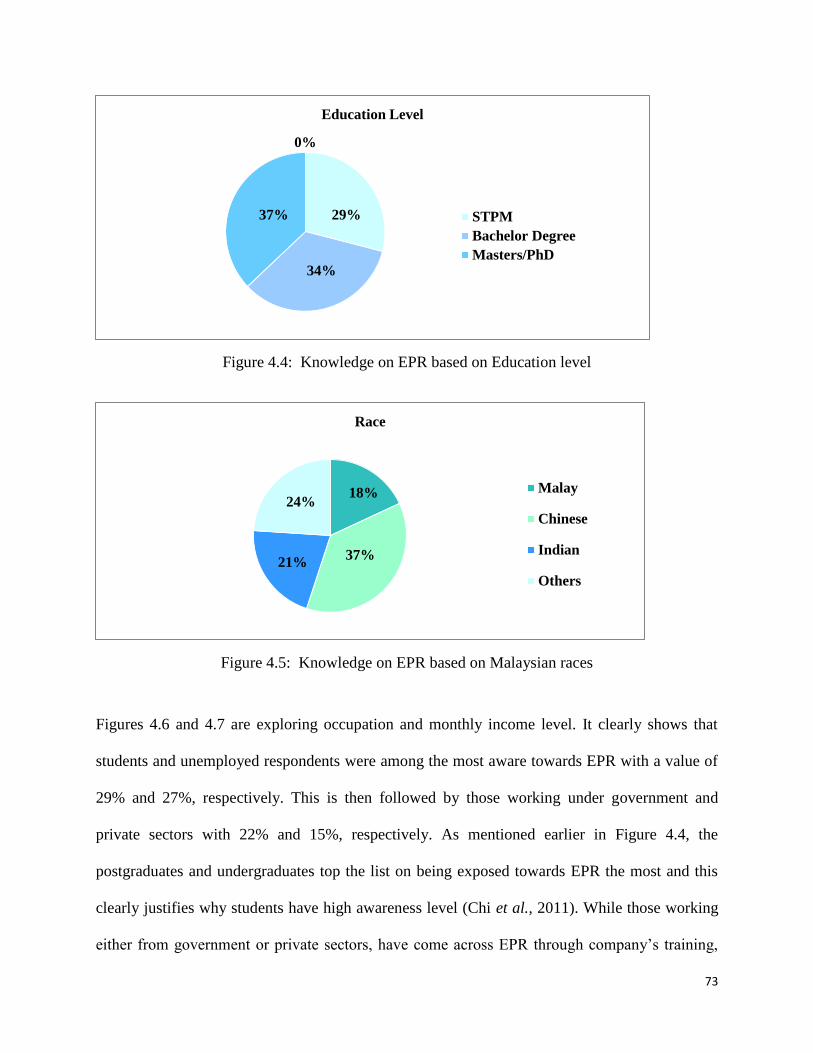
Based on education level, in Figure 4.4, a total of 46 of them were undergraduates and
postgraduates exposed towards EPR in their tertiary level of education. The number of
respondents with highest level of awareness were students with Masters/PhD. There were only
12 postgraduates who have familiarized well with EPR. Undergraduate students were the second
closest with 34%. Sijil Tinggi Pelajaran Malaysia (STPM) students were the least aware with
29%. From the survey done, none of the students from secondary schools or primary level have
even heard about EPR as it is something new to them. This shows that tertiary education have
played an important role in giving the knowledge to students on EPR.
In Figure 4.5, the Chinese community were the most aware towards EPR with 37% and a total of
26 of them. This was followed by Other races and Indians with a percentage of 24% and 21%,
respectively. Others, consist of ethnics such as Bidayuh’s and etc., in which only 12 of them
were exposed towards EPR. The community with least awareness were the Malays with a
percentage of 18%. Most of them were not exposed to issues related to EPR and did not create an
interest for them to learn about the practice in depth (Chung and Zhang, 2011).
0%
38%
28%
24%
10%
Age
22-34 years
35-44 years
45-54 years
55 years and above
73
Figure 4.4: Knowledge on EPR based on Education level
Figure 4.5: Knowledge on EPR based on Malaysian races
Figures 4.6 and 4.7 are exploring occupation and monthly income level. It clearly shows that
students and unemployed respondents were among the most aware towards EPR with a value of
29% and 27%, respectively. This is then followed by those working under government and
private sectors with 22% and 15%, respectively. As mentioned earlier in Figure 4.4, the
postgraduates and undergraduates top the list on being exposed towards EPR the most and this
clearly justifies why students have high awareness level (Chi et al., 2011). While those working
either from government or private sectors, have come across EPR through company’s training,
29%
34%
37%
0%
Education Level
STPM
Bachelor Degree
Masters/PhD
18%
37% 21%
24%
Race
Malay
Chinese
Indian
Others

74
workshops and seminars (Hawari and Hassan, 2008). As far as the monthly income is concerned,
28 respondents with an income less than RM 1000 were the most aware towards EPR with the
highest at 28%. They consist of students who are still in universities or colleges, as well as, fresh
graduates who have just been hired. While those earning between RM 3001- 5000 (with 22%)
consist of working people mostly from the corporate world. They are users of electric and
electronic gadgets. Companies and corporations handle e-waste better as they dispose broken or
old computers and electric & electronic machines to recyclers (Khetriwal et al., 2007). The
respondents with 7%, with no income at all, were the least to be knowledgeable in EPR. They
were also students at various level without any exposure and were not keen to learn about EPR.
Some were not even aware on the existence of such practice in the Electronics Indusry and its
importance on e-waste matters (Guo et al., 2010).
Figure 4.6 Knowledge on EPR based on occupation level
22%
15%
27%
29%
7%
Occupation level
Government
Private
Unemployed
Student
Self-employed

75
Figure 4.7 Knowledge on EPR based on monthly income level
4.2 Knowledge and Awareness on Take-back Programme
From the 200 respondents, only 21% (or 42 of them) were aware on take-back activity (Figure
4.8). They have indicated to have heard about take-back through their peers, as well as, through
education. While those who have not been exposed to take-back are 58% higher than those who
know about this activity. From the 42 respondents who knew about take-back programme, 55%
were females and 45% were males (Figure 4.9). They do have knowledge and awareness on
take-back activity. Most of them got the information from newspaper articles, mass media and
their friends (Hicks et al., 2005).
28%
16%
22%
20%
14%
Monthly Income
Less than 1000
1001-3000
3001-5000
5001 and above
No income
21%
79%
0%
Take-back
YesNo

76
Figure 4.8: Knowledge on Take-back Programme
Figure 4.9: Public‘s Knowledge on Take-back based on gender
Knowledge and awareness on take–back programme based on age of respondents gave 37%, in
the age 22-34 years, as the most aware regards take-back activity. This was followed by those
aged between 35-44 years and 45-54 years with 30% and 24%, respectively. It was the students
again who were most knowledgeable on take-back programme as they were exposed through
education in higher institutions. Most claim that, internet has also played an important role in
providing information and knowledge on take-back programme as well (Jang, 2010). While the
older generation who are 55 years and above, have very low interest in take-back programme and
were not encouraged to take part even if such activity was organized and required their
participation (Junaidah, 2010).
45% 55%
Gender
Male Female
37%
30%
24%
9%
Age
22-34 years
35-44 years
45-54 years
>55 years and above

77
Figure 4.10 Public’s Knowledge on Take-back based on age
Based on Figure 4.11, take-back programme is well-known among the Chinese (41%). There
were 19 of them from 42 respondents. It then was followed by Indians with 32%, Malays with
17% and Others at 10%. Knowledge on take-back based on education level as shown in Figure
4.12, have stated that postgraduate students and those with a Bachelor’s Degree were among the
most aware and knowledgeable on this take-back programme with a value of 38% and 32%,
respectively. Students have been actively involved in take-back programme organized by many
societies and organizations. Almost similar to EPR, respondents with a Diploma or Sijil Tinggi
Pelajaran Malaysia (STPM) came in third with 30%. They (only 9 of them) have not been taught
in school or even taken part in such programmes. Some had gained knowledge and input through
media, training and campaigns organized by many recycling centres (Guo e al., 2010). There
were no respondents from the secondary or primary level of education who have knowledge on
take-back programme or have heard about it from theirfriends.
Figure 4.11: Knowledge on Take-back programme based on Malaysian races
17%
41%
32%
10%
Race
Malay
Chinese
Indian
Others

78
Figure 4.12: Knowledge on Take-back programme based on Education level
Figure 4.13 shows that 29% students were aware of take-back programme, followed by private
and government employees with 28% and 24%, respectively. Students and private sector workers
have been the most exposed on this particular issue. Particularly, employees from private group
have mentioned that many of their companies give priority about take-back in their company in
increasing the profit (Herold, 2007). As for monthly income, the respondents that earn less than
RM1000 were more aware on take-back compared to respondents earning between RM 1001-
2000, RM3001-5000 and RM 5001 or more. The students who fall within the income range of
earning less than RM1000 as they are either working on a part-time basis or appointed as
research or lab assistants in higher institutions.
30%
32%
38%
0%
Education Level
STPM
Bachelor Degree
Masters/PhD

79
Figure 4.13: Knowledge on Take-back programme based on Occupation level
Figure 4.14: Knowledge on Take-back programme based on Monthly income
Figure 4.15 shows the frequency of e-waste discarded by public respondents. Highest amount of
e-waste was cellphone with a total of 81 discarded within the first 5 years. This was followed by
computers with a total number of 40 for more than 5 years. Generally, almost all the respondents
own a cellphone and computer. Both are much needed necessity in life. Second highest to be
discarded was remote controls with a total of 25 within a 2 years period, computers with a
quantity of 36 and cellphones again for 5 years or more. Among all, the least to be discarded was
33%
19% 26%
22%
Monthly Income
Less than 1000
1001-3000
3001-5000
>5001 & above
24%
28% 19%
29%
Occupation Level
Government
Private
Unemployed
Student

80
heater. To date, not many of them dispose it with municipal waste and most are still functional.
The total number of e-waste discarded shows the value was highest at 190 pieces within 3-5
years period and 5 years or more with 38%. Number of e-wastes discarded by respondents were
significantly moderate with an overall total of 499 while cellphones ranked the highest in total.
This clearly shows that this device is easily owned by most of the respondents. In this fast paced
world with latest innovation and technology, the trend of mobile phone that keeps changing,
triggers them in changing their phones quite often (Huang, 2009). It easily becomes e-wastes
over the years (Hicks et al., 2005). As stated by Rachna (2008) in her study as well, the rapid
growth of electronic industries and consumer culture which encourages consumption of
electronic products have led to the increase in e-wastes.
Figure 4.16 shows the different options taken up by public in disposing their e-wastes. Most of
the respondents (31%) prefer to throw their wastes with municipal waste collection. The
respondents do not know how and where to dispose electronic waste in an appropriate manner.
Therefore, they resort to disposing their waste outside their premises together with other wastes
as was also stated by Junaidah (2010). Their second option was to give or sell to friends or
relatives with a total of 42 individuals doing this. While some prefer to bring it to recycler
stations/centres but their last priority is to give or sell to collectors. Many are not interested in
giving their e-wastes to collectors. Computers were the most discarded e-wastes into municipal
waste collection or given to collectors with a quantity of 12 and 9, respectively. Cellphones were
preferred to be given or sold to friends or relatives and recycler stations/centres. This showed
that the respondents were not fully aware or were exposed towards the options available in
discarding their e-wastes effectively (Junaidah, 2010). Although, there were recycler
stations/centers available in their neighbourhoods, the respondents were not given proper

81
notification or information in discarding their electronic wastes efficiently. Most of them throw
together with municipal waste without realizing the consequences in near future resulting from
hazardous substances found in e-wastes.
In terms of e-waste recycling, 92 respondents have sent their electronic waste for recycling. As
quoted by Jang (2010) as well, the respondents added that this does call for a stable market,
economic rationality and e-waste recycling is environmentally friendly .
Figure 4.15 Frequency of e-waste discarded by public
Astro
Decod
er
Heater
Refrig
erator
s
Air
condit
ioner
Comp
uter
DVD/
CD
Player
TVCellph
one
Remot
e
contro
ls
Total %
1-2 years 2 2 3 9 15 15 16 32 25 119 24
3-5 years 9 1 12 10 36 17 21 49 35 190 38
>5 years 6 1 8 11 40 20 33 38 33 190 38
0
20
40
60
80
100
120
140
160
180
200
Fre
qu
ency
(N
um
ber
)

82
Figure 4.16 : Different ways of discarding e-wastes by public
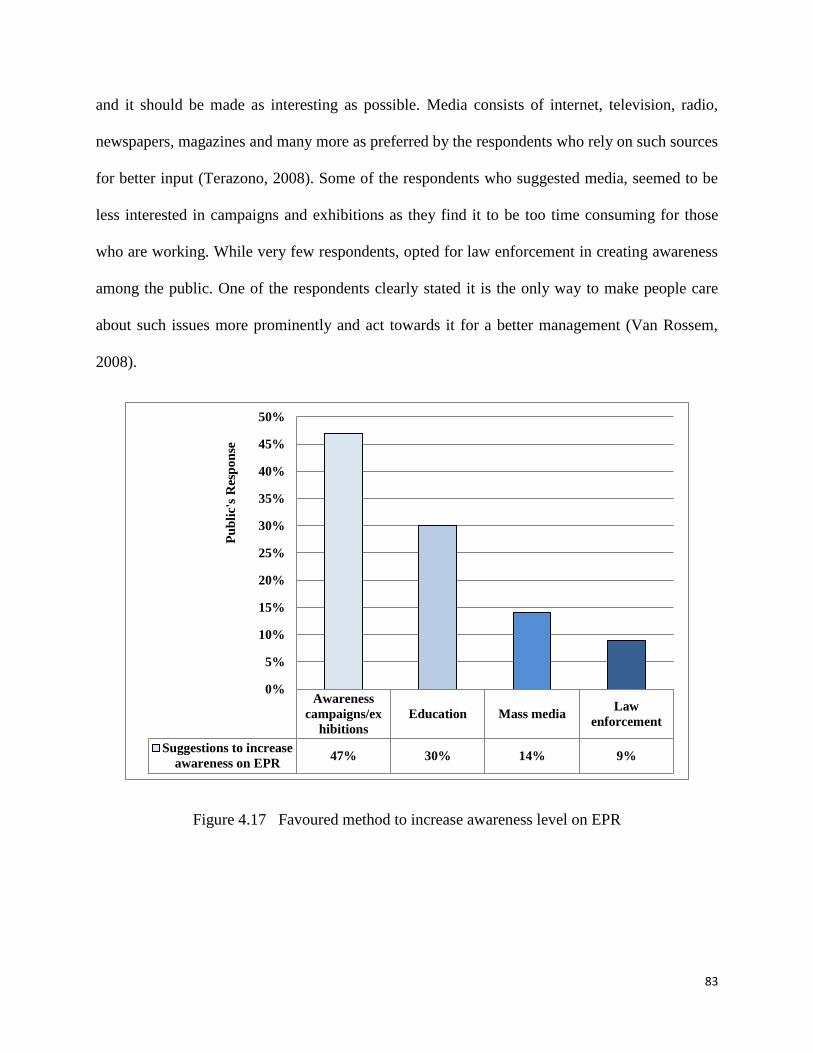
4.3 Suggestions to Increase Awareness Level on EPR and Take-back programme
Figures 4.17 and 4.18 summarized few suggestions given by the respondents on how to increase
the awareness level on EPR, as well as, take-back programme. Majority of the respondents prefer
campaigns and exhibitions to raise their knowledge on EPR and take-back programme (with 47
% and 31% respectively). Many are keen to learn about e-waste, environmental impact on e-
waste and methods to minimize and treat them. They suggested that awareness campaign should
be introduced in schools at primary and secondary level itself instead of focusing on such issues
only at tertiary level. This could be more effective in raising awareness (Mayers, 2007). Based
on the survey, education also played a big role in creating awareness to the public on issues like
EPR and take-back. Hence to create awareness, an exposure needs to be met in each categories
of education (Tang et al., 2010a). Apart from that, mass media is a great tool to create awareness
Air-
cond
ition
er
Heat
er
Astr
o
Dec
oder
DV
D/C
D
Play
er
Refr
iger
ators
Rem
ote
cont
rols
Cell
pho
ne
TV
Com
pute
r
Tota
l%
Discarded in municipal waste 1 1 2 4 4 5 9 10 12 48 31
Give/sell to collector 1 1 1 4 1 2 4 7 9 30 19
Give/sell to friends/relatives 0 0 2 6 3 2 13 9 7 42 27
Bring it to recycler
stations/centers3 0 2 4 2 4 9 6 7 37 24
0
10
20
30
40
50
60
Am
ou
nt
of
e-w
ast
es
83
and it should be made as interesting as possible. Media consists of internet, television, radio,
newspapers, magazines and many more as preferred by the respondents who rely on such sources
for better input (Terazono, 2008). Some of the respondents who suggested media, seemed to be
less interested in campaigns and exhibitions as they find it to be too time consuming for those
who are working. While very few respondents, opted for law enforcement in creating awareness
among the public. One of the respondents clearly stated it is the only way to make people care
about such issues more prominently and act towards it for a better management (Van Rossem,
2008).
Figure 4.17 Favoured method to increase awareness level on EPR
Awareness
campaigns/ex
hibitions
Education Mass mediaLaw
enforcement
Suggestions to increase
awareness on EPR47% 30% 14% 9%
0%
5%
10%
15%
20%
25%
30%
35%
40%
45%
50%
Pu
bli
c's
Res
po
nse

84
Figure 4.18 Favoured method to promote Take-back programme
4.4 Company Survey
The phase two of the interview session/ survey was conducted among stakeholders and
management staffs of computer based sectors in electronic industry. The survey was conducted
between September 2011 and May 2012. The list of companies was obtained from Malaysian
Industrial Development Authority (MIDA).
One of the important aspect evaluated, based on the interview/survey, was the factors
encouraging the adoption of EPR in each company which was then assessed through the
Expertchoice software. There were several factors which have encouraged these companies in
adopting an efficient EPR practice. Table 4.2 below shows a brief explanation on the factors that
have encouraged the adoption of EPR among the companies.
Campaign
&
exhibition
Education Mass media
Law
enforcemen
t
Suggestions to promote take-
back programme31% 28% 22% 19%
0%
5%
10%
15%
20%
25%
30%
35%
Pu
blic
's R
esp
on
se

85
Table 4.2 Factors encouraging the adoption of EPR
Factors Brief description
Costs Savings Many of the voluntary take-back and recycling initiatives have been
sustained by costs savings. Some companies in the electronics
industry have discovered they can make money by recovering and
reusing valuable components and high-pric ed metals.
Environmental Stewardship All of the companies interviewed have adopted environmental
stewardship as a corporate ethic. They see EPR initiatives as a
proactive way of demonstrating their commitment to this corporate
ethic.
Product Innovation Many of the companies found that extending responsibility to
additional stages of the life-cycle resulted in product innovations.
This either saved money through more efficient manufacturing or
allowed cost savings in materials use.
Customer Satisfaction & Loyalty Consumer products producers, particularly some computer
manufacturers, see product upgrades, take-back and recycling
programs as a means to increase customer satisfaction and loyalty.
Green Marketing All of the companies produce products that are sold to consumers
who are increasingly concerned about the environmental
performance of the products they purchase.
Take-back Many companies have adopted to this take-back initiative in a
voluntary approach. This demonstrates the further progress in end-
of- life management of the manufacturers products.

86
4.5 Company Profile
4.5.1 Company A
Company A is a well-known company worldwide headquartered in Round Rock, USA. A
computer based company which manufactures computers, laptops, server and storage solutions,
projectors, monitor screens, and other computer peripherals (Atasu et al., 2011). Company A
adopted a direct-selling business model in contrast to its competitors in the same industry which
surpasses retailers, and configures computers to individual customer specifications (Dell, 2009a).
In 2011, the company had revenues of 50.9 billion € and employed 103,300 people (Dell 2012b).
The company has market share in the European PC market with an estimation of 10.5% in the
fourth quarter of 2011 (Gartner Inc, 2012a).
One of the company’s vision is to ensure that all electronic products and retired IT assets
generated both from their sales, services, manufacturing operations and customers are properly
managed prior to potential reuse, through to final disposition (Smith and Wright, 2004).
Company A has grown by both increasing its customer base and through acquisitions. (Puckett et
al., 2005). According to Resource Recovery Fund Board (2006), Company A enjoyed a steady
growth and gained market share from competitors even during industry slumps. The company
achieved and maintained the number one rating in customer service and PC reliability, year after
year.
Company A has also implemented a general policy of manufacturing its products close to its
customers in minimizing the delay between purchase and delivery. This also allows for
implementing a manufacturing approach which is just in time, to minimize costs (Gartner Inc,
2012a).

87
4.5.2 Customer Satisfaction and Loyalty in influencing Adoption of EPR in Company A
Company A gives priority towards their Customer Satisfaction and Loyalty (Figure 4.19). The
Company has long understood on how to build and maintain their customer’s confidence based
on the adherence to a set of core practices and principles. Customer concerns, needs and
requirements are communicated by customers and acted upon daily within the organization.
According to Canning (2006), customer loyalty is defined as “a deeply held commitment to
repatronize a preferred service or product consistently in the future. Customer’s loyalty usually
expresses an intended behaviour related to the service, product and/or the company. Customers
may be loyal due to a number of factors – high switching barriers, lack of real alternatives,
satisfaction with currents services/products, price, words of mouth and so forth (Electronics
Takeback Coalition, 2010).
Company A has been leading the industry by continually innovating a model perfectly that often
meets and exceeds the expectation level of customers (Canning, 2006). Many other electronic
companies which are principal competitors are now approaching similar status in the industry by
following many of Company A’s practices and policies for customer relationship management
(Ismail et al., 2006). Adding to that, Company A has consistently set the standard and has
established a strong sense of trust among its customers, for promoting the most positive customer
perceptions (Dempsey et al., 2010).
Based on a survey done by Technology Business Research (TBR) (2012), the result of a quality
satisfaction experience done towards Company A for any customer has increased loyalty. TBR
includes in its studies, various measurements in determining customer’s loyalty based on a 1-5
point scale. Based on this evaluation, customers express their loyalty levels towards the products
sold by Company A. This is due to the fact that this company has a ready access to sales and

88
service data, and was able to find patterns. Eventually, the direct sales model gave A an
economic advantage, the company was able to leverage this into providing even better services
to their customers.
Figure 4.19 : Factors encouraging Adoption of EPR in Company A
4.5.3 Company B
Company B is an American multinational information technology corporation headquartered
in California, United States. It is one of the world’s largest IT sales company that provides
products, technologies, software, solutions and services to consumers, small, medium and large
sized businesses (SMBs), including customers in government, health and education sectors (HP,
2011a). The company has been world’s leading PC manufacturer since 2007 fending of a
challenge by Chinese manufacture Lenovo. Their major product lines include personal
0% 5% 10% 15% 20% 25%
Environmental Stewardship
Take-back
Product Innovation
Green Marketing
Costs Savings
Customer Satisfaction & Loyalty
Pri
ori
ties
Environment
al
Stewardship
Take-backProduct
Innovation
Green
Marketing
Costs
Savings
Customer
Satisfaction
& Loyalty
Company A 12% 14% 15% 18% 19% 22%
Company A(Manufacturing)

89
computing devices, enterprise, and industry standard servers, related storage devices, networking
products, software and a diverse range of printers, and other imaging products (HP, 2012a).
The company markets its products to households as well as other businesses through online
distribution, consumer-electronics and office-supply retailers. It specializes in developing and
manufacturing computing, data storage, and networking hardware, designing software and
delivering services (Herold, 2007). Their high-performance businesses are those that effectively
balance current needs and future opportunities, consistently outperform peers in revenue growth,
profitability and total return to shareholders (Kumar et al., 2008). Among the values of the
company is a deep respect for the environment, and an ingrained commitment to reducing our
impact today and building a sustainable global economy tomorrow (Deutz, 2009).
4.5.4 Take-back in influencing Adoption of EPR in Company B
Company B has been providing global recycling solutions in over 45 countries and regions
which are environmentally friendly when compared with many other computer based companies
(HP, 2011b). The company is highly committed to the standards of recycling around the world.
Ahead of legislative requirements in Asia, B offered hardware recycling services to commercial
business customers in nine countries and regions, including China (Gartner Inc, 2012a).
Company B has officially launched Planet Partners return way back in 1987 and invented
recycling program inkjet print cartridges in 1991. In 1997, the inkjet print cartridges were added
to the recycling program. Globally, it has recycled 453,592 tonnes of hardware and print
cartridges (HP, 2012b). None of the print cartridges were sent to landfill. Plastics and metals
from recycled cartridges have been utilized to make a range of new products such as automotive

90
parts, clothes hangers, fence posts and shoe soles. On the whole, company B recycles and
recovers up to 98 percent of returned print cartridge materials for energy, by weight, worldwide
(Basiye, 2008).
This explains the data generated from Expertchoice as shown in Figure 4.20, which stated that
take-back activity has been the company’s main priority in support of their EPR practice.
Company B takes a centralized approach towards their take-back programme which is conducted
by Take- Back Operations Organisation (TBOO) and Environmental Business Management
Organisation (EBMO). TBOO is responsible for the management and implementation of both
individual and collective schemes (Hischier et al., 2005). EBMO took responsibility over
monitoring and compliance assurance (Hischier et al., 2005). The organization also covers the
whole region of Europe, Middle East and Africa, unlike many other companies, which delegate
take-back tasks partially or fully, to individual country subsidiaries (HP, 2011b).
Company B has been working with a network of vendors in 67 countries and territories
worldwide to collect, process for resale, and/or recycle returned products (Greenpeace, 2011a).
Many of their customers responsibly choose to return unwanted IT equipment, making the
company’s product return and recycling programs a commercial priority (Ian, 2009). Thus, the
product take-back and recycling solutions also demonstrates Company B’s commitment to
environmental sustainability. In 2011, the company achieved a milestone of recycling 2 billion
kg of electronic products and supplies. Customers can return used ink and LaserJet toner
cartridges to authorized retail locations or collection sites for recycling through the Planet
Partners program (HP, 2012a). Plus, through the company’s ‘’closed loop’’ recycling process,
original ink and LaserJet toner cartridges were reduced to raw materials that can then be used to
make new cartridges, as well as, other metal and plastic products (HP, 2012b).

91
Figure 4.20 : Factors encouraging Adoption of EPR in Company B
4.5.5 Company C
Company C is one of Sweden's largest companies, which is a provider of telecommunications
equipment, data communication systems, and related services covering a range of technologies
including mobile networks (Sony, 2011a). The company has become the world’s largest mobile
telecommunications equipment maker in mid 2012. It enjoys the unique ability in providing
complete cellular solutions; from planning, engineering and supplying all constituent parts
(Shinn, 2005). Company C believes that telecommunication contributes to economic prosperity,
social equity and environmental performance (Sheehan and Speigelman, 2005).
Moreover, this company actively seeks in reducing the environmental impact of products using
Life Cycle Assessment (LCA) and Design for Environment (DfE) throughout the value chain to
0% 5% 10% 15% 20% 25%
Costs Savings
Environmental Stewardship
Customer Satisfaction & Loyalty
Product Innovation
Green Marketing
Take-back
Pri
ori
ties
Costs SavingsEnvironmenta
l Stewardship
Customer
Satisfaction &
Loyalty
Product
Innovation
Green
MarketingTake-back
Company B 12% 13% 15% 18% 20% 22%
Company B (IT sales)

92
measures that help customers improve environmental performance and end-of-life treatment of
their products (Walls, 2006]. This include raw material extraction, manufacturing, transport, use
and end-of-life treatment (Smith and Wright, 2004).
For improved efficiency, Company C has further facilitated recycling and recovery of products
for their customers (Sony, 2011a). Apart from complying with legislation, it has helped to
minimize costs while reducing negative impacts to the company, environment and their
customers’ brands. Overall, their aim is to reduce the end-of-life impact of products, while
making the process cost-neutral as well as creating market opportunities and competitive
advantage (Walls, 2006).
4.5.6 Costs savings in influencing Adoption of EPR in Company C
Figure 4.21 indicates that, costs savings has been an important factor in pushing towards the
adoption of EPR in Company C. Its Research & Development facilities are based in Tokyo,
Japan, Chennai, India; Lund, Sweden; Beijing, China and Silicon Valley in U.S.A (Van Rossem,
2008). However, one of the biggest challenges is to ensure that the management of products are
smooth and efficient between its many global positions. At the same time, the company has to
help improve on the operational efficiency as the network of partners and vendors expand
(UNEP and UNU, 2009). Their substantial cost savings have been achieved by reducing local
agency costs, overall costs through improved efficiency (for example, less duplication of effort
and less wastage), and reducing production costs through group buying (UNESCAP and IGES,
2007).
Company C has greater visibility of market spending habits and spend distribution across local
markets. It has massively reduced its labour costs in which its product launches are now

93
managed by a single account manager instead of a dedicated team. Moreover, displaying more
consistent brand message across local markets with more consistent collateral quality
(Townsend, 2011).
Figure 4.21 : Factors encouraging Adoption of EPR in Company C
4.5.7 Company D
Company D is also a Japanese multinational conglomerate corporation headquartered in
Kōnan Minato, Tokyo, Japan. One of the leading manufacturers of electronic products for the
consumer and professional markets, Company D has been ranked 87th on the 2012 list
of Fortune Global 500 (Greenpeace, 2011a). Its diversified business is primarily focused on the
electronics, game, entertainment and financial services sectors (Kautto, 2009).
These make the company one of the most comprehensive companies worldwide. Its
manufactured consumer products include laptops, mobile phones, video and audio entertainment
0% 5% 10% 15% 20% 25%
Customer Satisfaction & Loyalty
Product Innovation
Take-back
Green Marketing
Environmental Stewardship
Costs Savings
Pri
ori
ties
Customer
Satisfaction &
Loyalty
Product
InnovationTake-back
Green
Marketing
Environmental
StewardshipCosts Savings
Company C 13% 13% 15% 18% 19% 22%
Company C (Telecommunications)

94
devices, digital imaging products and medical equipment (Huisman et al., 2007). In November
2011, Company D was ranked 9th in the Guide to Greener Electronics with other major
electronics companies on their contribution towards environmental work. The company has
improved on its ranking based on the double standards in their waste policies (Hischier et al.,
2005). Company D has also received full marks for the efficiency of its products and highest
score in energy policy advocacy after adopting an unconditional 30% reduction target for
greenhouse gas emissions by 2020 (Huisman et al., 2007).
4.5.8 Costs savings in influencing Adoption of EPR in Company D
Company D also primarily conducts strategic business planning of the group, research and
development (R&D), planning, designing and marketing for electronics products (Ahmed, 2011).
Moreover, the company runs an extensive individual take-back programme for PCs and
televisions, which are treated individually in the company’s own recycling plants which save
costs (Greenpeace International, 2008). Based on the feedback received from the management of
the company and analysis from Expertchoice, the results displayed in Figure 4.22 has indicated
that the company gives priority in reducing its end-of-life costs. The company has been
practicing two ways in reducing its costs (Knight et al., 2009). First, in ensuring that their costs
do not exceed than what is required, they begin with optimizing their compliance. This is
followed by manufacturing products that depends on specific raw material and are convenient to
be recycled as well (Dempsey et al., 2010). By doing this, the company has seen progress
especially when competing on WEEE market with regards to the costs of their take-back
compliance and design changes of their products (UNESCAP and IGES, 2007).

95
Studies done by Atasu et al., (2011), have confirmed Company D’s approach towards reaching
their environmental target of cost reduction. The company has come up with a ‘’Road to Zero’’
strategy, an environmental plan in achieving zero environmental footprint throughout the
lifecycle of its products and business activities by 2050. According to Crul et al., 2007, in
approaching the goal of the strategy, the company‘s global operations were structured into
various groups that formulate their own targets in achieving them. The employees were also
given specific training programmes, as well as, environmental information in achieving a level of
competence to perform their duties well towards the company’s strategy (Ahmed, 2011). Hence,
Company D focuses primarily on flagship products to achieve this goal (Sony, 2011a). This is
through the comprehensive Green Management eco-design programme. It is seen as an objective
to minimize their resource use and increase use of recycled materials. Thus, this saves the cost
production and raises their target of increasing the share of recycled materials up to 10%
covering the whole product range (Sony, 2011b).
Figure 4.22 : Factors encouraging Adoption of EPR in Company D
0% 5% 10% 15% 20% 25%
Product Innovation
Take-back
Customer Satisfaction & Loyalty
Green Marketing
Environmental Stewardship
Costs Savings
Pri
ori
ties
Product
InnovationTake-back
Customer
Satisfaction
& Loyalty
Green
Marketing
Environment
al
Stewardship
Costs
Savings
Company D 14% 14% 15% 17% 18% 22%
Company D (Manufacturing)

96
4.5.9 Company E
Company E is an American multinational technology and consulting corporation, with
headquarter in New York, United States (Figure 4.23). The company was founded in 1911 as
the Computing Tabulating Recording Company (CTR) through a merger of three companies.
Their manufacturing involves computer hardware and software, and offers infrastructure,
hosting and consulting services in areas ranging from mainframe computers to nanotechnology.
It employs nearly 270,000 and operates 33 manufacturing, hardware development and research
sites in 14 countries (UNEP and UNU, 2009).
Company E is the largest technology and consulting employer in the world, with approximately
serving clients in 170 countries. The company offers a wide range of services; a broad portfolio
of middleware for collaboration, predictive analytics, software development and systems
management. In utilizing its business consulting, technology and R&D expertise, Company E
helps their customers become "smarter" as the planet becomes more digitally interconnected
(Tsydenova, 2011). This includes working with organizations and governments to build systems
that improve traffic congestion, availability of clean water, and health and safety of populations.
The company has received recognition beyond any commercial technology research organization
(Walls, 2006).
Company E’s corporate environmental policy pledges the company to several EPR-related goals
such as conserving natural resources through material reuse and recycling, including employing
recycled material in products; and developing environmentally sound and energy efficient
products (Atasu et al., 2011).

97
4.5.10 Green Marketing in influencing Adoption of EPR in Company E
Green marketing has been the company’s main priority in adopting an effective EPR practice and
as indicated through analysis using Expertchoice (Figure 4.23). EPR activities, as defined in this
study, were enacted in the company through Environmentally Conscious Products (ECP)
program, which was established in 1992.
Company E has also come up with global financing which includes funding and IT asset disposal
as an early strategy to help secure the execution of green initiatives and lower the total cost of
products (Environment Bureau, 2010). It also contributes asset recovery services solutions in
solving energy challenges by providing disposal solutions towards unwanted IT assets. This
include buyback for assets of value, environmentally-compliant disposal for older assets without
value, and disk overwrite services to help ensure data security (Empa, 2005).
Overall, Company E which prioritizes green marketing, lowered the costs of production,
minimized risks involved, and speed up the return of IT acquisitions. It helps to build strategy of
investments, fuel up innovation, and turn ambitious vision into a tangible solution (Environment
Bureau, 2010).

98
Figure 4.23 : Factors encouraging Adoption of EPR in Company E
4.5.11 Company F
Company F is a Chinese multinational computer hardware and electronics company with its
operational headquarter in North Carolina, United States. The world’s second-largest PC vendor
by 2012 unit sales, their products include personal computers, tablet computers, mobile
phones, workstations, servers, electronic storage devices, IT management software and smart
televisions. The company also markets a line of notebook computers and desktops (Chung and
Murakami, 2008).
Company F has operations in more than 60 countries and products are sold in over 160 countries.
Their manufacturing operations are a departure from the usual industry practice of outsourcing to
contract manufacturers. The focus is on vertical integration in order to avoid excessive reliance
on original equipment manufacturers and to reduce on costs (Goodman, 2008). They did benefit
from its vertical integration after flooding affected hard-drive manufacturers in Thailand, 2011
(Goodman, 2008). Their company continued manufacturing operations by shifting production
0% 5% 10% 15% 20% 25%
Product Innovation
Take-back
Costs Savings
Environmental Stewardship
Customer Satisfaction & Loyalty
Green Marketing
Pri
ori
ties
Product
InnovationTake-back
Costs
Savings
Environmen
tal
Stewardship
Customer
Satisfaction
& Loyalty
Green
Marketing
Company E 13% 14% 15% 17% 20% 21%
Company E (Manufacturing)

99
towards products for which hard drives were still available (Chung and Zhang, 2011). As the
speed of innovation was fast, the company was able to keep up with the pace, control inventory,
to match supply with demand and handle very fast turnover (Chung and Murakami, 2008).
4.5.12 Environmental stewardship in influencing Adoption of EPR in Company F
Company F is committed to an environmentally responsible practice in the communities around
the world. It is working towards building a long-term, comprehensive environmental approach
focused on product design, management and supply chain operations, product end- of- life
management, health and wellness of employees (UNEP and UNU, 2009). Environmental
Stewardship happens to be the driver towards their EPR practice (Figure 4.24). Company F
practices transparency in reporting policies and practices (Henzler et al., 2008). The corporate
environmental policy applies to all its operations and forms the foundation of Environmental
Management System (EMS). It is committed to exhibit leadership in environmental affairs in all
of its business activities (Greenpeace International, 2008). Corporate strategies, policies and
guidelines must support this commitment to leadership in environmental affairs. Each manager
and employee, as well as any contractor working on their site, bears a personal responsibility for
the following objectives:
• Develop, manufacture, and market products that are energy efficient, and can be reused,
recycled or disposed of safely,
• Use development and manufacturing processes that do not adversely affect the environment,
• Rely on internal operations that conserve energy and give preference to renewable over non-
renewable energy sources when feasible,

100
• Participate in efforts to improve environmental protection around the world and share
appropriate pollution prevention technology, knowledge and methods,
• Conduct self-assessments of company's compliance with this policy and report periodically to
senior executive management,
• Strive to continually improve company’s environmental management system and performance,
• Promptly report conditions that may threaten health, safety or the environment to authorities
and affected parties, as appropriate, and
• Provide appropriate resources to fulfill these objectives (HP, 2012a).
Figure 4.24 : Factors encouraging Adoption of EPR in Company F
0% 5% 10% 15% 20% 25%
Customer Satisfaction & Loyalty
Product Innovation
Green Marketing
Take-back
Costs Savings
Environmental Stewardship
Pri
ori
ties
Customer
Satisfaction
& Loyalty
Product
Innovation
Green
MarketingTake-back Costs Savings
Environmenta
l Stewardship
Company F 13% 15% 15% 17% 19% 21%
Company F (Manufacturing)
101
4.5.13 Company G
Company G is a South Korean multinational conglomerate company headquartered in Samsung
Town, Seoul. As a global company with approximately 190,000 employees and operations in 61
countries worldwide, Company G has applied a strict global code of conduct to all employees
and is fully committed to complying with local laws and regulations (Manomaivibool, 2009). It
comprises of numerous subsidiaries and affiliated businesses, highly diversified, with activities
in areas including construction, electronics, financial services, shipbuilding and medical services
(Huo et al., 2007). From its inception as a small export business in Korea, the company has
grown to become one of the world's leading electronics companies, specializing in digital
appliances and media, semiconductors, memory, and system integration (Henzler et al., 2008).
Today, Company G’s top quality and innovative products and processes are recognized
worldwide (Huo et al., 2007). They, as a group of company have expanded its product lines,
reached, grew its revenue and market share, and has followed its mission of making life better
for consumers around the world. New vision reflects the company’s commitment in inspiring its
communities by leveraging three key strengths: "New Technology," "Innovative Products," and
"Creative Solution" (Huang, 2009). Through efforts of the company in promoting new value for
core networks such as Industry, Partners, and Employees, Company G hopes to contribute to a
better world and a richer experience for all (Khetriwal et al.,2009).
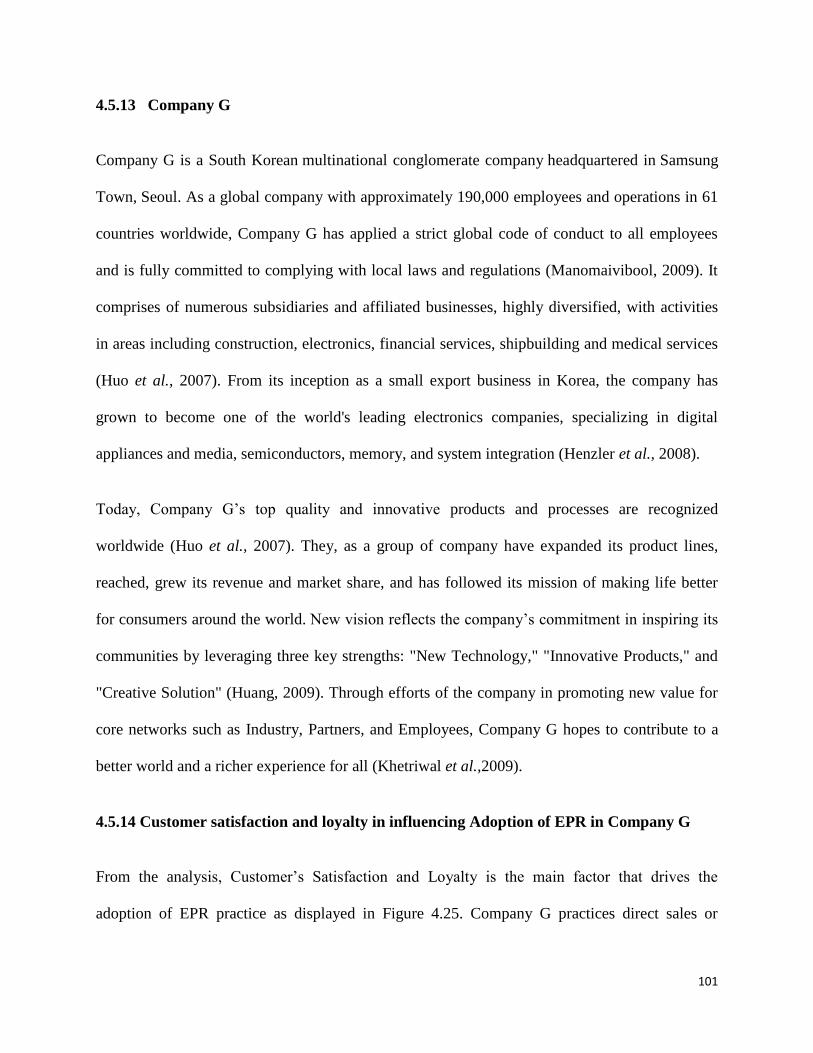
4.5.14 Customer satisfaction and loyalty in influencing Adoption of EPR in Company G
From the analysis, Customer’s Satisfaction and Loyalty is the main factor that drives the
adoption of EPR practice as displayed in Figure 4.25. Company G practices direct sales or

102
distribution with their customers in which they prefer to see them eye to eye and listen to their
customers closely. In 2011, Company G has gathered wide ranging (Voice of Customers) VOC
responses on stages of processes, from development through production (Philips, 2012b). Based
on the responses, the company maintained the objective of improving their overall quality of
products, as well as, addressing basic customer complaints. Moreover, the company monitors
customer point-of-contact departments, to improve VOC response procedures more effectively
(Philips, 2012d). Daily inspection meetings are also conducted in customer response related
departments, such as sales, quality, development, technology and production, in providing
comprehensive and quick responses on various issues on customers (Philips, 2012b).
The efforts to maximize customer satisfaction and minimize customer complaints are encouraged
through these active and prompt channels of communication. In 2011, Company G conducted a
consumer survey on 2,400 users of digital devices around the world to collect respondents'
opinions, as well, as to identify end consumers‘ needs (Philips, 2011e). They utilized the
collected responses in the survey to develop products that meet customers' expectations by
listening directly to the voice of customers on their priorities. From this, the consumers and
potential customers can access comprehensive information on Company G’s products more
conveniently (Philips, 2012b).

103
Figure 4.25 : Factors encouraging Adoption of EPR in Company G
4.5.15 Company H
Company H is a Dutch multinational electronics company, headquartered in Amsterdam, the
Netherlands, and it manufactures a broad range of communication and electronic equipment. One
of the largest electronics companies in the world and employs around 122,000 people across
more than 60 countries (Philips 2012b). The production of the company continues for Asian
markets, particularly in India and China. Company H is one of the world's top three consumer
electronics companies. The wide range of products is based on the company’s world-leading
digital technology competencies, and designed to enhance consumers’ everyday lives (Jang,
2010).
Company H strives to make the world healthier and more sustainable through innovation. Their
ultimate goal is to improve the lives of 3 billion people a year by 2025 (Babu, 2007). By
0% 5% 10% 15% 20%
Take-back
Green Marketing
Costs Savings
Environmental Stewardship
Product Innovation
Customer Satisfaction & LoyaltyP
riori
ties
Take-backGreen
Marketing
Costs
Savings
Environment
al
Stewardship
Product
Innovation
Customer
Satisfaction
& Loyalty
Company G 13% 15% 15% 18% 19% 20%
Company G (Telecommunication)

104
adopting an Open Innovation strategy and harnessing its relationships with institutes, academics
and industrial partners, The Group of Innovation delivers superior value for customers and
shareholders (Marinelli, 2008). This leverages its company-wide synergies in technology,
research, design, shared competencies and laboratories to bring innovations to the market
effectively.
4.5.16 Green marketing in influencing Adoption of EPR in Company H
Moving into eco-design of products, Company H prioritizes green marketing as their main tool
towards adoption of EPR (Figure 4.26). It has a reputation of playing a vital role in eco design
and innovations, and setting up a systematic approach on environmental issues (Mazzanti, 2009).
The firm has already developed organisational structures to ensure design standards are followed
up. Moreover, many other projects based on eco-design innovations have been launched by the
company (Luo et al., 2011).
As part of the scheme, the Green Flagship Program was introduced, which was renamed to
Green Products in 2007. The programme focuses on the development and promotion of selected
products that have a better environmental performance than any competitive products. To qualify
for the label, a product has to show at least 10% improved environmental performance in one of
six specified Green Focal Areas (Philips, 2011a). The share of green products has expanded
steadily over the last years. In 2011 alone, 39% of the company’s product sales were Green
Products. The company aims to increase the share to 50% by 2015 (Philips, 2012b).
As part of its Green Flagship Program, the company developed a comprehensive environmental
benchmark method, which influenced the work of designers as it provides orientation and
assessment of their concepts. “Environmental benchmarking was seen as the ideal link between
105
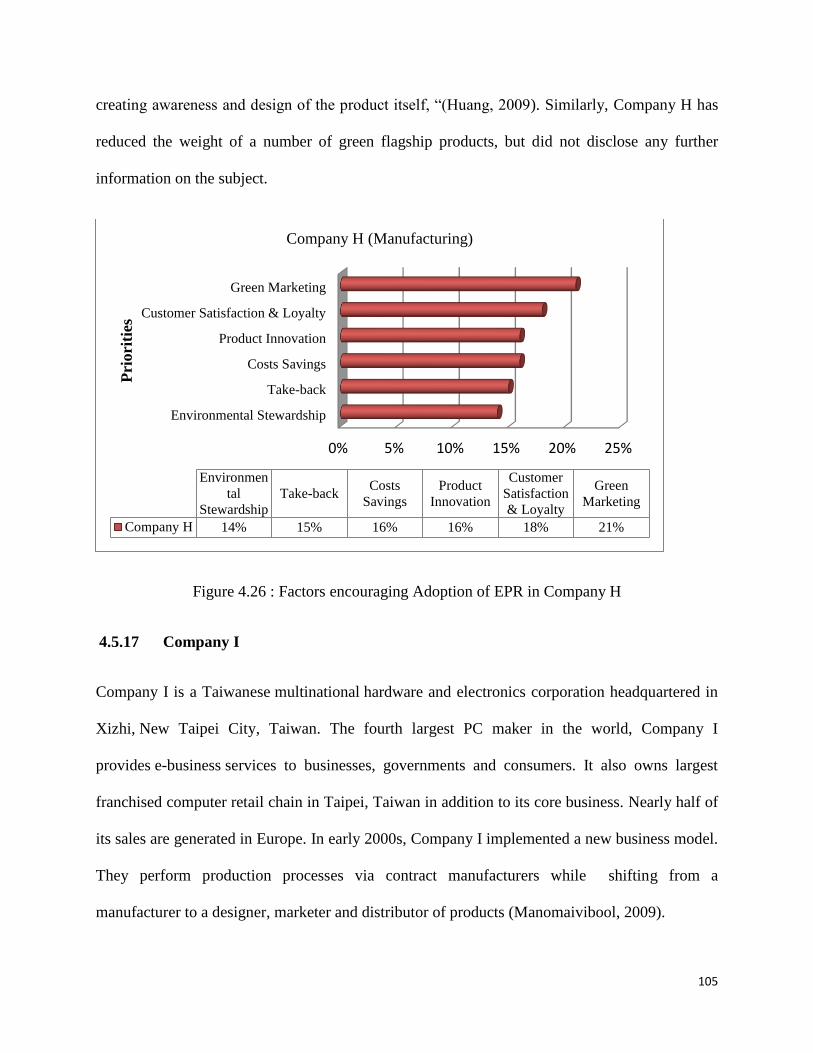
creating awareness and design of the product itself, “(Huang, 2009). Similarly, Company H has
reduced the weight of a number of green flagship products, but did not disclose any further
information on the subject.
Figure 4.26 : Factors encouraging Adoption of EPR in Company H
4.5.17 Company I
Company I is a Taiwanese multinational hardware and electronics corporation headquartered in
Xizhi, New Taipei City, Taiwan. The fourth largest PC maker in the world, Company I
provides e-business services to businesses, governments and consumers. It also owns largest
franchised computer retail chain in Taipei, Taiwan in addition to its core business. Nearly half of
its sales are generated in Europe. In early 2000s, Company I implemented a new business model.
They perform production processes via contract manufacturers while shifting from a
manufacturer to a designer, marketer and distributor of products (Manomaivibool, 2009).
0% 5% 10% 15% 20% 25%
Environmental Stewardship
Take-back
Costs Savings
Product Innovation
Customer Satisfaction & Loyalty
Green Marketing
Pri
ori
ties
Environmen
tal
Stewardship
Take-backCosts
Savings
Product
Innovation
Customer
Satisfaction
& Loyalty
Green
Marketing
Company H 14% 15% 16% 16% 18% 21%
Company H (Manufacturing)

106
Principally engaged in the research, development, design, manufacture and distribution of
personal computers (PCs) and notebook, the Company distributes its products in domestic and
overseas markets (WEEE, 2011b). During the year of 2012, the Company obtained
approximately 65% and 17% of its revenue from the sale of notebook computers and desktop
computers (LG Electronics, 2012a).
The current issue of treating electrical and electronic waste has become a major environmental
concern in this company. The products embody the concept of Individual Producer
Responsibility (IPR) as Company I endeavour to reduce environmental impact throughout each
stage of the product lifecycle. This is by eco-design and providing appropriate recycling channels
in helping consumers to do their part for the environment (UNEP and UNU, 2009).
4.5.18 Take-back in influencing Adoption of EPR in Company I
As shown in Figure 4.27, Company I practiced take-back programme which is their main activity
that contributes towards the adoption of EPR. As part of their commitment to sustainable
operations and corporate social responsibility, Company I continues to expand on ways to help
reduce environmental impact on the I.T. industry. The company has introduced a "Take Back
Program" where the consumers are required to return their unwanted PC, Notebook and LCD to
an authorized recycler. The electronic devices are either cleaned for reuse or dismantled for
recycling (Chung et al., 2011).
With the ‘’Reuse’’ option, the authorized recycler cleans and removes any information stored on
the hard drive and later offered it to the market for those wishing to purchase the product. This
could reduce the amount of electronic devices being sent to landfills. The ‘’Recycle’’ option is to
have the equipment being recycled by the recycler. The items will be dismantled and recyclable

107
components such as plastics and metals are melted down and reused in other items ranging from
cars, furniture and even into other I.T. equipment (Greenpeace International, 2008). With the
Take Back Program, company I has been able to contribute towards an effective EPR practice in
which only 2% of an item goes to landfill. This leads to less energy being consumed, as well as,
reducing carbon emissions.
Figure 4.27 : Factors encouraging Adoption of EPR in Company I
4.5.19 Company J
Company J, is a Japanese multinational electronics and engineering conglomerate corporation
headquartered in Tokyo, Japan. The company is a diversified manufacturer of electrical products,
spanning information and communications equipment and systems, and electronic components
and materials (Herold, 2007). It is a world leader in high technology, an integrated manufacturer
of electrical and electronics products.
0% 5% 10% 15% 20% 25%
Product Innovation
Green Marketing
Customer Satisfaction & Loyalty
Environmental Stewardship
Costs Savings
Take-back
Pri
ori
ties
Product
Innovation
Green
Marketing
Customer
Satisfaction
& Loyalty
Environmenta
l StewardshipCosts Savings Take-back
Company I 13% 14% 15% 17% 20% 21%
Company I (IT sales)

108
The Group aims to become an even stronger global contender, ahead of others, and capitalize on
the coming trends in the field of environment. In 2010, after Hewlett Packard (HP), Lenovo,
Dell, and Acer, Company J was the world's fifth-largest personal computer vendor measured by
revenues (Steiner, 2007). The company is focused in transforming business structure which is a
challenging task in global business of environment (Sony, 2011b).
Company J acts with complete integrity in every aspect of their activities. They place an utmost
priority on respect for people, strict safety and full compliance with all laws and regulations, as
the company strives to be one that is respected, trusted and admired by people around the globe
(Steiner, 2007).
4.5.20 Customer satisfaction and loyalty in influencing Adoption of EPR in Company J
According to Figure 4.28, Company J prioritized Customer Satisfaction and Loyalty in practicing
an efficient EPR practice. Previously, Company J has been focusing only on communicating to
department managers about the standards on customer service. This was done through their
program titled ‘’ Customer Loyalty Starts’’ which covers their employees.
Based on the interview/survey done, the company has indicated that the program was initiated to
help step up employees' service levels and help launch service. This was one of their ways to
build their brand through interaction with their customers.
The elements of the program are:
Enterprisewide customer loyalty training that emphasizes the impact of interfacing with
customers. The training is conducted at executive level and includes customer experience
scenarios,

109
A voice-of-the-customer committee that addresses issues as they arise. Customer feedback
is routed to the employee/department responsible for resolving the problem,
"Customer Loyalty Starts With Me" posters mounted throughout headquarters and in field
offices to keep employees focused on the message. Each poster features tips from
employees who have been recognized for providing exceptional service,
A "toolbox" the company has given to each employee that's filled with devices to help them
master customer service skills, such as a mirror to remind them to smile when talking to
customers, and thank-you notes to conduct personal follow-up.
The company has also established a Customer Satisfaction Policy in 2003, which aims to
enhance customer satisfaction (CS) through communication with customers, as well as, provision
of safe and innovative products and services (Environment Bureau, 2010).
Figure 4.28 : Factors encouraging Adoption of EPR in Company J
0% 5% 10% 15% 20%
Product Innovation
Green Marketing
Costs Savings
Take-back
Environmental Stewardship
Customer Satisfaction & Loyalty
Pri
ori
ties
Product
Innovation
Green
Marketing
Costs
SavingsTake-back
Environment
al
Stewardship
Customer
Satisfaction
& Loyalty
Company J 14% 15% 16% 17% 18% 20%
Company J (Manufacturing)
110
4.6 Comparative Analysis Among Companies
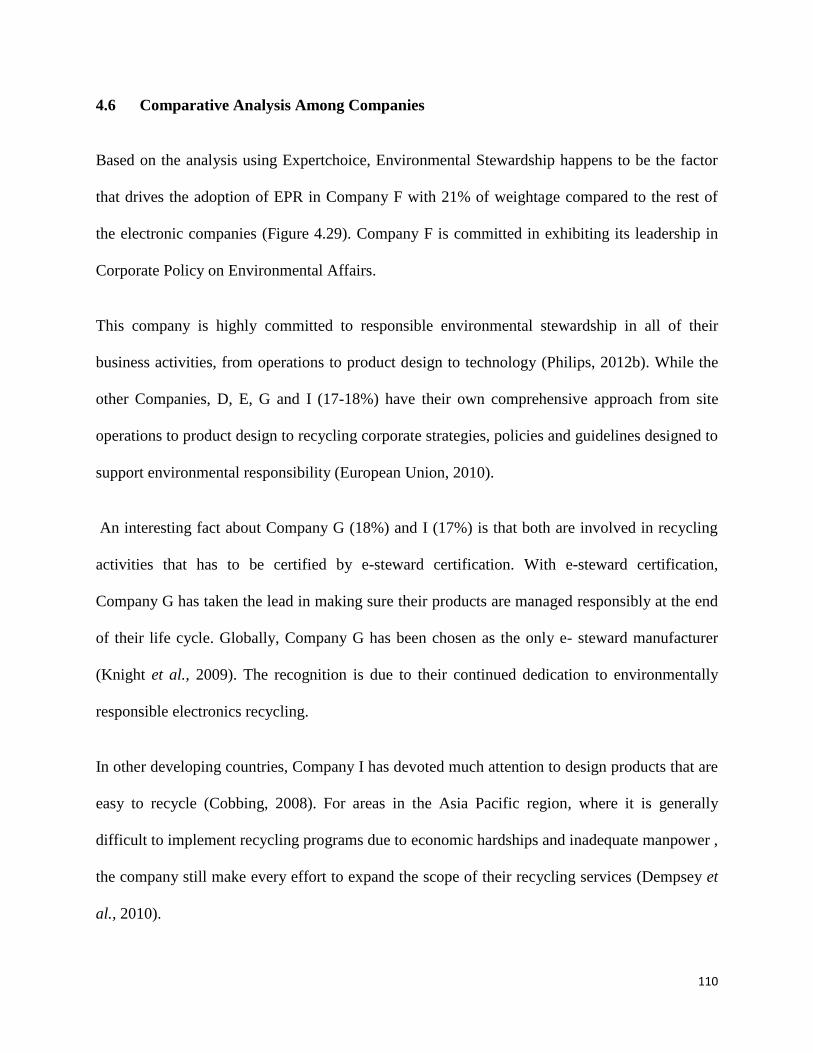
Based on the analysis using Expertchoice, Environmental Stewardship happens to be the factor
that drives the adoption of EPR in Company F with 21% of weightage compared to the rest of
the electronic companies (Figure 4.29). Company F is committed in exhibiting its leadership in
Corporate Policy on Environmental Affairs.
This company is highly committed to responsible environmental stewardship in all of their
business activities, from operations to product design to technology (Philips, 2012b). While the
other Companies, D, E, G and I (17-18%) have their own comprehensive approach from site
operations to product design to recycling corporate strategies, policies and guidelines designed to
support environmental responsibility (European Union, 2010).
An interesting fact about Company G (18%) and I (17%) is that both are involved in recycling
activities that has to be certified by e-steward certification. With e-steward certification,
Company G has taken the lead in making sure their products are managed responsibly at the end
of their life cycle. Globally, Company G has been chosen as the only e- steward manufacturer
(Knight et al., 2009). The recognition is due to their continued dedication to environmentally
responsible electronics recycling.
In other developing countries, Company I has devoted much attention to design products that are
easy to recycle (Cobbing, 2008). For areas in the Asia Pacific region, where it is generally
difficult to implement recycling programs due to economic hardships and inadequate manpower ,
the company still make every effort to expand the scope of their recycling services (Dempsey et
al., 2010).

111
Company F (21%) is significantly higher than Company A (12%), with 0.001 value at p <
0.05.This was analyzed using SPSS software-One way anova . Company A is only committed
towards Environmental Stewardship within their organization. The particular company only
supports legislation expectations based on reasonably convenient methods. Recycling legislation
has been one of its commitment.
Figure 4.29 : Company’s priority towards Environmental Stewardship
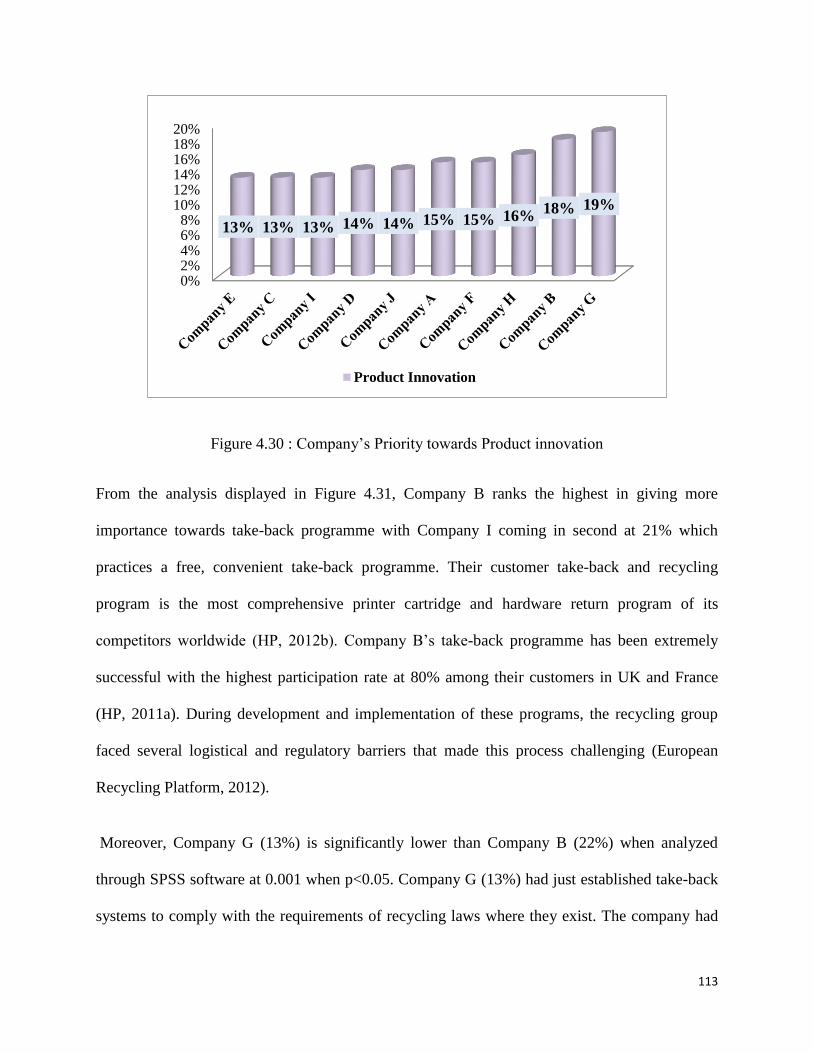
Product innovation is a major influence in Company G towards an efficient EPR practice with a
percentage of 19% as displayed in Figure 4.30. Company B comes in second with just a minor
difference of 1% at 18%. Their strategy of delivering high quality products with an emphasis on
design is paying off and the company is confident of its future performance (Deutz, 2009).
Products represent the largest share of Company B’s (18%) environmental footprint. Their
0%
5%
10%
15%
20%
25%
12% 13% 14% 17% 17% 18% 18% 18% 19% 21%
Environmental Stewardship

112
approach to product innovation responds to evolving customer needs and ex pectations
(European Recycling Platform, 2012).
Company G has also recently launched a new green memory website. This is to boost its efforts
to increase both manufacturing consumers and customers global interest in green IT and eco-
friendly products and solutions. This provides information on the company’s green product
strategies and green-focused partners and industry-wide green IT trends (Masanet and Horvath,
2007).
Company A (15%) in particular, has been creatively bringing innovative products to life by
combining the technical genius of their production team with the creative artistry of their design
teams. The company has come up with best products as part of their Green Collection with new
options for energy savings and greener materials (Atasu et al., 2011). Customer feedback is the
key to product innovation in Company F. According to Bogue (2007), Company F owns a
strong, proven global engine for innovation in developing countries. Their focus is towards
development of products with innovative features in a bid to boost sales (European Union, 2010).
In terms of significant difference between Company F and Company E, C and I (the least to be
prioritizing Product Innovation in their company), Company F is significantly higher at 0.006,
when p< 0.05. This is based on their response towards the importance of product innovation in
their company. Company E (13%) focuses more on Asset Recovery Solutions of their products
rather than innovation (Mayers, 2007). Company C(13%) has admitted that its image as an
innovator has ‘’dissipated’’ over the past two years .This is due to few quality problems, market
coverage as well as competition from other companies in the industry (Masanet and Horvath,
2007).
113
Figure 4.30 : Company’s Priority towards Product innovation
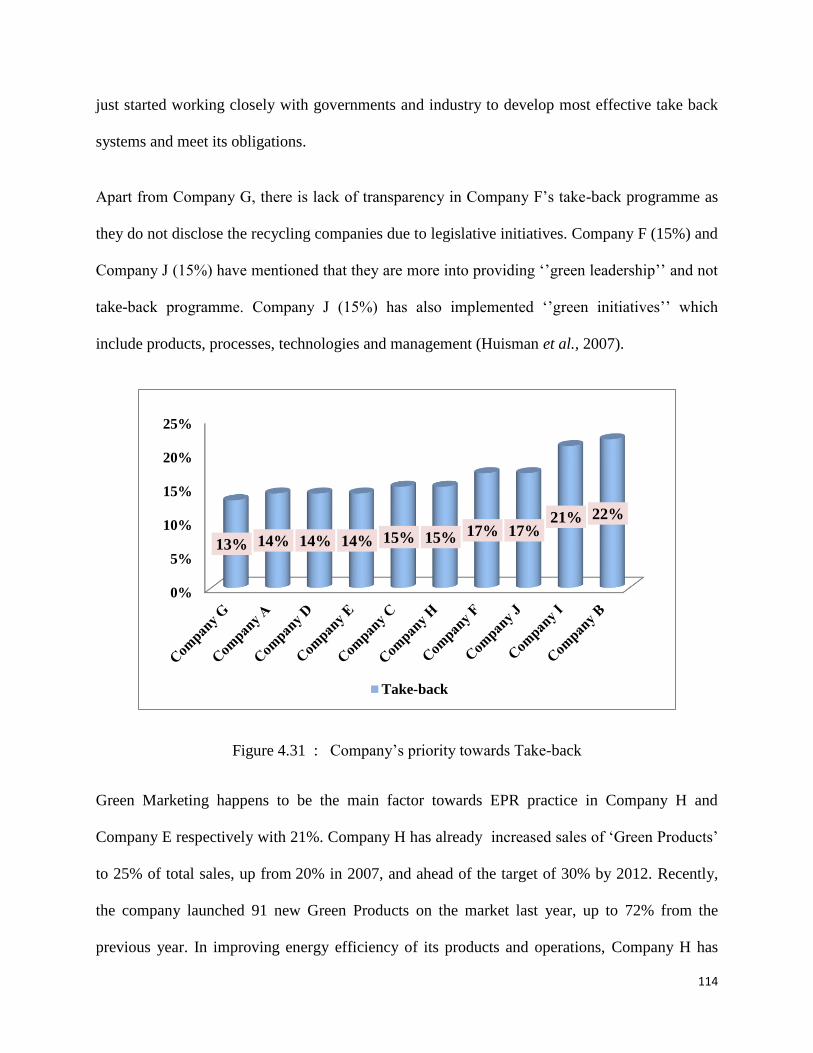
From the analysis displayed in Figure 4.31, Company B ranks the highest in giving more
importance towards take-back programme with Company I coming in second at 21% which
practices a free, convenient take-back programme. Their customer take-back and recycling
program is the most comprehensive printer cartridge and hardware return program of its
competitors worldwide (HP, 2012b). Company B’s take-back programme has been extremely
successful with the highest participation rate at 80% among their customers in UK and France
(HP, 2011a). During development and implementation of these programs, the recycling group
faced several logistical and regulatory barriers that made this process challenging (European
Recycling Platform, 2012).
Moreover, Company G (13%) is significantly lower than Company B (22%) when analyzed
through SPSS software at 0.001 when p<0.05. Company G (13%) had just established take-back
systems to comply with the requirements of recycling laws where they exist. The company had
0%2%4%6%8%
10%12%14%16%18%20%
13% 13% 13% 14% 14% 15% 15% 16% 18% 19%
Product Innovation
114
just started working closely with governments and industry to develop most effective take back
systems and meet its obligations.
Apart from Company G, there is lack of transparency in Company F’s take-back programme as
they do not disclose the recycling companies due to legislative initiatives. Company F (15%) and
Company J (15%) have mentioned that they are more into providing ‘’green leadership’’ and not
take-back programme. Company J (15%) has also implemented ‘’green initiatives’’ which
include products, processes, technologies and management (Huisman et al., 2007).
Figure 4.31 : Company’s priority towards Take-back
Green Marketing happens to be the main factor towards EPR practice in Company H and
Company E respectively with 21%. Company H has already increased sales of ‘Green Products’
to 25% of total sales, up from 20% in 2007, and ahead of the target of 30% by 2012. Recently,
the company launched 91 new Green Products on the market last year, up to 72% from the
previous year. In improving energy efficiency of its products and operations, Company H has
0%
5%
10%
15%
20%
25%
13% 14% 14% 14% 15% 15% 17% 17% 21% 22%
Take-back

115
announced new voluntary recycling initiatives in India, Brazil, Argentina and China (Philips,
2012c). Company H, promotes Green Products that reduces costs, energy consumption and CO2
emissions (Bohr, 2007; Kojima, 2005).
Whereas, Company E has to be applauded for how serious it is about the Smarter Planet
campaign. The company explains its strategy in hundreds of customer examples and case studies
(European Union, 2010). In many countries, Company E has been offering solutions to
household consumers for the end-of-life management through their voluntary initiatives or
programs (Nguyen et al., 2009).
The company with least priority, Company I(14%), has responsibilities too in giving back to the
community and this is done through R&D to meet the needs of today. Recently, Company I has
launched biodegradeable, eco-friendly product in addition to user needs, functionality and added
value (Deutz, 2009). However, Company I is not significant compared to Company B at a
difference of 0.26 which is higher than 0.05.
Other companies such as, Company A(18%) and Company B(20%) are taking different
approaches towards sustainable green products. In terms of ‘green marketing’, Company B is
better than Company A in removing toxic compounds from their design of products. Both have
effective competing sustainability strategies, but the marketplace will not tolerate in near future
as one is emphasizing in removing toxic compounds from manufacturing the other is focused on
recycling through take back programs (Bogue, 2007).

116
Figure 4.32 : Company’s Priority towards Green Marketing
In Figure 4.33, Companies C and D are leading companies in Japan as well as the largest
manufacturers in electronics. As far as costs savings factor is concerned, both the companies
focus towards the quality and differentiation of products which are sold to consumers. They are
also actively involved in recycling of computers and PC’s (Electronics Take-back Coalition,
2010).
One of the key factor in the product orientation strategy of Company C has been its branding.
According to Crul, '' It is wide recognised that brands are one of the most valuable assets that
firms own''. This explains why improvement on product design of the company has become a
priority so as to maintain its brand name and image which customers hold about its products
(Crul et al., 2007). Recently, the brand name of Company C with their sophisticated features,
which was launched known as green heart cell phone has a positive image in the minds of their
consumers (Dempsey et al., 2010).
0%
5%
10%
15%
20%
25%
14% 15% 15% 15% 17% 18% 18% 20% 21% 21%
Green marketing

117
Company D has smartly differentiated products with the aim of targeting different segments of
the market, since it is difficult for a single product to satisfy the needs of different consumers.
Adding to that, the company also aimed to gain leadership in the mobile phone industry using a
strong brand name (Electronics Take-back Coalition, 2010). Overall, their brand strength has
helped in innovation and creation of .This has helped in creating strategies that its competitors
cannot implement or follow as the brand name. Thus a strong brand name can result in a greater
profit margin and the more an organisation achieves its objectives (Greenpeace, 2011a).
In the context of costs savings, Company B (12%) is not significant when compared with both
companies C and D at a difference of 0.11. The only part of Company B’s costs savings is their
return and recycling program. Company B can help recapture value from existing equipment by
trading it in for new technology. The company only helps in saving resources and lower the
wastes.
Figure 4.33 : Company’s Priority towards Costs savings
0%
5%
10%
15%
20%
25%
12% 15% 15% 16% 16%
19% 19% 20% 22% 22%
Costs savings

118
Company A is dependent towards Customer’s Satisfaction and Loyalty in adopting an efficient
EPR practice in their company as displayed in Figure 4.34. The customers have known the
company’s reputation for long-term value that continually attracts new customers. In contrast to
its competitors, Company A adopted a direct-selling business model, which surpasses retailers,
and configures computers to individual customer specifications (Herold, 2007)
Company J, which comes in second directly distribute and sell accessories with other countries
such as Austria, Sweden and New Zealand by giving more specification towards the customers
they deal with (Electronics Take-back Coalition, 2010). Both the companies earn customer trust
through its commitment to customer satisfaction, achieved largely due to their renowned process
refinement abilities (Dell, 2012a).
Other than that, Company G, E, and J (20%), is working towards making their product a brand
which is lovable among its customers. Company E, retains their valuable customers by
improving satisfaction and loyalty. According to the management of Company G, they believe
their brand is only as strong as the people who support it. Therefore, they are working diligently
in meeting their customers’ needs as the company continues to grow. In Company J, high
customer, employee and partner satisfaction levels are the main drivers of their business and
long-term profitability (Dell, 2012b).
Company C(13%) and Company F(13%) have been the least in prioritizing Customers’
Satisfaction and Loyalty. Moreover, both the companies are not significant when compared to
Company A(22%). Their customers delight and satisfaction was largely restricted to the quality
and reliability of the companies products. This is largely due to competitive strength from other
companies in the industry. Compared to Company A, Company F has been unsuccessful at

119
transitioning strong customer satisfaction and loyalty. Company A’s strong customer loyalty
remains a competitive advantage.
Figure 4.34 : Company’s Priority towards Customer’s Satisfaction & Loyalty
4.7 General Discussion
In this study, for EPR to be successful, the public participation is very important. The public
attitude towards issues on EPR and E-waste is closely related to the level of education received
by the respondents. In many cases, groups which are highly educated were easier to understand
the necessities of certain action as compared to the less educated (Fauziah, 2009). The awareness
and concern among public are discussed with other studies involving developed or developing
nations.
0%
5%
10%
15%
20%
25%
13% 13% 15% 15% 15% 18% 20% 20% 20%
22%
Customer's Satisfaction & Loyalty

120
The survey had showed that very few respondents were aware on the concept of EPR and E-
waste due to the lack of knowledge or exposure on such issues. Based on a study conducted by
Jang (2010) on Extended Producer Responsibility (EPR) as a policy tool in Hong Kong, he has
stated that the scarcity of knowledge among the public has been hindering the implementation of
EPR as well. Most of the respondents just have basic knowledge or know little about it.
Moreover, not enough or inconvenient recycling stations impede the people from discarding their
WEEE properly.
In Malaysia, many respondents do feel that government’s involvement is important in
strengthening the legislation in managing WEEE. It is not surprising that only 29% of the
respondents know about EPR and again it is the government’s responsibility to strengthen the
promotion of EPR and convey a clear message to the public. Malaysians do not know the proper
way of disposing their e-wastes as there is no information on how to dispose of e-waste
appropriately. Hayashi et al.,(2009), have indicated there are many sources of information on
how to dispose of electrical and electrical appliances at the end of life of its product.
Many respondents from this survey, have also mentioned on lack of information as well media
on disposal of e-waste. Advertising has been one of the best way of informing the public on
handling and disposing of e-waste and this was indicated by Junaidah (2010) as well in her
study. In terms of e-waste recycling, many still perceived e-waste as tool that holds a certain
amount of value (Henzler et al., 2008). However, they are not willing to pay for their e-waste to
be recycled. They are unwilling to pay as proved by a study conducted in China, by Li et al.,
(2008) where their public prefer to sell their electronic appliances to get some money rather than
pay for the treatment of the waste.

121
Based on the survey, 50% of the respondents have agreed to participate in e-waste recycling
campaigns or events. However, in Malaysia, it is difficult for the local community to participate
in e-waste recycling as there is no proper regulation enforcing the public to pay for their e-waste.
It would not necessarily be successful if a recycling campaign is organized (Ahmed, 2011).
Overall, the respondents do have concerns on the environmental consequences and awareness
involving issues regarding EPR, e-waste and how EPR would be able to solve problems
associated with e-wastes (Junaidah, 2010).
This study was only confined to multinational companies and not small and medium-sized
enterprises (SMEs) as SMEs were more into family oriented business. Their focus is more on
quality management and competitiveness in the industry. From all the 10 multinational
companies interviewed, the combination of qualitative and quantitative information gained have
generated a basic understanding of EPR and Take-back practices in each company. The most
significant findings were understanding and awareness of EPR practice and e-waste in the
industry. This include the drivers behind the practice of EPR in the industry which was generated
by Expertchoice software in this study. In Malaysia, the existing practice of EPR is restricted
through voluntary participation in multinational companies.
In Japan, based on a study done by Tojo (2004), several promoting factors of EPR practice were
determined and discussed in managing end-of-life management of their products. Societal trends
has been one of the factors in raising awareness on EPR. Some interviewees have mentioned that
by incorporating 3R, would perhaps differentiate the company from other competitors (Bryant,
2009). Same goes to economic benefit and commitment of top management/company’s policy, in
helping the management to gain knowledge about the practice as well as improve the energy

122
efficiency of the product through recycling. Customer’s demand has been a contributing factor as
well in practicing a systematic EPR (Basiye, 2008).
Similar findings in Sweden, also by Tojo (2004), which stated costumer’s demand, regulatory
requirements, economic benefits, corporate culture and green procurement policy as their driving
forces of EPR practice in the company. The management has stated green procurement policy as
their major driving force focusing particularly on the design of the product (Keller, 2011).
Apart from the factors that drives the practice, there are also constraints that hinder such changes
such as costs, lack of demand for recycled materials, conflicts among design priorities, lack of
expertise, and lack of demand from customers (Kumar et al., 2008). In Malaysian context, EPR
initiative seems promising although it should be viewed with cautious optimism based on past
trends (Agamuthu and Victor, 2011). This is due to delay between policy formulation, formal
adoption and implementation, potentially caused from lack of political will, weak stakeholder
acceptance or policy impracticality due to direct adoption of policy practices from other
countries (Agamuthu and Victor, 2011).
The lesson from EPR initiative in stimulating participation of electrical and electronics industry
in Malaysia may yield positive results in short term while awaiting legislative initiatives to
mature in the long term.