chapter-8 discussion of test results -...
TRANSCRIPT
285
CHAPTER-8
DISCUSSION OF TEST RESULTS
8.0 INTRODUCTION
The results of the experimental investigations on Low, Medium
and High grade SCC are discussed as follows.
The discussions are classified into seven phases of study. They are
i). Studies on behavior of fresh and hardened properties of low,
medium and high grades of SCC with GGBS.
ii). Studies on effect of partial replacement of Rice Husk Ash in
GGBS SCC mix on its fresh and hardened properties.
iii) Evaluation of strength efficiency factors of GGBS and RHA in
SCC.
iv). Studies on Stress-Strain behavior of SCC with and without steel
confinement.
v). Studies on flexural behavior of different SCC mixes.
vi). Validation of theoretical moment-curvature values.
vii). Studies on the durability of SCC with GGBS and RHA.
8.1 PROPERTIES OF MATERIALS
The cement used is 53 grade cement of specific gravity 3.15.The
fineness modulus of fine aggregate is 2.625, bulk density 1700 kg/m3
and specific gravity 2.59 indicating that it is fine sand. The coarse
286
aggregate used is of fineness modulus 6.64, bulk density 1560 kg/m3
and specific gravity 2.61.
The admixture is used not to improve the quality of concrete but
to modify the properties of concrete as per special requirements.
GGBS and RHA are the mineral admixtures used in the present study,
apart from chemical admixtures. The GGBS generally reduces the
water demand and improves workability. The factors influencing the
reactivity of GGBS are the chemical composition of slag and the glass
content which is shown in tables 5.1.3.1 & 5.1.3.2. Rice Husk Ash
used is having very high silica content and it is exhibiting high
pozzolanic characteristics contributing to high strength and high
permeability of concrete, these properties are shown in tables 5.1.4.1
& 5.1.4.2. However to achieve adequate workability as well as high
strength in SCC, superplasticisers are necessary, tables 5.1.5.1 &
5.1.5.2 show the properties of superplasticisers used in present
investigation.
8.2. STUDIES ON BEHAVIOUR OF FRESH AND HARDENED
PROPERTIES OF THREE GRADES OF SCC WITH GGBS.
8.2.1. Mix Proportions of Low, Medium and High grade Self
Compacting Concrete with GGBS.
The three grades are designed based on EFNARC method with
coarse aggregate of size 10 mm to get trial mixes. Number of trials is
performed in the laboratory and from these finally design mixes are
arrived. The main investigation is to study the behavior of low,

287
medium and high grades of SCC with GGBS and chemical admixtures
like superplasticizers.
During the initial stage of work the cube specimens of the three
grades M20, M40 and M60 are cast with cement replaced by 10% to
35% of GGBS (at an increment of 5% ) and the specimens are tested
for Compressive strength at 3days and 7days. The Compressive
strengths are compared with that of corresponding grade concrete
specimens without GGBS and found that at 30% GGBS replacement
for M20 and M40 grade SCC mixes the strength was maximum, and
for M60 grade SCC mix the maximum strength was achieved when
GGBS replacement was 25%. .
Based on optimum GGBS percentages arrived from 3days and
7days cube Compressive strengths, the strengths of prisms and
cylinders are studied for 20% to 35% of GGBS replacement at an
increment of 5% and the cube strengths are studied for 10% to 35% of
GGBS replacements at an increment of 5%. With 30% replacement of
GGBS the studies are done only on M20 and M40 grade SCC mixes.
As the M60 grade mix with 25% GGBS has not satisfied the required
the fresh properties of SCC like slump test, V- funnel test and L- box
test, 5% of RHA is added for further studies. The mix proportions of
different grades are represented in the form of pie charts 5.3.1 to
5.3.6.

288
8.2.2 Fresh Properties of Self Compacting Concrete GGBS Mixes
Fresh properties of self compacting concrete mixes with different
percentages of GGBS are studied. The limits for these parameters as
prescribed by the EFNARC specifications are shown in table 5.9.
These values indicate the basic requirements for self compacting
concrete in fresh state. The results of slump cone test, V-funnel test
and L-box test which represents filling ability, passing ability and
segregation resistance are well within the prescribed EFNARC
specifications given in tables 5.2.1.1 to 5.2.1.3. It is observed that the
GGBS based SCC mixes possess self compacting characteristics in
fresh state. The presence of GGBS in the mix improves workability
and makes the mix more mobile but cohesive. This is the consequence
of a better dispersion of the cementitious particles and of the surface
characteristics of the GGBS particles; however it is more sensitive to
variations in the water content than ordinary cement concrete.
8.2.3 Hardened Properties of Self Compacting Concrete GGBS
Mixes
Hardened properties such as compressive strength, split tensile
and flexural strengths are determined by testing specimens of
standard size as per IS specifications. With the selected GGBS mixes,
cubes, cylinders and prisms of standard size are cast, cured and
tested as per IS 516-1959 and the results are tabulated. These results
are discussed as follows.
289
8.2.3.1 Compressive Strength
Cubes of 100 mm size are cast with SCC mixes, cured and tested
as per IS 516-1959 to get compressive strength. The results are shown
in tables 5.4.1.1 to 5.4.1.3 and figures 5.4.1 to 5.4.6. An improvement
of 8.3% & 31.04% in M20 mix and 5.6% & 20.83% in M40 mix was
observed when 7days and 28 days compressive strengths of SCC
mixes produced with 30% GGBS are compared with other mixes
without GGBS. However in case of M60 grade the required target
strength was not achieved when replaced with GGBS, so 5% RHA was
added. Also it is observed that there is decrease in compressive
strength by a maximum of 13% at 3 days for all mixes. This is
because the initial hydration of GGBS is very slow as it depends upon
the breakdown of the glass present in GGBS by the hydroxyl ions
released during the hydration of the Portland cement.
8.2.3.2 Split Tensile Strength
Split tensile strength tests are carried out on cylinders of 150 mm
diameter and 300 mm height using a compression testing machine of
1000 KN capacity as per IS 516-1959. Split tensile strength values at
28 days for the mixes are shown in table 5.6.1 to 5.6.3. The 28 days
tensile strengths of SCC mix with 30% GGBS compared to that of mix
without GGBS is increased by 13.35% in M40 grade, while the tensile
strengths are almost same in M20 grade.
290
8.2.3.3 Flexural Strength
Flexural strength tests are carried out on prisms of size 100 X
100 X 500 mm using flexure testing machine of capacity 100 KN as
per IS 516-1959. The results of flexural strength tests are shown in
tables 5.7.1 to 5.7.3.
It is observed that the values of modulus of rupture obtained by
the flexure test for the SCC mixes are higher than the values obtained
by 0.7√fck for conventional concrete of same strength. The increase is
6.7% and 4.4% for M20 and M40 GGBS mixes respectively, thus
indicating a considerable increase in the flexural strength of SCC mix
made with GGBS when compared to ordinary SCC mixes. The flexural
strength variation is shown in fig 5.7.1.
8.3 STUDIES ON EFFECT OF PARTIAL REPLACEMENT OF RHA IN
GGBS SCC MIXES, ITS FRESH AND HARDENED PROPERTIES
8.3.1 Fresh Properties of Self Compacting Concrete GGBS-RHA
Mixes
The 30% GGBS mixes are partially replaced with RHA in M20
and M40 grades and in case of M60 grade 5% RHA is added.
Quantities, fresh properties and hardened properties of self
compacting concrete mixes with partial replacement of RHA are given
in tables 5.8.1 and 5.8.2. The fresh properties are within EFNARC
specifications. The rice husk ash which contains as much as 85-95%
silica is highly reactive. Addition of finely ground RHA with a fineness

291
of above 16000 sq.cm/gm improves the microstructure of the
interfacial transition zone (ITZ) between the cement paste and the
aggregate in SCC.
8.3.2 Hardened Properties of Self Compacting Concrete GGBS -
RHA Mixes
Hardened properties such as compressive strength, split tensile and
flexural strengths are determined by testing specimens cast with the
GGBS-RHA mixes,
8.3.2.1 Compressive Strength, Split Tensile Strength and Flexural
Strength
When SCC mixes produced with GGBS-RHA are compared with
other mixes without admixtures the improvement is observed in
compressive strengths. From tables 5.8.1 and 5.8.2 it is observed that
the increase in 7days strength is 8.67%, 8.15% and 2.17%
respectively for M20, M40 and M60 grades respectively whereas the
increase in 28 days strength is 46.35%, 33.63% and 7.6%.
From tables 5.7.1 to 5.7.3 the improvement observed in28 days
split tensile strength is 23%, 14.5% and 8.8% for M20, M40 and M60
grades respectively. Similarly when the increase in 28 days flexural
strength is observed it is found to be 17.3 %, 13.2% and 4.45% more
for M20, M40 and M60 grades respectively when compared with
concrete without GGBS and RHA.
The above observations shows that the increase in strengths is
nominal when compared to SCC mixes produced with only GGBS and
292
high when compared with GGBS RHA mixes. This is because of high
or effective reactivity of RHA with GGBS. The percentage increase in
strength increased with increase in the amount of RHA but only up to
some percentage of replacement, at higher percentages fresh
properties are greatly affected and the SCC mixes lost self
compactability. This is because of more water absorbing capacity of
RHA at higher dosages i.e. at 5% and more.
8.3.2.2 Finally eight SCC mixes with and without admixtures which
satisfied properties of SCC in fresh state and gave maximum
compressive strength are selected and taken for further investigations.
These mix proportions along with fresh and hardened properties are
given in tables 5.11.1 to 5.11.3.
8.4 INFLUENCE OF MINERAL ADMIXTURES ON FRESH AND
HARDENED PROPERTIES OF SCC
8.4.1 Fresh Properties of SCC
Self compacting concrete mixes produced with different mineral
admixtures like GGBS and RHA given in tables 5.2.1.1, 5.2.1.3 have
shown good range of test results for slump flow values, V-funnel and
L-Box tests which satisfy the limits prescribed by EFNARC
specifications. Thus SCC of acceptable fresh concrete properties can
be produced with GGBS and RHA with proper proportioning. This not
only reduces the production cost of SCC but also increases the proper
utilization of industrial wastes like GGBS and RHA.
293
8.4.2 Hardened Properties of SCC
When hardened properties like compressive, split tensile and
flexural strengths of SCC mixes using mineral admixtures like GGBS
and RHA in different proportions are observed, in general SCC mixes
with GGBS and RHA have shown better performance in hardened
state than SCC mixes without admixtures. In case of GGBS mix due
to the reduced fineness of GGBS resulting in lesser water content and
hence is the improvement in strength and ground to higher fineness
GGBS reduces bleeding of concrete.
Whereas the results indicate that in case of GGBS -RHA mix at
higher dosages of RHA there is no considerable increase in the
compressive strength at early ages but at later ages, the increase was
high, up to 46% for M20 grade and 33.63% for M40 grade
respectively. Whereas the increase was only 7.58% for M60 grade
when compared with ordinary SCC mixes.
Similarly when the improvement in split tensile strength and flexural
strengths are observed the increase is more in case of M20 and M40
grades and improvement is less in case of M60 grade, this may be due
the reason that in case of M60 grade the RHA is added but not
replaced, demanding more water, reducing the strength.
Thus incorporation of sufficient dosages of RHA to GGBS based
SCC mixes, greatly increases the strengths at different ages if the
fresh properties satisfy EFNARC specifications. Therefore can be
concluded that GGBS, RHA and their combinations used in the
294
production of SCC greatly influences fresh and hardened properties of
SCC.
8.5 INFLUENCE OF SUPERPLASTICISER ON FRESH AND
HARDENED PROPERTIES OF SCC
Self-compacting concrete incorporates admixtures that
significantly increase the material's workability and fluidity. SCC is
placed with little or no compaction in very heavily reinforced sections,
in inaccessible areas because of easily flowability.
Final mixes produced with mineral admixtures like GGBS and
RHA with different dosages of superplasticizer as given in table 5.11.1.
From the table 5.11.2 it is observed that slump flow values are
between 760-715mm, T50 time is between 4.28-3.08 sec, V-Funnel test
results between 8.68-8.03 seconds and L-Box test results 0.98 to 0.86
for three grades of SCC.
The super plasticizer makes SCC mix workable and offers
fluidity to the mix for the given water-powder ratio. This quantity
plays an important role in SCC, because if the dosage is less than the
required quantity, it reduces the workability and fluidity affecting the
fresh properties of SCC which in turn affects self compactability which
leads to reduction in strength. Whereas if the dosage of super
plasticizer is much higher than the required dosage, it increases
fluidity causing bleeding of SCC mix, thus affecting fresh properties of
SCC and in turn reducing the strength.
295
8.6 INFLUENCE OF VISCOSITY-MODIFYING ADMIXTURE (VMA)
With the addition of viscosity-modifying admixture (VMA) in
SCC mixes, the viscosity enhances, which in turn reduces bleeding
and segregation of SCC. The fresh properties of self compacting
concrete mixes produced with mineral admixtures like GGBS and
RHA given in table 5.9 are within EFNARC limits.
The optimum dosage of VMA enhances the viscosity of fluid
mixture and reduces bleeding, segregation and settlement.
8.7 EVALUATION OF STRENGTH EFFICIENCY FACTORS
This study was mainly intended to evaluate the efficiency of
GGBS as admixture in Self Compacting Concrete mixes of grade M20,
M40 and M60 at 3, 7 and 28 days. The same parametric study is
carried out to find the efficiency of GGBS and RHA combination as
mineral admixtures in Self Compacting Concrete mixes of grade
M20,M40 and M60 at 3, 7 and 28 days .
Efficiency factors found from Bolomey‟s strength equation are
used to describe the effect of the GGBS and RHA combination
replacement in SCC in the enhancement of strength and durability
characteristics
8.7.1 Strength Efficiency factors “k” was calculated using a
modified version of the Bolomey equation, which is an empirical
relationship used to predict compressive strength of concrete. This
efficiency factor “k” of GGBS in SCC is the combination of two factors
296
efficiency factor kg depending on the age of the concrete and the
efficiency factor kp depending on the various % of GGBS replacement
alone and also with other case of % GGBS and RHA in SCC.
Strength efficiency factor „k‟ increases by 21% in case of
GGBS+ RHA replacement in M20, M40 and M60 SCC mixes when
compared to the case of GGBS replacement alone in M20, M40 and
M60 SCC mixes, at 28 days.
When compared to M20, M40 and M60 grade SCC mixes
without any mineral admixture at 28 days, Strength efficiency of
GGBS increases by 31% in M20, 21% increase in M40 SCC mixes. In
M60 grade the required target strength was not reached when
replaced with GGBS, so 5% RHA is added to satisfy fresh properties of
SCC and also to obtain required target strength, then it is observed an
increase of 11% in M60 SCC mix.
Where as in case of GGBS RHA combination in SCC, the
Strength efficiency increases by 47 % in M20, 37% increase in M40
and an increase of 11% in M60 GGBS RHA SCC mixes when
compared to SCC mixes without any mineral admixture at 28 days at
optimum % GGBS and RHA replacement level.
8.8 STRESS-STRAIN BEHAVIOUR OF SCC WITH GGBS AND RHA
The stress-strain behavior of SCC mixes with and without steel
confinement is obtained by testing cylinders of standard size,150mm
diameter and 300 mm long in axial compression under strain control
as per IS 516-1959. Three cylinders for each mix are tested to study
297
the stress-strain behavior. A total of one forty four cylinders are tested
in axial compression to get the stress-strain behavior of SCC mixes.
From the values of stresses and strains, average stress-strain curve
for each mix is plotted, taking the average values of the results of the
three cylinders.
The stress-strain values for eight SCC mixes with GGBS and
RHA, with and without steel confinement and the corresponding
stress-strain curves are shown in chapter V. The stress-strain values
of M20 are shown in tables 5.13.1 to 5.13.7, 5.15.1 to 5.15.7 and
5.17.1 to 5.17.7, whereas the curves are shown in figures 5.13.1 to
5.13.4, 5.15.1 to 5.15.4 and 5.17.1to 5.17.4 for M2S, M2SG and
M2SGR respectively.
The stress-strain values of M40 are shown in tables 5.19.1 to
5.19.7, 5.21.1 to 5.21.7 and 5.23.1 to 5.23.7 and the figures 5.19.1 to
5.19.4, 5.21.1 to 5.21.4 and 5.23.1 to 5.23.4 shows the curves of
M4S, M4SG and M4SGR respectively.
Similarly tables 5.25.1 to 5.25.7and 5.27.1 to 5.27.7 shows the
stress strain values of M60 and curves 5.25.1 to 5.25.4 and figures
5.27.1 to 5.27.4 shows the stress strain values of M6S and M6SGR
respectively.
8.8.1 Stress-Strain Response of SCC Mixes
From the observations made from stress-strain curves of all the
eight SCC mixes with GGBS and RHA with and without steel
confinement, the stress-strain pattern is observed to be almost
298
similar. But in case of GGBS-RHA mixes there is improvement in
stress values. It is also observed that for higher grades of concrete,
with increase in stress there was decrease in strain.
8.8.2. Strains at Peak Stress on the Descending Portion of Stress-
Strain Curves of SCC
Compressive strain values corresponding to peak stresses of
M20, M40 and M60 mixes are observed and the average of peak strain
values for M 20 SCC is observed to be 0.0073, the peak strain value is
0.0067 for M 40 SCC and 0.0066 for M 60 SCC.
All values are more than compressive strain in conventional
concrete in axial compression, which is 0.002 as per IS 456-2000.This
indicates that the compressive strains at peak stress in steel confined
SCC is more than conventional concrete.
8.8.3 Normalized Stress-Strain Curves for SCC Mixes
From the stress-strain values of SCC mixes with and without steel
confinement and their corresponding stress-strain plots, normalized
stress-strain values are calculated by dividing each stress value by the
peak stress and dividing each strain value by strain at peak stress.
From the normalized stress-strain values of eight SCC mixes, the
average normalized stress-strain curves are plotted for M20, M40 and
M60 grades.
The normalized stress-strain values of M20 grade are shown in
tables 5.14.1 to 5.14.8, M20 GGBS are shown in 5.16.1 to 5.16.8 and
M20 GGBS-RHA are shown in 5.18.1 to 5.18.8. The relevant
299
normalized stress-strain curves are shown in figures 5.14.1 to 5.14.8,
5.16.1 to 5.16.8 and 5.18.1 to 5.18.8.
The normalized stress-strain values of M40 grade are shown in
tables 5.20.1 to 5.20.8, M40 GGBS are shown in 5.22.1 to 5.22.8 and
M40 GGBS-RHA are shown in 5.24.1 to 5.24.8. The relevant
normalized stress-strain curves are shown in figures 5.20.1 to 5.20.8,
5.22.1 to 5.22.8 and 5.24.1 to 5.24.8 and the normalized stress-strain
values of M60 grade are shown in tables 5.26.1 to 5.26.8 and M 60
GGBS-RHA are shown in 5.28.1 to 5.28.8. The relevant normalized
stress-strain curves are shown in figures 5.26.1 to 5.26.8 and 5.28.1
to 5.28.8.
From the stress-strain curves of SCC mixes and average
normalized stress-strain curves, different parameters like energy
absorption capacity, peak stresses, strains and stress-strain behavior
are discussed.
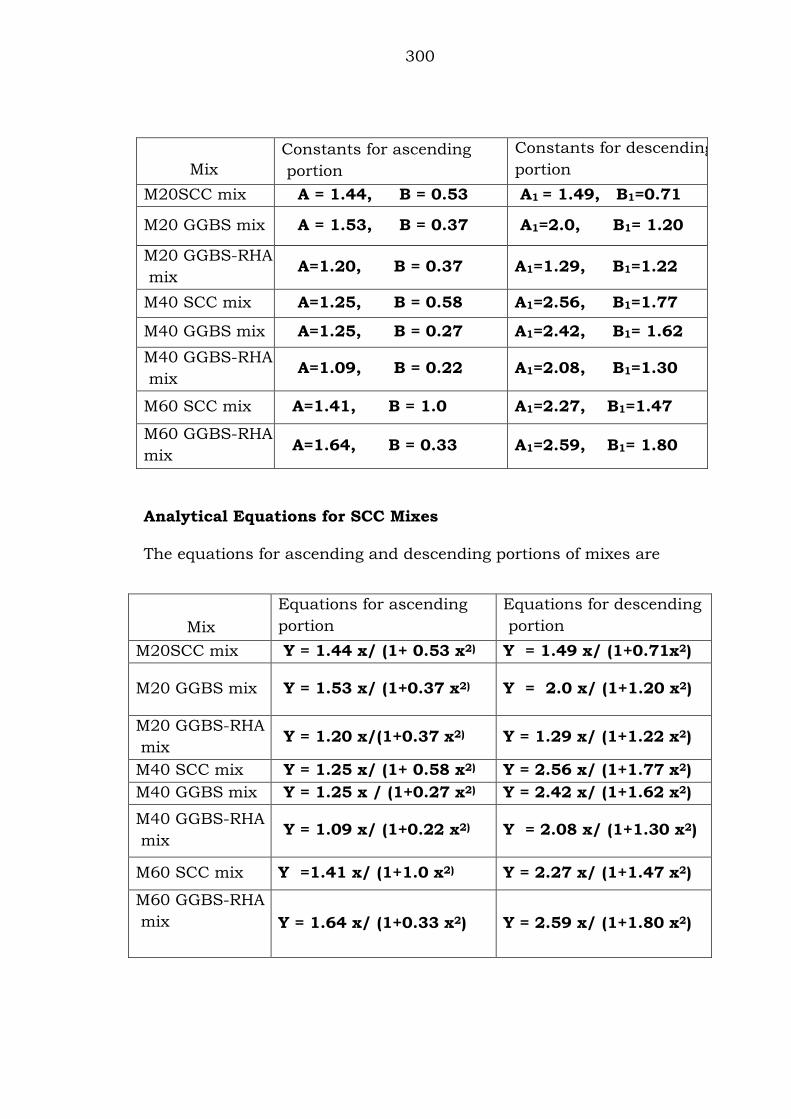
Mathematical Models for Stress-Strain Curves of SCC Mixes.
Empirical equations for the stress-strain response of SCC mix have
been proposed in the form of Y =Ax/ (1+Bx2), where Y = σ/σ0 and
x = Є/Є0. The same empirical formula is valid for both ascending and
descending portions with different values of constants. A set of
constants A,B and A1,B1 have been determined to get empirical
equations for ascending and descending portions of normalized stress-
strain curves for different SCC mixes. The constants for mixes are
300
Analytical Equations for SCC Mixes
The equations for ascending and descending portions of mixes are
Mix
Constants for ascending
portion
Constants for descending
portion
M20SCC mix A = 1.44, B = 0.53 A1 = 1.49, B1=0.71
M20 GGBS mix A = 1.53, B = 0.37 A1=2.0, B1= 1.20
M20 GGBS-RHA
mix A=1.20, B = 0.37 A1=1.29, B1=1.22
M40 SCC mix A=1.25, B = 0.58 A1=2.56, B1=1.77
M40 GGBS mix A=1.25, B = 0.27 A1=2.42, B1= 1.62
M40 GGBS-RHA
mix A=1.09, B = 0.22 A1=2.08, B1=1.30
M60 SCC mix A=1.41, B = 1.0 A1=2.27, B1=1.47
M60 GGBS-RHA
mix A=1.64, B = 0.33 A1=2.59, B1= 1.80
Mix
Equations for ascending
portion
Equations for descending
portion
M20SCC mix Y = 1.44 x/ (1+ 0.53 x2) Y = 1.49 x/ (1+0.71x2)
M20 GGBS mix Y = 1.53 x/ (1+0.37 x2) Y = 2.0 x/ (1+1.20 x2)
M20 GGBS-RHA
mix Y = 1.20 x/(1+0.37 x2) Y = 1.29 x/ (1+1.22 x2)
M40 SCC mix Y = 1.25 x/ (1+ 0.58 x2) Y = 2.56 x/ (1+1.77 x2)
M40 GGBS mix Y = 1.25 x / (1+0.27 x2) Y = 2.42 x/ (1+1.62 x2)
M40 GGBS-RHA
mix Y = 1.09 x/ (1+0.22 x2) Y = 2.08 x/ (1+1.30 x2)
M60 SCC mix Y =1.41 x/ (1+1.0 x2) Y = 2.27 x/ (1+1.47 x2)
M60 GGBS-RHA
mix
Y = 1.64 x/ (1+0.33 x2) Y = 2.59 x/ (1+1.80 x2)
301
The proposed empirical equations can be used as stress block in
analyzing the flexural behavior of sections of SCC structural elements.
The proposed equations have shown good correlation with
experimental values.
8.8.4 INFLUENCE OF GGBS AND RHA.
The mixes designated as M2S, M4S and M6S are ordinary SCC
mixes whereas M2SG and M4SG contains mineral admixture GGBS
only and the mixes M2SGR, M4SGR and M6SGR contains mineral
admixture RHA in addition to GGBS. The remaining constituent
materials and their proportions in M2SGR , M4SGR and M6SGR are
same as in M2SG, M4SG and M6SG, hence comparison of results
M2SGR , M4SGR and M6SGR mixes is made with M2S,M2SG,M4S,
M4SG,M6S and M6SG mixes to study the influence of GGBS and
RHA on SCC mixes with regard to various parameters as follows.
8.8.5 Peak Stress
Peak stress values of the three SCC mixes are shown in tables
in chapter. Average Peak stress value is 35.30N/mm2 for M2S mix and
the average value for M2SG and M2SGR is 38.56N/mm2 and 41.23
N/mm2 respectively.
The average values for M4S, for M4SG and M4SGR mixes are
48.06N/mm2,50.04N/mm2 and 52.17N/mm2 respectively and the
average peak values are 63.42 N/mm2 and 65.66 N/mm2 for M6S and
M6SGR respectively. This indicates there is an increase in the peak
302
compressive strength for different mixes blended with GGBS and RHA.
The increase may be due to high reactivity of RHA with GGBS.
8.8.5.1 Strain at Peak Stress
Peak compressive strain values corresponding to peak stresses of
M20 SCC mixes are shown in tables 5.13.8, 5.15.8 and 5.17.8,for M40
SCC mixes the values are shown tables 5.19.8, 5.21.8 and 5.23.8,for
M60 SCC mixes the values are shown in tables 5.25.8 and 5.27.8 .
Strain values corresponding to peak stress ranges from a
minimum of 0.00437 to a maximum of 0.00812 for M20 SCC mix,
0.00502 to a maximum of 0.00898 for M20 GGBS mix and 0. 00589
to 0.00934 for M20 GGBS-RHA SCC mix. Similarly the strain values
ranges from 0.00426 to 0.00728 for M40 mix, 0.005 to 0.00830 for
M40 GGBS mix, and 0.00574 to 0.009 for M40 GGBS-RHA mix. The
strain values of M60 ranges from 0.00414 to 0.00712, M60 GGBS-
RHA value ranges from 0.00529 TO 0.00836.
8.9 INFLUENCE OF STEEL
The eight mixes of SCC are confined with steel along with mineral
and chemical admixtures like GGBS, RHA, superplasticizers and
viscosity modifying agents. The cylinders are confined with different
percentage of steel i.e. 0%, 0.79%, 1.06%, 1.32%, 1.82%, 2.43%and
3.04%. Studies of results of three grades with different percentages of
steel for each mix are done separately. Comparisons are made among
SCC mixes with and without steel to study the influence of steel on
SCC mixes with regard to various parameters as follows.

303
8.9.1. Peak Stress
Comparing the peak stress values of mixes with and without
steel an increase in the peak compressive stress of 6.56 % to 48.14%
is observed for M20 mixes, 7.29% to 18.66 % for M 40 mixes and 1.5%
to 11.33% for M60 mixes. The increase in stress is due to confinement
of steel. When the peak stresses of all the eight mixes are compared it
is observed that the there is drastic improvement in M20 and M40
mixes compared to M60 mixes. The observations are as follows
GGBS mixes
It observed that the increase is 7.64% to 48.88% for M20 GGBS
mix with different percentage of steel confinement when compared
with M20 GGBS mix without steel. Similarly when the stresses of M40
GGBS mixes with different percentages of steel are studied and
compared without steel, the observation is that the increase in average
values is 5.27% to 19.6% for M4S1 to M4S6 mixes.
GGBS-RHA mixes
When the values of GGBS-RHA mixes with steel confinement are
compared without steel confinement the increase in stress value is
8.14% to 41.6% for M 20 GGBS-RHA mix, 3.26% to 16.94% for M40
GGBS-RHA mix and 2.36% to 13.13% for M 60 GGBS-RHA mix. Thus
confinement of small percentage of steel to SCC mixes increases the
cylindrical strength marginally. Particularly the increase in stress is
observed in low and medium grades than higher grade of SCC for the
same strain levels and same percentage of steel confinement.
304
Strains at Peak Stress on the Descending Portion of Stress-Strain
Curves
Compressive strain values corresponding to peak stress for the
eight SCC mixes are shown in tables. The average value of strain at
peak stress for M20 mix is 0.0073 which is almost four times the
maximum compressive strain at peak stress, i.e.0.002 for
conventional concrete in axial compression as per IS 456-2000. For
other two mixes also the values are almost three times to the standard
value. This indicates that the maximum compressive strain at peak
stress in SCC is with steel confinement. The steel present in cylinders
yielded for long time giving maximum strain.
8.10 TOUGHNESS OF SCC MIXES
Energy absorption capacity expressed in terms of area under
stress-strain diagram of SCC mixes is shown in table 5.39.1. The
average value of area under stress-strain diagram for M20, M40 &
M60 grade SCC mixes with different mineral and chemical admixtures
are observed to be 0.76 units, 0.78 units and 0.80 respectively.
Area under stress-strain curves are 0.66, 0.80 and 0.84 for M2S,
M2SG and M2SGR mixes respectively. Thus indicating an increase of
27% due to blending of RHA to SCC mixes. Area under M4S, M4SG
and M4SGR curves are 0.72, 0.74 & 0.90 respectively, indicating an
increase of 25%. Similarly area under M6S, M6SGR is 0.68 and 0.90,
indicating an increase of 36%.Thus RHA has considerable effect on
energy absorption capacity of SCC mixes. Thus blending of RHA with
305
proper proportioning enhances the mechanical properties, peak stress
values, energy absorption capacity etc. of SCC mixes as long as the
fresh properties are within EFNARC specifications.
Ductility (µ) which indicates the deformable characteristic of
material is expressed as the ratio of strain in the descending to that in
the ascending portion of stress- strain curves. From the normalized
stress-strain curves, it is observed that there is improvement in
ductility due to the addition of GGBS and RHA to SCC mixes.
8.11 FLEXURAL BEHAVIOUR OF SCC BEAMS
Under and over-reinforced beams of size 100 x 150 x 1200 mm
with selected eight SCC mixes were cast, tested under two point
flexural bending tests under strain rate control. Beams were tested
until the load drops to about 15-20% of peak load in the descending
portion of load deflection curves. While testing the load at first crack,
ultimate load, curvature, crack width and crack pattern were observed
for all beams. Test set up is shown in plate no.1.10. The results are
shown in tables 5.40.1 & 5.40.2.
The following discussions are based on the experimental results
shown in tables 5.40.1 and 5.40.2, load-deflection and moment-
curvature plots shown in figures 5.41.1 to 5.41.3, 5.42.1 to 5.42.3
respectively.
306
8.11.1. Load-Deflection Behaviour
Load-deflection plots for eight SCC mixes for under and over
reinforced beams are shown in figs 5.41.1 to 5.41.3.Up to application
of load at first crack the curve is linear and on further application of
load multiple cracks are caused and the deviation in curve is
observed.
For under reinforced beams with the increase in load the
multiple cracks increased. After the multiple cracking stages, it is
found that there is yield in steel so the P-δ curve become more or less
flat till the ultimate load is reached. On further increase in load a drop
in the load is observed with propagation of cracks. All the beams failed
by compression of concrete and the load deformation curves are
plotted up to failure stage. The same behavior was noticed in all the
under-reinforced SCC beams.
However in over-reinforced beams with flexural loading,
cracking was observed near the mid span of the beam. But, the
number of cracks formed is few when compared to under reinforced
beam. Crushing of concrete in compression was found beyond the
cracking stage. The strain values indicates that the steel
reinforcement is not fully stressed to its permissible value and hence
no yielding of steel has taken place, So the P-δ curves creep up till the
ultimate load is reached. The load deformation curves are plotted up
to failure stage, finally when all the beams failed by compression of
concrete. The behavior was same in all over-reinforced SCC beams.
307
The differences noticed in the load deflection behavior of SCC
beams with and without GGBS and RHA are the increase in the
horizontal plateau of the load-deflection curve and the increase in load
at first crack and ultimate load in GGBS-RHA beams than that in SCC
beams.
8.11.2. Moment Curvature Relationship
Moment curvature plots for eight SCC mixes for under and over
reinforced beams are drawn and shown in figure 5.42.1 to 5.42.3.
These moment curvature plots for under and over reinforced beams
with GGBS and RHA observed to follow the similar pattern as that of
load deflection plots of beams.
In under reinforced beams with the increase in moment,
curvature increased gradually up to the multiple cracking stages and
beyond, and later curvature increased drastically at constant moment
or with small variation in the moment. The M-Ф curve is more or less
flat till the ultimate moment is reached. As all the beams failed by
compression of concrete the moment curvature plots are drawn up to
failure stage. The behaviour is similar in all the under-reinforced SCC
beams.
Whereas in over reinforced beams, after the multiple cracking
stage M-Ф curves creep up till the ultimate moment is reached. Finally
the beams failed by compression of concrete and the moment
curvature plots are drawn up to failure stage.
308
The differences noticed in the moment-curvature behaviour of
SCC beams are, the increase in the horizontal plateau of the moment-
curvature plots and increase in ultimate moment in beams with GGBS
and RHA than that in ordinary SCC beams.
8.11.3. Load at First Crack
Both load at first crack occurred during the experiment and also
first crack load is determined from load-deflection plot corresponding
to the point on the curve at which the curve deviated from linearity is
observed. It is observed that the values obtained experimentally are
closer but higher than those values obtained from load deflection plots
of SCC beams.
Load at first crack increased with the addition of GGBS and
RHA which is due to the bond between the concrete and steel in
beams. As the GGBS and RHA are finer than cement the bondage is
more which arrests the micro cracks developed in the matrix which
results in requirement of more energy. This lead to an improvement in
load at first crack.
Load at first crack values for the under and over reinforced
beams made with eight SCC mixes viz M2S, M2SG, M2SGR… are
shown in tables 5.40.1 & 5.40.2. An increase in the load at first crack
by 10% to 5.5 % is observed due to an addition of GGBS in M20 and
M40 mixes and an increase of 35.00%, 14.18% and 15.56% due to
replacement of GGBS with 3% RHA in under-reinforced M20, M40
beams and with 5% addition of RHA in M60 beams.
309
For over-reinforced beams, increase in load at first crack for
M20 mix is 22.6 % to 26.15% and for M40 mix an increase of 12.19%
to 16.58 % is observed. Similarly for M60 mix an increase of 15.61 %
is observed.
The increase is significant in both cases and it may be due to
high reactivity of RHA with GGBS. Also from the above results it is
observed that the dosage of RHA has yielded higher percentage
increase of load at first crack.
8.11.4. Ultimate Load
In under-reinforced beams after the multiple cracking stages,
the yielding of steel was found to be more, and ultimate load
corresponds to the yielding of steel and crushing of concrete. However
in over-reinforced beams steel reinforcement is not fully stressed to its
permissible value, ultimate load is due to crushing of concrete alone
and so due to compression failure of concrete the section failure
occurs.
When micro cracks develop in the matrix, the GGBS-RHA paste
present in the vicinity of such micro cracks will try to arrest these
cracks and prevent further propagation. Hence there is increase the
ultimate load, as the cracks that appear inside the matrix will take
meandering path, resulting in the demand for more energy for future
propagation. The GGBS-RHA beams have shown improved ultimate
load values compared to that of ordinary SCC beams.
310
8.11.5. Deflections at Service Loads
The deflection at service load is determined from load deflection
plot corresponding to a load of Pu/1.5.Deflections observed from the
load-deflection curves for all the specimens at service loads(Pu/1.5)
are less than the maximum permissible deflection of 4mm i.e
span/250 specified by IS 456-2000. For under reinforced beams made
with GGBS and RHA, values of deflection at service load varied from
2.8- 4.0 mm and for over reinforced beams it varied from 2.2- 6.2 mm.
.
8.11.6 Crack Widths
The crack widths measured at ultimate load for under-
reinforced beams varied from 1.8 mm to 3.5 mm for SCC beams with
GGBS and RHA. For over-reinforced SCC beams the crack widths
varied from 1.5 mm to 3.0 mm
8.11.7 Crack Pattern
In under-reinforced SCC beams the visible flexural cracks
developed at 60% to 70% of the ultimate load of each beam and in
GGBS- RHA beams they developed at 75% to 85% of the ultimate load
of each beam. The crack started to widen considerably indicating
higher strains in steel than the yield strain in steel. All the beams
exhibited a tension failure which is a ductile failure. The cracks are
accompanied by pronounced bulging. When the load is further
increased, cracks propagated towards the top of the beam. As the
beams are forced to deform further, the cracks became more
311
pronounced and the concrete crushed at one or both the ends. With
further increase in beam deflection, the load decreased, accompanied
by concrete spalling. This crack pattern is observed to be same for all
under-reinforced SCC beams, except the spacing of the cracks.
Similarly in all over-reinforced SCC beams failure is initiated by
spalling of concrete in the compression zone. At the time of occurrence
of spalling, the cracks propagated upto half to two third depth of the
beam. The load continued to increase slowly with the increase in
deflection. The beams failed by crushing of concrete. Crack pattern
indicates a compression failure in over reinforced beams. This crack
pattern is observed to be same for all over-reinforced SCC and beams,
except the spacing of the cracks. Crack pattern for beams are shown
in plates 1.11 and 1.12.
8.11.8 Maximum Deflection and Curvature at Failure
The maximum deflection values for under-reinforced SCC
beams varied from 19 to 38.50 mm. Where as for over-reinforced
beams these values varied from 7.71 to 16.28 mm. The higher values
of maximum deflection for under-reinforced beams are due to yielding
of reinforcement at ultimate loads. For over-reinforced beams, steel
does not yield at ultimate load hence there is reduction in the values
of maximum deflection.
Similarly the maximum curvature for under-reinforced SCC
beams varied from 113.42x10⁻⁶ to 83.95x10⁻⁶/mm. For over-reinforced
beams these values varied from 72.29 x10⁻⁶/mm to 37.08 x10⁻⁶/mm
312
for SCC beams. Due to yielding of reinforcement at ultimate loads the
under-reinforced beams has shown higher values of maximum
curvature. For over-reinforced beams steel does not yield at ultimate
load, hence there is reduction in the values of maximum curvature.
8.11.9 Theoretical Moment-Curvature Values.
The values of experimental moments and curvatures are
calculated, from the loads and curvature meter readings obtained
from the beams tested under two point flexural bending tests under
strain rate control.
Theoretical moments and curvatures are calculated using the
analytical equations developed for stress-strain behaviour of SCC.
These equations were developed by conducting axial compression
tests on cylindrical specimens made with SCC. Using these equations
theoretical moments were calculated for SCC. Curvatures were
calculated from the strain distribution over the cross section. With
these values M-Ф curves were plotted. Theoretical moment curvature
values are shown in tables 5.45.1 to 5.45.8 and plots are shown in
figures 5.45.1 to 5.45.8.
Theoretical moment-curvature values of SCC with GGBS and
RHA mixes followed the same pattern as that of corresponding
experimental values. The only difference is that, the values of
theoretical moments calculated are lesser than the experimental
values for under-reinforced and for over reinforced beams.

313
This may be because the curvature values in the experiment
were calculated over a specified gauge length but the theoretical
values at a section of the beam. Hence there is a difference between
experimental and theoretical values of curvatures.
8.11.10 Deflection at Service Loads
Deflections observed from the load-deflection curves (fig 5.41.1
to 5.41.3) of under and over reinforced specimens with out and with
RHA, at service loads (Pu/1.5) are less than the maximum permissible
deflection of 4.0 mm i.e. Span/250 specified by IS 456-2000.
Deflection at service loads is 4.0 mm to 2.8mm and for M2S,
M2SG and M2SGR respectively and M40 these values are 2.8 and 3.0
mm respectively and for M60 these values vary 2.9 to 3.2.Thus
blending of more dosage of RHA has reduced the deflection at service
loads and this may be because of high reactivity of RHA with GGBS,
thus increasing the strength and reducing the deflection at service
loads.
Load-Deflection Behaviour
Load-deflection plots for SCC mixes for under and over
reinforced beams with and without RHA are drawn and are shown in
figures 5.41.1 to 5.41.3. The load-deflection behavior is observed to be
similar for all under-reinforced SCC beams and all over-reinforced
SCC beams with and without RHA, except that the SCC mixes
containing RHA have shown an increase in load at first crack and
ultimate load compared to that of mixes without RHA.

314
8.11.11 COMPARISON OF EXPERIMENTAL AND THEORETICAL
MOMENT-CURVATURE VALUES AND VALIDATION
The values of experimental moments and curvatures are
calculated from the loads and curvature meter readings obtained from
the beams tested under strain rate control. Theoretical moments and
curvatures are calculated using the analytical equations developed for
stress-strain behaviour of SCC. These equations were developed by
conducting axial compression tests on cylindrical specimens made
with SCC. Using these equations theoretical moments were developed
for SCC with GGBS and RHA. Curvatures were calculated from the
strain distribution over the cross section. With these values M-Ф
curves were plotted.
This difference in experimental and theoretical curvature values
is mainly due to the measurement of curvature over a short specified
gauge length during the experiment. Theoretically obtained curvature
represents the curvature at a section, where as the experimental
curvatures represent the curvature over a gauge length .Hence the
experimental curvature values are higher than the theoretical values.
Also the experiment was conducted beyond the ultimate stage
up to complete failure of the beam. At this stage the beams deflect by
large amounts before they fail. Hence there is a variation between
theoretical and experimental values of curvatures.
315
8.12 DURABILITY STUDIES ON SCC
8.12.1 Durability factors
Acid Durability Factors The variation in ADF with different
percentages of GGBS and RHA replacement for M20, M40 and M60
grades are shown in Fig 7.1.1 to 7.1.9. Durability studies carried out
in the investigation through acid attack test with 5% H2SO4, 5% Hcl
and 5% Na2SO4 revealed that GGBS and RHA concrete are more
durable in terms of “Acid Durability Factors” than reference concrete.
The investigation through acid attack test with 5% H2SO4
revealed that rice husk ash concrete is 12% more durable in terms of
“Acid Durability Factors” than the reference concrete.
The investigation through acid attack test with 5% Na2SO4
revealed that rice husk ash concrete is 5% more durable in terms of
“Acid Durability Factors” than the reference concrete.
Durability studies carried out in the investigation through acid
attack test with 5% Hcl revealed that rice husk ash concrete is 16%
more durable in terms of “Acid Durability Factors” than the reference
concrete.
Acid Attack Factors
Fig. 7.1.1 to 7.1.9 shows the variation in ADF and AAF with
different percentages of GGBS and RHA replacement for M20, M40
and M60 grades.
Similar studies carried out in the investigation through acid
attack test with 5% H2SO4, 5% Hcl, 5% Na2SO4 revealed that GGBS

316
and RHA concrete is less attacked for M20, M40 and M60 grades of
concrete in terms of “Acid Attack Factors” than the SCC concrete.
8.12.2 Weight loss
Figs. 7.2.1 to 7.2.9 show variation in percentage weight loss
with different percentages of GGBS and RHA replacement for M20,
M40 and M60 grades. It is observed that the percentage of weight loss
is more for the cubes immersed in 5% H2SO4, for SCC mix with GGBS
and RHA than ordinary SCC mixes.
8.12.3 Compressive Strengths
From the studies of compressive strengths for three grades of
concrete, before and after immersion in acids it is observed that when
immersed in Na2SO4 the three grades of SCC are showing lesser
compressive strength loss than immersed in H2SO4 and HCl.
The % compressive strength loss of M20 SCC mix, when
immersed in 5% H2SO4 is 1.3 to19.63 , For M20 SCC mix with GGBS
the % compressive strength loss values are 1.21 to 10.32, Similarly
the % compressive strength loss values for M20 GGBS-RHA SCC are
1.00 to 6.41 respectively.
From the studies of compressive strength, it is observed that the
compressive strength loss is more for cubes immersed in H2SO4 than
the cubes immersed in Na2SO4 and HCl.