3 chapter 3: results and discussion synthesis of palm
TRANSCRIPT

62
3 CHAPTER 3: RESULTS AND DISCUSSION
SYNTHESIS OF PALM OLEIC ACID-BASED MACROMERS
In view of the increasing interest in environmental protection, the use of vegetable
oils in non-food applications has attracted appreciable attention. One of the specific areas is
the use of vegetable oils for production of alkyd resins, which are extensively used in
paints, adhesives [104], inks [105], varnishes [106] and various coatings. The properties of
formulated alkyd resin, depends on the chemical composition and also their preparation
processes. Various synthetic procedures, each with many variables, are used to produce
different alkyd resins.
The use of vegetable oils such as linseed oil, soybean oil, castor oil and tall oil can
impart to the alkyds certain properties, such as ability to air-dry, film hardness and
durability and gloss retention, etc. Therefore, there is need to investigate native sources of
oils for alkyd production.
Palm oil is classified as non-drying oil because of its low iodine value; alkyds made
from palm oil are not capable of forming coherent film by air oxidation. Consequently,
there are very little reports of the use of palm oil alone in the manufacturing of alkyds for
coating application. Palm oil needs to mix with tung oil to produce a workable coating resin
[84]. Another paper reported mixing the palm oil based-alkyds with melamine to form
baking enamels [107].
This study describes the use of oleic acid, one of the palm oil derivatives, as raw
material together with phthalic anhydride, PA, and glycerol to produce low molecular
weight polyesters containing unsaturation (-C=C-) to function as macromers for
copolymerization with MMA. For this project, three macromers were formulated with
63
different amounts of oleic acid, in combination with the other components to produce the
macromers. The properties of the macromers were investigated with different
characterization methods as will be mentioned in the next sections.
3.1 Synthesis of AlkOA65
AlkOA65 was prepared by polyesterification reaction from PA, oleic acid and
glycerol. The AlkOA65 was formulated according to Patton’s gel point calculation, which
is an applicable alkyd formulation system to avoid gelation [99]. The theoretical calculation
is demonstrated in Table 3.1.
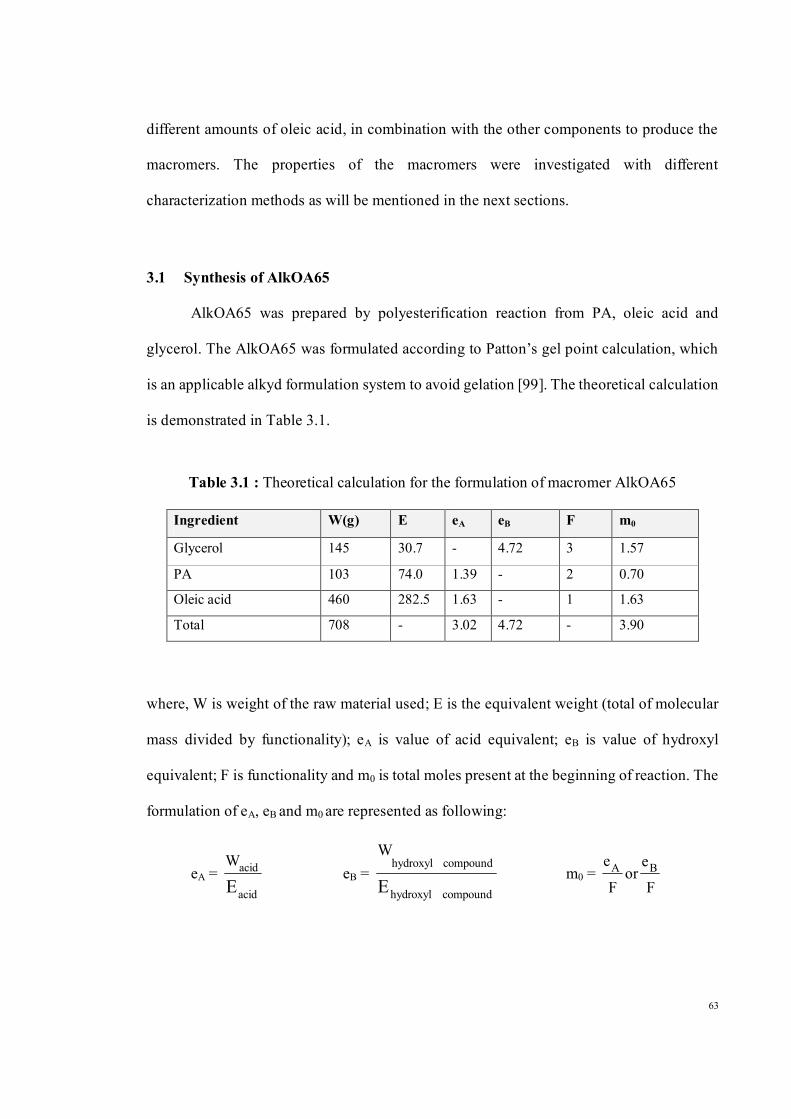
Table 3.1 : Theoretical calculation for the formulation of macromer AlkOA65
Ingredient W(g) E eA eB F m0
Glycerol 145 30.7 - 4.72 3 1.57
PA 103 74.0 1.39 - 2 0.70 Oleic acid 460 282.5 1.63 - 1 1.63
Total 708 - 3.02 4.72 - 3.90
where, W is weight of the raw material used; E is the equivalent weight (total of molecular
mass divided by functionality); eA is value of acid equivalent; eB is value of hydroxyl
equivalent; F is functionality and m0 is total moles present at the beginning of reaction. The
formulation of eA, eB and m0 are represented as following:
eA = acid
acid
EW
eB = compoundhydroxyl
compound hydroxyl
E
W m0 =
F
eor
F
e BA

64
Patton’s gel point (constant K) refers to the extent of reaction when gelation might occur
[99]. K is defined as in the following formula and should be greater than 1.00, so that
gelation would not occur at 100% reaction conversion.
Patton’s gel point constant K =
A
0
e
m
If the Patton gel point constant is 0.90 then gelation might occur at 90% conversion. From
Table 3.1, the K for AlkOA65 was 1.29 and gelation will not happen at 100% of reaction.
The excess of hydroxyl groups in AlkOA65 could be estimated by taking the ratio between
eA and eB, as in the following formula:
Excess of hydroxyl group=
A
B
e
e=1.56
This points out that in the macromer formulation there is 56% of excess –OH
groups. From Table 3.1, AlkOA65 was formulated as a long oil length macromer with
(100×460)/ 708, i.e., 65 parts oleic acid per 100 g resin.
According to the references [108, 109], the amount of polyhydric alcohol used in the
formulation of alkyd resin varies between 5 to 40% by weight. If the amount of polyhydric
alcohol is greater than 40% by weight, the unreacted polyhydric alcohols in the alkyd
system will show an excessive increase in absorption moisture. Furthermore, if the
polyhydric alcohol content is less than 5% by weight, the molecular weight of the finished
alkyd resin is difficult to improve. While for polybasic acids, the desirable content varies
from 10 to 50% by weight.
The excess amount of polybasic acid of more than 50% by weight may cause increase in
side reactions during synthesis which will take into account for the gel formation at high
temperature. Furthermore, extra amount of polybasic acid can have effect on tackiness of
the finished alkyd, resulting in alkyd resin with low tackiness.

65
On the other hand, if polybasic acid content is less than 10%, polycondensation
reaction will hardly progress. As displayed in Table 3.1, the glycerol and PA contents in
AlkOA65 are (100 ×145/708), i.e. 20.5 and (100 ×103/708), i.e. 14.5% respectively, thus
these ratios are in the desirable range in an alkyd formulation.
Average functionality (Fav) is also an important factor which reflects the overall
ability of the macromer in crosslinking. Average functionality is defined as following
formula:
F av = 0
BA
m
ee = 1.98
3.2 Synthesis of AlkOA40
AlkOA40 was synthesized with the same procedure as with AlkOA65. The
theoretical formulation is summarized in Table 3.2.
Table 3.2 : Formulation of AlkOA40
Ingredient W(g) E eA eB F m0
Glycerol 256 30.7 - 8.34 3 2.78 PA 338 74.0 4.57 - 2 2.29 Oleic acid 400 282.5 1.42 - 1 1.42
Total 994 - 5.99 8.34 - 6.49
3.3 Synthesis of AlkOA28
AlkOA28 was prepared in the same manner as with other macromers. The
theoretical calculation is shown in Table 3.3. According to Table 3.3, Fav for AlkOA28 is
2.3.
66
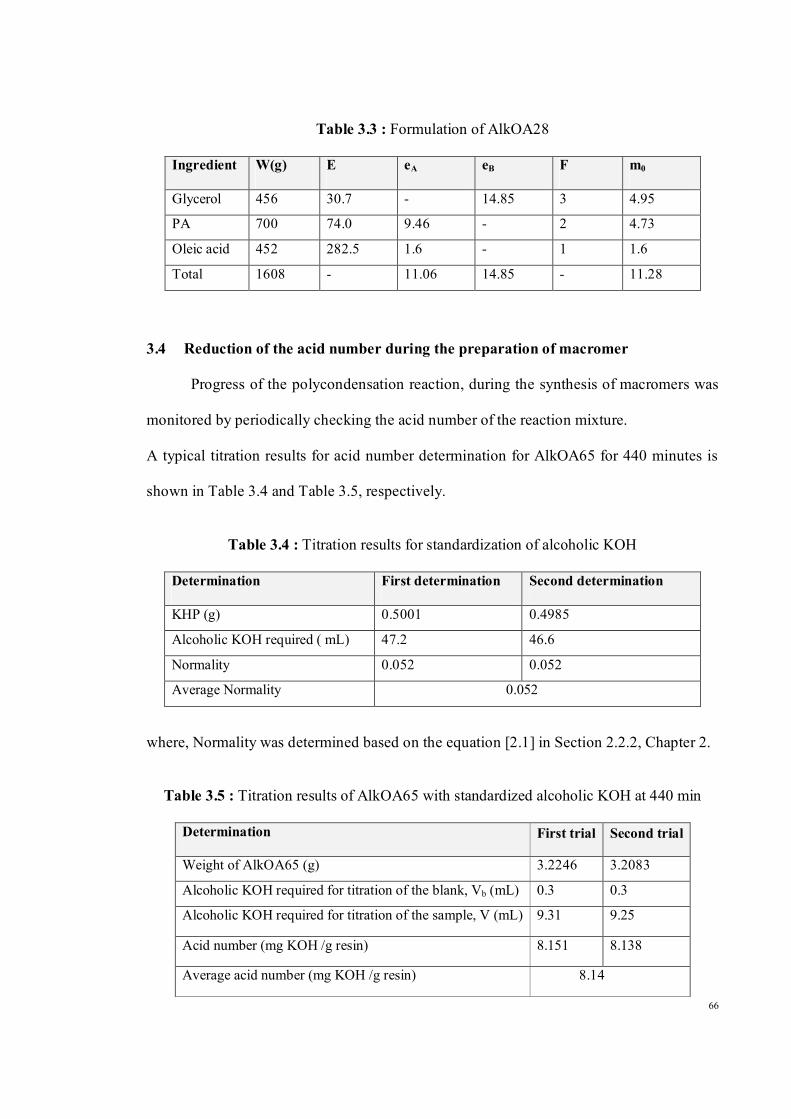
Table 3.3 : Formulation of AlkOA28
Ingredient W(g) E eA eB F m0
Glycerol 456 30.7 - 14.85 3 4.95 PA 700 74.0 9.46 - 2 4.73 Oleic acid 452 282.5 1.6 - 1 1.6 Total 1608 - 11.06 14.85 - 11.28
3.4 Reduction of the acid number during the preparation of macromer
Progress of the polycondensation reaction, during the synthesis of macromers was
monitored by periodically checking the acid number of the reaction mixture.
A typical titration results for acid number determination for AlkOA65 for 440 minutes is
shown in Table 3.4 and Table 3.5, respectively.
Table 3.4 : Titration results for standardization of alcoholic KOH
Determination First determination Second determination
KHP (g) 0.5001 0.4985 Alcoholic KOH required ( mL) 47.2 46.6 Normality 0.052 0.052 Average Normality 0.052
where, Normality was determined based on the equation [2.1] in Section 2.2.2, Chapter 2.
Table 3.5 : Titration results of AlkOA65 with standardized alcoholic KOH at 440 min
Determination First trial Second trial
Weight of AlkOA65 (g) 3.2246 3.2083 Alcoholic KOH required for titration of the blank, Vb (mL) 0.3 0.3 Alcoholic KOH required for titration of the sample, V (mL) 9.31 9.25
Acid number (mg KOH /g resin) 8.151 8.138
Average acid number (mg KOH /g resin) 8.14

67
where, acid number was calculated based on the equation [2.2] in Section 2.2.3, Chapter 2.
The values of determined acid numbers and nX throughout the synthesis of macromers are
tabulated in Table 3.6, Table 3.7 and Table 3.8 for synthesis AlkOA65, AlkOA40 and
AlkOA28 respectively. nX was calculated using equation 3.2 and 3.3 (Section 3.4.1).
Table 3.6 : Variation of acid number with reaction time and nX during the synthesis
of AlkOA65
Reaction time (min) Acid number(mg KOH/g resin) nX
0 239.3 - 60 175.4 1.4 130 86.00 2.8 190 33.7 7.1 205 28.5 8.4 220 23.0 10.4 235 19.7 12.2 250 17.6 13.5 266 15.7 15.2 280 14.5 16.4 295 13.5 17.9 310 12.2 19.6 325 10.9 21.7 340 10.0 23.8 365 9.7 24.4 380 9.4 25.6 395 8.9 27.0 411 8.6 27.8 426 8.4 28.6 440 8.1 29.4
refers to initial acid number are calculated using following formula:
Initial acid number =
W
(Total)e56100 A [3.1]

68
Table 3.7 : Variation of acid number and nX during the synthesis of AlkOA40
Table 3.8 : Variation of acid number and nX during the synthesis of AlkOA28
Reaction time (min) Acid number (mg KOH/g resin) nX
0 338.1 - 60 125.8 2.7 90 93.1 3.6
120 74.4 4.5 159 55.7 6.1 192 46.3 7.3 242 30.0 11.2 292 24.5 13.9 344 21.0 16.1 394 18.0 18.9 447 15.6 21.7 501 12.3 27.8 551 10.6 32.3 611 8.9 38.5
Reaction time (min) Acid number (mg KOH/g resin) nX
0 385.9 - 50 170.0 2.3
90 139.1 2.8 130 112.0 3.4
170 94.4 4.1 210 87.2 4.4 250 67.0 5.7 290 60.7 6.4 340 48.0 8.1 390 39.0 9.9 440 30.5 12.7 500 26.1 14.7 550 25.6 15.2 600 22.8 16.9 650 21.6 17.9 700 18.6 20.8 750 18.4 20.8 800 16.0 24.4

69
Changes in the acid number with increasing reaction time for the different macromers
are plotted in Figure 3.1. As can be observed, the decrease in acid number is faster in the
early stages than the later stages during the reaction time for all samples. These changes in
acid number have been elucidated on the basis of the different reactivity of primary and
secondary OH groups of glycerol.
0
50
100
150
200
250
300
350
400
450
0 100 200 300 400 500 600 700 800
Time (min)
Aci
d nu
mbe
r(m
g K
OH
/g)
AlkOA40 AlkOA65 AlkOA28
Figure 3.1 : plots of changes in acid number versus reaction time for macromers
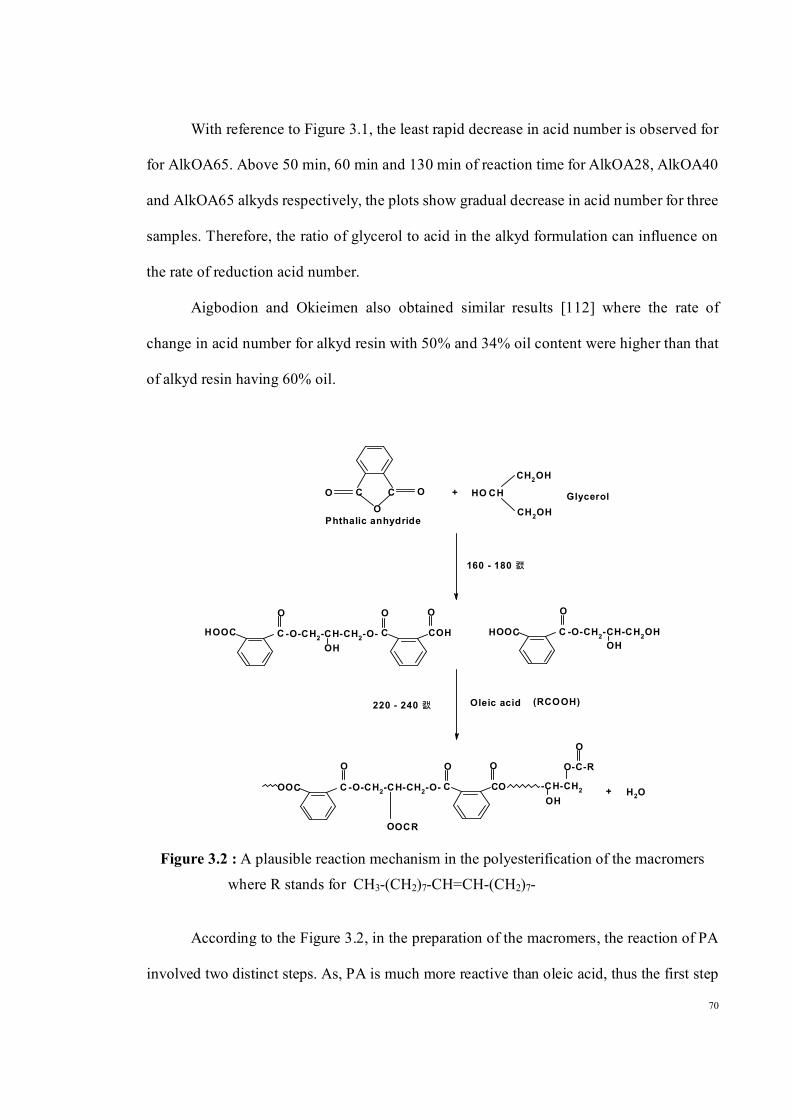
Figure 3.2 shows a plausible reaction mechanism in the preparation of macromers.
Since primary OH group is more reactive than secondary OH group, indeed rapid decrease
in acid number at the initial stages of reaction occurs when primary hydroxyl groups react
followed by secondary OH groups react in the later stages [110].
It has been also stated that reduction in acid number in later stages could be related
to the formation of crosslinks or branching between the chains [111] and consequently
increases viscosity in the reaction medium.
70
With reference to Figure 3.1, the least rapid decrease in acid number is observed for
for AlkOA65. Above 50 min, 60 min and 130 min of reaction time for AlkOA28, AlkOA40
and AlkOA65 alkyds respectively, the plots show gradual decrease in acid number for three
samples. Therefore, the ratio of glycerol to acid in the alkyd formulation can influence on
the rate of reduction acid number.
Aigbodion and Okieimen also obtained similar results [112] where the rate of
change in acid number for alkyd resin with 50% and 34% oil content were higher than that
of alkyd resin having 60% oil.
CCO
OO
-CH-CH2
O
-O-CH2-CH-CH2-O-OH
C
O
C
O
C
O
OCR
-O-CH2-CH-CH2-O- C
O
C
O
CO
O
OCO
-O-CH2-CH-CH2OHOH
CO
O
CO
OH
O-C-R
O
(RCOOH)
HHOOC OH
CH
CH2OH
CH2OH
HO+
Phthalic anhydride
Glycerol
Oleic acid
160 - 180 캜
220 - 240 캜
+ H2O
Figure 3.2 : A plausible reaction mechanism in the polyesterification of the macromers
where R stands for CH3-(CH2)7-CH=CH-(CH2)7-
According to the Figure 3.2, in the preparation of the macromers, the reaction of PA
involved two distinct steps. As, PA is much more reactive than oleic acid, thus the first step

71
of reaction with most of the primary OH groups of glycerol proceeds rapidly by ring
opening of the anhydride ring to form a half ester and a free carboxylic group. This step did
not evolve any water and occurred quite readily around 160-180°C. As the reactions are
depicted in Figure 3.2, when the temperature was increased to 220-240°C, the carboxylic
acid group of the half ester and oleic acid would compete to react with the remaining
hydroxyl groups in the mixture and the water of condensation was collected in the Dean-
stark decanter.
3.4.1 Calculation of extent of reaction and average degree of polymerization based
on acid number:
The extent of reaction, P, was calculated from end group analysis of aliquots of the
reaction mixture withdrawn at various time intervals during the reaction using the following
equation [3.2].
0t0 ]/(AN)(AN)[(ANP [3.2]
Where:
(AN)0 = Acid number at the zero time
(AN)t = Acid number at the distinct time
The average degree of polymerization, nX defined as the average number of structural units
per polymer chain, was calculated based on P using equation [3.3] at different times of
reaction.
1P)1(Xn
[3.3]
Tables of 3.6, 3.7 and 3.8 display the average degree of polymerization for
AlkOA65, AlkOA40 and AlkOA28 respectively. As has been reported earlier [113], poly-
72
functional and mono-functional polyesterification reactions can be expressed as a second-
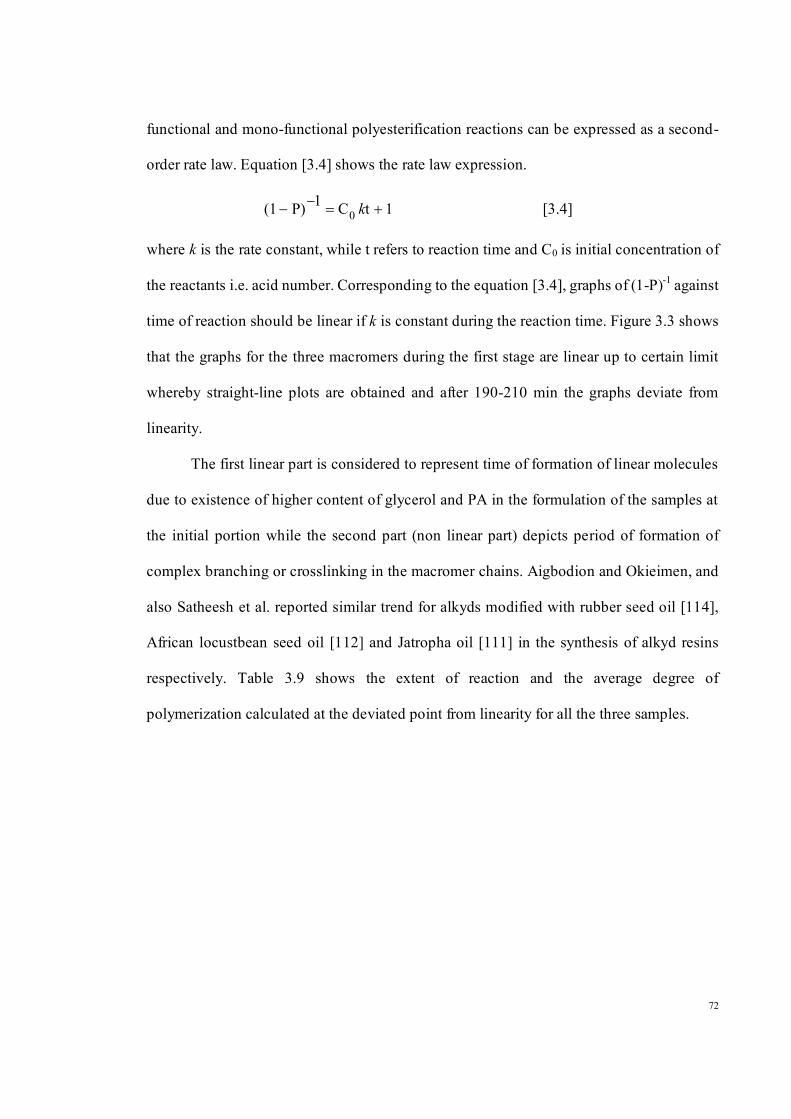
order rate law. Equation [3.4] shows the rate law expression.
1tC1P)(1 0 k [3.4]
where k is the rate constant, while t refers to reaction time and C0 is initial concentration of
the reactants i.e. acid number. Corresponding to the equation [3.4], graphs of (1-P)-1 against
time of reaction should be linear if k is constant during the reaction time. Figure 3.3 shows
that the graphs for the three macromers during the first stage are linear up to certain limit
whereby straight-line plots are obtained and after 190-210 min the graphs deviate from
linearity.
The first linear part is considered to represent time of formation of linear molecules
due to existence of higher content of glycerol and PA in the formulation of the samples at
the initial portion while the second part (non linear part) depicts period of formation of
complex branching or crosslinking in the macromer chains. Aigbodion and Okieimen, and
also Satheesh et al. reported similar trend for alkyds modified with rubber seed oil [114],
African locustbean seed oil [112] and Jatropha oil [111] in the synthesis of alkyd resins
respectively. Table 3.9 shows the extent of reaction and the average degree of
polymerization calculated at the deviated point from linearity for all the three samples.

73
Figure 3.3 : Graphs of (1- P)-1 against time for the macromer samples
Table 3.9 : Calculated P%, nX and k at the deviate point from linearity, and P% at the end of reaction for the macromers
Kinetic parameters
Macromers Time (min) P% nX k× 105
g (mgKOH)-1 min-1 P%
at the end of reaction
AlkOA28 210 77.4 4.4 4.1 95.9 AlkOA40 192 86.3 7.3 9.8 97.4 AlkOA65 190 85.9 7.1 18 96.6

74
The results reveal that the extent of reaction at these regions changes 77.4 to 85.9%.
In accordance to the results obtained for reaction between PA and glycerol which varied
between 75-80%, the results obtained from palm oleic acid based macromers indicate a
significant degree of conversion [115]. The results obtained from palm oleic acid based-
macromers also show significant extent of reaction at the end of reaction as exhibited in
Table 3.9.
The second-order rate constants, k, calculated through the linear part of Figure 3.3
are tabulated in Table 3.9. Sample AlkOA65 shows the largest value of 18×10-5 g (mg
KOH)-1 min-1. These results prove that ratio of the reactants used (PA, glycerol and oleic
acid) in the reaction affects the polyesterification rate. The smallest k and P% was obtained
for AlkOA28 which can be attributed to the relatively highest molecular weight and
consequently highest viscosity.
As the mixture became more viscous after reaching a certain conversion level, the
molecular chains motion would become very slow even at the end of reaction. As such,
AlkOA28 shows the least extent of the reaction and rate constant.
3.5 Characterization of synthesized macromers
In this section, concentrations of carboxylic and hydroxyl groups were determined
from titration method. FTIR and 1H-NMR spectroscopies as common techniques are then
used to identify and confirm the functional groups present in the chemical structures of the
resulting macromers. In addition, the functional groups in the macromers are compared to
the oleic acid functional groups. 13C-NMR spectroscopy is used to recognize configuration
of -C=C- in macromers. Thermal stability is studied using DSC and TGA. From TGA

75
results activation energy and thermal degradation mechanism of the macromers were also
investigated.
3.5.1 Hydroxyl number determination of macromers
Determination of hydroxyl number of macromer was accomplished in two stages; in
the first stage free hydroxyl groups in the macromer was esterified with PA, subsequently
in the second stage hydroxyl number was measured from the amount of unreacted PA
remained which was neutralized by NaOH. In hydroxyl number calculation, before the
titration, sample size of the macromer must be calculated by substituting the estimated
hydroxyl number using equation [3.5] into equation [2.4] as shown in Section 2.2.6.
Estimated hydroxyl number =
evolvedWaterW
56100)ee ( AB [3.5]
where water evolved is [eA (PA) × 9] + [eA (oleic acid) × 18].
Therefore, according to the Table 3.1 and equations 3.5, estimated hydroxyl number for
AlkOA65 was calculated as following:
Estimated hydroxyl number =18)1.639(1.39708
561003.02)(4.72
=143.17
Corresponding to the equation [2.4] in Chapter 2, sample size for this macromer was (561÷
143.17), i.e. 3.92 g.
Hydroxyl number is determined by the standard test method (Chapter 2, Section 2.2.6),
involving reacting the hydroxyl compound with excess phthalic anhydride, and then back
titrate for the remaining acid. An example of titration results for the standardization of
NaOH solution and hydroxyl number of AlkOA65 were shown in Table 3.10 and Table
3.11 respectively.

76
Table 3.10 : Standardization of NaOH solution
Determination First trial Second trial
Weight of potassium hydrogen phthalate/g 4.4878 4.4622 NaOH solution required /mL 44.4 44.1 Normality 0.4950 0.4955 Average Normality/ N 0.495
where normality was calculated using the equation [2.3] in section 2.2.5., Chapter 2.
Table 3.11 : Titration results of AlkOA65 with standardized NaOH solution
Determination First trial Second trial
Sample size/ g 3.9205 3.9198 NaOH solution required for titration of the blank /mL 95.1 95.0 NaOH solution required for titration of the sample /mL 75.2 75.2 Hydroxyl number (mg NaOH/ g sample) 140.95 140.27 Average hydroxyl number (mg NaOH/ g sample) 140.6 Estimated hydroxyl number 143.2
where, hydroxyl number was calculated using the equation [2.5] in Section 2.2.6,
Chapter 2.
The titration results for AlkOA40 and AlkOA28 are tabulated in Tables 3.12 and 3.13
respectively.
Table 3.12 : Titration results of AlkOA40 with standardized NaOH solution
Determination First trial Second trial
Sample size/ g 3.9321 3.9289 NaOH solution required for titration of the blank /mL 95.1 95.2 NaOH solution required for titration of the sample /mL 75.9 75.8 Hydroxyl number (mg NaOH/ g sample) 135.6 137.1 Average hydroxyl number (mg NaOH/ g sample) 136.4 Estimated hydroxyl number 142.2
77
Table 3.13 : Titration results of AlkOA28 with standardized NaOH solution
Determination First trial Second trial
Sample size/ g 3.9321 3.9501 NaOH solution required for titration of the blank /mL 95.0 95.1 NaOH solution required for titration of the sample /mL 76.1 76.4 Hydroxyl number (mg NaOH/ g sample) 133.5 131.5 Average hydroxyl number (mg NaOH/ g sample) 132.5 Expected hydroxyl number 142.3
Table 3.14 represents the hydroxyl numbers, acid numbers and estimation of the properties
for three macromers as stated from the titration method.
Table 3.14 : Hydroxyl and acid numbers of macromers
Macromer Property
AlkOA65 AlkOA40 AlkOA28
Hydroxyl number (mg NaOH / g sample) 140.6 136.4 132.5 Acid number (mg KOH/ g sample) 8.1 8.9 16 -OH concentration/ mol g-1 2.5 × 10⁻³ 2.4 × 10⁻³ 2.4 ×10⁻³ -COOH concentration/ mol g-1 1.4 ×10⁻⁴ 1.6 ×10⁻⁴ 2.9 ×10⁻⁴ Ratio of –OH/ -COOH 17.9 15 8.3
where,
-OH concentration = 56100
numberHydroxyl, –COOH concentration =
56100numberAcid
From Table 3.14, ratios of –OH to –COOH, demonstrate all macromers were perpetually
formulated with excess hydroxyl groups.

78
3.5.2 FTIR spectroscopy
Figure 3.4 indicates the overlaid FTIR spectra of macromers and oleic acid while,
the assignments of major absorption peaks for these spectra are tabulated in Table 3.15.
Figure 3.4 : Infrared spectra of the AlkOA macromers and oleic acid
The characteristic bands are observed at 1730-1740 cm-1 for ester group and twin
peaks at 1580 to 1599 cm-1 shows C=C stretching conjugated skeletal ring breathing modes
of the aromatic group from PA. The broad OH stretching bands at 3458-3486 cm-1 confirm
the presence of free hydroxyl groups which are observable in all the macromers except for
oleic acid. Bands are observed at 1450-1458 cm-1 for C-H bending of CH2, 1281-1283 cm-1
and 1070-1125 cm-1 for C-O-C stretching of ester; all these bands support the structure of
macromers formed as suggested in the reaction.

79
Table 3.15 : Major absorption peaks of macromers in FTIR spectra
Bonding Wave number/cm-1
OH stretching 3458-3486 C-H stretching aromatic and aliphatic 2925, 2854 C=O stretching carbonyl groups 1730- 1740 C=C stretching aromatic rings(PA) 1580, 1599 C-H bending of CH2 1450-1458 Aromatic =C-H bending 744
C-O-C stretching of ester groups 1070-1283
3.5.3 1H-NMR spectroscopy
The structure of the macromers was further confirmed by 1H-NMR spectroscopy.
Figure 3.5 shows the 1H-NMR spectrum of the AlkOA40 together with molecular structure
of the macromer. The peaks at chemical shifts δ 7.4 -7.8 ppm are due to the aromatic proton
of phthalic ester (j). The peaks (h,i) at 5.3 ppm are attributed to the vinylic protons –
CH=CH- of the oleic acid, while the terminal –CH3 in the chain end of the oleic acid (a) is
at 0.89 ppm. The primary (f) and secondary protons (g) on the glycerol unit appear as a
very broad peak at 3.6-4.7 ppm (lower field) due to the electronegativity of oxygen. The
sharp resonance (b) at 1.3 ppm was attributed to the secondary protons of –CH2 of the oleic
acid; while the allylic protons of –CH2 in fatty acid structure appeare as a weaker resonance
(c) at 2.1 ppm. The CH2 protons (e) on the oleic acid unit are deshieled due to
electronegativity of adjacent carboxylic group to the CH2 protons and appear around 2.3
ppm. The strong peak at 7.26 ppm is assigned to the CDCl3 solvent.

80
Figure 3.5 : 1H-NMR spectrum and one of the plausible molecular structures of AlkOA40
The ratio of integrations of peaks at 5.3 ppm to 0.89 ppm is 0.67, in agreement with
the oleic acid structure in the macromer. 1H-NMR spectra of AlkOA65 and AlkOA28 are
shown in Appendix A.
3.5.4 13C-NMR Spectroscopy
Natural oleic acid occurs in the cis-configuration at the -C=C-. Comparing the 13C-
NMR spectra of oleic acid and macromer in Figures 3.6 (a) and (b) revealed that the oleic
acid moiety in the macromer still maintained the cis-configuration at the -C=C- as shown
by the peaks 129.6-129.9 ppm. The assignments of the various carbons arising from oleic
acid and macromer are shown in Table 3.16. The peak at 77 ppm is assigned to the CDCl3
solvent.

81
Figure 3.6 : 13C-NMR Spectra for oleic acid (a) and macromer AlkOA65 (b)

82
Table 3.16 : Chemical shifts of 13C-NMR spectra of oleic acid and macromer
3.5.5 Gel-permeation chromatography (GPC)
The number average molecular weight (Mn), weight average molecular weight (Mw)
and polydispersity index of the macromers were determined by GPC. The molecular weight
characteristics of macromers are shown in Table 3.17. Whereby, the Mn as well as Mw of
the macromers increases with increasing of PA and decreasing of oleic acid in the
macromers. AlkOA28 macromer shows the highest molecular weight and broadest
distribution.
Table 3.17: The molecular weight characteristics of macromers Macromer code PA (%) ( Mn ) ( Mw ) (Mw/Mn)
AlkOA65 14.5 907 1829 2.0 AlkOA40 34.0 1285 3311 2.6 AlkOA28 43.5 2018 10479 5.2
3.5.6 Differential Scanning Calorimetry (DSC analysis)
One of the most important basic characteristic of a polymer is its glass transition
temperature. The glass transition temperature of the macromer samples with different oil
Chemical shift (δ)/ ppm Assignment
14 (protons of methyl groups) CH3-(CH2)7-CH=CH- 22.5-34.5 Different kinds of (-CH2-) groups in oleate branches 60-70.1 -O-CH2-CH(O)-CH2(O)- in glycerol moiety 129.6- 129.9 –CH=CH- (Aliphatic) from oleate branches 129.1- 131.4 –CH=CH- (Aromatic ring) 170-185 C=O ( Arising from ester and acid groups)

83
lengths were measured using DSC. The Tg of the macromers vary between -36˚C to -39˚C
as shown in Table 3.18. DSC thermograms of macromers were represented in Appendix B.
Table 3.18: Glass transition temperatures of macromers
Macromer code Tg 2 /˚C
AlkOA65 -36.80 AlkOA 40 -38.86 AlkOA28 -39.08
3.5.7 Thermogravimetric analysis (TGA)
TGA is an important technique that provides valuable information on thermal
stability of polymer. Thermal degradation of the three macromers was studied by
determining their mass loss during heating at programmed heating rate under nitrogen
atmosphere. Overlay of TG and DTG curves at heating rate of 10˚C min-1 for the three
macromers are presented in Figures 3.7a and 3.7b respectively. From these thermograms, it
can be seen that AlkOA28 has relatively higher thermal stability followed by AlkOA40 and
AlkOA65.
In the TG curves, only one single stage mass loss was observed. To investigate the
relative thermal stability, Td (-2.5 wt.%), at which 2.5 wt.% of original macromer has
already been thermally degraded and lost, was empirically taken as an index to compare its
thermal stability. This temperature, Td, as shown in Figure 3.7b is 271˚C for alkOA28 and
200˚C and 190˚C for AlkOA40 and AlkOA65 respectively.

84
Figure 3.7 : TG (a) and DTG (b) curves of three macromers at heating rate 10˚C/min
These early stages of the decomposition and such a pre-major weight loss may be
due to volatilization of small molecules in the polymer [116].
3.5.7.1 Activation energy using Kissinger equation
The kinetic parameters of the polymers can provide important additional information
for their use and process ability as new materials. In order to understand and predict the
performance of macromers versus temperature, it is necessary to obtain the kinetic
parameters. Non-isothermal methods have been used extensively for the determination of

85
kinetic parameters. To further analyze the degradation mechanisms of the macromers it is
important that the kinetic parameters, activation energy Ed, pre-exponential factor A and
degradation rate constant, k, be evaluated.
Looking at TG and DTG curves of AlkOA28 at different heating rates (Figure 3.8),
it is clear that the peak temperature, Tp, which is the temperature at maximum rate of
decomposition where peak deflection occurs in the DTG curves, shifts to higher values with
increasing heating rate.
Figure 3.8 : TG (a) and DTG (b) thermograms of AlkOA28 at various heating rates
Similar results are observed for both AlkOA40 and AlkOA65 using its DTG
thermograms (Figure 3.9b and 3.10b) where an increment of 17˚C for AlkOA28, 20˚C for
AlkOA40 and 26˚C for AlkOA65 are obtained (Table 3.19).

86
Figure 3.9 : TG (a) and DTG (b) thermograms of AlkOA40 at various heating rates
Figure 3.10 : TG (a) and DTG (b) thermograms of AlkOA65 at various heating rates

87
Table 3.19: Ed, A and k at different heating rates using Kissinger plots
The activation energy of decomposition can be estimated via the Kissinger equation [3.6]
[117].
)EAR
(lnRTE
)T
q(ln
dp
d2
p
[3.6]
where q is the heating rate, Tp , as it noted earlier, is the temperature at maximum rate of
decomposition where peak deflection occur in the DTG curves, R is the gas constant, A is
the pre-exponential factor and Ed is the decomposition activation energy. The plots of -ln
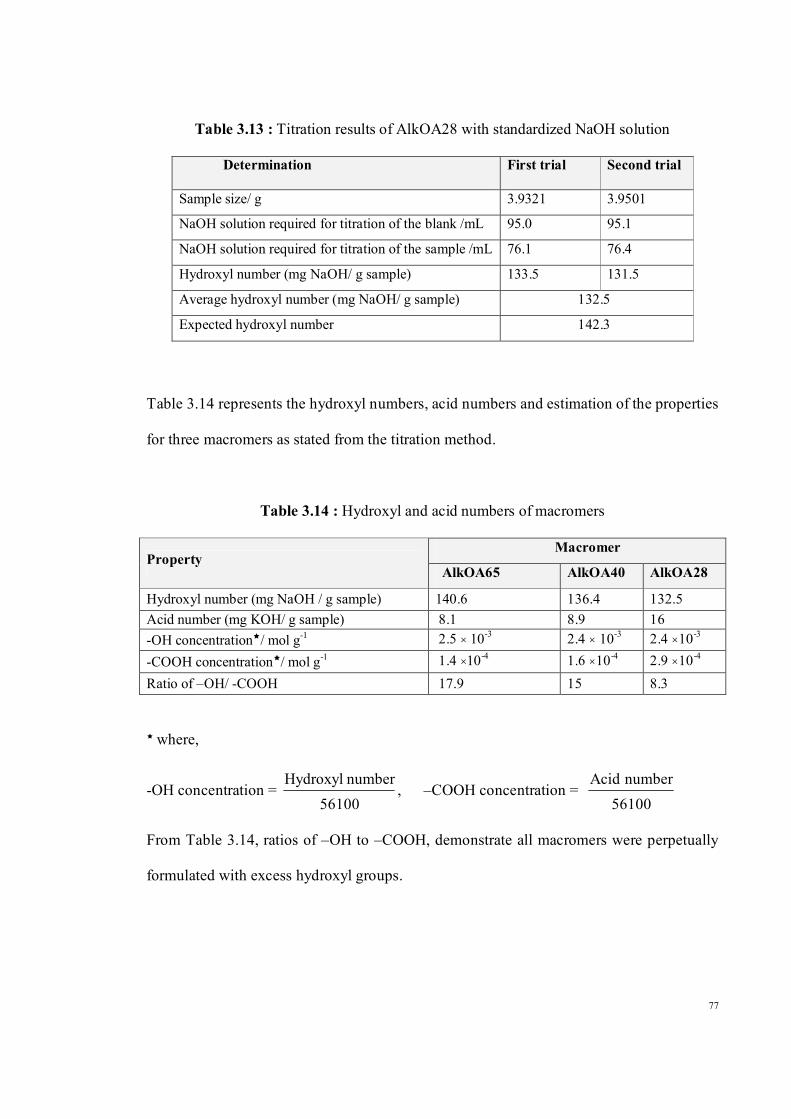
(q/Tp2) against 1/Tp for three samples are shown in Figure 3.11.
Macromer q (K min-1)
Tp
(K) A
(s-1) Ed
(kJ mol-1) Average A
(s-1) k (s-1) Average
(k) 10 649.44 2.78× 10¹⁶ 0.011 15 653.9 3.08× 10¹⁶ 0.016 20 658.35 3.04× 10¹⁶ 0.021 25 660.41 3.32× 10¹⁶ 0.026
AlkOA28
30 666.28 2.71× 10¹⁶
229.0 2.98× 10¹⁶
0.031
0.021
10 644.98 5.88× 10¹² 0.009 15 653.35 5.55× 10¹² 0.013 20 658.05 5.73× 10¹² 0.017 25 662.76 5.57× 10¹² 0.021
AlkOA40
30 665.11 5.9 × 10¹²
183.0 5.72× 10¹²
0.025
0.017
10 674.59 1.4 × 10⁸ 0.006 15 677.29 1.89 × 10⁸ 0.009 20 690.66 1.53 ×10⁸ 0.011
25 695.11 1.63 ×10⁸ 0.014
AlkOA65
30 700.68 1.6 ×10⁸
134.0 1.61× 10⁸
0.016
0.011
88
y = 16.285x - 13.543R2 = 0.9262
y = 27.509x - 31.778R2 = 0.9651
y = 22.158x - 23.693R2 = 0.9955
9.4
9.6
9.8
10
10.2
10.4
10.6
10.8
1.42 1.44 1.46 1.48 1.5 1.52 1.54 1.56 1.58
1/Tp(103 ) K-1
-ln (q
/Tp2
)AlkOA28AlkOA40AlkOA65
Figure 3.11 : Determination of Ed by Kissinger method for the three macromers
Thermal decomposition activation energies (Ed) were calculated from the slopes of the
straight lines of –ln (q/Tp2) versus 1/Tp. The results are shown in Table 3.19.
In the following part, kinetic parameters were calculated for AlkOA28 as an example.
Equation for linear curve in Figure 3.11: y = 27526 x - 31.805
With gradient Ed/R in equation [4.6] = 27526(K)
Ed = 27526 × 8.3143
Ed = 228859.4218 (J mol-1)
Ed = 228.86 (kJ mol-1)
From the equation [3.6] A = )T
1RE(
expTR
Eq pd
p
d2
When q = 10 K min-1, Tp = 649.44 (K)

89
A10 = 2)44.649(3143.8
)44.649
1)(
8.31438228859.421
exp(8228859.42110
= 1.66684 × 10¹⁸ (min-1) = 2.78 × 10¹⁶ (s-1)
When q = 15 K min-1, Tp = 653.9 (K)
A15 = 1.8471 × 10¹⁸ (min-1) = 3.08 × 10¹⁶ (s-1)
When q = 20 K min-1, Tp = 658.35(K)
A20 = 1.82796 × 10¹⁸ (min-1) = 3.04 × 10¹⁶ (s-1)
When q = 25 K min-1, Tp = 660.41(K)
A25 = 1.99307 × 10¹⁸ (min-1) = 3.32 × 10¹⁶ (s-1)
When q = 30 K min-1, Tp = 666.28 (K)
A30 = 1.62758 × 10¹⁸ (min-1) = 2.71 × 10¹⁶ (s-1)
Average (A10:A30) = 2.99 × 10¹⁶ (s-1)
From the calculated activation energies in Table 3.19, an improvement in the
thermal stability of the samples can be seen with an increase in the PA and glycerol.
AlkOA28 shows relatively the highest thermal stability due to the highest activation energy
followed by AlkOA40 and AlkOA65. The trend in thermal stability of the macromers may
also be due to enhancement of the intermolecular attraction among the polymer chains. The
increasing number of –OH groups in the macromer formulation and the formation of
hydrogen bonds between –OH groups in glycerol may have effect on increasing the thermal
stability. The improved thermal stability can also be explained through the reduced
mobility of the polymer chains in the polyesters. PA can usually hinder the motion of the

90
polymer chains. During thermal decomposition of samples, relatively weak bonds break at
lower temperature whereas the stronger bonds in the aromatic rings take place at higher
temperature [118, 119]. The oleic acid, due to its long chain is more thermally labile and
thus decreases the thermal stability. It is well known that differences in the molecular
weights may also affect the thermal degradation behaviour of polymers [120]. The balance
of all these reasons has significant contribution to the increment of the thermal stability of
AlkOA28.
Using the Arrhenius equation [3.7] below, the degradation rate constant, k, at Tp,
calculated are as shown in Table 3.19 whereby increasing the heating rate, the degradation
rate constants shift to higher values.
p
dRT
E
expA.
k [3.7]
Using AlkOA28 as an example, the kinetic parameter, k, was calculated at heating rate
10˚C min-1.
At heating rate of 10 K min-1 Tp = 649.44 (K)
k = 2.78 × 10¹⁶ exp -228859.4218 / (8.3143 × 649.44)
k = 0.011 (s-1)
3.5.7.2 Activation energy and thermal degradation mechanism of the macromers
using isoconversional method of Ozawa, Flynn and Wall (OFW)
Ozawa, Flynn and Wall equation [3.8] [121, 122] was used to clarify relationship
between activation energy and degree of conversion (α) in the decomposition reactions.
This method includes the measuring of the temperatures corresponding to fixed values of α
from experiments at different heating rates (q).
91
RTE
dT/d)(fAlnq)(ln d
[3.8]
The graph, ln q versus 1/T is used to construct the Ozawa plot, where q is the
heating rate, T is the temperature from the various heating rates at the same loss weight, Ed
the activation energy and R the gas constant.
The OFW method is a method which assumes that conversion function f (α) does
not change with the alteration of the heating rate for all values of α. If the determined
activation energy, Ed, is the same for the various values of α, the existence of a single–step
reaction can be concluded with confidence. On the contrary, a change of Ed with increasing
degree of conversion is an indication of a complex reaction mechanism that invalidates the
separation of variables involved in the OFW analysis [123]. The following section
describes the OFW analysis of the three samples.
3.5.7.3 Kinetic analysis of AlkOA28 degradation using OFW method
Firstly, the Ozawa method was used to calculate the activation energy for different
conversion values by fitting the plots of ln (q) against 1/T. Some of the Ozawa plots for
AlkOA28 which has the largest Mn, 2018 are displayed in Figure 3.12 and all data are
summarized in Table 3.20. (See Appendix N for calculations)

92
1.5
2
2.5
3
3.5
4
1.43 1.48 1.53 1.58 1.63 1.68
1/T× (103)
ln (q
)
Figure 3.12 : Ozawa plots of AlkOA28 at various conversion of reaction: α = 0.1(○), α =
0.2 (-), α = 0.3 (+), α = 0.4 (♦), α = 0.5 (◊), α = 0.6 (×), α = 0.7 (▲), α = 0.8 (□), α = 0.9 (•)
Table 3.20 : Calculated Ed using the Ozawa method at various conversion using different heating rates for the three macromers
Ed (kJ mol-1)
Conversion (α ) AlkOA28 AlkOA40 AlkOA65
0.1 109.6 107 105.8 0.2 168.3 151.3 141.5 0.3 243.9 165.4 169 0.4 247.9 176.6 177.3 0.5 247.5 187.1 191.5
0.6 252.6 195.6 192.7 0.7 254.4 208.6 194.8 0.8 284.1 209.2 219.8 0.9 302.1 243.6 224.4
It is clear from DTG thermograms of AlkOA28 (Figure 3.8b), the mass loss follows
at least two stages under all heating rates. These stages are: first in the temperature region
close to 376 to 390˚C and second step is before 700˚C. Therefore, for the precise kinetic
description of mass loss, at least two different mechanisms have to be considered. However
in OFW method, the equation used is derived assuming constant activation energy,

93
introducing systematic error in the estimation of Ed [124]. Thus, the dependence of Ed on α
value, as calculated with OFW method, can be separated in three distinct regions
corresponding to the different degradation processes of sample during heating (Figure
3.13); the first for values of α up to 0.3, (I) in which Ed presents an important increase, the
second (0.3< α < 0.7) in which Ed presents no increase (II) and in third region for 0.7 < α <
0.9 in which E shows again a significant increase (III). This dependence of Ed on α is an
indication of a reaction with the participation of at least three different mechanisms and
each one mechanism presents different activation energy.
Figure 3.13 : Activation energies corresponding to fixed values of α using
Ozawa plots of AlkOA28
3.5.7.4 Kinetic analysis of AlkOA40 degradation using OFW method
The thermogravimetric curves of AlkOA40 having Mn = 1285 g mol-1 at different
heating rates were shown in Figure 3.9. With reference to the DTG thermograms of
AlkOA40 (Figure 3.9b), the mass loss follows 3 stages but these stages are
indistinguishable in the TG curves. These 3 stages are: first in the temperature region close
to the 130˚C, second between 371 to 392˚C and the third is before 700˚C. Hence, to enable
detailed kinetic description of mass loss, at least three different mechanisms have to be
94
considered. The activation energy of degradation of the studied macromer as estimated
using this method also corresponds to distinct values of α during the reaction. Some of the
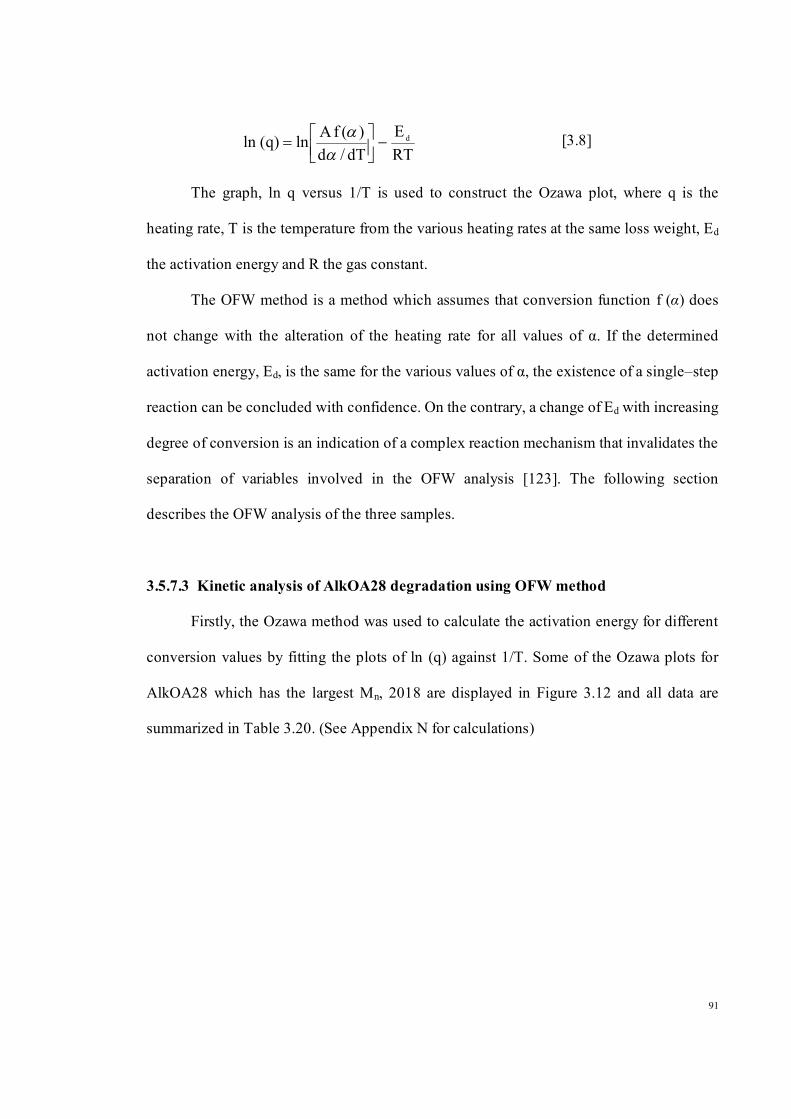
Ozawa plots for AlkOA40 between 10% and 90% weight loss are displayed in Figure 3.14
and as mentioned before data are summarized in Table 3.20. (See Appendix N for
calculations)
1.7
2.1
2.5
2.9
3.3
3.7
1.38 1.48 1.58 1.68 1.78
1/T× (103)
ln q
Figure 3.14 : Ozawa plots of AlkOA40 at various conversion of reaction: α = 0.1(○), α =
0.2 (-), α = 0.3 (+), α = 0.4 (♦), α = 0.5 (◊), α = 0.6 (×), α = 0.7 (▲), α = 0.8 (□), α = 0.9 (•)
The results as shown in Figure 3.15 reveal that the dependence of Ed on α value calculated
according to the different degradation processes can be divided by four distinct regions.
Figure 3.15 : Activation energies corresponding to fixed values of α using
Ozawa plots of AlkOA40

95
The first one is for values of α up to 0.2, in which Ed presents a significant increase,
the second for values between 0.2 < α < 0.7 in which Ed shows a slight monotonous
increase, the third region appears between 0.7< α < 0.8 in which Ed shows no increase and
the fourth region can be seen for α > 0.8 whereby Ed displays an important increase. This
dependence of Ed on α is an indication of a complex reaction comprising of at least four
different mechanisms. The activation energies for this sample are very small at the initial
stages of decomposition and higher at the final stages. These initial lower values are most
likely associated with initiation process that occurs at weak links of the polymer. By
increasing the temperature, random scission of macromolecular chains predominates.
3.5.7.5 Kinetic analysis of AlkOA65 degradation using OFW method
The thermogravimetric curves of AlkOA65 with Mn= 907 g mol-1 at different
heating rates are shown in Figure 3.10. From the DTG thermograms of AlkOA65 (Figure
3.10b); it can be seen that the mass loss occurs in a minimum 4 of stages under all heating
rates. These stages are obvious: first in the region of the between 100 to 200˚C, second
around 368˚C and the third step is between 400 to 428˚C and final stage takes place before
700˚C. Therefore, for the exact kinetic description of mass loss, at least four different
mechanisms have to be taken into account. Figure 3.16 shows Ozawa plots for AlkOA65
between 10 to 90% weight loss at different heating rates. (See Appendix N for calculations)
Figure 3.17 shows that the dependence of Ed on α values that were calculated using OFW
method.

96
2
2.4
2.8
3.2
3.6
4
1.37 1.42 1.47 1.52 1.57 1.62 1.67 1.72 1.77
1/T×(103)
ln (q
)
Figure 3.16 : Ozawa plots of AlkOA65 at various conversion of reaction: α = 0.1(○), α =
0.2 (-), α = 0.3 (+), α = 0.4 (♦), α = 0.5 (◊), α = 0.6 (×), α = 0.7 (▲), α = 0.8 (□), α = 0.9 (•)
From the slopes of the Figure 3.17, the degradation process can be separated in five
regions for this sample. The initial stage of decomposition that occurs up to α < 0.3 shows
an important increase in activation energy, the second stage appears at 0.3< α < 0.5 in
which Ed demonstrates a small increment, the third region at 0.5 < α < 0.7 displays no
increase in activation energy, the fourth stage of decomposition appears at 0.7 < α < 0.8
presents a big increase in activation energy and the final region for α > 0.8 in which Ed
exhibits a slight increase again.
Figure 3.17 : Activation energies corresponding to fixed values of α using
Ozawa plots of AlkOA65

97
This dependence of Ed on α indicates a complex reaction and also proves the effect of
molecular weight of the alkyds on reaction mechanism. By using OFW method, decreasing
the molecular weight of macromer reveals more complexity in degradation reaction and all
results are consistent with the presence of overlapped peaks in the DTG curves.
3.6 Summary
Three macromers with different percentage of oleic acid, phthalic anhydride and
glycerol were synthesized. From Kissinger method, the activation energies of thermal
degradation for the macromers AlkOA28, AlkOA40 and AlkOA65 are found to be 229.0,
183.0 and 134.0 kJ mol-1 respectively. Using the Arrhenius equation, the average
degradation rate constant, k, at Tp, calculated for AlkOA28, AlkOA40 and AlkOA65 are
0.021, 0.017 and 0.011.
Ozawa, Flynn and Wall (OFW) method was used to clarify relationship between
activation energy and degree of conversion (α) in decomposition reactions. From OFW
method, the dependence of activation energy on the α value for AlkOA28, was recognized
by the existence of three regions for Ed values and that of AlkOA40 was indicated by four
regions, while for AlkOA65 the existence of five regions for Ed values was identified. In
addition, the OFW method reveals more complexity in the degradation reactions with
decrease in the molecular weight of the macromers. The thermal properties of the
macromers improve as the PA/oleic acid ratio is increased from 0.22 in AlkOA65 to 1.55 in
AlkOA28 and glycerol/oleic acid ratio raised up from 0.32 in AlkOA65 to 1 in AlkOA28.
The oleic acid, due to its long chain is more thermally labile and thus decreases the thermal
stability.