boletim do banco central do brasil – annual report 2011 · 2013-05-27 · 2 boletim do banco...
TRANSCRIPT


ISSN 1517-7270CGC 00.038.166/0001-05
Boletim do Banco Central do Brasil Brasília v. 47 Annual 2011 P. 1-222 Report

2 Boletim do Banco Central do Brasil – Annual Report 2011
Boletim do Banco Central do BrasilPublished annually by the Banco Central do Brasil/Department of Economics (Depec). The contents and their correspondent statistical tables are under the charge of the following component parts:
The Brazilian Economy – Consultative Group on Domestic Economic Activity (Coace) (E-mail: [email protected]); Money and Credit – Monetary and Banking Division (Dimob) (E-mail: [email protected]); Capital and Financial Markets – Monetary and Banking Division (Dimob) (E-mail: [email protected]);Public Finance – Public Finance Division (Difin) (E-mail: [email protected]);Economic-Financial Relations with the International Community – Balance of Payments Division (Dibap) (E-mail: [email protected]);The International Economy – Consultative Group on Economic Research and Analysis (Copec)(E-mail: [email protected]);International Financial Organizations – Departament of Foreign Debt and External Relations (Derin)(E-mail: [email protected]);
Information on the Boletim:
Phone (55.61) 3414-1009Fax (55.61) 3414-2036
Subscription request: complete and print the form that can be found at the site www.bcb.gov.br, and send it with a cheque for the appropriate amount payable to Banco Central do Brasil, at the following prices: R$375,00 (domestic) and US$231,00 (abroad) to the General Control of Publications. Subscription to the Boletim includes twelve monthly issues, the Annual Report and four issues of the Inflation Report.
Reproduction permitted only if source is stated: Boletim do Banco Central do Brasil, Volume 47, Annual Report 2011
General Control of Publications
Banco Central do BrasilSecre/Surel/CogivSBS – Quadra 3 – Bloco B – Edifício-Sede – 1º andarCaixa Postal 8.67070074-900 Brasília – DF – BrazilPhones: (55.61) 3414-3710 and 3414-3565Fax: (55.61) 3414-3626E-mail: [email protected]
Single copy: US$21.16
Statistical Conventions: ... data not available. - nil or non-existence of the event considered.0 ou 0.0 less than half the final digit shown. * preliminary figures.
A hiphen (-) between years (1970-75) indicates the years covered, including the beginning and ending years.A bar (/) between years (1970/75) indicates the average of the years covered, including the beginning and ending years, or even crop or agreement year, when mentioned in the text.
Minor discrepancies between constituent figures and totals as well as percentage changes are due to rounding.
There are no references to sources in tables and graphs originated in the Banco Central do Brasil.
Address
Banco Central do BrasilSecre/Surel/DiateSBS – Quadra 3 – Bloco B – Edifício-Sede – 2º subsolo70074-900 Brasília - DFIDDD: (55) 0800 9792345Fax: (55.61) 3414-2553Internet: <http//www.bcb.gov.br>

Summary 3
Summary
Introduction ....................................................................................................11I- The Brazilian Economy ................................................................................ 13 Activity level ................................................................................................... 13 Gross Domestic Product ................................................................................. 13 Central Bank Index of Economic Activity ...................................................... 17 Investments ..................................................................................................... 18 Industrial output indicators ............................................................................. 20 Services ........................................................................................................... 23 Commerce Indicators ...................................................................................... 24 Agricultural output indicators ......................................................................... 26 Livestock ......................................................................................................... 28 Agricultural policy .......................................................................................... 28 Productivity ..................................................................................................... 29 Energy ........................................................................................................... 29 Employment indicators ................................................................................... 30 Wage and earnings indicators ......................................................................... 32 Price indicators ............................................................................................... 33 General price indices ...................................................................................... 33 Consumer price indices ................................................................................... 34 Regulated prices .............................................................................................. 36 Cores ........................................................................................................... 37
II- Money and Credit ......................................................................................... 39 Monetary policy .............................................................................................. 39 Monetary aggregates ....................................................................................... 39 Financial system credit operations .................................................................. 44 National Financial System .............................................................................. 50

4 Boletim do Banco Central do Brasil – Annual Report 2011
III- Capital and Financial Markets .................................................................... 53 Real interest rates and market expectations .................................................... 53 Capital markets ............................................................................................... 54 Financial investments ..................................................................................... 56
IV- Public Finance ............................................................................................... 59 Tax, fiscal and budget policies ........................................................................ 59 Other economic policy measures .................................................................... 60 Public Sector Borrowing Requirements ......................................................... 61 Federal securities debt .................................................................................... 65 Public Sector Net Debt ................................................................................... 69 Collection of federal taxes and contributions ................................................. 73 Social Security ................................................................................................ 74 State and municipal finances .......................................................................... 75
V- Economic-Financial Relations with the International Community ......... 77 Foreign Trade Policy ....................................................................................... 77 Exchange policy .............................................................................................. 82 Exchange movement ....................................................................................... 85 Balance of payments ....................................................................................... 86 Trade balance .................................................................................................. 88 Trade exchange ............................................................................................. 108 Services ......................................................................................................... 109 Income ..........................................................................................................113 Current unilateral transfers ............................................................................115 Financial account ..........................................................................................116 International reserves ................................................................................... 125 National Treasury external debt service ........................................................ 125 Foreign debt .................................................................................................. 127 Foreign sustainability indicators .................................................................. 134 External funding operations .......................................................................... 136 Brazilian foreign debt bonds ......................................................................... 137 International Investment Position (IIP) ......................................................... 138 IMF financing and relationship with Brazil ................................................. 139
VI- The International Economy ....................................................................... 141 Economic activity ......................................................................................... 141 Monetary policy and inflation ....................................................................... 146 International financial market ....................................................................... 151 Commodities ................................................................................................. 155

Summary 5
VII- International Financial Organizations ...................................................... 157 International Monetary Fund ........................................................................ 157 G-20 ......................................................................................................... 159 Bank for International Settlements (BIS) ..................................................... 161 Center for Latin American Monetary Studies (Cemla) ................................. 163
VIII- Main Economic Policy Measures ............................................................... 165 Constitutional Amendment ........................................................................... 165 Supplementary Law ...................................................................................... 165 Laws ......................................................................................................... 165 Provisional Measures .................................................................................... 168 Legislative Decrees ....................................................................................... 170 Decrees 170 National Monetary Council Resolutions ....................................................... 176 Foreign Trade Council Resolutions .............................................................. 185 Central Bank of Brazil Circulars .................................................................. 195 Circulars of the Foreign Trade Secretariat .................................................... 199 Federal Revenue Secretariat of Brazil Directives ......................................... 200 Foreign Trade Secretariat Directives ............................................................ 201 National Treasury Secretariat Directives ...................................................... 201 Normative Instructions of the Federal Revenue Secretariat of Brazil .......... 204 Interpretative Declaratory Acts of the Federal Revenue Secretariat ............. 205 Central Bank of Brazil Communiqués .......................................................... 205 Circular Letters of the Central Bank of Brazil .............................................. 205
Appendix ...................................................................................................... 207

6 Boletim do Banco Central do Brasil – Annual Report 2011
Statistical Tables
Chapter I 1.1 GDP at market price ......................................................................... 14 1.2 GDP real change rates – Under the prism of production ................ 15 1.3 GDP real change rates – Under the prism of expenditure ................ 15 1.4 GDP – Quarterly growth/previous quarter – Seasonally adjusted ... 16 1.5 Gross Domestic Product – At current value ..................................... 17 1.6 Gross capital formation (GCF) .......................................................... 18 1.7 Selected capital goods production .................................................... 19 1.8 BNDES disbursement ....................................................................... 20 1.9 Industrial production ......................................................................... 21 1.10 Industrial capacity utilization .......................................................... 22 1.11 Agricultural production – Major crops ............................................. 26 1.12 Agricultural production, harvested area and average earnings – Major crops ..................................................................... 27 1.13 Apparent consumption of oil derivatives and fuel alcohol ............. 30 1.14 Electric energy consumption ............................................................ 30 1.15 Formal employment – New jobs openings ........................................ 31 1.16 Average earnings of occupied people – 2011 ................................... 32 1.17 IPCA items share in 2011 ................................................................. 38 1.18 IPCA items share in 2011 ................................................................. 39 1.19 Major items included in the IPCA during 2011 ............................... 36 1.20 Regulated prices in 2011 – Selected items ....................................... 37 1.21 Consumer prices and core inflation in 2011 ..................................... 38
Chapter II 2.1 Collection rate on mandatory reserves ............................................. 42 2.2 Financial assets ................................................................................. 44 2.3 Credit operations ............................................................................... 45 2.4 Nonearmarked credit operations ....................................................... 46 2.5 Earmarked credit operations .............................................................. 49 2.6 BNDES disbursements ..................................................................... 50 Chapter III 3.1 Nominal income of financial investment – 2011 .............................. 58
Chapter IV 4.1 Public sector borrowing requirements .............................................. 62 4.2 Central government primary result .................................................. 63 4.3 Gross revenue of National Treasure ................................................. 64 4.4 National Treasure expenditures ........................................................ 64 4.5 Uses and sources – Consolidated public sector ................................ 65 4.6 Federal securities – Portfolio position .............................................. 66 4.7 Federal public securities ................................................................... 67

Summary 7
4.8 Public sector net debt growth ...................................................... 69/70 4.9 Public Sector Net Debt ..................................................................... 71 4.10 Gross and net government debt ........................................................ 72 4.11 Gross federal revenues ..................................................................... 73 4.12 Income Tax and Industrialized Products Tax ................................... 74 4.13 Social Security.................................................................................. 74 4.14 Payment of the Tax on the Circulation of Merchandise and Services (ICMS) ............................................................................... 75 4.15 Federal government onlendings to states and municipalities ............ 76
Chapter V 5.1 Foreign exchange operations ............................................................ 85 5.2 Balance of payments ........................................................................ 87 5.3 Trade balance – FOB ........................................................................ 88 5.4 Exports price and volume indices .................................................... 89 5.5 Imports price and volume indices .................................................... 91 5.6 Exports by aggregate factor – FOB .................................................. 93 5.7 Exports – FOB – Major primary products ....................................... 94 5.8 Exports by aggregate factor and by region – FOB ........................... 95 5.9 Exports – FOB – Major semimanufactured goods ........................... 96 5.10 Exports – FOB – Major manufactured goods .................................. 97 5.11 Exports by main products and countries – FOB .............................. 99 5.12 Exports by tecnological intensity – FOB ....................................... 100 5.13 Imports – FOB ................................................................................ 101 5.14 Imports – FOB – Major products ................................................... 103 5.15 Imports by category of use and by region – FOB .......................... 104 5.16 Imports by main products and trade partners – FOB ..................... 106 5.17 Imports by tecnological intensity – FOB ....................................... 107 5.18 Brazilian trade by region – FOB .................................................... 109 5.19 Services ........................................................................................... 110 5.20 International travel .......................................................................... 111 5.21 Transportation ................................................................................. 111 5.22 Business, technical and professional services ................................. 112 5.23 Income ............................................................................................. 114 5.24 Current transfers .............................................................................. 115 5.25 Current account balance and external financing requirements ........ 116 5.26 Private sector medium and long-term rollover rates ....................... 117 5.27 Foreign direct investments .............................................................. 118 5.28 Foreign direct investments inflows – Equity capital – Distribution by immediate investing country ................................. 120 5.29 Foreign direct investments inflows – Equity capital – Distribution by economic activity sector ....................................... 121 5.30 Portfolio investments – Liabilities ................................................. 122 5.31 Other foreign investments .............................................................. 123 5.32 Brazilian direct investments abroad ............................................... 123
8 Boletim do Banco Central do Brasil – Annual Report 2011
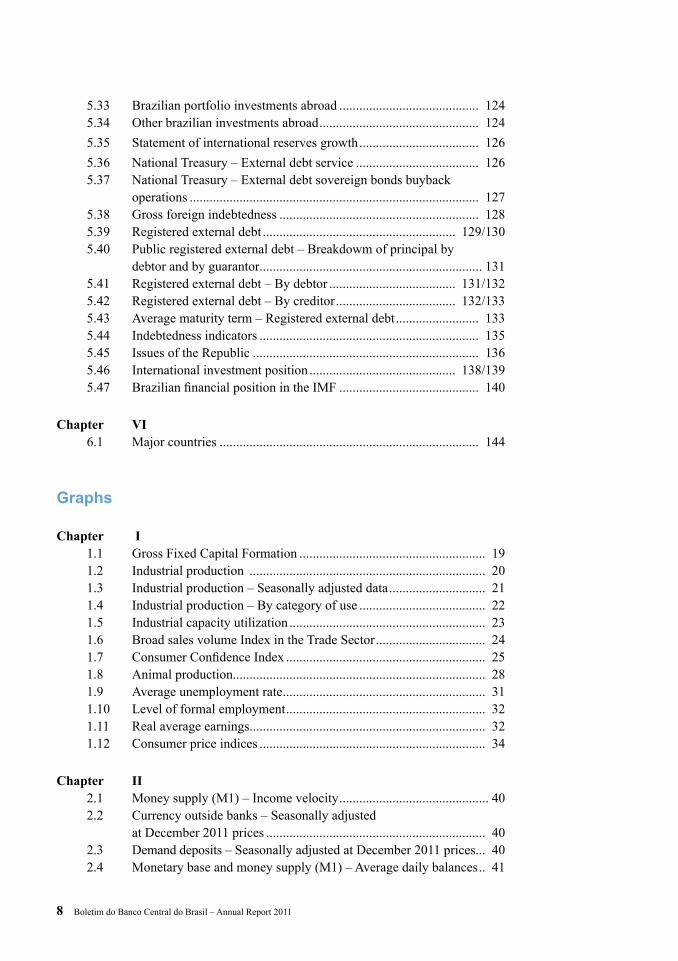
5.33 Brazilian portfolio investments abroad .......................................... 124 5.34 Other brazilian investments abroad ................................................ 124 5.35 Statement of international reserves growth .................................... 126 5.36 National Treasury – External debt service ..................................... 126 5.37 National Treasury – External debt sovereign bonds buyback operations ....................................................................................... 127 5.38 Gross foreign indebtedness ............................................................ 128 5.39 Registered external debt .......................................................... 129/130 5.40 Public registered external debt – Breakdowm of principal by debtor and by guarantor................................................................... 131 5.41 Registered external debt – By debtor ...................................... 131/132 5.42 Registered external debt – By creditor .................................... 132/133 5.43 Average maturity term – Registered external debt ......................... 133 5.44 Indebtedness indicators .................................................................. 135 5.45 Issues of the Republic .................................................................... 136 5.46 International investment position ............................................ 138/139 5.47 Brazilian financial position in the IMF .......................................... 140
Chapter VI 6.1 Major countries .............................................................................. 144
Graphs
Chapter I 1.1 Gross Fixed Capital Formation ........................................................ 19 1.2 Industrial production ....................................................................... 20 1.3 Industrial production – Seasonally adjusted data ............................. 21 1.4 Industrial production – By category of use ...................................... 22 1.5 Industrial capacity utilization ........................................................... 23 1.6 Broad sales volume Index in the Trade Sector ................................. 24 1.7 Consumer Confidence Index ............................................................ 25 1.8 Animal production............................................................................ 28 1.9 Average unemployment rate ............................................................. 31 1.10 Level of formal employment ............................................................ 32 1.11 Real average earnings ....................................................................... 32 1.12 Consumer price indices .................................................................... 34 Chapter II 2.1 Money supply (M1) – Income velocity ............................................. 40 2.2 Currency outside banks – Seasonally adjusted at December 2011 prices .................................................................. 40 2.3 Demand deposits – Seasonally adjusted at December 2011 prices... 40 2.4 Monetary base and money supply (M1) – Average daily balances .. 41

Summary 9
2.5 Financial assets – As percentage of GDP ......................................... 43 2.6 Credit by borrower’s economic activity – Financial system ............ 45 2.7 Interest rates of credit operations with nonearmarked resources ..... 47 2.8 Interest rates of credit operations – Individuals .............................. 47 2.9 Interest rates of credit operations – Corporations ........................... 47 2.10 Spread of credit operations with nonearmarked resources ............... 48 2.11 Default rate of credit operations with nonearmarked resources ....... 48
Chapter III 3.1 Over/Selic rate .................................................................................. 53 3.2 Over/Selic rate x dollar x 360-day swap .......................................... 53 3.3 Yield curve – ID x fixed rate swap ................................................... 54 3.4 Over/Selic cumulative 12-month rate .............................................. 54 3.5 Primary issues .................................................................................. 55 3.6 Ibovespa ........................................................................................... 55 3.7 Ibovespa x Dow Jones x Nasdaq – 2011 .......................................... 55 3.8 Daily average volume traded in Bovespa – 2011 ............................. 56 3.9 Market capitalization – 2011 – Corporation listed in Bovespa ........ 56 3.10 Financial investments – Balances .................................................... 57 3.11 Nominal income of major financial investments – 2011 ................. 57
Chapter IV 4.1 Public sector borrowing requirements ............................................... 63 4.2 Federal public securities ................................................................... 67 4.3 Federal securitized debt structure ...................................................... 67 4.4 Net financing position of the federal public securities ...................... 68 4.5 Central Bank repo operations ............................................................ 68 4.6 Social security ................................................................................... 75
Chapter V 5.1 Current accounts balance and external financing requirements ....... 88 5.2 Exports and imports – FOB .............................................................. 88 5.3 Terms of trade index ......................................................................... 89 5.4 Quarterly price indices and volume of Brazilian exports ................. 90 5.5 Quarterly price indices and volume of Brazilian imports ................ 92 5.6 Exports by aggregate factor – FOB .................................................. 93 5.7 Raw material imports x industrial production ................................ 101 5.8 Brazilian imports by end use category – FOB (% growth) ............ 102 5.9 Brazilian imports by end use category – FOB (% change) ............ 105 5.10 International reserves ..................................................................... 125 5.11 Average term of registered external debt ....................................... 134 5.12 Registered external debt composition ............................................ 134 5.13 Sustainability indicators ................................................................. 136 5.14 Prices of Brazilian securities abroad .............................................. 137
10 Boletim do Banco Central do Brasil – Annual Report 2011
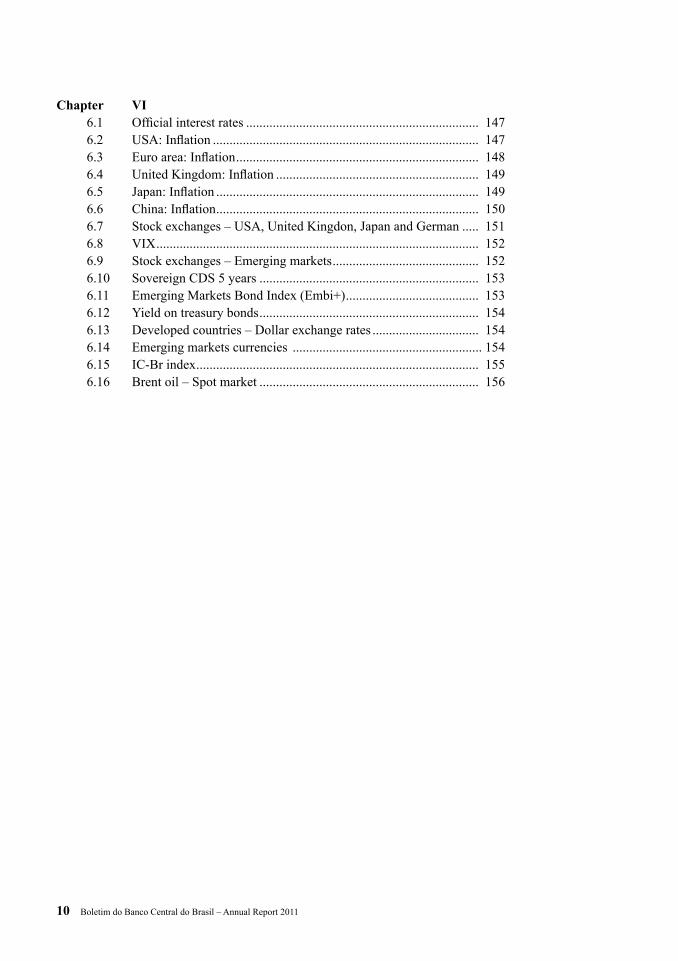
Chapter VI 6.1 Official interest rates ...................................................................... 147 6.2 USA: Inflation ................................................................................ 147 6.3 Euro area: Inflation ......................................................................... 148 6.4 United Kingdom: Inflation ............................................................. 149 6.5 Japan: Inflation ............................................................................... 149 6.6 China: Inflation ............................................................................... 150 6.7 Stock exchanges – USA, United Kingdon, Japan and German ..... 151 6.8 VIX ................................................................................................. 152 6.9 Stock exchanges – Emerging markets ............................................ 152 6.10 Sovereign CDS 5 years .................................................................. 153 6.11 Emerging Markets Bond Index (Embi+) ........................................ 153 6.12 Yield on treasury bonds .................................................................. 154 6.13 Developed countries – Dollar exchange rates ................................ 154 6.14 Emerging markets currencies ......................................................... 154 6.15 IC-Br index ..................................................................................... 155 6.16 Brent oil – Spot market .................................................................. 156
Introduction 11
Introduction
The global economic activity, following a strong recovery observed at the beginning of 2011, started to refl ect the upward trajectory of commodity prices begun in the previous year; the worsening of the fi scal crisis in some European countries; geopolitical confl icts in the North Africa and Middle East; and economic impacts of the strong earthquake that hit Japan. In this scenario, economic activity decelerated signifi cantly in leading mature economies, except in the Eurozone. Infl ation, basically refl ecting the supply shock of commodities observed since the second half of 2010, continued to follow an upward trend in major developed and emerging economies, where the tightening cycles of monetary and fi scal policies were intensifi ed.
In the second quarter of the year, businessmen and consumers’ expectations were negatively affected by the worsening of the fi scal crisis in Europe, of some fi scal-related issues in the U.S., coupled with the perspective of moderate activity growth in these economies and its likely effects over leading mature and emerging economies. In this context, in which important European economies slowed down and the Japanese economy registered another decline, the increase of risk perception led to high volatility on fi nancial markets.
The reduction of growth forecasts in leading economies intensifi ed in the second half of 2011. In this context, in spite of renewed consumption support to activity growth in the U.S., activity expansion in Japan due to measures aimed at reconstruction and post-catastrophe recovery of production lines, coupled with a slight growth deceleration in China, the Eurozone economy registered a signifi cant slowdown. In this framework, coupled with the environment of high volatility on fi nancial markets, the world economy continued to follow a disinfl ationary trajectory.
In line with the evolution of the international scenario, the Brazilian economy did not succeed to repeat the vigorous growth rate registered in the previous year. The moderation of economic activity in 2011 was also consistent with policy measures implemented since the end of 2010 aimed to adjust domestic liquidity conditions and the mismatch between aggregate supply and demand. In this context, the Gross Domestic Product (GDP) registered annual expansion of 2.7% in 2011.

12 Boletim do Banco Central do Brasil – Annual Report 2011
It should be noted that, in a context of global economic deceleration, the expansion of the Brazilian economy continued to be fueled by domestic demand, with emphasis on the dynamics of consumption, which registered the eighth consecutive annual growth, mainly refl ecting the impact on household income of favorable labor market conditions and the maintenance of government social programs.
In this scenario, according to a pre-established schedule, the Central Bank Monetary Policy Committee (Copom) carried out eight ordinary meetings in the year. In the fi rst fi ve meetings, by evaluating that the risks for the consolidation of a positive infl ation scenario were associated, in the external scope, to the increased commodity prices and, in the internal scope, to the mismatch between the growth rates of domestic absorption and supply expansion capacity, Copom implemented fi ve consecutive risings in the basic interest rate, totalizing 175 b.p., which was fi xed at 12.50% p.y. in July.
In the meetings carried out in August, October and November, Copom evaluated that the impact of supply shocks observed in the fi rst half of the year on infl ation as well as the risks associated with the persistent mismatch between the growth rates of supply and demand started to diminish. In this scenario, in which the level of utilization of installed capacity started to decline and the international scenario further deteriorated, Copom, by assessing that the prospective infl ation scenario was favorable, carried out three consecutive cuts in the Selic rate, totalizing 150 b.p., which was fi xed at 11,0% p.y. in the November meeting.
With regard to the external sector, the perception about the solidness of Brazilian external accounts offset the impact of international fi nancial markets volatility. This sentiment, in a scenario of sustained consistence of macroeconomic policy based on infl ation targets, fi scal responsibility and fl oating exchange system, refl ected in the signifi cant improvement of Brazilian sovereign credit ratings by the agencies Fitch, in April, Moody’s, in June, and Standard and Poor’s, in November.
In this context, the Brazilian external position was positive in 2011 according to several aspects: the defi cit in current transactions, measured as a GDP ratio, was reduced in comparison with the previous year; the trade in goods and services increased; the net external liabilities, expressed by the International Investment Position (IIP), decreased in absolute terms; and the coverage of the stock of international reserves over the debt’s principal with 12-month maturity improved signifi cantly.
Worries about the evolution of the sovereign debt of important European countries did not affect the volume of funds obtained by the Brazilian private sector. According to previous estimates published by the United Nations Conference on Trade and Development (Unctad) through the Global Investment Trends Monitor, Brazil was the fi fth greatest recipient of net fl ows, behind the U.S, U.K., China and Hong Kong.

I The Brazilian Economy 13
IThe Brazilian Economy
Activity level
Following the strong expansion in 2010, the Brazilian economy registered a moderate growth pace in 2011. This evolution was consistent with the policy measures implemented since the end of 2010 and the deteriorating international economic scenario, especially as of the second half of the year. In this context, the GDP registered annual expansion of 2.7% in 2011, compared to 7.5% in 2010.
It should be noted that, in the context of reduced foreign demand, economic expansion was supported by domestic demand, with emphasis on the dynamics of household consumption, which, mainly refl ecting the favorable labor market and the maintenance of governmental programs aimed at income distribution, registered the eighth consecutive annual growth.
Gross Domestic Product
According to the Quarterly National Accounts of the Brazilian Institute of Geography and Statistics (IBGE), the GDP grew 2.7% in 2011. In current values, the GDP at market prices totaled R$4,143 billion in the year.
The analysis under the perspective of demand reveals that the annual GDP expansion resulted from contributions of 3.4 p.p. of the domestic component and -0.7 p.p. of the external sector. Investments, refl ecting the favorable evolution of the civil construction sector and the absorption of capital goods, expanded 4.7%, while household consumption and government consumption grew by 4.1% and 1.9%, respectively. The negative contribution of the external sector refl ected expansions of 9.7% under imports and 4.5% under exports.
In the scope of supply, agriculture expanded 3.9%, services, 2.7%, and industry, 1.6%. The performance of the agricultural sector refl ected annual expansion of 7% in the grain harvest and respective variations of -2.8%, 6.6% and 9.4% in the slaughters of cattle,
I

14 Boletim do Banco Central do Brasil – Annual Report 2011
poultry and swine. The expansion of the sector of services was basically fueled by the segments of information services, 4.9%; fi nancial intermediation, insurance, pension and related services, 3.9%; commerce, 2.4%; and transportation, storage and postal services, 2.8%. The performance of the last two segments refl ected the trajectory of the agricultural and industrial sectors. The industrial performance was specially supported by the segments of production and distribution of electricity, gas and water, 3.8%; civil
Table 1.1 – GDP at market price
Year At 2011 Real Implicit At current Population Per capita GDP
prices change deflator prices1/ (million) At 2011 Real At current
(R$ (%) (%) (US$ prices change prices1/
million) million) (R$) (%) (US$)
1980 1 882 456 9.2 92.1 237 772 118 563 15 877 7.0 2 005
1981 1 802 452 -4.3 100.5 258 553 121 213 14 870 -6.3 2 133
1982 1 817 412 0.8 101.0 271 252 123 885 14 670 -1.3 2 190
1983 1 764 162 -2.9 131.5 189 459 126 573 13 938 -5.0 1 497
1984 1 859 427 5.4 201.7 189 744 129 273 14 384 3.2 1 468
1985 2 005 373 7.8 248.5 211 092 131 978 15 195 5.6 1 599
1986 2 155 576 7.5 149.2 257 812 134 653 16 008 5.4 1 915
1987 2 231 668 3.5 206.2 282 357 137 268 16 258 1.6 2 057
1988 2 230 329 -0.1 628.0 305 707 139 819 15 952 -1.9 2 186
1989 2 300 807 3.2 1 304.4 415 916 142 307 16 168 1.4 2 923
1990 2 200 722 -4.3 2 737.0 469 318 146 593 15 013 -7.1 3 202
1991 2 223 389 1.0 416.7 405 679 149 094 14 913 -0.7 2 721
1992 2 211 303 -0.5 969.0 387 295 151 547 14 592 -2.2 2 556
1993 2 320 205 4.9 1 996.1 429 685 153 986 15 068 3.3 2 790
1994 2 456 003 5.9 2 240.2 543 087 156 431 15 700 4.2 3 472
1995 2 559 740 4.2 93.9 770 350 158 875 16 112 2.6 4 849
1996 2 614 787 2.2 17.1 840 268 161 323 16 208 0.6 5 209
1997 2 703 044 3.4 7.6 871 274 163 780 16 504 1.8 5 320
1998 2 703 999 0.0 4.2 843 985 166 252 16 264 -1.5 5 077
1999 2 710 870 0.3 8.5 586 777 168 754 16 064 -1.2 3 477
2000 2 827 605 4.3 6.2 644 984 171 280 16 509 2.8 3 766
2001 2 864 735 1.3 9.0 553 771 173 808 16 482 -0.2 3 186
2002 2 940 882 2.7 10.6 504 359 176 304 16 681 1.2 2 861
2003 2 974 603 1.1 13.7 553 603 178 741 16 642 -0.2 3 097
2004 3 144 521 5.7 8.0 663 783 181 106 17 363 4.3 3 665
2005 3 243 877 3.2 7.2 882 439 183 383 17 689 1.9 4 812
2006 3 372 239 4.0 6.1 1 088 767 185 564 18 173 2.7 5 867
2007 3 577 656 6.1 5.9 1 366 544 187 642 19 066 4.9 7 283
2008 3 762 678 5.2 8.3 1 650 897 189 613 19 844 4.1 8 707
2009 3 750 271 -0.3 7.2 1 625 636 191 481 19 586 -1.3 8 490
2010 4 032 805 7.5 8.2 2 143 921 193 253 20 868 6.5 11 094
2011 4 143 013 2.7 7.0 2 475 066 194 947 21 252 1.8 12 696
Source: IBGE
1/ Estimates obtained by the Banco Central do Brasil dividing the GDP at current prices by the annual average buying
rate of exchange.

I The Brazilian Economy 15
construction, 3.6%; and mining activities, 3.2%, as against the sluggish performance of the manufacturing industry, which grew 0.1% in the year.
The analysis of seasonally adjusted data reveals that the GDP grew moderately during the fi rst two quarters of 2011, as compared to the respective quarters of the previous year, then slowed down slightly in the third quarter of the year, when the economic activity was impacted by the deterioration of the international scenario, and resumed the growth trajectory in the fi nal quarter of the year.
The GDP grew 0.6% in the fi rst quarter of the year, in comparison with the fourth quarter of 2010. The analysis under the prism of supply reveals that the quarterly
Table 1.2 – GDP real change rates – Under the prism of production
Percentage
Itemization 2009 2010 2011
GDP -0.3 7.5 2.7
Crop and livestock sector -3.1 6.3 3.9
Industrial sector -5.6 10.4 1.6
Mineral extraction -3.2 13.6 3.2
Manufacturing -8.7 10.1 0.1
Building -0.7 11.6 3.6
Production and distribution of electricity, gas and water supply 0.9 8.1 3.8
Service sector 2.1 5.5 2.7
Commerce -1.0 10.9 3.4
Transportation, storage and postal services -3.6 9.2 2.8
Information services 0.8 3.7 4.9
Financial intermediation, insurance, complementary pension system
and related services 7.8 10.0 3.9
Other services 3.2 3.7 2.3
Real estate activities and rent 2.6 1.7 1.4
Public administration, health and education 3.0 2.3 2.3
Source: IBGE
Table 1.3 – GDP real change rates – Under the prism of expenditure
Percentage
Itemization 2009 2010 2011
GDP -0.3 7.5 2.7
Family consumption 4.4 6.9 4.1
Government consumption 3.1 4.2 1.9
Gross Fixed Capital Formation -6.7 21.3 4.7
Exports of goods and services -9.1 11.5 4.5
Imports of goods and services -7.6 35.8 9.7
Source: IBGE

16 Boletim do Banco Central do Brasil – Annual Report 2011
GDP performance resulted from respective increases of 4.4%, 1.7% and 0.4% under the primary sector, industry and services. It should be noted that the agricultural sector had been negatively impacted in the second half of 2010, while the sector of services had been following an upward trajectory since the beginning of 2009.
Under the perspective of demand, expansions under Gross Fixed Capital Formation (GFCF) and household consumption closed at 1.2% and 0.5% in the fi rst quarter of the year, respectively, while the government consumption decreased 0.1%. Additionally, exports and imports declined 2.6% and 1.3%, in the same order.
GDP increased 0.5% in the second quarter of 2011 as compared with the previous quarter. The analysis under the output perspective reveals respective quarterly variations of -1.1%, -0.3% and 0.6% in the segments of agriculture, industry and service. It is worth noting the dynamics of the sector of services, which registered the tenth consecutive quarterly expansion, while the industrial production slowed down in the period.
Under the perspective of demand, in which the domestic component supported GDP expansion, it should be noted the 2.0% expansion under government consumption, followed by respective quarterly expansions of 1.1% and 0.5% under GFCF and household consumption. The external sector gave a negative contribution to the GDP evolution in the quarter, as imports increased 5.4% and exports, 2.5%.
In the third quarter of 2011, GDP decreased 0.1% in comparison with the previous year. The analysis under the perspective of production reveals quarterly increase of 2.5% in the agricultural sector, in contrast with declines in the sector of services, 0.2%, and
Table 1.4 – GDP – Quarterly growth/previous quarter – Seasonally adjusted
Percentage
Itemization
I II III IV
GDP at market price 0.6 0.5 -0.1 0.3
Under the prism of product
Crop and livestock sector 4.4 -1.1 2.5 0.9
Industrial sector 1.7 -0.3 -1.1 -0.5
Service sector 0.4 0.6 -0.2 0.6
Under the prism of expenditure
Family consumption 0.5 0.5 -0.1 1.1
Government consumption -0.1 2.0 -0.8 0.4
Gross Fixed Capital Formation 1.2 1.1 -0.4 0.2
Exports of goods and services -2.6 2.5 1.9 1.9
Imports of goods and services -1.3 5.4 -0.5 2.6
Source: IBGE
2011

I The Brazilian Economy 17
industry, 1.1%, the worst quarterly industrial result since the start of the international crisis in 2008/2009.
With regard to domestic components of demand, household consumption declined by 0.1%; GFCF by 0.4%; and government consumption by 0.8%. In the scope of the external sector, exports grew 1.9% and imports decreased 0.5%.
GDP expanded 0.3% in the last quarter of the year, in comparison with the immediately previous quarter. The analysis under the perspective of production reveals respective quarterly expansion under agriculture and services, 0.9% and 0.6%, in contrast with the 0.5% decline under industry, the third negative sector’s result in the sequence in this comparison basis.
Insofar as demand is concerned, the domestic component registered expansion under household consumption, 1.1%, government consumption, 0.4%; and GFCF, 0.2%. Meanwhile, in the scope of the external sector, exports and imports increased by 1.9% and, 2.6%, respectively.
Central Bank Index of Economic Activity
The Central Bank Index of Economic Activity – Brazil (IBC-Br) increased 2.7% in 2011, as against expansion of 7.6% observed in the previous year. The seasonally adjusted analysis reveals that the indicator grew 1.4% in the quarter ended in March, as compared
Table 1.5 – Gross Domestic Product – At current value
In R$ million
Itemization 2008 2009 2010 2011
Gross Domestic Product at market prices 3 032 203 3 239 404 3 770 085 4 143 013
Under the prism of product
Crop and livestock sector 152 612 157 232 171 177 192 653
Industrial sector 719 987 749 699 905 852 972 156
Service sector 1 707 850 1 887 448 2 150 151 2 366 062
Under the prism of expenditure
Final consumption expenditure 2 398 945 2 666 752 3 045 956 3 356 136
Family consumption 1 786 840 1 979 751 2 248 624 2 499 489
Government consumption 612 105 687 001 797 332 856 647
Gross Capital Formation 627 497 577 846 763 012 817 261
Gross Fixed Capital Formation 579 531 585 317 733 712 798 720
Changes in inventories 47 966 -7 471 29 300 18 540
Exports of goods and services 414 295 355 653 409 868 492 570
Imports of goods and services (-) 408 534 360 847 448 752 522 953
Source: IBGE
18 Boletim do Banco Central do Brasil – Annual Report 2011
with the quarter ended in December 2010, followed by declines of 0.2% and 0.3% in the next two quarters and expansion of 0.1% in the last quarter of the year.
Investments
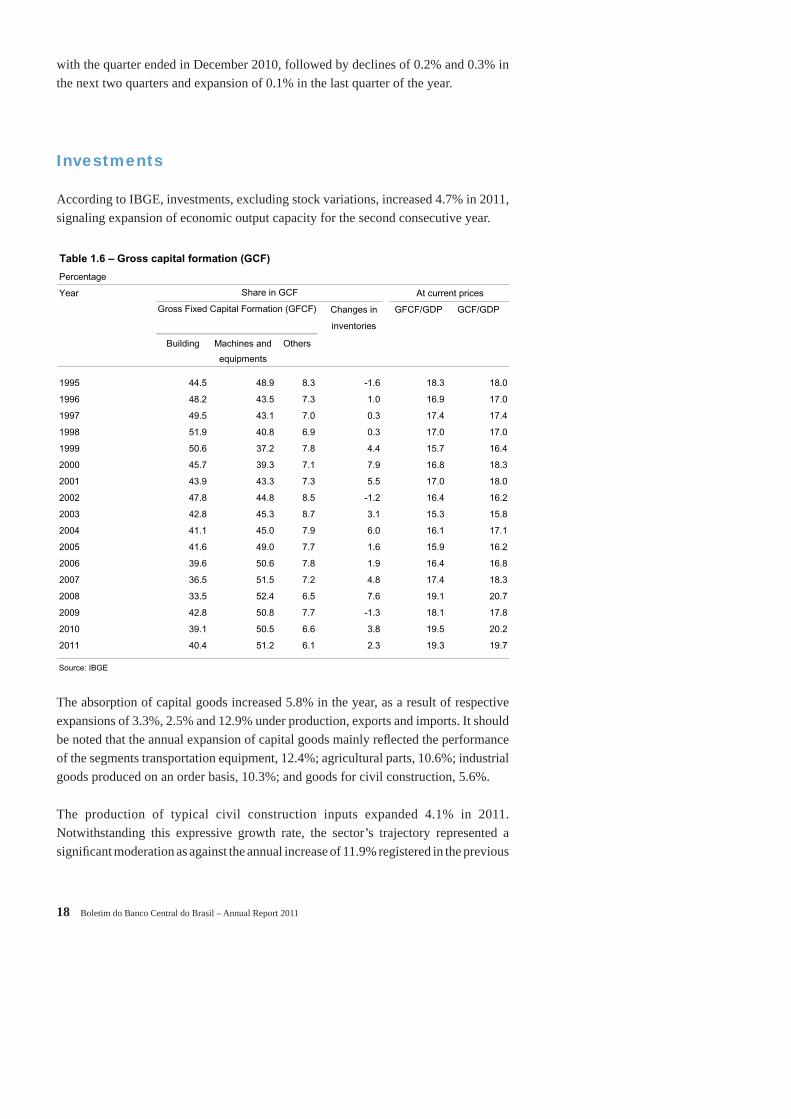
According to IBGE, investments, excluding stock variations, increased 4.7% in 2011, signaling expansion of economic output capacity for the second consecutive year.
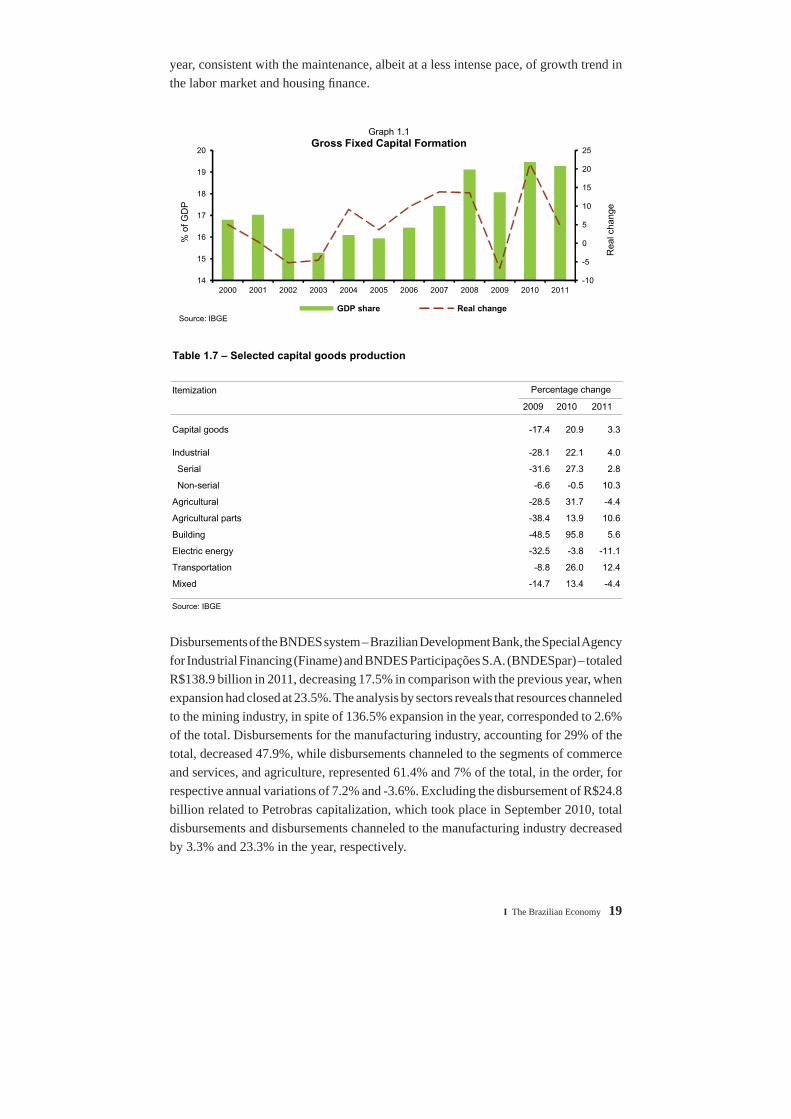
The absorption of capital goods increased 5.8% in the year, as a result of respective expansions of 3.3%, 2.5% and 12.9% under production, exports and imports. It should be noted that the annual expansion of capital goods mainly refl ected the performance of the segments transportation equipment, 12.4%; agricultural parts, 10.6%; industrial goods produced on an order basis, 10.3%; and goods for civil construction, 5.6%.
The production of typical civil construction inputs expanded 4.1% in 2011. Notwithstanding this expressive growth rate, the sector’s trajectory represented a signifi cant moderation as against the annual increase of 11.9% registered in the previous
Table 1.6 – Gross capital formation (GCF)
Percentage
Year At current prices
Changes in GFCF/GDP GCF/GDP
inventories
Building Machines and Others
equipments
1995 44.5 48.9 8.3 -1.6 18.3 18.0
1996 48.2 43.5 7.3 1.0 16.9 17.0
1997 49.5 43.1 7.0 0.3 17.4 17.4
1998 51.9 40.8 6.9 0.3 17.0 17.0
1999 50.6 37.2 7.8 4.4 15.7 16.4
2000 45.7 39.3 7.1 7.9 16.8 18.3
2001 43.9 43.3 7.3 5.5 17.0 18.0
2002 47.8 44.8 8.5 -1.2 16.4 16.2
2003 42.8 45.3 8.7 3.1 15.3 15.8
2004 41.1 45.0 7.9 6.0 16.1 17.1
2005 41.6 49.0 7.7 1.6 15.9 16.2
2006 39.6 50.6 7.8 1.9 16.4 16.8
2007 36.5 51.5 7.2 4.8 17.4 18.3
2008 33.5 52.4 6.5 7.6 19.1 20.7
2009 42.8 50.8 7.7 -1.3 18.1 17.8
2010 39.1 50.5 6.6 3.8 19.5 20.2
2011 40.4 51.2 6.1 2.3 19.3 19.7
Source: IBGE
Share in GCF
Gross Fixed Capital Formation (GFCF)
I The Brazilian Economy 19
year, consistent with the maintenance, albeit at a less intense pace, of growth trend in the labor market and housing fi nance.
Disbursements of the BNDES system – Brazilian Development Bank, the Special Agency for Industrial Financing (Finame) and BNDES Participações S.A. (BNDESpar) – totaled R$138.9 billion in 2011, decreasing 17.5% in comparison with the previous year, when expansion had closed at 23.5%. The analysis by sectors reveals that resources channeled to the mining industry, in spite of 136.5% expansion in the year, corresponded to 2.6% of the total. Disbursements for the manufacturing industry, accounting for 29% of the total, decreased 47.9%, while disbursements channeled to the segments of commerce and services, and agriculture, represented 61.4% and 7% of the total, in the order, for respective annual variations of 7.2% and -3.6%. Excluding the disbursement of R$24.8 billion related to Petrobras capitalization, which took place in September 2010, total disbursements and disbursements channeled to the manufacturing industry decreased by 3.3% and 23.3% in the year, respectively.
Table 1.7 – Selected capital goods production
Itemization
2009 2010 2011
Capital goods -17.4 20.9 3.3
Industrial -28.1 22.1 4.0
Serial -31.6 27.3 2.8
Non-serial -6.6 -0.5 10.3
Agricultural -28.5 31.7 -4.4
Agricultural parts -38.4 13.9 10.6
Building -48.5 95.8 5.6
Electric energy -32.5 -3.8 -11.1
Transportation -8.8 26.0 12.4
Mixed -14.7 13.4 -4.4
Source: IBGE
Percentage change
-10
-5
0
5
10
15
20
25
14
15
16
17
18
19
20
2000 2001 2002 2003 2004 2005 2006 2007 2008 2009 2010 2011
% o
f GD
P
Graph 1.1Gross Fixed Capital Formation
GDP share Real change
Source: IBGE
Rea
l cha
nge

20 Boletim do Banco Central do Brasil – Annual Report 2011
The Long Term Interest Rate (TJLP), used as indexing factor for loans granted by the BNDES system, remained stable at 6% p.y. throughout 2011.
Industrial output indicators
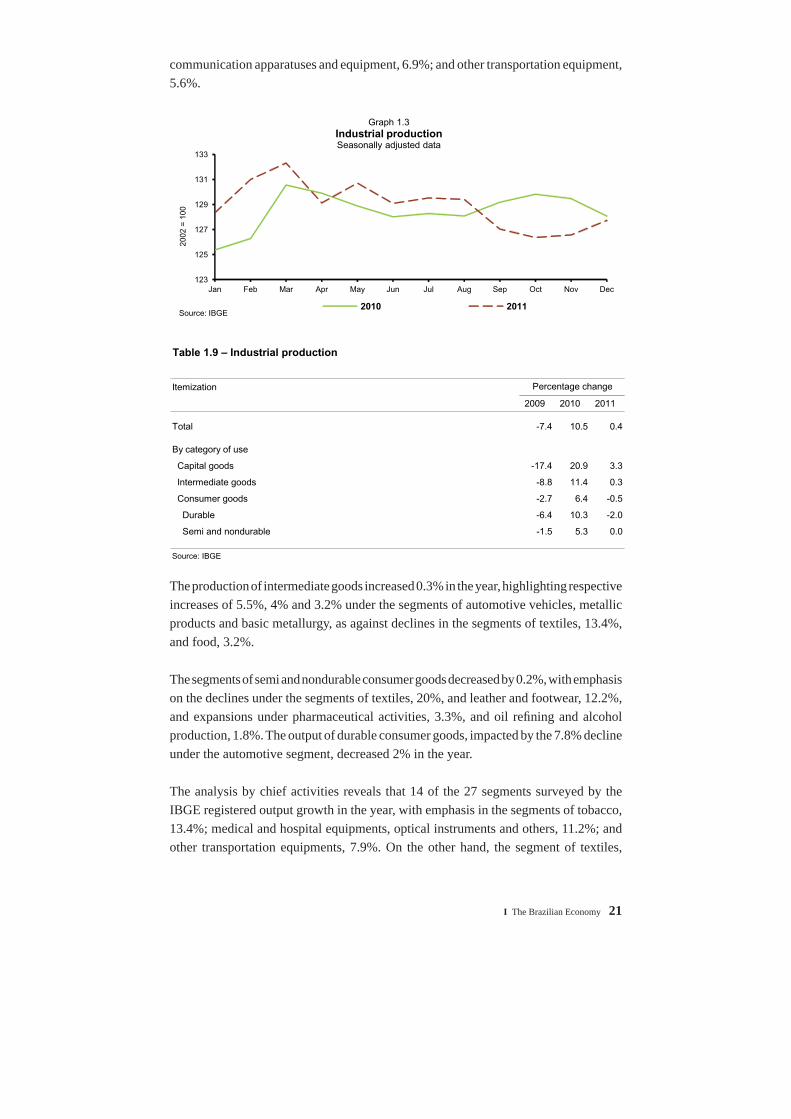
According to the IBGE Monthly Industrial Survey – Physical Production (PIM-PF), physical industrial output registered annual growth of 0.4% in 2011, following expansion of 10.5% in 2010 and decline of 7.4% in 2009. The industrial performance resulted from expansions under the mining and manufacturing segments, 2.1% and 0.2%, respectively. It should be noted that the industrial sector, after expanding 1.1% in the fi rst quarter of the year, as compared to the previous quarter, declined by 0.7%, 0.8% and 1.4% in the following quarters of the year.
The annual industrial output trajectory by category of use reveals an enhanced performance of the sector of capital goods, which grew 3.3% in 2011, with emphasis on the performance of the segment of automotive vehicles, 15.4%; electronic material,
-10
-5
0
5
10
15
20
2000 2001 2002 2003 2004 2005 2006 2007 2008 2009 2010 2011
Graph 1.2Industrial production
Total Mineral extraction Manufacturing
Source: IBGE
Per
cent
age
chan
ge
Table 1.8 – BNDES disbursement1/
In R$ million
Itemization 2009 2010 2011
Total 136 356 168 423 138 873
By sector
Manufacturing industry 60 302 77 255 40 270
Commerce and service 65 979 79 528 85 265
Crop and livestock 6 856 10 126 9 759
Extraction industry 3 219 1 514 3 579
Source: BNDES
1/ Includes BNDES, Finame and BNDESpar.
I The Brazilian Economy 21
communication apparatuses and equipment, 6.9%; and other transportation equipment, 5.6%.
The production of intermediate goods increased 0.3% in the year, highlighting respective increases of 5.5%, 4% and 3.2% under the segments of automotive vehicles, metallic products and basic metallurgy, as against declines in the segments of textiles, 13.4%, and food, 3.2%.
The segments of semi and nondurable consumer goods decreased by 0.2%, with emphasis on the declines under the segments of textiles, 20%, and leather and footwear, 12.2%, and expansions under pharmaceutical activities, 3.3%, and oil refi ning and alcohol production, 1.8%. The output of durable consumer goods, impacted by the 7.8% decline under the automotive segment, decreased 2% in the year.
The analysis by chief activities reveals that 14 of the 27 segments surveyed by the IBGE registered output growth in the year, with emphasis in the segments of tobacco, 13.4%; medical and hospital equipments, optical instruments and others, 11.2%; and other transportation equipments, 7.9%. On the other hand, the segment of textiles,
123
125
127
129
131
133
Jan Feb Mar Apr May Jun Jul Aug Sep Oct Nov Dec
2002
= 1
00
Graph 1.3Industrial productionSeasonally adjusted data
2010 2011Source: IBGE
Table 1.9 – Industrial production
Itemization
2009 2010 2011
Total -7.4 10.5 0.4
By category of use
Capital goods -17.4 20.9 3.3
Intermediate goods -8.8 11.4 0.3
Consumer goods -2.7 6.4 -0.5
Durable -6.4 10.3 -2.0
Semi and nondurable -1.5 5.3 0.0
Source: IBGE
Percentage change

22 Boletim do Banco Central do Brasil – Annual Report 2011
leather and footwear, and offi ce machines and computer equipment registered respective annual declines of 14.8%, 10.4% and 4.9%. Output of the foodstuff sector, the most important general industry segment, decreased 0.2% in 2011.
Industrial output expanded in nine of the thirteen federation units surveyed by the IBGE, with emphasis on Paraná, 7%; Espírito Santo, 6.8%; and Goiás, 6.7%. On the other hand, declines were observed in Ceará, 11.7%; Santa Catarina, 4.8%; and Bahia, 4.4%. The industrial output in the state of São Paulo, which holds the greatest share in national industry, grew 0.6% in 2011.
The level of utilization of installed capacity (Nuci) of the industrial segment followed a downward trajectory in 2011, reaching 83.4% in December, as compared to 84.9% in the same period of 2010. In terms of annual average, the Nuci decreased 0.8 p.p. in 2011, reaching 84%. Personnel employed in the industrial sector increased 1% in 2011.
The seasonally adjusted Industry Confi dence Index (ICI), of the Getulio Vargas Foundation (FGV), reached 101.8 points at the end of 2011, a level 12.7 points down from December 2010. The component that evaluates the current situation reached 102.4 points and that related to expectations, 101.1 points, declining by 13.8% and 11.7%, respectively, as compared to December 2010.
100
120
140
160
180
200
Jan2010
Feb Mar Apr May Jun Jul Aug Sep Oct Nov Dec Jan2011
Feb Mar Apr May Jun Jul Aug Sep Oct Nov Dec
2002
=100
Graph 1.4Industrial production – By category of use
Seasonally adjusted data
Capital goods Intermediate goods
Durable goods Semi and nondurable goodsSource: IBGE
Table 1.10 – Industrial capacity utilization1/
Percentage
Itemization 2009 2010 2011
Manufacturing industry 80.2 84.8 84.0
Consumer goods 82.5 85.4 83.2
Capital goods 75.5 83.4 84.4
Building material 85.3 90.1 89.1
Intermediate goods 80.8 85.8 85.5
Source: FGV
1/ Average in the year.

I The Brazilian Economy 23
It is worth mentioning that the modest industrial performance observed in 2011 refl ected the increase of foreign competitiveness, associated, on the one hand, with the appreciation of domestic currency, and, on the other, with increased labor cost. Thus, it should be noted that the quantum of imports of intermediate goods and consumer durable goods grew 6.5% and 27.1%, respectively, in 2011, while the average real wage in the industrial segment increased 4.3%, refl ecting the enhanced labor market dynamics. In this framework, the federal government, with the aim of stimulating manufacturing activities, implemented, in August, a set of measures called Greater Brazil Plan, attempting to increase investments and technological efforts1.
Services
The growth registered in the sector of services, although less accentuated than in 2010, fueled economic expansion in 2011. The FGV Service Confi dence Index (ICS), which refl ects the sector’s businessmen confi dence, registered an average level of 131.2 points in 2011, above the indifference line of 100 points, signaling positive businessmen expectations. All the same, the indicator declined 1% in the year, after expanding 16.2% in 2010. This trajectory resulted from declines of 1.2% under the component related to the Current Situation Index (ISA) and 0.9% under the Expectations Index (EI).
The Purchase Manager Index (PMI-Services), related to the business activities component, reached an average of 53 points in 2011, compared to 52.6 points in 2010, suggesting the maintenance of the sector’s dynamics.
80
81
82
83
84
85
86
Jan2010
Feb Mar Apr May Jun Jul Aug Sep Oct Nov Dec Jan2011
Feb Mar Apr May Jun Jul Aug Sep Oct Nov Dec
%
Graph 1.5Industrial capacity utilization
CNI FGVSources: CNI and FGV
1/ For more details about the Greater Brazil Plan, see Chapter IV of this report.

24 Boletim do Banco Central do Brasil – Annual Report 2011
Commerce Indicators
In 2011, retail activity indicators, refl ecting the continuity of a favorable scenario in the credit and labor markets, kept on the upward trend observed over the last years, although at a more moderate pace. Thus, according to the IBGE Monthly Trade Survey (PMC), the Sales Volume Index increased 6.6% in 2011, as compared to expansions of 12.2% in 2010, 6.8% in 2009 and 9.9% in 2008. In the restricted concept, which excludes the segments of automotive vehicles and building materials, expansion came to 6.7%, 10.9%, 5.9% and 9.1% in the years aforementioned, respectively. It should be highlighted sales expansions in the following segments during the year: computer and communication equipment and materials, 19.6%; furniture and appliances; 16.6%, pharmaceutical, medical, orthopedic, perfumery and cosmetic products; 9.7%, and construction materials, 9.1%.
The regional analysis reveals that expanded retail sales registered annual increase of 7.8% in the South region, followed by increases of 7.2% in the Southeast; 6.5% in the Central-West; 6.4% in the Northeast; and 6.1% in the North. Among the federation units, sales expanded in Tocantins, 22.2%; Espírito Santo, 15%; Paraíba, 10%; Maranhão, 9.6%; Roraima, 9.5%; and in Mato Grosso, 9.2%;, and declined in Amapá, 4.6%.
Nominal sales revenues increased 9.4% in 2011, as a result of expansion of 6.6% in the sales volume and 2.6% in prices. Apart from respective increases of 3.4% and 4.6% in the segments of stationery, computer and communication equipment, and vehicles, motorcycles, parts and spares, nominal revenue growth rates exceeded the annual infl ation rate of 6.5% as measured by the IBGE Extended National Consumer Price Index (IPCA) in the period in all surveyed segments. It is noteworthy annual expansion of nominal revenues in the segments of pharmaceutical, medical, orthopedic, perfumery and cosmetic products, 14.1%; furniture and appliances, 13.1%; building materials, 12.9%; textiles, apparel and footwear, 11.8%,; and in hypermarkets, supermarkets, food products, beverages and tobacco, 11.4%
170
180
190
200
210
Jan 2010
Feb Mar Apr May Jun Jul Aug Sep Oct Nov Dec Jan 2011
Feb Mar Apr May Jun Jul Aug Sep Oct Nov Dec
2003
= 1
00
Graph 1.6Broad Sales volume Index in the Trade Sector
Seasonally adjusted data
Source: IBGE

I The Brazilian Economy 25
Sales of the automotive sector, refl ecting the macro-prudential measures implemented in December 2010, slowed down as against the previous years. In this context, sales of cars and light commercial vehicles registered annual increase of 2.9% in 2011, according to the National Federation of Automotive Vehicle Distribution (Fenabrave), the lowest rate since 2004. Similarly, sales of national cars in the domestic market, released by the National Association of Automotive Vehicle Manufacturers (Anfavea) decreased 2.8% in 2011. It should be noted the increased participation of imported vehicles on domestic market sales, from 21.7% in December 2010, to 27% in December 2011.
According to the Brazilian Association of Supermarkets (Abras), real supermarket sales, which accounts for approximately 32% of the Monthly Retail Trade Survey (PMC), kept on the upward trend begun in 2007, expanding 3.7% in 2011, although at a more moderate pace than in the previous three years. The slowdown refl ected the increase in food prices, associated with the shock of agricultural commodities observed in the second half of 2010.
In 2011, commerce default indicators increased as compared with 2010. The average default rate in the São Paulo Metropolitan Region (RMSP), measured by the São Paulo Trade Association (ACSP) closed at 5.7% in 2011, as against 5.2% in the previous year, according to net consultations with the SPC in relation to total consultations.
The National Confi dence Index (INC), elaborated by the Ipsos Public Affairs for the ACSP, registered annual growth of 2.5% in 2011, compared to 15.6% in the previous year. Regionally, it is noteworthy the increase in consumer confi dence in the South, 10.3%, Southeast, 3.3%, and in the North/Central-West region, 0.6%, as opposed to decrease in the Northeast Region, 3.3%.
The FGV Consumer Confi dence Index grew 0.6% in the year, as a result of increase of 4.8% in the Current Situation Index (ISA) and decrease of 2.1% in the Expectations Index (IE).
80
95
110
125
140
155
Jan 2010
Feb Mar Apr May Jun Jul Aug Sep Oct Nov Dec Jan 2011
Feb Mar Apr May Jun Jul Aug Sep Oct Nov Dec
Graph 1.7Consumer Confidence Index
ICC Consumer expectations Current economic situation
Source: FGV
Sep 2005=100

26 Boletim do Banco Central do Brasil – Annual Report 2011
Agricultural output indicators
According to the IBGE Systematic Survey of Agricultural Production (LSPA), the harvest of cereals, leguminous and oilseeds registered annual increase of 7% in 2011, reaching the record of 159.9 million tons of grains. This trajectory, refl ecting expansions of 4.6% in the harvested area and 2.3% in the average yield, was partially favored by respective annual increases of 18.9% and 9.4% under the harvests of rice and soybeans. In the regional scope, it should be highlighted the respective participations of 19.7%, 19.5% and 18.5% of the states of Paraná, Mato Grosso and Rio Grande do Sul in the country’s overall production of grains.
The production of soybeans totaled 74.9 million tons in 2011, for annual expansion of 9.4%, resulting from increases of 3.3% in the harvested area and 5.9% in the average productivity, refl ecting historical productivity records registered in major producing areas, Mato Grosso, Paraná and Rio Grande do Sul. Soybeans exports grew 13.5% in the year, as compared to expansion of 1.8% observed in 2010.
The rice harvest totaled 13.4 million tons, for annual increase of 18.9%, resulting from expansion 17.2% under the average productivity and 1.4% in the harvested area. This trajectory mainly refl ected the favorable weather conditions in the Rio Grande do Sul, the major producing state.
Table 1.11 – Agricultural production – Major crops
Millions of tons
Products 2010 2011
Grain production 149.6 160.1
Cotton seed 1.8 3.1
Rice (in husk) 11.3 13.4
Beans 3.2 3.5
Corn 56.1 56.3
Soybeans 68.5 74.9
Wheat 6.0 5.7
Others 2.7 3.2
Change in grain production (%) 11.6 7.0
Other crops
Bananas 7.0 6.7
White potatoes 3.6 3.9
Cocoa (beans) 0.2 0.2
Coffee (manufactured) 2.9 2.7
Sugarcane 719.2 715.1
Tobacco (in leaf) 0.8 1.0
Oranges 19.1 19.8
Cassava 24.4 25.3
Tomatoes 3.7 4.1
Source: IBGE

I The Brazilian Economy 27
The corn harvest reached 56.3 million tons, for annual increase of 0.4%, in a scenario of respective variations of 3.4% and -2.9% under the harvested area and average productivity. This performance resulted from expansion of 3.2% in the fi rst harvest, favored by positive weather conditions, and decrease of 3.7% in the second harvest, impacted by adverse weather conditions in the state of Paraná.
The production of beans totaled 3.5 million tons, for an increase of 9.3% in the year, with emphasis on the performance of the fi rst harvest. The annual growth resulted from increases of 6.4% in the harvested area and 2.8% in the average productivity.
The production of cotton seed reached 3.1 million tons in 2011. The annual growth of 72.7% mainly refl ected the increase of 70.2% in the harvested area.
The wheat crop decreased 5.6% in the year, totaling 5.7 million tons. Average productivity declined by 3.9%, impacted by frosts and dry weather conditions observed in the South region, while the harvested area decreased by 1.9%.
The sugar cane harvest totaled 715.1 million tons. The annual decrease of 0.6% refl ected respective variations of -5.3% and 5% under the average productivity and the harvested area.
The production of coffee, due to the biannual productivity cycle, declined to 2.7 million tons, an annual decrease of 7.5%, consequent upon decreases of 2.3% in the harvested area and 5.3% in the average productivity.
Table 1.12 – Agricultural production, harvested area and average earnings – Major crops
Percentage change
Products
2010 2011 2010 2011 2010 2011
Grain production 11.6 7.0 -1.5 4.6 13.4 2.3
Cotton (seed) 0.0 72.7 1.9 70.2 -1.8 1.4
Rice (in husk) -10.3 18.9 -6.2 1.4 -4.4 17.2
Beans -9.1 9.3 -16.6 6.4 9.0 2.8
Corn 9.4 0.4 -7.1 3.4 17.8 -2.9
Soybeans 20.3 9.4 7.1 3.3 12.4 5.9
Wheat 21.6 -5.6 -10.5 -1.9 35.9 -3.9
Source: IBGE
Area Average earningsProduction

28 Boletim do Banco Central do Brasil – Annual Report 2011
Livestock
According to the IBGE Quarterly Survey of Animal Slaughters, the production of poultry, cattle and swine totaled, in the order, 11.4 million, 6.8 million and 3.4 million tons in 2011, for respective annual variations of 6.6%, -2.8% and 9.4%. Exports turned in respective annual variations of 3.2%, -13.8% and -5.9%.
Agricultural policy
The 2011/2012 agricultural and livestock plan, published in the month of June by the Ministry of Agriculture, Livestock and Supply (Mapa), made available R$122.2 billion, 7.2% up as compared to the previous plan, of which R$107.2 billion targeted to the commercial agriculture and R$15 billion to the family agriculture.
In the context of commercial agriculture, R$80.2 billion were channeled to working capital and marketing operations, representing annual increase of 6.1%, of which R$64.1 billion granted at controlled interest rates (6.75% p.y.) and R$16.1 billion at market interest rates. Resources channeled to investments totaled R$20.5 billion, up 13.9% in the year, of which R$10.5 billion granted by the BNDES and Banco do Brasil.
The Program for Sustainable Agribusiness Production (Produsa) and the Program for Commercial Planting and Recover of Forests (Propfl ora) were incorporated to the Program for Reducing Greenhouse Gas Emissions in Agriculture (Programa ABC). The resources for the Program for Modernization of Agriculture and Conservation of Natural Resources (Moderagro) reached R$3.15 billion and R$850 million, respectively.
0.6 4.7
-2.8
11.2
5.1
9.4
-2.7
7.66.6
-8
-4
0
4
8
12
16
2009 2010 2011
Graph 1.8Animal production
Cattle Swine Poultry
Per
cent
age
chan
ge
Source: IBGE

I The Brazilian Economy 29
Productivity
Industrial labor productivity, defi ned as the ratio between the index of physical production and the number of hours paid to personnel employed in the manufacturing sector, both released by the IBGE, registered stability in 2011, as compared with expansion of 6.1% in 2010 and decline of 2.2% in 2009. Productivity remained stable in the manufacturing industry, and expanded 1.3% in the mining industry. Among the sectors surveyed, the most signifi cant gains occurred in the activities of tobacco, 20.2%; paper and graphics, 10%; and timber, 10.1%, as opposed to losses observed in the sectors of textiles, 13.5%; machines and apparatuses, exclusively electrical, electronic, precision and communications equipment, 6.1%; and leather and footwear, 4.7%.
Industrial labor productivity decreased in six of the ten federation units surveyed by the IBGE, with emphasis on declines observed in Ceará, 9.4%; Bahia, 5.9%; and Pernambuco, 5.6%, as opposed to expansion in Espírito Santo, 6.4%; Paraná, 6.2%; and São Paulo, 2.1%.
In the agricultural sector, average productivity, estimated by the ratio between the production of grains and the harvested area, increased 2.3% in the year. This trajectory was consistent with respective annual growth rates of 5.6% and 29.8% under national production and imports of agricultural fertilizers. According to the Anfavea, sales of agricultural machinery on the domestic market decreased 5.1% in the year, as a result of respective declines of 27.7% and 6.8% in sales of motorized cultivators and wheeled tractors and increase of 18% in sales of harvesters.
Energy
Oil production, including liquefi ed natural gas (LNG), increased 2.6% in the year, compared to 5.3% in 2010, according to the National Petroleum Agency (ANP). The average production reached 2.193 million barrels/day (mbd), compared to 2,137 mbd in the previous year, registering a record level in December, 2,301 mbd, and the lowest level in August, 2,140 mbd. The production of natural gas increased 4.9% in 2011, reaching an average of 0,415 mbd.
Total oil processed in refi neries increased 4.3% in 2011, reaching 1,831 mbd. Imports of oil increased 2% in the year, totaling 0.355 mbd, while exports decreased 4.2%, remaining at 0,605 mbd.
In 2011, consumption of oil derivatives in the domestic market grew 6.9%, with emphasis on automotive gasoline, 18.8%; aviation kerosene, 10.8%; diesel oil, 5.2%: and aviation gasoline, 0.7%, as against declines in the consumption of fuel oil, 25.1%,

30 Boletim do Banco Central do Brasil – Annual Report 2011
and lighting kerosene, 7.1%. Alcohol consumption decreased 13.6% in the year, as a result of decline under sales of hydrated alcohol, 28.7%, and expansion under sales of anhydrous alcohol, 18.5%.
In 2011, the national consumption of electricity rose 3.3%, according to the Energy Research Company (EPE), a federal public company under the Ministry of Mines and Energy (MME). Expansions were observed in the commercial, 6.3%; residential, 4.5%; and other segments, 2.7%, including public lighting, services and public sector, and the rural sector; and industrial, 2.2%.
Electricity consumption registered annual growth in all of the fi ve geographic regions of the country, with expansions of 8.6% in the Central-West region, 5.7% in the North region, 3.8% in the South region, 2.7% in the Southeast region and 0.9% in the Northeast region.
Employment indicators
In 2011, the labor market maintained a favorable trajectory. The annual average unemployment rate, published by the IBGE Monthly Employment Survey (PME),
Table 1.13 – Apparent consumption of oil derivatives and fuel alcohol
Daily average (1,000 b/d)
Itemization 2009 2010 2011
Petroleum 1 481 1 651 1 764
Fuel oil 86 84 63
Gasoline 328 392 466
Diesel oil 763 848 892
Liquid gas 209 216 222
Other derivatives 95 109 121
Fuel alcohol 393 381 329
Anhydrous 109 122 144
Hydrated 284 259 185
Source: ANP
Table 1.14 – Electric energy consumption1/
GWh
Itemization 2009 2010 2011
Total 388 676 416 456 430 188
By sectors
Commercial 65 325 69 141 73 502
Residential 100 751 107 235 112 089
Industrial 166 163 180 779 184 685
Other 56 440 59 299 60 912
Source: EPE
1/ Self-producers not included.
I The Brazilian Economy 31
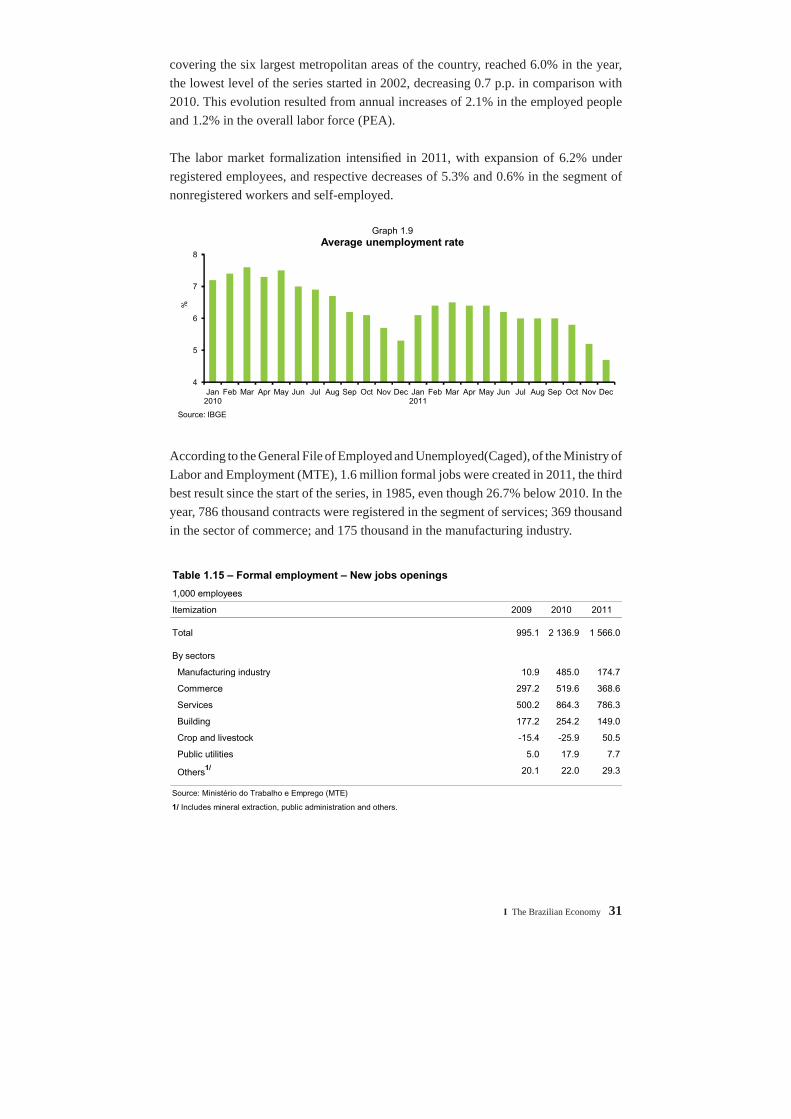
covering the six largest metropolitan areas of the country, reached 6.0% in the year, the lowest level of the series started in 2002, decreasing 0.7 p.p. in comparison with 2010. This evolution resulted from annual increases of 2.1% in the employed people and 1.2% in the overall labor force (PEA).
The labor market formalization intensifi ed in 2011, with expansion of 6.2% under registered employees, and respective decreases of 5.3% and 0.6% in the segment of nonregistered workers and self-employed.
According to the General File of Employed and Unemployed(Caged), of the Ministry of Labor and Employment (MTE), 1.6 million formal jobs were created in 2011, the third best result since the start of the series, in 1985, even though 26.7% below 2010. In the year, 786 thousand contracts were registered in the segment of services; 369 thousand in the sector of commerce; and 175 thousand in the manufacturing industry.
4
5
6
7
8
Jan2010
Feb Mar Apr May Jun Jul Aug Sep Oct Nov Dec Jan2011
Feb Mar Apr May Jun Jul Aug Sep Oct Nov Dec
Graph 1.9Average unemployment rate
%
Source: IBGE
Table 1.15 – Formal employment – New jobs openings
1,000 employees
Itemization 2009 2010 2011
Total 995.1 2 136.9 1 566.0
By sectors
Manufacturing industry 10.9 485.0 174.7
Commerce 297.2 519.6 368.6
Services 500.2 864.3 786.3
Building 177.2 254.2 149.0
Crop and livestock -15.4 -25.9 50.5
Public utilities 5.0 17.9 7.7
Others1/ 20.1 22.0 29.3
Source: Ministério do Trabalho e Emprego (MTE)
1/ Includes mineral extraction, public administration and others.
32 Boletim do Banco Central do Brasil – Annual Report 2011
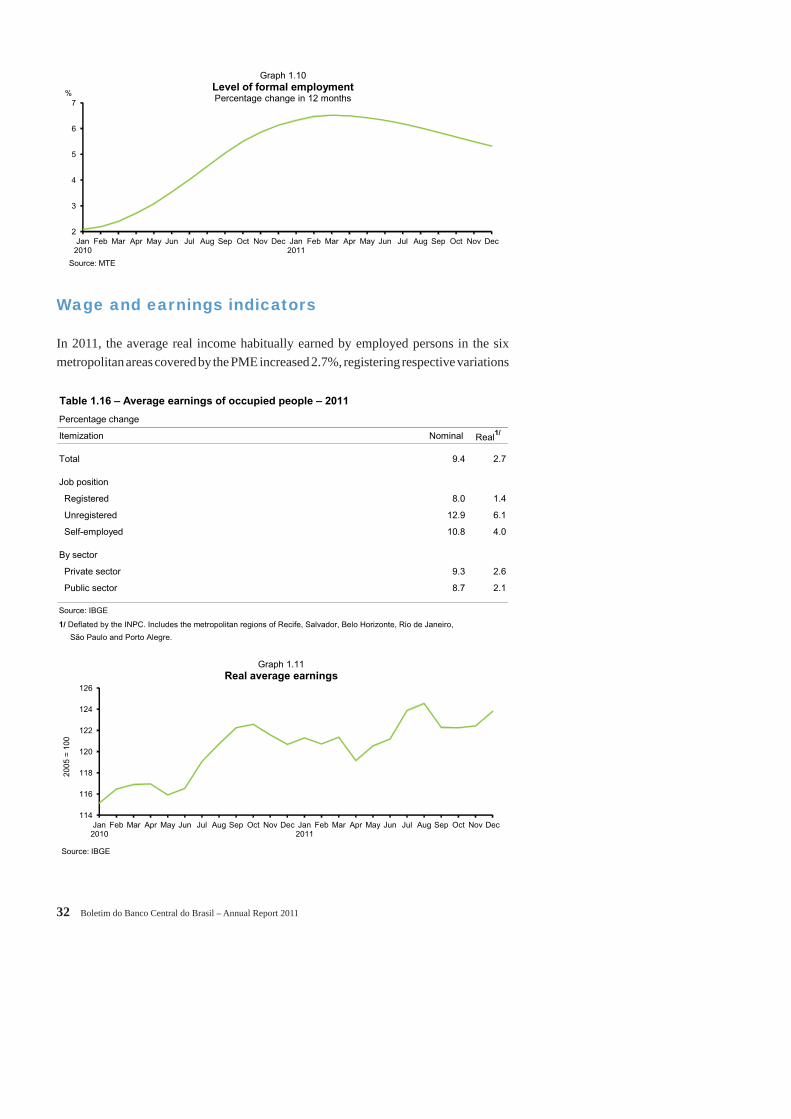
Wage and earnings indicators
In 2011, the average real income habitually earned by employed persons in the six metropolitan areas covered by the PME increased 2.7%, registering respective variations
2
3
4
5
6
7
Jan2010
Feb Mar Apr May Jun Jul Aug Sep Oct Nov Dec Jan2011
Feb Mar Apr May Jun Jul Aug Sep Oct Nov Dec
%
Graph 1.10Level of formal employmentPercentage change in 12 months
Source: MTE
Table 1.16 – Average earnings of occupied people – 2011
Percentage change
Itemization Nominal Real1/
Total 9.4 2.7
Job position
Registered 8.0 1.4
Unregistered 12.9 6.1
Self-employed 10.8 4.0
By sector
Private sector 9.3 2.6
Public sector 8.7 2.1
Source: IBGE
1/ Deflated by the INPC. Includes the metropolitan regions of Recife, Salvador, Belo Horizonte, Rio de Janeiro,
São Paulo and Porto Alegre.
114
116
118
120
122
124
126
Jan 2010
Feb Mar Apr May Jun Jul Aug Sep Oct Nov Dec Jan 2011
Feb Mar Apr May Jun Jul Aug Sep Oct Nov Dec
2005
= 1
00
Graph 1.11Real average earnings
Source: IBGE

I The Brazilian Economy 33
of 1.4% and 6.1% in the segments of registered and nonregistered workers in the private sector. Among the activity sectors, the most signifi cant gains were registered in the manufacturing industry, 5.1%; construction, 5%; and commerce, 1.7%, as against the decline of 1.8% in the sector of services. Real overall wages, the product of the average real income habitually earned by the number of employed persons, grew 4.8% in the year.
Price indicators
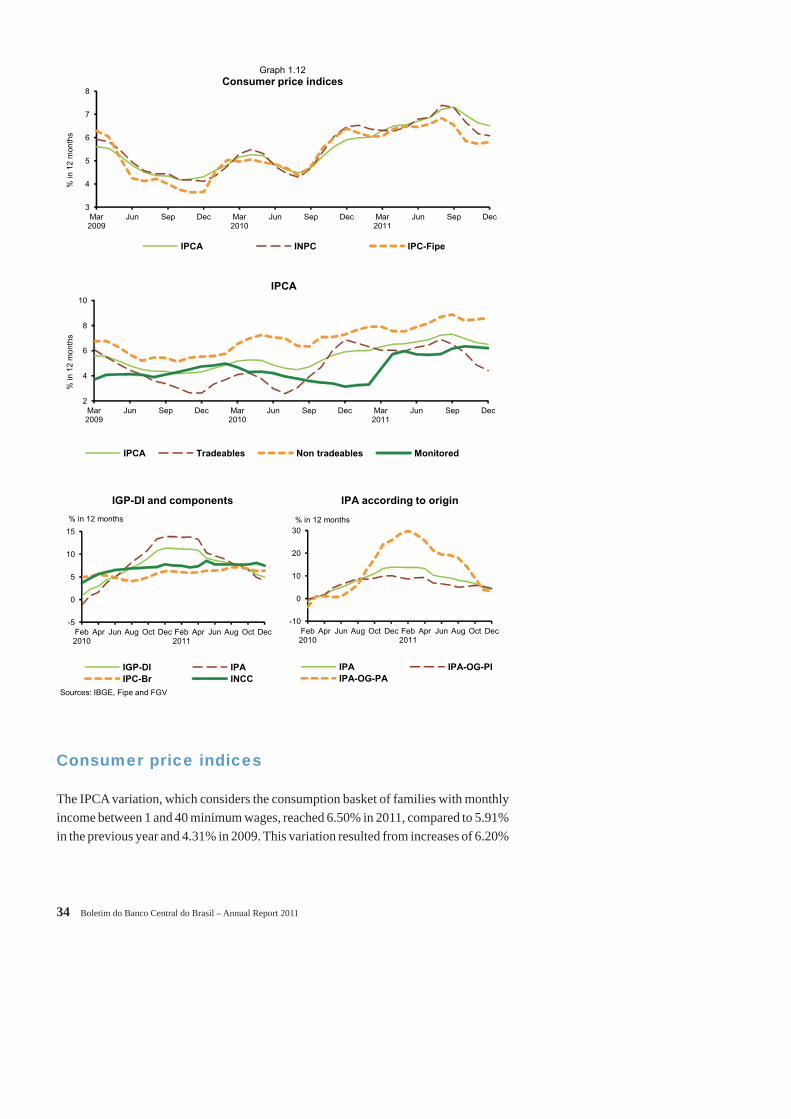
The upward trend of consumer price indices in 2011 mainly refl ected the performance of regulated prices, with emphasis on price increases in the segments of gasoline, urban buses, airline tickets and water and sewage fees. Market prices, revealing deceleration in the segments of food and domestic goods, registered less signifi cant increase in 2011. The IPCA variation calculated by the IBGE closed at 6.50%, remaining within the interval stipulated by the National Monetary Council (CMN) in the framework of the infl ation targeting system.
General price indices
The General Price Index (IGP-DI), published by the FGV, which aggregates the Extended Producer Price Index (PPI), the Consumer Price Index (CPI) and the National Cost of Construction Index (INCC), with respective weights of 60%, 30% and 10%, registered variation of 5.00% in 2011, as compared to 11.30% in the previous year.
The IPA increased 4.12% in the year, as compared to 13.85% in 2010, resulting from respective annual variations of 4.46% and 3.15% in the prices of industrial and agricultural products, which had increased 10.13% and 25.61%, respectively, in 2010. The IPC increased 6.36% and the INCC, 7.49%, compared to 6.24% and 7.77%, respectively, in 2010.
34 Boletim do Banco Central do Brasil – Annual Report 2011
Consumer price indices
The IPCA variation, which considers the consumption basket of families with monthly income between 1 and 40 minimum wages, reached 6.50% in 2011, compared to 5.91% in the previous year and 4.31% in 2009. This variation resulted from increases of 6.20%
3
4
5
6
7
8
Mar 2009
Jun Sep Dec Mar 2010
Jun Sep Dec Mar 2011
Jun Sep Dec
% in
12
mon
ths
Graph 1.12Consumer price indices
IPCA INPC IPC-Fipe
-5
0
5
10
15
Feb2010
Apr Jun Aug Oct Dec Feb2011
Apr Jun Aug Oct Dec
IGP-DI and components
IGP-DI IPA
IPC-Br INCC
% in 12 months
Sources: IBGE, Fipe and FGV
-10
0
10
20
30
Feb2010
Apr Jun Aug Oct Dec Feb2011
Apr Jun Aug Oct Dec
IPA according to origin
IPA IPA-OG-PI
IPA-OG-PA
% in 12 months
2
4
6
8
10
Mar 2009
Jun Sep Dec Mar 2010
Jun Sep Dec Mar 2011
Jun Sep Dec
% in
12
mon
ths
IPCA
IPCA Tradeables Non tradeables Monitored

I The Brazilian Economy 35
Table 1.17 – IPCA items share in 2011
Percentage change
Groups IPCA
Weight1/ Accumulated Accumulated Accumulated Index
change in change in share share2/
2010 2011 in 2011
IPCA 100.00 5.91 6.50 6.50 100.00
Meals away from home 8.23 9.82 10.47 0.86 13.25
Domestic services 3.61 11.81 11.38 0.41 6.32
Educational institutions 5.07 6.64 8.09 0.41 6.30
Rent 2.88 7.43 11.00 0.32 4.86
Recreation 3.43 5.31 5.89 0.20 3.11
Milk and dairy products 2.03 11.42 8.06 0.16 2.52
Meats 2.48 29.66 3.62 0.09 1.38
Sugar (refined and crystal) 0.59 23.38 1.06 0.01 0.10
Beans 0.33 51.55 -5.57 -0.02 ...
Used automobiles 1.10 -2.01 -3.71 -0.04 ...
TV sets and the like 0.47 -12.25 -11.26 -0.05 ...
Non-processed food 1.68 0.32 -3.75 -0.06 ...
Automobiles 2.23 -1.04 -2.87 -0.06 ...
Source: IBGE1/ Average weight in 2011.2/ It is obtained by dividing the accumulated share in the year by the accumulated change in the year.
Table 1.18 – IPCA items share in 2011
Percentage change
Groups IPCA
Weight1/ Accumulated Accumulated Accumulated Index
change in change in share share2/
2010 2011 in 2011
IPCA 100.00 5.91 6.50 6.50 100.00
Foodstuffs and beverages 23.36 10.39 7.18 1.68 25.81
Housing 13.18 4.98 6.75 0.89 13.67
Housing products 4.00 3.51 0.00 -0.00 0.00
Apparel 6.83 7.51 8.27 0.57 8.69
Transportation 18.81 2.41 6.05 1.14 17.50
Health and personal care 10.73 5.06 6.32 0.68 10.43
Personal outlays 10.44 7.37 8.61 0.90 13.82
Education 7.28 6.21 8.06 0.59 9.02
Communication 5.37 0.86 1.52 0.08 1.25
Source: IBGE
1/ Average weight in 2011.
2/ It is obtained by dividing the accumulated share in the year by the accumulated change in the year.

36 Boletim do Banco Central do Brasil – Annual Report 2011
under regulated prices of goods and services2 and 6.63% under market prices, compared to 3.13% and 7.09%, respectively, in the previous year.
The acceleration, from 3.13% to 6.20%, in the segment of regulated prices, mainly revealed the annual increases in prices of urban buses, gasoline, medicine, airline ticket and health insurance plan, while the lowest variation of market prices, from 7.09% to 6.63%, was mainly associated to the moderation in the variation of food prices, especially beef, beans, sugar, poultry and perishable food.
The variation of the National Consumer Price Index (INPC), calculated by the IBGE, increased 6.08% as compared to 6.47% in 2010. The IPC, calculated by the Institute of Economic Research Foundation (Fipe3), varied 5.81% in 2011, as compared to 6.40% in the previous year.
Regulated prices
Regulated prices increased 6.20% in 2011, accounting for 1.80 p.p. of the total IPCA variation in the year. The largest variations occurred for airline tickets, 52.91%; lotteries,
Table 1.19 – Major items included in the IPCA during 2011
Percentage change
Itemization IPCA
Weight1/ Accumulated Accumulated Accumulated
change in change in share in
2010 2011 2011
Index (A) 100.00 5.91 6.50 6.50
Non-monitored prices 71.04 7.09 6.63 4.70
Monitored prices 28.96 3.13 6.20 1.80
Selected monitored items
Urban transportation 3.89 7.53 8.45 0.33
Health care 3.48 6.87 7.54 0.26
Electric energy 3.13 3.05 3.97 0.12
Medicine 2.77 3.36 4.39 0.12
Gasoline 4.02 1.67 6.93 0.28
Interstate bus rates 1.19 4.78 5.90 0.07
Water and sewage fees 1.61 3.38 8.29 0.13
Air ticket 0.40 3.15 52.91 0.21
Source: IBGE
1/ Average weight in 2011.
2/ Regulated prices are those direct or indirectly determined by the state, municipal and federal governments. In some cases, the readjustments are established by contracts between producers/suppliers and the corresponding regulating agencies, as in the cases of electricity and telephone.
3 For families with income between one and twenty minimum wages in the city of São Paulo.

I The Brazilian Economy 37
10.66%; piped gas, 9.45%; subway, 8.76%; urban bus, 8.45%; medicines, 8.30%; water and sewage fees, 8%; health insurance plans, 7.54%; gasoline, 6.93%; intercity bus, 5.90% and electricity, 3.97%.
The variation in the item of health insurance plans, regulated by the National Supplementary Health Agency (ANS), exerted an impact of 0.26 p.p. on the annual variation of the IPCA, reaching 6.84% in Porto Alegre and 7.71% in Belo Horizonte. The urban bus fares contributed with 0.33 p.p., and the largest readjustments occurred in Curitiba, 12.80%; Goiânia, Fortaleza and São Paulo, 11.11%; Porto Alegre, 10.21%; Salvador, 8.70%. The variation of the water and sewage fees exerted an impact of 0.13 p.p., registering sharper increases in Curitiba, 15.97%, and Salvador, 13.91%.
The average readjustments of electricity tariffs, contributing with 0.12 p.p. to the annual IPCA variation, resulted from different variations in the eleven regions covered by the IPCA, varying from -1.63% in Goiânia to 9.80% in Salvador. The increases in the prices of gasoline, which varied from -0.42% in Fortaleza to 14.41% in Belo Horizonte, airline tickets and medicines contributed with 0.28 p.p., 0.21 p.p. and 0.12 p.p., respectively, for the annual IPCA variation in 2011.
Cores
Similarly to the trajectory of the headline index, the fi ve IPCA infl ation core indices calculated by the Central Bank accelerated in 2011, and only one core index registered annual variation lower than the IPCA.
Table 1.20 – Regulated prices in 2011 – Selected items
Percentage change
Itemization City bus Water and Residential Gasoline
fares sewage fees electricity
Brazil 8.44 8.30 3.97 6.92
Belém 8.11 0.00 -1.03 1.12
Belo Horizonte 6.52 10.43 4.78 14.41
Brasília 0.00 7.16 6.07 2.47
Curitiba 12.81 15.97 3.52 6.58
Fortaleza 11.11 -2.37 0.21 -0.42
Goiânia 11.11 5.93 -1.63 7.19
Porto Alegre 10.20 8.28 7.37 7.86
Recife 8.14 6.48 7.87 0.02
Rio de Janeiro 4.17 8.80 6.36 6.55
Salvador 8.70 13.91 9.80 0.45
São Paulo 11.11 6.79 1.60 8.37
Source: IBGE

38 Boletim do Banco Central do Brasil – Annual Report 2011
The smoothed trimmed average means increased 6.67% in 2011, compared to 5.63% in the previous year, while the non-smoothed trimmed average means varied 5.67%, compared to 4.88% in 2010. The double weighted core4 turned in respective variations of 6.95% and 5.62% in the years under analysis, while the variation of the core by exclusion, which excludes price changes of ten items5 of the subgroup of household food items and fuels and vehicles, reached 6.68%, compared to 5.45% in 2010. The core that excludes the prices of household food and regulated prices varied 6.96% in 2011, compared to 6.12% in the previous year.
The variation of the IPC core, calculated by the FGV by using the method of smoothed trimmed means, rose from 5.18% in 2010, to 5.51% in 2011, below the 6.36% IPC index.
Table 1.21 – Consumer prices and core inflation in 2011
Percentage change
Itemization 2010
1 H 2 H In the year
IPCA 5.91 3.87 2.54 6.50
Exclusion 5.45 4.11 2.48 6.68
Exclusion (meals at home and monitored prices) 6.12 4.16 2.69 6.96
Smoothed trimmed means 5.63 3.25 3.30 6.67
Non-smoothed trimmed means 4.88 3.16 2.43 5.67
Double-weighted 5.62 3.95 2.88 6.95
IPC-Br 6.24 3.80 2.47 6.36
Core IPC-Br 5.18 2.62 2.82 5.51
Source: IBGE and FGV
2011
4/ This core is calculated by reweighing the original weights – based on the participation of each item in the IPCA basket – by their degrees of relative volatility, thus reducing their importance to the behavior of the more volatile components.
5/ The ten items are: Tubers, roots and legumes; Cereals, leguminous and oilseeds; Greeneries and vegetables; Fruits; Meats; Fish; Sugar and derivatives; Milk and derivatives; Poultry and eggs; and Oils and fats.

II Money and Credit 39
Money and Credit
Monetary policy
The IPCA increased 6.50% in 2011, a variation consistent with the range from 2.50% to 6.50% set by the CMN for the year in the framework of the infl ation targeting system. It should be noted that infl ation remained within the range set by the CMN for the eighth consecutive year.
As previously scheduled, the Central Bank’s Monetary Policy Committee (Copom) held eight regular meetings in the year. In the fi rst fi ve meetings, after evaluating that the risks for the consolidation of a benign infl ation scenario resulted, in the external scope, from increases in commodities’ prices, and, in the domestic context, from the mismatch between the growth rates of domestic absorption and supply expansion capacity, the Copom promoted fi ve consecutive increases in the basic interest rate, totaling 175 b.p., fi xing it at 12.50% p.y. in July.
In the meetings held in August, October and November, the Copom concluded that the impact of supply shocks on infl ation during the fi rst half of the year, and the risks associated with the persistent mismatch between the supply and demand growth rates began to diminish. In this context, in which the level of installed capacity utilization declined and the global scenario deteriorated substantially, the Copom concluded that the prospective infl ation scenario was benign, thus implementing three consecutive cuts in the Selic Rate, totaling 150 b.p., which was fi xed at 11.0% p.y. in the November meeting.
Monetary aggregates
The evolution of the restricted monetary aggregates in 2011 mainly refl ected the scenario of moderate economic activity growth, while the trajectory of expanded indicators was basically associated with high infl ows of external resources observed in the year.
II

40 Boletim do Banco Central do Brasil – Annual Report 2011
The average daily balance of the restricted money supply (M1) totaled R$280.5 billion in December. The increase of 0.3% as compared to the same period of 2010 resulted from respective variations of 7.9% and -5.4% in the average balances of currency outside banks and demand deposits. Considering data defl ated by the IPCA, M1 decreased 5.8% in the year. The M1 income-velocity, defi ned as the ratio between the GDP at current value and the average aggregate balance, increased approximately 10% in the period.
12
13
14
15
16
17
18
Mar 2009
Jun Sep Dec Mar 2010
Jun Sep Dec Mar 2011
Jun Sep Dec
Graph 2.1Money supply (M1) – Income velocity1/
1/ Defined as the ratio between twelve-month accumulated GDP data current values and the average balance of the monetary aggregate.
90
94
98
102
106
110
114
118
122
Apr 2009
Jun Aug Oct Dec Feb Apr 2010
Jun Aug Oct Dec Feb Apr 2011
Jun Aug Oct Dec
R$
billi
on
Graph 2.2Currency outside banks – Seasonally adjusted at
December 2011 prices1/
1/ Deflated by the IPCA.
130
135
140
145
150
155
160
Feb Apr 2009
Jun Aug Oct Dec Feb Apr 2010
Jun Aug Oct Dec Feb Apr 2011
Jun Aug Oct Dec
R$
billi
on
Graph 2.3Demand deposits – Seasonally adjusted at
December 2011 prices1/
1/ Deflated by the IPCA.

II Money and Credit 41
The average daily balance of the monetary base totaled R$206 billion in December. It should be emphasized that 4.4% annual increase was consequent upon respective variations of 8.2% and -7.1% under the average balances of currency issued and banking reserves.
In terms of end-of-period balances, the restricted monetary base totaled R$214.2 billion in 2011, expanding R$7.4 billion in the year. The major factors underlying this monetary expansion were net redemptions of R$70.2 billion of National Treasury securities and net purchases of R$85.2 billion carried out by the Central Bank on the exchange interbank market. On the other hand, it should be highlighted the contractionary impacts associated with compulsory deposit fl ows, R$21.8 billion, and operations with the National Treasury single account, R$125.6 billion.
The expanded monetary base, including the restricted monetary basis, cash compulsory deposits and federal government securities outside the Central Bank registered in the Selic system, totaled R$2.7 trillion at the end of December. The annual increase of 12% mainly refl ected the valuation at market value of the federal securities debt on the market.
Graph 2.4
Monetary base and money supply (M1)
Average daily balances
0 20 40 60 80
100 120 140 160 180 200 220
Mar2010
Jun Sep Dec Mar2011
Jun Sep Dec
R$
billi
onMonetary base
Currency issued Banking reserves
0 30 60 90
120 150 180 210 240 270 300
Mar2010
Jun Sep Dec Mar2011
Jun Sep Dec
R$
billi
on
Money supply (M1)
Demand deposits Currency outside banks
0
5
10
15
20
25
30
-10-505
1015202530
Mar2010
Jun Sep Dec Mar2011
Jun Sep Dec
Mon
thly
% c
hang
e
Monetary base
Monthly percentage change
0
5
10
15
20
25
30
35
-10-505
1015202530
Mar2010
Jun Sep Dec Mar2011
Jun Sep Dec
Mon
thly
% c
hang
e
Money supply (M1)
Percentage change accumulated in 12
months

42 Boletim do Banco Central do Brasil – Annual Report 2011
Table 2.1 – Collection rate on mandatory reserves
PercentagePeriod Demand Time Credit Leasing Short FIF FIF FIF
deposits1/ deposits1/ Rural Other operations Companies exchange Short-term 30 days 60 days
modalities ID Resources position
Prior toReal Plan 50 - 15 15 - - - - - -
1994 Jun2/ 100 2/ - 20 20 - - - - - -
Jul " 2/ 20 " " - - - - - - Aug " 2/ " 30 30 - - - - - - Oct " 2/ 30 " " 15 - - - - - Dec 90 2/ 27 " " " - - - - -
1995 Apr " 2/ 30 " " " - - - - - May " 2/ " " " 12 - - - - - Jun " 2/ " " " 10 - - - - - Jul 83 " " " " - - 35 10 5Aug " 20 15 15 8 - - 40 5 0Sep " " " " 5 - - " " " Nov " " " " 0 - - " " "
1996 Aug 82 " " " " - - 42 " " Sep 81 " " " " - - 44 " " Oct 80 " " " " - - 46 " " Nov 79 " " " " - - 48 " " Dec 78 " " " " - - 50 " "
1997 Jan 75 " " " " - - " " " 1999 Mar " 30 " " " - - " " "
May " 25 " " " - - " " " Jul " 20 " " " - - " " " Aug " " " " " - - 0 0 " Sep " 10 " " " - - " " " Oct 65 0 " " " - - " " "
2000 Mar 55 " " " " - - " " " Jun 45 " " " " - - " " "
2001 Sep " 10 " " " - - " " " 2002 Jun " 15 " " " - - " " "
Jul " " 20 20 " - - " " " 2003 Feb 60 " " " " - - " " "
Aug 45 " " " " - - " " " 2008 May " " " " " 5 3/ - " " "
Jul " " " " " 10 3/ - " " "
Sep " " " " " 15 3/ - " " "
Oct 42 " " " " " - " " " Nov " " 15 " " " - " " "
2009 Jan " " " " " 0 4/ - " " "
Sep " 13.5 " " " " - " " " 2010 Mar " 15 " " " " - " " "
Jun 43 " 16 " " " - " " " Dec " 20 " " " " - " " "
2011 Apr " " " " " " 605/ " " "
Jun " " 17 " " " " " " "
Jul " " " " " " 606/ " " "
1/ As of August/2002, a new additional requirement on demand resources (3%), time deposits (3%) and savings deposits (5%) became effective. As of October/2002, rates for additional requirements on demand resources, time deposits and savings deposits moved to 8%, 8% and 10%, in that order. As of October/2008, rates for additional requirements on demand resources and time deposits moved to 5%. As of January/2009, the rate for add additonal requirement on time deposits moved to 4%. As of March/2010, the rates for additional requirements on demand resources and time deposits moved to 8%. As of december/2010, the rates for additional requirements on demand resources and time deposits rose to 12%.2/ During the period From June/1994 to June/1995, the rates refer to the sum of the following installments: I - requirements calculated for the base-periods starting in June 23 and 27, 1994. II - the possible addition, if observed by any chance, considering the average of each of its installments that form the amount liable to tax payments (VSR), from the calculation period under survey in relation to the respective averages of the base-periods. As of July/1995, the levy of compulsory deposits referes only to the arithmetics mean of daily balances in each calculation period.3/ It also includes 100% of the data base growth, if positive, as defined on 1.31.2008.4/ The interfinancial deposits carried by the leasing companies were included in the calculation basis for reserve requirements on time deposits.5/ On the total of the short exchange positions (daily balance) less the long positions deducted from the smaller value between US$3 billion and the Reference Worth level I. 6/ On the total of the short exchange positions ( moving average of five consecutive days) less the long positions deducted from the smaller value between US$1 billion and the Reference Worth level I.
Savings deposits1/

II Money and Credit 43
Aiming to streamline and unify the parameters for the calculation base of compulsory requirements on time deposits, short exchange position and additional requirements on deposits, the Central Bank, by means of Circular no. 3,528, dated March 23, 2011, considered the last available position of the Reference Worth Level I (PR-I)6 as the parameter to determine the deduction of values to be paid. According to the previous regulation, the 12-months PR-I average was utilized. Deduction limits for the modalities of time deposits and additional requirements on deposits were unifi ed in R$3 billion for institutions with reference worth lower than R$2 billion; in R$2 billion for those with assets between R$2 billion and R$5 billion; and in R$1 billion for those with assets between R$5 billion and R$7 billion. The institutions for which the PR-I is higher than R$7 billion are not subjected to any deduction.
The money supply according to the M2 concept grew 18.7% in the year, refl ecting expansions of 30.6% in the balance of private securities, which registered net infl ows of R$30 billion in the modality of time deposits, and 10.9% in savings deposits, with net infl ows of R$14.2 billion.
The M3 money supply increased 18.8% in the year, totaling R$3 trillion, for expansion of 18.8% under quotas of investment funds accumulating net infl ows of R$64.7 billion in the period, against R$89.4 billion in 2010. M4, corresponding to M3 plus public securities held by the nonfi nancial public, registered annual expansion of 16.8%, adding up R$3.6 trillion in December.
The quarterly projections for major monetary aggregates set by the monetary programming were strictly complied with in 2011.
6/ Base Capital (PR) is the regulatory capital measure utilized as the base for calculation in order to verify if the minimum assets required are being complied with, according to the CMN Resolution no. 3,444, dated February 28, 2007.
55
60
65
70
75
80
85
90
30
32
34
36
38
40
42
Jan2010
Feb Mar Apr May Jun Jul Aug Sep Oct Nov Dec Jan2011
Feb Mar Apr May Jun Jul Aug Sep Oct Nov Dec
M3 and M4
%
M2
%
Graph 2.5Financial Assets – as percentage of GDP1/
M2 M3 M4
1/ Refers to GDP estimate for the last 12 months up to the reference month.
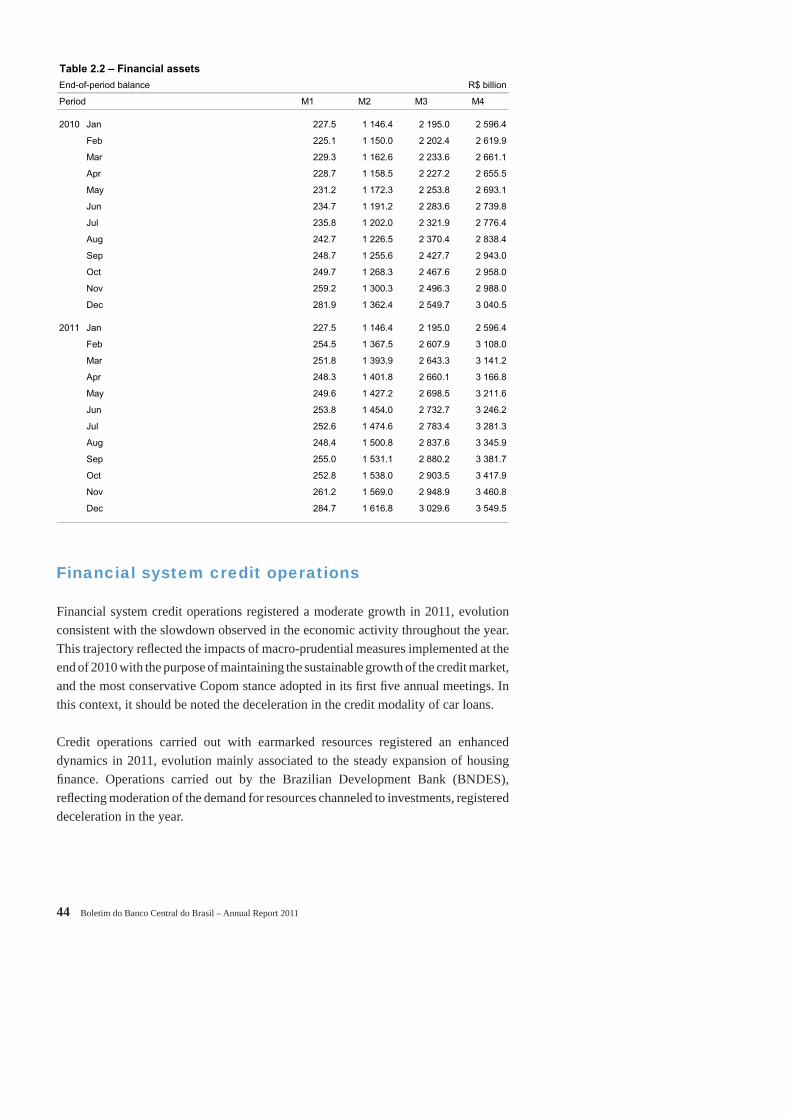
44 Boletim do Banco Central do Brasil – Annual Report 2011
Financial system credit operations
Financial system credit operations registered a moderate growth in 2011, evolution consistent with the slowdown observed in the economic activity throughout the year. This trajectory refl ected the impacts of macro-prudential measures implemented at the end of 2010 with the purpose of maintaining the sustainable growth of the credit market, and the most conservative Copom stance adopted in its fi rst fi ve annual meetings. In this context, it should be noted the deceleration in the credit modality of car loans.
Credit operations carried out with earmarked resources registered an enhanced dynamics in 2011, evolution mainly associated to the steady expansion of housing fi nance. Operations carried out by the Brazilian Development Bank (BNDES), refl ecting moderation of the demand for resources channeled to investments, registered deceleration in the year.
Table 2.2 – Financial assets
End-of-period balance R$ billion
Period M1 M2 M3 M4
2010 Jan 227.5 1 146.4 2 195.0 2 596.4
Feb 225.1 1 150.0 2 202.4 2 619.9
Mar 229.3 1 162.6 2 233.6 2 661.1
Apr 228.7 1 158.5 2 227.2 2 655.5
May 231.2 1 172.3 2 253.8 2 693.1
Jun 234.7 1 191.2 2 283.6 2 739.8
Jul 235.8 1 202.0 2 321.9 2 776.4
Aug 242.7 1 226.5 2 370.4 2 838.4
Sep 248.7 1 255.6 2 427.7 2 943.0
Oct 249.7 1 268.3 2 467.6 2 958.0
Nov 259.2 1 300.3 2 496.3 2 988.0
Dec 281.9 1 362.4 2 549.7 3 040.5
2011 Jan 227.5 1 146.4 2 195.0 2 596.4
Feb 254.5 1 367.5 2 607.9 3 108.0
Mar 251.8 1 393.9 2 643.3 3 141.2
Apr 248.3 1 401.8 2 660.1 3 166.8
May 249.6 1 427.2 2 698.5 3 211.6
Jun 253.8 1 454.0 2 732.7 3 246.2
Jul 252.6 1 474.6 2 783.4 3 281.3
Aug 248.4 1 500.8 2 837.6 3 345.9
Sep 255.0 1 531.1 2 880.2 3 381.7
Oct 252.8 1 538.0 2 903.5 3 417.9
Nov 261.2 1 569.0 2 948.9 3 460.8
Dec 284.7 1 616.8 3 029.6 3 549.5

II Money and Credit 45
The total volume of the fi nancial system credit operations, encompassing both earmarked and nonearmarked resources, totaled R$2,030 billion in December, up 19% in twelve months, against 20.6% in 2010 and 15.2% in 2009. The credit/GDP ratio closed at 49%, against 45.2% and 43.7% at the end of the periods under analysis.
The representativeness of public banks increased 1.7 p.p. in the year, to 43.5% of the total fi nancial system portfolio, mainly supported by the signifi cant expansion of housing fi nance. On the other hand, the participation of national and foreign private fi nancial institutions decreased 1.6 p.p. and 0.1 p.p., respectively, corresponding to 39.2% and 17.3% of total credit operations.
Loans channeled to the private sector totaled R$1,948 billion in December, increasing 18.9% as compared to the same period of 2010. The analysis by sector reveals that loans for the industrial segment reached R$418.1 billion, up 15.8%, with emphasis on the segments of agribusiness, energy and construction. Funds allocated to the sector of services, refl ecting the demands by the segments of transportation, steelworks and metallurgy, and consultancy activities, increased 18.7% in the period, to R$347.2 billion. Credit targeted for the trade sector increased 20.7%, totaling R$208.4 billion, with emphasis on the automotive, department stores and agribusiness segments.
4.0
21.2
8.1 7.3
10.1
32.2
17.1
4.0
20.6
9.9 6.9
10.3
31.2
17.1
0
5
10
15
20
25
30
35
40
Public sector Industry Housing Rural Commerce Individuals Other services
2010 2011
Figure 2.6Credit by borrower's economic activity – Financial system
%
Table 2.3 – Credit operations
R$ billion
Itemization 2009 2010 2011
2010 2011
Total 1 414.3 1 705.9 2 029.8 20.6 19.0
Nonearmarked 954.5 1116.1 1304.6 16.9 16.9
Earmarked 459.8 589.8 725.2 28.3 23.0
% participation:
Total/ GDP 43.7 45.2 49.0
Nonearmarked/GDP 29.5 29.6 31.5
Earmarked/GDP 14.2 15.6 17.5
% growth

46 Boletim do Banco Central do Brasil – Annual Report 2011
Housing fi nance operations, carried out with both earmarked and nonearmarked resources, channeled to the acquisition and construction of housing units, totaled R$200.5 billion, rising 44.5% in the year, as compared to expansion of 51.1% observed in 2010. The housing fi nance/GDP ratio increased 1.1 p.p. in the period, to 4.8%. Disbursements granted with funds from savings accounts totaled R$46.5 billion, an annual increase of 39.3%, corresponding to 281 thousand housing units fi nanced.
The balance of rural credit operations totaled R$141.1 billion in December. The annual increase of 13.9% refl ected respective expansions of 13.7% and 5.5% under the segments of costing and marketing, and relative stability in the balance of operations channeled to agricultural investments.
Loans targeted to the public sector added up R$81.7 billion at the end of 2011. The expansion of 20.4% observed in the year resulted from increases of 21.3% in the sphere of states and municipalities, with emphasis on disbursements targeted to urban infrastructure and electricity, and 19.7% in the federal context, with emphasis on the dynamics of the segments of oil and gas.
Nonearmarked credit operations totaled R$1,305 billion in December, up 16.9% in twelve months and corresponding to 64.3% of total fi nancial system credit operations, as compared with 65.4% at the end of 2010. Operations carried out in the segment of individuals, revealing the impact of macro-prudential measures adopted at the end of 2010, registered moderate growth in the period, increasing 16.3%, against 19.2% in 2010. It should be noted the slowdown under car loans and payroll-deducted loans, with respective growth rates of 23.5% and 15.1%, as compared with 49.1% and 28.1% in 2010.
Table 2.4 – Nonearmarked credit operations
R$ billion
Itemization 2009 2010 2011
Dec Dec Dec 2010 2011
Total 954.5 1 116.1 1 304.6 16.9 16.9
Corporations 484.7 556.1 653.5 14.7 17.5
Reference credit1/ 397.8 462.7 554.8 16.3 19.9
Domestic funding 342.9 413.9 493.2 20.7 19.2
External funding 54.9 48.9 61.6 -11.0 26.0
Leasing2/ 49.1 41.3 33.6 -15.9 -18.8
Rural2/ 4.0 3.1 3.7 -24.0 19.0
Others2/ 33.7 49.0 61.5 45.3 25.7
Individuals 469.9 560.0 651.1 19.2 16.3
Reference credit1/ 323.8 417.3 505.7 28.9 21.2
Credit unions 21.1 25.3 32.1 19.7 27.1
Leasing 63.2 45.6 27.7 -27.8 -39.3
Others 61.8 71.8 85.6 16.2 19.5
1/ Interest rate reference credit, defined according to Circular n. 2,957 dated 12.30.1999.
2/ Operations backed by domestic resources.
% growth

II Money and Credit 47
The balance of credit loans granted in the corporate segment totaled R$653.5 billion at the end of 2011, increasing 17.5% in twelve months. It should be noted the slowdown under the working capital and guaranteed account modalities, with respective expansion rates of 17.9% and 11.9%, as compared with 22.9% and 18.8% in 2010. Loans referenced in foreign currency, with emphasis on the Advance on Exchange Contracts (ACC) operations, totaled R$61.6 billion, a 26% expansion in twelve months, as against a decline of 11% in 2010. This turnaround mainly refl ected the effect of the currency depreciation observed in the period.
20
25
30
35
40
45
50
Jan2010
Feb Mar Apr May Jun Jul Aug Sep Oct Nov Dec Jan2011
Feb Mar Apr May Jun Jul Aug Sep Oct Nov Dec
% p
.y.
Graph 2.7Interest rates of credit operations with nonearmarked resources
Corporations Total
35
40
45
50
55
60
65
Jan2010
Feb Mar Apr May Jun Jul Aug Sep Oct Nov Dec Jan2011
Feb Mar Apr May Jun Jul Aug Sep Oct Nov Dec
% p
.y.
Graph 2.8Interest rates of credit operations – Individuals
0
10
20
30
40
50
Jan2010
Feb Mar Apr May Jun Jul Aug Sep Oct Nov Dec Jan2011
Feb Mar Apr May Jun Jul Aug Sep Oct Nov Dec
% p
.y.
Graph 2.9Interest rates of credit operations – Corporations
Preset rate Postset Floating

48 Boletim do Banco Central do Brasil – Annual Report 2011
The average interest rate of the reference credit operations, which had followed an upward trend up to May before declining as of the second half of the year, increased 2.1 p.p. in 2011, closing at 37.1% in December. The rate observed in the segment of individuals increased 3.2 p.p., to 43.8%, with emphasis on respective increases of 17.4 p.p. and 4.1 p.p. under the modalities of overdraft and personal credit. In the corporate segment, the average interest rate increased 0.3 p.p., to 28.2%, with emphasis on the variations under the modalities of guaranteed account, 14.8 p.p.; working capital, -2.9 p.p.; and purchase of goods, -3.5 p.p.
The banking spread referring to reference credit operations closed at 26.9 p.p. in December. The annual increase of 3.4 p.p. resulted from respective expansions of 5.2 p.p. and 0.9 p.p. under the segments of individuals and corporations, with respective spreads of 33.7 p.p. and 17.9 p.p.
Average term of reference credit operations closed at 497 days at the end of December, increasing by 21 days in the year. Average term in the segment of individuals increased by 38 days, to 600 days, highlighting respective variations of 438 days and -34 days under housing fi nance and car loans, while, in the corporate segment, average term increased by 3 days, to 402 days.
22
24
26
28
30
32
Jan2010
Feb Mar Apr May Jun Jul Aug Sep Oct Nov Dec Jan2011
Feb Mar Apr May Jun Jul Aug Sep Oct Nov Dec
% p
.y.
Graph 2.10Spread of credit operations with nonearmarked resources
0
5
10
Jan2010
Feb Mar Apr May Jun Jul Aug Sep Oct Nov Dec Jan2011
Feb Mar Apr May Jun Jul Aug Sep Oct Nov Dec
%
Graph 2.11Default rate of credit operations with nonearmarked resources1/
Total Corporations Individuals
1/ Portifolio's percentage share in arrears of more than 15 days.

II Money and Credit 49
Reference credit default rates, corresponding to delays of more than ninety days, closed at 5.5% in December 2011. The annual increase of 1 p.p. refl ected respective expansions of 1.7 p.p. and 0.4 p.p. under the segments of individuals and corporations, with respective default rates of 7.4% and 3.9%. It is noteworthy that the expansion observed in the segment of individuals was mainly associated with increased default rates under car loans, 2.5 p.p., and personal credit operations, 1.3 p.p.
The balance of earmarked credit operations totaled R$725.2 billion in December, increasing 23% in 2011. The portfolio of BNDES loans, encompassing direct operations and transfers of funds to fi nancial institutions, increased 17.3%, against 26.4% in 2010, totaling R$419.8 billion. The housing fi nance and rural portfolios totaled R$186.6 billion and R$102.8 billion, respectively, increasing 42% and 18.4% in the year, as compared with corresponding increases of 50.4% and 18.4% in the previous year.
Disbursements carried out by the BNDES totaled R$138.9 billion in 2011, declining by 17.5% as compared to 2010, period in which occurred the purchase of shares related to the capitalization of Petrobras. Similarly, loans granted for the industrial segment decreased 44.3%, as against increases in funds channeled to the segments of commerce and services, 7.2%, with signifi cant participation of the sectors of electricity and gas, telecommunications, and loans to micro, small and medium enterprises, 9%.
The volume of provisions set aside by the fi nancial system reached R$115.1 billion in December 2011, rising 21.6% in the year and accounting for 5.7% of the total credit portfolio, against 5.5% in 2010. This trajectory was consistent with the performance of default rates of total fi nancial system loans, which closed at 3.6% in December.
Table 2.5 – Earmarket credit operations
R$ billion
Itemization 2009 2010 2011
2010 2011
Total 459.8 589.8 725.2 28.3 23.0
BNDES 283.0 357.8 419.8 26.4 17.3
Direct 158.1 178.0 214.4 12.6 20.4
On lendings 124.9 179.8 205.4 43.9 14.3
Rural 78.7 86.8 102.8 10.3 18.4
Banks and agencies 74.6 81.9 96.9 9.8 18.3
Credit unions 4.1 4.9 5.9 19.1 20.4
Housing 87.4 131.4 186.6 50.4 42.0
Others 10.7 13.8 16.1 29.1 16.7
% growth

50 Boletim do Banco Central do Brasil – Annual Report 2011
National Financial System
In 2011, in spite of the scenario of greater volatility in the international fi nancial markets, the National Financial System (SFN) maintained proper conditions of liquidity, profi tability and capital levels for the coverage of risks involved in its operations. This sustainability refl ected the maintenance of suitable leverage levels and quality of assets, in addition to improved prudential regulations.
During the fi rst half of the year, the Central Bank released preliminary guides and the schedule for implementation of the Basle Banking Supervision Committee’s recommendations in Brazil related to the structure of capital and liquidity of fi nancial institutions. Such recommendations, included in the Basle III framework, resulted from discussions carried out in the scope of the Basle Committee, the Financial Stability Board (FSB) and G20 as of the outbreak of the fi nancial crisis in 2008.
In addition to prudential measures, the Central Bank, with the purpose of promoting a better management of fi nancial institutions exchange positions, established, at the beginning of 2011, the compulsory deposit on short positions. Initially, the payment was stipulated at 60% of short exchange positions value exceeding the lowest of the following values: US$3 billion or the PR-I. This requirement was reevaluated at the beginning of July, and the payment on short positions exceeding US$1 billion or the PR-I began to be required.
In the scope of the prudential regulation, Resolution no. 3,988 defi ned the compulsory implementation, up to June 30, 2013, of the capital management structure compatible
Table 2.6 – BNDES disbursements
R$ million
Itemization 2010 2011 Growth
(%)
Total 168 422.7 138 873.4 -17.5
Industry 78 768.5 43 849.4 -44.3
Food products 12 292.7 5 261.6 -57.2
Chemical 5 100.8 2 683.0 -47.4
Basic metallurgy 3 809.0 2 551.1 -33.0
Vehicle and other transport equipment1/ 10 201.2 8 202.8 -19.6
Petroleum and alcohol refining 28 712.3 4 466.5 - 84.4
Commerce/Services 79 527.9 85 265.0 7.2
Land transport 28 473.5 28 623.8 0.5
Construccion 6 650.2 7 195.2 8.2
Telecommunications 2 103.9 3 107.8 47.7
Electricity and gas 13 878.5 16 286.1 17.3
Farming 10 126.3 9 759.0 -3.6
Source: BNDES

II Money and Credit 51
with the operational nature and the complexity of products and services offered by fi nancial institutions.
The restriction for long-term credit loans with individuals, adopted in December 2010, were modifi ed by Circular no. 3,563, dated November 11, 2011, which promoted the reduction in the risk weighting factor applied to personal credit operations, car loans and car leasing operations with terms over twenty four months and below sixty months. The same measure increased capital requirements related to loans with terms longer than sixty months.

III Capital and Financial Markets 53
Capital and Financial Markets
Real interest rates and market expectations
The effective Selic rate accumulated in 2011 closed at 11.6%, while the real Selic rate, defl ated by the IPCA, closed at 4.8%. The ex-ante real interest rate, calculated on the basis of the Selic rate and the expected IPCA annual variation, according to research carried out with private sector analysts, decreased from 6.2%, at the end of 2010, to 4.2% p.y., at the end of 2011.
As for the derivatives market, in the fi rst half of 2011, the rates of swap contracts ID x 360-day fi xed-rate kept on the upward trend observed in the previous year, closing at
III
8
9
10
11
12
13
14
15
Jan Feb Mar Apr May Jun Jul Aug Sep Oct Nov Dec
% p
.y.
Graph 3.1Over/Selic rate
2010 2011
1.4
1.6
1.8
2.0
2.2
2.4
9.5
10.0
10.5
11.0
11.5
12.0
12.5
13.0
1.3 2.15 4.1 5.18 7.1 8.15 9.28 11.14 12.28
Dol
lar
(R$/
US
$)
Ove
r/S
elic
rat
e/36
0 da
ys s
wap
(% p
.y.)
Graph 3.2Over/Selic rate x dollar x 360-day swap
Selic 360-day swap Dollar

54 Boletim do Banco Central do Brasil – Annual Report 2011
12.65% p.y. in June. Throughout the second half, the rates of swap contracts, refl ecting the reduction of 125 b.p. in the Selic rate, started to decline, closing the year at 10.04% p.y., a level 199 b.p. lower as compared to the end of 2010.
Capital markets
Primary offers of shares, debentures and promissory notes registered in the Securities and Exchange Commission (CVM) totaled R$16.7 billion in 2011. The annual decrease of 90% refl ected the high comparison basis in 2010, which included the public offer worth R$120.2 billion in Petróleo Brasileiro S.A. (Petrobras) shares, and the absence of offers since September 2011, consequent upon uncertainties in the international scenario. In this context, the stock of primary issues totaled R$13.5 billion, while the public offer of debentures totaled R$3.2 billion, against R$145.2 billion and R$15.6 billion, respectively, in 2010.
The São Paulo Stock Exchange Index (Ibovespa) decreased 18.1% in 2011, totaling 56,754 points in the last session of the year, after registering its lowest level, 48,668
9.5
10.0
10.5
11.0
11.5
12.0
12.5
13.0
30 60 90 120 150 180 210 240 270 300 330 360
% p
.y.
Term in days
Graph 3.3Yield curve – ID x fixed rate swap
1st quarter 2nd quarter 3rd quarter 4th quarter
0
3
6
9
12
15
18
Dec 2006
Mar 2007
Jun Sep Dec Mar 2008
Jun Sep Dec Mar 2009
Jun Sep Dec Mar 2010
Jun Sep Dec Mar 2011
Jun Sep Dec
% p
.y.
Graph 3.4Over/Selic cumulative 12-month rate
Nominal Real (IPCA)

III Capital and Financial Markets 55
points, in August 8. Evaluated in US dollars, the Ibovespa devaluated 27.3% in the year, as compared to respective variations of -1.8% and 5.5% under Nasdaq and Dow Jones indices.
The market value of companies listed in the Bovespa decreased 10.7% in 2011, remaining at R$2.3 trillion in December, against R$2.6 trillion in the same period of
0
20
40
60
80
100
120
140
160
Stocks Debentures Commercial papers
R$
billi
on
Graph 3.5Primary issues
2008 2009 2010 2011Source: CVM
45 000
50 000
55 000
60 000
65 000
70 000
75 000
1.32011
2.7 3.16 4.20 5.27 7.4 8.8 9.13 10.19 11.25 12.30
Poi
nts
Graph 3.6Ibovespa
Source: Broadcast
65
70
75
80
85
90
95
100
105
110
115
Jan Feb Mar Apr May Jun Jul Aug Sep Oct Nov Dec
Inde
x D
ec/2
010
=100
Graph 3.7Ibovespa x Dow Jones x Nasdaq – 2011
Ibovespa (US$) Dow Jones Nasdaq
Source: Broadcast
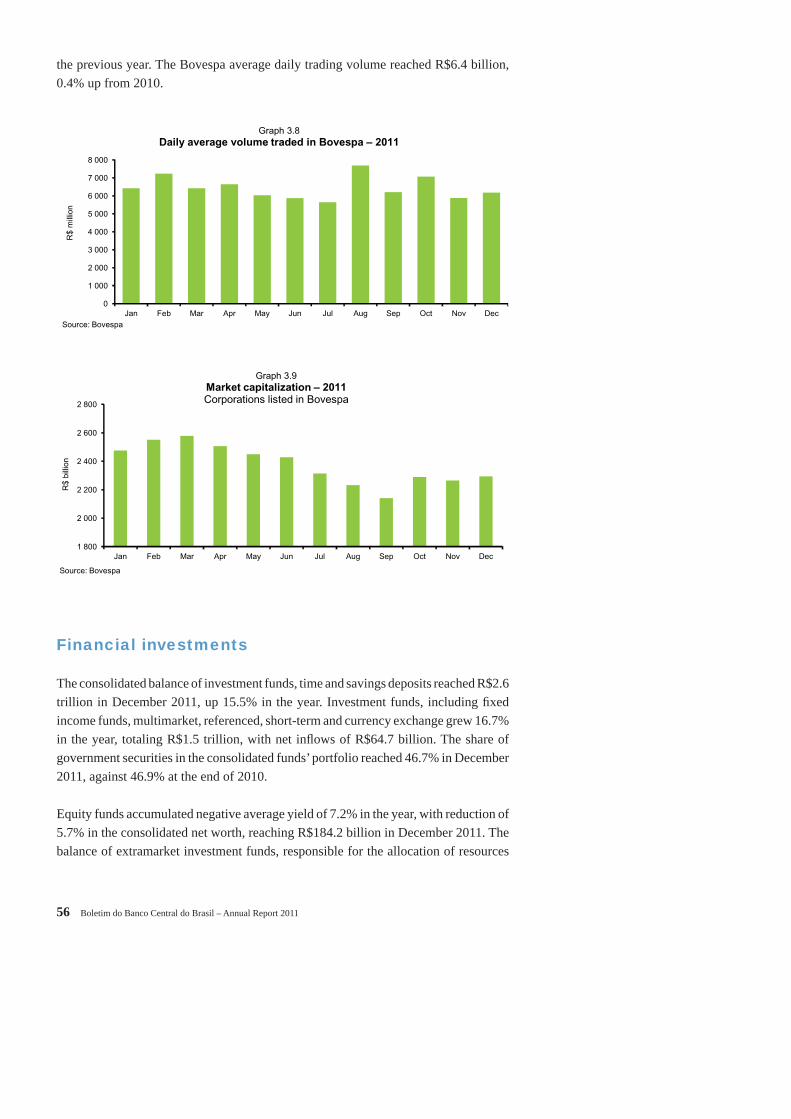
56 Boletim do Banco Central do Brasil – Annual Report 2011
the previous year. The Bovespa average daily trading volume reached R$6.4 billion, 0.4% up from 2010.
Financial investments
The consolidated balance of investment funds, time and savings deposits reached R$2.6 trillion in December 2011, up 15.5% in the year. Investment funds, including fi xed income funds, multimarket, referenced, short-term and currency exchange grew 16.7% in the year, totaling R$1.5 trillion, with net infl ows of R$64.7 billion. The share of government securities in the consolidated funds’ portfolio reached 46.7% in December 2011, against 46.9% at the end of 2010.
Equity funds accumulated negative average yield of 7.2% in the year, with reduction of 5.7% in the consolidated net worth, reaching R$184.2 billion in December 2011. The balance of extramarket investment funds, responsible for the allocation of resources
0
1 000
2 000
3 000
4 000
5 000
6 000
7 000
8 000
Jan Feb Mar Apr May Jun Jul Aug Sep Oct Nov Dec
R$
mill
ion
Graph 3.8Daily average volume traded in Bovespa – 2011
Source: Bovespa
1 800
2 000
2 200
2 400
2 600
2 800
Jan Feb Mar Apr May Jun Jul Aug Sep Oct Nov Dec
R$
billi
on
Graph 3.9Market capitalization – 2011
Corporations listed in Bovespa
Source: Bovespa
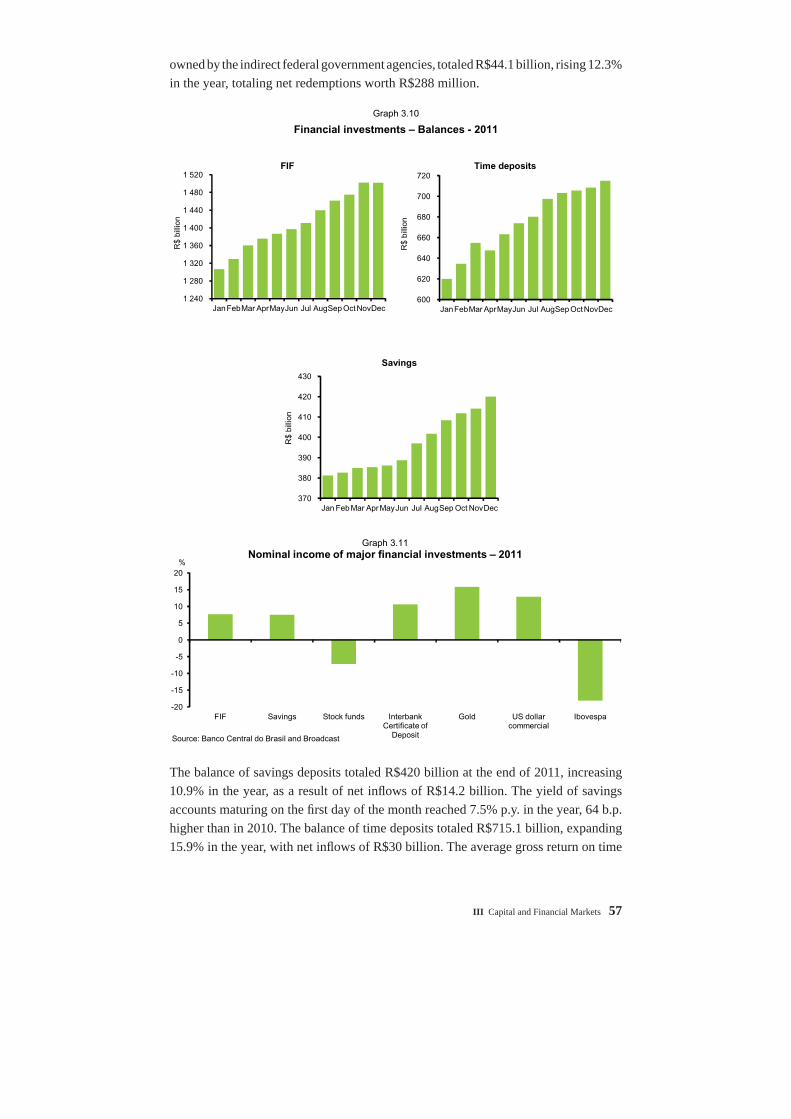
III Capital and Financial Markets 57
owned by the indirect federal government agencies, totaled R$44.1 billion, rising 12.3% in the year, totaling net redemptions worth R$288 million.
The balance of savings deposits totaled R$420 billion at the end of 2011, increasing 10.9% in the year, as a result of net infl ows of R$14.2 billion. The yield of savings accounts maturing on the fi rst day of the month reached 7.5% p.y. in the year, 64 b.p. higher than in 2010. The balance of time deposits totaled R$715.1 billion, expanding 15.9% in the year, with net infl ows of R$30 billion. The average gross return on time
Financial investments – Balances - 2011
Graph 3.10
1 240
1 280
1 320
1 360
1 400
1 440
1 480
1 520
JanFebMar AprMayJun Jul AugSep OctNovDec
FIFR
$ bi
llion
370
380
390
400
410
420
430
Jan FebMar AprMayJun Jul AugSep Oct NovDec
Savings
R$
billi
on
600
620
640
660
680
700
720
JanFebMar AprMayJun Jul AugSep OctNovDec
Time deposits
R$
billi
on
-20
-15
-10
-5
0
5
10
15
20
FIF Savings Stock funds Interbank Certificate of
Deposit
Gold US dollar commercial
Ibovespa
%
Graph 3.11Nominal income of major financial investments – 2011
Source: Banco Central do Brasil and Broadcast
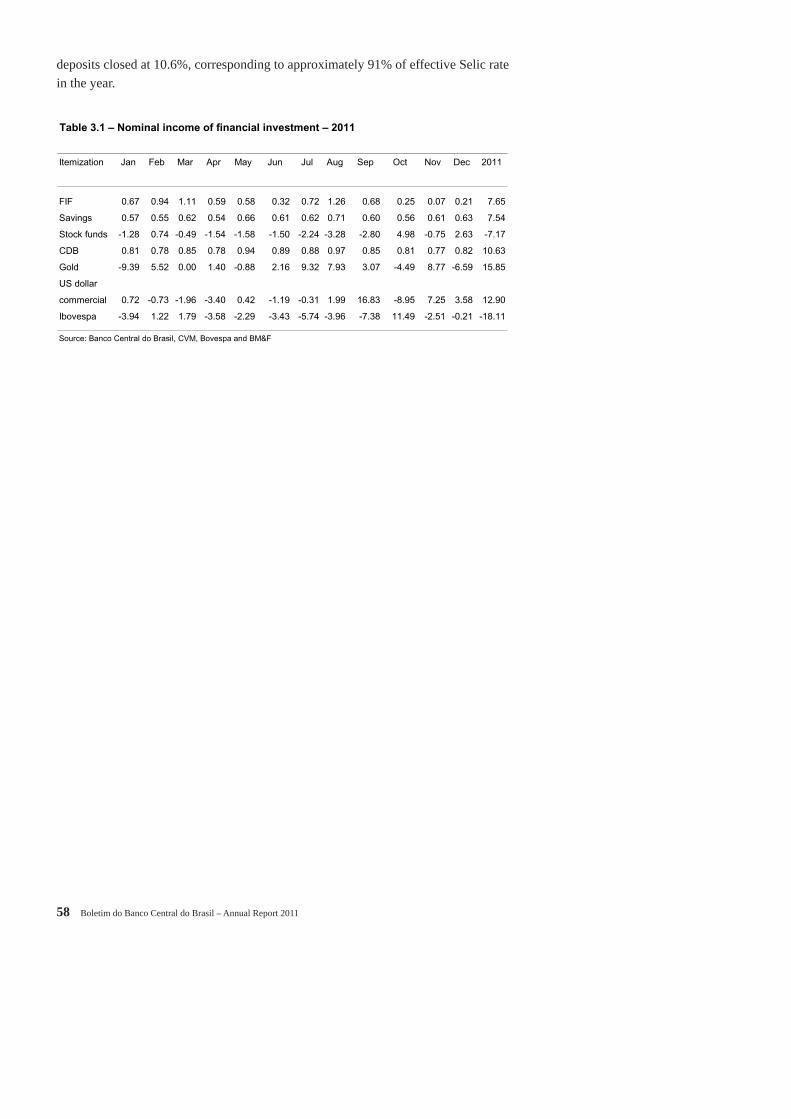
58 Boletim do Banco Central do Brasil – Annual Report 2011
deposits closed at 10.6%, corresponding to approximately 91% of effective Selic rate in the year.
Table 3.1 – Nominal income of financial investment – 2011
Itemization Jan Feb Mar Apr May Jun Jul Aug Sep Oct Nov Dec 2011
FIF 0.67 0.94 1.11 0.59 0.58 0.32 0.72 1.26 0.68 0.25 0.07 0.21 7.65
Savings 0.57 0.55 0.62 0.54 0.66 0.61 0.62 0.71 0.60 0.56 0.61 0.63 7.54
Stock funds -1.28 0.74 -0.49 -1.54 -1.58 -1.50 -2.24 -3.28 -2.80 4.98 -0.75 2.63 -7.17
CDB 0.81 0.78 0.85 0.78 0.94 0.89 0.88 0.97 0.85 0.81 0.77 0.82 10.63
Gold -9.39 5.52 0.00 1.40 -0.88 2.16 9.32 7.93 3.07 -4.49 8.77 -6.59 15.85
US dollar
commercial 0.72 -0.73 -1.96 -3.40 0.42 -1.19 -0.31 1.99 16.83 -8.95 7.25 3.58 12.90
Ibovespa -3.94 1.22 1.79 -3.58 -2.29 -3.43 -5.74 -3.96 -7.38 11.49 -2.51 -0.21 -18.11
Source: Banco Central do Brasil, CVM, Bovespa and BM&F

IV Public Finance 59
Public Finance
Tax, fi scal and budget policies
The Budget Guidelines Law of 2011 (Law no. 12,309, dated August 9, 2010) fi xed the consolidated public sector primary surplus target at R$125.5 billion, of which R$81.8 billion in the sphere of the Central Government, R$7.6 billion in the sphere of federal state companies and R$36.1 billion in the sphere of regional governments. Through the edition of Law no. 12,377, dated 12.30.2010, which excluded the Grupo Eletrobrás from the calculation of the primary defi cit, the consolidated target was reduced to R$117.9 billion, maintaining unchanged the targets for the Central Government and regional governments.
In September 2011, the release of the 4th evaluation report of Central Government primary incomes and expenditures revealed an expansion of R$25 billion in primary revenue estimates as compared to July estimates. In this scenario, the Decree no. 7.575, dated September 29, 2011, increased the Central Government and the consolidated public sector’s primary surplus target to R$91.8 billion and R$127.9 billion, respectively.
Aiming to provide Brazilian small entrepreneurs with more benefi ts and opportunities, the National Congress approved the Complementary Law no. 139, dated November 10, 2011, altering the National Statute of the Micro and Small Companies (Simples Nacional Tax Regime). Among the alterations, it should be noted:
a) Increase of 50% under the annual gross income range for classifying those companies in the special tax regime, the so-called Simples Nacional. Therefore, since January 1, 2012, legal persons with gross income equal or below R$360 thousand in the calendar year began to be classifi ed as Micro Companies; and legal persons with gross income over R$360 thousand or below R$3.6 billion will be classifi ed as Small Companies;
b) Increase from R$36 thousand to R$60 thousand under the gross income for classifying nonregistered workers as Micro Entrepreneurs (MEI). In addition, through Provisional Measure no. 529, dated April 7, 2011, the social security contribution of this category of workers was reduced from 11% to 5% of the minimum wage;
IV

60 Boletim do Banco Central do Brasil – Annual Report 2011
c) Permission for Micro and Small Companies to carry out exports with no risk of being excluded from the special regime, since exported values do not exceed the limits of the gross income required for benefi tting from the Simples Nacional tax regime. In effect, those companies may double their classifi cation range, as long as half of their sales revenue is based on external sales;
d) Streamlined the payment of all taxes and labor charges, which will be paid through the Single Social Information Declaration of the individual entrepreneur.
With the purpose of maintaining the fl exible defi nition of priorities in the budget management, the Executive Branch proposed a constitutional amendment, pleading the prorogation of the mechanism which, since 1994, allows the partial release of Federal revenues. The approval of the Constitutional Amendment no. 68, dated December 21, 2011, prorogated up to December 31, 2015 the Release of Federal Government Resources Entitlements (DRU). It should be noted that R$62.4 billion of 2012 budget expenditures with pre-established destination were converted into resources for free allocation.
Other economic policy measures
In August, the government announced a set of measures, the so-called Greater Brazil Plan (PBM), in order to favor the acceleration of productive investment and technological effort, innovation of national companies and increase the competitiveness of national goods and services. In the scope of these measures, the Special System of Tax Refund for Exporting Companies (Reintegra) was created, in order to refund values related to residual tax costs. This regime allows exporting companies of manufactured goods to calculate the value for partial or integral of the residual tax residue values. From the perspective of fi scal policy, the implementation of this Plan will involve tax reliefs estimated at R$24.5 billion in the 2011 and 2012 fi scal years. Among the measures that should reduce the tax collection, established through the edition of precautionary measures and presidential decrees, it is noteworthy:
a) Exemption, up to December 2012, of IPI on construction materials, capital goods and trucks and light commercial vehicles.
b) Reduction to zero of the employer contribution levied on the payroll of the apparel, footwear, furniture and software industries;
c) Refund of tax credits of the Social Integration Program (PIS) and the Contribution to Social Security Financing (Cofi ns) accumulated in the productive chain of the manufacturing sector. This credit corresponds to 3% of the value exported by the segment and the measure will be valid up to December 2012; and
d) Gradual reduction of the refund deadline of PIS/Cofi ns credits – from twelve months to immediate appropriation – levied on capital goods.

IV Public Finance 61
Aiming to improve the My House, My Life (Minha Casa, Minha Vida) program, the government established, through Provisional Measure no. 514, dated December 1, 2010, the target of fi nancing two million dwellings for low-income households in the period from 2011 to 2014, with investments estimated at R$125.7 billion. Out of this value, R$72.6 billion will be allocated to the concession of economic subsidies and R$53.1 billion for fi nancing.
It should also be highlighted the launching of the program Brazil without Misery, involving a set of measures comprising income transfer, access to public services in the areas of education, health, social assistance, sanitation and electricity, and productive inclusion. In the program framework, benefi ts included in the Bolsa Família Program were extended as of April 1, involving an average readjustment of 19.4% in the benefi ts’ values and increase in the number of benefi ciaries per family. By means of these changes, the value of the lowest benefi t granted by the Program increased from R$22.00 to R$32.00; and the highest, from R$200.00 to R$306.00.
The Provisional Measure no. 516, dated December 30, 2010, fi xed the value of the minimum wage at R$540.00, to be effective since January 1, 2011. On February 25, 2011, through Law no. 12,382, this value was modifi ed to R$545.00, effective since March 1. The same law provided for the rules for the minimum wage updating in the period 2012-2015, stipulating that the annual readjustment index will be composed of the 12-month cumulative INPC variation immediately before the month of readjustment plus the percentage corresponding to the GDP growth rate in the period t-2.
The benefi ts paid by the National Social Security Institute (INSS) were readjusted by 6.41%, effective since January 1, 2011. The ceiling for the values of benefi ts and contributions increased to R$3,689.66.
Public Sector Borrowing Requirements
The consolidated public sector primary surplus totaled R$128.7 billion in 2011, R$0.8 billion above the target established for the fi scal year and equivalent to 3.11% of GDP. Favorable results were observed in all the public sector spheres, reaching R$93 billion for the Central Government, R$33 billion for regional governments; and R$2.7 billion for public companies.

62 Boletim do Banco Central do Brasil – Annual Report 2011
The National Treasury gross revenues accounted for 18.3% of GDP in 2011, against 10.1% in the previous year, mainly refl ecting the impact of R$74.8 billion on the 2010 result, consequent upon the onerous assignment to Petrobras for oil exploration, with no counterpart in 2011.
Table 4.1 – Public sector borrowing requirements
Itemization
R$ million % of GDP1/ R$ million % of GDP1/
Nominal 74 460 2.8 61 927 2.0
Central government2/ 59 607 2.2 24 891 0.8
States 10 335 0.4 29 715 1.0
Local governments 2 369 0.1 5 494 0.2
State enterprises 2 150 0.1 1827 0.1
Primary -88 078 -3.3 -103 584 -3.4
Central government2/ -59 439 -2.2 -71 308 -2.4
State governments -25 998 -1.0 -25 931 -0.9
Local governments -3 936 -0.1 -4 644 -0.2
State enterprises 1 295 0.0 -1701 -0.1
Nominal interest 162 538 6.1 165 511 5.5
Central government2/ 119 046 4.5 96 199 3.2
State governments 36 333 1.4 55 646 1.8
Local governments 6 305 0.2 10 138 0.3
State enterprises 855 0.0 3528 0.1
(continues)
2007 2008
Table 4.1 – Public sector borrowing requirements (concluded)
Itemization
R$ million % of GDP1/ R$ million % of GDP1/ R$ million % of GDP1/
Nominal 106 242 3.3 93 673 2.5 107 963 2.6
Central government2/ 107 363 3.3 45 785 1.2 87 518 2.1
States -3 317 -0.1 40 442 1.1 14 008 0.3
Local governments 1 236 0.0 7 309 0.2 5 960 0.1
State enterprises 960 0.0 137 0.0 478 0.0
Primary -64 769 -2.0 -101 696 -2.7 -128 710 -3.1
Central government2/ -42 443 -1.3 -78 723 -2.1 -93 035 -2.3
State governments -17 957 -0.6 -16 961 -0.4 -29 649 -0.7
Local governments -3 045 -0.1 -3 674 -0.1 -3 314 -0.1
State enterprises -1 323 -0.0 -2 338 -0.1 -2 712 -0.1
Nominal interest 171 011 5.3 195 369 5.2 236 673 5.7
Central government2/ 149 806 4.6 124 509 3.3 180 553 4.4
State governments 14 639 0.5 57 403 1.5 43 657 1.1
Local governments 4 281 0.1 10 983 0.3 9 273 0.2
State enterprises 2 284 0.1 2 475 0.1 3 190 0.1
1/ Current prices.
2/ Federal Government, Central Bank and National Social Security Institute.
2011 2009 2010
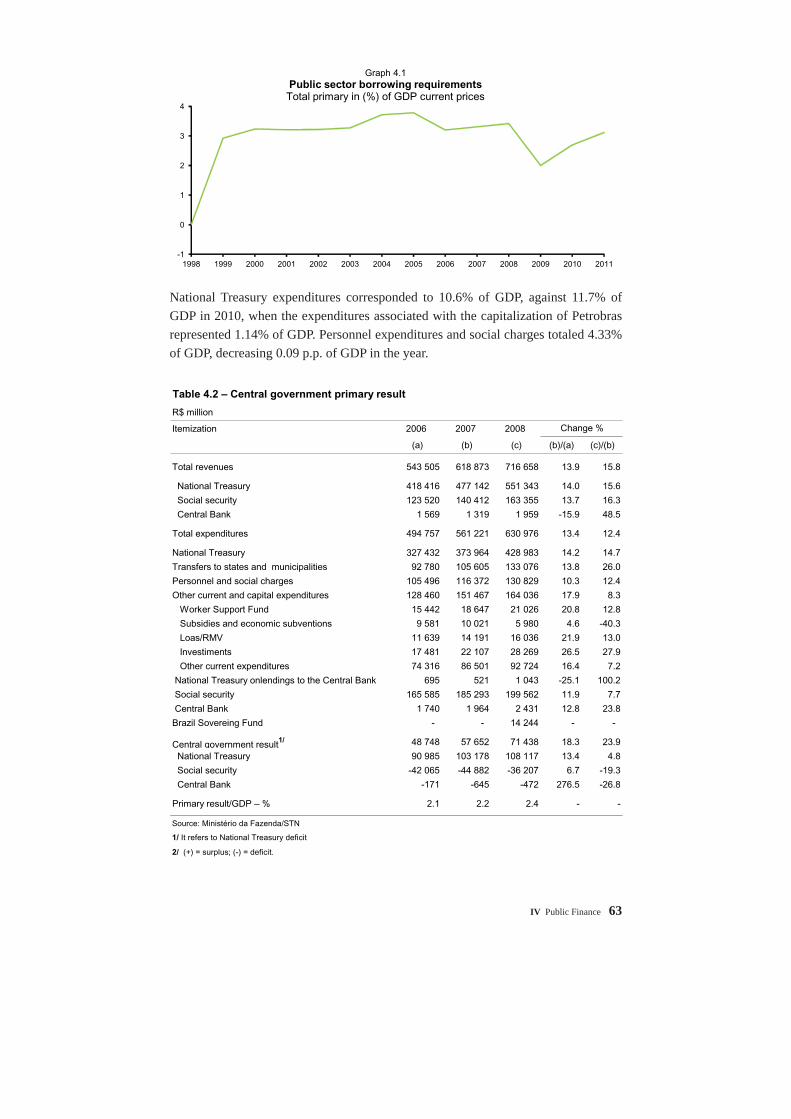
IV Public Finance 63
National Treasury expenditures corresponded to 10.6% of GDP, against 11.7% of GDP in 2010, when the expenditures associated with the capitalization of Petrobras represented 1.14% of GDP. Personnel expenditures and social charges totaled 4.33% of GDP, decreasing 0.09 p.p. of GDP in the year.
-1
0
1
2
3
4
1998 1999 2000 2001 2002 2003 2004 2005 2006 2007 2008 2009 2010 2011
Graph 4.1Public sector borrowing requirements
Total primary in (%) of GDP current prices
Table 4.2 – Central government primary result
R$ million
Itemization 2006 2007 2008
(a) (b) (c) (b)/(a) (c)/(b)
Total revenues 543 505 618 873 716 658 13.9 15.8
National Treasury 418 416 477 142 551 343 14.0 15.6
Social security 123 520 140 412 163 355 13.7 16.3
Central Bank 1 569 1 319 1 959 -15.9 48.5
Total expenditures 494 757 561 221 630 976 13.4 12.4
National Treasury 327 432 373 964 428 983 14.2 14.7
Transfers to states and municipalities 92 780 105 605 133 076 13.8 26.0
Personnel and social charges 105 496 116 372 130 829 10.3 12.4
Other current and capital expenditures 128 460 151 467 164 036 17.9 8.3
Worker Support Fund 15 442 18 647 21 026 20.8 12.8
Subsidies and economic subventions 9 581 10 021 5 980 4.6 -40.3
Loas/RMV 11 639 14 191 16 036 21.9 13.0
Investiments 17 481 22 107 28 269 26.5 27.9
Other current expenditures 74 316 86 501 92 724 16.4 7.2
National Treasury onlendings to the Central Bank 695 521 1 043 -25.1 100.2
Social security 165 585 185 293 199 562 11.9 7.7
Central Bank 1 740 1 964 2 431 12.8 23.8
Brazil Sovereing Fund - - 14 244 - -
Central government result1/ 48 748 57 652 71 438 18.3 23.9
National Treasury 90 985 103 178 108 117 13.4 4.8
Social security -42 065 -44 882 -36 207 6.7 -19.3
Central Bank -171 -645 -472 276.5 -26.8
Primary result/GDP – % 2.1 2.2 2.4 - -
Source: Ministério da Fazenda/STN
1/ It refers to National Treasury deficit
2/ (+) = surplus; (-) = deficit.
Change %

64 Boletim do Banco Central do Brasil – Annual Report 2011
Disbursements for the coverage of expenditures of the Worker Support Fund (FAT) – payment of bonus and unemployment insurance paid to private sector workers – totaled R$34.7 billion, and those for assistance benefi ts of the Social Assistance Law – Lifetime Monthly Income (Loas/RMV), R$24.9 billion, for respective annual increases of 14% and 12%. This trajectory refl ected the rise of the minimum wage, effective as of January 2011, and, in the scope of the social assistance benefi ts, the growth of 6.7% in the amount of benefi ts paid.
Investment expenditures totaled R$47.5 billion in 2011 (1.15% of GDP, registering annual decrease of 0.09 p.p. of GDP.
Table 4.3 – Gross revenue of National Treasure
R$ million
Itemization 2009 2010 2011
(b) (c) (c) (b)/(a) (c)/(b)
Total revenues 569 846 719 531 757 429 26.3 5.3
Taxes and contributions 470 684 546 285 641 552 16.1 17.4
Other revenues 99 162 173 246 115 877 74.7 -33.1
Financial compensations1/ 19 412 24 421 29 586 25.8 21.1
Dirctly collected 23 534 27 363 32 943 16.3 20.4
Federal government dividends 26 683 22 414 19 962 -16.0 -10.9
Grants 3 091 1 158 3 938 -62.5 240.1
Assignment for consideration in oil prospection - 74 808 - - -
Others 26 442 23 082 29 448 -12.7 27.6
Source: Ministério da Fazenda/STN
1/ Revenues from oil and natural gas output.
Change %
Table 4.4 – National Treasure expenditures
R$ million
Itemization 2009 2010 2011
(a) (b) (c) (b)/(a) (c)/(b)
Total expenditures 344 436 442 244 439 196 28.4 -0.7
Personnel and social charges 151 653 166 487 179 277 9.8 7.7
Current and capital 191 604 274 515 257 783 43.3 -6.1
Worker Support Fund 27 433 30 311 34 660 10.5 14.3
Economic subsidies and subventions 5 190 7 846 10 522 51.2 34.1
Social security benefits 18 946 22 234 24 905 17.4 12.0
Petrobras capitalization - 42 928 - - -
Other current and capital expenditures 140 035 171 196 187 696 22.3 9.6
Other current expenditures 105 898 124 090 140 196 17.2 13.0
Investiment 34 137 47 106 47 500 38.0 0.8
National Treasury's onlendings to Bacen 1 179 1 242 2 136 5.3 72.0
Source: Ministério da Fazenda/STN
Change %
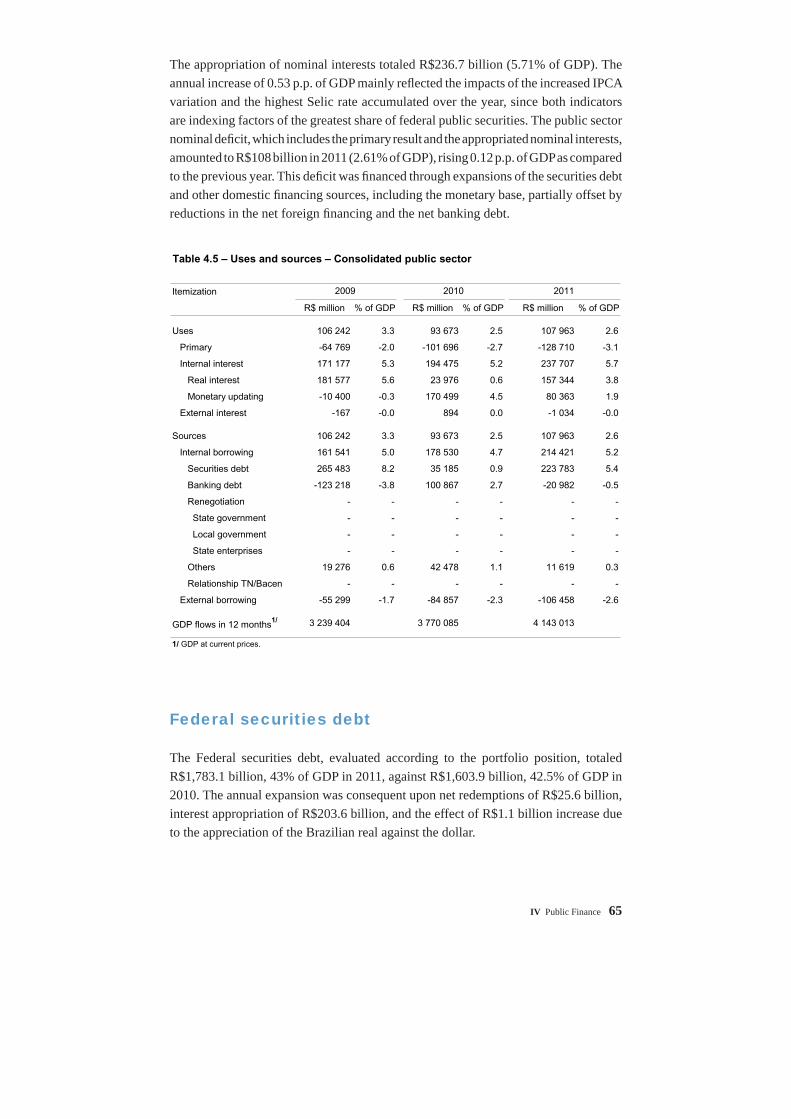
IV Public Finance 65
The appropriation of nominal interests totaled R$236.7 billion (5.71% of GDP). The annual increase of 0.53 p.p. of GDP mainly refl ected the impacts of the increased IPCA variation and the highest Selic rate accumulated over the year, since both indicators are indexing factors of the greatest share of federal public securities. The public sector nominal defi cit, which includes the primary result and the appropriated nominal interests, amounted to R$108 billion in 2011 (2.61% of GDP), rising 0.12 p.p. of GDP as compared to the previous year. This defi cit was fi nanced through expansions of the securities debt and other domestic fi nancing sources, including the monetary base, partially offset by reductions in the net foreign fi nancing and the net banking debt.
Federal securities debt
The Federal securities debt, evaluated according to the portfolio position, totaled R$1,783.1 billion, 43% of GDP in 2011, against R$1,603.9 billion, 42.5% of GDP in 2010. The annual expansion was consequent upon net redemptions of R$25.6 billion, interest appropriation of R$203.6 billion, and the effect of R$1.1 billion increase due to the appreciation of the Brazilian real against the dollar.
Table 4.5 – Uses and sources – Consolidated public sector
Itemization
R$ million % of GDP R$ million % of GDP R$ million % of GDP
Uses 106 242 3.3 93 673 2.5 107 963 2.6
Primary -64 769 -2.0 -101 696 -2.7 -128 710 -3.1
Internal interest 171 177 5.3 194 475 5.2 237 707 5.7
Real interest 181 577 5.6 23 976 0.6 157 344 3.8
Monetary updating -10 400 -0.3 170 499 4.5 80 363 1.9
External interest -167 -0.0 894 0.0 -1 034 -0.0
Sources 106 242 3.3 93 673 2.5 107 963 2.6
Internal borrowing 161 541 5.0 178 530 4.7 214 421 5.2
Securities debt 265 483 8.2 35 185 0.9 223 783 5.4
Banking debt -123 218 -3.8 100 867 2.7 -20 982 -0.5
Renegotiation - - - - - -
State government - - - - - -
Local government - - - - - -
State enterprises - - - - - -
Others 19 276 0.6 42 478 1.1 11 619 0.3
Relationship TN/Bacen - - - - - -
External borrowing -55 299 -1.7 -84 857 -2.3 -106 458 -2.6
GDP flows in 12 months1/ 3 239 404 3 770 085 4 143 013
1/ GDP at current prices.
2009 2010 2011

66 Boletim do Banco Central do Brasil – Annual Report 2011
National Treasury securities totaled R$2,534.9 billion in December 2011, of which R$751.8 billion on the Central Bank’s portfolio and R$1,783.1 billion on the market.
The participation of fi xed-rate securities and infl ation-indexed securities on the total securities debt increased, respectively, from 37.9% and 28.1%, in 2010, to 38.3% and 29.6%, in 2011, while the participation of securities indexed to the Selic rate decreased from 32.5% to 30.8%. The participation of exchange-indexed securities and TR-indexed securities remained stable at 0.6% and 0.8% in the period.
Primary National Treasury operations with federal public securities registered net redemptions of R$75.2 billion, consequent upon settlements of R$494 billion and placements of R$418.8 billion. Swap operations, carried out with the purpose of lengthening the debt maturity, totaled R$53.2 billion, with anticipated redemptions worth R$3.2 billion.
Table 4.6 – Federal securities – Portfolio position
Balances in R$ million
Itemization 2006 2007 2008 2009 2010 2011
National Treasury liabilities 1 390 694 1 583 871 1 759 134 2 036 231 2 307 143 2 534 898
Central Bank portfolio 297 198 359 001 494 311 637 815 703 203 751 837
LTN 164 989 158 748 131 149 132 191 112 341 148 877
LFT 72 737 78 955 187 346 242 856 271 074 226 960
NTN 59 472 121 298 175 817 262 768 319 788 376 000
Securitized credits 0 0 0 0 0 0
Outside the Central Bank 1 093 495 1 224 871 1 264 823 1 398 415 1 603 940 1 783 061
LTN 346 984 325 149 239 143 247 270 354 731 402 376
LFT 412 034 409 024 453 131 500 224 521 705 548 664
BTN 39 27 30 18 13 10
NTN 296 598 451 132 538 380 621 479 701 128 805 849
CTN/CFT-A/CFT-B/CFT-C/CFT-D/
CFT-E 14 532 13 903 14 306 12 851 13 141 12 435
Securitized credits 17 793 20 777 15 089 12 058 9 096 9 719
Agrarian debt 1 302 0 0 0 0 0
TDA 4 213 4 859 4 743 4 516 4 125 4 008
CDP 0 0 0 0 0 0
Central Bank liabilities 0 0 0 0 0 0
LBC - - - - - -
BBC/BBCA - - - - - -
NBCE - - - - - -
NBCF - - - - - -
NBCA - - - - - -
Outside the Central Bank – Total 1 093 495 1 224 871 1 264 823 1 398 415 1 603 940 1 783 061
In % of GDP 46.1 46.0 41.7 43.2 42.5 47.3

IV Public Finance 67
The daily average balance of repo operations closed at R$340.8 billion in December, expanding 4.6% as compared to the same period in 2010. Revealing the increase in average terms, the representativeness of operations with average terms from two weeks
0
20
40
60
80
100
2000 2001 2002 2003 2004 2005 2006 2007 2008 2009 2010 2011
Graph 4.2Federal public securities
Participation by indexing factor
Others Preset Over/Selic Price Indices Foreign exchange
0
5
10
15
20
25
30
35
40
2002 2003 2004 2005 2006 2007 2008 2009 2010 2011
Graph 4.3Federal securitized debt structure
Share – Portfolio position
Foreign exchange Preset
Table 4.7 – Federal public securities
Percentage share by indexator – Portfolio position
Index numbers 2005 2006 2007 2008 2009 2010 2011
Total – R$ million 979 662 1 093 495 1 224 871 1 264 823 1 398 415 1 603 940 1 783 061
Foreign exchange 2.7 1.3 0.9 1.1 0.7 0.6 0.6
Reference Rate (TR) 2.1 2.2 2.1 1.6 1.2 0.8 0.8
IGP-M 7.0 6.4 5.8 5.1 4.6 4.5 4.0
Over/Selic 51.8 37.8 33.4 35.8 35.8 32.5 30.8
Preset 27.9 36.1 37.3 32.2 33.7 37.9 38.3
Long-term Interest Rate (TJLP) 0.0 0.0 0.0 0.0 0.0 0.0 0.0
IGP-DI 1.1 0.9 0.7 0.6 0.4 0.3 0.2
INPC 0.0 0.0 0.0 0.0 0.0 0.0 0.0
IPCA 7.4 15.3 19.8 23.6 23.6 23.3 25.4
Others 0.0 0.0 0.0 0.0 0.0 0.0 0.0
Total 100.0 100.0 100.0 100.0 100.0 100.0 100.0
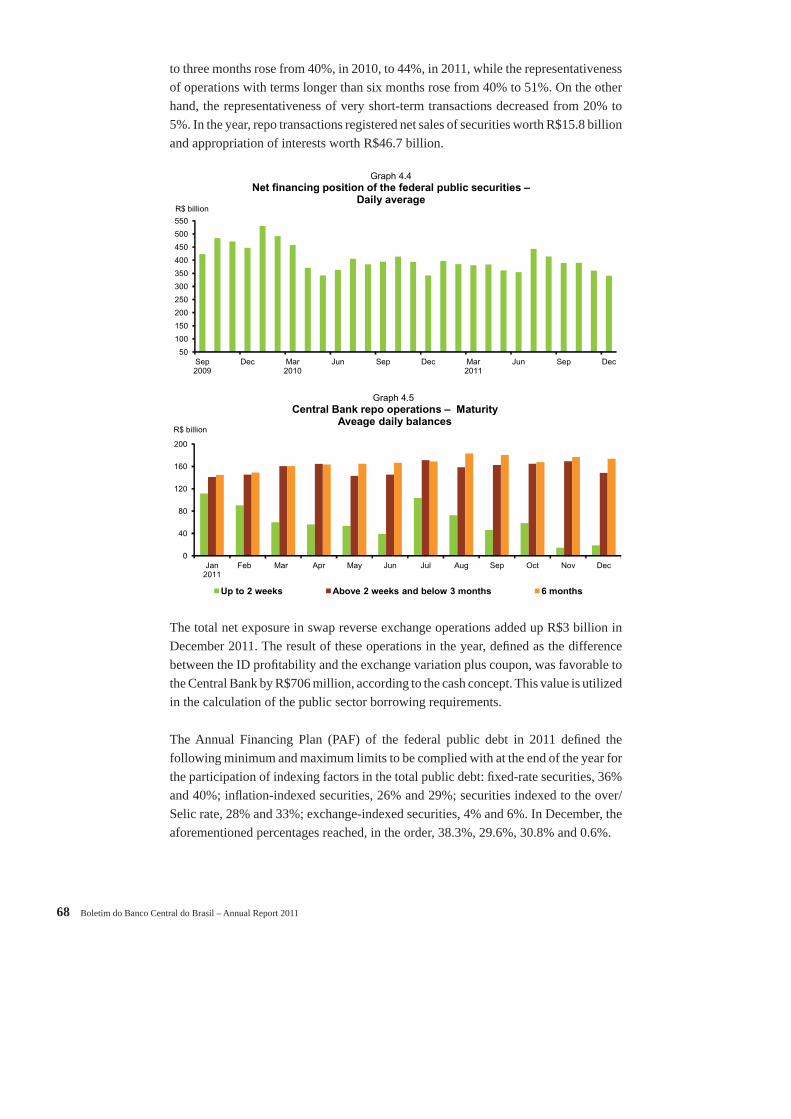
68 Boletim do Banco Central do Brasil – Annual Report 2011
to three months rose from 40%, in 2010, to 44%, in 2011, while the representativeness of operations with terms longer than six months rose from 40% to 51%. On the other hand, the representativeness of very short-term transactions decreased from 20% to 5%. In the year, repo transactions registered net sales of securities worth R$15.8 billion and appropriation of interests worth R$46.7 billion.
The total net exposure in swap reverse exchange operations added up R$3 billion in December 2011. The result of these operations in the year, defi ned as the difference between the ID profi tability and the exchange variation plus coupon, was favorable to the Central Bank by R$706 million, according to the cash concept. This value is utilized in the calculation of the public sector borrowing requirements.
The Annual Financing Plan (PAF) of the federal public debt in 2011 defi ned the following minimum and maximum limits to be complied with at the end of the year for the participation of indexing factors in the total public debt: fi xed-rate securities, 36% and 40%; infl ation-indexed securities, 26% and 29%; securities indexed to the over/Selic rate, 28% and 33%; exchange-indexed securities, 4% and 6%. In December, the aforementioned percentages reached, in the order, 38.3%, 29.6%, 30.8% and 0.6%.
50
100
150
200
250
300
350
400
450
500
550
Sep2009
Dec Mar2010
Jun Sep Dec Mar2011
Jun Sep Dec
R$ billion
Graph 4.4 Net financing position of the federal public securities –
Daily average
0
40
80
120
160
200
Jan2011
Feb Mar Apr May Jun Jul Aug Sep Oct Nov Dec
R$ billion
Up to 2 weeks Above 2 weeks and below 3 months 6 months
Graph 4.5 Central Bank repo operations – Maturity
Aveage daily balances
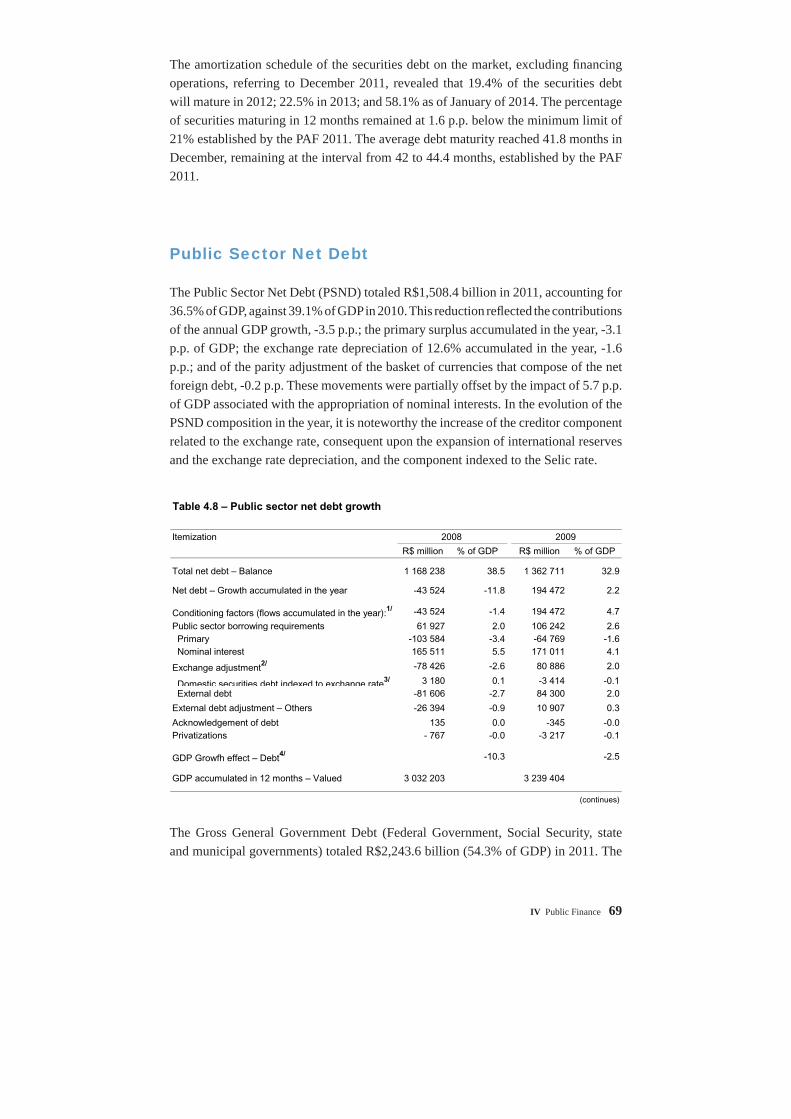
IV Public Finance 69
The amortization schedule of the securities debt on the market, excluding fi nancing operations, referring to December 2011, revealed that 19.4% of the securities debt will mature in 2012; 22.5% in 2013; and 58.1% as of January of 2014. The percentage of securities maturing in 12 months remained at 1.6 p.p. below the minimum limit of 21% established by the PAF 2011. The average debt maturity reached 41.8 months in December, remaining at the interval from 42 to 44.4 months, established by the PAF 2011.
Public Sector Net Debt
The Public Sector Net Debt (PSND) totaled R$1,508.4 billion in 2011, accounting for 36.5% of GDP, against 39.1% of GDP in 2010. This reduction refl ected the contributions of the annual GDP growth, -3.5 p.p.; the primary surplus accumulated in the year, -3.1 p.p. of GDP; the exchange rate depreciation of 12.6% accumulated in the year, -1.6 p.p.; and of the parity adjustment of the basket of currencies that compose of the net foreign debt, -0.2 p.p. These movements were partially offset by the impact of 5.7 p.p. of GDP associated with the appropriation of nominal interests. In the evolution of the PSND composition in the year, it is noteworthy the increase of the creditor component related to the exchange rate, consequent upon the expansion of international reserves and the exchange rate depreciation, and the component indexed to the Selic rate.
The Gross General Government Debt (Federal Government, Social Security, state and municipal governments) totaled R$2,243.6 billion (54.3% of GDP) in 2011. The
Table 4.8 – Public sector net debt growth
Itemization 2008 2009
R$ million % of GDP R$ million % of GDP
Total net debt – Balance 1 168 238 38.5 1 362 711 32.9
Net debt – Growth accumulated in the year -43 524 -11.8 194 472 2.2
Conditioning factors (flows accumulated in the year):1/ -43 524 -1.4 194 472 4.7
Public sector borrowing requirements 61 927 2.0 106 242 2.6 Primary -103 584 -3.4 -64 769 -1.6 Nominal interest 165 511 5.5 171 011 4.1
Exchange adjustment2/ -78 426 -2.6 80 886 2.0
Domestic securities debt indexed to exchange rate3/ 3 180 0.1 -3 414 -0.1 External debt -81 606 -2.7 84 300 2.0
External debt adjustment – Others -26 394 -0.9 10 907 0.3
Acknowledgement of debt 135 0.0 -345 -0.0Privatizations - 767 -0.0 -3 217 -0.1
GDP Growfh effect – Debt4/ -10.3 -2.5
GDP accumulated in 12 months – Valued 3 032 203 3 239 404
(continues)

70 Boletim do Banco Central do Brasil – Annual Report 2011
annual expansion of 0.9 p.p. of GDP mainly resulted from the incorporation of nominal interests and the exchange rate depreciation registered in the period.
Table 4.8 – Public sector net debt growth (concluded)
Itemization 2010 2011
R$ million % of GDP R$ million % of GDP
Total net debt – Balance 1 475 820 39.1 1 508 547 36.4
Net debt – Growth accumulated in the year 113 109 -1.6 32 727 -2.7
Conditioning factors (flows accumulated in the year):1/ 113 109 3.0 32 727 0.8
Public sector borrowing requirements 93 673 2.5 107 963 2.6 Primary -101 696 -2.7 -128 710 -3.1 Nominal interest 195 369 5.2 236 673 5.7
Exchange adjustment2/ 17 677 0.5 -66 626 -1.6
Domestic securities debt indexed to exchange rate3/ 1 513 0.0 -3 405 -0.1 External debt 16 163 0.4 -63 221 -1.5
External debt adjustment – Others 1 533 0.0 -9 097 -0.2
Acknowledgement of debt 2969 0.1 487 0.0Privatizations -2742 -0.1 0 0.0
GDP Growth effect – Debt4/ -4.6 -3.5
GDP in R$ million 3 770 085 4 143 013
1/ Net accumulated debt growth as percentage of GDP when considering all factors taken together GDP, divided by
the current GDP accumulated in the last 12 month period valuated, calculated by the formula:
(∑CondictioningFactors/GDPAccumulatedIn12Months)*100. Not reflecting debt growth as percentage of GDP.
2/ Indicates the sum of the monthly impacts up to the reference month.
3/ Includes adjustment of rate between the basket of currencies composing international reserves and the external debt
as well as other adjustments in the external area.
4/ It takes into account the change in the ratio debt/GDP due to growth observed in GDP, calculated by the formula:
Dt-1/(PIB present month/PIB base month)-Dt-1.

IV Public Finance 71
Table 4.9 – Public sector net debt
Itemization 2009 2010 2011
R$ million % of GDP R$ million % of GDP R$ million % of GDP
Fiscal net debt (G=E-F) 1 130 595 34.9 1 224 268 32.5 1 332 231 32.2
Internal debt methodological
adjustment (F) 116 583 3.6 118 096 3.1 114 691 2.8
Fiscal net debt with exchange
devaluation (E=A-B-C-D) 1 247 178 38.5 1 342 365 35.6 1 446 922 34.9
External debt methodological
adjustment (D) 79 727 2.5 97 424 2.6 25 106 0.6
Asset adjustment (C) 108 539 3.4 111 508 3.0 111 995 2.7
Privatization adjustment (B) -72 734 -2.2 -75 476 -2.0 -75 476 -1.8
Total net debt (A) 1 362 711 42.1 1 475 820 39.1 1 508 547 36.4
Federal government 971 724 30.0 1 044 518 27.7 1 061 809 25.6
Banco Central do Brasil -39 189 -1.2 -43 401 -1.2 -52 617 -1.3
State governments 350 339 10.8 387 503 10.3 404 621 9.8
Local governments 56 066 1.7 63 264 1.7 69 724 1.7
State enterprises 23 771 0.7 23 937 0.6 25 010 0.6
Internal net debt 1 655 242 51.1 1 835 512 48.7 2 047 015 49.4
Federal government 876 731 27.1 957 322 25.4 982 292 23.7
Banco Central do Brasil 368 999 11.4 430 187 11.4 599 046 14.5
State governments 335 899 10.4 368 599 9.8 380 897 9.2
Local governments 54 059 1.7 60 274 1.6 65 123 1.6
State enterprises 19 554 0.6 19 131 0.5 19 656 0.5
Foreign net debt -292 532 -9.0 -359 692 -9.5 -538 468 -13.0
Federal government 94 993 2.9 87 196 2.3 79 516 1.9
Banco Central do Brasil -408 188 -12.6 -473 588 -12.6 -651 663 -15.7
State governments 14 440 0.4 18 904 0.5 23 724 0.6
Local governments 2 007 0.1 2 989 0.1 4 601 0.1
State enterprises 4 217 0.1 4 806 0.1 5 353 0.1
GDP in R$ million 3 239 404 3 770 085 4 143 013

72 Boletim do Banco Central do Brasil – Annual Report 2011
Table 4.10 – Gross and net government debt1/
Itemization
R$ million % of GDP R$ million % of GDP R$ million % of GDP
Public sector net debt
(A=B+K+L) 1 362 711 42.1 1 475 820 39.1 1 508 547 36.4
General government net debt
(B=C+F+I+J) 1 378 129 42.5 1 495 285 39.7 1 536 154 37.1
General government gross debt
(C=D+E) 1 973 424 60.9 2 011 522 53.4 2 243 604 54.2
Internal debt (D) 1 861 984 57.5 1 904 779 50.5 2 137 910 51.6
Foreign debt (E) 111 440 3.4 109 397 2.9 108 385 2.6
Federal government 94 993 2.9 87 503 2.3 80 059 1.9
State government 14 440 0.4 18 904 0.5 23 724 0.6
Local government 2 007 0.1 2 989 0.1 4 601 0.1
General government assets (F=G+H) -830 612 -25.6 -979 408 -26.0 -1128 444 -27.2
Domestic assets (G) -830 612 -25.6 -979 100 -26.0 -1127 901 -27.2
General government available assets -445 177 -13.7 -451 320 -12.0 -529 644 -12.8
Social security system investments - 58 -0.0 -1579 -0.0 -642 -0.0
Tax collected (not transferred) -1 767 -0.1 -2 035 -0.1 -1 940 -0.0
Demand deposits -7 746 -0.2 -7 517 -0.2 -8 349 -0.2
Federal government available assets
in Bacen -406 354 -12.5 -404 516 -10.7 -475 622 -11.5
Investment in the banking system
(states) -29 252 -0.9 -35 673 -0.9 -43 091 -1.0
Credits with official financial institutions -144 787 -4.5 -256 602 -6.8 -319 147 -7.7
Hybrid capital and debt instruments -15 550 -0.5 -19 879 -0.5 -16 922 -0.4
Credits with BNDES -129 237 -4.0 -236 723 -6.3 -302 225 -7.3
Investment in funds -73 851 -2.3 -95 910 -2.5 -99 658 -2.4
Credits with public enterprises -16 518 -0.5 -15 274 -0.4 -11 824 -0.3
Other federal government's credits -10 249 -0.3 -13 634 -0.4 -10 119 -0.2
Worker assistance fund (FAT) -140 030 -4.3 -146 360 -3.9 -157 509 -3.8
Foreign credits (H) 0 0.0 -307 -0.0 -543 -0.0
Federal government 0 0.0 -307 -0.0 -543 -0.0
State government - - - - - -
Local government - - - - - -
Bacen available portfolio (I) 183 105 5.7 414 537 11.0 409 959 9.9
Exchange Equalization (J) 52 212 1.6 48 634 1.3 11 035 0.3
Banco Central net debt (K) -39 189 -1.2 -43 401 -1.2 -52 617 -1.3
Public enterprises net debt (L) 23 771 0.7 23 937 0.6 25 010 0.6
GDP in R$ million 3 239 404 3 770 085 4 143 013
1/ Includes federal, state and local government debt, with other economic agents, including the Banco Central.
2010 2009 2011

IV Public Finance 73
Collection of federal taxes and contributions
The collection of taxes and federal contributions, including the General Social Security System (RGPS), totaled R$969.9 billion in 2011, 17.4% up from the previous year.
This trajectory, in a scenario of overall wages expansion, mainly refl ected the impact of the payments of R$15.9 billion referring to installments of outstanding debts; of the real growth of 32.8% in the collection of the Income Tax on Capital Earnings, which increased from R$24.2 billion to R$34.3 billion; of the payment of R$5.8 billion of the Social Contribution on Net Corporate Profi ts (CSLL), in view of the legal settlements; and the increase of 25.45% in the value of exports in US dollar.
Additionally, it should be noted the impacts of increased rates of the Tax on Financial Operations (IOF) on credit operations with individuals, R$3.2 billion; and the update of reference prices in the table of beverages, R$0.9 billion, partially offset by the reduction associated with the update of the Income Tax of Individuals, R$1.6 billion; and to the reduction of the Contribution on Intervention in the Economic Domain (Cide) on gasoline and diesel, R$0.4 billion.
Table 4.11 – Gross federal revenues
R$ million
Itemization 2009 2010 2011
(a) (b) (c) (b)/(a) (c)/(b)
Income Tax (IR) 191 597 208 201 249 818 8.7 20.0
Industrialized Products Tax (IPI) 30 752 39 991 46 918 30.0 17.3
Import Tax (II) 16 092 21 119 26 734 31.2 26.6
Financial Operations Tax (IOF) 19 243 26 601 31 807 38.2 19.6
Contribution to the Financing
of the Social Security (Cofins) 117 886 139 690 158 079 18.5 13.2
Social Contrib. on the Profits of Legal Entities (CSLL) 44 237 45 928 58 127 3.8 26.6
Contribution to PIS/Pasep 31 755 40 548 41 844 27.7 3.2
Provisional Contribution on
Financial Transactions (CPMF) 286 119 145 -58.4 22.0
Contribution on Intervention in the
Economic Domain (Cide) 4 827 7 738 8 924 60.3 15.3
Other taxes 40 877 42 164 75 924 3.1 80.1
Subtotal 497 552 572 099 698 319 15.0 22.1
Social security revenue 200 737 233 609 271 588 16.4 16.3
Total 698 289 805 708 969 907 15.4 20.4
Source: Ministério da Fazenda/Receita Federal do Brasil
Change %

74 Boletim do Banco Central do Brasil – Annual Report 2011
Social Security
Social Security net revenues totaled R$245.9 billion in 2011, rising 16% in the year, while the payment of social security benefi ts grew 10.4%, to R$281.4 billion. As a result, the Social Security defi cit decreased from R$42.9 billion (1.14% of GDP) to R$35.5 billion (0.86% of GDP) in the period.
Table 4.12 – Income Tax and Industrialized Products Tax
R$ million
Itemization 2009 2010 2011 Change %
(a) (b) (c) (b)/(a) (c)/(b)
Income Tax (IR) 191 597 208 201 249 818 8.7 20.0
Individuals 14 840 17 252 21 973 16.3 27.4
Corporate entities 84 518 89 102 104 054 5.4 16.8
Financial institutions 13 610 13 118 15 073 -3.6 14.9
Other companies 70 908 75 984 88 982 7.2 17.1
Withholdings 92 239 101 847 123 791 10.4 21.5
Labor earnings 52 179 59 823 68 825 14.6 15.0
Capital earnings 22 926 24 185 34 254 5.5 41.6
Remittances abroad 10 657 11 297 13 402 6.0 18.6
Other earnings 6 477 6 542 7 310 1.0 11.7
Industrialized Products Tax (IPI) 30 753 39 991 46 918 30.0 17.3
Tobaco 3 312 3 705 3 744 11.9 1.0
Beverages 2 291 2 419 2 829 5.6 16.9
Automotive vehicles 2 054 5 672 6 980 176.1 23.1
Other taxes 14 685 16 874 19 631 14.9 16.3
Linked imports 8 411 11 321 13 735 34.6 21.3
Source: Ministério da Fazenda/Receita Federal do Brasil
Table 4.13 – Social Security
R$ million
Itemization 2009 2010 2011
(a) (b) (c) (b)/(a) (c)/(b)
Net inflow 182 008 211 968 245 892 16.5 16.0
Gross inflow 201 172 234 252 272 458 16.4 16.3
Social security contribution 183 110 212 558 245 647 16.1 15.6
Other revenues 18 062 21 694 26 811 20.1 23.6
Refund 555 740 1052 33.3 42.2
Transfers to third parties 18 609 21 544 25 514 15.8 18.4
Social security benefits 224 876 254 859 281 438 13.3 10.4
Primary result -42 868 -42 891 -35 546 ... ...
Source: Ministério da Previdência e Assistência Social
Change %

IV Public Finance 75
The performance of net infl ows, including the contributions of employers and private sector workers of the RGPS, by deducting the contributions of third parties (Sesi, Senai, Sesc, Senac, Sebrae, Sest, Senar), was specially favored by the labor market dynamics. The increase of social security benefi ts, including retirement, pension and other benefi ts, special judicial orders and court decisions for the settlement of liabilities consequent upon the review of values of benefi ts granted, refl ected both the review of benefi ts’ values and the increase in the number of benefi ts granted.
State and municipal fi nances
The collection of the Tax on the Circulation of Merchandises and Services (ICMS) totaled R$301.5 billion in 2011, registering annual real increase of 4.4%. The tax
4
5
6
7
8
1998 1999 2000 2001 2002 2003 2004 2005 2006 2007 2008 2009 2010 2011
Graph 4.6Social security
Primary flows in (%) of GDP current prices
Tax revenue Social benefits
Table 4.14 – Payment of the Tax on the Circulation of Merchandise and Services (ICMS)
R$ million
Itemization 2009 2010 2011
(a) (b) (c) (b)/(a) (c)/(b)
São Paulo 78 572 92 317 102 139 17.5 10.6
Rio de Janeiro 19 100 23 002 25 155 20.4 9.4
Minas Gerais 22 349 27 188 29 219 21.7 7.5
Rio Grande do Sul 15 087 17 893 19 503 18.6 9.0
Paraná 12 336 13 870 15 962 12.4 15.1
Bahia 10 143 12 143 13 231 19.7 9.0
Santa Catarina 8 528 10 366 12 514 21.6 20.7
Goiás 6 717 8 170 9 875 21.6 20.9
Pernambuco 6 866 8 411 9 926 22.5 18.0
Espírito Santo 6 670 6 965 8 466 4.4 21.5
Other states 43 012 50 402 55 538 17.2 10.2
Total 229 381 270 727 301 527 18.0 11.4
Source: Ministério da Fazenda/Confaz
Change %

76 Boletim do Banco Central do Brasil – Annual Report 2011
collection reached R$102.1 billion in the state of São Paulo, corresponding to 33.9% of the total in the year; followed by Minas Gerais, R$29.2 billion; in Rio de Janeiro, R$25.2 billion; and in Rio Grande do Sul, R$19.5 billion. These four federation units together corresponded to 58.4% of the annual ICMS collection.
The transfers of federal funds to state and municipal governments totaled R$172.5 billion, 22.6% up from the previous year. This evolution mainly resulted from three factors:
i) Growth of R$24.5 billion (23.1%) under constitutional transfers (State and Municipal Revenue Sharing Funds and Industrialized Products Exports Compensation Fund), refl ecting the higher collection of the Income Tax and the Industrialized Products Tax;
ii) Increase of R$4 billion (74.3%) under transfers supported by the Fund for the Maintenance and Development of Basic Education and Enhancement of Education Professionals (Fundeb), in order to complement the state and municipal expenditures with basic education and formation of educational professionals;
iii) Expansion of R$3.1 billion of incomes on royalties.
Table 4.15 – Federal government onlendings to states and municipalities
R$ million
Itemization 2009 2010 2011
(a) (b) (c) (b)/(a) (c)/(b)
Constitutional onlendings (IPI, IR and others) 97 561 105 745 130 172 8.4 23.1
Export Compensation Fund 1 950 1 950 1 950 0.0 0.0
Cide transfers 962 1 776 2 110 84.6 18.8
Others 27 211 31 207 38 252 14.7 22.6
Financial assistance 3 818 3 266 1 950 -14.5 -40.3
ITR/IOF 237 366 397 54.4 8.5
Royalties 12 199 15 481 18 595 26.9 20.1
Education allowance 5 755 6 554 7 771 13.9 18.6
Fundeb 5 070 5 353 9 329 5.6 74.3
Others1/ 132 187 210 41.7 12.3
Total 127 684 140 678 172 484 10.2 22.6
Source: Ministério da Fazenda/Secretaria do Tesouro Nacional1/ Contribution of education benefit, fund for the maintainance and development of the basic education and
enhancement of the teaching career (Fundef), petrol royalties and other onlendings.
Change %
V Economic-Financial Relations with the International Community 77
Economic-Financial Relations with the International Community
Foreign Trade Policy
In 2011, the foreign trade policy was guided by two major guidelines: the reinforcement of instruments for commercial protection and stimulus to innovation and national production, aiming to increase the country’s industrial competitiveness in both domestic and foreign markets, an initiative materialized in the Greater Brazil Plan (PBM).
The PBM was established by Decree no. 7,540, dated August 2, 2011, in compliance with the governmental policy of boosting and strengthening the national industry, implemented in May, 2008, through the so-called Productive Development Policy (PDP). The PBM goals are to increase the competitiveness of national goods and services, focusing on the areas of international trade, protection of domestic industry and market, and investment and innovation. Measures concerning the international trade were established with the following purposes:i) Tax relief on exports;ii) Commercial protection;iii) Financing and guaranteeing exports;iv) Commercial promotion.
In the scope of these measures, Provisional Measure no. 540, dated August 2, 2011, converted into Law no. 12,546, dated December 14, established the Reintegra in order to refund values related to residual tax costs. The producer (legal person) who exports manufactured goods in the country will be allowed to calculate the value eligible for the partial or total compensation of residual taxes in the productive chain. This value will be calculated through a percentage established by the Executive Branch on the income associated with exports, varying from zero to 3%, and being differentiated by economic sector and activity category.
This Reintegra regime was regulated by Decree no. 7,633, dated December 1. As a rule, the products for which the costs of imported inputs are not higher than 40% of the export price may be benefi ted, but for high tech goods (pharmaceuticals; machinery, apparatuses and electrical and electronic appliances; airplanes; instruments, apparatuses; clock making) the limit reaches 65%. Products imported with the aim of
V

78 Boletim do Banco Central do Brasil – Annual Report 2011
being re-exported by Brazilian companies are not subject to this system. In addition, inputs imported from the member states of the Southern Common Market (Mercosur) that complies with the origin requirements of the economic bloc will be considered as national inputs for the application of the Reintegra. This regulation also deals with the establishment of a technical group, consisting of the Ministry of Finance and the Ministry of Development, Industry and Foreign Trade (MDIC), whose mission will be to study occasional proposals for changing the refund percentage, the maximum percentage of imported inputs and the list of eligible goods. This system will be effective up to December 31, 2012.
Another PBM initiative, established by Provisional Measure no. 540, dated August 2, converted into Law no. 12,546, dated December 14, was the reduction, from 20% to zero, up to December 2012, of the employer’s contribution on the payroll in the textile, footwear, furniture and software segments, and the implementation of a contribution on revenues of those companies. The rate of 2.5% was defi ned for the software segment, and 1.5% for the other segments. The loss of RGPS’s revenues consequent upon these changes shall be offset with funds provided by the National Treasury. The same regulation determined the gradual reduction, of twelve months, in July of 2011, for immediate appropriation, in July 2012, of the deadline for the refund of the PIS/Cofi ns credits related to capital goods.
Still in the PBM scope, the following commercial protection measures were also announced: reduction, from 15 to 10 months, of the maximum deadline for antidumping investigations, safeguards and compensatory measures, and from 240 to 120 days for the application of provisional rights. Furthermore, it is noteworthy the additional efforts for fi ghting against circumvention (triangulation from which the product is sold by a country, having been produced in another country), false declaration of origin, sub-invoiced products, illegal imports and violation of industrial property.
Commercial protection was defi ned as one of the major foreign trade policy goals throughout the year, by means of several initiatives in this area. The Inter-ministerial Ordinance of the Secretariat of the Federal Revenue of Brazil (RFB) and MDIC no. 149, dated June 16, of the Intelligence Group on Foreign Trade (GI-CEX) allowed the easy identifi cation of administrative instruments of each entity, thus guaranteeing greater effi ciency in the fi ght against disloyal and illegal foreign trade practices. An innovative measure to improve the system of commercial protection with the aim of monitoring the infl ow of goods and avoid anticipated purchases by importers is the inclusion of the product in non-automatic licensing as of the moment in which an antidumping investigation is opened. Other initiative for the cooperation between the two entities was implemented by the Ordinance RFB no. 3,011, dated June 30, authorizing the exchange of data, from the Federal Revenue to the Foreign Trade Secretariat (Secex), in order to analyze requirements to open investigations for extending antidumping measures.

V Economic-Financial Relations with the International Community 79
Moreover, the full-margin was adopted for the calculation of antidumping measures, instead of the Management Executive Committee (Gecex) of the Foreign Trade Council (Camex) guideline suggesting to adopt the rule of the lowest right in effect since 2007. So far, Brazil had opted to impose a surcharge enough to compensate the damage, and the adoption of the full-margin is expected to increase the surcharges applied.
The retroactive charge of antidumping and compensatory rights was established by Camex Resolution no. 64, dated September 14. This regulation authorized the levying of taxes on imported products up to ninety days before the date of the application of provisional antidumping measures. This charge aims to avoid the accumulation of stocks in the period immediately after the beginning of investigations of disloyal commercial practices. The retroactive antidumping right is accepted by the World Trade Organization (WTO) and the Brazilian legislation.
At the end of 2011, a total of 84 antidumping rights, one price commitment and one safeguard measure, related to 52 products associated with 25 countries or blocs took place, with emphasis on those related to China, U.S. and India. It s worth mentioning that the Secex Ordinance no. 39, dated November 11, improved the criteria for the opening of investigation about the fulfi llment of rules established by the Brazilian legislation, and the fi rst investigations about circumvention were opened in the year.
In May, the government decided to apply the non-automatic licensing for the imports of new automotive vehicles. In the scope of the PBM, Provisional Measure no. 540, dated August 2, converted into Law no. 12,546, dated December 14, established a new system for the automotive sector with tax incentives for stimulating investments, value aggregation, employment generation and technological innovation. This regulation was dealt with by Decree no. 7,567, dated September 15. IPI was exempted for vehicles with minimum regional content of 65% in at least 6 of the 11 productive stages in the country, and investment of 0.5% of total gross income on sales of goods and services in research and technological innovation, effective up to December 31, 2012. IPI on vehicles imported from Mercosur member states and Mexico remained unchanged, as long as manufacturers held a plant installed in Brazil. Later on, the Brazilian Government extended, in compliance with the Brazil-Uruguay Automotive Agreement, the benefi ts of the IPI reduction on vehicles from the neighboring country. In view of the Decision of the Supreme Federal Court, stating that the rule would be effective after 90 days, it was established the Decree no. 7,604, dated November 10, which altered the beginning of the IPI increase, effective as of December 16.
In the scope of the Mercosur, the Brazilian government proposed the improvement of the Import Tax tariff structure, including the establishment of a mechanism that would allow tax increases. In the Council’s Meeting of the Mercosur Common Market in Montevideo, held on December 20, through the Decision no. 39/2011, it was implemented a mechanism allowing member states of this economic bloc to increase, temporarily,
80 Boletim do Banco Central do Brasil – Annual Report 2011
import tax rates. This mechanism is an instrument parallel to the List of Exception to the Common External Tariff (TEC), with the difference that TEC rates can be reduced or increased. Each country will be allowed to include one hundred new tariff codes of the Common Mercosur Nomenclature (NCM) apart from those included in the List of Exception, in order to raise rates included in the TEC of the Mercosur for products imported from non member countries.
In the scope of the commercial promotion, the Ata-Carnet came into force through the publication of Decree no. 7,545, dated August 2, 2011. This is a convention that makes it easy the circulation of goods under the regime of temporary admission with no taxes being charged. Additionally, it was reinforced the strategy of commercial promotion by overriding products/services in selected markets.
Regarding the fi nancing and guarantees for exports, it was determined the creation of the Export Financing Fund (FFEX), a fund of private nature established by the Banco do Brasil for companies with revenues up to R$60 million. The Federal Government was authorized by Provisional Measure no. 541, dated August 2, converted into the Law no. 12,545, dated December 14, to initially participate with R$1 billion, but other companies may participate in the fund, which will be also supported by earnings associated with the Proex-Financing.
Furthermore, it was implemented by the BNDES and Banco do Brasil the computerization of the process to issue the Credit Insurance to the Export Guarantee Fund (FGE) Policy. In the case of Proex Equalization operations, the defi nition of reference spreads shall be automatically approved for the exports of goods and services. The FGE will have a revolving ceiling of US$50 million concerning the exports of manufactured products.
With regard to measures aimed to fi nance exports, the Secex Ordinance no. 42, dated December 7, extended the utilization of the Export Financing Program (Proex) for operations carried out through the Simplifi ed Export Declaration (DSE), limited to the value of US$50 thousand. To obtain this fi nancing, it is necessary to fi ll in the Credit Registration (RC) in the Integrated Foreign Trade System (Siscomex), regardless of the Export Registration (RE). When fi nancing is approved by the Banco do Brasil, exporters are only required to present a copy of the DSE and documents related to the shipment of goods in order to release the loan.
Proex operations totaled US$4.1 billion in 2011, of which US$635 million related to fi nancing and US$3.5 billion to interest rates equalization. Funds allocated under the fi nancing modality increased 24.3% as compared to the previous year, while the number of operations decreased from 1,478 to 1,354, and the total of exporters participating in the program decreased from 371 to 312.
V Economic-Financial Relations with the International Community 81
The main economic sectors that took advantage of the Proex-Financing in 2011 were the agribusiness, 58% of total; the segments of textile, leather and footwear, 24%; and machinery and equipment, 9%. The main countries of destination of exports were Cuba, 45% of total; China, 10%; and France, 7%.
Funds allocated to the equalization modality registered stability in the year, while the issue of securities related to operations of interest rates equalization totaled US$185 million, rising 56.6% as compared to 2010. In the year, 2,531 operations were carried out by 34 exporters, as against 2,657 operations carried out by 31 companies in the previous year.
The sectoral analysis reveals that exports involving this modality were focused on machinery and equipment, accounting for 70%, followed by transportation equipment industry, 22%. The main regions of destination of exports carried out by the Proex-Equalization were the North American Free Trade Agreement (Nafta) countries, with 31%; countries of the Latin American Integration Association (Aladi), 20%; and Mercosur member countries, 15%. The main countries of destination were the U.S., with 22% of total; Argentina; 13%; Chile, 8%; Peru, 8%; and Mexico, 7%.
The prorogation of the deadline for the contract of fi nancing in the framework of the BNDES Investment Support Program (ISP), with a budget of R$75 billion, represented an important measure to leverage the productive investment and technological innovation. In March, the PSI was prorogated until December 31, 2011, and, in September, until the end of 2012, being adjusted to the PBM strategies. The National Monetary Council, through Resolution no. 4,009, dated September 14, approved some PSI alterations, with emphasis on the reallocation of fi nancing limits from the BNDES to the Finep, increasing the amount of funds from R$1 billion to R$3 billion; the inclusion as benefi ciaries of national or foreign corporations headquartered in Brazil, in addition to entrepreneurs, associations and foundations with the purpose of developing technological innovation projects in a systematic way.
On June 1, it was announced a partnership between Banco do Brasil and BNDES for the fi nancing of Brazilian exports of capital goods in the Latin America, in the framework of the BNDES Exim automatic. The new credit line, with payment deadlines of up to fi ve years, should contribute to enhance the competitiveness of Brazilian companies abroad, especially in the segment of capital goods. All Banco do Brasil’s branches, in Brazil and overseas, are eligible for negotiating with companies interested in this credit line, limited to US$200 million.
In 2011, disbursements related to BNDES foreign trade operations totaled US$6.7 billion, of which US$5 billion targeted to exports of goods and US$1.7 billion to exports of services. In the scope of the 580 operations involving disbursements for the industry, US$1.4 billion corresponded to exports in the segment of vehicles, tow trucks

82 Boletim do Banco Central do Brasil – Annual Report 2011
and bodyworks; US$1.2 billion in other transportation equipment; US$724 million to machinery and equipment; and US$487 million in electrical machines and apparatuses. These four segments accounted for 77.1% of total disbursements channeled to the manufacturing industry.
Regarding the special import regimes, the Secex Ordinance no. 8, dated February 15, regulated the new regime of Integrated Drawback Exemption. This system permits the replacement of stock of imported inputs acquired in the domestic market with the aim of being utilized in the industrialization of the fi nal exported product. The company may choose between the exemption for the amount imported or acquired in the domestic market, an innovative choice with the goal of improving the competitiveness of Brazilian products on the international market.
Other relevant item was the signing, on October 24, of the Constitutional Amendment Proposal (PEC) in order to prorogate, for more than 50 years, the validity of the Free Economic Zone of Manaus and the extension of benefi ts for that metropolitan region. In addition, through the Inter-Ministerial Ordinance of the Ministry of Science and Technology no. 432, dated June 28, it was defi ned the fi rst company allowed to produce tablets in the country, subject to tax incentives in the framework of the Informatics Law.
Exchange policy
According to Circular no. 3,520, dated January 6, fi nancial institutions should pay to the Central Bank, as compulsory deposit, 60% of the short exchange position exceeding the lowest of the following values: US$3 billion, or the Base Capital (PR). The deadline for fi nancial institutions to adapt to this compulsory deposit paid in cash and without return, totaled 90 days. This prudential measure aimed to reduce banking exchange exposure in foreign currency.
On January 14, the Central Bank resumed reverse exchange swap operations, in which it assumes asset position in exchange variation and liability in domestic interest rates. It is worth mentioning that, in June of 2009, the Central Bank had closed all its open positions in exchange swap contracts. At the end of December 2011, these operations resulted in net exposure of US$3 billion.
Circular no. 3,484, dated January 25, authorized foreign currency auctions with forward settlement, that is, with defi ned deadlines for future payments. Auctions were carried out in February, April and September, totaling US$2.2 billion in the year. Through this measure, the Central Bank obtained the following instruments to intervene on the
V Economic-Financial Relations with the International Community 83
exchange domestic market: direct interventions in the spot market; exchange swap and reverse exchange swap auctions; and forward auctions.
The maintenance of foreign capital infl ows to the Brazilian market allowed the monetary authority to keep the policy of purchasing foreign currency in the spot market, totaling acquisitions of US$47.9 billion from January to September, which, added up to US$2.2 billion related to forward operations, totaled purchases of US$50.1 billion in the year.
According to Decree no. 7,454, the IOF rate on exchange operations for the fulfi llment of obligations of the credit card administrators, commercial or multiple banks in the quality of credit card issuers, resulting from the acquisition of foreign goods and services by their users, increased to 6.38% as of March 25, This measure came into force on the publication’s date, with effects on the exchange operations after the thirtieth day subsequent to the publication’s date.
According to the Decree no. 7,456, dated March 28, the IOF rate on liquidations of exchange operations contracted since March 29, 2011, concerning infl ows of foreign funds under the modality of loans, contracted directly or through the issue of securities on the international market, with minimum average term of 360 days, was raised to 6%. The deadline was increased to 720 days for the settlement of exchange operations contracted since April 7, 2011, according to Decree no. 7,457, dated April 6. The aim of this regulation is to reduce short-term foreign debts, which are subject to higher risks in a crisis scenario.
Aiming to equalize the treatment provided to operations involving conversion operations and transfer between foreign capital registered at the Central Bank of Brazil, the CMN, through Resolution no. 3,967, dated April 4, turned it mandatory the implementation of simultaneous operation in renovations, renegotiations and assumption of obligations related to foreign loans operations, contracted directly or through the issue of securities on the international market. The Central Bank implemented normative changes on this subject through Circular no. 3,531, dated April 13.
Other macro-prudential measure aimed to reduce banking exposure in foreign currency was announced on July 8. Through Circular no. 3,548, the Central Bank redefi ned and consolidated the rules for the compulsory payment on exchange short position. According to this rule, fi nancial institutions should pay to the Central Bank, as compulsory deposit, 60% of the value of the exchange short position exceeding the lowest of the following values: US$1 billion, or the Base Capital (PR). This compulsory deposit should be paid in cash and yields no earnings.
Provisional Measure no. 539, dated July 26, converted into Law no. 12,543, dated December 8, authorized the National Monetary Council to establish specifi c conditions
84 Boletim do Banco Central do Brasil – Annual Report 2011
to negotiate derivatives contracts. According to this Law, operations related to securities, involving derivatives contracts are subjected to the maximum IOF rate, 25%. Additionally, Decree no. 7,536, dated July 26, fi xed the IOF rate in derivatives contracts at 1% on the adjusted value, in the purchase, sale or maturity of contracts of fi nancial derivatives, whose liquidation value had been affected by the variation of the interest rate and resulting in increase of the short net exposure, compared to that calculated at the end of the previous business day. Through Normative Instruction no. 1,207, dated November 3, the Federal Revenue regulated the collection of IOF, but its payment for the triggering events occurred from September 15 to December 31, 2011 was postponed, by means of Ordinance no. 560, dated December 23, to January 31, 2012. In addition, the same Decree determined for the loan operation, contracted by the minimum average deadline higher than 720 days, that if the minimum medium term required is not fulfi lled, the taxpayer will have to pay the tax calculated at a rate of 6%, plus interest on late payments and fi nes.
The IOF rate on foreign investment in shares was reduced from 2% to zero, according to Decree no. 7,632, dated December 1. The reduction reached the initial public offer (IPO) and the secondary market, and included the cancellation and primary issue of depositary receipts of Brazilian companies negotiated abroad. It was also reduced, from 6% to zero, the IOF rate on non-resident investments in securities of medium-term higher than four years, issued by non-fi nancial companies and associated with investment projects.
In the scope of the policy for strengthening the Brazilian companies’ performance on the international market, the CMN, through Resolution no. 4,033, dated November 30, allowed the authorized banks to operate in the exchange market, with minimum base capital of R$5 billion, and to use funds raised in the international market to grant credit abroad. This credit may be only channeled to Brazilian companies, subsidiaries of Brazilian companies and foreign companies, whose shareholder with the majority of voting capital should be, directly or indirectly, an individual or corporation resident in Brazil. In addition, banks were authorized to acquire, in the primary market, securities issued by the referred companies.
In the context of measures aimed to streamline exchange operations, the CMN, through Resolution no. 3,997, dated July 28, regulated the receipt by national exporters of funds associated with sales of goods and services abroad, in an environment of electronic commerce. The measure eliminated the harmful asymmetry for the Brazilian companies, thus allowing national exporters to compete in the environment of electronic commerce under similar conditions with foreign competitors.

V Economic-Financial Relations with the International Community 85
Exchange movement
The market of contracted exchange registered a surplus of US$65.3 billion in 2011, against US$24.4 billion in the previous year. The commercial surplus added up US$44 billion, against a defi cit of US$1.7 billion in 2011, refl ecting respective increases of 42.2% and 16.3% under exports and imports contracts. The fi nancial segment registered net infl ows of US$21.3 billion, against US$26 billion in the previous year, resulting from respective increases of 4.1% and 5.8% under foreign currency purchases and sales.
Central Bank’s purchases in the spot market totaled US$47.9 billion, while those associated to forward contracts on the domestic exchange market totaled US$2.2
Table 5.1 – Foreign exchange operations
US$ million
Period Balance
Exports Imports Balance Purchases Sales Balance
Total Advances on Payment Other
export contract in advance (C)
(A) (B) = (A)+(B)
2009 144 666 31 374 35 851 77 441 134 742 9 924 336 257 317 450 18 808 28 732
2010 Jan 10 723 3 332 1 481 5 910 10 863 -140 23 083 21 868 1 215 1 075
Feb 10 085 2 684 2 541 4 860 12 371 -2 285 23 765 21 879 1 886 -399
Mar 16 221 3 202 3 658 9 361 13 826 2 394 27 829 28 109 -280 2 114
Apr 12 750 3 035 2 684 7 031 13 389 -639 27 897 25 010 2 887 2 248
May 16 301 3 355 4 070 8 876 13 631 2 671 30 494 30 560 -66 2 605
Jun 13 961 3 025 3 892 7 043 14 749 -788 24 959 28 450 -3 491 -4 279
Jul 13 984 2 774 4 335 6 875 14 762 -777 28 655 27 166 1 490 712
Aug 14 984 3 250 3 162 8 572 16 868 -1 884 27 502 26 299 1 203 -680
Sep 14 741 2 622 3 984 8 136 17 730 -2 989 49 171 32 456 16 716 13 726
Oct 17 195 3 408 3 500 10 288 15 418 1 777 34 550 29 409 5 141 6 917
Nov 17 338 3 603 3 424 10 311 16 836 502 27 332 25 609 1 722 2 225
Dec 18 306 3 328 4 438 10 540 17 797 509 53 118 55 536 -2 418 -1 910
Year 176 590 37 618 41 169 97 802 178 240 -1 650 378 355 352 351 26 004 24 354
2011 Jan 15 072 3 492 1 807 9 774 13 995 1 077 42 675 28 240 14 435 15 513
Feb 14 670 3 362 2 592 8 716 15 169 -498 32 125 24 208 7 918 7 419
Mar 20 800 4 278 5 292 11 230 17 137 3 663 37 969 28 972 8 997 12 660
Apr 18 811 5 309 4 622 8 880 15 501 3 310 34 902 36 671 -1 769 1 541
May 24 313 4 895 6 883 12 535 17 050 7 263 29 860 31 867 -2 007 5 256
Jun 19 432 4 501 3 665 11 266 18 054 1 378 33 382 37 316 -3 934 -2 556
Jul 23 668 4 715 4 341 14 612 17 415 6 253 39 316 29 745 9 571 15 825
Aug 25 855 5 555 4 428 15 872 19 188 6 667 28 381 30 893 -2 512 4 155
Sep 26 228 5 275 4 847 16 106 17 469 8 758 26 030 26 304 -274 8 484
Oct 21 552 3 362 5 797 12 393 19 684 1 868 27 266 29 268 -2 002 -134
Nov 20 177 3 386 2 999 13 792 17 649 2 528 21 599 25 069 -3 470 -942
Dec 20 606 3 624 3 189 13 792 18 924 1 681 40 492 44 117 -3 625 -1 943
Year 251 185 51 754 50 463 148 968 207 236 43 950 393 997 372 669 21 329 65 279
Commercial Financial

86 Boletim do Banco Central do Brasil – Annual Report 2011
billion. Banks’ exchange position, refl ecting both operations with clients on the primary exchange market and Central Bank’s interventions, decreased from US$16.8 billion, at the end of 2010, to US$1.6 billion, at the end of December 2011.
The Brazilian real depreciated 12.6% against the U.S. dollar in 2011. Effective real exchange rate indices, defl ated by the Extended Price Index (IPA-DI) and the IPCA, registered respective decreases of 10.6% and 5.2% at the end of 2011 and 2010.
Balance of payments
The Brazilian external position was positive in 2011 according to several aspects: the defi cit under current transactions, measured as a proportion of the GDP, decreased as compared to the previous year; the trade fl ow of goods and services expanded; net foreign liability, expressed by the International Investment Position, decreased in absolute terms; and the coverage of debt maturing in twelve months by the stock of international reserves expanded. Therefore, in the scope of the foreign sector, the perception related to the soundness of the Brazilian foreign accounts partially offset the impact of the volatility on international fi nancial markets.
The adoption of a consistent macroeconomic policy, based on three pillars (infl ation targeting, fi scal responsibility and fl oating exchange system) was maintained in 2011. Additionally, the modern National Financial System regulation has been essential to the fi nancial stability. Throughout the year, in spite of the uncertainties in the international scenario, the risk classifi cation agencies increased the country’s sovereign credit rates, in the following order: Fitch, in April, Moody’s, in June, and Standard and Poor’s, in November. The sovereign fi nancing cost in the international market, favored, among other factors, by the strengthened foreign position, hit the lowest level over the last 40 years, in contrast with the environment of sovereign debt crisis in the Eurozone. In the last quarter of the year, the disbursement of bonds by the Brazilian Treasury registered positive records in terms of absolute funding costs and spread as compared to U.S. reference debt securities.
The turmoil arising from the sovereign debt crisis in important European countries did not affect the volumes obtained by the Brazilian private sector, thus positioning Brazil, according to estimates published by the United Nations Conference on Trade and Development (Unctad) in the Global Investment Trends Monitor as the fi fth greatest recipient of net infl ows, behind the U.S., United Kingdom, China and Hong Kong.
The defi cit in current transactions totaled US$52.5 billion in 2011, against US$47.3 billion in the previous year. Net expenditures on income expanded by US$7.8 billion, while expenditures on services rose US$7.1 billion, for respective annual increases of

V Economic-Financial Relations with the International Community 87
19.8% and 23.1%, partially offset by the increase of 47.9% in the trade balance surplus. The acknowledgment of Brazil as a safe environment for investments, expressed in terms of risk expectations, contributed to net infl ows of US$112.4 billion in the capital and fi nancial account in 2011. The balance of payments turned in a surplus of US$58.6 billion.
Table 5.2 – Balance of payments
US$ million
Itemization 2010 2011
1st half 2nd half Year 1st half 2nd half Year
Trade balance - FOB 7 880 12 267 20 147 12 960 16 846 29 807 Exports 89 187 112 728 201 915 118 304 137 736 256 040 Imports 81 308 100 461 181 768 105 343 120 890 226 233Services -13 531 -17 304 -30 835 -17 993 -19 959 -37 952 Credit 14 765 16 834 31 599 18 179 20 030 38 209 Debit 28 296 34 138 62 434 36 172 39 989 76 161 Income -19 731 -19 755 -39 486 -22 577 -24 742 -47 319 Credit 3 124 4 282 7 405 5 758 4 994 10 753 Debit 22 855 24 037 46 892 28 335 29 736 58 072 Current unilateral transfers (net) 1 563 1 339 2 902 1 576 1 408 2 984 Credit 2 395 2 379 4 775 2 481 2 435 4 915 Debit 833 1 040 1 873 905 1 027 1 931Current account -23 820 -23 453 -47 273 -26 034 -26 446 -52 480Capital and financial account 42 989 56 923 99 912 69 341 43 048 112 389 Capital account 494 625 1 119 666 907 1 573 Financial account 42 495 56 299 98 793 68 675 42 141 110 816 Direct investment (net) 3 215 33 704 36 919 34 986 32 703 67 689 Abroad -8 881 -2 706 -11 588 2 484 -1 455 1 029 Equity capital -12 110 -14 673 -26 782 -14 597 -4 936 -19 533 Intercompany loans 3 229 11 966 15 195 17 081 3 481 20 562 In the reporting country 12 096 36 410 48 506 32 502 34 158 66 660 Equity capital 12 256 27 860 40 117 25 827 28 955 54 782 Intercompany loans -160 8 550 8 390 6 675 5 203 11 878 Portfolio investments 22 790 40 221 63 011 25 146 10 165 35 311 Assets -375 -4 408 -4 784 12 711 4 147 16 858 Equity securities 896 5 315 6 211 6 841 1 961 8 801 Debt securities -1 271 -9 724 -10 995 5 871 2 186 8 057 Liabilities 23 166 44 629 67 795 12 435 6 018 18 453 Equity securities 9 733 27 937 37 671 3 865 3 309 7 174 Debt securities 13 432 16 692 30 124 8 570 2 709 11 278 Financial derivatives -17 -95 -112 -9 12 3 Assets 74 59 133 170 82 252 Liabilities -91 -154 -245 -179 -70 -249
Other investments1/ 16 507 -17 531 -1 024 8 552 -739 7 813 Assets -12 045 -30 522 -42 567 -20 564 -18 420 -38 984 Liabilities 28 552 12 991 41 543 29 116 17 681 46 796Errors and omissions -2 502 -1 036 -3 538 -397 -875 -1 272Overall balance 16 666 32 434 49 101 42 910 15 727 58 637
Memo:Current account/GDP (%) -2.20 -2.12
1/ Includes trade credits, loans, currency and deposits, other assets and liabilities.

88 Boletim do Banco Central do Brasil – Annual Report 2011
Trade balance
The trade balance registered a surplus of US$29.8 billion in 2011, the eleventh positive annual result in the sequence. The annual expansion of 47.9% refl ected increases of 26.8% under exports and 24.5% under imports, totaling, respectively, US$256 billion and US$226.2 billion. In the year, the trade fl ow increased by 25.7%, as against an expansion of 36.7% in 2010.
Table 5.3 – Trade balance – FOB
US$ million
Year Exports Imports Balance Trade flow
2010 201 915 181 768 20 147 383 684
2011 256 040 226 233 29 807 482 273
% change 26.8 24.5 47.9 25.7
Source: MDIC/Secex
-3
-2
-1
0
1
2
Mar2008
Jun Sep Dec Mar2009
Jun Sep Dec Mar2010
Jun Sep Dec Mar2011
Jun Sep Dec
Graph 5.1Current accounts balance and external financing requirements
Accumulated in 12 months
Current account balance/GDP External financing requirements/GDP
%
External financing requirements = current account deficit - net foreign direct investments
-30
-15
0
15
30
45
60
Dec 2007
Mar 2008
Jun Sep Dec Mar 2009
Jun Sep Dec Mar 2010
Jun Sep Dec Mar 2011
Jun Sep Dec
Source: MDIC/Secex1/ From the same period of the previous year.
Exports Imports
Graph 5.2Exports and imports – FOB
Last 12 months (% change)1/
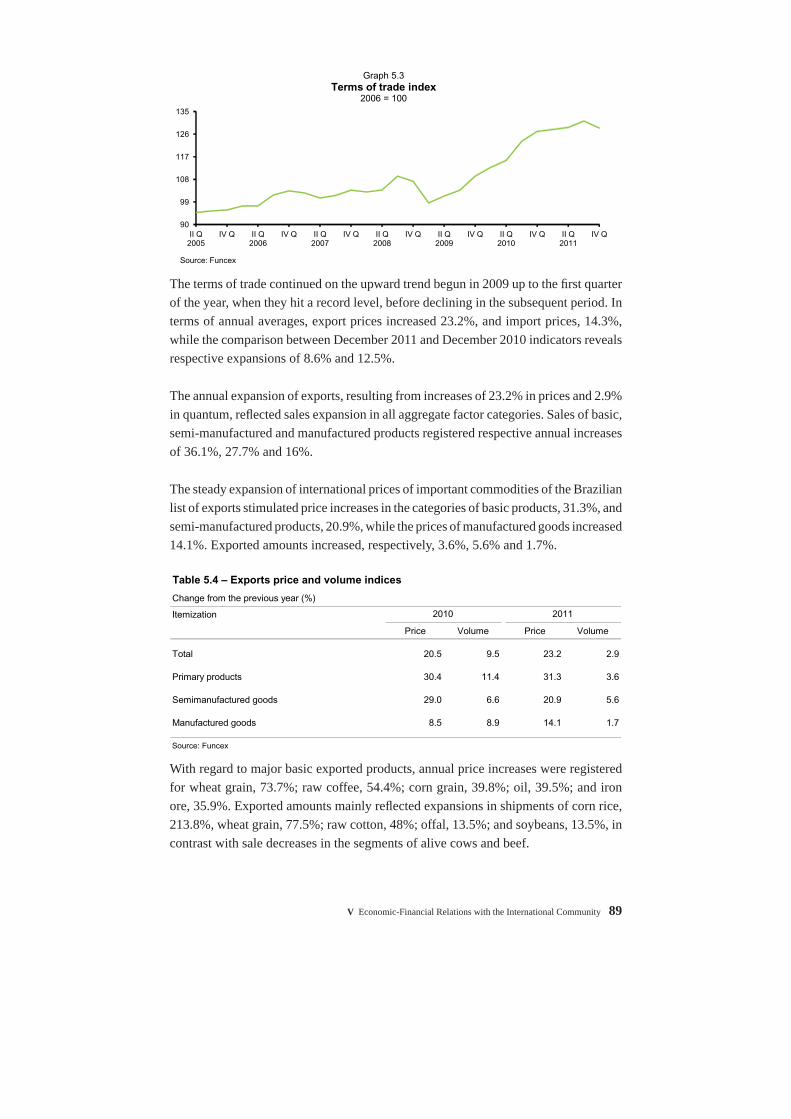
V Economic-Financial Relations with the International Community 89
The terms of trade continued on the upward trend begun in 2009 up to the fi rst quarter of the year, when they hit a record level, before declining in the subsequent period. In terms of annual averages, export prices increased 23.2%, and import prices, 14.3%, while the comparison between December 2011 and December 2010 indicators reveals respective expansions of 8.6% and 12.5%.
The annual expansion of exports, resulting from increases of 23.2% in prices and 2.9% in quantum, refl ected sales expansion in all aggregate factor categories. Sales of basic, semi-manufactured and manufactured products registered respective annual increases of 36.1%, 27.7% and 16%.
The steady expansion of international prices of important commodities of the Brazilian list of exports stimulated price increases in the categories of basic products, 31.3%, and semi-manufactured products, 20.9%, while the prices of manufactured goods increased 14.1%. Exported amounts increased, respectively, 3.6%, 5.6% and 1.7%.
With regard to major basic exported products, annual price increases were registered for wheat grain, 73.7%; raw coffee, 54.4%; corn grain, 39.8%; oil, 39.5%; and iron ore, 35.9%. Exported amounts mainly refl ected expansions in shipments of corn rice, 213.8%, wheat grain, 77.5%; raw cotton, 48%; offal, 13.5%; and soybeans, 13.5%, in contrast with sale decreases in the segments of alive cows and beef.
90
99
108
117
126
135
II Q 2005
IV Q II Q 2006
IV Q II Q 2007
IV Q II Q 2008
IV Q II Q 2009
IV Q II Q 2010
IV Q II Q 2011
IV Q
Source: Funcex
Graph 5.3Terms of trade index
2006 = 100
Table 5.4 – Exports price and volume indices
Change from the previous year (%)
Itemization
Price Volume Price Volume
Total 20.5 9.5 23.2 2.9
Primary products 30.4 11.4 31.3 3.6
Semimanufactured goods 29.0 6.6 20.9 5.6
Manufactured goods 8.5 8.9 14.1 1.7
Source: Funcex
2010 2011
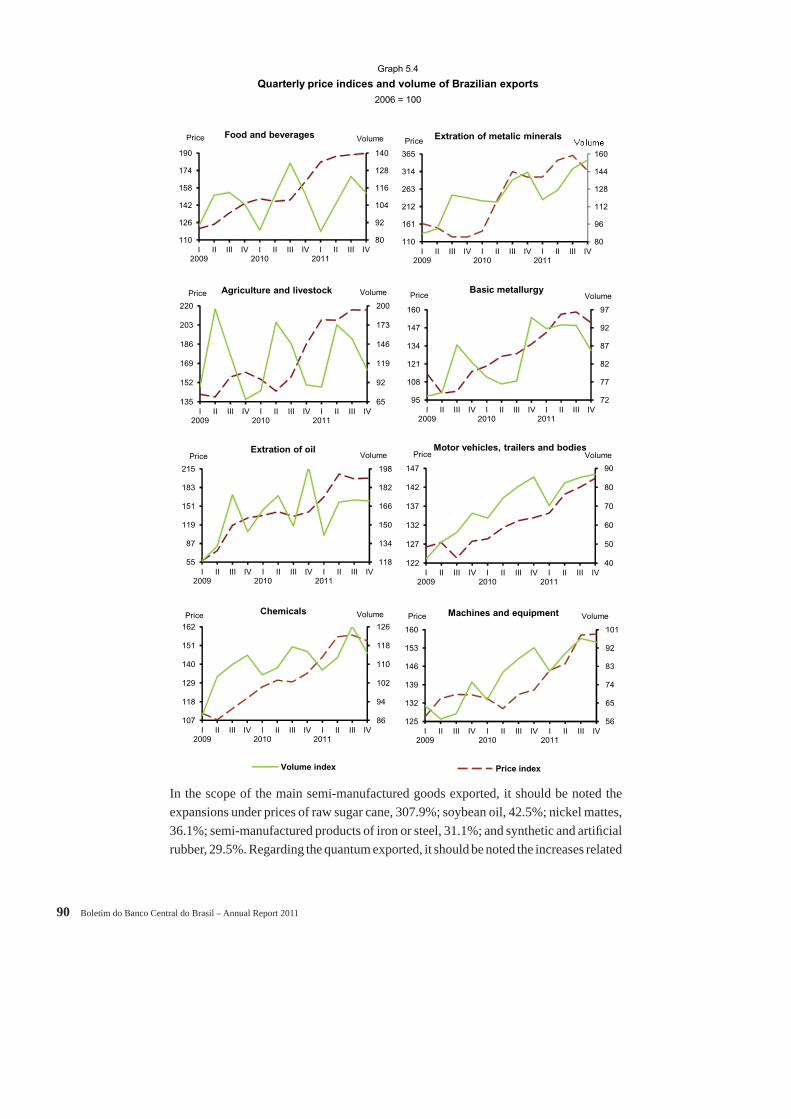
90 Boletim do Banco Central do Brasil – Annual Report 2011
In the scope of the main semi-manufactured goods exported, it should be noted the expansions under prices of raw sugar cane, 307.9%; soybean oil, 42.5%; nickel mattes, 36.1%; semi-manufactured products of iron or steel, 31.1%; and synthetic and artifi cial rubber, 29.5%. Regarding the quantum exported, it should be noted the increases related
Quarterly price indices and volume of Brazilian exports
2006 = 100
Graph 5.4
80
92
104
116
128
140
110
126
142
158
174
190
I2009
II III IV I2010
II III IV I2011
II III IV
VolumePrice Food and beverages
118
134
150
166
182
198
55
87
119
151
183
215
I2009
II III IV I2010
II III IV I2011
II III IV
VolumePriceExtration of oil
65
92
119
146
173
200
135
152
169
186
203
220
I2009
II III IV I2010
II III IV I2011
II III IV
VolumePrice Agriculture and livestock
72
77
82
87
92
97
95
108
121
134
147
160
I2009
II III IV I2010
II III IV I2011
II III IV
VolumePriceBasic metallurgy
80
96
112
128
144
160
110
161
212
263
314
365
I2009
II III IV I2010
II III IV I2011
II III IV
Price Extration of metalic minerals
40
50
60
70
80
90
122
127
132
137
142
147
I2009
II III IV I2010
II III IV I2011
II III IV
VolumePriceMotor vehicles, trailers and bodies
86
94
102
110
118
126
107
118
129
140
151
162
I2009
II III IV I2010
II III IV I2011
II III IV
VolumePrice Chemicals
Volume index
56
65
74
83
92
101
125
132
139
146
153
160
I2009
II III IV I2010
II III IV I2011
II III IV
VolumePrice Machines and equipment
Price index

V Economic-Financial Relations with the International Community 91
to pig iron and Spiegel iron, 40.6%, semi-manufactured products of iron or steel, 36.4%; copper cathodes, 23%; zinc, 15.2%, and nickel cathodes, 14.4%; in contrast with the decreases in the shipments of aluminum alloys, wood sawn or chipped and vegetable waxes.
In relation to foreign sales of manufactured products, whose prices, in general, are less volatile, it should be noted the annual increases in the segments of ethyl alcohol, 42.4%; fuel oil, 38.1%; frozen orange juice, 37.1%; hydrocarbons and their derivatives, 36%; and refi ned sugar, 33.2%. Regarding the amounts exported in this category, increases were observed in excavation and drilling machinery, 29.9%; tractors, 20.9%; ethylene polymers, propylene and styrene, 17.9%; engines for automotive vehicles, 17.9%; and cargo vehicles, 16.6%. Conversely, decreases higher than 15% were observed in the amounts exported of refi ned sugar, footwear and accessories, and hydrocarbons and their derivatives.
In 2011, according to the Foreign Trade Studies Center Foundation (Funcex), eight of the chief export segments totaled 80% of the country’s foreign sales. In the year, prices increased in all the mentioned segments, with emphasis on those related to oil drilling, 39.7%; metallic minerals, 34.6%; and crop and livestock, 31.9%. Among exports, it should be noted expansions related to basic metallurgy and machinery and equipments; both of them accounting for 11%; and automotive vehicles, tow trucks and bodyworks, 6.8%.
The annual evolution of imports refl ected expansion of prices, 14.3%, and quantum, 8.9%. All use categories registered expansion, with emphasis on the increase of 42.8% in fuels and lubricants, followed by durable consumer goods, 29.7%; nondurable goods, 24.4%; raw material and intermediate products, 21.5%; and capital goods, 16.8%.
The annual expansion of imports of raw materials and intermediate products resulted from increases of 14.7% in prices and 5.8% in quantum. It should be noted the price
Table 5.5 – Imports price and volume indices
Change from the previous year (%)
Itemization 2010 2011
Price Volume Price Volume
Total 3.9 37.0 14.3 8.9
Capital goods -3.7 43.3 4.6 11.6
Intermediate goods 2.1 37.3 14.7 5.8
Durable consumer goods 3.6 52.9 6.9 21.7
Nondurable consumer goods 10.5 17.9 8.4 14.5
Fuels and lubricants 22.2 21.6 36.7 3.9
Source: Mdic (elaboration by Central Bank)

92 Boletim do Banco Central do Brasil – Annual Report 2011
increases in the segments of fertilizers, 33.6%; naphtha, 33.5%; and insecticides, herbicides and pesticides, 32,5%, and quantum increases in the segment of fertilizers, 74.8%; parts and spares of airplanes, 26.6%; potassium chloride, 25.4%; and bearings and gears, 23.3%.
Quarterly price indices and volume of Brazilian imports
2006 = 100
Graph 5.5
75
94
113
132
151
170
130
139
148
157
166
175
I2009
II III IV I2010
II III IV I2011
II III IV
VolumePriceChemicals
100
126
152
178
204
230
115
118
121
124
127
130
I2009
II III IV I2010
II III IV I2011
II III IV
VolumePriceMachines, equipment and electrical
material
Price index
70
93
116
139
162
185
103
108
113
118
123
128
I2009
II III IV I2010
II III IV I2011
II III IV
VolumePrice
Eletronic and of communications
material
80
87
94
101
108
115
75
97
119
141
163
185
I2009
II III IV I2010
II III IV I2011
II III IV
VolumePriceExtration of oil
125
152
179
206
233
260
104
107
110
113
116
119
I2009
II III IV I2010
II III IV I2011
II III IV
VolumePrice
Machines and equipment
85
123
161
199
237
275
85
105
125
145
165
185
I2009
II III IV I2010
II III IV I2011
II III IV
VolumePrice
Coke, oil refining and fuel
100
126
152
178
204
230
97
104
111
118
125
132
I2009
II III IV I2010
II III IV I2011
II III IV
VolumePrice Basic metallurgy
Volume indexSource: Funcex
110
160
210
260
310
360
114
117
120
123
126
129
I2009
II III IV I2010
II III IV I2011
II III IV
VolumePriceMotor vehicles, trailers and bodies

V Economic-Financial Relations with the International Community 93
In the scope of the capital goods segments, quantum expanded 11.6% and prices, 4.6%. It should be noted the expanded volume of purchases of mobile phone transmitters and receivers, 74.7%; transmitter apparatuses or receivers, 44.8%; load-lifting machines, 43.5%; and medical instruments and equipment, 35.9%. Price expansion in this category mainly refl ected expansions in the items of airplanes, 82.1%; machinery to mold rubber or plastic, 21%; centrifuges and fi ltering apparatuses, 14.9%; and machines for computer data processing, 12.6%.
As for imports of durable consumer goods, quantum increased 21.7% and prices, 6.9%. The amount of imported motorcycles increased 60.9%, followed by increases in the items of bags, suitcases and trunks, 45.6%; and toys and plays, 36.3%, while the prices of transmitter apparatuses and receivers, parts and spares of motorcycles and bicycles, and plastic products for packaging registered respective increases of 114.2%, 31.9% and 18.3%.
The annual growth of imports of nondurable consumer goods resulted from increases of 14.5% in the quantum and 8.4% in prices, with emphasis on quantum expansion of frozen fi sh, 111.2%; milk and milk cream, 65%; and footwear and parts, 21.4%; and price expansion of frozen meat, 23.6%; medicines, 21.7%; and milk and milk cream, 17.6%.
Table 5.6 – Exports by aggregate factor – FOB
US$ million
Itemization 2007 2008 2009 2010 2011
Total 160 649 197 942 152 995 201 915 256 040
Primary products 51 596 73 028 61 957 90 005 122 457
Industrial products 105 743 119 756 87 848 107 770 128 317
Semimanufactured goods 21 800 27 073 20 499 28 207 36 026
Manufactured goods 83 943 92 683 67 349 79 563 92 291
Special transactions 3 311 5 159 3 189 4 140 5 265
Source: MDIC/Secex
-30
-9
12
33
54
Dec 2007
Mar 2008
Jun Sep Dec Mar 2009
Jun Sep Dec Mar 2010
Jun Sep Dec Mar 2011
Jun Sep Dec
Source: MDIC/Secex1/ From the same period of the previous year.
Primary Semimanufactured Manufactured
Graph 5.6Exports by aggregate factor – FOB
Last 12 months (% change)1/
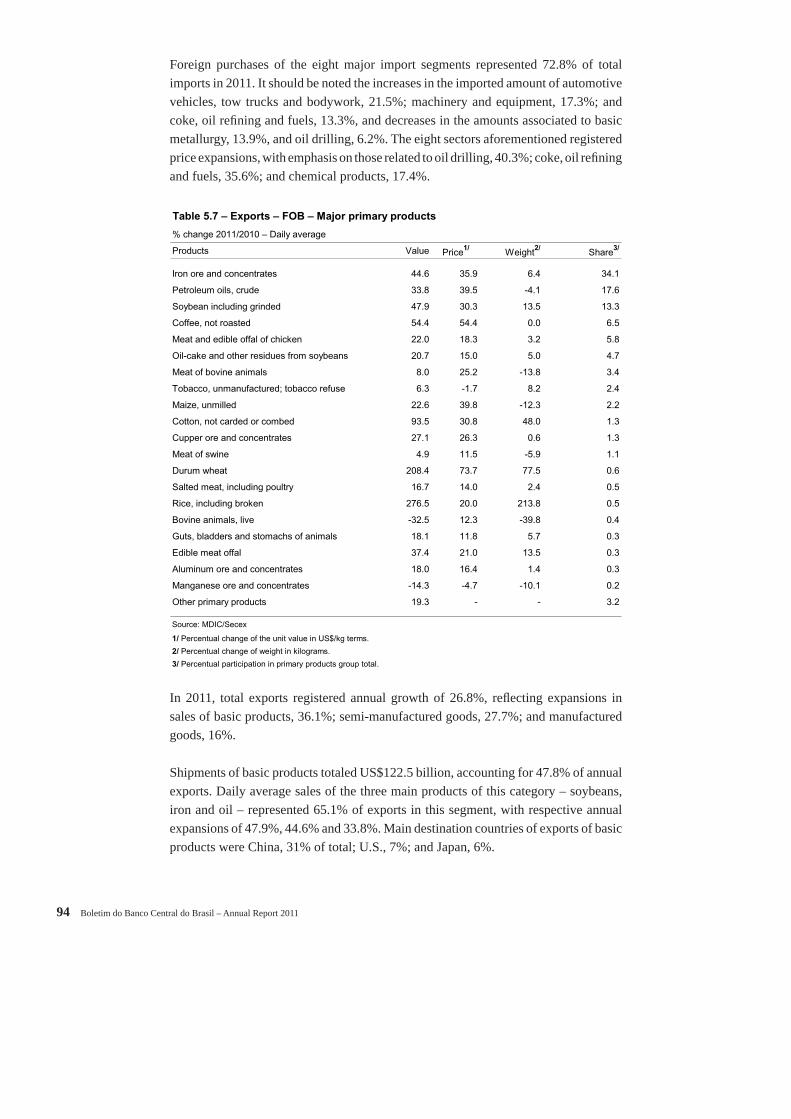
94 Boletim do Banco Central do Brasil – Annual Report 2011
Foreign purchases of the eight major import segments represented 72.8% of total imports in 2011. It should be noted the increases in the imported amount of automotive vehicles, tow trucks and bodywork, 21.5%; machinery and equipment, 17.3%; and coke, oil refi ning and fuels, 13.3%, and decreases in the amounts associated to basic metallurgy, 13.9%, and oil drilling, 6.2%. The eight sectors aforementioned registered price expansions, with emphasis on those related to oil drilling, 40.3%; coke, oil refi ning and fuels, 35.6%; and chemical products, 17.4%.
In 2011, total exports registered annual growth of 26.8%, refl ecting expansions in sales of basic products, 36.1%; semi-manufactured goods, 27.7%; and manufactured goods, 16%.
Shipments of basic products totaled US$122.5 billion, accounting for 47.8% of annual exports. Daily average sales of the three main products of this category – soybeans, iron and oil – represented 65.1% of exports in this segment, with respective annual expansions of 47.9%, 44.6% and 33.8%. Main destination countries of exports of basic products were China, 31% of total; U.S., 7%; and Japan, 6%.
Table 5.7 – Exports – FOB – Major primary products
% change 2011/2010 – Daily average
Products Value Price1/ Weight2/ Share3/
Iron ore and concentrates 44.6 35.9 6.4 34.1
Petroleum oils, crude 33.8 39.5 -4.1 17.6
Soybean including grinded 47.9 30.3 13.5 13.3
Coffee, not roasted 54.4 54.4 0.0 6.5
Meat and edible offal of chicken 22.0 18.3 3.2 5.8
Oil-cake and other residues from soybeans 20.7 15.0 5.0 4.7
Meat of bovine animals 8.0 25.2 -13.8 3.4
Tobacco, unmanufactured; tobacco refuse 6.3 -1.7 8.2 2.4
Maize, unmilled 22.6 39.8 -12.3 2.2
Cotton, not carded or combed 93.5 30.8 48.0 1.3
Cupper ore and concentrates 27.1 26.3 0.6 1.3
Meat of swine 4.9 11.5 -5.9 1.1
Durum wheat 208.4 73.7 77.5 0.6
Salted meat, including poultry 16.7 14.0 2.4 0.5
Rice, including broken 276.5 20.0 213.8 0.5
Bovine animals, live -32.5 12.3 -39.8 0.4
Guts, bladders and stomachs of animals 18.1 11.8 5.7 0.3
Edible meat offal 37.4 21.0 13.5 0.3
Aluminum ore and concentrates 18.0 16.4 1.4 0.3
Manganese ore and concentrates -14.3 -4.7 -10.1 0.2
Other primary products 19.3 - - 3.2
Source: MDIC/Secex
1/ Percentual change of the unit value in US$/kg terms.
2/ Percentual change of weight in kilograms.
3/ Percentual participation in primary products group total.
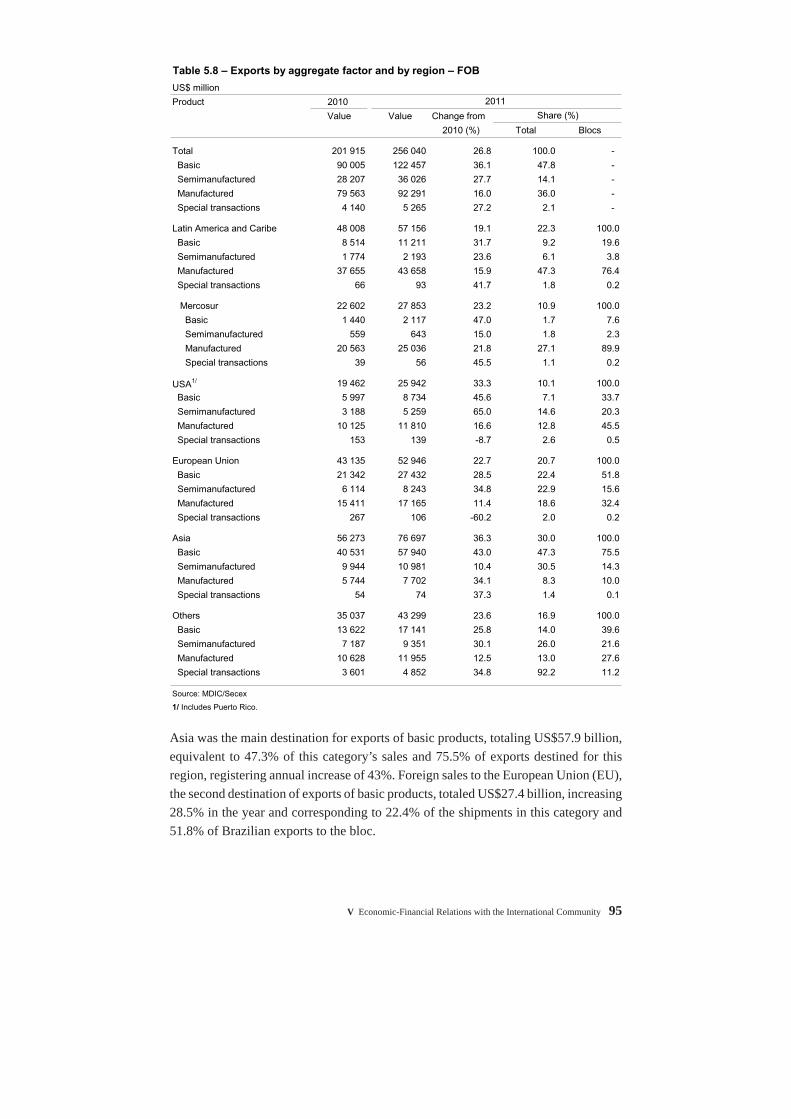
V Economic-Financial Relations with the International Community 95
Asia was the main destination for exports of basic products, totaling US$57.9 billion, equivalent to 47.3% of this category’s sales and 75.5% of exports destined for this region, registering annual increase of 43%. Foreign sales to the European Union (EU), the second destination of exports of basic products, totaled US$27.4 billion, increasing 28.5% in the year and corresponding to 22.4% of the shipments in this category and 51.8% of Brazilian exports to the bloc.
Table 5.8 – Exports by aggregate factor and by region – FOB
US$ million
Product 2010
Value Value Change from
2010 (%) Total Blocs
Total 201 915 256 040 26.8 100.0 -
Basic 90 005 122 457 36.1 47.8 -
Semimanufactured 28 207 36 026 27.7 14.1 -
Manufactured 79 563 92 291 16.0 36.0 -
Special transactions 4 140 5 265 27.2 2.1 -
Latin America and Caribe 48 008 57 156 19.1 22.3 100.0
Basic 8 514 11 211 31.7 9.2 19.6
Semimanufactured 1 774 2 193 23.6 6.1 3.8
Manufactured 37 655 43 658 15.9 47.3 76.4
Special transactions 66 93 41.7 1.8 0.2
Mercosur 22 602 27 853 23.2 10.9 100.0
Basic 1 440 2 117 47.0 1.7 7.6
Semimanufactured 559 643 15.0 1.8 2.3
Manufactured 20 563 25 036 21.8 27.1 89.9
Special transactions 39 56 45.5 1.1 0.2
USA1/ 19 462 25 942 33.3 10.1 100.0
Basic 5 997 8 734 45.6 7.1 33.7
Semimanufactured 3 188 5 259 65.0 14.6 20.3
Manufactured 10 125 11 810 16.6 12.8 45.5
Special transactions 153 139 -8.7 2.6 0.5
European Union 43 135 52 946 22.7 20.7 100.0
Basic 21 342 27 432 28.5 22.4 51.8
Semimanufactured 6 114 8 243 34.8 22.9 15.6
Manufactured 15 411 17 165 11.4 18.6 32.4
Special transactions 267 106 -60.2 2.0 0.2
Asia 56 273 76 697 36.3 30.0 100.0
Basic 40 531 57 940 43.0 47.3 75.5
Semimanufactured 9 944 10 981 10.4 30.5 14.3
Manufactured 5 744 7 702 34.1 8.3 10.0
Special transactions 54 74 37.3 1.4 0.1
Others 35 037 43 299 23.6 16.9 100.0
Basic 13 622 17 141 25.8 14.0 39.6
Semimanufactured 7 187 9 351 30.1 26.0 21.6
Manufactured 10 628 11 955 12.5 13.0 27.6
Special transactions 3 601 4 852 34.8 92.2 11.2
Source: MDIC/Secex
1/ Includes Puerto Rico.
Share (%)
2011
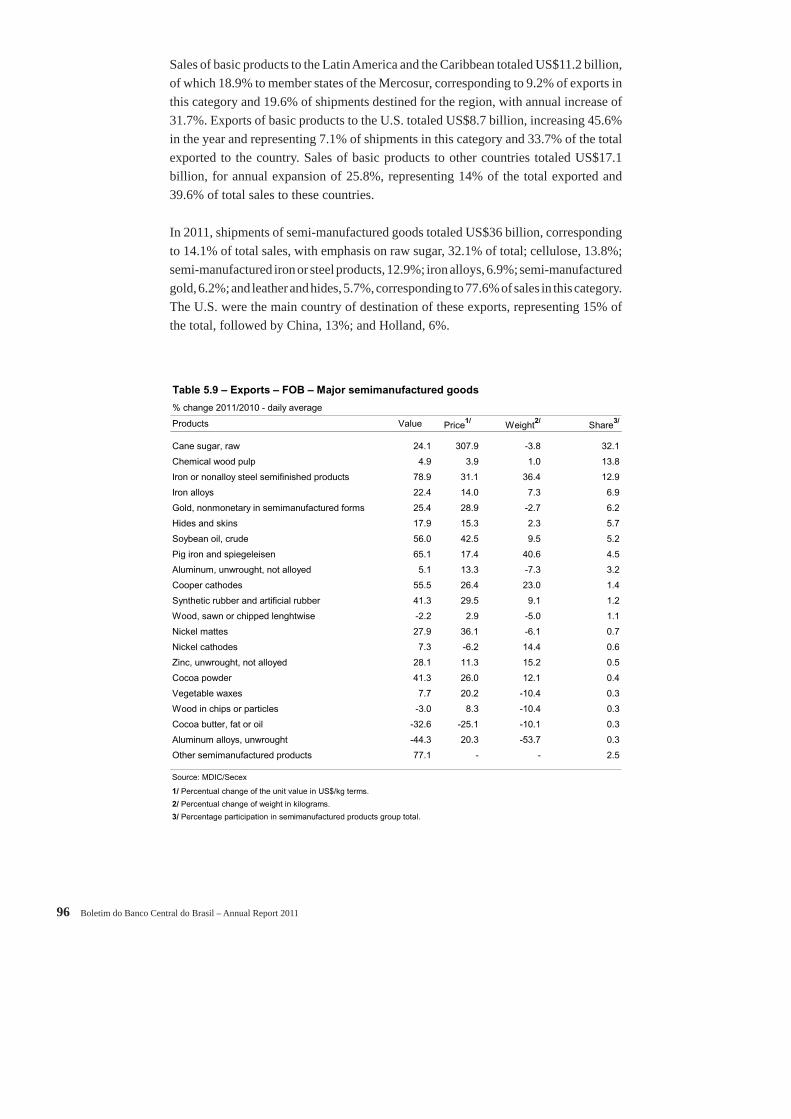
96 Boletim do Banco Central do Brasil – Annual Report 2011
Sales of basic products to the Latin America and the Caribbean totaled US$11.2 billion, of which 18.9% to member states of the Mercosur, corresponding to 9.2% of exports in this category and 19.6% of shipments destined for the region, with annual increase of 31.7%. Exports of basic products to the U.S. totaled US$8.7 billion, increasing 45.6% in the year and representing 7.1% of shipments in this category and 33.7% of the total exported to the country. Sales of basic products to other countries totaled US$17.1 billion, for annual expansion of 25.8%, representing 14% of the total exported and 39.6% of total sales to these countries.
In 2011, shipments of semi-manufactured goods totaled US$36 billion, corresponding to 14.1% of total sales, with emphasis on raw sugar, 32.1% of total; cellulose, 13.8%; semi-manufactured iron or steel products, 12.9%; iron alloys, 6.9%; semi-manufactured gold, 6.2%; and leather and hides, 5.7%, corresponding to 77.6% of sales in this category. The U.S. were the main country of destination of these exports, representing 15% of the total, followed by China, 13%; and Holland, 6%.
Table 5.9 – Exports – FOB – Major semimanufactured goods
% change 2011/2010 - daily average
Products Value Price1/ Weight2/ Share3/
Cane sugar, raw 24.1 307.9 -3.8 32.1
Chemical wood pulp 4.9 3.9 1.0 13.8
Iron or nonalloy steel semifinished products 78.9 31.1 36.4 12.9
Iron alloys 22.4 14.0 7.3 6.9
Gold, nonmonetary in semimanufactured forms 25.4 28.9 -2.7 6.2
Hides and skins 17.9 15.3 2.3 5.7
Soybean oil, crude 56.0 42.5 9.5 5.2
Pig iron and spiegeleisen 65.1 17.4 40.6 4.5
Aluminum, unwrought, not alloyed 5.1 13.3 -7.3 3.2
Cooper cathodes 55.5 26.4 23.0 1.4
Synthetic rubber and artificial rubber 41.3 29.5 9.1 1.2
Wood, sawn or chipped lenghtwise -2.2 2.9 -5.0 1.1
Nickel mattes 27.9 36.1 -6.1 0.7
Nickel cathodes 7.3 -6.2 14.4 0.6
Zinc, unwrought, not alloyed 28.1 11.3 15.2 0.5
Cocoa powder 41.3 26.0 12.1 0.4
Vegetable waxes 7.7 20.2 -10.4 0.3
Wood in chips or particles -3.0 8.3 -10.4 0.3
Cocoa butter, fat or oil -32.6 -25.1 -10.1 0.3
Aluminum alloys, unwrought -44.3 20.3 -53.7 0.3
Other semimanufactured products 77.1 - - 2.5
Source: MDIC/Secex
1/ Percentual change of the unit value in US$/kg terms.
2/ Percentual change of weight in kilograms.
3/ Percentage participation in semimanufactured products group total.
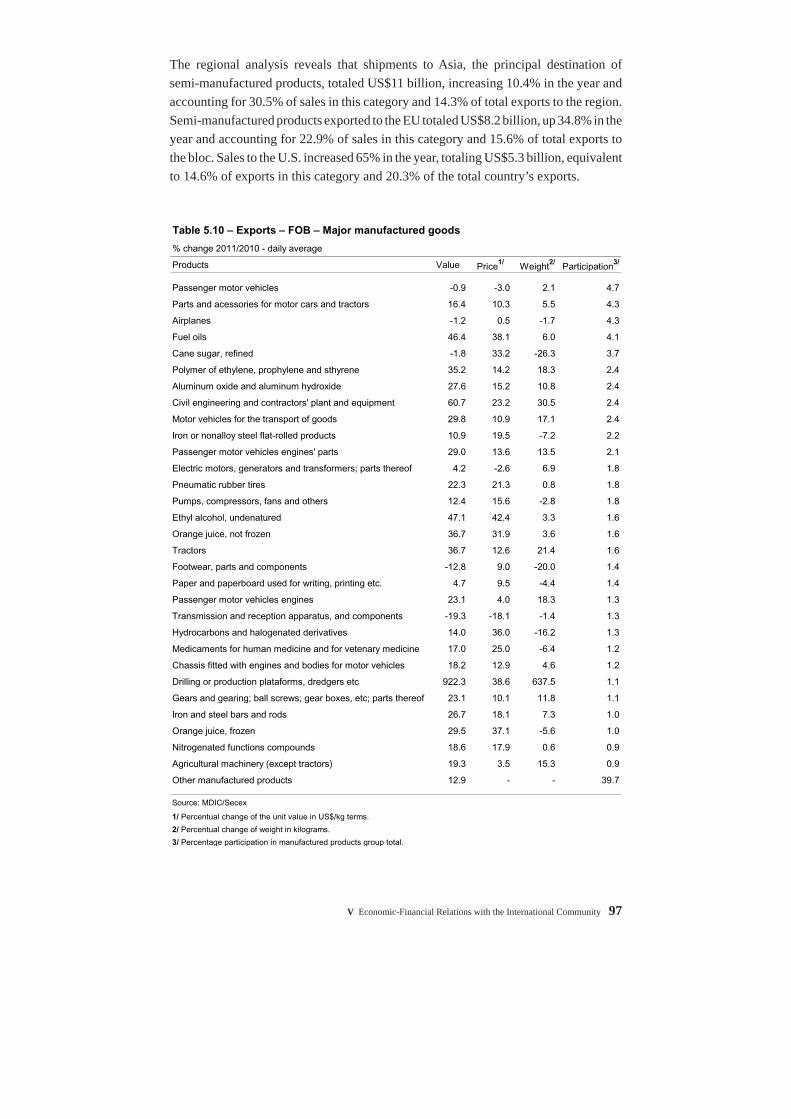
V Economic-Financial Relations with the International Community 97
The regional analysis reveals that shipments to Asia, the principal destination of semi-manufactured products, totaled US$11 billion, increasing 10.4% in the year and accounting for 30.5% of sales in this category and 14.3% of total exports to the region. Semi-manufactured products exported to the EU totaled US$8.2 billion, up 34.8% in the year and accounting for 22.9% of sales in this category and 15.6% of total exports to the bloc. Sales to the U.S. increased 65% in the year, totaling US$5.3 billion, equivalent to 14.6% of exports in this category and 20.3% of the total country’s exports.
Table 5.10 – Exports – FOB – Major manufactured goods
% change 2011/2010 - daily average
Products Value Price1/ Weight2/ Participation3/
Passenger motor vehicles -0.9 -3.0 2.1 4.7
Parts and acessories for motor cars and tractors 16.4 10.3 5.5 4.3
Airplanes -1.2 0.5 -1.7 4.3
Fuel oils 46.4 38.1 6.0 4.1
Cane sugar, refined -1.8 33.2 -26.3 3.7
Polymer of ethylene, prophylene and sthyrene 35.2 14.2 18.3 2.4
Aluminum oxide and aluminum hydroxide 27.6 15.2 10.8 2.4
Civil engineering and contractors' plant and equipment 60.7 23.2 30.5 2.4
Motor vehicles for the transport of goods 29.8 10.9 17.1 2.4
Iron or nonalloy steel flat-rolled products 10.9 19.5 -7.2 2.2
Passenger motor vehicles engines' parts 29.0 13.6 13.5 2.1
Electric motors, generators and transformers; parts thereof 4.2 -2.6 6.9 1.8
Pneumatic rubber tires 22.3 21.3 0.8 1.8
Pumps, compressors, fans and others 12.4 15.6 -2.8 1.8
Ethyl alcohol, undenatured 47.1 42.4 3.3 1.6
Orange juice, not frozen 36.7 31.9 3.6 1.6
Tractors 36.7 12.6 21.4 1.6
Footwear, parts and components -12.8 9.0 -20.0 1.4
Paper and paperboard used for writing, printing etc. 4.7 9.5 -4.4 1.4
Passenger motor vehicles engines 23.1 4.0 18.3 1.3
Transmission and reception apparatus, and components -19.3 -18.1 -1.4 1.3
Hydrocarbons and halogenated derivatives 14.0 36.0 -16.2 1.3
Medicaments for human medicine and for vetenary medicine 17.0 25.0 -6.4 1.2
Chassis fitted with engines and bodies for motor vehicles 18.2 12.9 4.6 1.2
Drilling or production plataforms, dredgers etc 922.3 38.6 637.5 1.1
Gears and gearing; ball screws; gear boxes, etc; parts thereof 23.1 10.1 11.8 1.1
Iron and steel bars and rods 26.7 18.1 7.3 1.0
Orange juice, frozen 29.5 37.1 -5.6 1.0
Nitrogenated functions compounds 18.6 17.9 0.6 0.9
Agricultural machinery (except tractors) 19.3 3.5 15.3 0.9
Other manufactured products 12.9 - - 39.7
Source: MDIC/Secex
1/ Percentual change of the unit value in US$/kg terms.
2/ Percentual change of weight in kilograms.
3/ Percentage participation in manufactured products group total.

98 Boletim do Banco Central do Brasil – Annual Report 2011
Sales of semi-manufactured goods to the Latin America and the Caribbean, of which 29.3% to member states of the Mercosur, totaled US$2.2 billion, increasing 23.6% in the year and representing 6.1% of the total of this category and 3.8% of the total exported to these countries. Shipments of semi-manufactured products to the other countries of this area amounted to US$9.4 billion, with annual increase of 30.1%, corresponding to 26% of sales in this category and 21.6% of the total exported to the group.
Exports of manufactured products totaled US$92.3 billion, corresponding to 36% of the Brazilian exports in 2011 and being concentrated in passenger cars, 4.7% of total; auto parts, 4.3%; airplanes, 4.3%; fuel oil, 4.1%; and refi ned sugar, 3.7%. Sales of manufactured goods were mainly shipped to Argentina, 22% of the total in this category; U.S., 13%; and Netherlands, 5%.
Shipments of manufactured goods to the Latin America and the Caribbean totaled US$43.7 billion, increasing 15.9% in the year, corresponding to 47.3% of sales in this category and 76.4% of total shipments to this region. Exports of manufactured products to the EU reached US$17.2 billion, for annual expansion of 11.4%, representing 18.6% of sales in this category and 32.4% of shipments to the bloc.
Exports of manufactured goods to the U.S. registered annual increase of 16.6%, to US$11.8 billion, corresponding to 12.8% of the total of this category and 45.5% of total sales to the country. Shipments to Asia totaled US$7.7 billion, responding for 8.3% of exports of this category and 10% of Brazilian sales to the region, registering annual increase of 34.1%. S sales of manufactured products to the other countries in the region totaled US$12 billion, with annual expansion of 12.5%, representing 13% of the sales of this category and 27.6% of shipments to these countries.
Special operations – including onboard consumption and re-exports – amounted to US$5.3 billion in 2011, increasing 27.2% in the year and corresponding to 2.1% of total exports.
Exports of industrial products totaled US$153.2 billion in 2011, registering annual increase of 19.3%, corresponding to 59.8% of Brazilian exports, being distributed by low technology industries, 24.1% of total exports; medium-high technology, 16.7%, medium-low technology, 15.3%; and high technology, 3.7%.
Sales of low tech products totaled US$61.8 billion, with annual expansion of 15.8%. Shipments were concentrated in the segment of foodstuffs, beverage and tobacco, with emphasis on raw sugarcane, 18.7% of total; chicken meat, 11.4%; soybean meal, 9.2%; cellulose, 8.1%; and beef, 6.8%. The Netherlands was the main destination of these shipments, with 7.9% of total, followed by China, 7.3%; U.S., 7.3%; Russia, 5.7%; and Japan, 3.7%.

V Economic-Financial Relations with the International Community 99
Exports of medium-high tech products increased 17.9% in the year, adding up US$42.8 billion, with emphasis on those related to cars, 10.2% of total; auto parts, 9.3%; ethylene polymers, propylene and styrene, 5.2%; machinery and earthmoving equipments, 5.1%;
Table 5.11 – Exports by main products and countries – FOB
US$ billionItem 2010
Value Value Change Main countries by destiny (%)over
2000 (%)
Total 201.9 256.0 26.8 China (17%), USA (10%), Argentina (9%)
Primary products 90.0 122.5 36.1 China (31%), USA (7%), Japan (6%)Iron ore and concentrates 28.9 41.8 44.6 China (47%), Japan (11%), Netherlands (5%)Petroleum oils, crude 16.3 21.6 32.6 USA (27%), China (23%), Santa Lucia (14%)Soybeans 11.0 16.3 47.9 China (67%), Spain (7%), Netherlands (4%)Coffee 5.2 8.0 54.4 USA (22%), Germany (21%), Italy (10%)Meat and edible offal of chicken 5.8 7.1 22.0 Japan (19%), Saudi Arabia (17%), Hong Kong (8%)Oil-cake and other residues from soybeans 4.7 5.7 20.7 Netherlands (29%), France (14%), Germany (10%)Meat of bovine animals 3.9 4.2 8.0 Russia (24%), Iran (17%), Egypt (10%)Tobacco, unmanufactured 2.7 2.9 6.4 China (13%), Belgium (12%), USA (10%)Maize, unmilled 2.2 2.7 22.6 Iran (19%), Taiwan (12%), Japan (8%)Cotton, not carded or combed 0.8 1.6 93.5 China (36%), South Korea (13%), Indonesia (13%)Copper ores and concentrates 1.2 1.6 27.1 India (30%), Germany (22%), South Korea (12%)Meat of swine 1.2 1.3 4.9 Russia (30%), Hong Kong (18%), Ukraine (14%)Durum wheat 0.2 0.7 208.4 Algeria (30%), Egypt (8%), Tunisia (8%)Salted meat, including chicken 0.6 0.7 16.7 Netherlands (62%), U.K. (19%), Germany (10%)Primary products, sundry 5.2 6.4 22.5 -
Semimanufactured products 28.2 36.0 27.7 USA (15%), China (13%), Netherlands (6%)Cane sugar, raw 9.3 11.5 24.1 Russia (16%), China (10%), Egypt (8%)Chemical wood pulp 4.8 5.0 4.9 China (26%), Netherlands (21%), USA (19%)Iron or nonalloy steel flat-rolled products 2.6 4.6 78.9 USA (37%), Germany (14%), South Korea (14%)Ferroalloys 2.0 2.5 22.4 Netherlands (26%), China (17%), Japan (14%)Gold, nonmonetary 1.8 2.2 25.4 U.K. (56%), Switzerland (31%), USA (8%)Hides and skins 1.7 2.0 17.9 Italy (22%), China (20%), USA (11%)Soybean oil, crude 1.2 1.9 56.0 China (41%), Algeria (9%), India (9%)Pig iron and spiegeleisen 1.0 1.6 65.1 USA (66%), China (9%), Taiwan (8%)Aluminum, unwrought 1.1 1.2 5.1 Japan (45%), Switzerland (35%), Netherlands (7%)Cooper cathodes 0.3 0.5 55.5 China (35%), Italy (32%), Netherlands (25%)Synthetic rubber and artificial rubber 0.3 0.4 41.3 USA (28%), Argentina (12%), Venezuela (12%)Wood, sawn or chipped 0.4 0.4 - 2.3 USA (22%), France (11%), China (10%)Nickel mattes 0.2 0.2 27.9 Finland (92%), Netherlands (8%), Germany (0%)Nickel cathodes 0.2 0.2 7.3 Japan (37%), USA (32%), South Korea (11%)Semi-manufactured, sundry 1.3 1.6 27.5 -
Manufactured products 79.6 92.3 16.0 Argentina (22%), USA (13%), Netherlands (5%)Passenger motor vehicles 4.4 4.4 - 0.9 Argentina (83%), Mexico (9%), Germany (2%)Parts and accessories for motor carsand tractors 3.4 4.0 16.4 Argentina (56%), USA (10%), Mexico (7%)Airplanes 4.0 3.9 - 1.6 USA (17%), China (16%), Argentina (10%)Fuel Oil 2.6 3.8 46.4 Netherlands (23%), Netherlands Antilles (22%)Cane sugar, refined 3.5 3.4 - 1.8 United Arab Emirates (14%), Ghana (8%)Polymers 1.7 2.2 35.2 Argentina (24%), China (14%), Belgium (13%)Aluminum oxide and aluminum hydroxide 1.7 2.2 27.6 Canada (33%), Norway (24%), Island (12%)Civil engineering and contractors' plantand equipment 1.4 2.2 60.8 USA (21%), Argentina (10%), Peru (7%)Motor vehicles for the transport of goods 1.7 2.2 29.8 Argentina (57%), Chile (10%), Peru (8%)Iron or nonalloy steel flat-rolled products 1.8 2.0 10.9 Argentina (21%), Chile (9%), Colombia (7%)Parts and accessories for motor cars 1.5 1.9 29.1 USA (33%), Germany (17%), Argentina (9%)Electric motors and generators 1.6 1.7 4.2 USA (27%), Germany (11%), Argentina (8%)Pneumatic rubber tires 1.4 1.7 22.3 USA (25%), Argentina (24%), Mexico (7%)Pumps and compressors 1.5 1.7 12.5 USA (21%), Argentina (15%), Germany (13%)Manufactured products, sundry 47.5 55.0 15.9 -
2011

100 Boletim do Banco Central do Brasil – Annual Report 2011
motors, generators and electrical transformers, 4%; and pumps, compressors and fans, 3.9%. The main countries of destination were Argentina, 31.8% of total; U.S., 12.2%; Mexico, 5.4%; Germany, 4.1%; Chile, 4%; and Paraguay, 3.6%.
Exports of medium-low tech products totaled US$39.1 billion, increasing 32.9% in the year and being concentrated in oil and fuels for ships and airplanes (onboard consumption), 12.4% of total; semi-manufactured iron or steel products, 11.9%; fuel oil, 9.7%; iron alloys, 6.4%; gold in semi-manufactured forms, 5.8%; and aluminum oxides and hydroxides, 5.6%. The main countries of destination were U.S., 14.9% of total; Argentina, 9.6%; Netherlands, 8.4%; Singapore, 5.6%; and the United Kingdom, 3.5%.
Sales of high tech products totaled US$9.5 billion, with annual expansion of 2.4%, with emphasis on those related to airplanes, 41.2% of total; transmitter or receiver devices, 12.6%; medicines, 11.9%; nitrogen compounds, 6.3%; and instruments and equipments of measuring and verifi cation, 5.3%. The U.S. were the main country of destination
Table 5.12 – Exports by tecnological intensity – FOB
US$ million
Itemization 2010
Valor Var.%1/ Part.%
Total 201 915 256 040 26.8 100.0
Industrial products 128 355 153 171 19.3 59.8
High tecnology 9 316 9 538 2.4 3.7
Aircraft 4 686 4 662 -0.5 1.8
Telecom, audio and video equipment 1 828 2 192 19.9 0.9
Other 2 802 2 684 -4.2 1.0
Middle-high tecnology 36 299 42 784 17.9 16.7
Road motor vehicles 13 972 16 169 15.7 6.3
Non-electrical machinery Nesoy 9 026 11 349 25.7 4.4
Chemicals products, excluded pharmaceutical 9 439 11 339 20.1 4.4
Other 3 862 3 927 1.7 1.5
Middle-low tecnology 29 417 39 094 32.9 15.3
Fabricated metal products 17 852 23 385 31.0 9.1
Petroleum products and other fuels 6 733 9 369 39.2 3.7
Other 4 833 6 339 31.2 2.5
Low tecnology 53 323 61 756 15.8 24.1
Food, beverages and tobacco 38 318 46 089 20.3 18.0
Wood, paper and pulp 8 738 9 138 4.6 3.6
Textiles, hides and skins and footwear 4 782 4 943 3.4 1.9
Manufactured products Nesoy and recycled products 1 485 1 587 6.8 0.6
Source: MDIC/Secex,
1/ Percentual change in working days.Note: 2010, 251 working days; 2011, 251 working days.
2011
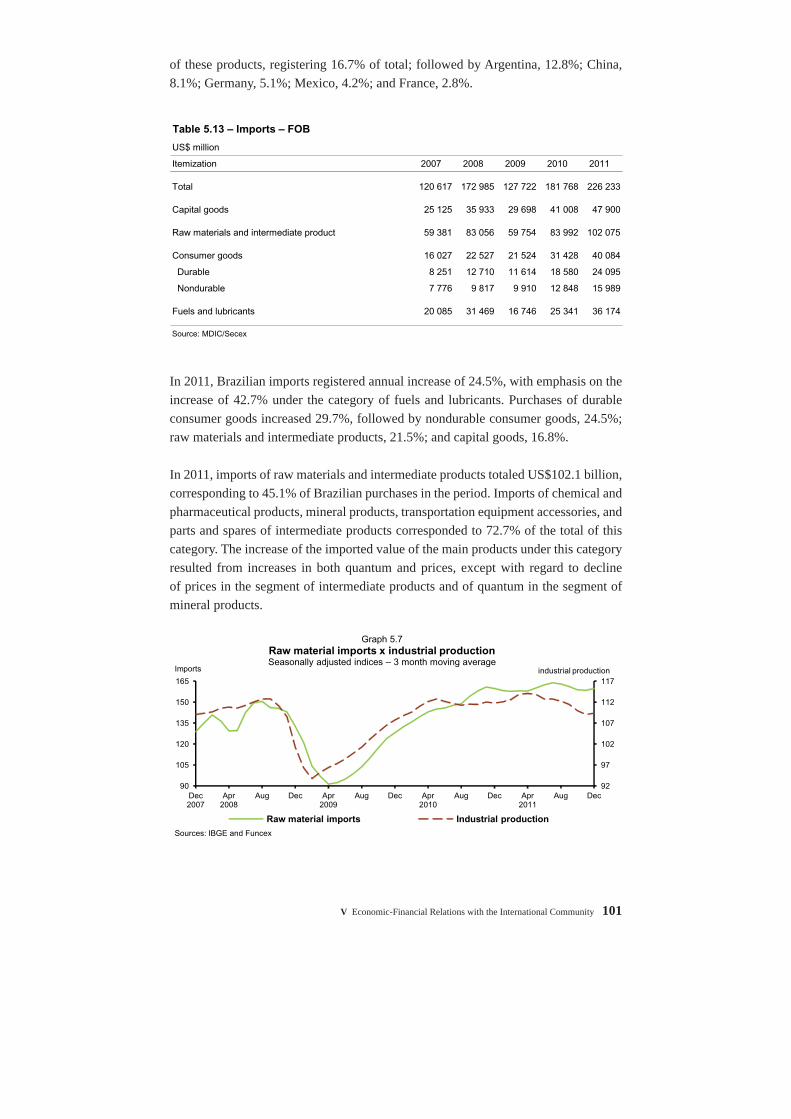
V Economic-Financial Relations with the International Community 101
of these products, registering 16.7% of total; followed by Argentina, 12.8%; China, 8.1%; Germany, 5.1%; Mexico, 4.2%; and France, 2.8%.
In 2011, Brazilian imports registered annual increase of 24.5%, with emphasis on the increase of 42.7% under the category of fuels and lubricants. Purchases of durable consumer goods increased 29.7%, followed by nondurable consumer goods, 24.5%; raw materials and intermediate products, 21.5%; and capital goods, 16.8%.
In 2011, imports of raw materials and intermediate products totaled US$102.1 billion, corresponding to 45.1% of Brazilian purchases in the period. Imports of chemical and pharmaceutical products, mineral products, transportation equipment accessories, and parts and spares of intermediate products corresponded to 72.7% of the total of this category. The increase of the imported value of the main products under this category resulted from increases in both quantum and prices, except with regard to decline of prices in the segment of intermediate products and of quantum in the segment of mineral products.
Table 5.13 – Imports – FOB
US$ million
Itemization 2007 2008 2009 2010 2011
Total 120 617 172 985 127 722 181 768 226 233
Capital goods 25 125 35 933 29 698 41 008 47 900
Raw materials and intermediate product 59 381 83 056 59 754 83 992 102 075
Consumer goods 16 027 22 527 21 524 31 428 40 084
Durable 8 251 12 710 11 614 18 580 24 095
Nondurable 7 776 9 817 9 910 12 848 15 989
Fuels and lubricants 20 085 31 469 16 746 25 341 36 174
Source: MDIC/Secex
92
97
102
107
112
117
90
105
120
135
150
165
Dec 2007
Apr 2008
Aug Dec Apr 2009
Aug Dec Apr 2010
Aug Dec Apr 2011
Aug Dec
industrial productionImports
Sources: IBGE and Funcex
Raw material imports Industrial production
Graph 5.7Raw material imports x industrial productionSeasonally adjusted indices – 3 month moving average

102 Boletim do Banco Central do Brasil – Annual Report 2011
Imports of raw materials and intermediate products coming from Asia, the EU, Latin America and the Caribbean totaled US$28.8 billion, US$22.2 billion and US$18.8 billion, respectively, corresponding to 68.4% of imports under this category. Purchases from other countries increased 40.6% in the year, with emphasis on the increase of 70.2% in those associated to other raw materials for the agricultural sector.
The U.S., China and Argentina were the three main markets of origin, accounting for 35% of imports under this category. Purchases were concentrated under chemical and pharmaceutical products, mineral products, transportation equipment accessories and parts and spares of intermediate products, totaling US$74.3 billion and representing 72.7% of purchases in this category. It should be noted the participation of Mercosur member states as suppliers of food products, with emphasis on the imports from Argentina.
Imports of capital goods totaled US$47.9 billion, corresponding to 21.2% of total imports in 2011. Purchases of industrial machinery, offi ce and scientifi c services machinery and equipment, parts and spares for industrial capital goods and mobile transportation equipment totaled US$36.1 billion, corresponding to 75.4% of imports under this category of use. The growth of imported value of major capital goods subgroups resulted from increases in both quantum and prices, excluding price decreases in the segments of mobile transportation and accessories for industrial machinery, and the drop in the quantum of the other components of capital goods.
Purchases of capital goods coming from Asia, EU and U.S. corresponded to 87.4% of imports in this category, while those from the EU, important supplier of instruments and equipments of measuring and verifi cation, registered annual increase of 21%.
China, U.S. and Germany were the three main countries of origin of imports of capital goods, corresponding to 52% of total. Purchases of industrial machinery, offi ce and scientifi c services machinery and equipment, parts and spares for industrial capital goods and mobile transportation equipments amounted to US$36.1 billion, corresponding to
-30
-16
-2
12
26
40
54
Dec 2007
Mar 2008
Jun Sep Dec Mar 2009
Jun Sep Dec Mar 2010
Jun Sep Dec Mar 2011
Jun Sep Dec
Source: MDIC/Secex1/ From the same period of the previous year.
Capital goods Raw materials
Graph 5.8Brazilian imports by end use category – FOB
Last 12 months (% growth)1/

V Economic-Financial Relations with the International Community 103
75.4% of imports under this category of use. It is worth mentioning the role of China as the main individual supplier of these products to the Brazilian market, except for the subgroup of mobile equipment, which originated mainly from Argentina and the U.S.
Table 5.14 – Imports – FOB – Major products
% change 2011/2010 - daily average
Products Value Price1/ Weight2/ Share3/
Capital goods 16.8 100.0
Industrial machinery 21.4 14.1 6.5 34.2
Machines and apparat. for office and scientific destination 4.8 1.9 2.9 16.1
Capital goods parts and components 27.6 4.0 22.6 14.1
Transportation movable equipment 7.8 -6.0 14.7 10.9
Industrial machinery accessories 6.5 -1.5 8.2 7.0
Other capital goods 23.3 75.9 -29.9 17.7
Raw materials and intermediate goods 21.5 100.0
Chemical and pharmaceutical products 17.8 8.3 8.8 26.5
Mineral products 14.1 19.5 -4.5 20.0
Accessories for transport equipment 20.2 1.9 18.0 13.6
Intermediate products - parts 12.1 -1.5 13.8 12.6
Other raw materials for farming 70.2 29.8 31.1 11.2
Other raw materials and intermediate goods 22.8 16.2 5.7 16.1
Nondurable consumer goods 24.5 100.0
Pharmaceutical products 15.6 17.4 -1.5 31.9
Foodstuffs 25.2 14.7 9.2 30.5
Apparel and other textiles clothing 53.7 22.6 25.3 12.3
Perfumery, cosmetics, or toilet preparations 28.0 10.2 16.1 6.3
Tobacco and beverage 21.0 4.6 15.7 3.9
Other nondurable consumer goods 23.0 11.7 10.1 15.0
Durable consumer goods 29.7 100.0
Passenger motor vehicles 39.6 6.8 30.7 52.9
Machines and appliances for household use 17.1 11.4 5.1 19.4
Articles for personal use or adornment 25.5 10.7 13.4 15.7
Durable consumer goods parts 18.5 -10.2 31.9 4.6
Furniture and other household equipment 12.0 5.8 5.9 4.3
Other durable consumer goods 28.5 2.2 25.6 3.1
Fuels and lubricants 42.7 100.0
Fuels 43.4 36.6 5.0 97.3
Lubricants and electricity 21.2 29.7 -6.5 2.7
Source: MDIC/Secex
1/ Percentage change of the unit value in US$/kg terms.
2/ Percentage change of weight in kilograms.
3/ Percentage participation in each end-use category total.

104 Boletim do Banco Central do Brasil – Annual Report 2011
Table 5.15 – Imports by category of use and by region – FOB
US$ million
Product 2010
Value Value Change from
2010 (%) Category Blocs
Total 181 768 226 233 24.5 100.0 -
Capital goods 41 008 47 900 16.8 21.2 -
Durable consumer goods 18 580 24 095 29.7 10.7 -
Nondurable consumer goods 12 848 15 989 24.5 7.1 -
Fuels and lubricants 25 341 36 174 42.7 16.0 -
Raw material and intermediate goods 83 992 102 075 21.5 45.1 -
Latin America and Caribe 30 919 37 810 22.3 16.7 100.0
Capital goods 2 959 3 339 12.8 7.0 8.8
Durable consumer goods 5 575 6 983 25.2 29.0 18.5
Nondurable consumer goods 3 062 3 834 25.2 24.0 10.1
Fuels and lubricants 3 515 4 846 37.9 13.4 12.8
Raw material and intermediate goods 15 808 18 807 19.0 18.4 49.7
Mercosul 16 620 19 375 16.6 8.6 100.0
Capital goods 2 137 2 451 14.7 5.1 12.7
Durable consumer goods 4 115 4 717 14.6 19.6 24.3
Nondurable consumer goods 2 174 2 720 25.1 17.0 14.0
Fuels and lubricants 343 495 44.5 1.4 2.6
Raw material and intermediate goods 7 851 8 992 14.5 8.8 46.4
USA1/ 27 256 34 225 25.6 15.1 100.0
Capital goods 6 978 8 339 19.5 17.4 24.4
Durable consumer goods 954 1 138 19.3 4.7 3.3
Nondurable consumer goods 1 490 1 764 18.4 11.0 5.2
Fuels and lubricants 4 133 6 225 50.6 17.2 18.2
Raw material and intermediate goods 13 701 16 760 22.3 16.4 49.0
European Union 39 127 46 416 18.6 20.5 100.0
Capital goods 12 067 14 596 21.0 30.5 31.4
Durable consumer goods 2 548 3 392 33.2 14.1 7.3
Nondurable consumer goods 3 702 4 588 23.9 28.7 9.9
Fuels and lubricants 1 497 1 673 11.8 4.6 3.6
Raw material and intermediate goods 19 314 22 166 14.8 21.7 47.8
Asia 56 150 70 076 24.8 31.0 100.0
Capital goods 16 068 18 844 17.3 39.3 26.9
Durable consumer goods 9 184 12 075 31.5 50.1 17.2
Nondurable consumer goods 3 318 4 489 35.3 28.1 6.4
Fuels and lubricants 3 444 5 824 69.1 16.1 8.3
Raw material and intermediate goods 24 137 28 844 19.5 28.3 41.2
Others 28 316 37 706 33.2 16.7 100.0
Capital goods 2 936 2 781 -5.3 5.8 7.4
Durable consumer goods 320 507 58.7 2.1 1.3
Nondurable consumer goods 1 276 1 314 3.0 8.2 3.5
Fuels and lubricants 12 752 17 606 38.1 48.7 46.7
Raw material and intermediate goods 11 032 15 498 40.5 15.2 41.1
Source: MDIC/Secex
1/ Includes Puerto Rico.
2011
Share (%)

V Economic-Financial Relations with the International Community 105
Imports of fuels and lubricants totaled US$36.2 billion, registering annual increase of 42.7% – the highest increase among the categories of use – and representing 16% of the total imports. The main supplier countries were Nigeria, U.S. and India, representing 24%, 18% and 10%, respectively, of the total under this category.
In 2011, purchases of durable consumer goods increased 29.7%, totaling US$24.1 billion and corresponding to 10.7% of total imports. Asia, Latin America and the Caribbean were the chief supplier regions, accounting for 50.1% and 29%, respectively, of imports in this category. Imports from China, Argentina and South Korea represented 47% of total purchases, which were concentrated in passenger cars, with 53% of total.
Purchases of nondurable consumer goods totaled US$16 billion, increasing 24.5% in the year. EU and Asia were the main supplier blocs, with respective participations of 28.7% and 28.1% in the total imports of this category. Individually, Argentina was the main supplier country, with 20% of the total, followed by China, 16%, and the U.S., 8%. Food and pharmaceutical products represented 31.9% and 30.5%, respectively, of total purchases in this category.
The import analysis with regard to technological content reveals that the purchases of industrial products increased 23.4% in 2011, adding up US$196.4 billion and corresponding to 86.8% of total imports. Purchases of medium-high tech products represented 41.8% of total Brazilian imports, followed by medium-low tech goods, 19.3% of total; high tech goods, 17.7%; and low tech goods, 8%.
Purchases of medium-high tech products increased 25.7%, totaling US$94.6 billion and concentrated in cars, 12.6% of total; car parts, 6.7%; potassium chloride, 3.7%; motors, generators and electrical transformers, 3.3%, and bearings and gears, 2.7%. Purchases of this segment mainly came from the U.S., with 15.7% of the total, followed by China, 12.8%; Germany, 10.5%; Argentina, 10%; and Japan, 5.6%.
-50
-25
0
25
50
75
Dec 2007
Mar 2008
Jun Sep Dec Mar 2009
Jun Sep Dec Mar 2010
Jun Sep Dec Mar 2011
Jun Sep Dec
Source: MDIC/Secex1/ From the same period of the previous year.
Consumer goods Fuels and lubricants
Graph 5.9Brazilian imports by end use category – FOB
Last 12 months (% change)1/

106 Boletim do Banco Central do Brasil – Annual Report 2011
Imports of medium-low tech products increased 27.9% in 2011, totaling US$43.7 billion. Purchases were concentrated in fuel oil, with 18.1% of the total; naphtha, 11%; iron or steel laminated products, 5.6%; and copper cathodes, 4.7%. The main blocs of
Table 5.16 – Imports by main produtcs and trade partners – FOB
US$ billionProduto 2010
Value
Value % Chg. Over 2010
Main trade partners - Share (%)
Total 181.8 226.2 24.5 USA (15%), China (14%), Argentina (7%)
Capital goods 41.0 47.9 16.8 China (23%), USA (17%),Germany (12%)Industrial machinery 13.5 16.4 21.4 China (19%),Germany (16%), USA (15%)Machines and office apparatuses 7.4 7.7 4.8 China (28%),USA (24%), Germany (11%)Parts for industrial capital goods 5.3 6.8 27.6 China (30%), USA (14%), Germany (10%)Moving equipment for transportation 4.9 5.2 7.8 Arg. (36%), USA (24%), Germany (8%)Accessories for industrial machinery 3.1 3.3 6.5 China (19%), USA (17%), Germany (12%)Tools 0.9 1.3 43.8 China (34%), USA (18%),Germany (17%)Fixed equipment for transportation 0.6 0.4 -36.6 Japan (20%), USA (19%), China (18%)Parts for agricultural capital goods 0.2 0.3 31.3 USA (49%), Germany (7%),Belgium (7%)Machines and tools 0.1 0.2 50.7 USA(40%),Canada(9%),Netherlands (7%)Other capital goods for agriculture 0.0 0.1 24.2 USA (58%), Canada (15%), China (7%)Transport equipment and traction 0.0 0.0 0.0 France (94%), USA (6%)Sundry 5.0 6.3 25.6 China (37%), USA (11%), Germany (7%)
Nondurable consumer goods 12.8 16.0 24.5 Arg. (20%), China (16%), USA (8%)Pharmaceutical products 4.4 5.1 15.6 USA(20%),Germany (20%),Switzerl.(13%)Foodstuffs 3.9 4.9 25.2 Arg. (60%), Uruguay (14%), Paraguay (6%)Apparel and other textil clothing 1.3 2.0 53.7 China (60%), Bangladesh (6%), India (6%)Beauty products 0.8 1.0 28.0 USA (23%), Arg. (22%), France (13%)Beverage and tobacco 0.5 0.6 21.0 U. Kingdon(18%), Chile (14%), Arg. (12%)Sundry 1.9 2.4 23.0 China (37%), Vietnan (8%),Taiwan (7%)
Durable consumer goods 18.6 24.1 29.7 China (19%), Arg. (16%), S. Korea (12%)Passenger vehicles 9.1 12.7 39.6 Arg. (34%), S. Korea (19%), Mexico (16%)Machines and domestic apparatuses 4.0 4.7 17.1 China (52%), S. Korea (24%),Taiwan (6%)Articles of adornment 3.0 3.8 25.5 China (32%), USA (15%), Germany (7%)Durables - Parts and spares 0.9 1.1 18.5 China (46%), USA (8%), H. Kong (7%)Furniture and other house equipments 0.9 1.0 12.0 China (57%), USA (13%), Germany (4%)Household appliances 0.4 0.5 33.8 China (59%), USA (8%), India (5%)Sundry 0.2 0.2 16.6 China (47%), Germany (29%)
Fuels and lubricants 25.3 36.2 42.7 Nigeria (24%), USA (18%), India (10%)Fuels 24.5 35.2 43.4 Nigeria (23%), USA (16%), India (10%)Lubricants 0.8 0.9 22.0 USA (47%), France (11%), Italy (9%)Electricity 0.0 0.0 -0.1 Venezuela (100%)
Raw material and intermediate products 84.0 102.1 21.5 USA (15%), China (12%), Arg. (8%)Chemical and pharmaceutical products 23.0 27.0 17.8 USA (27%), China (11%), Germany (10%)Mineral products 17.9 20.5 14.1 Chile (15%), Algeria (12%), China (10%)Accessories for transportation equipment 11.6 13.9 20.2 USA (19%), Arg. (9%), Japan (9%)Intermediate products - parts and spares 11.4 12.8 12.1 China (25%), USA (12%), S. Korea (8%)Other raw materials for farming 6.7 11.4 70.2 Russia (16%), Belarus (12%), USA (11%)Inedible farm products 6.4 7.8 22.1 China (23%), Indonesia (13%), USA (13%)Intermediate foodstuffs 3.3 3.8 15.6 Arg. (60%), Uruguay (14%),Paraguay (6%)Building materials 2.1 2.9 36.1 China (33%), USA (9%), Germany (6%)Transport equipment - parts and spares 1.0 1.2 20.9 USA (73%), Germany (9%), France (4%)Animal feed 0.3 0.4 33.2 Paraguay (35%), China (17%), Arg. (11%)Sundry 0.2 0.2 9.0 USA (19%), Mexico (9%), Colombia (8%)
2011
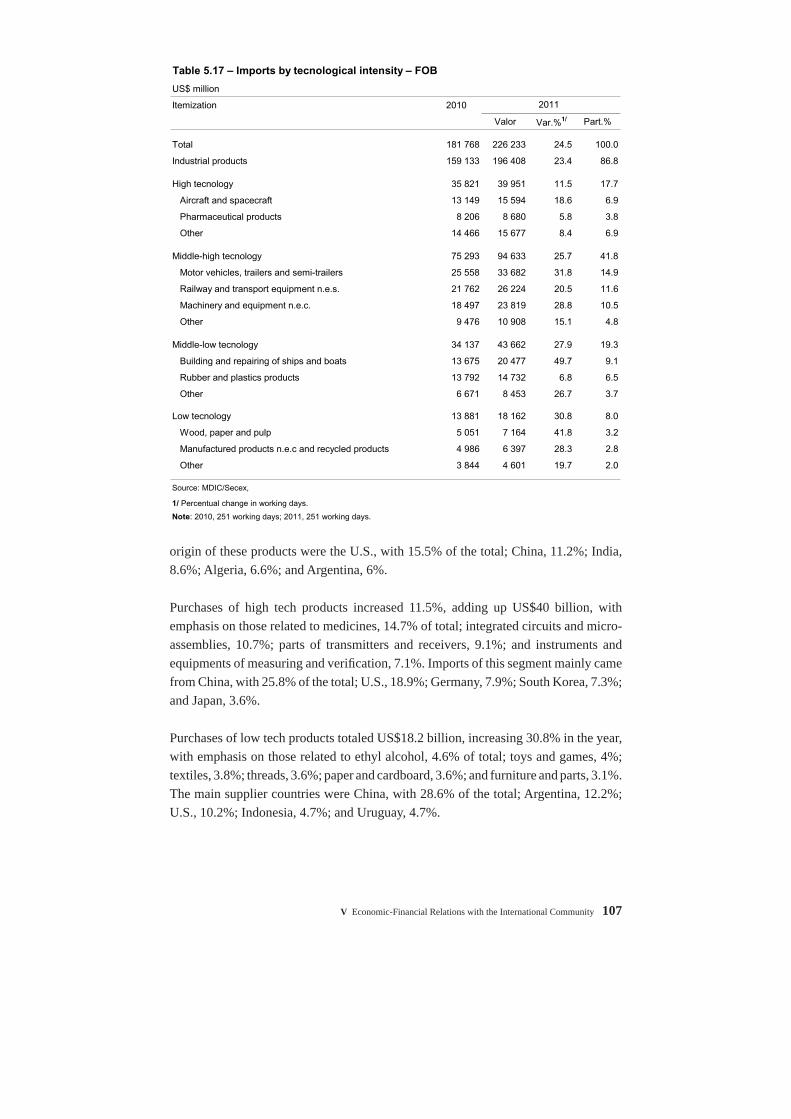
V Economic-Financial Relations with the International Community 107
origin of these products were the U.S., with 15.5% of the total; China, 11.2%; India, 8.6%; Algeria, 6.6%; and Argentina, 6%.
Purchases of high tech products increased 11.5%, adding up US$40 billion, with emphasis on those related to medicines, 14.7% of total; integrated circuits and micro-assemblies, 10.7%; parts of transmitters and receivers, 9.1%; and instruments and equipments of measuring and verifi cation, 7.1%. Imports of this segment mainly came from China, with 25.8% of the total; U.S., 18.9%; Germany, 7.9%; South Korea, 7.3%; and Japan, 3.6%.
Purchases of low tech products totaled US$18.2 billion, increasing 30.8% in the year, with emphasis on those related to ethyl alcohol, 4.6% of total; toys and games, 4%; textiles, 3.8%; threads, 3.6%; paper and cardboard, 3.6%; and furniture and parts, 3.1%. The main supplier countries were China, with 28.6% of the total; Argentina, 12.2%; U.S., 10.2%; Indonesia, 4.7%; and Uruguay, 4.7%.
Table 5.17 – Imports by tecnological intensity – FOB
US$ million
Itemization 2010
Valor Var.%1/ Part.%
Total 181 768 226 233 24.5 100.0
Industrial products 159 133 196 408 23.4 86.8
High tecnology 35 821 39 951 11.5 17.7
Aircraft and spacecraft 13 149 15 594 18.6 6.9
Pharmaceutical products 8 206 8 680 5.8 3.8
Other 14 466 15 677 8.4 6.9
Middle-high tecnology 75 293 94 633 25.7 41.8
Motor vehicles, trailers and semi-trailers 25 558 33 682 31.8 14.9
Railway and transport equipment n.e.s. 21 762 26 224 20.5 11.6
Machinery and equipment n.e.c. 18 497 23 819 28.8 10.5
Other 9 476 10 908 15.1 4.8
Middle-low tecnology 34 137 43 662 27.9 19.3
Building and repairing of ships and boats 13 675 20 477 49.7 9.1
Rubber and plastics products 13 792 14 732 6.8 6.5
Other 6 671 8 453 26.7 3.7
Low tecnology 13 881 18 162 30.8 8.0
Wood, paper and pulp 5 051 7 164 41.8 3.2
Manufactured products n.e.c and recycled products 4 986 6 397 28.3 2.8
Other 3 844 4 601 19.7 2.0
Source: MDIC/Secex,
1/ Percentual change in working days.
Note: 2010, 251 working days; 2011, 251 working days.
2011

108 Boletim do Banco Central do Brasil – Annual Report 2011
The trade balance in the group of industrial products registered a defi cit of US$43.2 billion, with annual increase of 40.5%. The segments of medium-high technology, high technology and medium-low technology turned in respective defi cits of US$51.8 billion, US$30.4 billion and US$4.6 billion, and the segment of low technological intensity, a surplus of US$43.6 billion.
Trade exchange
In 2011, the trade fl ow registered annual increase of 25.7%, hitting a record of US$482.3 billion.
The trade exchange with Asian countries totaled US$146.8 billion. The annual increase of 30.6% refl ected expansions of 36.3% under exports and 24.8% under imports. The bilateral trade with China represented 52.5% of the fl ow with the region, followed by Japan, 11.8%, and South Korea, 10.1%.
The trade fl ow with the EU reached US$99.4 billion, up 20.8% in the year. Exports to the EU totaled US$52.9 billion, while imports totaled US$46.4 billion, registering respective annual increases of 22.7% and 18.6%. The three major partners in the region were Germany, accounting for 24.4% of the fl ow with the bloc; Netherlands, 16%; and Italy, 11.7%.
The trade exchange with countries of the Latin America and the Caribbean reached US$94.9 billion. The expansion of 20.3%, compared to the previous year, resulted from increases of 19.1% under exports and 22.2% under imports, reaching US$57.2 billion and US$37.8 billion, respectively. The main partners in the region were Argentina, with 41.7% of total; Chile, 10.5%, and Mexico, 9.6%.
The trade fl ow with the U.S. totaled US$60.2 billion, up 28.8% in the year. Exports totaled US$25.9 billion, and imports, US$34.2 billion, registering respective annual increases of 33.3% and 25.6%.

V Economic-Financial Relations with the International Community 109
Services
The services account turned in a defi cit of US$38 billion in 2011, as against US$30.8 billion in 2010, an expansion mainly explained by the performance of international
Table 5.18 – Brazilian trade by region – FOB
US$ million
Itemization
Exports Imports Balance Exports Imports Balance
Total 201 915 181 768 20 147 256 040 226 233 29 807
EFTA1/ 2 464 3 585 -1 121 2 861 3 657 -796
Latin America and Caribe 48 008 30 919 17 089 57 156 37 787 19 368
Mercosur 22 602 16 620 5 981 27 853 19 376 8 477
Argentina 18 523 14 435 4 088 22 709 16 906 5 803
Paraguay 2 548 611 1 937 2 969 716 2 253
Uruguay 1 531 1 574 -43 2 175 1 754 421
Chile 4 258 4 182 76 5 418 4 550 868
Mexico 3 715 3 859 -143 3 960 5 130 -1 170
Others 17 433 6 259 11 174 19 925 8 732 11 194
Canada 2 321 2 714 -393 3 130 3 556 -426
European Union 43 135 39 127 4 007 52 946 46 418 6 528
Germany 8 138 12 554 -4 415 9 039 15 213 -6 174
Belgium/Luxembourg 3 579 1 811 1 768 4 043 1 904 2 139
Spain 3 867 2 773 1 094 4 675 3 299 1 376
France 3 576 4 801 -1 225 4 319 5 462 -1 143
Italy 4 235 4 838 -603 5 441 6 223 -782
Netherlands 10 228 1 773 8 454 13 640 2 265 11 374
United Kingdom 4 628 3 155 1 473 5 202 3 376 1 827
Others 4 883 7 422 -2 539 6 587 8 676 -2 089
Eastern Europe 4 788 3 023 1 764 5 174 5 175 -2
Asia2/ 56 273 56 150 122 76 697 70 078 6 619
Japan 7 141 6 986 155 9 473 7 872 1 601
China 30 786 25 595 5 190 44 315 32 790 11 525
Korea, Republic of 3 760 8 422 -4 662 4 694 10 097 -5 403
Others 14 586 15 147 -561 18 216 19 319 -1 104
USA3/ 19 462 27 256 -7 793 25 942 34 228 -8 286
Others 25 464 18 993 6 471 32 134 25 333 6 801
Memo:
Nafta 25 499 33 828 -8 329 33 032 42 914 -9 882
Opec 15 934 13 330 2 605 18 459 18 455 4
Source: MDIC/Secex
1/ Iceland, Liechtenstein, Norway and Switzerland.
2/ Excludes the Middle East.
3/ Includes Puerto Rico.
2010 2011

110 Boletim do Banco Central do Brasil – Annual Report 2011
travel, equipment rental, transportation, computer and information services, and royalty and license fees.
Net expenditures on international travel totaled US$14.7 billion, resulting from respective increases of 29.5% and 15% under Brazilian’s expenditures abroad and foreigners’ expenditures in the country, reaching US$21.3 billion and US$6.6 billion, respectively. Credit card expenditures by Brazilian tourists and foreign tourists totaled US$12.7 billion and US$4.9 billion, respectively, corresponding to 59.6% and 75.4% of total. It should be noted that, in March 2011, the IOF rate on Brazilian expenditures abroad paid with credit cards increased by 4 p.p., to 6.38%.
Table 5.19 – Services
US$ million
Itemization
1st half 2nd half Year 1st half 2nd half Year
Total -13 531 -17 304 -30 835 -17 993 -19 959 -37 952
Credit 14 765 16 834 31 599 18 179 20 030 38 209
Debit 28 296 34 138 62 434 36 172 39 989 76 161
Transportation -2 980 -3 427 -6 407 -3 558 -4 776 -8 334
Credit 2 306 2 626 4 931 3 025 2 794 5 819
Debit 5 286 6 053 11 339 6 583 7 570 14 153
Travel -4 213 -6 505 -10 718 -6 969 -7 741 -14 709
Credit 2 834 2 867 5 702 3 273 3 282 6 555
Debit 7 047 9 372 16 420 10 242 11 023 21 264
Insurance -565 -547 -1 113 -654 -559 -1 212
Credit 213 203 416 148 357 505
Debit 778 751 1 529 802 915 1 717
Financial services 135 259 394 284 575 858
Credit 976 1 096 2 073 1 161 1 500 2 662
Debit 841 837 1 679 878 926 1 804
Computer and information -1 628 -1 667 -3 296 -2 107 -1 692 -3 800
Credit 126 84 210 106 130 236
Debit 1 754 1 752 3 505 2 213 1 822 4 036
Royalties and licence fees -1 196 -1 257 -2 453 -1 252 -1 458 -2 710
Credit 192 205 397 282 309 591
Debit 1 388 1 462 2 850 1 534 1 767 3 301
Operational leasing -6 188 -7 563 -13 752 -7 833 -8 853 -16 686
Credit 27 27 54 34 35 69
Debit 6 216 7 590 13 806 7 867 8 888 16 755
Government services -824 -564 -1 388 -639 -772 -1 411
Credit 618 909 1 527 872 902 1 774
Debit 1 442 1 473 2 915 1 511 1 675 3 185
Other 3 929 3 969 7 898 4 735 5 319 10 054
Credit 7 473 8 816 16 289 9 278 10 722 19 999
Debit 3 544 4 848 8 391 4 543 5 403 9 946
2010 2011
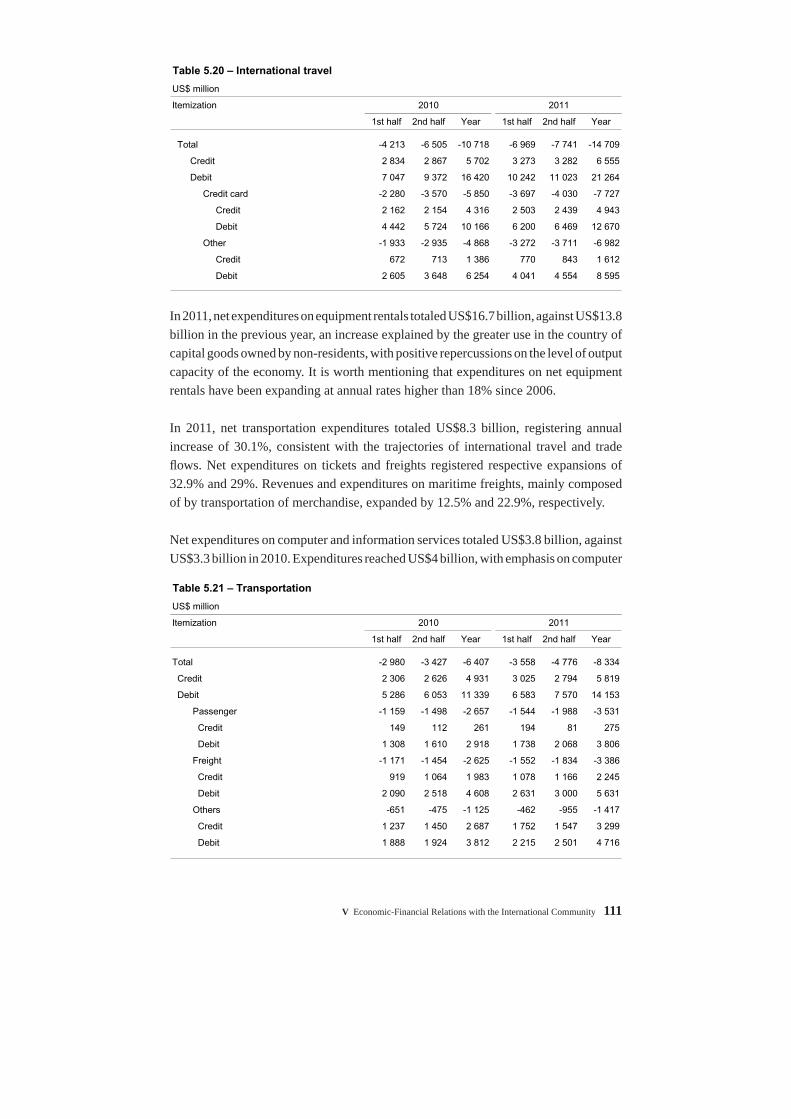
V Economic-Financial Relations with the International Community 111
In 2011, net expenditures on equipment rentals totaled US$16.7 billion, against US$13.8 billion in the previous year, an increase explained by the greater use in the country of capital goods owned by non-residents, with positive repercussions on the level of output capacity of the economy. It is worth mentioning that expenditures on net equipment rentals have been expanding at annual rates higher than 18% since 2006.
In 2011, net transportation expenditures totaled US$8.3 billion, registering annual increase of 30.1%, consistent with the trajectories of international travel and trade fl ows. Net expenditures on tickets and freights registered respective expansions of 32.9% and 29%. Revenues and expenditures on maritime freights, mainly composed of by transportation of merchandise, expanded by 12.5% and 22.9%, respectively.
Net expenditures on computer and information services totaled US$3.8 billion, against US$3.3 billion in 2010. Expenditures reached US$4 billion, with emphasis on computer
Table 5.20 – International travel
US$ million
Itemization 2010 2011
1st half 2nd half Year 1st half 2nd half Year
Total -4 213 -6 505 -10 718 -6 969 -7 741 -14 709
Credit 2 834 2 867 5 702 3 273 3 282 6 555
Debit 7 047 9 372 16 420 10 242 11 023 21 264
Credit card -2 280 -3 570 -5 850 -3 697 -4 030 -7 727
Credit 2 162 2 154 4 316 2 503 2 439 4 943
Debit 4 442 5 724 10 166 6 200 6 469 12 670
Other -1 933 -2 935 -4 868 -3 272 -3 711 -6 982
Credit 672 713 1 386 770 843 1 612
Debit 2 605 3 648 6 254 4 041 4 554 8 595
Table 5.21 – Transportation
US$ million
Itemization 2010 2011
1st half 2nd half Year 1st half 2nd half Year
Total -2 980 -3 427 -6 407 -3 558 -4 776 -8 334
Credit 2 306 2 626 4 931 3 025 2 794 5 819
Debit 5 286 6 053 11 339 6 583 7 570 14 153
Passenger -1 159 -1 498 -2 657 -1 544 -1 988 -3 531
Credit 149 112 261 194 81 275
Debit 1 308 1 610 2 918 1 738 2 068 3 806
Freight -1 171 -1 454 -2 625 -1 552 -1 834 -3 386
Credit 919 1 064 1 983 1 078 1 166 2 245
Debit 2 090 2 518 4 608 2 631 3 000 5 631
Others -651 -475 -1 125 -462 -955 -1 417
Credit 1 237 1 450 2 687 1 752 1 547 3 299
Debit 1 888 1 924 3 812 2 215 2 501 4 716

112 Boletim do Banco Central do Brasil – Annual Report 2011
services, US$3.9 billion, while revenues totaled US$236 million, for respective annual increases of 15.1% and 12.5%.
In 2011, net payments of royalties and license fees abroad, including services associated with the segments of technology, copyrights, licenses and trademark, patents and franchise, among others, reached US$2.7 billion, up 10.5% in the year.
In 2011, net revenues on fi nancial services, including banking services, commissions, guarantees and brokerage, totaled US$858 million, against US$394 million in the previous year.
Insurance services registered net outlays of US$1.2 billion, against US$1.1 billion in 2010. Expenditures reached US$1.7 billion, and revenues, US$505 million, for respective annual increases of 12.3% and 21.3%.
In 2011, business, professional and technical services registered net revenues of US$10.7 billion, up 27.2% in the year. This trajectory mainly refl ected respective net revenues of US$5.4 billion, US$2.8 billion and US$2.2 billion under the segments of administrative
Table 5.22 – Business, technical and professional services
US$ million
Itemization 2010 2011
1st half 2nd half Year 1st half 2nd half Year
Total 4 177 4 236 8 413 5 051 5 648 10 699
Credit 6 753 7 876 14 629 8 448 9 899 18 346
Mail orders 4 1 5 1 1 2
Self-employed remuneration 1 436 1 424 2 860 1 462 1 669 3 131
Administrative services and real-state rental 2 393 2 872 5 265 3 228 3 434 6 662
Participation in fairs and exhibits 22 25 47 35 38 73
Professional athletes transfer fees 108 124 232 96 142 239
Publicity 176 158 334 235 286 521
Architectural, engineering and other 2 547 3 192 5 738 3 311 3 962 7 273
Technical and economic project implementation
services 68 81 149 79 366 445
Debit 2 575 3 641 6 216 3 397 4 250 7 647
Mail orders 27 40 67 36 58 94
Self-employed remuneration 260 406 666 432 520 953
Administrative services and real-state rental 398 668 1 066 560 710 1 269
Participation in fairs and exhibits 55 45 100 38 40 78
Professional athletes transfer fees 6 27 33 32 21 53
Publicity 182 239 420 280 397 678
Architectural, engineering and other 1 647 2 213 3 860 2 013 2 503 4 516
Technical and economic project implementation
services 0 3 3 6 1 7

V Economic-Financial Relations with the International Community 113
services and rental properties, architectural and engineering, and autonomous workers’ fees, registering annual variations of 28.5%, 46.8% and -0.7%, respectively.
Income
In 2011, the defi cit of the income account totaled US$47.3 billion defi cit, 19.8% up from the previous year.
Net interest expenditures totaled US$9.7 billion, refl ecting increases of 39.2% under revenues and 15.7% under expenditures. The signifi cant upward trend for revenues has been consistent with the upward trend of international reserves, the main asset component that generates revenues.
Net remittances of profi ts and dividends hit a record level of US$38.2 billion. The annual expansion of 25.7% is consistent with the increase of the stock of foreign direct investments in the country and with the devaluation registered by the average exchange rate in 2011, which stimulates the remittance of profi ts earned in domestic currency. Remittances of profi ts and dividends surpassed net expenditures on interests for the sixth consecutive year, refl ecting the predominance of stocks of risky capital – foreign direct investments and stocks – over the stock of foreign indebtedness in the composition of foreign liabilities.
In 2011, the account salaries and wages registered net infl ows of US$567 million, 13.7% down from the previous year. Earnings brought from abroad by employees resident in the country reached US$665 million, increasing 17.7% in the year.
Maintaining the trend observed since 2006, net remittances of income abroad was strongly infl uenced by net remittances of income on direct investments, which totaled US$29.6 billion, up 16.2% in the year. Net remittance of profi ts and dividends, in this category, reached US$27.4 billion, up 16.1%. Net remittances of interests on intercompany loans increased 17.7%, to US$2.3 billion.
Net remittances of income on portfolio investments totaled US$12.2 billion, increasing 22.1% as compared to 2010. This trasjectory mainly refl ected the performance of net remittances of dividends related to stocks listed on Brazilian stock exchanges and notes negotiated in foreign stock exchanges, which totaled US$10.8 billion, up 59% in the period. The account of interests on fi xed-income securities registered net expenditures of US$1.4 billion, against US$3.2 billion in 2010. Net remittances of income on other investments, including interests on supplier credits, loans, deposits, and other assets and liabilities, totaled US$6.1 billion, up 34.8% according to the same comparison basis.

114 Boletim do Banco Central do Brasil – Annual Report 2011
Gross remittances of profi ts and dividends reached a record of US$40 billion in 2011, highlighting the increases of 19.2% under foreign direct investment gross expenditures and 59% under portfolio investment gross expenditures. Gross outfl ows related to Foreign Direct Investments (FDI) reached US$29.2 billion, against US$24.5 billion in the previous year.
Table 5.23 – Income
US$ million
Itemization
1st half 2nd half Year 1st half 2nd half Year
Total -19 731 -19 755 -39 486 -22 577 -24 742 -47 319
Credit 3 124 4 282 7 405 5 758 4 994 10 753
Debit 22 855 24 037 46 892 28 335 29 736 58 072
Compensation of employees 266 232 498 272 294 567
Credit 295 270 565 316 349 665
Debit 29 38 66 43 55 98
Investment income -19 997 -19 987 -39 985 -22 850 -25 036 -47 886
Credit 2 829 4 012 6 841 5 443 4 646 10 088
Debit 22 826 23 999 46 826 28 292 29 682 57 974
Direct investment income -12 011 -13 493 -25 504 -13 965 -15 666 -29 631
Credit 385 695 1 080 873 1 212 2 085
Debit 12 397 14 188 26 584 14 838 16 878 31 716
Profits and dividends -11 206 -12 385 -23 591 -13 041 -14 338 -27 379
Credit 296 592 888 690 1 113 1 804
Debit 11 502 12 977 24 479 13 731 15 452 29 183
Interests on intercompany loans - 805 -1 108 -1 913 - 924 -1 328 -2 252
Credit 90 103 193 183 99 282
Debit 895 1 211 2 106 1 107 1 426 2 533
Portfolio investment income -5 723 -4 241 -9 964 -5 566 -6 598 -12 164
Credit 2 045 2 883 4 928 4 039 3 007 7 046
Debit 7 767 7 124 14 892 9 605 9 605 19 210
Income on equity (dividends) -3 761 -3 023 -6 784 -5 727 -5 060 -10 787
Credit 0 0 1 0 0 1
Debit 3 762 3 023 6 785 5 727 5 061 10 788
Income on debt securities (interests) -1 961 -1 219 -3 180 161 -1 538 -1 377
Credit 2 044 2 883 4 927 4 039 3 007 7 046
Debit 4 006 4 101 8 107 3 878 4 545 8 423
Other investments income1/ -2 264 -2 253 -4 517 -3 319 -2 772 -6 091
Credit 399 434 833 530 427 956
Debit 2 662 2 687 5 350 3 849 3 198 7 047
Memo:
Interest -5 030 -4 580 -9 610 -4 082 -5 638 -9 719
Credit 2 533 3 419 5 952 4 752 3 532 8 284
Debit 7 563 7 999 15 562 8 834 9 169 18 003
Profits and dividends -14 967 -15 408 -30 375 -18 768 -19 398 -38 166
Credit 296 593 889 690 1 114 1 804
Debit 15 263 16 000 31 263 19 458 20 512 39 971
1/ Includes interests on loans, trade credits, deposits and other assets and liabilities.
2010 2011

V Economic-Financial Relations with the International Community 115
Quadro 5.24 – Current transfers
US$ million
Itemization
1st half 2nd half Year 1st half 2nd half Year
Total 1 563 1 339 2 902 1 576 1 408 2 984
Credit 2 395 2 379 4 775 2 481 2 435 4 915
Debit 833 1 040 1 873 905 1 027 1 931
General government transfers -123 -62 -185 -149 -155 -305
Credit 19 112 132 27 64 92
Debit 142 175 317 177 220 397
Other sectors transfers 1 686 1 401 3 087 1 725 1 564 3 289
Credit 2 376 2 267 4 643 2 453 2 370 4 824
Debit 691 866 1 557 728 807 1 535
Workers' remittances 696 638 1 334 654 668 1 322
Credit 1 087 1 102 2 189 1 058 1 076 2 134
United States 320 314 634 293 310 603
Japan 203 206 409 194 211 406
Remaining countries 564 582 1 146 570 555 1 125
Debit 391 464 855 404 408 811
Other transfers 990 763 1 753 1 071 896 1 967
Credit 1 289 1 165 2 454 1 395 1 295 2 690
Debit 299 402 701 324 399 723
2010 2011
Companies of the industrial and the service sectors were responsible for the respective gross remittances of 55.2% and 42% of profi ts and dividends, with emphasis on the sectors of automotive vehicles, tow trucks and bodywork assembly, with 19.1% of total; fi nancial services, 10.8%; telecommunications, 8.4%; chemical products, 7.8%; beverages, 6.7%; and electricity and gas, 6.7%. Remittances related to the six aforementioned sectors totaled US$17.4 billion, or 59.5% of gross remittances of profi ts and dividends on FDI in 2011.
Current unilateral transfers
Current unilateral transfers remained stable in 2011, with total net infl ows adding up US$3 billion, mostly composed of by income for the maintenance of residents, totaling US$1.3 billion, for annual decrease of 0.9%. Gross income for the maintenance of residents accounted for 44.3% of total current unilateral transfer infl ows, mainly from the U.S., with 28.3% of total, and Japan, 19%.
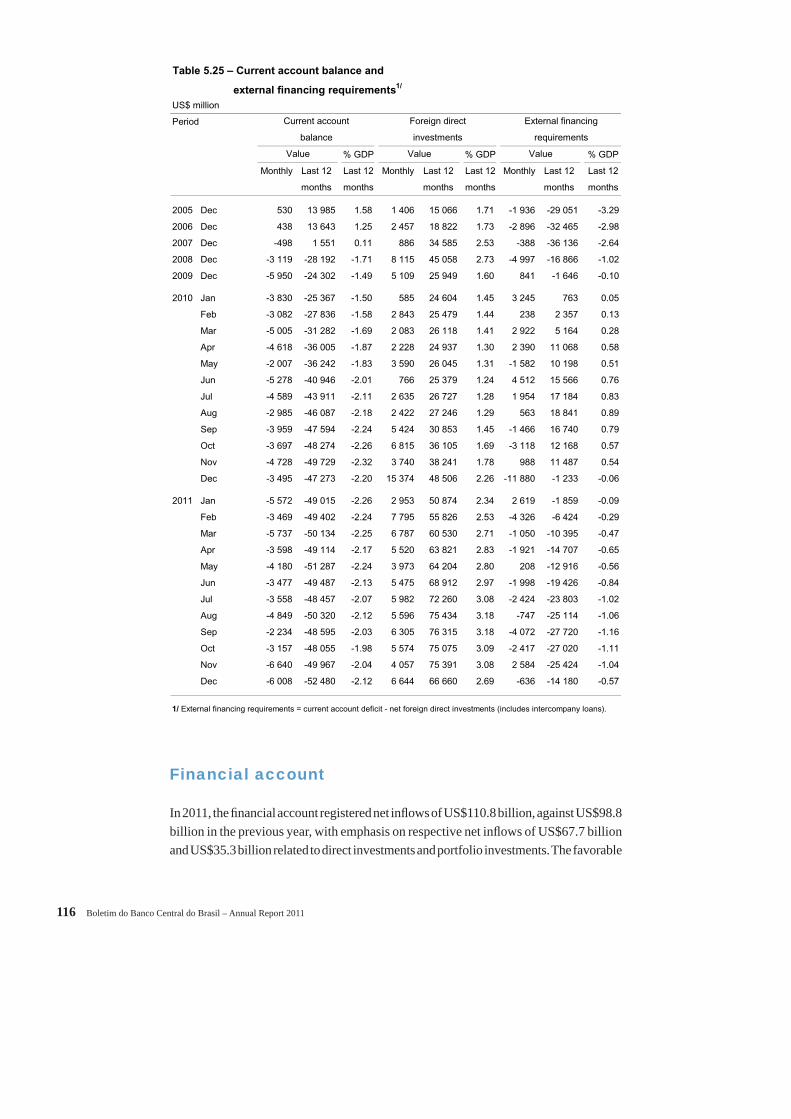
116 Boletim do Banco Central do Brasil – Annual Report 2011
Financial account
In 2011, the fi nancial account registered net infl ows of US$110.8 billion, against US$98.8 billion in the previous year, with emphasis on respective net infl ows of US$67.7 billion and US$35.3 billion related to direct investments and portfolio investments. The favorable
Table 5.25 – Current account balance and
external financing requirements1/
US$ million
Period
% GDP % GDP % GDP
Monthly Last 12 Last 12 Monthly Last 12 Last 12 Monthly Last 12 Last 12
months months months months months months
2005 Dec 530 13 985 1.58 1 406 15 066 1.71 -1 936 -29 051 -3.29
2006 Dec 438 13 643 1.25 2 457 18 822 1.73 -2 896 -32 465 -2.98
2007 Dec -498 1 551 0.11 886 34 585 2.53 -388 -36 136 -2.64
2008 Dec -3 119 -28 192 -1.71 8 115 45 058 2.73 -4 997 -16 866 -1.02
2009 Dec -5 950 -24 302 -1.49 5 109 25 949 1.60 841 -1 646 -0.10
2010 Jan -3 830 -25 367 -1.50 585 24 604 1.45 3 245 763 0.05
Feb -3 082 -27 836 -1.58 2 843 25 479 1.44 238 2 357 0.13
Mar -5 005 -31 282 -1.69 2 083 26 118 1.41 2 922 5 164 0.28
Apr -4 618 -36 005 -1.87 2 228 24 937 1.30 2 390 11 068 0.58
May -2 007 -36 242 -1.83 3 590 26 045 1.31 -1 582 10 198 0.51
Jun -5 278 -40 946 -2.01 766 25 379 1.24 4 512 15 566 0.76
Jul -4 589 -43 911 -2.11 2 635 26 727 1.28 1 954 17 184 0.83
Aug -2 985 -46 087 -2.18 2 422 27 246 1.29 563 18 841 0.89
Sep -3 959 -47 594 -2.24 5 424 30 853 1.45 -1 466 16 740 0.79
Oct -3 697 -48 274 -2.26 6 815 36 105 1.69 -3 118 12 168 0.57
Nov -4 728 -49 729 -2.32 3 740 38 241 1.78 988 11 487 0.54
Dec -3 495 -47 273 -2.20 15 374 48 506 2.26 -11 880 -1 233 -0.06
2011 Jan -5 572 -49 015 -2.26 2 953 50 874 2.34 2 619 -1 859 -0.09
Feb -3 469 -49 402 -2.24 7 795 55 826 2.53 -4 326 -6 424 -0.29
Mar -5 737 -50 134 -2.25 6 787 60 530 2.71 -1 050 -10 395 -0.47
Apr -3 598 -49 114 -2.17 5 520 63 821 2.83 -1 921 -14 707 -0.65
May -4 180 -51 287 -2.24 3 973 64 204 2.80 208 -12 916 -0.56
Jun -3 477 -49 487 -2.13 5 475 68 912 2.97 -1 998 -19 426 -0.84
Jul -3 558 -48 457 -2.07 5 982 72 260 3.08 -2 424 -23 803 -1.02
Aug -4 849 -50 320 -2.12 5 596 75 434 3.18 -747 -25 114 -1.06
Sep -2 234 -48 595 -2.03 6 305 76 315 3.18 -4 072 -27 720 -1.16
Oct -3 157 -48 055 -1.98 5 574 75 075 3.09 -2 417 -27 020 -1.11
Nov -6 640 -49 967 -2.04 4 057 75 391 3.08 2 584 -25 424 -1.04
Dec -6 008 -52 480 -2.12 6 644 66 660 2.69 -636 -14 180 -0.57
1/ External financing requirements = current account deficit - net foreign direct investments (includes intercompany loans).
Value Value Value
Current account Foreign direct External financing
balance investments requirements

V Economic-Financial Relations with the International Community 117
foreign accounts fi nancing conditions were also expressed in the rollover rates, i.e., the ratio between the new disbursements and amortizations, which hit a record of 460% in the year, as compared to 243% in 2010.
FDI global fl ows totaled US$1.5 trillion in 2011, according to the Unctad preliminary estimates, rising 17% in the year and remaining at a level higher than in the triennium ended in 2007. Investments in new projects, the so-called Greenfi eld investments, impacted by uncertainties surrounding global fi nancial markets, especially those related
Table 5.26 – Private sector medium and long-term rollover rates1/
US$ million
Itemization
1st half 2nd half Year 1st half 2nd half Year
Total 220% 268% 243% 495% 421% 460%
Credit 16 210 17 517 33 726 34 863 26 648 61 512
Debit 7 366 6 530 13 896 7 041 6 332 13 372
Private sector 202% 234% 217% 731% 362% 512%
Credit 14 131 15 051 29 181 31 354 22 577 53 931
Debit 6 998 6 445 13 443 4 291 6 242 10 533
Private sector - bonds, notes and commercial
papers 191% 265% 223% 837% 247% 508%
Credit 9 995 10 408 20 403 17 081 6 382 23 463
Debit 5 230 3 921 9 151 2 040 2 579 4 619
Private sector - direct loans 234% 184% 205% 634% 442% 515%
Credit 4 136 4 643 8 779 14 273 16 195 30 468
Debit 1 768 2 524 4 292 2 252 3 663 5 915
Public sector2/ 565% 2 887% 1 002% 128% 4 517% 267%
Credit 2 079 2 466 4 545 3 509 4 071 7 580
Debit 368 85 453 2 749 90 2 839
Public sector - bonds, notes and commercial
papers 487% - 1 280% 0% - 1 086%
Credit 1 000 1 627 2 627 0 1 995 1 995
Debit 205 0 205 184 0 184
Public sector - direct loans 663% 983% 773% 137% 2 304% 210%
Credit 1 079 839 1 918 3 509 2 077 5 586
Debit 163 85 248 2 566 90 2 656
Memo:
Bonds, notes and commercial papers 202% 307% 246% 768% 325% 530%
Credit 10 995 12 034 23 029 17 081 8 377 25 458
Debit 5 435 3 921 9 356 2 223 2 579 4 802
Direct loans 270% 210% 236% 369% 487% 421%
Credit 5 215 5 482 10 697 17 783 18 272 36 054
Debit 1 931 2 610 4 541 4 817 3 753 8 570
1/ Rollover rate refers to the ratio between disbursements and amortizations.
Does not comprise trade financing.
2/ Excludes sovereign bonds. Includes financial public sector and others from public sector.
2010 2011
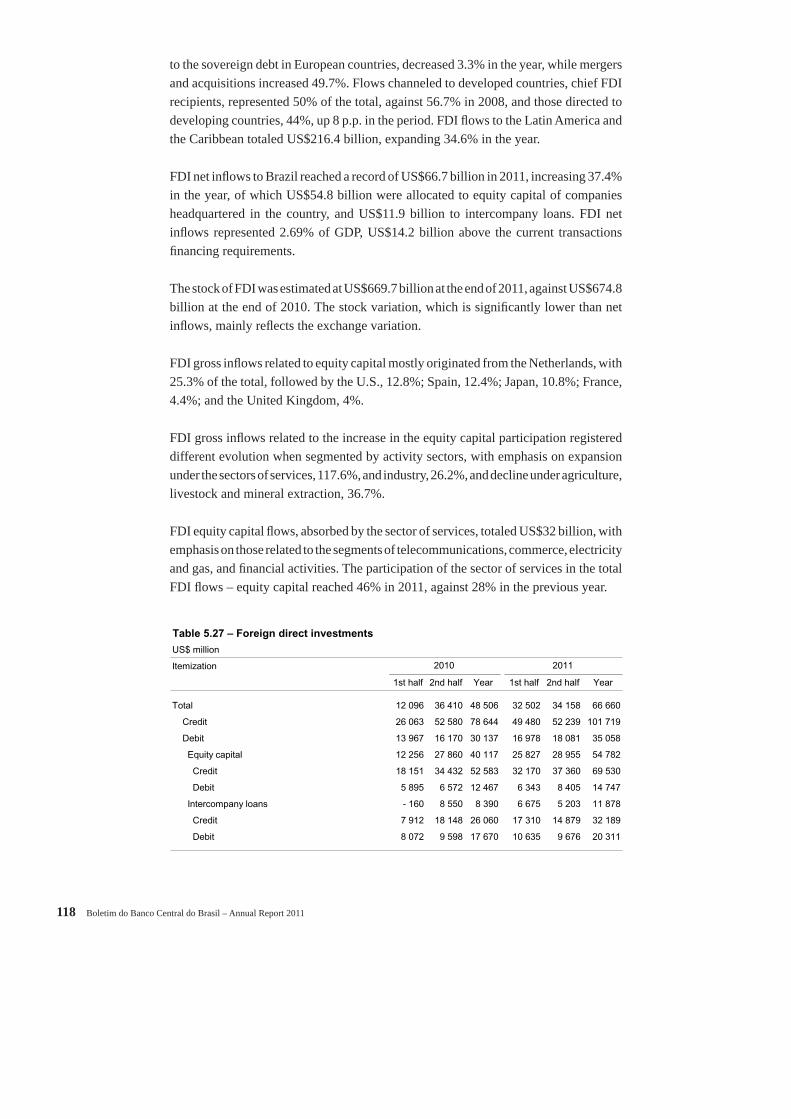
118 Boletim do Banco Central do Brasil – Annual Report 2011
to the sovereign debt in European countries, decreased 3.3% in the year, while mergers and acquisitions increased 49.7%. Flows channeled to developed countries, chief FDI recipients, represented 50% of the total, against 56.7% in 2008, and those directed to developing countries, 44%, up 8 p.p. in the period. FDI fl ows to the Latin America and the Caribbean totaled US$216.4 billion, expanding 34.6% in the year.
FDI net infl ows to Brazil reached a record of US$66.7 billion in 2011, increasing 37.4% in the year, of which US$54.8 billion were allocated to equity capital of companies headquartered in the country, and US$11.9 billion to intercompany loans. FDI net infl ows represented 2.69% of GDP, US$14.2 billion above the current transactions fi nancing requirements.
The stock of FDI was estimated at US$669.7 billion at the end of 2011, against US$674.8 billion at the end of 2010. The stock variation, which is signifi cantly lower than net infl ows, mainly refl ects the exchange variation.
FDI gross infl ows related to equity capital mostly originated from the Netherlands, with 25.3% of the total, followed by the U.S., 12.8%; Spain, 12.4%; Japan, 10.8%; France, 4.4%; and the United Kingdom, 4%.
FDI gross infl ows related to the increase in the equity capital participation registered different evolution when segmented by activity sectors, with emphasis on expansion under the sectors of services, 117.6%, and industry, 26.2%, and decline under agriculture, livestock and mineral extraction, 36.7%.
FDI equity capital fl ows, absorbed by the sector of services, totaled US$32 billion, with emphasis on those related to the segments of telecommunications, commerce, electricity and gas, and fi nancial activities. The participation of the sector of services in the total FDI fl ows – equity capital reached 46% in 2011, against 28% in the previous year.
Table 5.27 – Foreign direct investments
US$ million
Itemization
1st half 2nd half Year 1st half 2nd half Year
Total 12 096 36 410 48 506 32 502 34 158 66 660
Credit 26 063 52 580 78 644 49 480 52 239 101 719
Debit 13 967 16 170 30 137 16 978 18 081 35 058
Equity capital 12 256 27 860 40 117 25 827 28 955 54 782
Credit 18 151 34 432 52 583 32 170 37 360 69 530
Debit 5 895 6 572 12 467 6 343 8 405 14 747
Intercompany loans - 160 8 550 8 390 6 675 5 203 11 878
Credit 7 912 18 148 26 060 17 310 14 879 32 189
Debit 8 072 9 598 17 670 10 635 9 676 20 311
2010 2011

V Economic-Financial Relations with the International Community 119
The industrial sector accounted for US$26.8 billion of 2011 fl ows, or 38.6% of total, against 40.5% in 2010, with emphasis on metallic products, beverages and foodstuffs.
Flows channeled to the agriculture, livestock and mineral extraction industry totaled US$10.3 billion, 14.8% of the total, against 30.9% in 2011, with emphasis on infl ows of oil and natural gas extraction, and metallic minerals extraction.
Foreign portfolio investment infl ows totaled US$18.5 billion in 2911, against US$67.8 billion in the previous year, consequent upon a decline of 26.7% under infl ows and expansion of 2.4% under outfl ows.
Net infl ows of foreign investments in stocks of Brazilian companies totaled US$7.2 billion in the year, decreasing by US$30.5 billion as compared to the record of 2010, with annual decrease of 25.3% under incomes and increase of 2.1% under expenditures, totaling US$85 billion and US$77.8 billion, respectively.
In 2011, foreign investments on fi xed-income securities registered net disbursements of US$11.3 billion, against the record of US$30.1 billion occurred in 2010. This reduction partially refl ected the impact of the introduction of the 6% IOF rate, at the end of 2010, on fi xed-income foreign capital negotiated in the country. Net amortizations of foreign investments on fi xed-income securities traded in the country totaled US$61 million in 2011, against net disbursements of US$14.6 billion in the previous year.
In 2011, net amortizations of sovereign bonds negotiated abroad totaled US$4.1 billion, including the original schedule of debt maturities and early debt redemptions, highlighting the policy aimed to improve the indebtedness temporary profi le and the creation of conditions to establish a longer and complete yield curve. Total gross infl ows added up US$1.7 billion, consequent upon the reopening of Global 21, US$550 million, and Global 41, US$1.1 billion. The National Treasury, following the policy aimed to improve the public sector indebtedness temporary profi le, carried out anticipated redemptions of US$2.9 billion in the period, of which US$2.3 billion related to face value and US$573 million to the premium of these operations.
Notes and commercial papers totaled net infl ows of US$21.7 billion in 2011, against US$13.7 billion in the previous year, contributing to the increase of short-term and medium-term rollover rates from 246%, in 2010, to 530%, in 2011. Short-term and medium-term infl ows were concentrated in the fi rst quarter of 2011, impacted by the IOF rate of 6%, effective as of April, for infl ows with maturity lower than 720 days. Placements of short-term securities totaled US$6.3 billion in net amortizations, against net infl ows of US$5.4 billion registered in 2010. It should be noted that, since the introduction of the new IOF rate, short-term operations were no longer registered in the year.

120 Boletim do Banco Central do Brasil – Annual Report 2011
Table 5.28 – Foreign direct investments inflows – Equity capital
Distribution by immediate investing country
US$ million
Itemization 2010 2011
1st half 2nd half Year 1st half 2nd half Year
Total 18 151 34 432 52 583 32 170 37 361 69 530
Netherlands 1 819 4 883 6 702 9 637 7 945 17 582
United States 2 547 3 597 6 144 4 992 3 918 8 910
Spain 384 1 140 1 524 5 184 3 409 8 593
Japan 440 2 062 2 502 2 337 5 200 7 536
France 1 957 1 522 3 479 648 2 437 3 086
United Kingdom 344 686 1 030 1 499 1 251 2 749
Hong Kong 7 76 83 18 2 058 2 077
Luxembourg 889 7 930 8 819 790 1 077 1 867
Canada 136 615 751 813 975 1 789
Austria 24 3 396 3 420 1 442 66 1 508
Switzerland 4 916 1 529 6 445 487 707 1 194
British Virgin Islands 131 927 1 059 444 694 1 138
Germany 179 359 538 398 727 1 125
Australia 215 341 556 357 722 1 079
South Korea 171 874 1 045 319 757 1 075
Norway 802 737 1 540 234 840 1 073
Chile 278 663 941 239 591 830
Bermudas 723 131 854 117 682 800
Cayman Islands 158 248 406 349 263 612
Portugal 236 967 1 203 216 275 491
Sweden 210 177 387 96 371 467
Italy 119 181 300 149 309 457
Belgium 41 33 75 150 270 420
Uruguay 180 95 275 121 180 301
Mexico 93 51 143 227 70 297
Singapore 19 19 38 27 225 252
Panama 99 33 132 32 216 248
Ireland 3 12 15 14 170 184
China 366 29 395 137 42 179
Denmark 232 64 295 98 53 151
Peru 24 65 89 77 64 141
Cyprus 3 38 41 45 89 134
Angola 8 7 15 99 29 128
Mauritius 70 266 336 8 111 120
Argentina 30 71 100 30 67 97
Bahamas 53 56 109 37 59 96
Ukraine 0 1 1 0 81 81
Israel 2 60 63 37 32 69
Finland 1 42 42 55 2 56
Other countries 243 446 689 210 326 536
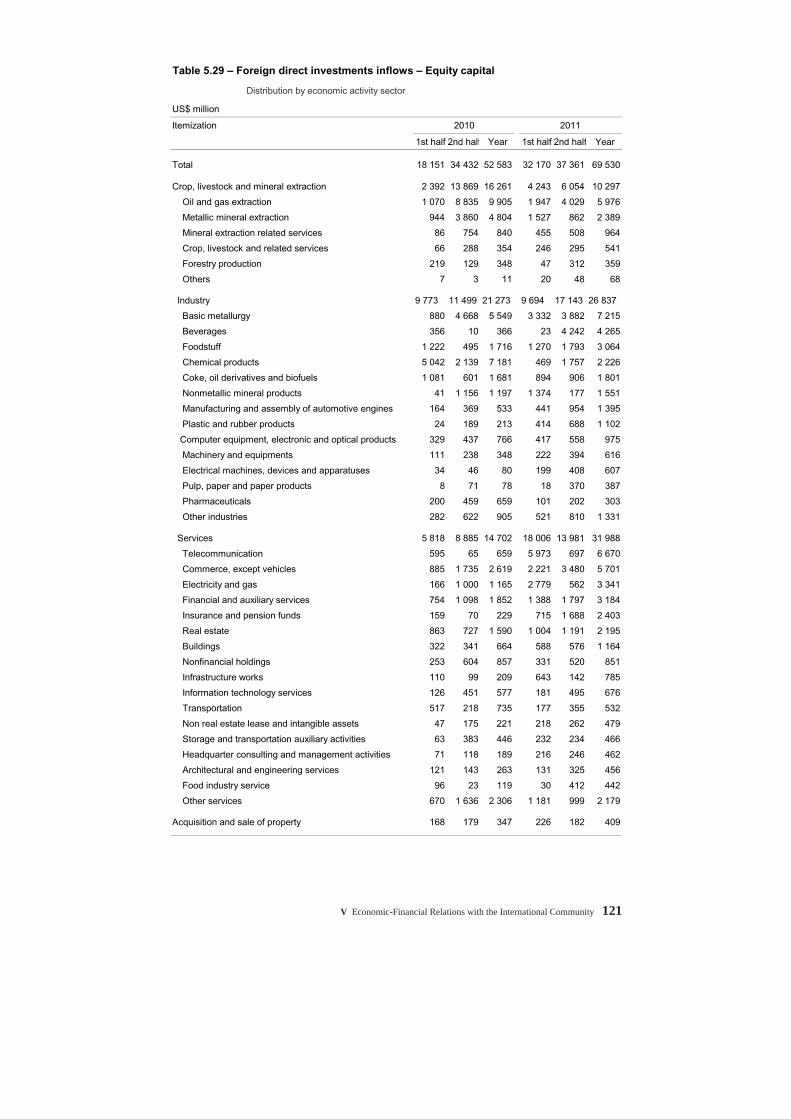
V Economic-Financial Relations with the International Community 121
Table 5.29 – Foreign direct investments inflows – Equity capital
Distribution by economic activity sector
US$ million
Itemization 2010 2011
1st half 2nd half Year 1st half 2nd half Year
Total 18 151 34 432 52 583 32 170 37 361 69 530
Crop, livestock and mineral extraction 2 392 13 869 16 261 4 243 6 054 10 297
Oil and gas extraction 1 070 8 835 9 905 1 947 4 029 5 976
Metallic mineral extraction 944 3 860 4 804 1 527 862 2 389
Mineral extraction related services 86 754 840 455 508 964
Crop, livestock and related services 66 288 354 246 295 541
Forestry production 219 129 348 47 312 359
Others 7 3 11 20 48 68
Industry 9 773 11 499 21 273 9 694 17 143 26 837
Basic metallurgy 880 4 668 5 549 3 332 3 882 7 215
Beverages 356 10 366 23 4 242 4 265
Foodstuff 1 222 495 1 716 1 270 1 793 3 064
Chemical products 5 042 2 139 7 181 469 1 757 2 226
Coke, oil derivatives and biofuels 1 081 601 1 681 894 906 1 801
Nonmetallic mineral products 41 1 156 1 197 1 374 177 1 551
Manufacturing and assembly of automotive engines 164 369 533 441 954 1 395
Plastic and rubber products 24 189 213 414 688 1 102
Computer equipment, electronic and optical products 329 437 766 417 558 975
Machinery and equipments 111 238 348 222 394 616
Electrical machines, devices and apparatuses 34 46 80 199 408 607
Pulp, paper and paper products 8 71 78 18 370 387
Pharmaceuticals 200 459 659 101 202 303
Other industries 282 622 905 521 810 1 331
Services 5 818 8 885 14 702 18 006 13 981 31 988
Telecommunication 595 65 659 5 973 697 6 670
Commerce, except vehicles 885 1 735 2 619 2 221 3 480 5 701
Electricity and gas 166 1 000 1 165 2 779 562 3 341
Financial and auxiliary services 754 1 098 1 852 1 388 1 797 3 184
Insurance and pension funds 159 70 229 715 1 688 2 403
Real estate 863 727 1 590 1 004 1 191 2 195
Buildings 322 341 664 588 576 1 164
Nonfinancial holdings 253 604 857 331 520 851
Infrastructure works 110 99 209 643 142 785
Information technology services 126 451 577 181 495 676
Transportation 517 218 735 177 355 532
Non real estate lease and intangible assets 47 175 221 218 262 479
Storage and transportation auxiliary activities 63 383 446 232 234 466
Headquarter consulting and management activities 71 118 189 216 246 462
Architectural and engineering services 121 143 263 131 325 456
Food industry service 96 23 119 30 412 442
Other services 670 1 636 2 306 1 181 999 2 179
Acquisition and sale of property 168 179 347 226 182 409

122 Boletim do Banco Central do Brasil – Annual Report 2011
Other foreign investments, including direct loans with banks and international organizations, commercial credits and deposits, totaled net revenues of US$46.8 billion in 2011, up 12.7% from the previous year. Net infl ows of short-term commercial suppliers’ credits totaled US$22.6 billion, while those related to long-term loans of other
Table 5.30 – Portfolio investments – Liabilities
US$ million
Itemization
1st half 2nd half Year 1st half 2nd half Year
Total 23 166 44 629 67 795 12 435 6 018 18 453
Credit 75 536 99 573 175 109 73 349 55 022 128 371
Debit 52 371 54 943 107 314 60 915 49 004 109 919
Equities 9 733 27 937 37 671 3 865 3 309 7 174
Credit 46 911 66 933 113 844 46 556 38 416 84 972
Debit 37 177 38 996 76 173 42 691 35 107 77 798
Issued in the country 6 178 18 264 24 442 3 046 3 199 6 245
Credit 43 263 56 856 100 118 45 538 38 160 83 699
Debit 37 085 38 591 75 676 42 492 34 962 77 454
Issued abroad (DRs) 3 556 9 673 13 229 819 111 930
Credit 3 648 10 078 13 725 1 018 256 1 274
Debit 92 405 497 199 145 344
Debt securities 13 432 16 692 30 124 8 570 2 709 11 278
Credit 28 626 32 639 61 265 26 793 16 606 43 399
Debit 15 193 15 947 31 141 18 223 13 897 32 121
Issued in the country 9 309 5 293 14 601 135 -196 -61
Medium and long term 8 295 5 104 13 399 86 -265 -179
Credit 12 873 11 475 24 348 5 633 6 159 11 792
Debit 4 578 6 371 10 949 5 547 6 425 11 972
Short term 1 014 189 1 202 49 70 119
Credit 1 499 590 2 089 628 420 1 047
Debit 485 402 887 578 350 929
Issued abroad 4 123 11 399 15 523 8 434 2 904 11 339
Bonds -2 168 -1 396 -3 564 -3 381 -686 -4 067
Private -1 -1 -2 -2 -1 002 -1 004
Disbursements 0 0 0 0 0 0
Amortizations 1 1 2 2 1 002 1 004
Public -2 167 -1 395 -3 561 -3 379 315 -3 063
Disbursements 788 2 030 2 818 0 1 650 1 650
Amortizations 2 954 3 425 6 379 3 379 1 335 4 713
Face value 2 601 2 798 5 399 2 981 1 159 4 140
Discounts 353 627 981 398 175 573
Notes and commercial papers 5 561 8 115 13 676 14 860 6 800 21 659
Disbursements 10 995 12 034 23 029 17 081 8 377 25 458
Amortizations 5 434 3 920 9 354 2 221 1 577 3 799
Money market instruments 730 4 681 5 411 -3 045 -3 209 -6 253
Disbursements 2 471 6 509 8 980 3 452 0 3 452
Amortizations 1 741 1 828 3 569 6 496 3 209 9 705
2011 2010
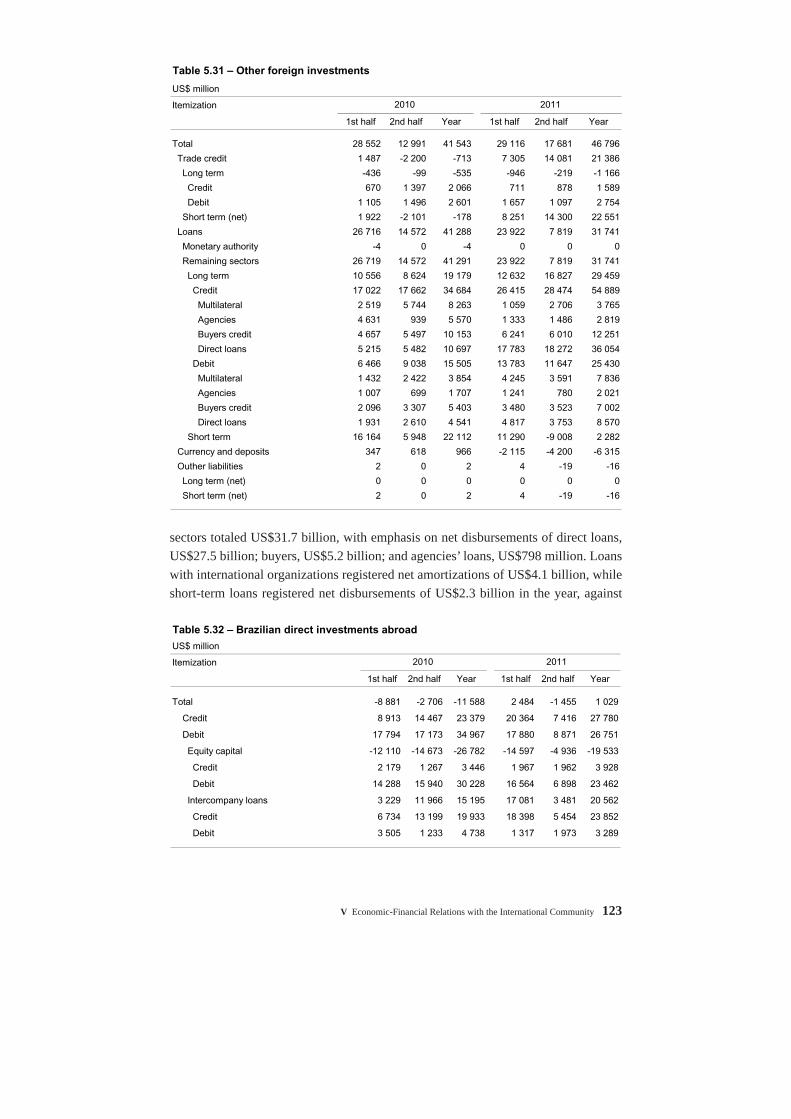
V Economic-Financial Relations with the International Community 123
sectors totaled US$31.7 billion, with emphasis on net disbursements of direct loans, US$27.5 billion; buyers, US$5.2 billion; and agencies’ loans, US$798 million. Loans with international organizations registered net amortizations of US$4.1 billion, while short-term loans registered net disbursements of US$2.3 billion in the year, against
Table 5.31 – Other foreign investments
US$ million
Itemization
1st half 2nd half Year 1st half 2nd half Year
Total 28 552 12 991 41 543 29 116 17 681 46 796
Trade credit 1 487 -2 200 -713 7 305 14 081 21 386
Long term -436 -99 -535 -946 -219 -1 166
Credit 670 1 397 2 066 711 878 1 589
Debit 1 105 1 496 2 601 1 657 1 097 2 754
Short term (net) 1 922 -2 101 -178 8 251 14 300 22 551
Loans 26 716 14 572 41 288 23 922 7 819 31 741
Monetary authority -4 0 -4 0 0 0
Remaining sectors 26 719 14 572 41 291 23 922 7 819 31 741
Long term 10 556 8 624 19 179 12 632 16 827 29 459
Credit 17 022 17 662 34 684 26 415 28 474 54 889
Multilateral 2 519 5 744 8 263 1 059 2 706 3 765
Agencies 4 631 939 5 570 1 333 1 486 2 819
Buyers credit 4 657 5 497 10 153 6 241 6 010 12 251
Direct loans 5 215 5 482 10 697 17 783 18 272 36 054
Debit 6 466 9 038 15 505 13 783 11 647 25 430
Multilateral 1 432 2 422 3 854 4 245 3 591 7 836
Agencies 1 007 699 1 707 1 241 780 2 021
Buyers credit 2 096 3 307 5 403 3 480 3 523 7 002
Direct loans 1 931 2 610 4 541 4 817 3 753 8 570
Short term 16 164 5 948 22 112 11 290 -9 008 2 282
Currency and deposits 347 618 966 -2 115 -4 200 -6 315
Outher liabilities 2 0 2 4 -19 -16
Long term (net) 0 0 0 0 0 0
Short term (net) 2 0 2 4 -19 -16
2010 2011
Table 5.32 – Brazilian direct investments abroad
US$ million
Itemization
1st half 2nd half Year 1st half 2nd half Year
Total -8 881 -2 706 -11 588 2 484 -1 455 1 029
Credit 8 913 14 467 23 379 20 364 7 416 27 780
Debit 17 794 17 173 34 967 17 880 8 871 26 751
Equity capital -12 110 -14 673 -26 782 -14 597 -4 936 -19 533
Credit 2 179 1 267 3 446 1 967 1 962 3 928
Debit 14 288 15 940 30 228 16 564 6 898 23 462
Intercompany loans 3 229 11 966 15 195 17 081 3 481 20 562
Credit 6 734 13 199 19 933 18 398 5 454 23 852
Debit 3 505 1 233 4 738 1 317 1 973 3 289
2010 2011

124 Boletim do Banco Central do Brasil – Annual Report 2011
US$22.1 billion in 2010, a decline mainly explained by the adoption of the IOF rate of 6% on foreign loans with maturity lower than 720 days, effective since April 2011. Non-resident liabilities held in the country as deposits and currency decreased US$6.3 billion, against net expansion of US$966 million in 2010.
In 2011, the Brazilian fl ows of direct investments abroad amounted to net returns of US$1 billion, as compared to net investments of US$11.6 billion in the previous year. Equity capital participation in foreign enterprises registered net investments of US$19.5 billion, decreasing 27.1% in the year. Net amortizations of to loans granted by Brazilian companies to affi liated companies abroad totaled US$20.6 billion, up 35.3% in the year. According to December 2011 estimates, the stock of Brazilian direct investments abroad totaled US$202.6 billion.
Table 5.34 – Other brazilian investments abroad
US$ million
Itemization
1st half 2nd half Year 1st half 2nd half Year
Total -12 045 -30 522 -42 567 -20 564 -18 420 -38 984
Loans -11 770 -24 799 -36 569 -20 344 -15 305 -35 649
Long term -23 -8 -30 -97 -81 -179
Credit 42 102 145 38 43 81
Debit 65 110 175 136 124 259
Short term (net) -11 747 -24 792 -36 539 -20 247 -15 223 -35 471
Currency and deposits -400 -4 446 -4 846 -306 -4 114 -4 420
Banks 3 413 -1 303 2 110 1 783 -895 887
Remaining domestic sectors -3 814 -3 142 -6 956 -2 089 -3 219 -5 307
Other assets 125 -1 277 -1 152 86 999 1 086
Long term -134 -73 -207 -179 -116 -295
Credit 71 26 96 56 33 90
Debit 205 98 303 235 150 385
Short term (net) 259 -1 205 -945 265 1115 1380
2010 2011
Table 5.33 – Brazilian portfolio investments abroad
US$ million
Itemization
1st half 2nd half Year 1st half 2nd half Year
Total -375 -4 408 -4 784 12 711 4 147 16 858
Credit 3 214 7 705 10 919 20 179 8 704 28 883
Debit 3 590 12 113 15 703 7 468 4 557 12 025
Equity investment 896 5 315 6 211 6 841 1 961 8 801
Credit 1 379 6 152 7 531 7 414 2 699 10 112
Debit 483 837 1 320 573 738 1 311
Debt securities -1 271 -9 724 -10 995 5871 2186 8 057
Credit 1 836 1 552 3 388 12 766 6 005 18 771
Debit 3 107 11 276 14 383 6 895 3 819 10 714
2010 2011
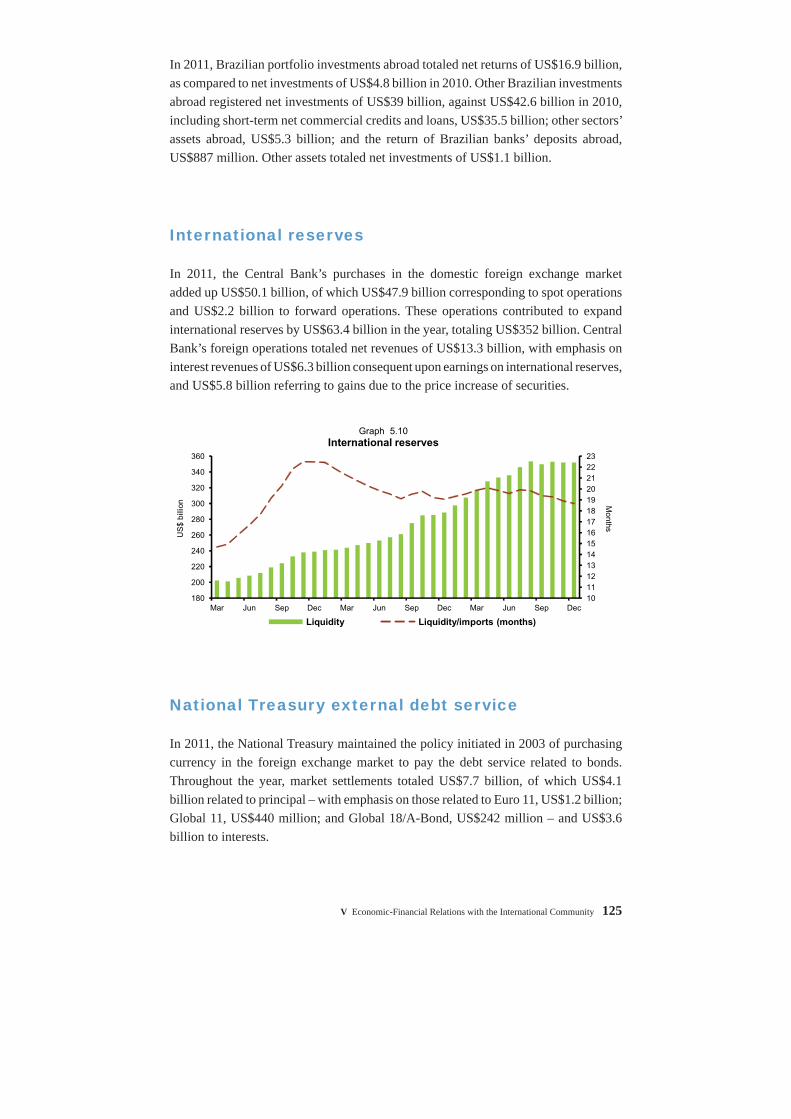
V Economic-Financial Relations with the International Community 125
In 2011, Brazilian portfolio investments abroad totaled net returns of US$16.9 billion, as compared to net investments of US$4.8 billion in 2010. Other Brazilian investments abroad registered net investments of US$39 billion, against US$42.6 billion in 2010, including short-term net commercial credits and loans, US$35.5 billion; other sectors’ assets abroad, US$5.3 billion; and the return of Brazilian banks’ deposits abroad, US$887 million. Other assets totaled net investments of US$1.1 billion.
International reserves
In 2011, the Central Bank’s purchases in the domestic foreign exchange market added up US$50.1 billion, of which US$47.9 billion corresponding to spot operations and US$2.2 billion to forward operations. These operations contributed to expand international reserves by US$63.4 billion in the year, totaling US$352 billion. Central Bank’s foreign operations totaled net revenues of US$13.3 billion, with emphasis on interest revenues of US$6.3 billion consequent upon earnings on international reserves, and US$5.8 billion referring to gains due to the price increase of securities.
National Treasury external debt service
In 2011, the National Treasury maintained the policy initiated in 2003 of purchasing currency in the foreign exchange market to pay the debt service related to bonds. Throughout the year, market settlements totaled US$7.7 billion, of which US$4.1 billion related to principal – with emphasis on those related to Euro 11, US$1.2 billion; Global 11, US$440 million; and Global 18/A-Bond, US$242 million – and US$3.6 billion to interests.
10 11 12 13 14 15 16 17 18 19 20 21 22 23
180
200
220
240
260
280
300
320
340
360
Mar Jun Sep Dec Mar Jun Sep Dec Mar Jun Sep Dec
Months
US
$ bi
llion
Liquidity Liquidity/imports (months)
Graph 5.10International reserves
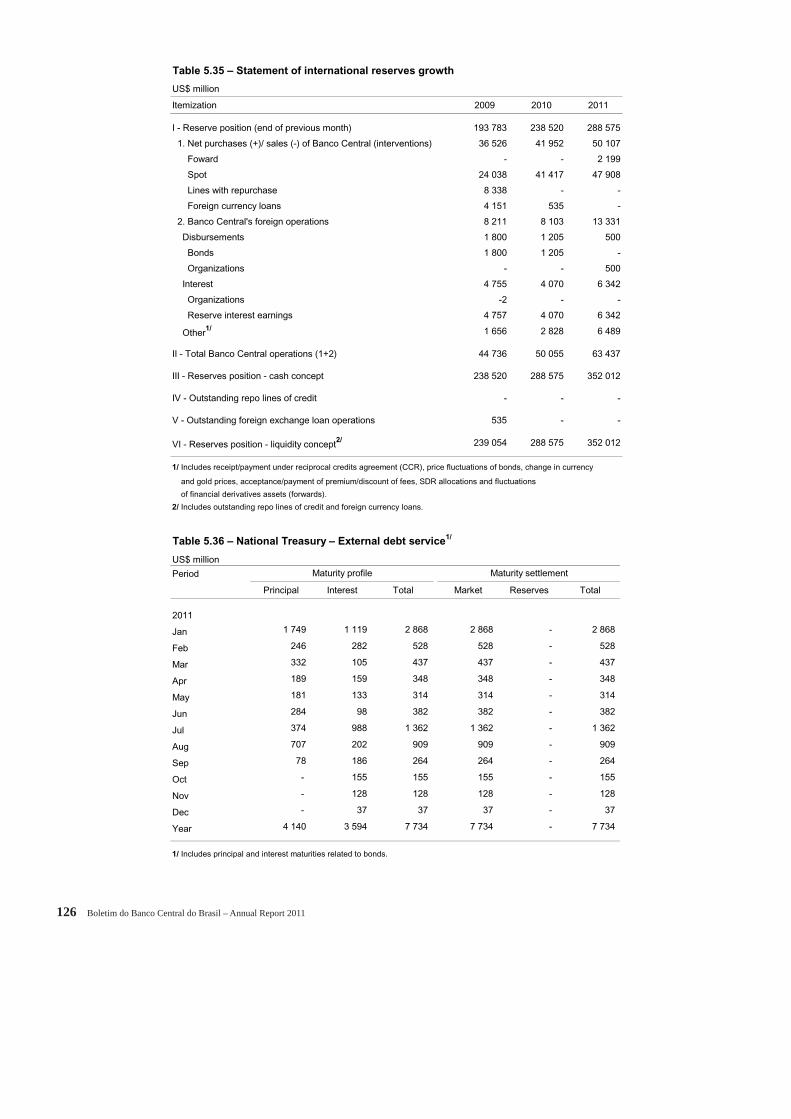
126 Boletim do Banco Central do Brasil – Annual Report 2011
Table 5.35 – Statement of international reserves growth
US$ million
Itemization 2009 2010 2011
I - Reserve position (end of previous month) 193 783 238 520 288 575
1. Net purchases (+)/ sales (-) of Banco Central (interventions) 36 526 41 952 50 107
Foward - - 2 199
Spot 24 038 41 417 47 908
Lines with repurchase 8 338 - -
Foreign currency loans 4 151 535 -
2. Banco Central's foreign operations 8 211 8 103 13 331
Disbursements 1 800 1 205 500
Bonds 1 800 1 205 -
Organizations - - 500
Interest 4 755 4 070 6 342
Organizations -2 - -
Reserve interest earnings 4 757 4 070 6 342
Other1/ 1 656 2 828 6 489
II - Total Banco Central operations (1+2) 44 736 50 055 63 437
III - Reserves position - cash concept 238 520 288 575 352 012
IV - Outstanding repo lines of credit - - -
V - Outstanding foreign exchange loan operations 535 - -
VI - Reserves position - liquidity concept2/ 239 054 288 575 352 012
1/ Includes receipt/payment under reciprocal credits agreement (CCR), price fluctuations of bonds, change in currency
and gold prices, acceptance/payment of premium/discount of fees, SDR allocations and fluctuations
of financial derivatives assets (forwards).
2/ Includes outstanding repo lines of credit and foreign currency loans.
Table 5.36 – National Treasury – External debt service1/
US$ million
Period
Principal Interest Total Market Reserves Total
2011
Jan 1 749 1 119 2 868 2 868 - 2 868
Feb 246 282 528 528 - 528
Mar 332 105 437 437 - 437
Apr 189 159 348 348 - 348
May 181 133 314 314 - 314
Jun 284 98 382 382 - 382
Jul 374 988 1 362 1 362 - 1 362
Aug 707 202 909 909 - 909
Sep 78 186 264 264 - 264
Oct - 155 155 155 - 155
Nov - 128 128 128 - 128
Dec - 37 37 37 - 37
Year 4 140 3 594 7 734 7 734 - 7 734
1/ Includes principal and interest maturities related to bonds.
Maturity profile Maturity settlement

V Economic-Financial Relations with the International Community 127
The Brazilian repurchase program of foreign debt securities, aiming to improve the sovereign Brazilian public debt maturity profi le and allow the building up of a more complete yield curve, kept the policy of including all securities, regardless of the maturity date. On the domestic exchange market, contractions totaled US$2.9 billion, of which US$2.3 billion related to amortizations, corresponding to the value of the effective foreign debt reduction, US$60 million to interests, and US$573 million in premium expenditures.
Foreign debt
The total Brazilian foreign debt amounted to US$298 billion at the end of 2011, rising US$41.4 billion in the year. The long-term foreign debt increased by US$58.6 billion, to US$258 billion, while the short-term debt decreased by US$17.2 billion, to US$40.1 billion. The stock of intercompany loans increased by US$10.8 billion, to US$106 billion, of which US$104 billion corresponding to long-term loans.
In December 2011, the long-term foreign debt was composed of by debt securities, with 43.1% of total; loans, 41.4%; and commercial credits, 12.5%. The stocks of these components increased in 2011 by US$16 billion, US$34.9 billion and US$7.2 billion, respectively. The reduction of the short-term debt mainly resulted from respective declines of US$8.9 billion and US$7.2 billion under the stocks of loans and debt securities.
Table 5.37 – National Treasury - External debt sovereign bonds buyback operations
By settlement date
US$ million
Itemization Principal Interest Premium/Discount Total
2011
Jan 467 15 139 622
Feb 246 4 46 295
Mar 317 6 61 384
Apr 189 3 42 234
May 181 5 40 226
Jun 284 10 69 363
Jul 263 8 77 348
Aug 267 9 83 359
Sep 63 1 15 79
Oct - - - -
Nov - - - -
Dec - - - -
Year 2 276 60 573 2 909

128 Boletim do Banco Central do Brasil – Annual Report 2011
At the end of 2011, the private sector’s foreign debt, accounting for 62.8% of total registered foreign debt, was composed of by US$160 billion in long-term operations and US$4.7 billion in short-term operations. The public sector foreign debt accounted for 37.2% of total, composed of by US$97.6 billion in long-term operations and US$54 million in short-term operations. The long-term nonfi nancial public sector debt was concentrated in the National Treasury, accounting for 55.4% of the total, of which US$37.8 billion corresponding to bonds. The Central Bank’s debt, accounting for 5.7% of the total, referred to allocations of Special Drawing Rights (SDR) with the IMF, classifi ed as debt with international organizations. The foreign debt of state and municipal governments accounted for 19.5% of the total, concentrated in loans from international organizations, while the debt of state-owned enterprises was mainly related to credits received from government agencies.
In 2011, the debt contacted with the endorsement of the public sector increased by US$2 billion, reaching US$29.1 billion, of which US$27.4 billion were granted by the federal government.
Table 5.38 – Gross foreign indebtedness1/
US$ million
Itemization 2007 2008 2009 2010 2011
A. Total external debt (B+C)1/193 219 198 340 198 192 256 804 298 204
B. Long-term debt 154 318 161 896 167 220 199 497 258 055
Debt securities 93 618 85 134 86 564 95 095 111 105
Loans 45 463 53 489 53 420 71 900 106 781
Trade credits 10 605 16 148 19 483 24 987 32 222
Other debt liabilities 4 632 7 124 7 753 7 515 7 947
C. Short-term debt 38 901 36 444 30 972 57 307 40 149
Debt securities 4 130 3 468 2 949 7 700 468
Loans 31 260 31 247 26 046 46 744 37 841
Currency and deposits 1 154 467 642 392 592
Trade credits 83 464 363 589 870
Other debt liabilities 2 275 799 971 1 881 378
D. Intercompany loans 47 276 64 570 79 372 95 137 105 913
E. Total external debt, including intercompany
loans (A+D) 240 495 262 910 277 563 351 941 404 117
1/ Excludes intercompany loans.
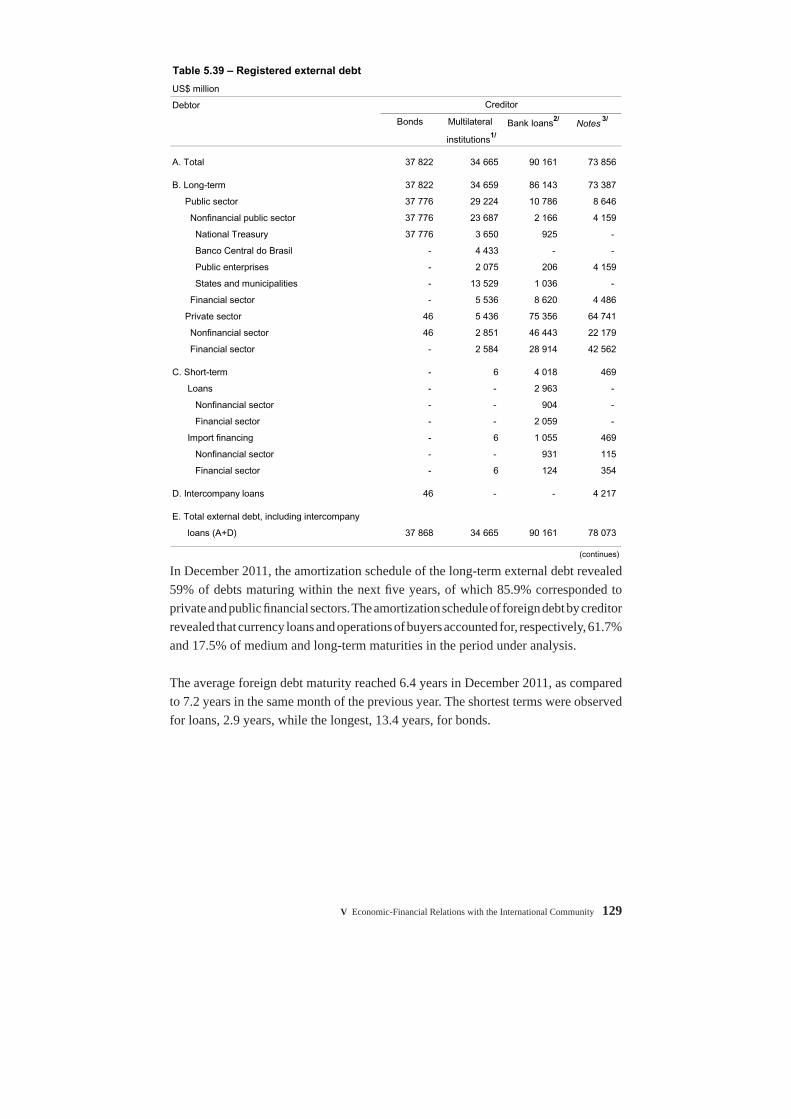
V Economic-Financial Relations with the International Community 129
In December 2011, the amortization schedule of the long-term external debt revealed 59% of debts maturing within the next fi ve years, of which 85.9% corresponded to private and public fi nancial sectors. The amortization schedule of foreign debt by creditor revealed that currency loans and operations of buyers accounted for, respectively, 61.7% and 17.5% of medium and long-term maturities in the period under analysis.
The average foreign debt maturity reached 6.4 years in December 2011, as compared to 7.2 years in the same month of the previous year. The shortest terms were observed for loans, 2.9 years, while the longest, 13.4 years, for bonds.
Table 5.39 – Registered external debt
US$ million
Debtor
Bonds Multilateral Bank loans2/Notes
3/
institutions1/
A. Total 37 822 34 665 90 161 73 856
B. Long-term 37 822 34 659 86 143 73 387
Public sector 37 776 29 224 10 786 8 646
Nonfinancial public sector 37 776 23 687 2 166 4 159
National Treasury 37 776 3 650 925 -
Banco Central do Brasil - 4 433 - -
Public enterprises - 2 075 206 4 159
States and municipalities - 13 529 1 036 -
Financial sector - 5 536 8 620 4 486
Private sector 46 5 436 75 356 64 741
Nonfinancial sector 46 2 851 46 443 22 179
Financial sector - 2 584 28 914 42 562
C. Short-term - 6 4 018 469
Loans - - 2 963 -
Nonfinancial sector - - 904 -
Financial sector - - 2 059 -
Import financing - 6 1 055 469
Nonfinancial sector - - 931 115
Financial sector - 6 124 354
D. Intercompany loans 46 - - 4 217
E. Total external debt, including intercompany
loans (A+D) 37 868 34 665 90 161 78 073
(continues)
Creditor
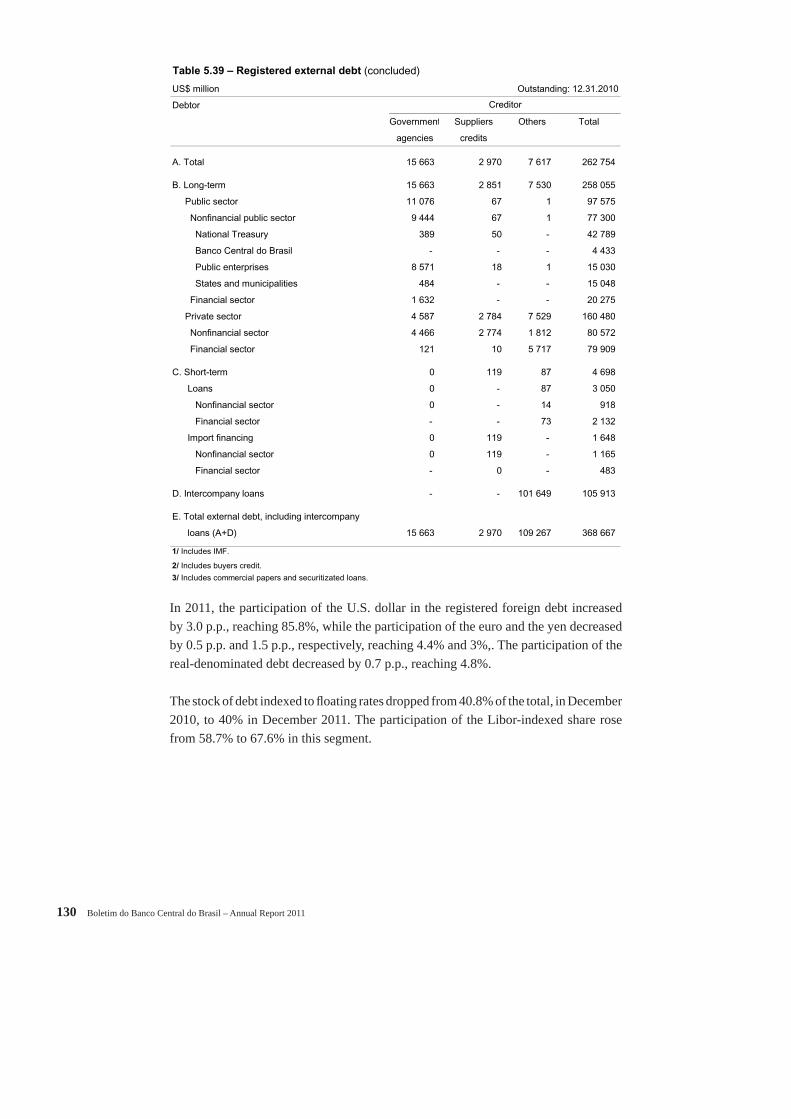
130 Boletim do Banco Central do Brasil – Annual Report 2011
In 2011, the participation of the U.S. dollar in the registered foreign debt increased by 3.0 p.p., reaching 85.8%, while the participation of the euro and the yen decreased by 0.5 p.p. and 1.5 p.p., respectively, reaching 4.4% and 3%,. The participation of the real-denominated debt decreased by 0.7 p.p., reaching 4.8%.
The stock of debt indexed to fl oating rates dropped from 40.8% of the total, in December 2010, to 40% in December 2011. The participation of the Libor-indexed share rose from 58.7% to 67.6% in this segment.
Table 5.39 – Registered external debt (concluded)
US$ million Outstanding: 12.31.2010
Debtor
Government Suppliers Others Total
agencies credits
A. Total 15 663 2 970 7 617 262 754
B. Long-term 15 663 2 851 7 530 258 055
Public sector 11 076 67 1 97 575
Nonfinancial public sector 9 444 67 1 77 300
National Treasury 389 50 - 42 789
Banco Central do Brasil - - - 4 433
Public enterprises 8 571 18 1 15 030
States and municipalities 484 - - 15 048
Financial sector 1 632 - - 20 275
Private sector 4 587 2 784 7 529 160 480
Nonfinancial sector 4 466 2 774 1 812 80 572
Financial sector 121 10 5 717 79 909
C. Short-term 0 119 87 4 698
Loans 0 - 87 3 050
Nonfinancial sector 0 - 14 918
Financial sector - - 73 2 132
Import financing 0 119 - 1 648
Nonfinancial sector 0 119 - 1 165
Financial sector - 0 - 483
D. Intercompany loans - - 101 649 105 913
E. Total external debt, including intercompany
loans (A+D) 15 663 2 970 109 267 368 667
1/ Includes IMF.
2/ Includes buyers credit.
3/ Includes commercial papers and securitizated loans.
Creditor

V Economic-Financial Relations with the International Community 131
Table 5.41 – Registered external debt – By debtor
Amortization schedule1/
US$ million
Itemization Outstanding 2012 2013 2014 2015 2016
debt
A. Total debt (B+C) 262 754 41 787 41 152 25 564 27 210 21 273
B. Medium and long-term debt 258 055 37 089 41 152 25 564 27 210 21 273
Nonfinancial public sector 77 300 4 044 3 082 2 658 6 311 5 396
Central government 47 222 2 676 1 554 1 242 2 662 2 465
Others 30 078 1 368 1 529 1 416 3 649 2 931
Financial public sector 20 275 903 2 633 731 1 042 1 812
Private sector 160 480 32 141 35 437 22 175 19 858 14 065
C. Short-term debt 4 698 4 698 - - - -
Nonfinancial public sector - - - - - -
Financial public sector 54 54 - - - -
Private sector 4 645 4 645 - - - -
D. Intercompany loans 105 913 12 392 15 741 16 357 12 419 7 764
E. Total debt + intercompany loans (A+D) 368 667 54 179 56 893 41 921 39 629 29 036
(continues)
Table 5.40 – Public registered external debt
Breakdown of principal by debtor and by guarantor
US$ million
Itemization 2007 2008 2009 2010 2011
Federal government (direct) 58 991 54 373 54 779 51 888 42 789
States and municipalities 7 055 8 199 9 593 13 239 15 048
Direct 41 27 5 3 2
Guaranteed by the federal government 7 013 8 172 9 588 13 235 15 047
Semi-autonomous entities, public - - - - -
companies and mixed companies 14 700 17 147 26 850 35 872 39 791
Direct 8 619 10 946 15 474 23 587 27 547
Guaranteed by the federal government 6 081 6 201 11 376 12 285 12 244
Private sector (garanteed by the public sector) 436 450 891 1 578 1 828
Total 81 182 80 169 92 113 102 577 99 456
Direct 67 652 65 346 70 258 75 478 70 338
Guaranteed by 13 530 14 823 21 855 27 099 29 118
Federal government 13 454 14 688 21 234 25 684 27 409
States and municipalities 8 7 5 0 -
Semi-autonomous entities, public
companies and mixed companies 67 127 616 1 414 1 709
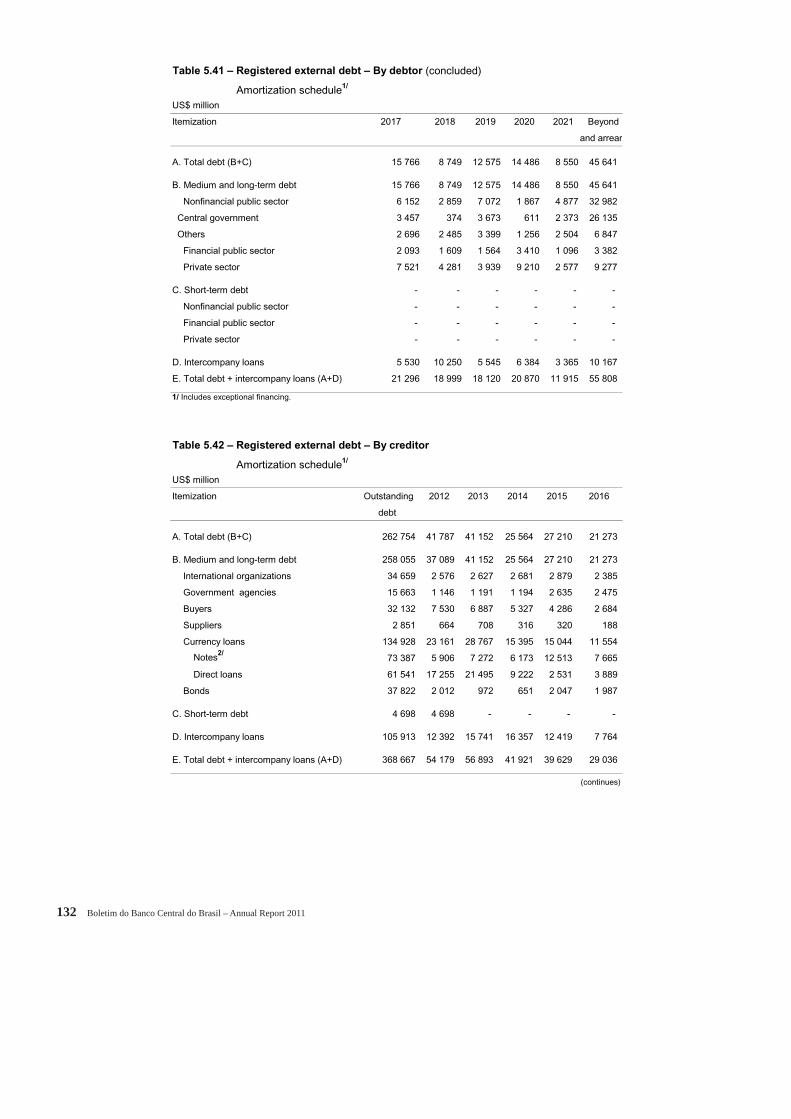
132 Boletim do Banco Central do Brasil – Annual Report 2011
Table 5.41 – Registered external debt – By debtor (concluded)
Amortization schedule1/
US$ million
Itemization 2017 2018 2019 2020 2021 Beyond
and arrears
A. Total debt (B+C) 15 766 8 749 12 575 14 486 8 550 45 641
B. Medium and long-term debt 15 766 8 749 12 575 14 486 8 550 45 641
Nonfinancial public sector 6 152 2 859 7 072 1 867 4 877 32 982
Central government 3 457 374 3 673 611 2 373 26 135
Others 2 696 2 485 3 399 1 256 2 504 6 847
Financial public sector 2 093 1 609 1 564 3 410 1 096 3 382
Private sector 7 521 4 281 3 939 9 210 2 577 9 277
C. Short-term debt - - - - - -
Nonfinancial public sector - - - - - -
Financial public sector - - - - - -
Private sector - - - - - -
D. Intercompany loans 5 530 10 250 5 545 6 384 3 365 10 167
E. Total debt + intercompany loans (A+D) 21 296 18 999 18 120 20 870 11 915 55 808
1/ Includes exceptional financing.
Table 5.42 – Registered external debt – By creditor
Amortization schedule1/
US$ million
Itemization Outstanding 2012 2013 2014 2015 2016
debt
A. Total debt (B+C) 262 754 41 787 41 152 25 564 27 210 21 273
B. Medium and long-term debt 258 055 37 089 41 152 25 564 27 210 21 273
International organizations 34 659 2 576 2 627 2 681 2 879 2 385
Government agencies 15 663 1 146 1 191 1 194 2 635 2 475
Buyers 32 132 7 530 6 887 5 327 4 286 2 684
Suppliers 2 851 664 708 316 320 188
Currency loans 134 928 23 161 28 767 15 395 15 044 11 554
Notes2/ 73 387 5 906 7 272 6 173 12 513 7 665
Direct loans 61 541 17 255 21 495 9 222 2 531 3 889
Bonds 37 822 2 012 972 651 2 047 1 987
C. Short-term debt 4 698 4 698 - - - -
D. Intercompany loans 105 913 12 392 15 741 16 357 12 419 7 764
E. Total debt + intercompany loans (A+D) 368 667 54 179 56 893 41 921 39 629 29 036
(continues)

V Economic-Financial Relations with the International Community 133
Table 5.42 – Registered external debt – By creditor (concluded)
Amortization schedule1/
US$ million Outstanding: 12.31.2011
Itemization 2017 2018 2019 2020 2021 Beyond
and arrears
A. Total debt (B+C) 15 766 8 749 12 575 14 486 8 550 45 641
B. Medium and long-term debt 15 766 8 749 12 575 14 486 8 550 45 641
International entities 2 012 1 742 1 599 1 444 1 244 13 471
Government agencies 2 109 2 004 1 830 314 233 532
Buyers 1 515 1 358 1 052 583 248 663
Suppliers 133 123 99 113 62 125
Currency loans 6 908 3 451 4 605 11 659 4 601 9 782
Notes2/ 5 659 2 967 3 946 9 485 3 771 8 031
Direct loans 1 249 484 659 2 174 830 1 751
Bonds 3 089 71 3 391 373 2 163 21 066
C. Short-term debt - - - - - -
D. Intercompany loans 5 530 10 250 5 545 6 384 3 365 10 167
E. Total debt + intercompany loans (A+D) 21 296 18 999 18 120 20 870 11 915 55 808
1/ Includes exceptional financing.
2/ Includes commercial papers and securities.
Table 5.43 – Average maturity term
Registered external debt1/
US$ million
Itemization 2011 Average maturity (years)
A. Total 260 980 6.4
International organizations 34 651 9.4
Government agencies 15 639 5.3
Buyers 31 627 3.3
Suppliers 2 751 3.5
Currency loans + others 61 385 2.9
Notes and commercial papers 72 683 6.2
Bonds 37 822 13.4
Bradies 62 1.5
Global/Euro 37 714 13.4
Others 46 1.9
Short-term 4 421 1.0
B. Intercompany loans 103 201 5.1
C. Total + intercompany loans 364 181 6.0
1/ Excludes debt in arrears.
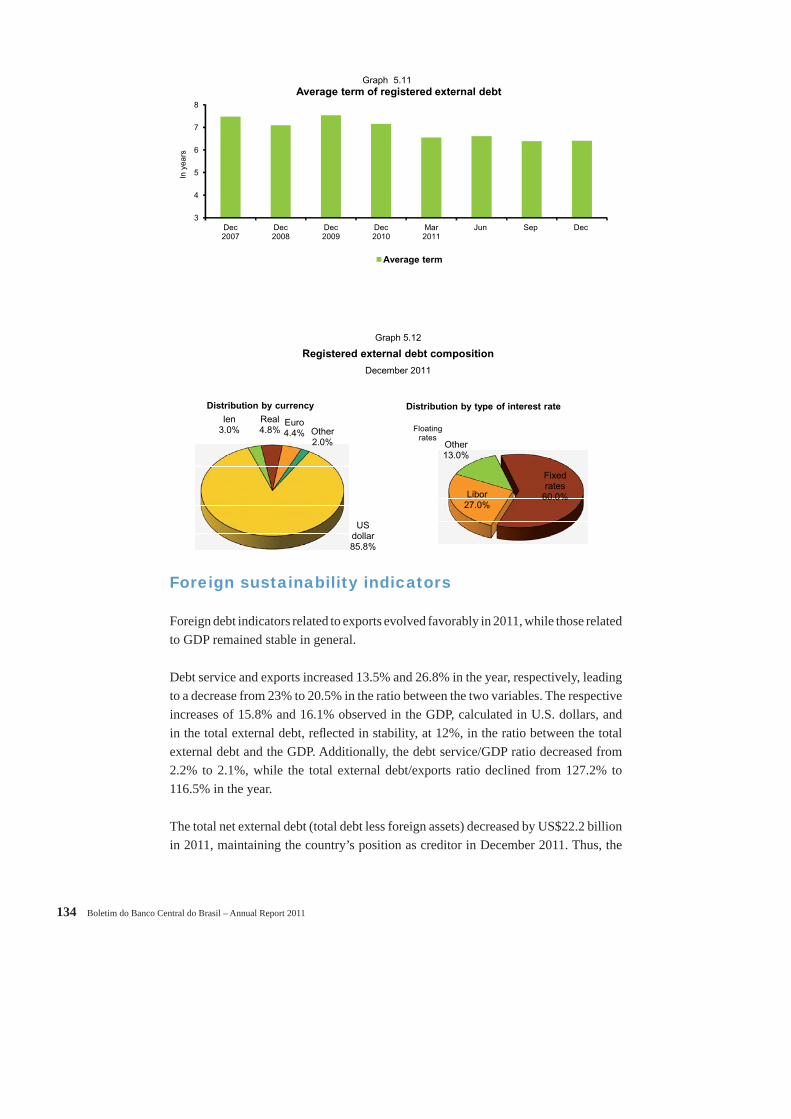
134 Boletim do Banco Central do Brasil – Annual Report 2011
Foreign sustainability indicators
Foreign debt indicators related to exports evolved favorably in 2011, while those related to GDP remained stable in general.
Debt service and exports increased 13.5% and 26.8% in the year, respectively, leading to a decrease from 23% to 20.5% in the ratio between the two variables. The respective increases of 15.8% and 16.1% observed in the GDP, calculated in U.S. dollars, and in the total external debt, refl ected in stability, at 12%, in the ratio between the total external debt and the GDP. Additionally, the debt service/GDP ratio decreased from 2.2% to 2.1%, while the total external debt/exports ratio declined from 127.2% to 116.5% in the year.
The total net external debt (total debt less foreign assets) decreased by US$22.2 billion in 2011, maintaining the country’s position as creditor in December 2011. Thus, the
3
4
5
6
7
8
Dec2007
Dec2008
Dec2009
Dec2010
Mar2011
Jun Sep Dec
In y
ears
Average term
Graph 5.11Average term of registered external debt
Graph 5.12
Registered external debt composition
December 2011
Libor27.0%
Other13.0%
Fixed rates
60.0%
Floating rates
Distribution by type of interest rate
Ien3.0%
Real4.8%
Euro4.4% Other
2.0%
US dollar85.8%
Distribution by currency

V Economic-Financial Relations with the International Community 135
net external debt and exports ratio over the last twelve months moved from -25.1%, in December 2010, to -28.5%, in December 2011, while the net external debt and GDP ratio decreased from -2.4% to -2.9%.
Table 5.44 – Indebtedness indicators1/
US$ million
Itemization 2007 2008 2009 2010 2011
Debt service 52 028 37 638 43 561 46 348 52 596
Amortizations2/36 687 22 065 29 639 32 864 37 126
Gross interest 15 342 15 573 13 922 13 484 15 470
Medium and long-term external debt (A) 154 318 161 896 167 220 199 497 258 055
Short-term external debt (B) 38 901 36 444 30 972 57 307 40 149
Total debt (C)=(A+B) 193 219 198 340 198 192 256 804 298 204
International reserves (D) 180 334 206 806 239 054 288 575 352 012
Brazilian credit abroad (E)3/2 894 2 657 2 435 2 227 2 194
Commercial bank assets (F) 21 938 16 560 18 474 16 630 16 866
Net debt (G)=(C-D-E-F) -11 948 -27 683 -61 771 -50 628 -72 868
Exports 160 649 197 942 152 995 201 915 256 040
GDP 1 366 544 1 650 897 1 625 636 2 143 921 2 482 070
Indicators (in percentage)
Debt service/exports 32.4 19.0 28.5 23.0 20.5
Debt service/GDP 3.8 2.3 2.7 2.2 2.1
Total debt/exports 120.3 100.2 129.5 127.2 116.5
Total debt/GDP 14.1 12.0 12.2 12.0 12.0
Net total debt/exports -7.4 -14.0 -40.4 -25.1 -28.5
Net total debt/GDP -0.9 -1.7 -3.8 -2.4 -2.9
1/ Excludes stock of principal, amortizations and interests concerning intercompany loans. Considers a review
in the medium and long-term indebtedness position of the private sector.2/ Includes the payments referring to the financial assistance program. Refinanced amortizations are not considered.
3/ Export Financing Program (Proex).
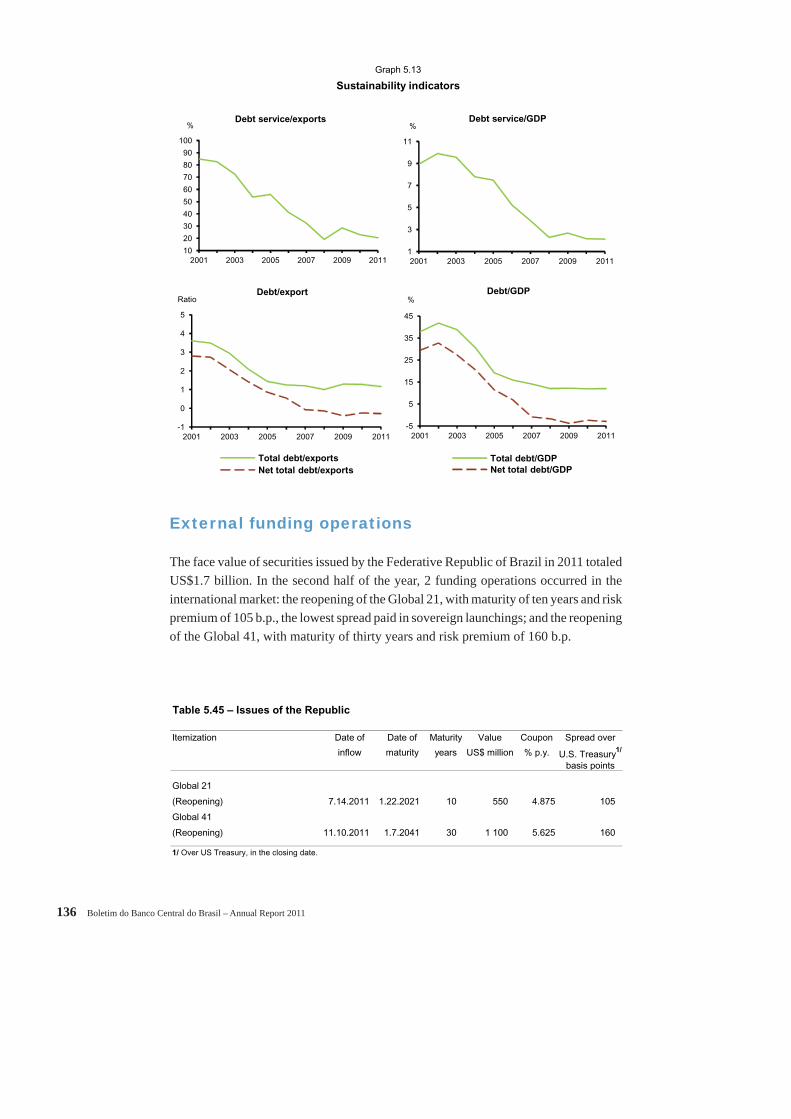
136 Boletim do Banco Central do Brasil – Annual Report 2011
External funding operations
The face value of securities issued by the Federative Republic of Brazil in 2011 totaled US$1.7 billion. In the second half of the year, 2 funding operations occurred in the international market: the reopening of the Global 21, with maturity of ten years and risk premium of 105 b.p., the lowest spread paid in sovereign launchings; and the reopening of the Global 41, with maturity of thirty years and risk premium of 160 b.p.
Table 5.45 – Issues of the Republic
Itemization Date of Date of Maturity Value Coupon Spread over
inflow maturity years US$ million % p.y. U.S. Treasury1/
basis points
Global 21
(Reopening) 7.14.2011 1.22.2021 10 550 4.875 105
Global 41
(Reopening) 11.10.2011 1.7.2041 30 1 100 5.625 160
1/ Over US Treasury, in the closing date.
Graph 5.13
Sustainability indicators
10
20
30
40
50
60
70
80
90
100
2001 2003 2005 2007 2009 2011
%Debt service/exports
1
3
5
7
9
11
2001 2003 2005 2007 2009 2011
%Debt service/GDP
-1
0
1
2
3
4
5
2001 2003 2005 2007 2009 2011
Debt/export
Total debt/exports
Net total debt/exports
Ratio
-5
5
15
25
35
45
2001 2003 2005 2007 2009 2011
%Debt/GDP
Total debt/GDP
Net total debt/GDP

V Economic-Financial Relations with the International Community 137
Brazilian foreign debt bonds
In 2011, chief Brazilian foreign debt bonds registered volatility, registering price decreases in the third quarter of the year and recovery in the subsequent period.
In 2011, the basket of securities that compose of the Brazilian foreign debt, weighted by liquidity on the basis of daily observations, registered average spread of 194 b.p. as compared to earnings on U.S. Treasury securities, against 203 b.p. in 2010. At the
Graph 5.14
Prices of Brazilian securities abroad
Secondary market – Bid price, end-of-period – 2011
115
117
119
121
123
125
Jan2011
Feb Mar Apr May Jun Jul Aug Sep Oct Nov Dec
US$ centsGlobal 15
110
112
114
116
118
120
122
Jan2011
Feb Mar Apr May Jun Jul Aug Sep Oct Nov Dec
US$ centsGlobal 16
112
114
116
118
120
122
124
Jan2011
Feb Mar Apr May Jun Jul Aug Sep Oct Nov Dec
US$ cents Global 18
140
145
150
155
160
165
170
Jan2011
Feb Mar Apr May Jun Jul Aug Sep Oct Nov Dec
US$ centsGlobal 27
165
170
175
180
185
190
195
Jan2011
Feb Mar Apr May Jun Jul Aug Sep Oct Nov Dec
US$ centsGlobal 30
121
126
131
136
141
146
151
Jan2011
Feb Mar Apr May Jun Jul Aug Sep Oct Nov Dec
US$ centsGlobal 34
105
110
115
120
125
130
135
Jan2011
Feb Mar Apr May Jun Jul Aug Sep Oct Nov Dec
US$ centsGlobal 37
130
132
134
136
138
140
142
Jan2011
Feb Mar Apr May Jun Jul Aug Sep Oct Nov Dec
US$ centsGlobal 40
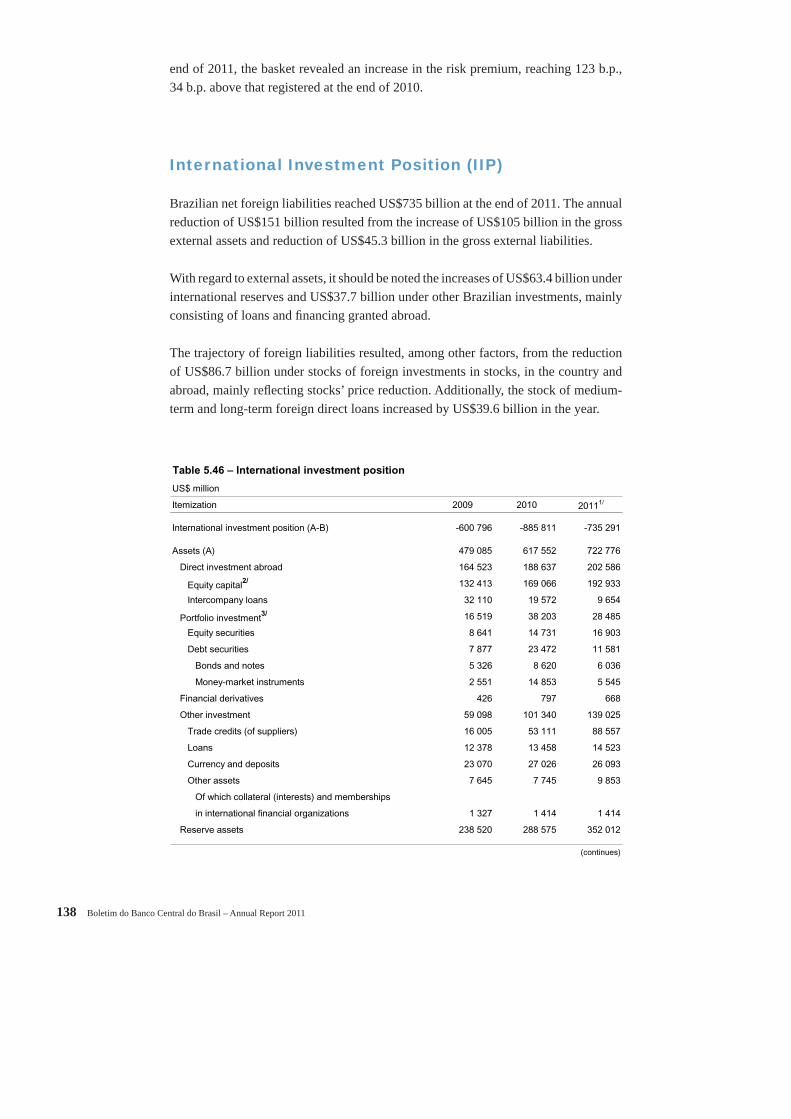
138 Boletim do Banco Central do Brasil – Annual Report 2011
end of 2011, the basket revealed an increase in the risk premium, reaching 123 b.p., 34 b.p. above that registered at the end of 2010.
International Investment Position (IIP)
Brazilian net foreign liabilities reached US$735 billion at the end of 2011. The annual reduction of US$151 billion resulted from the increase of US$105 billion in the gross external assets and reduction of US$45.3 billion in the gross external liabilities.
With regard to external assets, it should be noted the increases of US$63.4 billion under international reserves and US$37.7 billion under other Brazilian investments, mainly consisting of loans and fi nancing granted abroad.
The trajectory of foreign liabilities resulted, among other factors, from the reduction of US$86.7 billion under stocks of foreign investments in stocks, in the country and abroad, mainly refl ecting stocks’ price reduction. Additionally, the stock of medium-term and long-term foreign direct loans increased by US$39.6 billion in the year.
Table 5.46 – International investment position
US$ million
Itemization 2009 2010 20111/
International investment position (A-B) -600 796 -885 811 -735 291
Assets (A) 479 085 617 552 722 776
Direct investment abroad 164 523 188 637 202 586
Equity capital2/ 132 413 169 066 192 933
Intercompany loans 32 110 19 572 9 654
Portfolio investment3/ 16 519 38 203 28 485
Equity securities 8 641 14 731 16 903
Debt securities 7 877 23 472 11 581
Bonds and notes 5 326 8 620 6 036
Money-market instruments 2 551 14 853 5 545
Financial derivatives 426 797 668
Other investment 59 098 101 340 139 025
Trade credits (of suppliers) 16 005 53 111 88 557
Loans 12 378 13 458 14 523
Currency and deposits 23 070 27 026 26 093
Other assets 7 645 7 745 9 853
Of which collateral (interests) and memberships
in international financial organizations 1 327 1 414 1 414
Reserve assets 238 520 288 575 352 012
(continues)

V Economic-Financial Relations with the International Community 139
IMF fi nancing and relationship with Brazil
In March 2011, as result of the general review of quotas negotiated in 2008, the Brazilian quota in the IMF increased from SRD 3 billion to SRD 4.3 billion. The country’s Reserve Position in the IMF reached SRD 2 billion in December 2011, equivalent to US$3 billion, consisting of SRD 1.2 billion in Reserve Tranche, quota in convertible currency, and SRD 750 million in Notes Type A redeemable under demand, associated with the fi nancing program New Arrangements to Borrow.
Table 5.46 – International investment position (concluded)
US$ million
Itemization 2009 2010 20111/
Liabilities (B) 1 079 881 1 503 363 1 458 067
Direct investment in reporting economy 400 808 674 764 669 670
Equity capital2/ 321 436 579 627 563 757
Intercompany loans 79 372 95 137 105 913
Portfolio investment 561 848 663 801 590 512
Equity securities 376 463 437 750 351 071
In the reporting country 205 159 254 194 217 987
Abroad 171 304 183 556 133 084
Debt securities 185 385 226 051 239 441
In the reporting country 95 802 122 732 127 763
Abroad 89 583 103 319 111 678
Long-term 86 212 94 925 111 209
Short-term 3 372 8 393 469
Financial derivatives 3 413 3 781 4 678
Other investment 113 813 161 017 193 208
Trade credits 3 306 3 133 2 970
Long-term 3 138 2 996 2 851
Short-term 167 138 119
Loans 100 793 145 905 178 531
Monetary authority 3 - -
Other sectors 100 790 145 905 178 531
Long-term 73 357 97 129 139 562
International entities 28 202 35 166 30 227
Government agencies 6 826 15 528 15 663
Buyers 19 302 24 461 32 132
Direct loans 19 027 21 975 61 541
Short-term 27 433 48 776 38 969
Currency and deposits 5 205 7 532 7 274
Monetary authority 69 58 44
Banks 5 135 7 474 7 230
Other liabilities 4 510 4 446 4 433
1/ Preliminary data.
2/ Includes reinvested earnings.
3/ Includes securities issued by residents.

140 Boletim do Banco Central do Brasil – Annual Report 2011
Table 5.47 – Brazilian financial position in the IMF
SDR million
Date Quota SDR holdings SDR allocations
Reserve tranche Series A Notes Total
2011 Jan 3 036 782 660 1 442 2 889 2 887
Feb 3 036 782 660 1 442 2 890 2 887
Mar 4 251 1 086 750 1 836 2 587 2 887
Apr 4 251 1 086 750 1 836 2 587 2 887
May 4 251 1 086 750 1 836 2 588 2 887
Jun 4 251 1 086 750 1 836 2 588 2 887
Jul 4 251 1 086 750 1 836 2 588 2 887
Aug 4 251 1 086 750 1 836 2 590 2 887
Sep 4 251 1 121 750 1 871 2 590 2 887
Oct 4 251 1 121 750 1 871 2 590 2 887
Nov 4 251 1 121 750 1 871 2 591 2 887
Dec 4 251 1 200 750 1 950 2 591 2 887
Reserve position in the IMF
No new SRD allocation occurred in 2011, with SRD assets declining by SRD 298 million (US$458 million), to SRD 2.6 billion (US$4 billion).
VI The International Economy 141
The International Economy
The international economy, after registering a strong recovery at the beginning of the year, started to refl ect the environment of increased commodity prices, worsening of the fi scal crisis in peripheral countries of the Euro Area and geopolitical tensions in the North Africa and Middle East. This scenario, worsened by the impacts of the earthquake on local Japanese production, was refl ected, except in the Euro Zone, in activity deceleration in chief advanced economies. Infl ation continued on an upward trend in leading developed and emerging countries, mainly refl ecting the supply shocks of commodities observed since the second half of 2010, with emphasis on the extension of fi scal and monetary tightening cycles in emerging economies.
The scenario of global uncertainties worsened during the second quarter of the year. The deterioration of the European fi scal crisis and similar tensions observed in the U.S., the perspectives of economic deceleration in both economies and its likely impacts on chief mature and emerging economies affected negatively both entrepreneurs and consumers’ expectations In this context, in which important European economies faced activity deceleration and the Japanese economy registered a new decline, the increase of the risk perception resulted in sharp volatility on fi nancial markets.
The reduction of growth perspectives in advanced economies was further intensifi ed in the second half of 2011. In this scenario, notwithstanding, in the U.S., the resumption of economic growth fueled by consumption; in Japan, the increased pace of activity growth stimulated by measures aimed to the reconstruction and recovery of the production lines; and, in China, only marginal impacts on the country’s growth rates, the economy of the Euro Area registered a signifi cant slowdown, a process that, in an environment of high volatility on fi nancial markets, maintained the disinfl ationary trend of the global economy.
Economic activity
U.S. GDP registered annual increase of 0.4% in the fi rst quarter of 2011. The deceleration of 1.9 p.p., compared to the quarter ended in December of the previous year, mainly
VI
142 Boletim do Banco Central do Brasil – Annual Report 2011
refl ected the negative contributions of government expenditures, 1.2 p.p., and the external sector, 0.3 p.p., revealing respective expansions of 8.3% and 7.9% under imports and exports. Household consumption, although refl ecting the increase of oil price on real income, rose by 2.1% in the period, while the private sector’s investments, refl ecting higher stocks and investments in equipments and software, increased by 3.8%. It should be noted that the corporate gross fi xed capital formation increased 2.1%, while the residential investment decreased by 2.4%. In this context, in which 567 thousand net jobs were opened, the unemployment rate decreased by 0.5 p.p. in the quarter, reaching 8.9% in March 2011.
The annual expansion of the U.S. GDP reached 1.3% in the quarter ended in June, with emphasis on the 10.3% expansion under corporate gross fi xed capital formation, the lower decline under government expenditures and the reduction, from 8.3% to 1.4%, under the growth rate of imports. Residential investments grew 4.2%, and household consumption, 0.7%, a signifi cant moderation as compared to the previous quarter, consequent upon the deterioration of the consumer sentiment, in a scenario of unemployment rate expansion by 0.2 p.p., reaching 9.1%.
U.S. GDP turned in annual increase of 1.8% in the quarter ended in September, with emphasis on the expansions of household consumption, 1.7%, and corporate gross fi xed capital formation, 15.7%. Exports increased 4.7%, and imports, 1.2%, thus leading to the 0.4 p.p. external sector contribution to the GDP growth in the quarter. In the period, 383 thousand jobs were created, contributing to the annualized quarterly increase of 0.7% under the disposable personal income.
The annual variation of the U.S. GDP came to 3.9% in the quarter ended in December 2011, with emphasis on respective contributions of 1.8 p.p. and 1.5 p.p. by increased stocks and private consumption. The corporate gross fi xed capital formation and the fi xed residential investment registered annual increases of 5.2% and 11.6%, respectively, in the period. Conversely, the 4.2% decline under government expenditures and the trajectory of the external sector – exports and imports increased by 2.7% and 3.7%, respectively – resulted in respective negative contributions of 0.8 p.p. and 0.3 p.p. of the GDP. The private labor market registered the opening of 551 thousand job positions in the quarter, as against the closing of 59 thousand formal job positions in the government sphere, resulting in a quarterly decline of 0.5 p.p. under the unemployment rate, to 8.5% in December. Disposable personal income registered annualized quarterly increase of 1.6% in the period.
The GDP of the Euro Area turned in annualized quarterly increase of 3% in the fi rst quarter of 2011, the second highest variation since the beginning of 2007, according to this comparison basis, with emphasis on the expansion of 5.5% registered in Germany. The acceleration of 1.7 p.p., as compared to the previous quarter, mainly resulted from expansion under gross fi xed capital formation, contributing with 1.4 p.p. Household
VI The International Economy 143
consumption decreased by 0.4% in the quarter, while exports and imports registered respective increases of 5.5% and 2.7%. In this scenario, the unemployment rate decreased to 9.9% in the period, the lowest level since August 2009.
The annualized GDP growth rate in the Euro Area came to 0.6% in the quarter ended in June, the worst performance since the second quarter of 2009, with emphasis on the impact of activity deceleration in Germany, where the GDP increased 1.1%, against 5.5% in the previous quarter, and the 0.2% decline observed in France. The region’s GDP trajectory mainly refl ected declines under household consumption, 1.6%, and gross fi xed capital formation, 0.6%. In the scope of the external sector, exports and imports expanded respectively by 5% and 1.6%.
The sluggish economic activity in the Euro Area refl ected in the maintenance, at 0.6%, of the annualized GDP growth rate in the quarter ended in September. Government consumption and gross fi xed capital formation declined by 0.7% and 1.2%, respectively, as opposed to recovery under household consumption, which rose by 1.2% in the period. Exports increased by 5.9%, and imports, 2.9%. It should be noted that Germany and France GDP’s expanded, respectively, 2.3% and 1.1% in the period, as opposed to declines observed in Italy, 0.9%, and Portugal, 2.5%.
GDP of the Euro Area registered annualized decrease of 1.3% in the fourth quarter of 2011, due to declines in all demand components, with emphasis on those observed in Italy, 2.7%; Spain, 1.2%; and Germany, 0.7%, and expansion in France, 0.3%. The deterioration of the regional economy impacted the unemployment rate, which climbed to 10.7% in December, the highest level since June 1997, and the consumer confi dence index, which closed at -21.3 points in December, the lowest level since August 2009.
In the United Kingdom, annualized GDP variation came to 1.0% in the fi rst quarter of the year, with emphasis on the 4.0 p.p. contribution by the external sector, resulting from annualized variations of 5.8% under exports and -6.7% under imports. In the scope of domestic demand, annualized quarterly declines were observed under residential investments, 6.3%; gross fi xed capital formation, 3.7%; and household consumption, 3.5%, as opposed to expansion under government consumption, 0.2%. In this scenario, the unemployment rate closed at 7.7%, dropping by 0.2 p.p. in the quarter.
The annualized GDP variation of the United Kingdom came to -0.2% in the quarter ended in June. The turnaround in relation to the previous quarter mainly refl ected the 8.5% decline under exports. Household consumption and gross fi xed capital formation registered respective annualized quarterly decreases of 1.6% and 0.6%. Conversely, residential investments and government consumption expanded by 42.8% and 0.7%, respectively. In this scenario, the unemployment rate rose by 0.2 p.p. in the period, closing at 7.9%.

144 Boletim do Banco Central do Brasil – Annual Report 2011
The annualized GDP expansion in the United Kingdom reached 2.3% in the quarter ended in September, with emphasis on the contribution of the sector of services, which, accounting for 76% of the local GDP, increased by 3.2% in the period. Unemployment rate, following an upward trajectory, closed at 8.3% in September, the worst result since January 1996.
Table 6.1 – Major countries
GDP components1/
% Quarterly rate anualised alised2010 2011
I II III IV I II III IV
GDP
United States 3.9 3.8 2.5 2.3 0.4 1.3 1.8 3.0
Euro Area 1.9 3.7 1.7 1.3 3.0 0.6 0.5 -1.3
United Kingdom 1.6 4.5 2.7 -2.0 1.0 -0.2 2.3 -1.2
Japan 5.3 4.8 3.1 -0.1 -7.7 -1.7 7.8 0.1
China1/ nd nd nd 10.0 9.1 9.5 10.0 7.8
Household consumption
United States 2.7 2.9 2.6 3.6 2.1 0.7 1.7 2.1
Euro Area 0.8 0.7 1.3 1.8 -0.4 -1.6 1.2 -1.9
United Kingdom -0.2 3.4 0.2 -1.1 -3.5 -1.6 -1.1 1.7
Japan 2.3 1.3 1.8 0.9 -5.9 2.4 4.3 2.9
Non-residencial Gross Fixed Capital Formation (GFCF)
United States 6.0 18.6 11.3 8.7 2.1 10.3 15.7 5.2
Euro Area2/ -0.1 8.6 0.5 -2.2 7.5 -0.6 -1.2 -1.6
United Kingdom2/ 23.5 -10.9 3.6 -0.2 -3.7 -0.6 2.6 -2.2
Japan -3.8 20.7 3.8 -7.6 -1.2 -1.0 0.6 22.3
Residencial investment
United States -15.3 22.8 -27.7 2.5 -2.5 4.2 1.2 11.5
Euro Area3/ -3.7 7.3 -2.8 -7.4 11.2 -3.6 -2.5 -1.4
United Kingdom -25.4 73.5 9.7 -11.0 -6.3 42.8 -14.7 3.6
Japan 12.6 3.3 1.0 19.3 6.7 -11.9 20.6 0.3
Exports of goods and services
United States 7.3 10.0 10.0 7.8 7.9 3.6 4.7 2.7
Euro Area 12.4 19.8 8.8 6.5 5.8 4.5 6.1 -2.7
United Kingdom -0.2 19.5 2.6 17.3 5.8 -8.5 -0.2 6.4
Japan 27.2 23.8 6.1 -0.7 -1.8 -22.9 39.6 -14.1
Imports of goods and services
United States 12.6 21.6 12.3 -2.3 8.3 1.4 1.2 3.7
Euro Area 14.4 18.2 6.1 6.0 3.1 2.4 2.7 -6.7
United Kingdom 9.3 12.2 12.6 5.0 -6.7 -2.4 0.8 3.6
Japan 10.3 25.9 7.4 0.7 4.8 0.6 14.8 3.8
Government expenditures
United States -1.2 3.7 1.0 -2.8 -5.9 -0.9 -0.1 -4.1
Euro Area4/ -1.5 0.8 0.2 0.1 -0.6 -0.1 -1.2 -0.6
United Kingdom4/ 1.7 2.7 -0.8 -0.3 0.2 0.7 -2.0 2.2
Japan 0.3 -0.5 1.0 -0.2 -2.1 8.0 0.2 0.6
Sources: BEA, Thomson, Cabinet Office and Eurostat. 1/ Quarterly information regarding China available solely to the aggregate GDP and begining on the last quarter of 2010.2/ GFCF total3/ GFCF4/ Government consumption only.
VI The International Economy 145
The United Kingdom GDP registered annualized decrease of 1.2% in the fourth quarter of 2011, with emphasis on the 2.2% decline under the gross fi xed capital formation. By contrast, household consumption, after four consecutive quarterly declines, increased by 1.7%. Government consumption grew 2.2%, and the external sector contributed with 0.8 p.p. to the quarterly GDP trajectory, resulting from expansions under exports, 6.4%, and imports, 3.6%, respectively. The analysis of the annualized quarterly GDP growth under the supply perspective reveals declines under the sector of construction, 0.8%, and industrial production, 4.9%. The unemployment rate climbed to 8.4% in December.
The economic activity in Japan, after recovery signs observed at the beginning of the year – industrial production and private consumption registered respective monthly increases of 1.1% and 0.6% in February as against January – refl ected the impact of the catastrophe in Fukushima. In this scenario, in which the generation and transmission of energy was affected, in addition to a signifi cant supply shortage of parts and spares for the automotive industry, the pace of activity dropped more signifi cantly, thus leading to annualized GDP variation of -7.7% in the quarter ended in March, with emphasis on negative contributions by private stocks, 2.9 p.p.; private consumption, 3.5 p.p.; and the external sector, 0.9 p.p.
The Japanese GDP registered annualized decline of 1.7% in the second quarter of 2011, the third consecutive decline according to this comparison basis, in spite of private consumption expansion, 2.4%, contributing with 1.4 p.p. to the GDP growth. Corporate gross fi xed capital formation, residential investments and exports turned in annualized quarterly declines of 1%, 11.9% and 22.9%, respectively, while investments and government consumption expanded by 32.6% and 2.7%. The industrial sector, which was strongly supported during the progressive recovery of the automotive sector’s assembly lines, registered monthly expansions of 5.8% in May and 3.8% in June.
After three consecutive declines, the Japanese GDP turned in annualized growth of 7.8% in the quarter ended in September. Private consumption and residential investments, following an upward trend, grew 4.3% and 20.6%, respectively, while government consumption and public investments registered respective variations of 0.9% and -3.8%. Exports and imports increased, respectively, by 39.6% and 14.8%, thus leading to a 3.1 p.p. contribution by the external sector to the annualized quarterly GDP expansion.
Japan’s GDP registered annualized expansion of 0.1% in the quarter ended in December 2011. This deceleration mainly resulted from reduced dynamics under private consumption, residential investment and government expenditures, which increased by 2.9%, 0.3% and 1.6%, respectively, in the period, as opposed to expansion of 22.3% under corporate gross fi xed capital formation. The external sector, revealing respective variations of -14.1% under exports and 3,8% under imports, contributed with -2.9 p.p.,

146 Boletim do Banco Central do Brasil – Annual Report 2011
a trajectory associated with the global economic deceleration, the yen appreciation and the interruption in some supply chains due to fl oods in Thailand.
In China, the annualized GDP variation, impacted by restrictive monetary policy measures, rose by 9.1% in the quarter ended in March, as against 10% in the quarter ended in December 2010. In year over year comparisons, the GDP expanded by 9.7% and 9.8% in the quarters under analysis, respectively. According to this comparison basis, industrial production, retail sales and investments in fi xed assets increased by 14.4%, 16.3% and 25.4%, respectively. In the fi rst quarter of the year, the external sector turned in a trade defi cit of US$0.7 billion, resulting from respective annual expansions of 32.8% and 26.4% under imports and exports.
In spite of the maintenance of the restrictive monetary policy scenario, the GDP registered annualized variation of 9.5% in the quarter ended in June, the same rate observed in terms of the year over year comparison. Retail sales and industrial production grew by 17.7% and 15.1%, respectively, in June, as compared to the same period in 2010. It should be noted that investments in fi xed assets, refl ecting administrative restraints imposed on the real state sector, grew 1.6% in June, as compared to May, against expansion of 2.5% in March.
The Chinese GDP registered annualized variation of 10% in the quarter ended in September. In terms of inter-annual variations, the GDP growth came to 9.1% in the quarter, while industrial production and investments in fi xed assets grew 14.2% and 24.9%, respectively.
Impacted by the lower dynamics of the foreign trade, the China’s GDP registered annualized increase of 7.8% in the quarter ended in December 2011. The inter-annual GDP variation came to 8.9% in the quarter, highlighting that this deceleration, as compared to the previous quarter, mainly refl ected declines under growth rates of exports and imports, to 14.3% and 20.6%, respectively. Still in terms of inter-annual comparison, the industrial aggregate value, retail sales and investments in fi xed assets increased by 13.9%, 17.1% and 23.8%, respectively.
Monetary policy and infl ation
In 2011, the dynamics of global infl ation was strongly conditioned by commodity prices, which, after following an upward trend in the beginning of the year, started to decline as of May, thus favoring infl ation deceleration throughout the second half of the year. In that period, in view of the sluggish global economic activity, the increase of risk aversion and the liquidity sinks, central banks of mature economies maintained basic interest at exceptionally low levels and resumed the adoption of easing monetary

VI The International Economy 147
measures, while, in most of emerging economies, the process of normalization of the monetary policy was interrupted.
In the U.S., even in the face of high unemployment rates and low level of utilization of output capacity, the CPI reached 3.9% in September, before declining to 3.0% in December, a trajectory conditioned by the performance of energy prices. Throughout the year, the 12-month variation of the CPI core followed an upward trend, moving from 1%, in January, to 2.2% in December.
In view of an economic recovery scenario that frustrated the expectations of economic agents, the Federal Reserve (Fed) kept the limits of the fl uctuation band of the Fed funds target at 0% and 0.25%, and the so-called quantitative easing II – sales of more than US$600 billion in long-term treasuries up to the end of the fi rst quarter. In August, the Fed Open Market Federal Committee announced the maintenance of the policy for reinvesting principal payments originating in the institution’s securities portfolio in new securities, and the likely maintenance of the Fed funds rates at exceptionally low levels up to 2013, thus representing the persistence of negative real interests at least up to the end of 2011. Additionally, in September, with the aim to force the reduction of long-term interest rates, support economic recovery and attain more accommodative fi nancial
012345678
Jun 2008
Aug Oct Dec Feb 2009
Apr Jun Aug Oct Dec Feb 2010
Apr Jun Aug Oct Dec Feb 2011
Apr Jun Aug Oct Dec
Source: USA – Fed, Euro Area – ECB, United Kingdom – BoE, Japan – BoJ and China – PBoC1/ USA – Fed funds, Euro Area – minimum bid rate, United Kingdom – Securities repurchase, Japan – Overnight call rate and China – 1-year working capital.
Graph 6.1Official interest rates1/
Annual rate (%)
USA Euro Zone United Kingdom Japan China
-8-6-4-202468
10
Dec 2008
Feb 2009
Apr Jun Aug Oct Dec Feb 2010
Apr Jun Aug Oct Dec Feb 2011
Apr Jun Aug Oct Dec
Source: Bureau of Labor Statistics1/ Producer and consumer prices.
Graph 6.2USA: Inflation1/
Annual percentage change
PPI CPI

148 Boletim do Banco Central do Brasil – Annual Report 2011
conditions, the Fed announced the Twist operation – acquisition of US$400 billion in long-term securities to be exchanged for short-term securities, up to June 2012 – and, with the purpose of improving the mortgage market operational conditions, declared its intention to reinvest debt maturities belonging to mortgage agencies and mortgage bonds issued by them and rollover the totality of maturing Treasury securities.
It should be noted that, on November 30, through a coordinated action with the aim to increase and diversify the liquidity provision to the global fi nancial system, the Fed, the Bank of Canada (BoC), the Bank of England (BoE), the Bank of Japan (BoJ), the European Central Bank (ECB) and the Swiss National Bank (SNB) established bilateral swap lines among their respective currencies, effective up to February 1, 2013, and reduced by 50 b.p. the liquidity swap rates in U.S. dollar between the Fed and the aforementioned central banks.
In the Euro Area, the annual variation of the Harmonized Consumer Price Index (HCPI) increased from 2.3% in January, to 3% in September, October and November, a trajectory infl uenced by the evolution of food and energy prices, with respective annual expansions of 3.1% and 9.7% in December, against 1.9% and 12% in January. Similarly, the HICP core increased from 1.1% to 1.6% in the period. In this context, the ECB increased basic interest rates twice, fi xing it at 1.5% p.y. in July. However, due to the worsening of the fi scal crisis and the deterioration of the region’s growth perspectives, the ECB reduced that rate, also twice, fi xing it at 1% in December, when expectations pointed to imminent infl ation deceleration.
Aiming to reestablish the functionality of the sovereign debt market and guarantee the effi cacy of monetary policy transmission mechanisms, the ECB resumed, since August, its program of repurchase of sovereign securities on the secondary market. In October, the monetary authority announced the Long-Term Refi nancing Operation (LTRO), whose maturity was extended to three years in the auction held on December 21, when €489.2 billion were allocated to 523 banks, at a fi xed rate and with limited supply.
-1.0
-0.5
0.0
0.5
1.0
1.5
2.0
2.5
3.0
3.5
Dec 2008
Feb 2009
Apr Jun Aug Oct Dec Feb 2010
Apr Jun Aug Oct Dec Feb 2011
Apr Jun Aug Oct Dec
Source: Bloomberg1/ Consumer prices.
Graph 6.3 Euro Area: Inflation1/
Annual percentage change
HICP HICP – Core
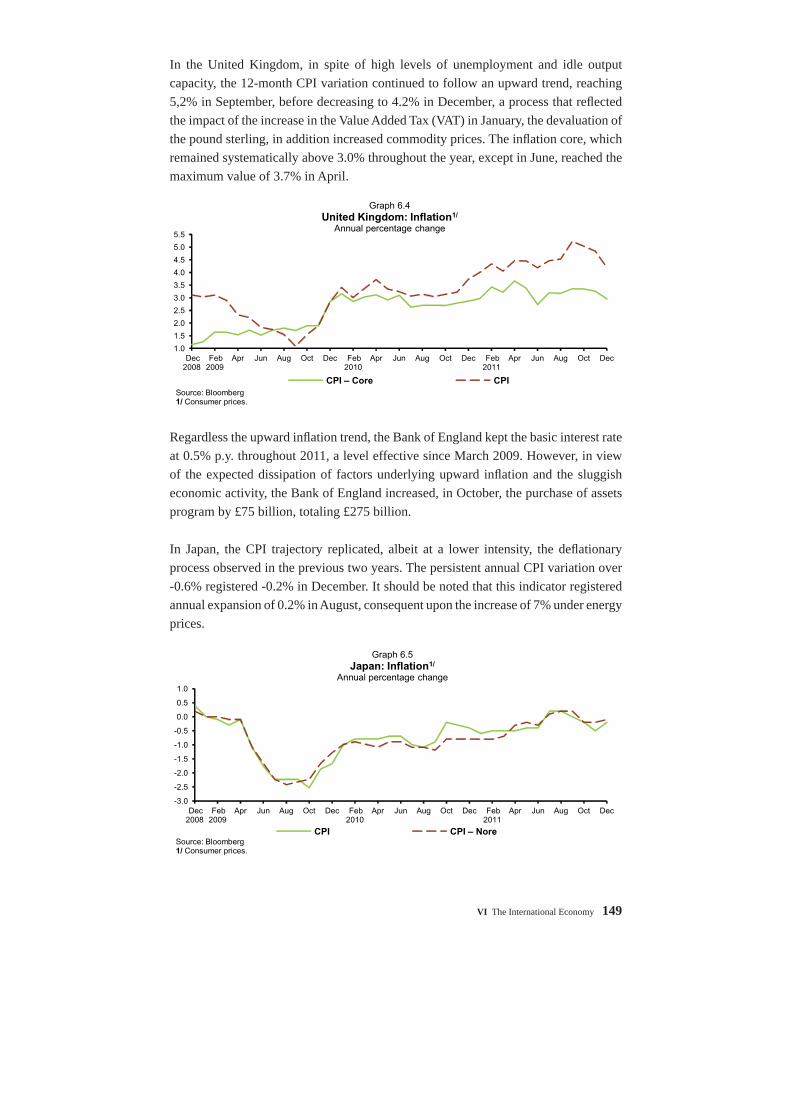
VI The International Economy 149
In the United Kingdom, in spite of high levels of unemployment and idle output capacity, the 12-month CPI variation continued to follow an upward trend, reaching 5,2% in September, before decreasing to 4.2% in December, a process that refl ected the impact of the increase in the Value Added Tax (VAT) in January, the devaluation of the pound sterling, in addition increased commodity prices. The infl ation core, which remained systematically above 3.0% throughout the year, except in June, reached the maximum value of 3.7% in April.
Regardless the upward infl ation trend, the Bank of England kept the basic interest rate at 0.5% p.y. throughout 2011, a level effective since March 2009. However, in view of the expected dissipation of factors underlying upward infl ation and the sluggish economic activity, the Bank of England increased, in October, the purchase of assets program by £75 billion, totaling £275 billion.
In Japan, the CPI trajectory replicated, albeit at a lower intensity, the defl ationary process observed in the previous two years. The persistent annual CPI variation over -0.6% registered -0.2% in December. It should be noted that this indicator registered annual expansion of 0.2% in August, consequent upon the increase of 7% under energy prices.
1.0
1.5
2.0
2.5
3.0
3.5
4.0
4.5
5.0
5.5
Dec 2008
Feb 2009
Apr Jun Aug Oct Dec Feb 2010
Apr Jun Aug Oct Dec Feb 2011
Apr Jun Aug Oct Dec
Source: Bloomberg1/ Consumer prices.
Graph 6.4United Kingdom: Inflation1/
Annual percentage change
CPI – Core CPI
-3.0
-2.5
-2.0
-1.5
-1.0
-0.5
0.0
0.5
1.0
Dec 2008
Feb 2009
Apr Jun Aug Oct Dec Feb 2010
Apr Jun Aug Oct Dec Feb 2011
Apr Jun Aug Oct Dec
Source: Bloomberg1/ Consumer prices.
Graph 6.5 Japan: Inflation1/
Annual percentage change
CPI CPI – Nore

150 Boletim do Banco Central do Brasil – Annual Report 2011
Aiming to fi ght against defl ationary pressures and the yen appreciation, the Bank of Japan reinforced its commitment with the interest rate policy between 0% and 0.1% until achieving the annual infl ation target of up to 2%, centered at 1%. Additionally, in order to assure fi nancial stability, the Bank of Japan invested more than ¥15 trillion on local markets shortly after the March earthquake. In April, the Bank of Japan expanded from ¥5 trillion to ¥40 trillion the Assets Acquisition Program implemented in October 2010, and established, as part of the reconstruction efforts, a mechanism to grant funds to fi nancial institutions located in the affected areas. In October, the program value reached ¥55 trillion.
In China, the annual CPI variation increased from 4.6%, in December 2010, to 6.5% in July 2011, a period in which the annual food infl ation increased from 9.6% to 14.8%. However, throughout the second half of the year, food prices registered a signifi cant deceleration, with the respective index turning in annual variation of 9.1% in December 2011, a month in which the CPI rose by 4.1%, the lowest level since September 2010.
In this context, at the beginning of the year, the Bank of China adopted the infl ation control as its priority macroeconomic policy. In January, aiming to curb the infl ation of goods and services and to restrain the climbing of real estate asset prices, the Bank of China increased from 50% to 60% the initial parcel for the acquisition of a second residential property, and established more severe fi scal restrictions on resale. In February, April and July, the Bank of China increased the basic interest rate to 6.06%, 6.31% and 6.56%, respectively. Additionally, the Bank increased the compulsory rate in six occasions, reaching 19.5% in June for small banks and 21.5% for large institutions. In December, in view of the country’s economic deceleration process, the Bank of China initiated a new fl exibility phase of the monetary policy. The Bank of China, maintaining basic interest rates unchanged, cut the compulsory payment rates of small and large banks to 19% and 21%, respectively.
-9
-7
-5
-3
-1
1
3
5
7
9
Dec 2008
Feb 2009
Apr Jun Aug Oct Dec Feb 2010
Apr Jun Aug Oct Dec Feb 2011
Apr Jun Aug Oct Dec
Source: Bloomberg1/ Consumer prices.
Graph 6.6 China: Inflation1/
Annual percentage change
CPI PPI

VI The International Economy 151
International fi nancial market
At the beginning of the year, stock markets refl ected the optimism about the sustainability of the U.S. economic recovery. In March, however, market volatility increased due to the worsening of geopolitical tensions in the Middle East and the earthquake in Japan. In May, in view of the worsening of the European fi scal situation and the moderation of economic growth in the U.S. and in the Euro Area, fi nancial markets registered a further deterioration.
From August till the beginning of December, the worsening of the fi scal crisis in Europe, the fragility of the European banking system, the impasse on the U.S. debt-ceiling, which resulted in the reduction of the country’s credit rating by one of the risk rating agencies, and the increased fears about a new recession in the U.S. and the signifi cant economic slowdown in China, contributed to maintain volatility and risk aversion at high levels. Thereafter, the wide liquidity injection by the ECB in the European banking system, coupled with recovery signs in the U.S. contributed to recover global fi nancial markets.
Stock markets of chief mature economies registered losses in 2011. The Nikkei, of Japan; the Deutscher Aktienindex (DAX), of Germany; and the Financial Times Securities Exchange Index (FTSE 100), of the Unites Kingdom, registered respective annual decreases of 17.3%, 14.7% and 5.6%, while the Standard & Poor’s 500 index, of the U.S., registered stability. It should be noted that losses occurred mostly with regard to stocks of the fi nancial sector, refl ecting uncertainties in the European debt market and the fragile economic recovery in the U.S.
The Chicago Board Options Exchange Volatility Index (VIX), of the Chicago Board Options Exchange, which measures the short-term implicit volatility of the S&P500 and is considered an important measure of risk aversion, after remaining at a level lower than 15 points at the end of April, reached 48 points on August 8, in a scenario of reduction of the long-term U.S. sovereign credit rating. The annual average of this
40
60
80
100
120
140
1.32010
3.10 5.15 7.20 9.24 11.29 2.32011
4.10 6.15 8.20 10.25 12.30
31.1
2..2
005
= 10
0
Source: Bloomberg
Graph 6.7Stock exchanges – USA, United Kingdon, Japan and German
R.U. Alemanha Nikkey 225 S&P 500

152 Boletim do Banco Central do Brasil – Annual Report 2011
indicator increased by 1.6 p.p. in 2011, reaching 24.1 points, registering a higher monthly average value in August, 35 points.
Stock markets of leading emerging economies were affected by the increased risk aversion in mature economies, and fears about the Chinese economic deceleration coupled with the adoption of a more restrictive monetary policy aiming to curb local infl ation pressures. In this context, the Ibovespa, of Brazil; the Istanbul Stock Exchange National 100 Index (XU100), of Turkey; the Bombay Stock Exchange Sensitive Index (Sensex), of India; and the Shanghai Composite, of China, registered respective losses of 9.4%, 12.4%, 17.8%, and 18.6% in the year.
The reduction of the sovereign U.S. credit rating, the fears of a sovereign debt default in Greece and the increased uncertainties about the fi scal trajectory of European mature economies affected, since August, the Italian sovereign debt, whose risk premiums surpassed those of Spain, thus pressuring European sovereign debt markets. The exposure of French banks to the Italian sovereign debt resulted in the increase in the country’s sovereign risk premiums. In this scenario, sovereign risk premiums, measured by the Credit Default Swaps (CDS) of Greece, Portugal, Italy, Spain and France reached, in 2011, the highest levels of the historical series. However, in December, after the liquidity
10
20
30
40
50
60
70
80
1.2 2009
4.3 7.3 10.2 1.1 2010
4.2 7.2 10.1 12.31 4.12011
7.1 9.30 12.30
Source: Bloomberg
Graph 6.8 VIX
South Africa (JALSH)
Brazil (Ibovespa)
China (Shangai)
Korea (KOSPI)
Hungary (BUX)
India (Sensex)
Mexico (IPC)
Turkey (XU100)
-30 -20 -10 0 10 20 30
Graph 6.9Stock exchanges – Emerging markets
Percentual change in 2008 and 2009 in local currency
2010 2011Source: Bloomberg
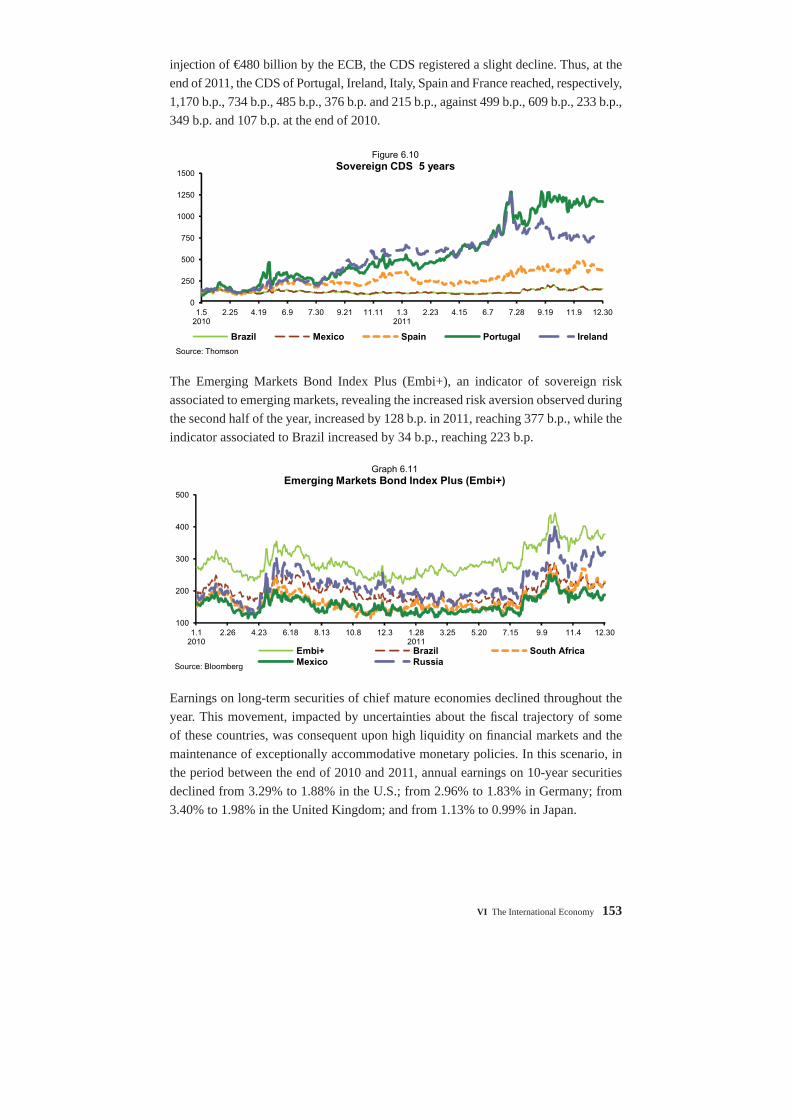
VI The International Economy 153
injection of €480 billion by the ECB, the CDS registered a slight decline. Thus, at the end of 2011, the CDS of Portugal, Ireland, Italy, Spain and France reached, respectively, 1,170 b.p., 734 b.p., 485 b.p., 376 b.p. and 215 b.p., against 499 b.p., 609 b.p., 233 b.p., 349 b.p. and 107 b.p. at the end of 2010.
The Emerging Markets Bond Index Plus (Embi+), an indicator of sovereign risk associated to emerging markets, revealing the increased risk aversion observed during the second half of the year, increased by 128 b.p. in 2011, reaching 377 b.p., while the indicator associated to Brazil increased by 34 b.p., reaching 223 b.p.
Earnings on long-term securities of chief mature economies declined throughout the year. This movement, impacted by uncertainties about the fi scal trajectory of some of these countries, was consequent upon high liquidity on fi nancial markets and the maintenance of exceptionally accommodative monetary policies. In this scenario, in the period between the end of 2010 and 2011, annual earnings on 10-year securities declined from 3.29% to 1.88% in the U.S.; from 2.96% to 1.83% in Germany; from 3.40% to 1.98% in the United Kingdom; and from 1.13% to 0.99% in Japan.
0
250
500
750
1000
1250
1500
1.52010
2.25 4.19 6.9 7.30 9.21 11.11 1.32011
2.23 4.15 6.7 7.28 9.19 11.9 12.30
Brazil Mexico Spain Portugal Ireland
Source: Thomson
Figure 6.10Sovereign CDS 5 years
100
200
300
400
500
1.12010
2.26 4.23 6.18 8.13 10.8 12.3 1.282011
3.25 5.20 7.15 9.9 11.4 12.30
Source: Bloomberg
Graph 6.11 Emerging Markets Bond Index Plus (Embi+)
Embi+ Brazil South Africa
Mexico Russia
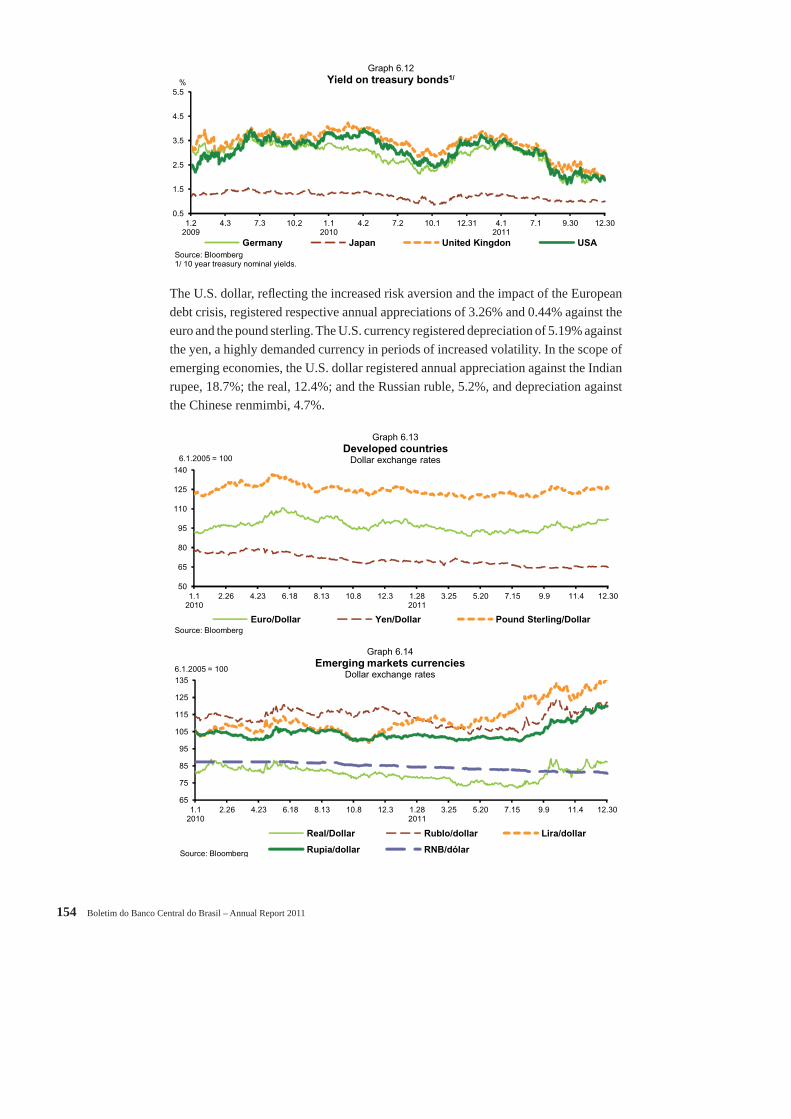
154 Boletim do Banco Central do Brasil – Annual Report 2011
The U.S. dollar, refl ecting the increased risk aversion and the impact of the European debt crisis, registered respective annual appreciations of 3.26% and 0.44% against the euro and the pound sterling. The U.S. currency registered depreciation of 5.19% against the yen, a highly demanded currency in periods of increased volatility. In the scope of emerging economies, the U.S. dollar registered annual appreciation against the Indian rupee, 18.7%; the real, 12.4%; and the Russian ruble, 5.2%, and depreciation against the Chinese renmimbi, 4.7%.
0.5
1.5
2.5
3.5
4.5
5.5
1.2 2009
4.3 7.3 10.2 1.1 2010
4.2 7.2 10.1 12.31 4.12011
7.1 9.30 12.30
%
Source: Bloomberg1/ 10 year treasury nominal yields.
Graph 6.12Yield on treasury bonds1/
Germany Japan United Kingdon USA
50
65
80
95
110
125
140
1.12010
2.26 4.23 6.18 8.13 10.8 12.3 1.282011
3.25 5.20 7.15 9.9 11.4 12.30
6.1.2005 = 100
Source: Bloomberg
Graph 6.13Developed countries
Dollar exchange rates
Euro/Dollar Yen/Dollar Pound Sterling/Dollar
65
75
85
95
105
115
125
135
1.12010
2.26 4.23 6.18 8.13 10.8 12.3 1.282011
3.25 5.20 7.15 9.9 11.4 12.30
Real/Dollar Rublo/dollar Lira/dollar
Rupia/dollar RNB/dólar
Graph 6.14Emerging markets currencies
Dollar exchange rates6.1.2005 = 100
Source: Bloomberg

VI The International Economy 155
Commodities
International commodity prices, maintaining the upward trend begun in the second half of 2010, expanded sharply at the beginning of 2011. This trajectory, which refl ected strong supply shocks in the context of high international liquidity levels, was interrupted as of the second quarter of the year, in response to deteriorating perspectives of global economic activity growth, increasing risk aversion on fi nancial markets and progressive improvement of supply conditions. Notwithstanding the persistence of this downward price trajectory up to the end of the year, the average 2011 prices, refl ecting the strong expansion observed at the beginning of the year, reached historic records for the majority of commodities.
The Commodities Index – Brazil (IC-Br), calculated by the Central Bank of Brazil, decreased by 0.35% in 2011, being partly offset by the depreciation of the real in the period, resulting from respective variations of -0.48%, -10.78% and 13.50% under agricultural, metallic and energetic commodities. In terms of annual averages, the indicator grew by 22.56% in 2011.
In the two fi rst months of 2011, agricultural commodity prices maintained the trajectory of signifi cant appreciation begun in the second half of 2010, resulting from adverse weather conditions in leading producing regions and the robust demand by important emerging markets. As of the second quarter of the year, the conjunction of favorable perspectives for the harvest 2011/2012, the slowdown of global economic activity and the increased risk aversion led to strong volatility and a declining price trend in this segment up to the end of the year. In this scenario, the average S&P Goldman Sachs indices referring to December 2010 and December 2011 registered expansion, in U.S. dollar, under prices of corn, 2.4%; and coffee, 1.8%, as against decreases under prices of cotton, 36.8%; sugar, 24.7%; wheat, 21.1%; and soybeans, 13.2%.
Similarly, the prices of metallic commodities also followed an upward trend at the beginning of the year, infl uenced by the strong Chinese demand and interruption in the
60
70
80
90
100
110
120
130
140
150
160
Dec 2006
Apr2007
Aug Dec Apr2008
Aug Dec Apr2009
Aug Dec Apr2010
Aug Dec Apr 2011
Aug Dec
2005
= 1
00
Source: BCB
Graph 6.15 IC-Br Index
IC-Br IC-Br Agriculture IC-Br Metal IC-Br Energy

156 Boletim do Banco Central do Brasil – Annual Report 2011
supply of some metals. Throughout the second half of the year, refl ecting deteriorated perspectives for the growth rates of the global economy and increased risk aversion, markets slowed down. In terms of monthly averages, the S&P Goldman Sachs Indices in 2011 and 2010 registered declines under the prices of nickel, 24.3%; copper, 17.1%; zinc, 16.7%; lead, 15.9%; and aluminum, 14.2%.
In 2011, according to data from the Metal Bulletin, the average monthly price of the iron ore at 63.5% content in the Chinese spot market decreased by 17.4%, as a result of moderate Chinese demand and the deterioration of growth perspectives for the global economy. It should be noted that this commodity price decreased by 22.9% in the fourth quarter of the year, refl ecting the reduction of demand by Chinese steelworks plants, which, in view of uncertainties concerning the performance of the country’s civil construction sector, reduced the steel production and prioritized the utilization of iron stocks.
Refl ecting the intensifi cation of geopolitical tensions, which resulted in the interruption of Libyan exports in the fi rst quarter of the year, the average prices of oil barrels Brent and WTI types followed an increasing trend at the beginning of 2011, reaching US$123.04 and US$109.96, respectively, in April. As of May, prices started to refl ect the deceleration of the global economy and, in the second half of the year, the resumption of the Libyan exports. In this context, the average prices of oil barrels Brent and WTI types reached US$107.91 and US$98.56 in December, rising 17.5% and 10.6%, respectively, as compared to the same period in 2010.
30
45
60
75
90
105
120
135
150
Dec 2007
Mar 2008
Jun Sep Dec Mar 2009
Jun Sep Dec Mar 2010
Jun Sep Dec Mar 2011
Jun Sep Dec
US
$ pe
r ba
rrel
Source: Bloomberg
Graph 6.16Brent oil – Spot market

VII International Financial Organizations 157
International Financial Organizations
VII
7/ IMF Articles of Agreement were incorporated to the Brazilian legal system by Decree-Law no. 8,479, dated December 27, 1945.
8/ The 2010 Reform of Quotas should be effective in 2012, increasing Brazil’s participation to 2.32%.9/ Established in 1997, the NAB expects that members provide IMF with resources (as loans or notes)
upon the IMF Director-Manager request subject to the approval by 85% of members.
International Monetary Fund
The IMF was created at the Conference of Bretton Woods on July 22, 1944, and its activities begun on December 27, 1945, when 29 countries, including Brazil, signed the Articles of Agreement7. At the end of 2011, the Fund encompassed 187 member countries.
IMF’s mission is to ensure the proper functioning of the global fi nancial system through the promotion of international monetary co-operation, exchange rate stability and economic growth. The key IMF’s activities are: granting loans to countries in diffi culty; monitoring local and global economic conditions (surveillance) and providing technical assistance and economic advice.
IMF is an organization based on quotas, which represent each country’ fi nancial contribution and infl uence on the institution’s decision power. IMF capital totaled SDR238 billion at the end of 2011. Brazilian quotas in the Fund totaled SDR4.25 billion, accounting for 1.79% of the total IMF’s quotas8.
In order to accomplish its fi nancing activities, the IMF, in addition to resources raised by means of quotas, obtains funds from member countries. During 2011, Brazil started to co-operate more effectively in this regard, by contributing to the enlargement of the New Arrangements to Borrow (NAB)9. The expanded NAB, which consolidates a series of bilateral agreements with the purpose of providing IMF with loans and other additional resources, amounts to SDR367.5 billion (US$575.5 billion). Brazil’s contribution to the NAB added up SDR750 million (US$1.17 billion) at the end of 2011.
In 2011, credit lines made available by the Fund were also reviewed. The Flexible Credit Line (FCL) and the Precautionary Credit Line (PCL), established in 2009 and 2010, respectively, were re-evaluated in terms of their effectiveness in providing countries

158 Boletim do Banco Central do Brasil – Annual Report 2011
with solid economic positions with resources in a precautionary way and reduced requirements to be fulfi lled. To this end, discussions about the fl exibility of terms and criteria to accede to the PCL resulted in the establishment of the Precautionary and Liquidity Line (PLL), a broader mechanism than the PCL.
IMF’s monitoring activities (surveillance) are traditionally focused on the annual assessment of each member country’s economy, regulated by Article IV of the Articles of Agreement. This assessment includes fi scal, monetary, fi nancial, and exchange aspects, with the aim to check whether policies implemented by member countries contribute to both domestic and external stability. To this end, the Brazilian Central Bank, together with other public administration bodies, participated once more in the fulfi llment of the IMF’s assessment missions. The fi nal IMF message, issued on July 2011, was positive with regard to the country’s macroeconomic management and solidity of economic policies, which contributed to improve the country’s growth capacity, resistance to external shocks and social equity.
Another bilateral IMF assessment tool is the Financial Sector Assessment Program (FSAP), conducted jointly with the World Bank, aiming to supervise two aspects: the country’s degree of fi nancial stability and the level of fi nancial development. In 2011, with the beginning of activities of the new Brazilian FSAP, the Central Bank received, in September, an introductory mission composed by members of both institutions with the aim of introducing the program’s chief guidelines.
As FSAP supporting element, the country will be also subjected to the Reports on the Observance of Standards and Codes (ROSC), which evaluate the level of compliance with international standards in several areas. Brazil opted to be subjected to seven ROSCs in the current FSAP edition. Four of them, under the World Bank responsibility, initiated the evaluation at the end of 2011: Accounting and Auditing; Corporate Governance; Payments Systems; Insolvency and Creditor Rights. The other 3 ROSCs are evaluated by the IMF and will be carried out at the beginning of 2012: Banking Supervision, Securities Regulation, and Insurance Supervision.
In addition to the bilateral monitoring, IMF conducts a multilateral monitoring, consolidating assessments in its studies and elaborating evaluations of the world economy as a whole. The most relevant studies are the World Economic Outlook (WEO), the Global Financial Stability Report (GFSR), and the Fiscal Monitor, all of them published biannually.
In 2011, the IMF’s multilateral surveillance activities were signifi cantly overhauled, with the introduction of two reports: the “Spillover Reports” and the “Consolidated Multilateral Surveillance Report” (CMSR). The fi rst report, elaborated in the framework of the fi ve regions holding the greatest systemic infl uence (U.S., China, Japan, England and the Euro Area), identifi ed the impacts of domestic policies of this group in the
VII International Financial Organizations 159
economy of other countries. The second report combines the messages of different IMF publications (WEO, GFSR, Fiscal Monitor, etc.) in a single message. The CMSR was published during the Annual IMF Meeting, held in September 2011.
G-20
G-20 is an informal forum that promotes discussion between industrialized and emerging countries on key issues related to the global economic stability. The Group supports worldwide growth and development by strengthening the international fi nancial architecture and providing opportunities for dialogue on national policies and international co-operation.
Established in response to the fi nancial crisis on the late 90s, the G-20 refl ects more accurately the diversity of interests of industrialized and emerging economies, thus having greater representation and legitimacy. G-20 is composed by the Finance Ministers and Central Bank Governors from 19 countries10 and the rotating presidency of the European Union Council and the European Central Bank. Furthermore, in order to ensure simultaneous activities with international institutions, the IMF Managing Director and the World Bank Governor participate ex offi cio in the meetings.
The presidency of the Group changes every year, rotating among members, and the country in charge is responsible for establishing an interim secretariat during its tenure.
In 2011, the G-20 held one Summit and four meetings with Finance Ministers and Central Bank Governors. The intense debate about the origins of the last crisis led the G-20 to focus on the chief performance lines: correction of macroeconomic unbalances; strengthening of regulatory aspects; and reform of the international monetary system. Moreover, the Group’s agenda had to include current matters such as the growth recovery in developed economies; commodity prices volatility, and erratic capital fl ows to emerging economies.
The reduction of macroeconomic unbalances is an essential G-20 objective, a matter discussed by the Framework Work Group. In addition to focusing on countries facing more severe economic unbalances, the group has required countries to increase their commitment with actions aiming to achieve a more robust, sustainable and balanced growth. Therefore, G-20 countries will renew the submission of a list detailing the measures adopted to ensure the growth. In relation to this activity, Brazil announced the adoption of the following guidelines:
10/ South Africa, Germany, Saudi Arabia, Argentina, Australia, Brazil, Canada, China, South Korea, France,

160 Boletim do Banco Central do Brasil – Annual Report 2011
a) To maintain the primary surplus of the consolidated public sector around the target of 3.1% of GDP in the period 2012-2014, guaranteeing a fi scal policy that promotes a downward trend for the debt/GDP ratio;
b) To avoid risks to the macroeconomic and fi nancial stability associated with the abundance of volatile capital and the accelerated credit expansion, by resorting to macro-prudential and similar measures;
c) To improve the quality and expand several segments of the economic and social-urban infrastructure, by means of public investment expansion (Growth Incentive Program – PAC 2);
d) To stimulate the social inclusion, eradication of extreme poverty and expand opportunities for vulnerable segments of the population (multi-sectional program “Brazil without Misery”); and
e) To carry out additional investments for the sporting events to be held in the country in the following years (2013 FIFA Confederations Cup, 2014 FIFA World Cup, and 2016 Olympic Games).
G-20 increased the number of discussed matters by means of the composition of study or work groups (GTs). These groups, in which participation is voluntary, tend to aggregate all member countries and some important international organizations.
In this regard, together with periodic events, the G-20 discussed, in 2011, in the scope of the GTs, in addition to the aforementioned Framework, about instruments to improve the International Monetary System (IMS) functioning; a new regulatory framework; and the volatility and other aspects related to the commodity markets. Brazil participated actively in the IMS, as coordinator, together with Germany, in one of the work subgroups referred to as the Capital Flows Management (CFM).
The CFM agenda included discussions about the integration of economic policies in view of the international capital volatility, as well as the utilization and usefulness of macro-prudential and capital control measures. Brazil organized two seminars, one of them carried out by the Central Bank, together with the World Bank, about Monetary Policy and Macro-prudential Regulation. In terms of results, this subgroup elaborated a report with conclusions about the experiences of G-20 countries in the management of capital fl ows and an Action Plan about the issue of securities in local currency.
Moreover, the subgroup of Global Liquidity Management (GLM) was established to discuss about the management of reserves, fi nancial protection networks, the composition of the SDR role and the measures concerning global liquidity.
In the Summit of Cannes, the Group’s presidency was transferred to Mexico, which included in the agenda for 2012 the prioritization of discussions about the areas involving economic stabilization; strengthening of the fi nancial system and fi nancial inclusion; international fi nancial architecture; food security and commodities volatility; and
VII International Financial Organizations 161
promotion of sustainable development and green growth. It was also announced that Russia will assume G-20 presidency in 2013, Australia in 2014, and Turkey in 2015.
Bank for International Settlements (BIS)
The Bank for International Settlements (BIS) is an organization founded in 1930, and its mission is to assist central Banks and fi nancial authorities in the maintenance of monetary and fi nancial stability, promote international co-operation in these areas and act as a bank for central banks. The Central Bank of Brazil is a BIS shareholder since March 25, 1997, with 3,000 subscribed shares for the amount of SDR15 million.
In 2011, revealing the institution’s effort to diversify its composition, four countries were incorporated to BIS, two of them of the Latin America: Colombia, Peru, United Arab Emirates, and Luxembourg.
With the aim of promoting fi nancial stability, BIS coordinates the Basle Committee on Banking Supervision; the Committee on Payment and Settlement Systems; the Committee on the Global Financial System; and the Committee on Markets, which are granted a high degree of autonomy for structuring their agendas and activities.
In the role of bank for central Banks, BIS offers a wide variety of banking services, especially designed to assist in the management of reserves. Approximately 140 institutions, including central banks, resort to this service. On average, over recent years, about 6% of global international reserves have been deposited by central banks with the BIS.
In addition to the Annual General Assembly, which is usually held in June, bimonthly high-level technical meetings, restricted to central bank governors and, at most, one more special advisor, are also carried out, among which it should be highlighted the Global Economy Meeting (GEM) and the Meeting of Central Bank Governors.
The key purpose of the GEM, which brings together 30 Central Bank governors of BIS permanent shareholders (including Brazil), plus 15 observers, is to monitor economic and fi nancial developments and assess risks and opportunities in the world economy and in the global fi nancial system. In addition, the GEM started to coordinate the activities of the Committee on Payment and Settlement Systems (CPSS), the Committee on the Global Financial System (CGFS), and the Committee on Markets. In order to assist the GEM in the elaboration of proposals for discussion and decision, the BIS board created the Economic Consultative Committee (ECC), composed of 15 members of the Board, the General BIS Manager and the governors of the Mexican and Indian Central Banks. The Basle Committee on Banking Supervision (BCBS) directs its efforts at supervising

162 Boletim do Banco Central do Brasil – Annual Report 2011
individual institutions and their relation with the macro-prudential supervision. Throughout 2011, the Basle Committee worked hardly in the rules of Basle III, with more stringent provisions to the fi nancial system, especially with regard to banking capital levels. In October 2011, a report was published about the implementation of the new rules.
The Committee on Payment and Settlement Systems (CPSS) works in partnership with the International Organization of Securities Commissions (Iosco), analyzing and implementing standards for the systems of payment, settlement and clearing. Among its main products, it should be mentioned the publications about payment systems and other infrastructures underlying the fi nancial market of several countries, the so-called “red books”. In 2012, a new red book should be published, the fi rst to include the countries incorporated to the CPSS (currently totaling 24, including Brazil).
The key function of the Committee on the Global Financial System (CGFS) is to monitor the development of fi nancial markets of major central Banks. The Committee’s goal is to identify and evaluate potential sources of stress in global fi nancial markets and thereby promote market stability and improvement. In 2011, the CGFS dealt with the topic Interactions of Sovereign Debt Management with Monetary Conditions and Financial stability. The report concluded that the recent fi nancial crisis radically changed the environment in which sovereign debt managers and central banks are required to operate. One of the statements is that central banks may benefi t from the conduction of activities related to sovereign debt management.
The Committee on Markets is a forum for monitoring the development, operation and likely fi nancial market trends with the purpose of facilitating the exchange of information among the members on short-term implications of recent events on the markets functioning and central bank operations.
In the Financial Stability Board (FSB), an agency coordinated by the BIS, Brazil has participated actively in discussions on the reform of global prudential regulatory standards and the promotion of co-operation between national authorities, international organizations and regulatory agencies. In 2011, the FSB continued to maintain a close relation with the G-20, focusing on questions such as systematically important fi nancial institutions, shadow banking, among others. In 2011, the FSB also expanded its activities in order to refl ect the global nature of the fi nancial system, by means of the establishment of fi ve regional consultative groups. Discussions were also initiated about the possibility of transforming the FSB in a formal institution, with its own staff, governance and budget.
The Brazilian Central Bank participates in the Americas Advisory Council, created in 2008 and composed by central bank’s governors of BIS members in the region, with the aim of improving the organization’s performance in the region so as to better refl ect
VII International Financial Organizations 163
the needs and interests of the Americas in the work program. Finally, the BCB also represents the country in the Irving Fisher Committee on Central Bank Statistics.
Center for Latin American Monetary Studies (Cemla)
Cemla, an organization established in 1952, is a civil association with legal domicile in Mexico City, with the objectives to promote a better understanding of monetary and banking issues in the Latin America and the Caribbean; assistance in training the staff of central Banks and other fi nancial agencies in the region; research and systematization of results in the aforementioned fi elds; and dissemination of information to members about events of international and regional interest in the scope of monetary and fi nancial policies.
Cemla is currently composed of 53 institutions, of which 30 are central banks holding voting and voice power. The other institutions are divided between collaborative members and staff assistants, holding only voice power.
The Center management is provided by the Governors Assembly and the Board of Government, advised by the Alternates Committee and the Auditing Committee. The elective offi ce of the deputy general director, the second most important in the institution, has been traditionally occupied by the BCB.
In 2011, the Cemla faced an important administrative update: the creation of the Editorial Committee, responsible for the project aiming to raise the quality of Cemla’s publications to high levels in the region. The Committee’s structure includes research directors of Cemla’s main central bank members, including Brazil.
It is worth mentioning the conclusion of the process for reviewing annual fi nancial contributions by Cemla’s member countries. The proposal of increasing quotas by 50% was ratifi ed, as well as the quota’s review every 4 years. The annual Brazilian contribution adds up to US$425 thousand.
During 2011, the Cemla offered 60 events and 7 technical assistance missions, often in conjunction with other organizing institutions. Out of these activities, approximately 45% focused on the area of training. Regarding the distribution of events by subject matter, the Cemla maintained in 2011 the guideline of focusing on issues related to the crisis, especially about macroeconomic aspects and fi nancial stability.

164 Boletim do Banco Central do Brasil – Annual Report 2011
The Cemla organized, in partnership with the Brazilian Central Bank, the annual seminar of the Program for Improving Central Bank Reporting and Procedures in the Area of Remittances, dealing specifi cally with Remittances and Migration.

VIII Main Economic Policy Measures 165
Constitutional Amendment
68, dated 12.21.2011 – Approved the prorogation of the Release of Federal Government Resources Entitlements (DRU) up to December 31, 2015. By means of this mechanism, R$62.4 billion of the Federal Budget of 2012 were converted to funds for free programming.
Supplementary Law
139, dated 11.10.2011 – Increased by 50% the limits of the annual Gross income for purposes of classifi cation of micro-enterprises and small companies into the differentiated tributary regime (Simplifi ed Taxation System). Such limits increased to R$360 thousand and R$3.6 million, respectively. Besides, increased from R$36 thousand to R$60 thousand the gross income value for purposes of classifi cation o informal workers into the category of individual micro-entrepreneur.
Laws
12,380, dated 1.10.2011 (conversion of the Provisional Measure no. 500, dated 8.30.2010) – Authorized the Federal Government and entities of the federal indirect public administration to contract, reciprocally, or with private fund of which the National Treasury be a single shareholder, the acquisition, conveyance, assignment and share swap, and assignment of credits resulting from advances for future increase of capital, the assignment of overriding allocation of shares in public supplies or the assignment to the right of preference for the subscription of shares in increase of business capital, in which have share participation, and adopted other precautionary measures.
12,381, dated 2.9.2011 – Estimated the incomes and fi xed the expenditures of the Federal Budget related to the fi scal year 2011.
12,382, dated 2.25.2011 – Set in R$545.00 the minimum wage, which came into force on March 1, 2011, and established rules to set the value that will come into force in the period 2012-2015.
VIIIMain Economic Policy Measures

166 Boletim do Banco Central do Brasil – Annual Report 2011
12,385, dated 3.3.2011 – Provided for the provision of fi nancial assistance by the Federal Government to the States, the Federal District and the Municipalities, in the fi scal year 2010, in order to promote the country’s exports; modifi ed the conditions for the concession of subsidy in fi nancing operations, according to the Article 1 of Law no. 12,096, dated November 24, 2009, and repealed devices of Laws no. 10,260, dated July 12, 2001, and 12,096, dated November 24, 2009.
12,397, dated 3.23.2011 (conversion of the Provisional Measure no. 505, dated 9.24.2010) – Authorized the Federal Government to grant credit to the Brazilian Development Bank (BNDES), amounting to R$30 billion, aiming to make it feasible to the bank to participate in the equity offer of Petrobras.
12,402, dated 5.2.2011 (conversion of the Provisional Measure no. 510, dated 10.28.2010) – Regulated the fulfi llment of the tax obligations by consortiums, which carry out the contracting, on their own behalf, on behalf of legal persons and individuals, with or without employment bonds.
12,404, dated 5.4.2011 (conversion of the Provisional Measure no. 511, dated 11.5.2010) – Authorized the Federal Government to create the “Empresa de Transporte Ferroviario de Alta Velocidade S.A.”, and guarantee a fi nancing of up to R$20 billion between the Brazilian Development Bank (BNDES) and the concessionaire which will explore such mode of transport.
12,407, dated 5.19.2011 (conversion of the Provisional Measure no. 512, dated 11.25.2010) – Prorogated up to 2020 the fi scal incentives granted to automotive industries located on the North, Northeast and Central-West regions.
12,409, dated 5.25.2011 (conversion of the Provisional Measure no. 513, dated 11.26.2010) – Authorized the Wage Variation Compensation Fund (FCVS) to assume rights and obligations of the Homeowner Insurance of the Housing Financing System; authorized the Federal Government to issue, in favor of the Sovereign Fund of Brazil, securities of the Federal Public Securities Debt.
12,431, dated 6.24.2011 (conversion of the Provisional Measure no. 517, dated 12.30.2010) – Provided for the incidence of the income tax on specifi c operations, modifi ed the Laws no. 6,404, dated December 15, 1976, no. 9,430, dated December 27, 1996, no. 11,478, dated May 29, 2007, and 12,350, dated December 20, 2010, created the Special Incentive System for the Development of Nuclear Power Plants (Renuclear), provided for tax measures related to the Internet Access National Plan, modifi ed the legislation related to the exemption of the Additional Charge on Freight (AFRMM), provided for the extinction of the Development National Fund, among other measures.
VIII Main Economic Policy Measures 167
12,453, dated 7.21.2011 (conversion of the Provisional Measure no. 526, dated 3.4.2011) – Increased from R$134 billion to R$209 billion the limit of fi nancing operations with economic subsidy under the modality of interest rate equalization, organized by the Brazilian Development Bank (BNDES).
12,465, dated 8.12.2011 – Provided for the guidelines, priorities of expenditures and rules and parameters that should guide the elaboration of the annual budget law project, which will be submitted to the National Congress up to August 31, 2011. Also provided for the most relevant goals of the Federal Public Administration, the organization and guidelines for the elaborations and execution of the federal budgets and the dispositions related to the federal public debt. The primary surplus target, for the nonfi nancial consolidated public sector, was set at R$139.8 billion (3.5% of GDP), of which R$97 billion should be considered by the Social Security and Fiscal Budget, and R$42.8 billion by regional governments. The primary surplus target may be reduced up to the sum of R$40.6 billion related to the Growth Incentive Program (PAC).
12,469, dated 8.26.2011 (conversion of the Provisional Measure no. 528, dated 3.25.2011) – Modifi ed the values contained in the table of the Individual Income Tax, which will come into force in the calendar years 2011, 2012, 2013 and 2014.
12,507, dated 10.11.2011 – Modifi ed the Article 28 of Law no. 11,196, dated November 21, 2005, to include in the Digital Inclusion Program the tablet PC produced in the country, in compliance with the basic productive process established by the Executive Branch.
12,543, dated 12.8.2011 – Authorized the National Monetary Council, for purposes of exchange and monetary policy, to establish specifi c conditions for the negotiation of derivative contracts, among other measures.
12,545, dated 12.14.2011 (conversion of the Provisional Measure no. 541, dated 8.2.2011) – Authorized the Federal Government to participate with R$1 billion in the Export Financing Fund (FFEX), for the composition of its assets.
12,546, dated 12.14.2011 (conversion of the Provisional Measure no. 540, dated 8.2.2011) – Created the Special System of Tax Return for Exporting Companies (Reintegra); provided for the reduction of the Industrialized Products Tax (IPI) to automotive industries; reduced to zero the rate of the employer contribution on the payroll of industries of textiles, footwear, furniture and software; increased to 300% the IPI rate on cigarettes; increased from 7.6% to 9.1% the rate of the Contribution to Social Security Financing (Cofi ns) – import on clothing, footwear and leather products, wood furniture, among other products.
168 Boletim do Banco Central do Brasil – Annual Report 2011
Provisional Measures
523, dated 1.20.2011 – Authorized the Federal Government to grant economic subsidy to the Brazilian Development Bank (BNDES), in fi nancing operations channeled to working capital and investment of companies and individual micro-entrepreneurs located in municipalities of the State of Rio de Janeiro.
526, dated 3.4.2011 – Increased from R$134 billion to R$209 billion the limit of fi nancing operations with economic subsidy, under the modality of interest rate equalization, established by the Brazilian Development Bank (BNDES).
528, dated 3.25.2011 – Readjusted in 4.5% the monthly progressive table of the Income Tax, with retroactive effects on January 1, 2011, and determined that the table will be also readjusted in 4.5% for the fi scal years 2012, 2013 and 2014.
529, dated 4.7.2011 – Reduced from 11% to 5% of the monthly minimum wage, the rate of the social security contribution for the Small Individual Entrepreneur (MEI) – individual entrepreneur with annual gross income of up to R$36 thousand.
532, dated 4.28.2011 – Redefi ned the Law no. 9,478, dated August 6, 1997, aiming to recognize and include the biofuels as an essential energetic good for the country. Until then, biofuels had been considered as an agricultural product included in the energy matrix. Through this modifi cation, the National Council of Energetic Policy may establish guidelines for the import and export of biofuels, as it already takes place in the case of fuels derived from petroleum.
534, dated 5.20.2011 – Altered the Article 28 of Law no. 11,196, dated November 21, 2005, to include in the Digital Inclusion Program the tablet PC produced in the country, in compliance with the basic productive process established by the Executive Branch.
535, dated 6.2.2011 – Created the Environment Protection Supporting Program, in order to promote better life conditions and improve the income of the population living in poverty that carry out activities to protect the natural resources in the rural environment; and created the Rural Productive Activities Supporting Program, in order to stimulate the employment and income generation, and promote the food and nutritional safety of the benefi ciaries.
539, dated 7.26.2011 – Authorized the National Monetary Council, for purposes of exchange and monetary policy, to establish specifi c conditions to the negotiation of derivative contracts, regardless the nature of the investor; increased to 25% the maximum Financial Operation Tax (IOF) rate on operations related to securities involving derivative contracts.

VIII Main Economic Policy Measures 169
540, dated 8.2.2011 – Created the Special System of Tax Return for Exporting Companies (Reintegra); provided for the reduction of the Industrialized Products Tax (IPI) to automotive industries; reduced to zero the rate of the employer contribution on the payroll of industries of textiles, footwear, furniture and software; increased to 300% the IPI rate on cigarettes; increased from 7.6% to 9.1% the rate of the Contribution to Social Security Financing (Cofi ns) – import on clothing, footwear and leather products, wood furniture, among other products.
541, dated 8.2.2011 – Authorized the Federal Government to participate with R$1 billion in the Export Financing Fund (FFEX) for the composition of its asset.
543, dated 8.24.2011 – Authorized the Federal Government to grant economic subsidy, limited to R$500 million per year, to fi nancial institutions under the modality of equalization of part of the costs underlying the contracting and following-up of guided productive microcredit operations.
544, dated 9.29.2011 – Established special rules for the purchases, the contracting of products, protection systems, and development of products and protection systems, and provided for rules of incentive to the strategic protection area. This Precautionary Measure does not exclude the control and restrictions to the import, export, manufacturing, trading and use of controlled products.
545, dated 9.29.2011 – Modifi ed the Law no. 10,893, dated July 13, 2004, which provides for the Additional charge on Freight (AFRMM) and the Merchant Navy Fund (FMM); modifi es the incidence of the Contribution to Social Integration Program (PIS)/Civil Service Asset Formation Program (Pasep) and the Contribution to Social Security Financing (Cofi ns) in the commodity chain of coffee, creates the Movies Near You Program and revokes the provisions mentioned.
546, dated 9.29.2011 – Provides for the fi nancial assistance offered by the Federal Government to the states, the Federal District and the municipalities, in the fi scal year 2011, aiming to promote the country’s exports, and altered the Law no. 12,409, dated May 25, 2011.
549, dated 11.17.2011 – Reduced to zero the rates of the Contribution to Social Integration Program (PIS)/Civil Service Asset Formation Program (Pasep) and the Contribution to Social Security Financing (Cofi ns) related to the import and the commercial revenue, in the domestic market, of some specifi c products targeted to disabled people.
551, dated 11.22.2011 – Reduced from 50% to 35.9% the additional airport tariff related to tariffs of boarding, landing, permanence and storing, and also eliminated its incidence on the tariffs of use of communication and assistance to the air navigation, so the corresponding values may be incorporated to the tariffs without altering the amount

170 Boletim do Banco Central do Brasil – Annual Report 2011
paid by users – tariff re-composition that should occur simultaneously with the entry into force of these provisions, on January 10, 2012. The tax reduction resulting from this measure was estimated at R$614.4 million in 2012; R$701.5 million in 2013 and R$801 million in 2014.
552, dated 12.1.2011 – Increased from R$75 thousand to R$85 thousand the fi nancing limit of real properties included in the My House, My Life Program (PMCMV), for purposes of classifi cation in the Special Taxation Scheme (RET); reduced from 9.25% to zero, up to June 30, 2012, the rates of the Contribution to Social Integration Program (PIS)/Contribution to Social Security Financing (Cofi ns) related to pastas; and prorogated from 12.31.2011 to 12.31.2012, the total exemption of the PIS/Cofi ns related to wheat fl our and common wheat.
556, dated 12.23.2011 – Established the exemption of the Civil Servant Social Contribution (CSSP) in relation to the following benefi ts: extra for vacations; extra for night work; extra for off-hours work; extra for supplementary healthcare; extra for pre-schooling assistance; and extra paid to public servants appointed to integrate deliberative council or body.
Legislative Decrees
126, dated 3.17.2011 – Approved the wording Maritime Transportation Agreement between Brazil and the U.S., signed in Washington, on September 30, 2005.
129, dated 5.12.2011 – Approved the wording Reversal Notes between the Federative Republic of Brazil and the Republic of Paraguay, over the Financial Basis of the Annex C of the Itaipu Treaty, signed on September 1, 2009.
159, dated 7.14.2011 – Approved the wording of the Unasur Constitutive Treaty, signed in Brasilia, on May 23, 2008.
304, dated 10.4.2011 – Approved the wording of the Customs Mutual Assistance Agreement between Brazil and India, signed in New Delhi, on May 4, 2007.
Decrees
7,425, dated 1.5.2011 – Provided for the budgetary execution of Executive Branch, until the publication of the General Federal Government Budget.

VIII Main Economic Policy Measures 171
7,439, dated 2.16.2011 – Authorized the increase of the social capital of the Brazilian Development Bank (BNDES), amounting to R$6,400 million, and the Federal Savings Bank, amounting to R$2,200 million.
7,444, dated 2.25.2011 – Provided for the fulfi llment, in national territory, of the Resolution no. 1,961, dated December 17, 2010, of the United Nations Security Council, which renovates the system of sanctions against Liberia.
7,445, dated 3.1.2011 – Provided for the fi nancial and budgetary program, established the monthly chronogram of disbursements of the Executive Branch for the fi scal year 2011 and adopted other measures.
7,446, dated 3.1.2011 – Established limits and procedures, in the scope of the Executive Branch, for government spending with daily lodging rates, tickets and transportation in the fi scal year 2011.
7,447, dated 3.1.2011 – Redefi ned the Article 19 of Decree no. 5,209, dated September 17, 2004, which regulated Law no. 10,836, dated January 9, 2004, that created the “Bolsa Família” Program. The modifi cation resulted in average readjustment of 19.4% in the program’s benefi ts.
7,450, dated 3.11.2011 – Provided for the fulfi llment, in national territory, of the Resolution no. 1,952, dated November 29, 2010, of the United Nations Security Council, which renovates the system of sanctions against the Democratic Republic of Congo.
7,451, dated 3.11.2011 – Regulated the Special Regime for Brazilian Aeronautical Industry (Retaero), established by the Articles 29 and 33 of the Law no. 12,249, dated June 11, 2010.
7,454, dated 3.25.2011 – Increased from 2.38% to 6.38% the Financial Operation Tax (IOF) rate on the sales of goods and services abroad, with credit card.
7,455, dated 3.25.2011 – Increased the Industrialized Products Tax (IPI) rate on cold beverages.
7,456, dated 3.28.2011 – Fixed at 6% the Financial Operations Tax (IOF) rate in the settlement of exchange operations contracted since March 29, 2011, for infl ow of resources, even by means of simultaneous operations, related to foreign loan, subjected to registration in the Central Bank of Brazil, directly contracted of through issue of securities in the international market, with minimum medium-term of up to 360 days.
7,457, dated 4.6.2011 – Determined that the rate of 6% with impact on contracted operations, since April 7, 2011, for fund infl ows to the country, related to foreign loan,

172 Boletim do Banco Central do Brasil – Annual Report 2011
will include operations with minimum medium-term of up to 720 days. According to the Decree no. 7,456, dated 3.28.2011, only operations with minimum medium-term of up to 360 days were subjected to this rate.
7,458, dated 4.7.2011 – Increased from 1.5% to 3% the aliquot on credit operations with individuals (except property fi nancings).
7,460, dated 4.14.2011 – Provided for the fulfi llment, in national territory, of the Resolution no. 1,970/2011, of the United Nations Security Council, which establishes a regime of sanctions to Libyan Arab Jamahiriya and determines, among other measures, arms embargo, report about the situation of the country to the International Criminal Court, prohibition of travels and freeze funds of individuals specifi cally designated.
7,468, dated 4.28.2011 – Kept the validity, after April 30, 2011, of the unprocessed accounts payable from expenditures registered in the fi scal years 2007, 2008 and 2009, which fulfi ll the conditions established in this decree.
7,477, dated 5.10.2011 – Modifi ed the annexes of the Decree no. 7,445, dated March 1, 2011, which provides for the fi nancial and budgetary program of the Federal Budget.
7,479, dated 5.16.2011 – Provided for the fulfi llment, in national territory, of the Resolution no. 1,928, dated June 7, 2010, of the United Nations Security Council, which prorogated the order of the Expert Panel established to give support to the Democratic People’s Republic of Korea (DPRK).
7,487, dated 5.23.2011 – Extended the Financial Operations Tax (IOF) zero rate to the operations with Agribusiness Credit Rights Certifi cate (CDCA), Agribusiness Credit Note (LCA), Agribusiness Receivable Certifi cate (CRA), Certifi cate of Real Estate Receivables (CRI) and Financial Notes issued by fi nancial institutions.
7,491, dated 6.2.2011 – Promulgated the General Agreement on Cooperation between Brazil and Saudi Arabia, signed in Riade, on May 16, 2009.
7,492, dated 6.2.2011 – Created the Brazil without Misery Plan, to be executed by the Federal Government, in collaboration with the States, the Federal District, Municipalities and the society, in order to overcome the situation of the population in extreme poverty within the entire national territory.
7,494, dated 6.2.2011 – Increased, from three to fi ve, the number of up to 15-years children, whose presence in the family gives the opportunity to receive variable fi nancial benefi ts from the “Bolsa Família” Program.

VIII Main Economic Policy Measures 173
7,502, dated 6.24.2011 – Provided for the execution of the Eightieth Additional Protocol to the Economic Supplementary Agreement no. 18, signed between Argentina, Brazil, Paraguay and Uruguay, on February 18, 2011.
7,506, dated 6.27.2011 – Promulgated the Agreement by Reversal Notes between the Federative Republic of Brazil and the Republic of Paraguay, over the Financial Basis of the Annex C of the Itaipu Treaty, signed on September 1, 2009.
7,532, dated 7.21.2011 – Promulgated the Fifth and Sixth Amendments to the Articles of Agreement of the International Monetary Fund.
7,533, dated 7.21.2011 – Provided for the payment in advance, in August, of the annual bonus due to insured and dependents of the Social Security, in 2011.
7,534, dated 7.21.2011 – Updated the estimated income for 2011 and established a new chronogram of disbursements of the Executive Branch, supported by the Federal Budget.
7,536, dated 7.26.2011 – Established the aliquot of 6% of the Financial Operations Tax (IOF), on loans received abroad, with maturity higher than 720 days and previously settled.
7,539, dated 8.2.2011 – Modifi ed the Decree no. 5,563, dated October 11, 2005, which provided for the incentives to the innovation and the technological and scientifi c research.
7,540, dated 8.2.2011 – Created the Greater Brazil Plan, whose main objective is to accelerate the growth of the productive investment and the technological and innovative effort of national companies, and increase the competitiveness of national goods and services.
7,541, dated 8.2.2011 – Prorogated, up to December 31, 2012, the exemption of the Industrialized Products Tax (IPI) on trucks and light vehicles.
7,542, dated 8.2.2011 – Prorogated, up to December 31, 2012, the exemption of the Industrialized Products Tax (IPI) on construction materials.
7,543, dated 8.2.2011 – Prorogated, up to December 31, 2012, the exemption of the Industrialized Products Tax (IPI) on capital goods.
7,544, dated 8.2.2011 – Provided for the relationships between federal institutions of higher education and scientifi c and technological research, and the supporting foundations.

174 Boletim do Banco Central do Brasil – Annual Report 2011
7,545, dated 8.2,2011 – Enacted the Convention on Temporary Admission (the Istanbul Convention), held on June 26, 1990, being supported by the World Customs Organization, the text of its Annex A, with reserve, and Annexes B.1, B.2, B.5 and B.6.
7,546, dated 8.2.2011 – Created the Public Purchases Inter-ministerial Commission.
7,555, dated 8.19.2011 – Regulated the Articles 14 and 20 of the Provisional Measure no. 540, dated August 2, 2011, which provides for the impact of the Industrialized Products Tax (IPI) on the domestic market and import of cigarettes.
7,563, dated 9.15.2011 – Modifi ed the Decree no. 6,306, dated December 14, 2007, which regulated the Financial Operations Tax (IOF).
7,567, dated 9.15.2011 – Increased at 30 p.p. the aliquots of the Industrialized Products Tax (IPI) with impact on the import of vehicles, except those coming from Mexico and Mercosur.
7,568, dated 9.16.2011 – Modifi ed the Decree no. 6,170, dated July 25, 2007, which provides for the rules related to transfer of federal funds, by means of transfer agreements, and adopted other measures.
7,570, dated 9.26.2011 – Reduced from R$230.00 to R$192.60 the aliquot of the Contribution on Intervention in the Economic Domain (Cide), with impact on the cubic meter of gasoline.
7,575, dated 9.29.2011 – Modifi ed the Annexes of the Decree no. 7,445, dated March 1, 2011, which provides for the budgetary and fi nancial program and established the monthly chronogram of disbursement of the Executive Branch for the fi scal year 2011.
7,591, dated 10.28.2011 – Reduced the aliquots with impact on the cubic meter of gasoline (from R$192.60 to R$91.00) and diesel (from R$70.00 to R$47.00).
7,593, dated 10.28.2011 – Prorogated, from December 1, 2011 to May 1, 2012, the readjustment of the IPI on the prices of cigarettes.
7,599, dated 11.7.2011 – Enacted the International Cocoa Agreement, signed by the Brazilian government in Rio de Janeiro, on September 14, 1964.
7,604, dated 11.10.2011 – Modifi ed the Decree no. 7,567, dated September 15, 2011, which regulates the Article 5 and 6 of the Provisional Measure no. 540, dated August 2, 2011, which establishes the Special System of Tax Return for Exporting Companies (Reintegra); provides for the reduction of the Industrialized Products Tax (IPI) to the
VIII Main Economic Policy Measures 175
automotive industry, and modifi es the impact of the social security contributions owed by the companies that mentions.
7,619, dated 11.21.2011 – Regulated the granting of credit deemed from the Industrialized Products Tax (IPI) in the acquisition of waste materials.
7,622, dated 11.22.2011 – Modifi ed the fi nancial and budgetary program and established the monthly chronogram of disbursement of the Executive Branch, for the fi scal year 2011.
7,623, dated 11.22.2011 – Regulated the Law no. 12,097, dated November 24, 2009, which provides for the application of the traceability in the commodity chain of beef and buffalo meat.
7,624, dated 11.22.2011 – Provides for the conditions of exploration by the private initiative of the airport infrastructure, by means of concession.
7,631, dated 12.1.2011 – Reduced the aliquots of the Industrialized Products Tax (IPI), with impact on the following products: stoves, from 4% to zero; refrigerators, from 15% to 5%; washing machines (automatic and semi-automatic), from 20% to 10%; washboards, from 10% to zero; synthetic paper for printing books and newspapers, from 15% to zero; and steel wool, from 10% to 5%.
7,632, dated 12.1.2011 – Reduced the aliquots of the Financial Operations Tax (IOF) with impact on the following operations: credit operations with individuals, from 3% p.y. to 2.5% p.y.; foreign investment in shares, from 3% to zero; venture capital, from 2% to zero; cancellation of receipts of shares traded by Brazilian companies abroad, from 2% to zero; non-residents investments in long-term private securities, with validity of up to 4 years, from 6% to zero.
7,633, dated 12.1.2011 – Regulated the Special System of Tax Return for Exporting Companies (Reintegra), established by the Provisional Measure no. 540, dated August 2, 2011.
7,653, dated 12.23.2011 – Authorized the increase of the capital stock of the Brazilian Development Bank (BNDES) and the Federal Saving Bank.
7,655, dated 12.23.2011 – Set in R$622.00 the minimum wage, which came into force on January 1, 2012.
7,658, dated 12.23.2011 – Provided for the Sixty Ninth Protocol Additional to the Economic Complementary Agreement no. 2 (69PA-ACE2), signed between Brazil and Uruguay, on August 24, 2011, regarding the automotive sector.

176 Boletim do Banco Central do Brasil – Annual Report 2011
7,760, dated 12.23.2011 – Approved the Industrialized Products Tax Table (Tipi), coming into force since January 1, 2012, and revoked the rules that mentions.
National Monetary Council Resolutions
3,941, dated 1.17.2011 – Modifi ed the Article 1 of the Resolution no. 3,912, dated October 7, 2010.
3,942, dated 1.21.2011 – Modifi ed the Resolution no. 3,759, dated July 9, 2009, to establish conditions for the contracting of fi nancings destined for working capital and investment of companies and individual micro-entrepreneurs, located in municipalities of the State of Rio de Janeiro, which determined state of emergency or public calamity.
3,943, dated 1.27.2011 – Provided for the maturity of contracting of backed trade operations in resources of the Coffee Economy Defense Fund (Funcafé), and fi nancings with resources of that fund destined for the recovery of the coffee plantations reached by hailstorms.
3,944, dated 1.27.2011 – Provided for the conditions for the renegotiations in which are focused the Articles 7 and 7-A, of the Law no. 11,775, dated September 17, with redaction given by the Law no. 12,380, dated January 10, 2011, and modifi ed the Resolutions no. 3,575 and no. 3,578, both dated May 29, 2008.
3,945, dated 1.27.2011 – Modifi ed the provisions of the Rural Credit Manual (MCR) related to the Price Guarantee Program for Family Agriculture (PGPAF).
3,946, dated 1.27.2011 – Modifi ed the volume and the source of funds of the special credit line for supporting family farms of the State of Mato Grosso reached by burnings without control.
3,947, dated 1.27.2011 – Provided for the formula to calculate the weighed medium-term and simplifi ed procedure foreseen in the paragraph 1 of the Article 1 of the Provisional Measure no. 517, dated December 30, 2010.
3,948, dated 2.11.2011 – Exempted the payment of interest for purposes of renegotiation, considered in the Section 1 of the Chapter 13 of the Rural Credit Manual (MCR), in favor of farmers affected by the rains in the State of Rio de Janeiro.
3,949, dated 2.11.2011 – Established an emergency credit line for fi nancing the family production units classifi ed in the National Program for Strengthening Family Agriculture (Pronaf), authorized the contracting of investment operations to give support to the Special Line of Credit for Investment in Food Production, and exempted the payment
VIII Main Economic Policy Measures 177
of interest for purposes of renegotiation, considered in the Section 5 of the Chapter 10 of the Rural Credit Manual (MCR) ), in favor of farmers affected by the rains in the State of Rio de Janeiro.
3,950, dated 2.24.2011 – Provided for the deadlines for application of the Articles 3 and 4 of the Law no. 11,775, dated September 17, 2008.
3,951, dated 2.24.2011 – Extended the periods of formalization of the debt composition of horticulturists, their cooperatives and companies, and of the contracting of the emergency line destined for family farms affected by the drought in the semiarid region of the States of the Northeast and Minas Gerais.
3,952, dated 2.24.2011 – Authorized the prorogation of maturity of the Federal Government Loans (EGF) of rice.
3,953, dated 2.24.2011 – Modifi ed conditions of the Highway Interventions Program (Provias) for those municipalities that declared state of public calamity, according to the State Decrees of Rio de Janeiro no. 42,796, 42,797, 42,801, 42,802, 42,803, 42,804 and 42,805, all dated January 14, 2011, and adopted other measures.
3,954, dated 2.24.2011 – Modifi ed and consolidated the rules that provided for the contracting of correspondents in the country.
3,955, dated 3.10.2011 – Extended the limit, altered the distribution of funds and modifi ed conditions for the granting of fi nancings described in the Resolution no. 3,759, dated July 9, 2009, which establishes conditions for the granting of fi nancings supported by economic subvention of the Federal Government, channeled for the acquisition and production of capital goods and technological innovation.
3,956, dated 3.29.2011 – Revoked the Resolution no. 1,857, dated August 15, 1991.
3,957, dated 3.30.2011 – Defi ned the Long-Term Interest Rate (TJLP) for the second quarter of 2011.
3,958, dated 3.31.2011 – Extended limits for the contracting of credit operations targeted to the execution of environmental sanitation and pavement actions, chosen for the Growth Acceleration Program (PAC).
3,959, dated 3.31.2011 – Modifi ed the Resolution no. 3,954, dated February 24, 2011, which provides for the contracting of correspondents in the country.
3,960, dated 3.31.2011 – Changed the limit of enforceability for mandatory funds (Rural Credit Manual – MCR 6-2-9 “a”) for the period of compliance 2010/2011.

178 Boletim do Banco Central do Brasil – Annual Report 2011
3,961, dated 3.31.2011 – Provided for the establishment of the additional aliquot of the Farm Activity Guarantee Program (Proagro) for purposes of classifi cation of agricultural fi nancing operations for the production of pineapple, açaí and black pepper.
3,962, dated 3.31.2011 – Changed the factor to weigh the enforceability of the rural savings (Rural Credit Manual – MCR 6-4) for the period of compliance 2010/2011.
3,963, dated 3.31.2011 – Provided for the assessment of the expansion limit for clients, included in the Resolution no. 2,844, dated June 29, 2001, by the Brazilian Development Bank (BNDES).
3,964, dated 3.31.2011 – Increased the credit limit for family farms, in operations supporting the investment line for the National Program for Strengthening Family Agriculture (Pronaf).
3,965, dated 3.31.2011 – Modifi ed the Resolution no. 2,524, dated July 30, 1998, which establishes rules for declaration of portage and transportation of foreign and national currency.
3,966, dated 3.31.2011 – Established an extraordinary credit line with resources of the Coffee Economy Defense Fund (Funcafé), targeted to the debt composition of rural producers, resulting from fi nancings granted for coffee production.
3,967, dated 4.4.2011 – Modifi ed the Resolution no. 3,844, dated March 23, 2010, which provides for the foreign stock in the country and its registration in the Central Bank of Brazil.
3,968, dated 4.28.2011 – Provided for the granting of funds of the Funcafé and prorogated the deadline for the unifi cation of the fi nancings and raisings with resources of these fund.
3,969, dated 4.28.2011 – Established new deadline for the contract of emergency credit line targeted to rice farmers of Rio Grande do Sul, in the scope of the Program of Incentive to Sustainable Farm Production (Produsa), included in the Rural Credit Manual – MCR 13-8-3.
3,970, dated 4.28.2011 – Excluded the mandatory minimum payment of 20% of what is owed, in order to prorogate the maturity of the Federal Government Loans operations (EGF), of the rice harvest 2009/2010, contracted in the States of Rio Grande do Sul and Santa Catarina.

VIII Main Economic Policy Measures 179
3,971, dated 4.28.2011 – Modifi ed the subsection XI of the Article 9-N of the Resolution no. 2,827, dated March 30,2001, and established new deadline for the granting of loans, by federal fi nancial institutions to the States and the Federal District.
3,972, dated 4.28.2011 – Provided for the devolution of check and cancellation of payment.
3,973, dated 5.26.2011 – Provided for procedures applicable to the accounting and publication of events subsequent to the reference period of the annual accounting reports.
3,974, dated 5.27.2011 – Transferred funds from the Program of Cooperative Development for Aggregating Value to Crop/Livestock Production (Prodeccop) to the Capitalization Program of Farm Cooperatives (Procap-Agro), for application in the harvest 2010/2011.
3,975, dated 5.27.2011 – Authorized credit provided by the Coffee Economy Defense Fund (Funcafé), targeted to fi nance the recovery of coffee plantations affected by hailstorms since October 1, 2010, to May 31, 2011, observing the general fi nancing conditions with resources of this fund.
3,976, dated 5.27.2011 – Increased the amount of funds authorized for the contracting of new credit operations targeted to the Electricity Transmission and Generation Program, in compliance with the Resolution no. 2,827, dated March 30, 2011.
3,977, dated 5.31.2011 – Changed rules of the National Program for Strengthening Family Agriculture (Pronaf).
3,978, dated 5.31.2011 – Provided for adjustments in rules of fi nancing, investment and trading with funds provided by rural credit, since the harvest 2011/2012.
3,979, dated 5.31.2011 – Provided for agricultural investment programs supported by the Brazilian Development Bank (BNDES).
3,980, dated 5.31.2011 – Associated the contracting of the fi nancing lines Procopa and Urban Mobility for the 2014 FIFA World Cup to the actions included in the Responsibility Matrix.
3,981, dated 6.1.2011 – Determined the retirement of bills considered inadequate to circulate, in view of the damage supposedly caused by anti-theft device.
3,982, dated 6.20.2011 – Modifi ed the paragraph “b”, subsection III, Article 8 of the Resolution no. 2,238, dated January 31, 1996, which regulates the conditions and
180 Boletim do Banco Central do Brasil – Annual Report 2011
procedures targeted to formalize the operations to extend debts from rural credit, included in the Law no. 9,138, dated November 29, 1995.
3,983, dated 6.29.2011 – Defi ned the Long-Term Interest Rate (TJLP) for the third quarter of 2011.
3,984, dated 7.1.2011 – Modifi ed rules of the National Program for Strengthening Family Agriculture (Pronaf).
3,985, dated 6.30.2011 – Modifi ed conditions to contract rural credit operations targeted to the fi shing and aquaculture.
3,986, dated 6.30.2011 – Modifi ed conditions for fi nancing operations, trading, Federal Government Loans (EGF), Special Trade Credit Line (LEC), programs of the Brazilian Developing Bank (BNDES), Program for Modernization of Agriculture and Conservation of Natural Resources (Moderagro), Capitalization Program of Farm Cooperatives (Procap-Agro) and Program of Cooperative Development for Aggregating Value to Crop/Livestock Production (Prodecoop).
3,987, dated 6.30.2011 – Consolidated conditions for fi nancings granted by the National Program for Support of the Medium Rural Producer (Pronamp).
3,988, dated 6.30.2011 – Provided for the implementation of structure to improve capital management.
3,989, dated 6.30.2011 – Established criteria and conditions to assess, recognize and publish the transactions with payment based on actions carried out by fi nancial institutions and other institutions authorized to operate by the Central Bank of Brazil.
3,990, dated 6.30.2011 – Modifi ed the conditions established in the Rural Credit Manual (MCR) 10-15 for the Price Guaranty Program for Family Agriculture (PGPAF).
3,991, dated 6.30.2011 – Set the infl ation target and its tolerance interval for 2013.
3,992, dated 7.14.2011 – Authorized the renegotiation of investment operations, funding and Federal Government Loans (EGF) contracted by rice farmers and pig farmers, and concession of Special Trade Credit Line (LEC) for pig production.
3,993, dated 7.14.2011 – Authorized the renegotiation of rural investment operations, maturing in 2011, contracted by rice farmers and pig farmers supported by the Brazilian Development Bank (BNDES), in the scope of the Investment Support Program (PSI).

VIII Main Economic Policy Measures 181
3,994, dated 7.14.2011 – Modifi ed the provisions of the National Program for Strengthening Family Agriculture (Pronaf).
3,995, dated 7.28.2011 – Provided for credit lines targeted to fi nancings supported by the Coffee Economy Defense Fund (Funcafé), and created the fi nancing line of working capital for industries of instant coffee.
3,996, dated 7.28.2011 – Defi ned weighing factors for purposes of compliance with the enforceability, based on demand deposits (Rural Credit Manual – MCR 6-2), modifi ed the percentages of the enforceability and faculty of application with funds of the MCR 6-2, and carried out other adjustments in the MCR.
3,997, dated 7.28.2011 – Modifi ed the Resolution no. 3,568, dated May 29, 2008, which provides for the exchange market, and adopted other measures.
3,998, dated 7.28.2011 – Provided for the registration of operations of credit granting and leasing, in systems of registration and fi nancial settlement of assets amortized by the Central Bank of Brazil.
3,999, dated 8.11.2011 – Authorized the renegotiation of funding and investment operations, maturing in 2011, contracted in the scope of the National Program for Strengthening Family Agriculture (Pronaf).
4,000, dated 8.25.2011 – Modifi ed and consolidated the rules that provide for microcredit operations targeted to population with low incomes and micro-entrepreneurs.
4,001, dated 8.25.2011 – Modifi ed conditions to contract operations of credit, investment and trading, and renegotiate those operations, in compliance with the Resolution no. 3,992, dated July 14, 2011.
4,002, dated 8.25.2011 – Authorized the Central Bank of Brazil to carry out operation of Rediscount of the Central Bank, in purchases with resale agreements, intraday, with fi nancial institutions holders of Settlement Account, and adopted other measures.
4,003, dated 8.25.2011 – Modifi ed the Resolution no. 3,605, dated August 29, 2008, regarding the accounting classifi cation of funds by fi nancial institutions and other institutions authorized to operate by the Central Bank of Brazil.
4,004, dated 8.25.2011 – Updated the deadline to contract credit operations included in the Fiscal Adjustment Programs of States (PAF), up to December 31, 2011.
4,005, dated 8.25.2011 – Modifi ed the Article 9-J of the Resolution no. 2,827, dated March 30, 2001, prorogating the deadline to contract credit operations, in the scope of the “Caminho da Escola” Program.
182 Boletim do Banco Central do Brasil – Annual Report 2011
4,006, dated 8.25.2011 – Modifi ed the conditions for the presentation of documents which prove agrarian regularity, according to the Rural Credit Manual (MCR) 2-1-18.
4,007, dated 8.25.2011 – Provided for the accounting registration and presentation of accounting policies, estimative change and rectifi cations of errors.
4.008, dated 9.14.2011 – Provides for fi nancing granted by the National Fund on Climate Change (FNMC).
4.009, dated 9.14.2011 – Modifi ed the Resolution no. 3,759, dated July 9, 2009, to extend deadline to contract operations, allocate limits to receive federal economic subsidy in fi nancing granted by the Brazilian Development Bank (BNDES) and the Financing Company of Studies and Projects (Finep), improve the relation of benefi ciaries of these operations, among other changes.
4,010, dated 9.14.2011 – Established conditions for credit line with federal economic subsidy, to fi nance companies of the sectors of ornamental stones, timber processing, leather processing, footwear and leather, textile and confection equipments, even home line, wood furniture, fruit (natural and processed), ceramics, software and rendering of information technology services, auto parts and capital goods (except for automotive vehicle to transport cargo and passengers, ships, airplanes, freight cars and railway and subway trains, tractors, harvesters and highway machinery).
4,011, dated 9.21.2011 – Modifi ed Resolution no. 3,759, dated July 9, 2009, to establish conditions for the granting of loans subjected to federal economic subsidy, targeted to working capital and investment by limited companies, individual entrepreneurs and individuals or legal persons, considered as rural producers, located in Municipalities of Federative States affected by natural disasters and protected by state decree providing for state of emergency or public calamity, recognized by the Federal Executive Branch.
4,012, dated 9.29.2011 – Defi ned the Long-Term Interest Rate (TJLP) for the fourth quarter of 2011.
4,013, dated 9.29.2011 – Adjusted the General Provisions (Rural Credit Manual – MCR 10-1) of the National Program for Strengthening Family Agriculture (Pronaf) and the Special Line of Credit for Investment in Food Production (MCR 10-18).
4,014, dated 9.29.2011 – Modifi ed provisions of lines of credit supported by the Coffee Economy Defense Fund (Funcafé).
4,015, dated 9.29.2011 – Added the Article 9-X to the Resolution no. 2,827, dated March 30, 2001, authorizing the contracting of new credit operation targeted to

VIII Main Economic Policy Measures 183
Modernization of the General and Patrimonial Administration of Public Defender’s Offi ce of the Federal District and States.
4,016, dated 9.29.2011 – Updated provisions of the Rural Credit Manual (MCR) related to the Farm Activity Guarantee Program (Proagro).
4,017, dated 9.29.2011 – Updated the Rural Credit Manual (MCR) in relation to specifi c rules of Proagro Mais.
4,018, dated 9.29.2011 – Modifi ed the Resolution no. 3,263, dated February 24, 2005, which provides for the agreements of compensation and settlement of liabilities, in the scope of the National Financial System.
4,019, dated 9.29.2011 – Provided for prudential and preventive measures to ensure the solidity, stability and regular functioning of the National Financial System.
4,020, dated 9.30.2011 – Modifi ed the Resolution no. 2,859, dated May 27, 2010, which provided for the constitution and functioning of credit cooperatives.
4,021, dated 9.30.2011 – Regulated the charge of tariffs by the rendering of services related to manual exchange operations, for the purchase or sale of foreign currency associated to international trips, and established the mandatory information of the Total Effective Value (VET) in the cash operations.
4,022, dated 10.13.2011 – Modifi ed the Resolution no. 3,759, dated July 9, 2009, to redistribute funds and establish conditions for the granting of fi nancing subjected to federal economic subsidy to the Brazilian Development Bank (BNDES), targeted to working capital and investment by limited companies, individual entrepreneurs and individuals or legal persons, considered as rural producers, located in municipalities affected by natural disasters and protected by state decree providing for state of emergency or public calamity, recognized by the Federal Executive Branch, in compliance with the Law no. 12,340, dated December 1, 2010.
4,023, dated 10.27.2011 – Modifi ed the Resolution no. 2,828, dated March 30, 2001, which provides for the constitution and functioning of development agencies.
4,024, dated 10.27.2011 – Adjusted the conditions for the contracting of investment rural credit operations.
4,025, dated 10.27.2011 – Modifi ed the conditions of the Capitalization Program of Farm Cooperatives (Procap-Agro) and the Program of Cooperative Development for Aggregating Value to Crop/Livestock Production (Prodeccop).

184 Boletim do Banco Central do Brasil – Annual Report 2011
4,026, dated 10.27.2011 – Modifi ed the regulation attached to the Resolution no. 3,308, dated August 31, 2005, which provides for the application of resources from reserves and funds from insurance companies, capitalized saving companies and open entities of complementary social security, as well as the approval of the corresponding assets, as guarantors of their respective funds, in compliance with the legislation and regulation.
4,027, dated 10.27.2011 – Modifi ed the Article 9-M of the Resolution no. 2,827, dated March 30, 2001, which consolidated and redefi ned the rules for the contingency of the credit of the public sector.
4,028, dated 11.18.2011 – Authorized the debt composition and the renegotiation of rural credit operations, in the scope of the National Program for Strengthening Family Agriculture (Pronaf).
4,029, dated 11.18.2011 – Authorized the renegotiation of agrarian credit operations, supported by the Agrarian Reform and Lands Fund, including the operations of the Land Credit Program contracted in the scope of the Loan Agreement no. 4,147-BR.
4,030, dated 11.18.2011 – Authorized the renegotiation of the operations supported by the Line of Credit for the Group “B” (Rural Production Microcredit), in the scope of the National Program for Strengthening Family Agriculture (Pronaf).
4,031, dated 11.18.2011 – Authorized the renegotiation of the operations supported by the Lines of Credit for the Groups “A” and “A/C” of the National Program for Strengthening Family Agriculture (Pronaf).
4,032, dated 11.30.2011 – Provided for adjustments in the fi nancing conditions to trade agricultural products.
4,033, dated 11.30.2011 – Provided for the application abroad of the availability, in foreign currency, of banks authorized to operate in the exchange market and in the foreign fundraising for specifi c purposes.
4,034, dated 11.30.2011 – Modifi ed the redaction of the Articles 2 and 4 of the Resolution no. 3,284, dated May 25, 2005, and 1 of the Resolution no. 2,423, dated September, 1997, among other measures.
4,035, dated 11.30.2011 – Modifi ed the Resolution no. 3,954, dated February 24, 2011, which provides for the contracting of correspondents in the country.
4.036, dated 11.30.2011 – Authorized the deferral of the negative net result, resulting from renegotiation of credit operation previously granted.
VIII Main Economic Policy Measures 185
4,037, dated 12.15.2011 – Defi ned the Long-Term Interest Rate (TJLP) for the fi rst quarter of 2012.
4,038, dated 12.15.2011 – Provided for the remuneration of fi nancial institutions and resources of the Lands Fund and Agrarian Reform.
4,039, dated 12.15.2011 – Modifi ed the Article 1 of the Resolution no. 3,912, dated October 7, 2010.
4,040, dated 12.15.2011 – Modifi ed the Resolution no. 3,339, dated January 26, 2006, which regulated the repo transactions that involve fi xed income bonds.
4,041, dated 12.16.2011 – Authorized the renegotiation of installments maturing in 2011 from the rural investment operations contracted by rice farmers and pig farmers, with funds administered by the Brazilian Development Bank (BNDES), in the scope of the Investment Support Program (PSI).
4,042, dated 12.15.2011 – Modifi ed the Resolution no. 3,954, dated February 24, 2011, which provided for the contracting of correspondents in the country.
4,043, dated 12.15.2011 – Modifi ed the Article 13 of the Resolution no. 2,238, dated January 31, 1996, and adopted other measures.
4,044, dated 12.15.2011 – Modifi ed conditions for the granting of agribusiness credit, targeted to the industrialization of sugar cane in the Amazon Rainforest, the Pantanal and the Upper Paraguay River Basin, among other areas.
4,045, dated 12.29.2011 – Modifi ed the redaction of the caput of the Article 9-K of the Resolution no. 2,827, dated March 30, 2001, which provides for the contracting of credit operations in the scope of the Provias.
Foreign Trade Council Resolutions
2, dated 1.19.2011 – Excluded the code Common Mercosur Nomenclature (NCM) no. 2917.36.00, related to the pure terephthalic acid-PTA, from the List of Exceptions to the Common External Tariff (TEC), and temporarily reduced the aliquot of the Import Tax for that code, according to the quota established due to shortages – Common Market Group Resolution (GMC) no. 69-2000.
3, dated 2.16.2011 – Changed to 2%, up to June 30, 2012, the ad valorem aliquots of the Import Tax with impact on the Telecommunication and Informatics Goods, as well as on the components of the Integrated Systems that relates.

186 Boletim do Banco Central do Brasil – Annual Report 2011
4, dated 2.16.2011 – Changed to 2%, up to June 30, 2012, the ad valorem aliquots of the Import Tax with impact on the Capital Goods, as well as on the components of the Integrated Systems that relates and modifi es the tariff exceptions included in the resolutions that mentions.
6, dated 2.16.2011 – Instituted, in the scope of the Management Executive Committee of the Camex (Gecex), the Coordination Group Mercosur – European Union, in order to examine and suggest the Brazilian position in the bi-regional negotiating process.
7, dated 2.16.2011 – Modifi ed the Brazilian List of Exceptions to the Common External Tariff (TEC).
8, dated 2.28.2011 – Applied defi nitive antidumping right, as fi xed specifi c aliquot, to the Brazilian imports of table objects, glass objects from Argentina, Indonesia and China, commonly classifi ed in the item Common Mercosur Nomenclature (NCM) no. 7013.49.00, for up to 5 years, in the following amounts: US$0.18/kg for the company that mentions; US$0.37/kg for other Argentinean producers; US$0.15/kg for imports from Indonesia and US$1.70/kg for imports from China.
9, dated 3.14.2011 – Modifi ed the Common Mercosur Nomenclature (NCM) and the aliquots of the Tax Import included in the Common External Tariff (TEC), regulated by the Annex 1 of the Camex Resolution no. 43, dated December 22, 2006.
10, dated 3.14.2011 – Created, in the scope of the Management Executive Committee of the Camex (Gecex), the Technical Monitoring Group of the Common Market Group Resolution (GMC) no. 8, dated June 30, 2008 (GTAR-08), aiming to examine proposals of temporary reduction of the Common External Tariff (TEC), exceptionally, to guarantee the regular supply and fl ow of products in the Mercosur.
11, dated 3.14.2011 – Changed to 2%, up to June 30, 2012, the ad valorem aliquots of the Import Tax with impact on the Telecommunication and Informatics Goods, as well as on the components of the Integrated Systems mentioned.
12, dated 3.14.2011 – Changed to 2%, up to June 30, 2012, the ad valorem aliquots of the Import Tax with impact on the Capital Goods, as well as on the components of the Integrated Systems that relates and modifi es the tariff exceptions included in the resolutions that mentions.
13, dated 3.14.2011 – Modifi ed the paragraph 2 of the Article 1 of the Resolution no. 70, dated September 14, 2010, providing for the quota distribution of cotton, not carded or combed (codes Common Mercosur Nomenclature – NCM no. 5201.00.20 and 5201.00.90) for industries of the textile segment, for use in the industrial process, and exporter commercial companies, and modifi ed the redaction of the “Ex” 001 of the
VIII Main Economic Policy Measures 187
code NCM no. 8716.40.00, contained in the Camex Resolution no. 7, dated February 17, 2011, to include semi-trucks.
14, dated 3.14.2011 – Increased to 35%, up to December 31, 2011, the aliquots of the Import Tax that compose the Common External Tariff (TEC), included in the Annex 1 of the Resolution no. 43, dated December 22, 2006, for the codes Common Mercosur Nomenclature (NCM) no. 2008.70.10 and NCM no. 2008.70.90.
15, dated 3.17.2011 – Determined that the Brazilian offi cial support to the export of civil airplanes, granted by means of fi nancing or refi nancing, credit insurance, interest rate equalization or any combination of these modes, should observe the terms, conditions and procedures stipulated in the new Aircraft Sector Understanding, of the Organization for Economic Co-operation and Development (OCDE), agreed between its participants in February, 2011.
16, dated 3.17.2011 – Modifi ed the Articles 1 and 2 of the Resolution no 86, dated December 9, 2010, which applied defi nitive antidumping right, for a deadline of up to fi ve years, to Brazilian imports of polypropylene, homopolymer and copolymer resin, coming from the U.S., commonly classifi ed in the items Common Mercosur Nomenclature (NCM) no. 3902.10.20 and 3902.30.00, respectively, to be collected as ad valorem aliquot, in compliance with the specifi cation.
18, dated 3.21.2011 – Excluded the code Common Mercosur Nomenclature (NCM) no. 4810.13.90, from the List of Exceptions to the Common External Tariff (TEC), included in the Annex II of the Resolution no. 43, dated December 22, 2006, and created the “Ex” 001 in the code mentioned, with ad valorem aliquot of the Import Tax of 2%, for a period of 12 months, according to the determined quota.
19, dated 4.7.2011 – Applied provisional antidumping right, for a deadline of up to six months, to the Brazilian imports of n-Butanol, from the U.S., commonly classifi ed in the item Common Mercosur Nomenclature (NCM) no. 2905.13.00, to be paid as fi xed specifi c aliquot, amounting US$127.53/t for the Basf Corporation; US$125.74/t for the Oxea Corporation; US$236.93/t for the Eastman Chemical Company; and US$244.91/t for the other producers/exporters.
20, dated 4.7.2011 – Applied defi nitive antidumping right, for a deadline of up to fi ve years, to the Brazilian imports of viscose meshes, with or without spandex, from the People’s Republic of China, commonly classifi ed in the items Common Mercosur Nomenclature (NCM) no. 6004.10.41, 6004.10.42, 6004.10.43, 6004.10.44, 6004.90.40, 6006.41.00, 6006.42.00, 6006.43.00 and 6006.44.00, to be paid as fi xed specifi c aliquot, amounting to US$4.10/kg.

188 Boletim do Banco Central do Brasil – Annual Report 2011
21, dated 4.7.2011 – Provided for the Incoterms and established the acceptance, in Brazilian exports and imports, of any sale condition practiced in the international trade, only if compatible with the national judicial system.
23, dated 4.7.2011 – Changed to 2%, up to June 30, 2012, the ad valorem aliquots of the Import Tax with impact on the Capital Goods, as well as on the components of the Integrated Systems that relates; and modifi ed the Resolution that relates.
24, dated 4.7.2011 – Applied defi nitive antidumping right, for a deadline of up to fi ve years, to the Brazilian imports of viscose meshes, with or without spandex, from the People’s Republic of China, commonly classifi ed in the items Common Mercosur Nomenclature (NCM) no. 6004.10.41, 6004.10.42, 6004.10.43, 6004.10.44, 6004.90.40, 6006.41.00, 6006.42.00, 6006.43.00 and 6006.44.00, to be paid as fi xed specifi c aliquot, amounting to US$4.10/kg.
25, dated 5.5.2011 – Revoked the subsection IV of the Article 2 of the Resolution no. 63, dated August 17, 2010, related to practices that frustrate the effectiveness of the application of commercial protection measures.
26, dated 5.5.2011 – Modifi ed the Article 3 of the Resolution no. 80, dated November 9, 2010, which provides for the rules of origin applied in non-preferential instruments of commercial policy.
27, dated 5.5.2011 – Modifi ed the § 1 of the Article 1 of the Resolution no. 70, dated September 14, 2010, in relation to the reduction of the quota established for operations with cotton.
28, dated 5.5.2011 – Changed to 2%, up to June 30, 2012, the ad valorem aliquots of the Import Tax with impact on the Telecommunication and Informatics Goods that relates, in the condition of tariff exception.
29, dated 5.5.2011 – Changed to 2%, up to June 30, 2012, the ad valorem aliquots of the Import Tax with impact on the Capital Goods, as well as on specifi c components of the Integrated System; and modifi ed the Resolutions that mentions.
33, dated 5.17.2011 – Prorogates, for a deadline of 60 days, the validity of the Resolution no. 21, dated April 7, 2011, which provides for sales conditions practices in the international trade, accepted in the Brazilian exports and imports.
34, dated 5.17.2011 – Changed to 2%, for the period and quota determined, due to shortages, the ad valorem aliquots of the Import Tax with impact on the products that that specifi es, classifi ed in the codes Common Mercosur Nomenclature (NCM) no. 2907.23.00 and NCM 7208.51.00.

VIII Main Economic Policy Measures 189
35, dated 6.1.2011 – Changed to 2%, up to June 30, 2012, the ad valorem aliquots of the Import Tax with impact on the Telecommunication and Informatics Goods that relates, in the condition of tariff exceptions.
36, dated 6.1.2011 – Changed to 2%, up to June 30, 2012, the ad valorem aliquots of the Import Tax with impact on the Capital Goods, in the condition of tariff exceptions.
37, dated 6.1.2011 – Applied provisional antidumping right, for a deadline of up to 6 months, to the Brazilian imports of supercalendered paper, classifi ed in the item 4806.40.00 of the Common Mercosur Nomenclature (NCM9, from the Republic of France, Republic of Italy and Republic of Hungary.
38, dated 6.1.2011 – Applied defi nitive antidumping right, for a deadline of up to 5 years, to the Brazilian imports of styrene-butadiene rubber of the lines 1502 and 1712, from Republic of Korea, commonly classifi ed in the item 4002.19.19 of the Common Mercosur Nomenclature.
39, dated 5.31.2011 – Changed to 0% the aliquot of the import tax on rabies and hepatitis B vaccines, for 12 months and according to determined quotas, and changed to 2% the aliquot of the tax on the imports of palm oil, also for 12 months and 222,500 tons, for purposes of supply.
40, dated 6.8.2011 – Instituted, in the scope of the Management Executive Committee (Gecex), the Coordination Group on Consolidation of Mercosur Customs Union (GC Mercosur), in order to examine and suggest the Brazilian position about the commitments foreseen in the Decision of the Common Market Council (CMC) no. 56, dated December 16, 2010 (Customs Union Consolidation Program), among other measures.
41, dated 6.14.2011 – Changed to 2% the aliquot of the Import Tax on the Ex 001 – Linear alkylbenzene, for 3 months and 3,000 tons, for purposes of supply.
42, dated 6.14.2011 – Instituted, in the scope of the Management Executive Committee (Gecex), the Monitoring Technical Group of the Common Market Group Resolution (GMC) no. 08, dated June 20, 2008 (GTAR-08), which provides for the modifi cation of the external tariff due to shortages.
43, dated 6.21.2011 – Changed to 2% the aliquot of the import tax on “anatase titanium dioxide”, for 12 months and 6,000 tons, for purposes of supply.
44, dated 7.11.2011 – Instituted, in the scope of the Foreign Trade Council (Camex), the Inter-Ministerial technical Group, authorized to elaborate proposal of modernization and consolidation of the internal legislation about foreign trade, in view of the harmonization, rationalization and simplifi cation.

190 Boletim do Banco Central do Brasil – Annual Report 2011
45, dated 7.11.2011 – Applied provisional antidumping right, for a deadline of up to six months, to the Brazilian imports of toluene-diisocynate, from Argentina and the U.S., commonly classifi ed in the item Common Mercosur Nomenclature (NCM) 2929.10.21, to be paid as specifi c aliquots fi xed in U.S. dollar per ton, according to specifi ed amounts.
46, dated 7.11.2011 – Prorogated the defi nitive antidumping right, for a deadline of up to fi ve years, applied to Brazilian imports of thermos from China, commonly classifi ed in the item Common Mercosur Nomenclature (NCM) 9617.00.10, keeping the right as ad valorem aliquot of 47%.
47, dated 11.7.2011 – Changed to 2%, up to December 31, 2012, the ad valorem aliquots of the Import Tax with impact on the Telecommunication and Informatics Goods that relates, in the condition of tariff exceptions, as well as on the components of the Integrated Systems that relates.
48, dated 7.11.2011 – Changed to 2%, up to December 31, 2012, the ad valorem aliquots of the Import Tax with impact on the Capital Goods, in the condition of tariff exceptions, as well as on the components of the Integrated Systems that relates; and changed to 0% the ad valorem aliquots of the Import Tax with impact on the components of the Integrated System (IS-844), included in the Resolution no. 36, dated June 1, 2011. The tariff exceptions of the Resolutions that mentions are also modifi ed.
50, dated 7.15.2011 – Changed to 2%, up to December 31, 2012, the ad valorem aliquot of the Import Tax with impact on the Telecommunication and Informatics Goods that relates, in the condition of tariff exceptions, classifi ed in the code Common Mercosur Nomenclature (NCM) no. 9030.82.10.
51, dated 7.15.2011 – Changed to 2%, up to December 31, 2012, the ad valorem aliquots of the Import Tax with impact on the Capital Goods, in the condition of tariff exceptions.
54, dated 8.9.2011 – Prorogated the defi nitive antidumping right, for a deadline of up to fi ve years, applied to Brazilian imports of carbon steel pipes, without sewing, used for oil pipelines and gas pipelines, with diameter of up to fi ve inches, from Romania, commonly classifi ed in the item Common Mercosur Nomenclature (NCM) no. 7304.19.00, to be paid as ad valorem aliquot of 14.3%, coming into force on October 7, 2011.
55, dated 8.9.2011 – Altered the Articles 1 and 6 of the Resolution no 35, dated November 22, 2006, which regulates the reduction of the aliquot of the Import Tax in capital, informatics and telecommunications goods, as well as their parts, pieces and components, without national production, and determines that the reduction is not applicable for used goods.

VIII Main Economic Policy Measures 191
56, dated 8.9.2011 – Changed to 2%, up to December 31, 2012, the ad valorem aliquot of the Import Tax with impact on the Telecommunication and Informatics Goods that mentions, in the condition of tariff exceptions.
57, dated 8.9.2011 – Changed to 2%, up to December 31, 2012, the ad valorem aliquots of the Import Tax with impact on the Capital Goods, in the condition of tariff exceptions.
58, dated 8.12.2011 – Changed to 0%, up to December 31, 2011, the aliquot of the Tax Import “Terephthalic Acid and its salts”, Common Mercosur Nomenclature (NCM) no. 2917.36.00, whose quota is of 135,000 tons, regulated by the Common Market Group Resolution (GMC) no. 8, dated June 20, 2008.
59, dated 8.29.2011 – Changed to 2%, for a period of six months and according to determined quotas, the ad valorem aliquots of the Import Tax of goods classifi ed in the codes Common Mercosur Nomenclature (NCM) no. 4810.13.90 coated paper, and 7307.91.00 fl anges, and up to December 31, 2011, of goods classifi ed in the code NCM no. 7208.51.00, regulated by the Common Market Group Resolution (GMC) no. 8, dated June 20, 2008.
60, dated 9.6.2011 – Altered the Resolution no. 38, dated June 1, 2011, which provides for the application of the defi nitive antidumping right to Brazilian imports of styrene-butadiene rubber of the lines 1502 and 1712, from Korea, commonly classifi ed in the item Common Mercosur Nomenclature (NCM) no. 4002.19.19, in view of the request for reconsideration presented by the Kumho Petrochemical Co., Ltd. (KKPC) and the Lanxess Elastômeros do Brasil S.A.
61, dated 9.6.2011 – Provides for the application of defi nitive antidumping right, for a deadline of up to 5 years, to the Brazilian imports of coarse salt non-targeted to animal and human consumption, from the Republic of Chile and homologates the pricing commitment.
63, dated 9.6.2011 – Provides for the application of defi nitive antidumping right, for a deadline of up to 5 years, to the Brazilian imports of carbon steel pipes from the People’s Republic of China.
64, dated 9.9.2011 – Regulated the retroactive charge of compensatory and antidumping rights.
65, dated 9.14.2011 – Altered the Brazilian List of Exceptions to the Common External Tariff (TEC).

192 Boletim do Banco Central do Brasil – Annual Report 2011
66, dated 9.6.2011 – Changed the way to apply the defi nitive antidumping right on Brazilian imports of polyvinyl chloride resin, regulated by the Resolution no. 85, dated December 8, 2010.
67, dated 9.20.2011 – Included new types of “tow trucks and semi trucks” in the Brazilian List f Exceptions to the Common External Tariff (TEC).
68, dated 9.20.2011, rectifi cation published on 9.27.2011 – Changed to 2%, up to December 31, 2012, the ad valorem aliquots of the Import Tax with impact on the Capital Goods, in the condition of tariff exceptions.
69, dated 9.20.2011, rectifi cation published on 9.30.2011 – Modifi ed the Common Mercosur Nomenclature (NCM), the aliquots of the Import Tax that compose the Common External Tariff (TEC) and the Brazilian List of Exceptions to the TEC.
70, dated 9.20.2011 – Changed to 2%, up to December 31, 2012, the ad valorem aliquot of the Import Tax with impact on the Telecommunication and Informatics Goods that mentions, in the condition of tariff exceptions.
71, dated 9.20.2011 – Prorogated the defi nitive antidumping right, for a deadline of up to 5 years, applied to Brazilian imports of Monocalcium Phosphate Monohydrate Food Grade (MCP), from the Republic of Argentina.
72, dated 10.5.2011 – Changed to 2%, for the indicated periods and according to the determined quota, the ad valorem aliquot of the Import Tax of goods classifi ed in the codes of the Common Mercosur Nomenclature (NCM) that relates.
73, dated 10.5.2011 – Modifi ed the Article 6 of the Resolution no. 35, dated November 22, 2006, which establishes the reduction of the aliquot of the Import Tax on capital, informatics and telecommunication goods, as well as their parts, pieces and components, without national production, considered in the Common External Tariff (TEC) as BK or BIT, may be granted in the condition of tariff exceptions.
74, dated 10.5.2011 – Changed to 2%, up to December 31, 2012, the ad valorem aliquots of the Import Tax with impact on the Capital Goods, in the condition of tariff exceptions, as well as on the components of the Integrated System that specifi es and modifi es the tariff exceptions of the Resolutions that mentions.
75, dated 10.5.2011 – Concluded the investigation about the application of defi nitive antidumping right, for a deadline of up to fi ve years, on the Brazilian imports of supercalendered paper, exported by France, Italy and Hungary, commonly classifi ed in the item Common Mercosur Nomenclature (NCM) no. 4806.40.00, to be paid as specifi c aliquot, set in U.S. dollar per ton, in the specifi ed amounts.

VIII Main Economic Policy Measures 193
76, dated 10.5.2011 – Concluded the investigation about the application of defi nitive antidumping right, for a deadline of up to fi ve years, on the Brazilian imports of n-Butanol, exported by the U.S., commonly classifi ed in the item Common Mercosur Nomenclature (NCM) no. 2905.13.00, to be paid as specifi c aliquot, set in U.S. dollar per ton, in the specifi ed amounts.
77, dated 10.5.2011 – Extinguished the defi nitive antidumping right applied to the Brazilian imports of barium carbonate, exported by China, commonly classifi ed in the item Common Mercosur Nomenclature (NCM) no. 2836.60.00, regulated by the Resolution no. 48, dated June 30, 2010.
78, dated 10.5.2011 – Considered as fulfi lled the authorization requirement, regulated by the item 2 of the Annex of the Resolution no. 55, dated August 5, 2010, when the import is not subjected to the requirement, in the Integrated Foreign Trade System (Siscomex), of direct or indirect import license, by legal person, in compliance with the Resolution no. 83, dated December 7, 2010.
79, dated 10.5.2011 – Altered the Brazilian List of Exceptions to the Common External Tariff (TEC).
82, dated 10.5.2011 – Created the Trade Defense Technical Group (GTDC), in the scope of the Foreign Trade Council (Camex), in order to examine the proposals of compensatory and antidumping rights fi xing, provisional or defi nitive, safeguard, of homologation of the pricing commitment and extension of the application of antidumping and compensatory measures, regulated by the Article 10-A, of the Law no. 9,019, dated March 30, 1995, and revoked by the Resolution no. 30, dated September 26, 2006.
83, dated 10.31.2011 – Altered, for the periods mentioned and according to determined quotas, the ad valorem aliquots of the Import Tax of goods classifi ed in the codes Common Mercosur Nomenclature (NCM), specifi ed and revoked by the Resolution no. 80, dated October 5, 2011.
84, dated 11.9.2011 – Changed to 2%, up to December 31, 2012, the ad valorem aliquots of the Import Tax with impact on the Telecommunication and Informatics Goods that mentions, in the condition of tariff exceptions.
85, dated 11.9.2011 – Changed to 2%, up to December 31, 2012, the ad valorem aliquots of the Import Tax with impact on the Capital Goods that mentions, in the condition of tariff exceptions, as well as on the components of the Integrated Systems that relates.
86, dated 11.9.2011 – Applied provisional antidumping right, for a deadline of up to six months, on the Brazilian imports of Light Weight Coated (LWC), coated in the two sides, weighting a total between 50 and 72 g/m, in which the coating weight should

194 Boletim do Banco Central do Brasil – Annual Report 2011
not exceed 152 g/m² per side, for offset printing, with brightness between 60% and 95%, while the supporting paper should be composed of, at least, 50% in weight of wood fi bers obtained by means of mechanic process, from the U.S., Finland, Sweden, Belgium, Canada and Germany, commonly classifi ed in the item Common Mercosur Nomenclature (NCM) 4810.22.90, to be paid as specifi c aliquots, set in U.S. dollar per ton, in the specifi ed amounts.
87, dated 11.9.2011 – Revoked modifi cation of aliquots of the Tax Import of the code mentioned, regulated by the Resolution no. 8, dated June 20, 2008, of the Mercosur Common Market Group (GMC), included in the Camex Resolutions no. 72 and 83, dated October 5, 2011, and October 31, 2011, respectively, which modifi ed the ad valorem aliquots of the Import Tax of goods classifi ed in the codes Common Mercosur Nomenclature (NCM) no. 7326.90.90.
88, dated 11.11.2011 – Prorogated the deadline to present the fi rst project of modernization and consolidation of the legislation related to the foreign trade, regulated by the Resolution no. 44, dated July 11, 2011.
92, dated 11.17.2011 – Applied defi nitive antidumping right, for a deadline of up to 5 years, on Brazilian imports of toluene diisocyanate (TDI-80/20), from the U.S. and Argentina.
94, dated 12.8.2011 – Altered the Common Mercosur Nomenclature (NCM) and the aliquots of the Import Tax that compose the Common External Tariff (TEC), as well as the List of Exceptions to the Common External Tariff and Informatics and Telecommunications Goods (BIT), for purposes of adaptation to the modifi cations of the Harmonized Commodity Description and Coding System (HS). This Resolution comes into force on January 1, 2012, revoking the opposite provisions, especially the Resolution no 43, dated December 22, 2006, and future alterations.
95, dated 12.13.2011 – Changed to 2%, up to December 31, 2012, the ad valorem aliquots of the Import Tax with impact on the Telecommunications and Informatics Goods, in the condition of tariff exceptions that mentions.
96, dated 12.13.2011 – Changed to 2%, up to December 31, 2012, the ad valorem aliquots of the Import Tax with impact on the Telecommunication and Informatics Goods, in the condition of tariff exceptions.
97, dated 12.23.2011 – Changed to 2%, for a period of 12 months and according to determined quota, the ad valorem aliquot of the Import Tax, with impact on the goods classifi ed in the codes Common Mercosur Nomenclature (NCM) no. 3206.11.19 and 3904.10.20.
VIII Main Economic Policy Measures 195
98, dated 12.29.2011 – Prorogated, up to December 31, 2012, the validity of the aliquot of the Import Tax of 35%, regulated by the Camex Resolution no. 92, dated December 27, 2010, for the codes Common Mercosur Nomenclature (NCM), included in the Annex 1 of the Resolution no. 94, dated December 8, 2011, coming into force on January 1, 2012.
99, dated 12.29.2011 – Prorogated, up to December 31, 2012, the validity of the aliquot of the Import Tax of 35%, regulated by the Resolution no. 14/2011, for the codes Common Mercosur Nomenclature (NCM), included in the Annex 1 of the Camex Resolution no. 94, dated December 8, 2011, coming into force on January 1, 2012.
100, dated 12.29.2011 – Updated the tariff framework and the numerations of tariff exceptions of valid Capital Goods, by adjusting the Resolution no. 94, dated December 8, 2011, which integrated the Amendment V to the Harmonized System, coming into force on January 1, 2012.
Central Bank of Brazil Circulars
3,520, dated 1.6.2011 – Established compulsory payment on exchange short position.
3,521, dated 1.12.2011 – Published the sample regulated by the Article 1 of the Resolution no. 3,354, dated March 31, 2006, in order to calculate the Basic Financing Rate (TBF) and the Reference Rate (TR).
3,522, dated 1.14.2011 – Prohibited the fi nancial institutions to sign covenants, contracts or agreements that impede the access of clients to credit operations offered by other institutions.
3,523, dated 1.14.2011 – Established the period to present the declaration of Brazilian Capital Abroad (CBE), related to the base date of December 31, 2010.
3,524, dated 2.3.2011 – Provided for the limits of leverage and mobilization to consortiums’ administers, and adopted other measures.
3,525, dated 2.10.2011 – Altered the International Exchange and Capital Market Regulations (RMCCI).
3,526, dated 2.23.2011 – Prorogated the fi nal deadline to present the declaration of Brazilian Capital Abroad (CBE), related to the base date of December 31, 2010.

196 Boletim do Banco Central do Brasil – Annual Report 2011
3,527, dated 3.3.2011 – Altered the International Exchange and Capital Market Regulations (RMCCI).
3,528, dated 3.23.2011 – Altered the Circular no. 3,091, dated March 1, 2002, and the Circular no. 3,144, dated August 14, 2002, which provide for the compulsory payment on term funds, and the additional enforceability about deposits, and the Circular no. 3,520, dated January 6, 2011, which provides for the compulsory payment on the exchange short position.
3,529, dated 3.29.2011 – Provides for the compulsory payment on funds raised by the Federal Savings Bank.
3,530, dated 4.7.2011 – Altered the International Exchange and Capital Market Regulations (RMCCI).
3,531, dated 4.13.2011 – Altered the International Exchange and Capital Market Regulations (RMCCI).
3,532, dated 4.25.2011 – Established the truncation as standard procedure, in the scope of the Clearance of Checks and other Documents Centralizing Bureau (Compe), altered and consolidated the proper regulation.
3,533, dated 4.25.2011 – Altered the International Exchange and Capital Market Regulations (RMCCI).
3,534, dated 5.6.2011 – Altered the regulation about Available Electronic Transfer (TED).
3,535, dated 5.16.2011 – Established reason to return checks, altered descriptions and specifi cations of use of existent reasons, and modifi ed the Circular no. 3,532, dated April 25, 2011.
3,536, dated 5.19.2011 – Altered the regulation of the Monetary Policy Committee (Copom), attached to the Circular no. 3,297, dated October 31, 2005.
3,537, dated 5.25.2011 – Altered the Circular no. 3,506, dated September 23, 2010, which provides for the methodology to assess real/dollar exchange rate by the Central Bank of Brazil (System of Exchange Rate Control and Information).
3,538, dated 6.1.2011 – Provided for the procedure to retire of circulation notes damaged due to supposed activation of anti-theft devices.
3,539, dated 6.2.2011 – Altered the Articles 8 and 9 of the Regulation attached to the Circular no. 3,057, dated August 31, 2011.

VIII Main Economic Policy Measures 197
3,540, dated 6.9.2011 – Altered the Circular no. 3,538, dated June 1, 2011, which provided for the procedures to retire of circulation notes damaged due to supposed activation of anti-theft devices.
3,541, dated 6.24.2011 – Altered the Circular no. 3,298, dated November 1, 2005, and its annex Regulation of Custody of Currency of the Central Bank of Brazil.
3,542, dated 6.24.2011 – Altered the Circular no. 3,427, dated December 19, 2008, prorogating the deadline for the acquisition and execution of inter-fi nancial deposits subjected to deduction of compulsory payment on term funds.
3,543, dated 6.24.2011 – Established deadline to present the declaration of Brazilian Capital Abroad (CBE), related to the base dates of March 31, 2011, June 30, 2011, and September 30, 2011.
3,544, dated 6.28.2011 – Altered the Regulation attached to the Circular no. 3,406, dated September 26, 2008, which provides for the Payments in Local Currency System between the Central Bank of Brazil and the Central Bank of Argentina.
3,545, dated 7.4.2011 – Altered the International Exchange and Capital Market Regulations (RMCCI), and adopted other measures.
3,546, dated 7.4.2011 – Altered the attachment to the Central Bank Information System (Sisbacen), published by the Circular no. 3,232, dated April 6, 2004.
3,547, dated 7.7.2011 – Established procedures and parameters related to the Internal Capital Adequacy Assessment Process (Icaap).
3,548, dated 7.8.2011 – Redefi ned and consolidated the rules of compulsory payment on exchange short position.
3,549, dated 7.18.2011 – Altered the Circular no. 3,512, dated November 25, 2010, and the Circular no. 3,360, dated September 12, 2007, to provide for matters related to credit card contracts that foresee the payment of invoices by means of payroll-deducted operations.
3,550, dated 7.21.2011 – Published the sample regulated by the Article 1 of the Resolution no. 3,354, dated March 31, 2006, in order to calculate the Basic Interest Rate (TBF) and the Reference Rate (TR).
3,551, dated 7.21.2011 – Altered the International Exchange and Capital Market Regulations (RMCCI).

198 Boletim do Banco Central do Brasil – Annual Report 2011
3,552, dated 7.26.2011 – Changed the data from which the Available Electronic Transfers (TEDs), carried out in favor or by command of institution holding the Banking Reserves Account or Settlement Account, should be subjected to settlement, in compliance with the system managed by the Central Bank of Brazil, only if involving application in capital and fi nancial markets.
3,553, dated 8.3.2011 – Provided for the conditions to register credit operations in systems of registration and fi nancial settlement of assets authorized by the Central Bank of Brazil.
3,554, dated 8.3.2011 – Altered the International Exchange and Capital Market Regulations (RMCCI).
3,555, dated 8.10.2011 – Regulated the electronic exchange of information by means of the National Financial System Network (RSFN).
3,556, dated 8.17.2011 – Altered the International Exchange and Capital Market Regulations (RMCCI).
3,557, dated 9.1.2011 – Altered provisions related to the Rediscount of the Central Bank, included in the regulation attached to the Circular no. 3,105, dated April 5, 2002.
3,558, dated 9.16.2011 – Provided for the risk prevention in the contracting of operations and rendering of services by administers of consortium, and adopted other measures.
3,559, dated 9.19.2011 – Published the conduction of the Census of Foreign Capital in the Country 2011.
3,560, dated 10.17.2011 – Released the issue of accounting documents by administers of consortium.
3,561, dated 10.26.2011 – Authorized fi nancial institutions to participate in the economic subsidy operations, in the scope of the My House, My Life Program (PMCMV), in compliance with the Law no. 11,977, dated July 7, 2009.
3,562, dated 10.31.2011 – Prorogated the fi nal deadline to present the declaration of the Census of Foreign Capital in the Country 2011, related to the base date of December 31, 2010.
3,563, dated 11.11.2011 – Altered the Circular no. 3,360, dated September 12, 2007, which established the procedures to calculate the Amount of the Required Base Capital referring to Exposures by Weighted Risk Factor (PEPR), and the Circular no. 3,512,
VIII Main Economic Policy Measures 199
dated November 25, 2010, which provided for the payment of the minimum value of the credit card invoice.
3,564, dated 11.16.2011 – Altered the attachment to the Central Bank Information System (Sisbacen), published by the Circular no. 3,232, dated April 6, 2004.
3,565, dated 12.8.2011 – Altered the International Exchange and Capital Market Regulations (RMCCI).
3,566, dated 12.8.2011 – Defi ned criteria for the fulfi llment of the required application of cash deposits in microcredit operations, and established procedures to send information related to these operations.
3,567, dated 12.12.2011 – Provided for the sending of information related to credit operations of the Credit Information System (SCR), regulated by the Resolution no. 3,568, dated December 17, 2008.
3,568, dated 12.21.2011 – Altered provisions of the Circulars no. 3,361, dated September 12, 2007, 3,388, dated June 4, 2008, 3,478, dated December 24, 2009, and 3,498, dated June 28, 2010, which established the procedures to calculate the Installment Referring to the Risk of Operations Subject to Interest Rate Variation (PJUR), the Amount Related to the Risk of Operations Subject to Change in Stock Price (PACS), the Amount Related to the Risk of Operations Subject to Change in the Price of Goods (PCOM), and the Amount Referring to Risk Exposure in Gold, Foreign Currency, and Operations subject to Foreign Exchange Variation (PCAM) of the Required Base Capital (PRE), regulated by the Resolution no. 3,490, dated August 29, 2007.
3,569, dated 12.21.2011 – Redefi ned and consolidated the rules of compulsory payment on term funds.
3,570, dated 12.23.2011 – Established the mandatory provision of information related to the resolutions of the United Nations Security Council (UNSC) incorporated to the Brazilian judicial system, altered the regulation of the International Exchange and Capital Market Regulations (RMCCI), and adopted other measures.
Circulars of the Foreign Trade Secretariat
1, dated 1.6.2011 – Established, since January 7, 2011, a deadline of 40 days to present proposals to improve the offer for negotiations, in the scope of the future Free Trade Agreement between the Mercosur and the EU. To indicate new offers, it should be observed the worksheet available in the website http://www.mdic.gov.br/sitio/interna/interna.php?area=5&menu=2635&refr=1893, which represents the consolidation of

200 Boletim do Banco Central do Brasil – Annual Report 2011
supplies of the Mercosur, on September, 2004. The expressions of interest may be exclusively formulated by professional associations, and should be sent by a written mean, to the Department of International Negotiations (Deint), located in the Esplanada dos Ministérios, Bloco J, 8° andar, sala 814, and a digital copy sent to [email protected] and [email protected].
3, dated 1.18.2011 – Prorogated, up to February 4, 2011, the fi nal deadline stipulated in the Circular no. 54/2010, to present any expression about the European proposal of specifi c requirements of origin for the products classifi ed in the Chapters 25-97 of the Harmonized System, for the negotiations of the Free Trade Agreement between the Mercosur and the EU. This deadline ends at 17:00 o’clock, Brasilia-DF time, on February 4, 2011.
23, dated 5.19.2011 – Concluded the research which investigated the presence of dumping in the exports of low-carbon and low-alloy laminated products, treated with continuous or traditional casting (Common Mercosur Nomenclature – NCM no. 7208.51.00 and 7208.52.00), from Turkey, North Korea, Chinese Taipei and Mexico.
25, dated 5.27.2011 – Prorogated for up to six months, since June 1, 2011, the deadline to investigate the dumping present in the exports of styrene-butadiene rubber E-SBR 1502 and 1712, from Korea to Brazil, and the damage caused to the domestic industry by this practice, initiated by means of the Circular no. 20, dated May 31, 2010.
63, dated 11.30.2011 – Published that the Generalized System of Preferences (GSP) of the U.S., from which Brazil is benefi ciary, was renovated up to July 31, 2013, by means of presidential sanction to the project of the North-American Congress “H.R. 2832: To extend the Generalized System of Preferences, and for other purposes”, occurred on October 21, 2011.
Federal Revenue Secretariat of Brazil Directives
257, dated 5.20.2011 – Provided for the readjustment of the Utilization Rate of the Foreign Trade Integrated System, administered by the Federal Revenue Secretariat of Brazil.
464, dated 9.22.2011 – Prorogated, up to December 29, 2011, the deadline to pay the Financial Operations Tax (IOF) on operations with derivatives, and revoked the Ordinance of the Ministry of Finance (MF) no. 370, dated July 29, 2011.
560, dated 12.23.2011 – Prorogated the deadline to pay the Financial Operations Tax (IOF) on operations with derivatives, and revoked the Ordinance of the Ministry of Finance (MF) no. 464, dated September 22, 2011.
VIII Main Economic Policy Measures 201
Foreign Trade Secretariat Directives
2, dated 7.1.2011 – Determined that since February 1, 2011, the Export Registrations will be only registered in the Siscomex Export, by means of the webpage of the Ministry of Development, Industry and Foreign Trade (www.mdic.gov.br).
23, dated 7.11.2011 – Consolidated the rules and procedures applicable to foreign trade operations, and revoked the Directive no. 10, dated May 24, 2010.
41, dated 12.5.2011 – Determined that the lead pencils and color pencils, considered as wood pencils, with diameter between 7 and 8 mm, classifi ed in the Common Mercosur Nomenclature (NCM) no. 9609.10.00, exported by the company that mentions, do not fulfi ll the necessary conditions to be considered as coming from Chinese Taipei.
National Treasury Secretariat Directives
65, dated 1.27.2011 – Authorized the issue of National Treasury Notes – Series I (NTN-I) amounting to R$22,711,845.33, on January 15, 2011, to be used in the equalization payment of interest rates of fi nancings to the export of Brazilian goods and services, supported by the Export Financing Program (Proex).
66, dated 1.27.2011 – Authorized the issue of National Treasury Notes – Series I (NTN-I) amounting to R$20,580,873.61, on January 15, 2011, to be used in the equalization payment of interest rates of fi nancings to the export of Brazilian goods and services, supported by the Export Financing Program (Proex).
188, dated 3.28.2011 – Authorized the issue of National Treasury Notes – Series I (NTN-I) amounting to R$2,945,697.32, on March 15, 2011, to be used in the equalization payment of interest rates of fi nancings to the export of Brazilian goods and services, supported by the Export Financing Program (Proex).
189, dated 3.28.2011 – Authorized the issue of National Treasury Notes – Series I (NTN-I) amounting to R$43,375,075.40, on March 15, 2011, to be used in the equalization payment of interest rates of fi nancings to the export of Brazilian goods and services, supported by the Export Financing Program (Proex).
190, dated 3.28.2011 – Authorized the issue of National Treasury Notes – Series I (NTN-I) amounting to R$2,859.11, on March 15, 2011, to be used in the equalization payment of interest rates of fi nancings to the export of Brazilian goods and services, supported by the Export Financing Program (Proex).
202 Boletim do Banco Central do Brasil – Annual Report 2011
268, dated 4.27.2011 – Authorized the issue of National Treasury Notes – Series I (NTN-I) amounting to R$14,204,036.20, on April 15, 2011, to be used in the equalization payment of interest rates of fi nancings to the export of Brazilian goods and services, supported by the Export Financing Program (Proex).
269, dated 27.4.2011 – Authorized the issue of National Treasury Notes – Series I (NTN-I) amounting to R$593,98.44, on April 15, 2011, to be used in the equalization payment of interest rates of fi nancings to the export of Brazilian goods and services, supported by the Export Financing Program (Proex).
270, dated 4.27.2011 – Authorized the issue of National Treasury Notes – Series I (NTN-I) amounting to R$2,247,293.85, on April 15, 2011, to be used in the equalization payment of interest rates of fi nancings to the export of Brazilian goods and services, supported by the Export Financing Program (Proex).
439, dated 7.5.2011 – Authorized the issue of National Treasury Notes – Series I (NTN-I) amounting to R$2,594,554.50, on June 15, 2011, to be used in the equalization payment of interest rates of fi nancings to the export of Brazilian goods and services, supported by the Export Financing Program (Proex).
440, dated 7.5.2011 – Authorized the issue of National Treasury Notes – Series I (NTN-I) amounting to R$20,170,450.74, on June 15, 2011, to be used in the equalization payment of interest rates of fi nancings to the export of Brazilian goods and services, supported by the Export Financing Program (Proex).
441, dated 7.5.2011 – Authorized the issue of National Treasury Notes – Series I (NTN-I) amounting to R$35,603,586.06, on June 15, 2011, to be used in the equalization payment of interest rates of fi nancings to the export of Brazilian goods and services, supported by the Export Financing Program (Proex).
526, dated 8.1.2011 – Authorized the issue of National Treasury Notes – Series I (NTN-I) amounting to R$1,089,225.47, on July 15, 2011, to be used in the equalization payment of interest rates of fi nancings to the export of Brazilian goods and services, supported by the Export Financing Program (Proex).
527, dated 8.1.2011 – Authorized the issue of National Treasury Notes – Series I (NTN-I) amounting to R$4,592,132.80, on July 15, 2011, to be used in the equalization payment of interest rates of fi nancings to the export of Brazilian goods and services, supported by the Export Financing Program (Proex).
528, dated 8.1.2011 – Authorized the issue of National Treasury Notes – Series I (NTN-I) amounting to R$16,952,636.51, on July 15, 2011, to be used in the equalization

203 Boletim do Banco Central do Brasil – Annual Report 2011
payment of interest rates of fi nancings to the export of Brazilian goods and services, supported by the Export Financing Program (Proex).
669, dated 9.30.2011 – Authorized the issue of National Treasury Notes – Series I (NTN-I) amounting to R$3,525,509.95, on September 15, 2011, to be used in the equalization payment of interest rates of fi nancings to the export of Brazilian goods and services, supported by the Export Financing Program (Proex).
670, dated 9.30.2011 – Authorized the issue of National Treasury Notes – Series I (NTN-I) amounting to R$35,020,361.02, on September 15, 2011, to be used in the equalization payment of interest rates of fi nancings to the export of Brazilian goods and services, supported by the Export Financing Program (Proex).
671, dated 9.30.2011 – Authorized the issue of National Treasury Notes – Series I (NTN-I) amounting to R$60,010,291.76, on September 15, 2011, to be used in the equalization payment of interest rates of fi nancings to the export of Brazilian goods and services, supported by the Export Financing Program (Proex).
726, dated 10.28.2011 – Authorized the issue of National Treasury Notes – Series I (NTN-I) amounting to R$229,204.35, on October 15, 2011, to be used in the equalization payment of interest rates of fi nancings to the export of Brazilian goods and services, supported by the Export Financing Program (Proex).
727, dated 10.28.2011 – Authorized the issue of National Treasury Notes – Series I (NTN-I) amounting to R$1,582,245.29, on October 15, 2011, to be used in the equalization payment of interest rates of fi nancings to the export of Brazilian goods and services, supported by the Export Financing Program (Proex).
728, dated 10.28.2011 – Authorized the issue of National Treasury Notes – Series I (NTN-I) amounting to R$21,008,442.64, on October 15, 2011, to be used in the equalization payment of interest rates of fi nancings to the export of Brazilian goods and services, supported by the Export Financing Program (Proex).
794, dated 11.30.2011 – Authorized the issue of National Treasury Notes – Series I (NTN-I) amounting to R$700,952.94, on November 15, 2011, to be used in the equalization payment of interest rates of fi nancings to the export of Brazilian goods and services, supported by the Export Financing Program (Proex).
795, dated 11.30.2011 – Authorized the issue of National Treasury Notes – Series I (NTN-I) amounting to R$2,381,552.03, on November 15, 2011, to be used in the equalization payment of interest rates of fi nancings to the export of Brazilian goods and services, supported by the Export Financing Program (Proex).

204 Boletim do Banco Central do Brasil – Annual Report 2011
796, dated 11.30.2011 – Authorized the issue of National Treasury Notes – Series I (NTN-I) amounting to R$26,472,037.40, on November 15, 2011, to be used in the equalization payment of interest rates of fi nancings to the export of Brazilian goods and services, supported by the Export Financing Program (Proex).
811, dated 12.7.2011 – Established that the resources related to the States, Federal District and Municipalities Revenue Sharing Funds and the Industrialized Products Exports Compensation Fund (IPI-EXP) should be provided in 2012, according to the chronogram that mentions.
850, dated 12.27.2011 – Authorized the issue of National Treasury Notes – Series I (NTN-I) amounting to R$385.301,78, on December 15, 2011, to be used in the equalization payment of interest rates of fi nancings to the export of Brazilian goods and services, supported by the Export Financing Program (Proex).
851, dated 12.27.2011 – Authorized the issue of National Treasury Notes – Series I (NTN-I) amounting to R$4,877,009.30, on December 15, 2011, to be used in the equalization payment of interest rates of fi nancings to the export of Brazilian goods and services, supported by the Export Financing Program (Proex).
852, dated 12.27.2011 – Authorized the issue of National Treasury Notes – Series I (NTN-I) amounting to R$27,550,023.28, on December 15, 2011, to be used in the equalization payment of interest rates of fi nancings to the export of Brazilian goods and services, supported by the Export Financing Program (Proex).
Normative Instructions of the Federal Revenue Secretariat of Brazil
1,124, dated 1.2.2011 – Provided for the adjustment mechanism, for purposes of confi rmation of transfer prices in the export, in order to reduce the impacts related to the appreciation of local currency, compared to other currencies, for the calendar year 2010.
1,169, dated 6.29.2011 – Established special procedures of control of the import and export of goods and commodities, in view of a supposed irregularity punishable with confi scation, and revoked the Normative Instructions no. 52, dated May 8, 2001, and no. 206, dated September 25, 2002.
1,186, dated 8.29.2011 – Provided for the Special Regime for Brazilian Aeronautical Industry (Retaero).

205 Boletim do Banco Central do Brasil – Annual Report 2011
1,202, dated 10.19.2011 – Approved the Amendment V to the Nomenclature of the Harmonized System of Designation and Codifi cation of Goods, coming into force on January 1, 2012.
1,207, dated 11.3.2011 – Provided for the impact of the Financial Operations Tax (IOF) on operations with derivatives.
Interpretative Declaratory Acts of the Federal Revenue Secretariat
40, dated 8.1.2011 – Determined that the use of credit card to pay bills by means of credit, regulated in the Resolution no. 3,919, dated November 25, 2010, is subjected to the Financial Operations Tax (IOF), to the aliquot of 3%.
41, dated 8.1.2011 – Determined that the settlements of exchange operations for the infl ow of funds in the country, by means of simultaneous operations, related to foreign loan directly contracted or through issue of international market securities with minimum medium-term of up to 720 days, in compliance with the paragraph XXII of the Article 15-A of the Decree no. 6,306, dated December 14, 2007, with the modifi cations introduced by the Decree no. 7,457, dated April 6, 2911, may be impacted by the Financial Operations Tax (IOF), to the aliquot of 6%.
Central Bank of Brazil Communiqués
20,503, dated 1.18.2011 – Released the entailment of exchange contracts to Export Dispatch Declarations (DDE) and Import Declarations (DI), among other measures.
21,124, dated 5.31.2011 – Published the signing of Bilateral Treaty between the Central Bank of Brazil and the Central Bank of the Republic of Argentina, authorizing, in the scope of the Reciprocal Credit and Payment Agreement (CCR) of the Latin American Integration Association (Aladi), international trade operations of services necessary to the execution of civil engineering works, targeted to the construction of infrastructure and industries.
Circular Letters of the Central Bank of Brazil
3,512, dated 6.24.2011 – Published criteria for the accreditation and disqualifi cation of dealers institutions, which operate jointly with the Department of International
206 Boletim do Banco Central do Brasil – Annual Report 2011
Reserve Operations (Depin) – Circular no. 3,083, dated January 30, 2002, and revoked the Circular Letter no. 3,395, dated April 23, 2009.
3,523, dated 10.18.2011 – Published procedures related to the compulsory payment on exchange short position.

Appendix 207
Members of the Conselho Monetário Nacional
Banco Central do Brasil Management
Central units (departments) of the Banco Central do Brasil
Regional offi ces of the Banco Central do Brasil
Acronyms
Appendix
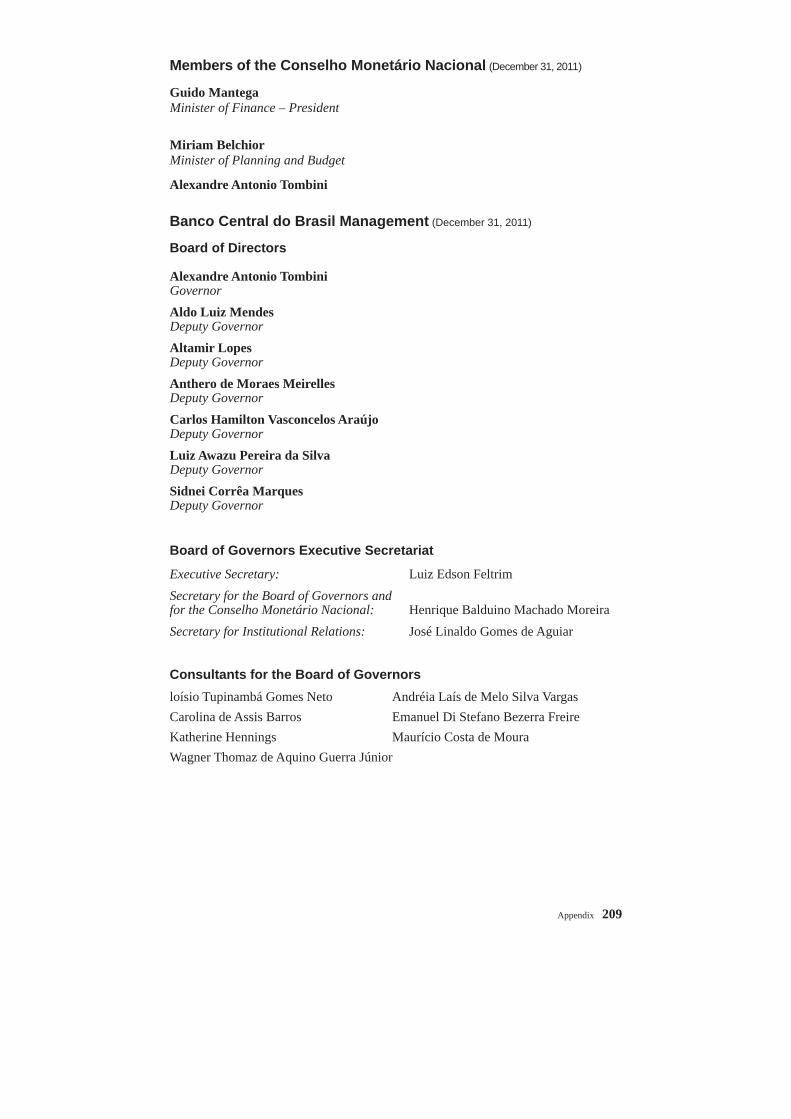
Appendix 209
Members of the Conselho Monetário Nacional (December 31, 2011)
Guido MantegaMinister of Finance – President
Miriam BelchiorMinister of Planning and Budget
Alexandre Antonio Tombini
Banco Central do Brasil Management (December 31, 2011)
Board of Directors
Alexandre Antonio TombiniGovernorAldo Luiz MendesDeputy GovernorAltamir LopesDeputy GovernorAnthero de Moraes MeirellesDeputy GovernorCarlos Hamilton Vasconcelos AraújoDeputy GovernorLuiz Awazu Pereira da SilvaDeputy GovernorSidnei Corrêa MarquesDeputy Governor
Board of Governors Executive Secretariat
Executive Secretary: Luiz Edson FeltrimSecretary for the Board of Governors and for the Conselho Monetário Nacional: Henrique Balduino Machado MoreiraSecretary for Institutional Relations: José Linaldo Gomes de Aguiar
Consultants for the Board of Governorsloísio Tupinambá Gomes Neto Andréia Laís de Melo Silva VargasCarolina de Assis Barros Emanuel Di Stefano Bezerra FreireKatherine Hennings Maurício Costa de MouraWagner Thomaz de Aquino Guerra Júnior

210 Boletim do Banco Central do Brasil – Annual Report 2011
Central units of the Banco Central do Brasil (December 31, 2011)
Banking Operations Department (Deban)Edifício-Sede – 18º andarSBS Quadra 3 Zona Central70074-900 Brasília (DF)Head: Daso Maranhão Coimbra
Congressional Affairs Offi ce (Aspar)Edifício-Sede – 19º andarSBS Quadra 3 Zona Central70074-900 Brasília (DF)Head: Luiz do Couto Neto
Currency Management Department (Mecir)Av. Rio Branco, 30 – Centro20090-001 Rio de Janeiro (RJ)Head: João Sidney de Figueiredo Filho
Department of Analysis and Control of Disciplinary Actions (Decap)Edifício-Sede – 7º andarSBS Quadra 3 Zona Central70074-900 Brasília (DF)Head: Claudio Jaloretto
Department of Bank Liquidation (Deliq)Edifício-Sede – 2º subsoloSBS Quadra 3 Zona Central700074-900 Brasília (DF)Head: Dawilson Sacramento
Department of Economics (Depec)Edifício-Sede – 10º andarSBS Quadra 3 Zona Central70074-900 Brasília (DF)Head: Tulio José Lenti Maciel
Department of External Debt and International Relations (Derin)Edifício-Sede – 14º andarSBS Quadra 3 Zona Central70074-900 Brasília (DF)Head: Bruno Walter Coelho Saraiva
Department of Financial System Organization (Deorf)Edifício-Sede – 19º andarSBS Quadra 3 Zona Central70074-900 Brasília (DF)Head: Adalberto Gomes da Rocha
Department of Financial System Regulation (Denor)Edifício-Sede – 5º subsoloSBS Quadra 3 Zona Central70074-900 Brasília (DF)Head: Sergio Odilon dos Anjos

Appendix 211
Department of Human Resources Administration (Depes)Edifício-Sede – 17º andarSBS Quadra 3 Zona Central70074-900 Brasília (DF)Head: Nilvanete Ferreira da Costa
Department of Information Systems Management (Deinf)Edifício-Sede – 2º andarSBS Quadra 3 Zona Central70074-900 Brasília (DF)Head: Marcelo José Oliveira Yared
Department of International Reserves Operations (Depin)Edifício-Sede – 5º andarSBS Quadra 3 Zona Central70074-900 Brasília (DF)Head: Márcio Barreira de Ayrosa Moreira
Department of Material Resources Administration (Demap)Edifício-Sede – 1º subsoloSBS Quadra 3 Zona Central70074-900 Brasília (DF)Head: Antônio Carlos Mendes Oliveira
Department of Off-site Supervision and Information Management (Desig)Edifício-Sede – 4º andarSBS Quadra 3 Zona Central70074-900 Brasília (DF)Head: Lucio Rodrigues Capelletto
Department of Open Market Operations (Demab)Av. Pres. Vargas, 730 – 6º andar20071-900 Rio de Janeiro (RJ)Head: João Henrique de Paula Freitas Simão
Department of Planning and Management Overview of Supervisory Activities (Decop)Edifício-Sede – 6º andarSBS Quadra 3 Zona Central70074-900 Brasília (DF)Head: Harold Paquete Espinola Filho
Department of Supervision of Credit Unions and Non-banking Financial Institutions and Financial System Consumer Complaints (Desuc)Edifício-Sede – 6º andarSBS Quadra 3 Zona Central70074-900 Brasília (DF)Head: José Angelo Mazzillo Júnior
Department of Surveillance of Illegal Activities and Supervision of Foreign Ex-change and International Capital Flows (Decic) Edifício-Sede – 7º andarSBS Quadra 3 Zona Central70074-900 Brasília (DF)Head: Ricardo Liáo
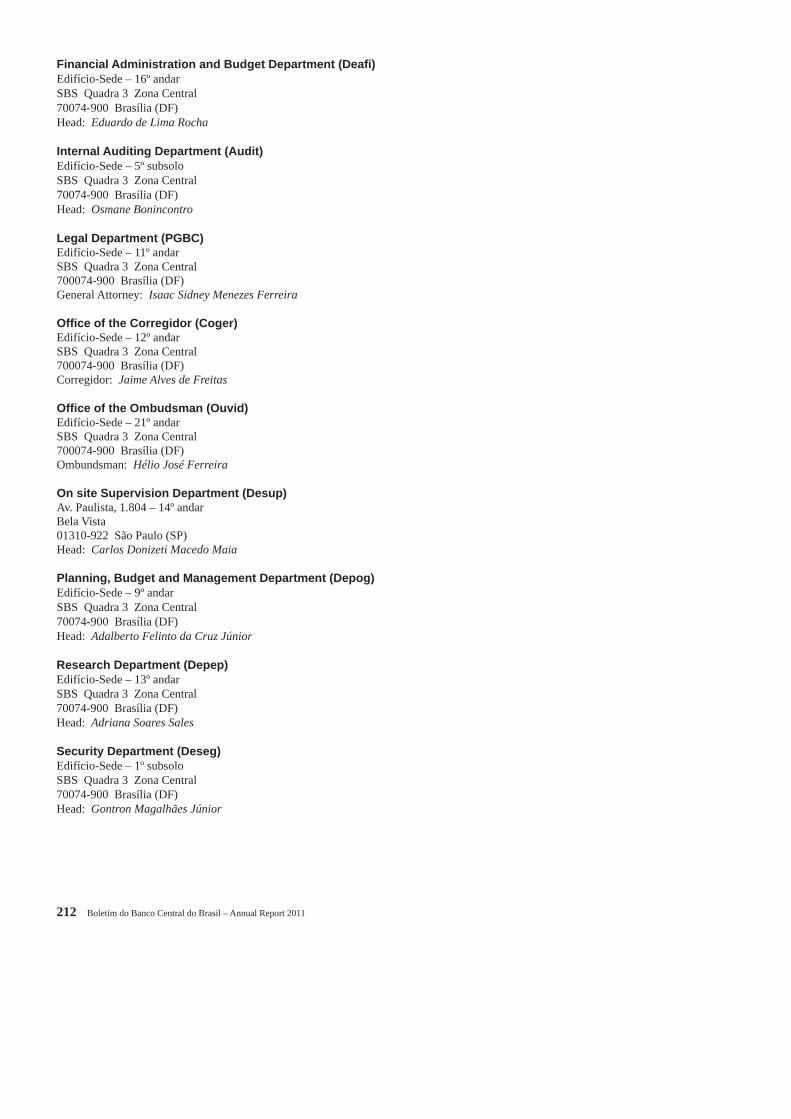
212 Boletim do Banco Central do Brasil – Annual Report 2011
Financial Administration and Budget Department (Deafi )Edifício-Sede – 16º andarSBS Quadra 3 Zona Central70074-900 Brasília (DF)Head: Eduardo de Lima Rocha
Internal Auditing Department (Audit)Edifício-Sede – 5º subsoloSBS Quadra 3 Zona Central70074-900 Brasília (DF)Head: Osmane Bonincontro
Legal Department (PGBC)Edifício-Sede – 11º andarSBS Quadra 3 Zona Central700074-900 Brasília (DF)General Attorney: Isaac Sidney Menezes Ferreira
Offi ce of the Corregidor (Coger)Edifício-Sede – 12º andarSBS Quadra 3 Zona Central700074-900 Brasília (DF)Corregidor: Jaime Alves de Freitas
Offi ce of the Ombudsman (Ouvid)Edifício-Sede – 21º andarSBS Quadra 3 Zona Central700074-900 Brasília (DF)Ombundsman: Hélio José Ferreira
On site Supervision Department (Desup)Av. Paulista, 1.804 – 14º andarBela Vista01310-922 São Paulo (SP)Head: Carlos Donizeti Macedo Maia
Planning, Budget and Management Department (Depog)Edifício-Sede – 9º andarSBS Quadra 3 Zona Central70074-900 Brasília (DF)Head: Adalberto Felinto da Cruz Júnior
Research Department (Depep)Edifício-Sede – 13º andarSBS Quadra 3 Zona Central70074-900 Brasília (DF)Head: Adriana Soares Sales
Security Department (Deseg)Edifício-Sede – 1º subsoloSBS Quadra 3 Zona Central70074-900 Brasília (DF)Head: Gontron Magalhães Júnior
Appendix 213
Executive Offi ce
Exchange and Foreign Capital Regulation Executive Offi ce (Gence)Edifício-Sede – 3º andarSBS Quadra 3 Zona Central70074-900 Brasília (DF)Head: Geraldo Magela Siqueira
Executive Offi ce for Administrative and Technological Support (Geate)Edifício-Sede – 21º andarSBS Quadra 3 Zona Central70074-900 Brasília (DF)Head: José Augusto Varanda
Executive Offi ce for Corporate Risk and Benchmarks (Geris)Edifício-Sede – 5º andarSBS Quadra 3 Zona Central70074-900 Brasília (DF)Head: Isabela Ribeiro Damaso Maia
Investor Relations Group (Gerin)Edifício-Sede – 1º subsoloSBS Quadra 3 Zona Central70074-900 Brasília (DF)Head: Renato Jansson Rosek
Proagro Executive Offi ce (Gerop)Edifício-Sede – 19º andarSBS Quadra 3 Zona Central70074-900 Brasília (DF)Head: Deoclécio Pereira de Souza
Appendix 215
Regional Offi ces of the Banco Central do Brasil (December 31, 2011)
1st Region – Regional Offi ce in Belém (ADBEL) Regional Delegate: Antonio Cardoso da Silva Jurisdiction: Acre, Amapá, Amazonas, Pará, Rondônia and Roraima Boulevard Castilhos França, 708 – Centro Caixa Postal 651 66010-020 Belém (PA)
2nd Region – Regional Offi ce in Fortaleza (ADFOR) Regional Delegate: Luiz Edivam Carvalho Jurisdiction: Ceará, Maranhão and Piauí Av. Heráclito Graça, 273 – Centro Caixa Postal 891 60140-061 Fortaleza (CE)
3rd Region – Regional Offi ce in Recife (ADREC) Regional Delegate: Cleber Pinto dos Santos Jurisdiction: Alagoas, Paraíba, Pernambuco and Rio Grande do Norte Rua da Aurora, 1.259 – Santo Amaro Caixa Postal 1.445 50040-090 Recife (PE)
4th Region – Regional Offi ce in Salvador (ADSAL) Regional Delegate: Genival Silva Coutinho Jurisdiction: Bahia and Sergipe Av. Anita Garibaldi, 1.211 – Ondina Caixa Postal 44 40210-901 Salvador (BA)
5th Region – Regional Offi ce in Belo Horizonte (ADBHO) Regional Delegate: Luiz Cláudio Portela Ferreira Jurisdiction: Minas Gerais, Goiás and Tocantins Av. Álvares Cabral, 1.605 – Santo Agostinho Caixa Postal 887 30170-001 Belo Horizonte (MG)
6th Region – Regional Offi ce in Rio de Janeiro (ADRJA) Regional Delegate: Felipe Beer Frenkel Jurisdiction: Espírito Santo and Rio de Janeiro Av. Presidente Vargas, 730 – Centro Caixa Postal 495 20071-900 Rio de Janeiro (RJ)
7th Region – Regional Offi ce in São Paulo (ADSPA) Regional Delegate: David Falcão Jurisdiction: São Paulo Av. Paulista, 1.804 – Bela Vista Caixa Postal 894 01310-922 São Paulo (SP)
8th Region – Regional Offi ce in Curitiba (ADCUR) Regional Delegate: Roberto Siqueira Filho Jurisdiction: Paraná, Mato Grosso and Mato Grosso do Sul Av. Cândido de Abreu, 344 – Centro Cívico Caixa Postal 1.408 80530-914 Curitiba (PR)

216 Boletim do Banco Central do Brasil – Annual Report 2011
9th Region – Regional Offi ce in Porto Alegre (ADPAL) Regional Delegate: Danilo Trademar Acosta Jurisdiction: Rio Grande do Sul and Santa Catarina Rua 7 de Setembro, 586 – Centro Caixa Postal 919 90010-190 Porto Alegre (RS)

Appendix 217
Acronyms
Abras Brazilian Association of SupermarketsACC Advance on Exchange ContractsACSP São Paulo Trade AssociationAFRMM Extracharge on FreightAladi Latin American Integration AssociationAnfavea National Association of Automotive Vehicle ManufacturersANP National Petroleum AgencyANS National Supplementary Health Agencyb.p. Basis pointsBIS Bank for International SettlementsBIT Informatics and Telecommunications GoodsBNDES Brazilian Development BankBNDESpar BNDES Participações S.A.BoC Bank of CanadaBoE Bank of EnglandBoJ Bank of JapanCaged General File of Employed and Unemployed PersonsCamex Foreign Trade CouncilCBE Brazilian Capital Abroad SurveyCCI Consumer Confi dence IndexCCR Reciprocal Credit and Payment AgreementCDCA Agribusiness Credit Rights Certifi cateCDs Distribution CentersCemla Center for Latin American Monetary StudiesCFM Capital Flows ManagementCGFS Committee on the Global Financial SystemCide Contribution on Intervention in the Economic DomainCMC Common Market CouncilCMN National Monetary CouncilCMSR Consolidated Multilateral Surveillance ReportCofi ns Contribution to Social Security FinancingCompe Clearance of Checks and Other Documents Centralizing BureauCopom Monetary Policy CommitteeCPI Consumer Price IndexCPMF Provisional Contribution on Financial OperationsCPSS Committee on Payment and Settlement SystemsCRA Agribusiness Receivables Certifi cateCSI Current Situation IndexCSLL Social Contribution on Net Corporate Profi tsCSSP Civil Servant Social ContributionCVM Securities and Exchange CommissionDAX Deutscher AktienindexDDE Export Dispatch DeclarationDeint Department of International NegotiationsDepin Department of International Reserve Operations
218 Boletim do Banco Central do Brasil – Annual Report 2011
DI Import DeclarationDPRK Democratic People’s Republic of KoreaDR Rural InvoiceDRU Release of Federal Government Resources EntitlementsDSE Simplifi ed Export DeclarationECB European Central BankECC Economic Consultative CommitteeEGF Federal Government LoansEI Expectations IndexEmbi+ Emerging Markets Bond Index PlusEPE Energy Research CompanyEU European UnionFAT Worker Support FundFCL Flexible Credit LineFCVS Wage Variation Compensation FundFDI Foreign Direct InvestmentsFecomercio SP Trade Federation of the State of São PauloFed Federal ReserveFenabrave National Federation of Automotive Vehicle DistributionFFEX Export Financing FundFGE Export Guarantee FundFGV Getulio Vargas FoundationFiname Special Industrial Financing AgencyFinep Financing Company of Studies and ProjectsFipe Institute of Economic Research FoundationFMM Merchant Navy FundFNMC National Fund on Climate ChangeFSAP Financial Sector Assessment ProgramFSB Financial Stability BoardFTSE 100 Financial Times Securities Exchange IndexFuncafé Coffee Economy Defense FundFuncex Foreign Trade Studies Center FoundationFundeb Fund for Maintenance and Development of Basic Education and Enhancement
of Education ProfessionalsGC Mercosul Coordination Group on Consolidation of MERCOSUL Customs UnionGCF Gross Capital FormationGDP Gross Domestic ProductGecex Management Executive CommitteeGEM Global Economy MeetingGFCF Gross Fixed Capital FormationGFSR Global Financial Stability ReportGI-CEX Intelligence Group on Foreign TradeGLM Global Liquidity ManagementGMC Common Market GroupGSP Generalized System of PreferencesGTDC Trade Defense Technical GroupHICP Harmonized Index of Consumer PricesIBC-Br Central Bank Economic Activity Index – Brazil

Appendix 219
IBGE Brazilian Institute of Geography and StatisticsIbovespa Bovespa IndexIcaap Internal Capital Adequacy Assessment ProcessIC-Br Commodities Index – BrazilIcea Current Economic Conditions IndexICI Industrial Confi dence IndexICMS Tax on the Circulation of Merchandises and ServicesICS Services Confi dence IndexIEC Consumer Expectations IndexIGP-DI General Price Index - Domestic SupplyII Import TaxIIP International Investment PositionIMF International Monetary FundIMS International Monetary SystemINC National Confi dence IndexINCC National Cost of Construction IndexINPC National Consumer Price IndexINSS National Social Security InstituteIOF Financial Operations TaxIOSCO International Organization of Securities CommissionsIPA-DI Broad Producer Price Index – Domestic SupplyIPCA Extended National Consumer Price IndexIPI lndustrialized Products TaxIPI-EXP IPI ExportIPO Initial public offeringIR Income TaxLCA Agribusiness Credit NoteLEC Special Trade Credit LineLNG Liquifi ed Natural GasLoas Social Assistance LawLSPA Systematic Survey of Agricultural ProductionLTRO Long-Term Refi nancing OperationMapa Ministry of Agriculture, Livestock and Supplymbd Million barrels/dayMCP Monocalcium Phosphate Monohydrate Food GradeMCR Rural Credit ManualMCT Ministry of Science and TechnologyMDIC Ministry of Development, Industry and Foreign TradeMEI Small Individual EntrepreneurMercosur Southern Common MarketMF Ministry of FinanceMME Ministry of Mines and EnergyModeragro Program for Modernization of Agriculture and Conservation of Natural
ResourcesMTE Ministry of Labor and EmploymentNAB New Arrangements to BorrowNafta North American Free Trade AgreementNCM Common Mercosul Nomenclature

220 Boletim do Banco Central do Brasil – Annual Report 2011
NTN-I National Treasury Note – Series INuci Installed Capacity Utilization LevelOECD Organisation for Economic Co-operation and Developmentp.p. Percentage pointsp.y. Per yearPAC Annual Trade SurveyPACS Amount related to the risk of of operations subject to change in stock pricePAF Annual Financing PlanPAF Fiscal Adjustment Programs of StatesPasep Civil Service Asset Formation ProgramPBC People’s Bank of ChinaPBM Greater Brazil PlanPCAM Amount referring to risk exposure in gold, foreign currency and operations
subject to foreign exchange variationPCL Precautionary Credit LinePCOM Amount related to the risk of of operations subject to change in the price of
goodsPDP Productive Development PolicyPEA Overall Labor ForcePEC Constitutional Amendment ProposalPEPR Amount of the Required Base Capital referring to exposures by weighted
risk factorPetrobras Brazilian Petroleum CompanyPGPAF Price Guaranty Program for Family AgriculturePIM-PF Monthly Industrial Survey – Physical ProductionPIS Social Integration ProgramPJUR Installment referring to the risk of operations subject to interest rate
variationPLL Precautionary and Liquidity LinePMC Monthly Retail Trade SurveyPMCMV My House, My Life ProgramPME Monthly Employment SurveyPMI Purchasing Managers IndexPPI Broad Producer Price IndexPR Base CapitalPRE Required Base CapitalPR-I Reference Worth Level IProagro Farm Activity Guarantee ProgramProcap-Agro Capitalization Program of Farm CooperativesProdecoop Program of Cooperative Development for Aggregating Value to Crop/
Livestock ProductionProdusa Program of Incentive to Sustainable Farm ProductionProex Export Financing ProgramPrograma ABC Program for Reduction of Emission of Greenhouse Gases in AgriculturePronaf National Program for Strengthening Family AgriculturePronamp National Program for Support of the Medium Rural ProducerPropfl ora Program of Commercial Planting of Forests
Appendix 221
Provias Highway Intervention ProgramPSI Policy Support |nstrumentPSND Public Sector Net DebtPtax System of Exchange Rate Control and InformationRC Credit RegistrationRE Export RegistrationReintegra Special System of Tax Return for Exporting CompaniesRenuclear Special Incentive System for the Development of Nuclear Power PlantsRET Special Taxation SchemeRetaero Special Regime for Brazilian Aeronautical IndustryRFB Federal Revenue Secretariat of BrazilRGPS General Social Security SystemRMCCI International Exchange and Capital Market RegulationsRMSP São Paulo Metropolitan RegionRMV Lifetime Monthly IncomeROSC Reports on the Observance of Standards and CodesRSFN National Financial System NetworkSCR Central Credit Risk SystemSDR Special Drawing RightsSebrae Brazilian Micro and Small Business Support ServiceSecex Foreign Trade SecretariatSelic Special System for Clearance and CustodySenac National Merchant Trade Training ServiceSenai National Industrial Training ServiceSenar National Service of Rural TrainingSensex Bombay Stock Exchange Sensitive IndexSesc Merchant Trade Social ServiceSesi Industry Social ServiceSest Transport Social ServiceSFN National Financial SystemSimples Nacional Special Unifi ed Tax and Contribution Collection System to be utilized by
micro and small businessesSisbacen Central Bank Information SystemSiscomex Integrated Foreign Trade SystemSNB Swiss National BankSRF Federal Revenue SecretariatTBF Basic Financing RateTEC Common External TariffTED Available Electronic TransferTEV Total Effective ValueTIPI Industrialized Products Tax TableTJLP Long-Term Interest RateTN National TreasuryTR Reference RateUNCTAD United Nations Conference on Trade and DevelopmentUNSC United Nations Security CouncilUSA United States of AmericaVAT Value Added Tax

222 Boletim do Banco Central do Brasil – Annual Report 2011
VIX Chicago Board Options Exchange Volatility IndexWEO World Economic OutlookWTI West Texas IntermediateWTO World Trade OrganizationXU100 Istanbul Stock Exchange National 100 Index