basic principles. geographical information systems…gi science (nb rebrand taking hold: spatial...
TRANSCRIPT

GISBasic Principles
What is GIS?
Geographical Information Systems…GI Science (NB rebrand taking hold: Spatial Data Science)
Conceptualising reality in a computer model
Not just maps or manipulation
Why is GI important? Everything happens somewhere Ability to attach multitude of information Relationship between phenomena
spatial co-incidence relate/transfer info (attributes) between layers where co-incide

Functionality
Data acquisition/integration
Data management/database management ‘electronic filing cabinet’
Data analysis Decision making
Visualisation/cartography

Data Types I: Vector
Discrete entities with specific location Multiple attributes for each feature
Point Polyline Polygon
Longley et al., 2005: 77.
Data Types II: Raster
Continuous surface with changing values Elevation and derivatives Satellite imagery Photographs Scanned maps
Attributes Each cell has single value This can relate to Value Attributes
Examples: Vector
Mapping schools, hospitals, retail outlets, etc.
Points
Multiple attributes can be recorded Type of facility Number of users, staff, etc. Turnover, vol. of sales, success rates, infection rate, etc. Date built, condition of buildings Record number
And of course implicitly – spatial reference/location Permits spatial analysis, incl. of all the attributes above Point-pattern analysis
Examples: Raster
Display density of alcohol outlets in Scotland
Grid (of usually square cells)
Each grid cell can show value relating to density of outlets per unit square
Aggregate (zonal) measures of one variable per grid

GIS – Data Capture
In the field – data capture and recording; primary data Vector Fieldwalking
Point locations Incidents Street Furniture
Line Surveys Transects Elevation Profiles
Polygons Land Parcel Capture Exclusion Zones Conservation Areas
Contour surveys Full Plans
In the lab – (automated) digitising, geo’l text analysis
www.english-heritage.org.uk
GIS – Data Sources Maps
Modern Can be vector or raster OS (OpenData, MasterMap) Enviro, e.g. CEH, BGS
Historical Old OS BGS? Other Historic Maps/Plans
Topography
Geophysical imagery
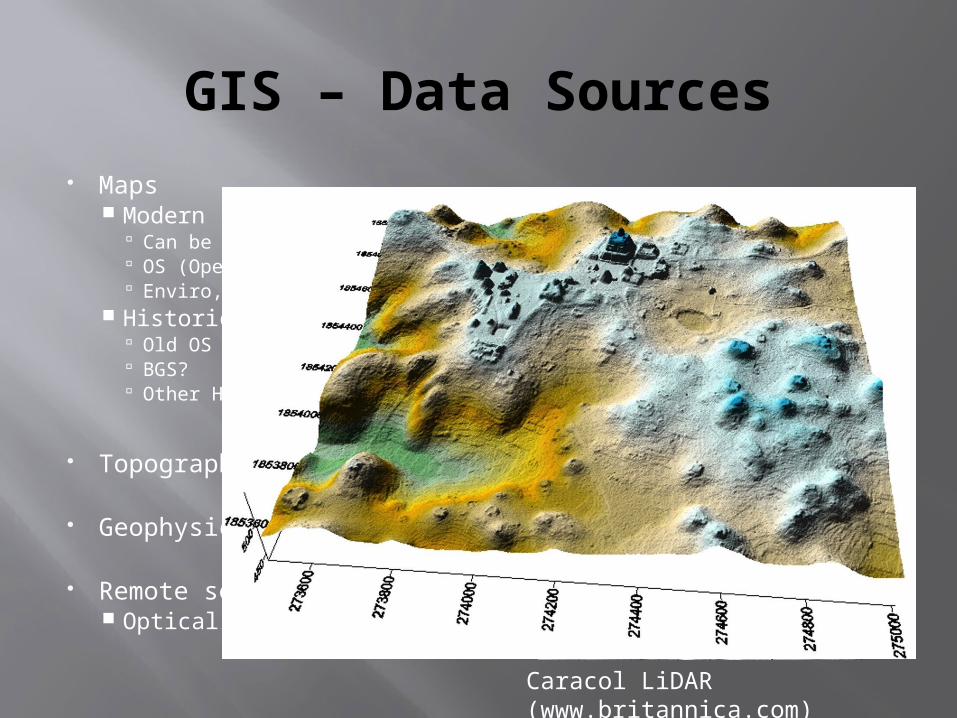
Remote sensing Optical/RADAR/LiDAR
Caracol LiDAR (www.britannica.com)
Databasing
Asset, Data, Facilities, Resource management Land and Property Gazetteers (National/Local) Large Environmental/Scientific Datasets
e.g. Climate, Flood risk, Land Capability, Forestry
More flexible storage and querying Topology preserved Sophisticated querying/spatial testing Handling of large data volumes (Big Data?) Attaching detailed attribute data to spatial objects Analysis of sites/processes within broader context
Databases – Public Access
Public dissemination Search databases online
Examples Data.gov.uk – goldmine! Met Office Rainfall, DTI/BERR Windspeeds, BGS Geology Data ONS OS – GPS network, OpenData, OpenSpace API
Or restricted to Academia e.g. UK (Census) Data Service EDINA Digimap (OS, CEH), MIMAS Landmap CEH/NERC datasets
Lack of standardisation. Not all may qualify as DBMS.
Data Extraction – APIs/ Screenscraping
Many services publicly accessible but limited In number of points that can be retrieved/processed In number of tasks which can be achieved, thus…
APIs/Screenscraping: Automation of data retrieval across web Using a mashup (our custom web page code) we can 'run' a target
web service with different inputs and extract desired information from the returned web page
E.g. Twitter, Foursquare, Facebook…. "Big Data" See: TwitterMap, TweetMap, etc. But also gov, enviro, health – see OpenCensus proj in R
Smart Cities/City Science/Sensor Networks VGI/Crowd-Sourcing

The one million tweet map

Trendsmap – mapping the #hashtags
Visualising Movement/Flow
Interesting Maps on the Web
These just appeared as I was preparing today’s materials:
http://matadornetwork.com/life/57-worlds-interesting-maps/
And, we can have interactivity
http://earth.nullschool.net/
Or, even a 'full' GIS in a browser…
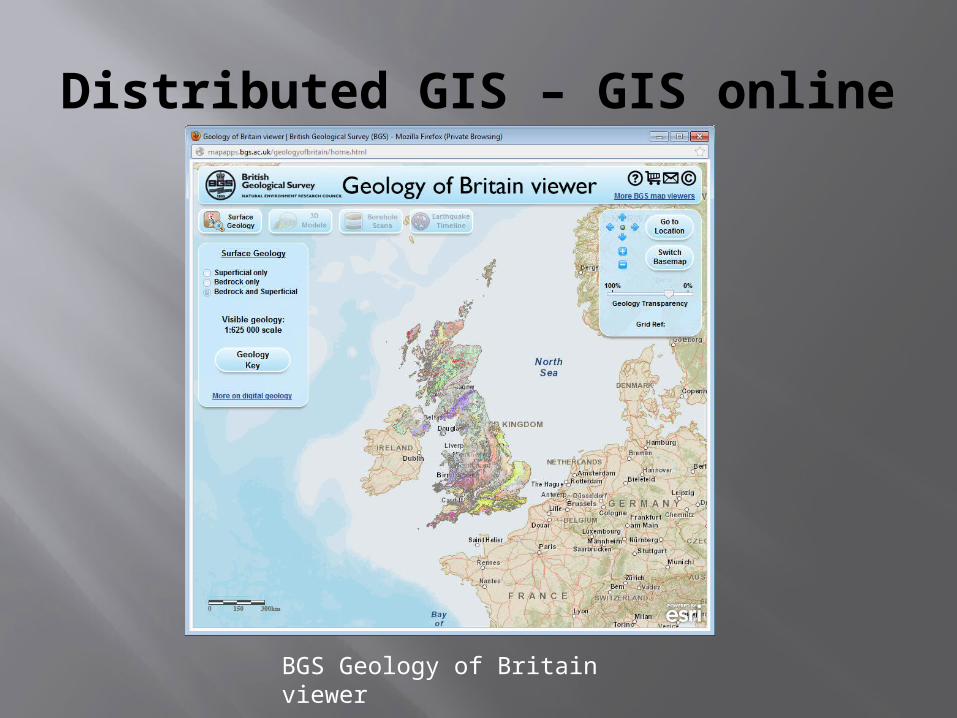
Distributed GIS – GIS online
BGS Geology of Britain viewer
GIS in your Browser
Google Maps (and Google Earth) Basic Functionality Online Full Power via JavaScript powered web pages Over-reliance on commercial megabusiness?
OpenLayers Free and Open alternative (NB Open <> Free)
Other web map tools: E.g. MapServer, GeoServer
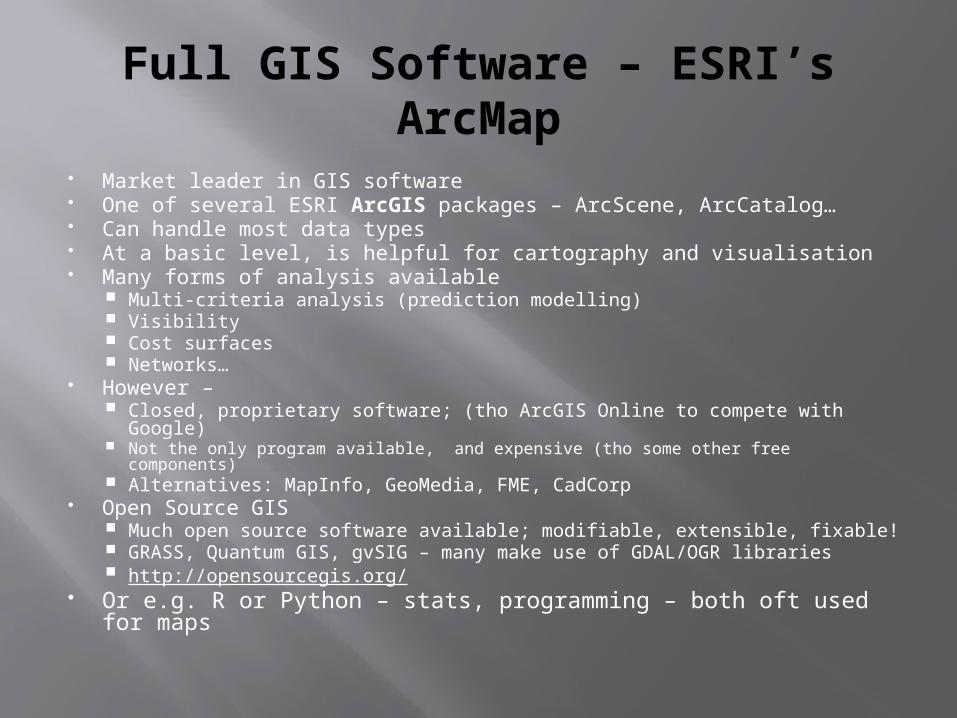
Full GIS Software – ESRI’s ArcMap
Market leader in GIS software One of several ESRI ArcGIS packages – ArcScene, ArcCatalog… Can handle most data types At a basic level, is helpful for cartography and visualisation Many forms of analysis available
Multi-criteria analysis (prediction modelling) Visibility Cost surfaces Networks…
However – Closed, proprietary software; (tho ArcGIS Online to compete with Google) Not the only program available, and expensive (tho some other free
components) Alternatives: MapInfo, GeoMedia, FME, CadCorp
Open Source GIS Much open source software available; modifiable, extensible, fixable! GRASS, Quantum GIS, gvSIG – many make use of GDAL/OGR libraries http://opensourcegis.org/
Or e.g. R or Python – stats, programming – both oft used for maps

http://www.shc.ed.ac.uk/projects/longwalls/Methodology/Visualisation.htm
Büyük Bedesten
Casal de Freiria
Rua and Altivo, 2011: 3302
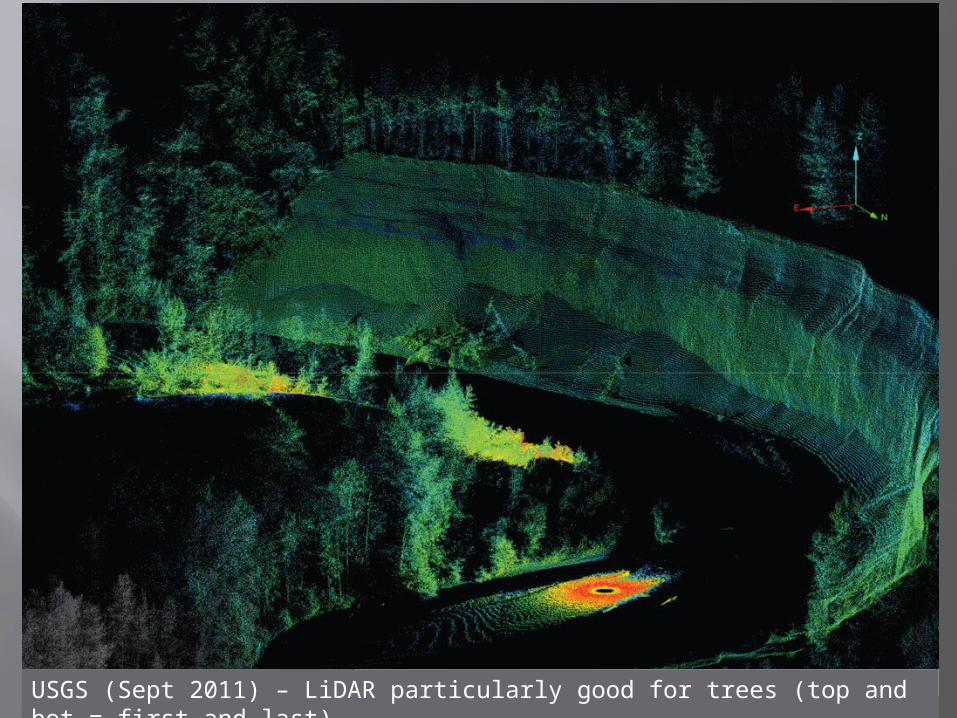
USGS (Sept 2011) – LiDAR particularly good for trees (top and bot = first and last)
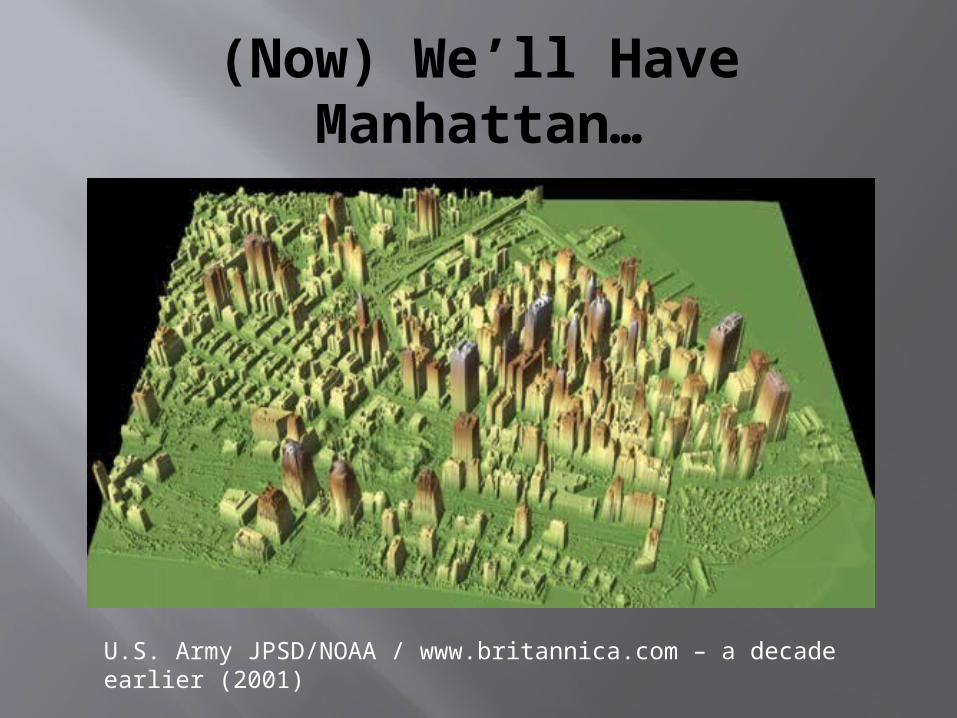
(Now) We’ll Have Manhattan…
U.S. Army JPSD/NOAA / www.britannica.com – a decade earlier (2001)
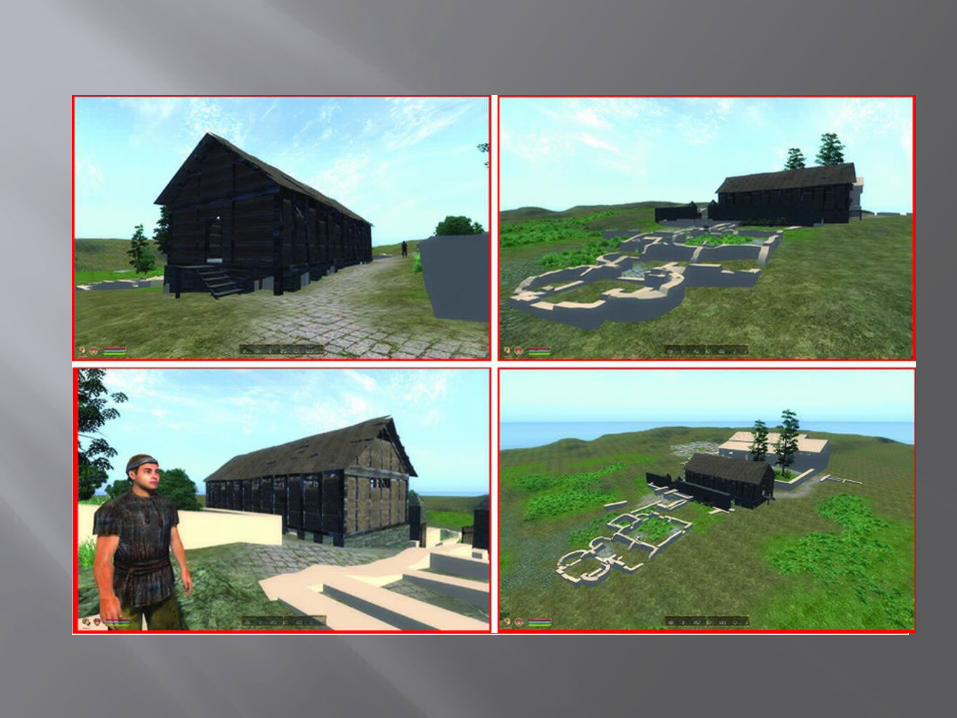
3D (2.5D) fly-through animations
Previous examples may require GIS data/model be fed to 3D modelling software for detailed work (or that model be constructed in dedicated CAD/3D software)
We can however very quickly create effective visualisations of 2.5D landscapes in e.g. ArcScene (and we can import 3D models from CAD/3D software)
We can also very quickly render animated visualisations of landscapes in GIS software
One example! (NB may not be made with Arc!): http://
www.satimagingcorp.com/gallery/quicktime-north-korea.html
Think!
We must be cautious when using computers Demonstrate how models are developed, and
provide information indicating our depth/lack of knowledge
Full publication (data, methods, limitations) ‘Knowledge representation’-what we think we
know
Don’t be blinded by their ‘scientific aura’ Don’t use them for the sake of it: question them Technological determinism Don’t tacitly accept their results…
Questions to ask before starting GIS analysis
What am I trying to get the GIS to do? How does this relate to my aim?
What data are available and will more need to be created?
What about data quality? Completeness? What is the state of scientific/area
knowledge? Therefore, how appropriate are the data? What is the most appropriate scale at which
to work? And what scale/resolution are the data?

Limitations of GIS Data quality
Different bodies hold data; different standards Currency, Completeness
Representation of reality; and not 3D but 2.5D Technological determinism
Packages can only perform certain operations Algorithms themselves can be restricting
Experiential/Subjective difficult to analyse… GIS/RS works fast over large areas, but final decisions
made at local scale/scale of day-day human experience
Big Data Volumes may allow behavioural analysis, modelling of supply and demand, etc. but temporal GIS still limited (as is true 3D, 4D, 5D, etc…)

Questions?
If not, then…

Practicals!