annual school report 2014 - woongarrah-p.schools.nsw.gov.au · welfare team meetings every 3 weeks....
TRANSCRIPT

[school code]
Woongarrah Public School Annual School Report 2014
4637

School context statement Woongarrah Public School is located on the Central Coast of NSW. The school opened in 2005 as one of the first nine schools constructed under the Public Private Partnership (PPP). The PPP Unit of Asset Management is responsible for managing a contract with a private consortium that finances, designs, constructs and provides facilities management for the school over a 30 year period. 2014 was the tenth year of this partnership.
The school enrolment has grown considerably in this time, from 150 students in 2005, to a peak of 540 in 2013 and 513 in 2014. New housing development continues in the suburb of Woongarrah. Most students live locally in middle income privately owned housing.
Personal excellence, high expectations and motivating students to achieve their best are significant aspects our school culture. The delivery of quality teaching and learning programs to equip students to be successful 21st century learners is our focus. A genuine commitment to continual improvement is a forte.
An experienced and committed staff work in partnership with a supportive school community, equally committed to providing a positive, inclusive and caring environment that engages and challenges students to reach their potential. We value remarkable levels of participation from parents and community in all aspects of school life. We enjoy a proud reputation for our strong commitment to student welfare and inclusive education. Our four school rules summarise what we expect and illustrate what we see in our students – Be Fair, Be Kind, Be Safe and Be Great.
Student leadership opportunities and school experiences foster responsible citizenship. We value the positive nature of our classrooms and playground, where learning and social cohesion is cherished. We enjoy a proud reputation for our strong commitment to student welfare and inclusive education.
NAPLAN data shows that the school consistently achieves results at or above state and national averages in all areas of literacy and numeracy. The percentage of students achieving National Minimum Standards is high at 95-100% in both Year 3 and Year 5. In line with our commitment to continual improvement, areas of need are identified annually and over time, with strategic
plans developed to address these needs for individuals, groups, and the school.
The current principal established the school. The staff are very stable, with only new staff arriving as a result of increasing enrolments.
Principal’s message It is with pleasure that I submit the Annual School Report for 2014. The purpose of this report is to provide parents and the community with information about Woongarrah Public School. You will find in this report information about the academic achievement of students, details about the school’s major achievements during 2014, an assessment of progress towards our targets and the priorities that have been established within the three year (2012-2014) planning cycle.
At Woongarrah Public School, students are our priority. Our Learning Support and Student Welfare teams coordinate high quality programs and procedures to meet the diverse needs of all students, from our gifted and talented students to our most vulnerable.
When you examine our NAPLAN results for 2014, you will see that Woongarrah Public School students continue to perform well in national assessments. On average, 99% of students in Year 3 and 94% of students in Year 5 who completed NAPLAN are performing at or above minimum standards in Literacy and Numeracy.
I certify that the information in this report is the result of a rigorous school self-evaluation process and is a balanced and genuine account of the school’s achievements and areas for development.
Leonie Clarkson
P & C message Thank you to the P&C executive for 2014 for their time and effort in leading this important group in the school:
Name Position Lauren McGuigan President Michelle Collins Vice President Kerry Brabender Vice President
Sarah Johnson Secretary Amy Crowther Treasurer
1
Student Leaders Student Parliament includes eight elected Year 6 ministers and two representatives from each class in Years 3-6.
The full parliament meets every 4 weeks. In between, the eight ministers attend weekly meetings to discuss matters and complete jobs arising from Parliament meetings.
Student Leaders for 2014:
Name Position
Amelia Ruskin Prime Minister Saskia Ormsby Deputy Prime Minister Ministers: Jorja Smith Emma Harrison Ethan Balestri Tianna Brabin Amanda Ghazawy Mackenzie Hupton
The SRC for 2014:
Jackson Hayward Ebony Waterworth Matthew Greenwood Charlotte Barwick Emma Bates Will Eagleton Nicholas Roussety Keira Collins Jade Nock Jordyn Hutchison Zac Kubica Brianna Caton Liam Riley-Griffiths Erinn McWilliams Brayden Johnson Leny Peterson Tahlia Doalman Kaidyn Dovey Camryn Millar Jacob Bell
Student information It is a requirement that the reporting of information for all students be consistent with privacy and personal information policies.
Student enrolment profile
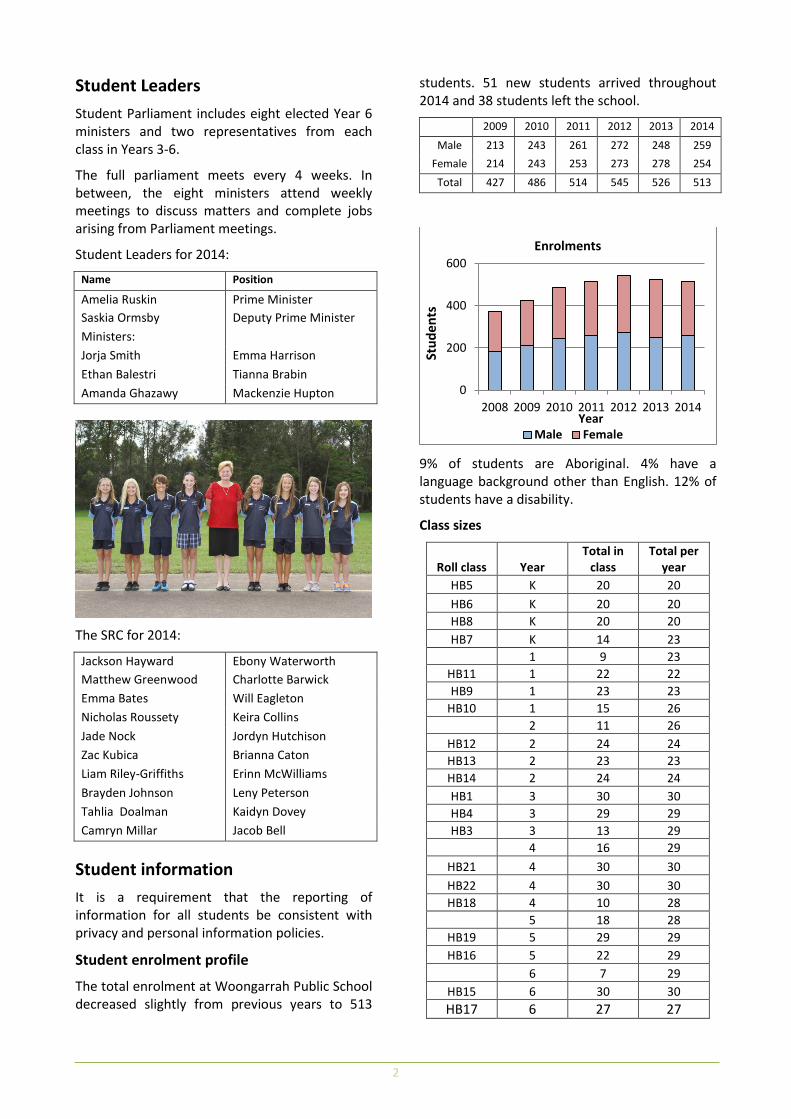
The total enrolment at Woongarrah Public School decreased slightly from previous years to 513
students. 51 new students arrived throughout 2014 and 38 students left the school.
2009 2010 2011 2012 2013 2014
Male 213 243 261 272 248 259 Female 214 243 253 273 278 254
Total 427 486 514 545 526 513
9% of students are Aboriginal. 4% have a language background other than English. 12% of students have a disability.
Class sizes
Roll class Year Total in
class Total per
year HB5 K 20 20 HB6 K 20 20 HB8 K 20 20 HB7 K 14 23
1 9 23 HB11 1 22 22 HB9 1 23 23
HB10 1 15 26 2 11 26
HB12 2 24 24 HB13 2 23 23 HB14 2 24 24 HB1 3 30 30 HB4 3 29 29 HB3 3 13 29
4 16 29 HB21 4 30 30 HB22 4 30 30 HB18 4 10 28
5 18 28 HB19 5 29 29 HB16 5 22 29
6 7 29 HB15 6 30 30 HB17 6 27 27
0
200
400
600
2008 2009 2010 2011 2012 2013 2014
Stud
ents
Year
Enrolments
Male Female
2

Student attendance profile
Our attendance rate of 95.5% is better than the state attendance rate. This is consistent with previous years.
Management of non-attendance
We regularly monitor attendance via Student Welfare Team meetings every 3 weeks. Teachers follow up on concerns through regular communication, including phone calls and notes home.
Workforce information It is a requirement that the reporting of information for all staff must be consistent with privacy and personal information policies.
Workforce composition
Position Number Principal 1 Deputy Principal(s) 1 Assistant Principal(s) 4 Head Teachers 0 Classroom Teacher(s) 16.64 Teacher of Reading Recovery 0.815 Learning and Support Teacher(s) 0.9 Teacher Librarian 1 Teacher of ESL 0 School Counsellor 1 School Administrative & Support Staff 3.962 Total 31.297
The Australian Education Regulation, 2014 requires schools to report on Aboriginal composition of their workforce. Two staff members are Aboriginal.
In 2015, Mrs Mefflin was appointed as Learning and Support Teacher via merit selection.
Mrs Le Loux was appointed as a class teacher.
Teacher qualifications
All teaching staff meet the professional requirements for teaching in NSW public schools.
Qualifications % of staff Degree or Diploma 82% Postgraduate 18%
Professional learning and teacher accreditation
Professional learning priorities in 2014 included preparation for the new Australian curriculum in English, Mathematics, Science and Technology, History and Geography. All teachers participated in numerous online sessions related to new syllabus. Teachers also spent time collaborating and working together to develop units of work based on the new syllabus documents. Five school development days were completed, with a focus on syllabus implementation and reporting to parents.
In addition, all staff completed mandatory training on the Disability Standards for Education, Child Protection, Code of Conduct, Asthma, CPR and Emergency Care.
Staff also attended professional learning activities on topics related to school targets and personal professional learning goals.
Every teacher has an individual performance management plan as part of our commitment to ongoing professional learning.
The school plays a key role in supporting the accreditation of New Scheme Teachers. In 2014, the school employed 8 New Scheme Teachers. Three teachers are working towards and five are maintaining accreditation at Professional competence. One teacher is working towards accreditation at Professional Leadership level. An Accreditation Counts network has been established at both school and local level.
Mrs Buhr, Mrs Dezius, Mrs Kelly and Mrs Guest completed the L3 program.
Mrs Sadler and Mrs Downey qualified as Reading Recovery teachers.
We received $21 812 for Teacher Professional Learning (TPL) in 2014. Funds were used to support TPL priorities related to career development, syllabus implementation, literacy and numeracy and welfare and equity.
Year 2009 2010 2011 2012 2013 2014K 95.3 96.4 95.6 94.9 96.4 96.41 94.7 95.7 95.5 95.1 94.7 95.02 95.0 95.3 95.9 94.9 96.1 95.93 94.5 95.3 95.5 94.9 95.6 95.64 95.4 94.2 94.7 94.9 94.7 95.65 91.5 95.0 93.9 93.9 95.3 94.76 93.5 93.6 93.6 92.5 95.1 94.8
Total 94.4 95.2 95.1 94.5 95.4 95.5K 94.3 94.7 94.7 94.3 95.0 95.21 93.7 94.2 94.2 93.9 94.5 94.72 94 94.4 94.2 94.2 94.7 94.93 94.1 94.5 94.4 94.4 94.8 95.04 94 94.5 94.3 94.3 94.7 94.95 94 94.4 94.2 94.2 94.5 94.86 93.6 94.0 93.8 93.8 94.1 94.2
Total 92.1 94.4 94.3 94.2 94.7 94.8
Stat
e DE
CSc
hool
3
The school also provides strong support for university training programs, providing opportunities for six university students to complete practical experiences at our school in 2014.
Beginning Teachers
There was one new permanent beginning teacher at the school in 2014. Funding that was provided as part of the Great Teaching, Inspired Learning was used to support this teacher with additional release time each week to participate in a school-based mentoring and induction program. The teacher was able to participate in professional learning programs to support her role in the school and was able to complete the maintenance phase of Accreditation at Proficient teaching standard.
Financial summary This summary covers funds for operating costs and does not involve expenditure areas such as permanent salaries, building and major maintenance.
Date of financial summary 30/11/2014
Income $ Balance brought forward 252737 Global funds 248564 Tied funds 232511 School & community sources 123240 Interest 10185 Trust receipts 45691 Canteen 47459 Total income 960390 Expenditure Teaching & learning
Key learning areas 26874 Excursions 48520 Extracurricular dissections 41505
Library 10118 Training & development 1347 Tied funds 168625 Casual relief teachers 109282 Administration & office 39824 School-operated canteen 41854 Utilities 34534 Maintenance 299 Trust accounts 58027 Capital programs 0.00 Total expenditure 580813 Balance carried forward 379577
The balance carried forward includes $125 000 in tied and trust accounts and $25 000 unpaid
salaries and goods from 2014. A further $125 000 is committed to salaries for curriculum initiatives that are continuing in 2015.
A full copy of the school’s 2014 financial statement is tabled at the annual general meetings of the School Council and/or the parent body. Further details concerning the statement can be obtained by contacting the school.
School performance 2014
Academic achievements NAPLAN
In the National Assessment Program, the results across the Years 3, 5, 7 and 9 literacy and numeracy assessments are reported on a scale from Band 1 to Band 10.
The achievement scale represents increasing levels of skills and understandings demonstrated in these assessments.
Year 3: from Band 1 (lowest) to Band 6 (highest for Year 3)
Year 5: from Band 3 (lowest) to Band 8 (highest for Year 5)
The My School website provides detailed information and data for national literacy and numeracy testing (NAPLAN).
Click on the link http://www.myschool.edu.au and enter the school name in the Find a school and select GO to access the school data.
Other school based assessments
Speech and Language Program
Our speech program continues to provide excellent results and support for students entering Kindergarten.
The Boehm Test of Basic Concepts is used to assess student’s knowledge of basic concepts needed for early learning. Fifty concepts are tested in Term 1 and again in Term 4.
The average score in Term 1 was 36 out of 50. In Term 4, the average score had improved to 44. The percentage of students in the lowest performance band decreased from 44% to 7%, while the percentage of students in the highest band increased from 20% to 56%. This program will continue in 2015.
4
Highest band (Term 1) Highest band (Term 4) 2012 21% 58% 2013 42% 62%
2014 20% 56% Lowest band (Term 1) Lowest band (Term 4)
2012 51% 12%
2013 31% 6% 2014 44% 7%
A-E Data
School based assessment data indicates that 86% of students in Years 1-6 are achieving stage appropriate outcomes in English and Maths:
English Maths
% performing at expected level 85 85 % performing above expectations
18 21
% performing below expectations
15 15
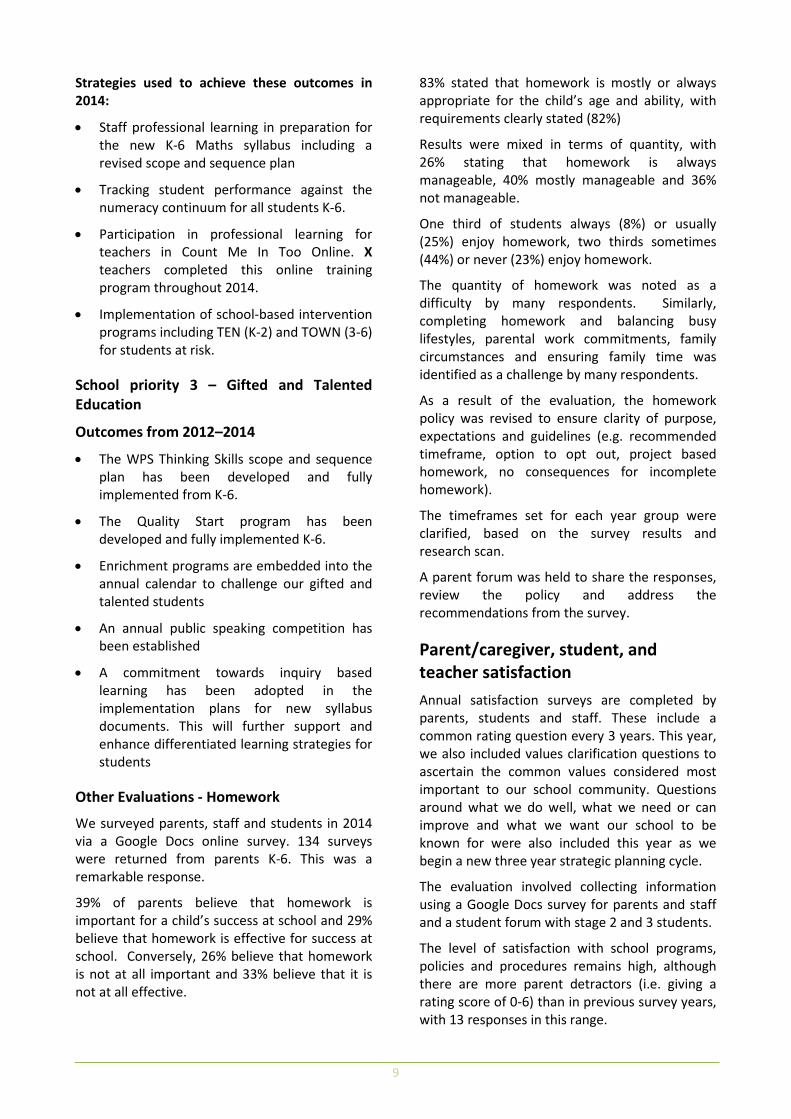
Other achievements Sporting Achievements
We had outstanding results as a school at zone level in 2014, as the Wallarah Zone Champion School in Cross Country for the third year in a row and Wallarah Zone Champion School in Athletics for the first time.
Two students represented at state level – Cooper Mortimer in Hockey and Kyra Manukia in Athletics.
Years 3-6 students participated in the friendly LMG interschool sport competition in AFL, soccer, touch and T-ball. Teams were selected to compete in PSSA competitions in soccer, cricket, netball, rugby league, AFL and touch.
All classes participated in the Premier’s Sporting Challenge. Funds received from the PSC were used to provide a Commonwealth Games Day at school for all students K-6. Students were organised into country groups to participate in a
series of activities and Commonwealth Games opening and closing ceremonies.
House Captains
Dolphins Haylee Freeberg, Rohnan Maher Platypus Georgia Bellamy, Trae Avery Goanna Eden Waddell, Toby Sibthorpe
Kangaroo Aidan Brooks, Ethan Writer
Other School award winners for 2014 include:
Dux of School Amelia Ruskin
Citizenship Award Jorja Smith Citizenship Award Emma Harrison 100% NAPLAN spelling Mackenzie Klein
Sporting Blue Kai McIntosh Walsh Premier’s Sporting Medal Rohnan Maher
Wyong Shire Gardening Competition
For the second year in a row, our school received first place in the Wyong Shire Gardening competition Schools and Colleges section and 3rd place in the culinary garden section. Our grounds are beautifully maintained and cared for by the whole school community.
Spelling Bee
Students in Stage 2 and 3 classes competed in the Premier’s Spelling Bee. The competition winners who represented our school at the Regional finals were:
Stage 2 Stage 3
Jerome Abrahams Amelia Ruskin
Sethum De Silva Mackenzie Hupton
Public Speaking Competition
The Public Speaking competition was held in semester 2. The competition winners were:
Stage 2 Stage 3 Matthew Greenwood Mackenzie Hupton
Meghan Hocking Sophie Farmer
Brayden Johnson Amelia Ruskin
Performing Arts
In June, selected Year 5 and 6 students participated in the Central Coast Dance Festival at Laycock Street Theatre, under the direction of Mrs Downey.
Four students were selected as dancers in the Central Coast dance ensemble – Mackenzie
5

Hupton, Emma Harrison, Saskia Ormsby and Madelyn Miller.
All students from K-6 participated in the ‘Music Count Us In’ program. This was the 7th year (2014) that Woongarrah students have joined in with others all over Australia.
The Christmas Choir was formed once again by Mrs Kelly and Mrs Sadler. Kinder to Year 6 students sang at a local church and retirement village and the school Carols Night.
Premier’s Reading Challenge
248 students participated in the Premier’s Reading Challenge. Of those, 225 successfully completed the challenge. Twenty-six students were awarded gold certificates and three students were awarded platinum certificates.
Library
All classes K-6 receive a weekly library lesson.
2264 new resources were added to the library in 2014. 18 786 resources were borrowed from the library by teachers and students.
Significant programs and initiatives – Policy and equity funding Aboriginal education
100% of Personalised Learning Plans for our 45 Aboriginal students were developed, implemented and reviewed in 2014. Students, teachers and parents participated in the evaluation process continuing to develop the relationship between home and school. Students identified academic, cultural and social goals.
NAIDOC Celebrations were a huge success. The students from Wadalba Community School ran workshops in art, didge and dance. The students from Woongarrah rotated through activities. Each Aboriginal student received a NAIDOC pack and the remaining packs were handed out as prizes to other students who participated. At the end of the day Wadalba Community School presented Woongarrah with a chair painted in Aboriginal design.
The Great Book Swap was again very successful. Students donated books from home and these books then were sold for a gold coin donation to support the Indigenous Literacy Foundation.
NAPLAN results for Aboriginal students are significantly above state average in all areas of
literacy and numeracy in Year 3 and Year 5, with the exception of Year 5 spelling.
Aboriginal Education was a focus area in the school’s curriculum initiative. A teacher was released for half a day each week in semester 2 using RAM Equity funding. We have looked at identifying Aboriginal content within the new syllabus documents, explored 8 Ways of Learning pedagogy, ensured Aboriginal content is embedded in units of work and located resources to support learning in the classroom.
The didge group continued in 2014, with students from Wadalba Community School teaching the boys group. These sessions are extremely popular with the boys at Woongarrah and they eagerly await each session. The group performed on stage for our NAIDOC week celebrations.
Six students received awards at the annual Ngara AECG awards ceremony for social academic and sporting achievements.
The attendance rate of the Aboriginal students was again high at 95.6% and on par with the wider student population.
Multicultural education and anti-racism
Multicultural education is delivered through the HSIE Key Learning Area where students learn about cultural diversity and the contribution to Australian society of people from many different backgrounds.
The Friendly Schools Program and Quality Start Program are implemented in all classes K-6 at the start of each year. These programs help to embed inclusive classroom and school practices, understandings and skills.
4% of students have a language background other than English. There are six students requiring English as a Second Language support.
We enjoy an inclusive school community and racism-free learning and working environment. Mr Demir is the Anti-Racism Contact Officer at our school. There were no complaints relating to anti-racism this year.
Personalising Learning and Support
Staff, students and parents highly value our visibly inclusive school culture and our ability to ensure that all students access and participate in the full range of curriculum and school activities.
6

We catered for over 65 students who required tailored educational programs or personalised adjustments to learning or school environment through developing and implementing Individual Education Plans in consultation with parents.
Learning and Support Funding provided by the Department was used to employ three part-time School Learning Support Officers, 1 day a week for the LST coordinator to coordinate programs and to provide time for teachers to meet with parents, plan and consult with other specialists working with students.
250 students (48%) from K-6 have individual files that are used to maintain records of interventions, programs, meetings, specialist reports and other information. The Learning and Support Team (LST) coordinates and prioritises programs and support across the school to best meet these needs. The LST also supports teachers with ongoing professional development and provides guidance and support regarding individual students. A full-time Learning and Support Teacher is employed to support teachers and students.
The school participated in the Nationally Consistent Collection of Data (NCCD) for the first time in 2014. There are 65 students with disabilities requiring adjustments enrolled, as follows: Physical disability 10 students, Cognitive disability 33 students, Social / emotional 22 students.
All staff participated in training on the Disability Standards for Education as part of our preparation for the NCCD.
Socio-economic background
The school received funding for students from low socio-economic background for the first time in 2014. Funds were used to support access to curriculum learning experiences, including a science day and whole school performance and to support a school-based curriculum initiative around the implementation of NSW syllabuses. Work in this area will continue in 2015. Student Assistance was also available to support students to participate in learning experiences.
Other initiatives
A curriculum implementation initiative was introduced in semester 2 this year utilising resources from our RAM equity funding and Literacy and Numeracy funding. Staff members
were selected via an Expression of Interest process to become curriculum leaders in English, Maths, Science and Technology and Aboriginal Education. Teachers were released from class to conduct a situational analysis of current needs, and develop and implement an action plan to address needs to build teacher capacity to implement new syllabus documents. Teachers conducted reviews of available resources, including professional learning courses, units of work and curriculum newsletters.
Outstanding collaboration between the curriculum leaders resulted in the development of a school scope and sequence plan incorporating History, Science and Technology and Geography syllabuses K-6. All staff then worked in teams to develop units of work in preparation for syllabus implementation in 2015.
School planning and evaluation 2012—2014
School evaluation processes NSW public schools conduct evaluations to support the effective implementation of the school plan. Planning and self-evaluation processes are evidence based and rely on the careful analysis of a broad range of data, including quantitative and qualitative data. The processes used include:
• Analysis of external data, such as AEDI, FOEI and NAPLAN results
• Analysis of school based data such as attendance, behavior records, suspension, mobility data, reading levels, work samples, student assessments, Reading Recovery, A-E tracking, literacy continuum K-6, numeracy continuum K-6, student reports and LST data
• Focus groups with students and staff;
• Staff, student, parent and community surveys and questionnaires
• Use of planning matrixes.
• Observation of work samples, programs, teacher records and documentation
• Document analysis
As a result of school self-evaluation processes an evidence base is developed using school evaluation and student performance data.
7

School planning 2012-2014:
School priority 1
To improve English outcomes for all students
Outcomes from 2012–2014
• We made progress towards our target to increase the percentage of Year 3 students in Band 4 or higher in Reading to 75% from an average of 67.7% in 2010-2012. On average, 70% of students achieved Band 4 or above in 2012-2014. 2013 was the best result, with 79.8% of students achieving Band 4 or above.
• Our target to increase the percentage of Year 5 students achieving Bands 7 or 8 in Reading to 25% from an average of 22% in 2010-2012 was met, with an average of 28.1% of students achieving this goal over 2012-2014. Results were best in 2013 (30.8%) and 2014 (31.3%).
• Our target of 75% of students achieving reading benchmarks of level 6 (Kindergarten), level 16 (Year 1) and level 26 (Year 2) were met (highlighted) in Kindergarten and Year 1, but not in Year 2,
2012 2013 2014
Kindy 81 95.5 97.2
Year 1 85 81 92.7
Year 2 70 85 69
• Our target of 97% of Year 3 and 5 students achieving at or above minimum standards in literacy was met (highlighted) in all areas in Year 3, but not in Year 5.
% of students achieving at or above minimum standard
Year 3 2012 2013 2014 Reading 97.4
100
98.5 Writing 100 100 100 Spelling 97.3 100 98.5
Grammar
97.3 100 100 Numeracy 98.6 100 100
% of students achieving at or above minimum standard
Year 5 2012 2013 2014 Reading 94.1 98.5 92.2 Writing 97.6 96.9 95.3 Spelling 97.6 95.4 93.8
Grammar
90.5 95.4 93.8 Numeracy 96.5 95.4 96.8
Strategies used to achieve these outcomes in 2014
• Continued training and implementation of the L3 program in all Kindergarten classes
• Professional learning for teachers to support the implementation of the new English K-6 syllabus
• Tracking student performance against the literacy continuum from K-6 for all students K-6
• Continued implementation of programs to support students, including Reading Recovery, Kindy Speech and MultiLit
School priority 2 - Mathematics
To deliver quality teaching and learning programs that develop sound mathematical skills and support all students to become competent mathematicians
Outcomes from 2012–2014
• Our target to increase the percentage of Year 5 students achieving Bands 7 or 8 in Numeracy to 25% (from an average of 20.5% in 2010-2012) was not achieved on average, with the average remaining at 20.5%. However, results in 2014 (27%) met the target.
• Our target for 97% of Year 3 and 5 students to achieve at or above minimum standards in numeracy was achieved in Year 3, but not in Year 5 (see table above in school priority 1).
8
Strategies used to achieve these outcomes in 2014:
• Staff professional learning in preparation for the new K-6 Maths syllabus including a revised scope and sequence plan
• Tracking student performance against the numeracy continuum for all students K-6.
• Participation in professional learning for teachers in Count Me In Too Online. X teachers completed this online training program throughout 2014.
• Implementation of school-based intervention programs including TEN (K-2) and TOWN (3-6) for students at risk.
School priority 3 – Gifted and Talented Education
Outcomes from 2012–2014
• The WPS Thinking Skills scope and sequence plan has been developed and fully implemented from K-6.
• The Quality Start program has been developed and fully implemented K-6.
• Enrichment programs are embedded into the annual calendar to challenge our gifted and talented students
• An annual public speaking competition has been established
• A commitment towards inquiry based learning has been adopted in the implementation plans for new syllabus documents. This will further support and enhance differentiated learning strategies for students
Other Evaluations - Homework
We surveyed parents, staff and students in 2014 via a Google Docs online survey. 134 surveys were returned from parents K-6. This was a remarkable response.
39% of parents believe that homework is important for a child’s success at school and 29% believe that homework is effective for success at school. Conversely, 26% believe that homework is not at all important and 33% believe that it is not at all effective.
83% stated that homework is mostly or always appropriate for the child’s age and ability, with requirements clearly stated (82%)
Results were mixed in terms of quantity, with 26% stating that homework is always manageable, 40% mostly manageable and 36% not manageable.
One third of students always (8%) or usually (25%) enjoy homework, two thirds sometimes (44%) or never (23%) enjoy homework.
The quantity of homework was noted as a difficulty by many respondents. Similarly, completing homework and balancing busy lifestyles, parental work commitments, family circumstances and ensuring family time was identified as a challenge by many respondents.
As a result of the evaluation, the homework policy was revised to ensure clarity of purpose, expectations and guidelines (e.g. recommended timeframe, option to opt out, project based homework, no consequences for incomplete homework).
The timeframes set for each year group were clarified, based on the survey results and research scan.
A parent forum was held to share the responses, review the policy and address the recommendations from the survey.
Parent/caregiver, student, and teacher satisfaction Annual satisfaction surveys are completed by parents, students and staff. These include a common rating question every 3 years. This year, we also included values clarification questions to ascertain the common values considered most important to our school community. Questions around what we do well, what we need or can improve and what we want our school to be known for were also included this year as we begin a new three year strategic planning cycle.
The evaluation involved collecting information using a Google Docs survey for parents and staff and a student forum with stage 2 and 3 students.
The level of satisfaction with school programs, policies and procedures remains high, although there are more parent detractors (i.e. giving a rating score of 0-6) than in previous survey years, with 13 responses in this range.
9
2009 2011 2014 Satisfaction (8-10) Staff 90% 100% 90%
Satisfaction (8-10) Parents 89.5% 95% 70%
Total promoters (9-10) 77% 78% 76%
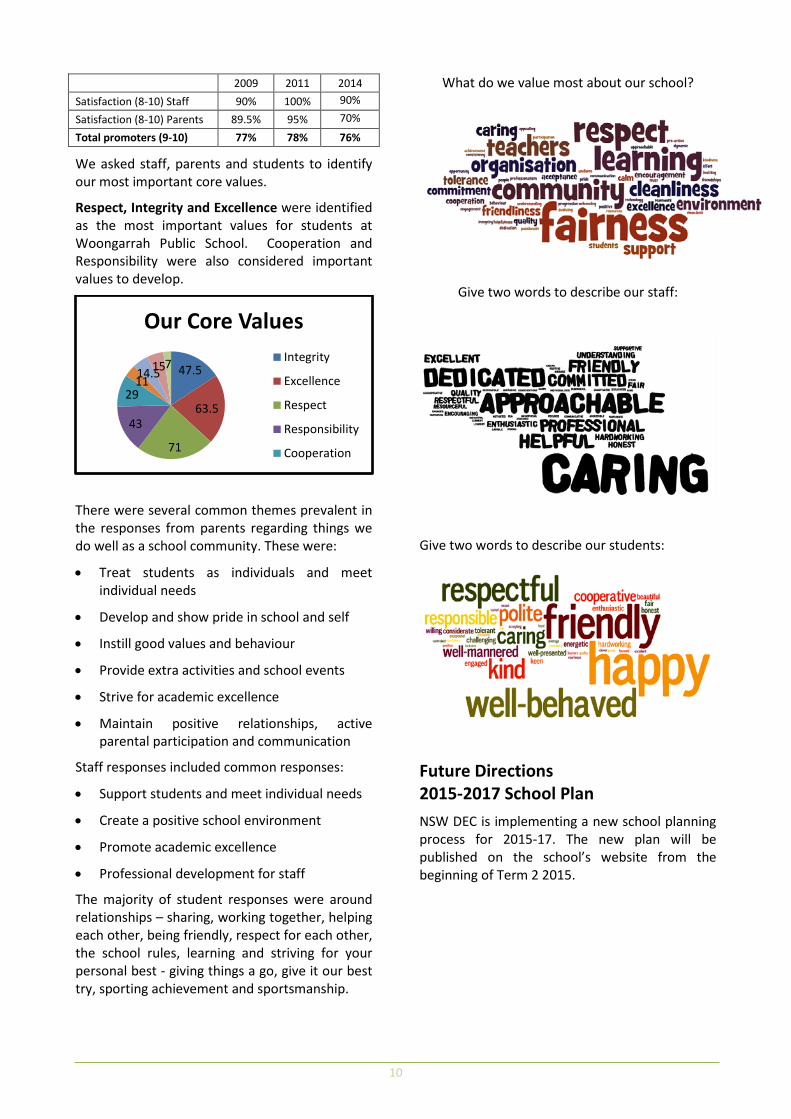
We asked staff, parents and students to identify our most important core values.
Respect, Integrity and Excellence were identified as the most important values for students at Woongarrah Public School. Cooperation and Responsibility were also considered important values to develop.
There were several common themes prevalent in the responses from parents regarding things we do well as a school community. These were:
• Treat students as individuals and meet individual needs
• Develop and show pride in school and self
• Instill good values and behaviour
• Provide extra activities and school events
• Strive for academic excellence
• Maintain positive relationships, active parental participation and communication
Staff responses included common responses:
• Support students and meet individual needs
• Create a positive school environment
• Promote academic excellence
• Professional development for staff
The majority of student responses were around relationships – sharing, working together, helping each other, being friendly, respect for each other, the school rules, learning and striving for your personal best - giving things a go, give it our best try, sporting achievement and sportsmanship.
What do we value most about our school?
Give two words to describe our staff:
Give two words to describe our students:
Future Directions 2015-2017 School Plan NSW DEC is implementing a new school planning process for 2015-17. The new plan will be published on the school’s website from the beginning of Term 2 2015.
47.5
63.5
71
43
29 11 14.5 15 7
Our Core Values Integrity
Excellence
Respect
Responsibility
Cooperation
10
About this report In preparing this report, the self-evaluation committee has gathered information from evaluations conducted during the year and analysed other information about the school's practices and student learning outcomes. The self-evaluation committee and school planning committee have determined targets for the school's future development.
Leonie Clarkson Principal
Mark Jennings Deputy Principal
Sharon Buhr Assistant Principal
Lorne Smith Assistant Principal
Lyn Wigney Assistant Principal
Debbie Kerr-Thomson Assistant Principal
School contact information
Woongarrah Public School
63-73 Mataram Road
Woongarrah NSW 2259
Ph: 4392 7493
Fax: 4392 7807
Email: [email protected]
Web: www.woongarrah-p.schools.nsw.edu.au
School Code: 4637
Parents can find more information about Annual School Reports, how to interpret information in report and have the opportunity to provide feedback about the report at:
http://www.schools.nsw.edu.au/learning/emsad/asr/index.php
11