2017-2018 budget summary citizen's budget · accounting entity with a self-balancing set of...
TRANSCRIPT
Prepared by: Mark Deebach, Assistant Superintendent for Business & Support Services
Holly Graham, Director of Accounting
Tammy Longstaff, Administrative Assistant
8/29/2017
Ferndale School District #502Business and Support Services
2017/18 Budget SummaryCitizens' Budget
General Fund
Table of Contents
Page
Introduction to Funds -----------------------------------------------------------------------------------------------------------------------------1
General Fund Budget Overview ------------------------------------------------------------------------------------------------------------- 3
Enrollment --------------------------------------------------------------------------------------------------------------------------------------------4
General Fund Revenue - Where does the money come from?----------------------------------------------------------------- 5
Revenues defined by state budget codes ------------------------------------------------------------------------------------------------ 6
General Fund Expenditures - How is the money spent? -------------------------------------------------------------------------- 8
Expenditures defined by state program budget codes ----------------------------------------------------------------------------- 9
Expenditures by major budget activity codes ------------------------------------------------------------------------------------------ 10
Expenditures by major budget object codes ------------------------------------------------------------------------------------------- 11
Staffing Summary ----------------------------------------------------------------------------------------------------------------------------------12
Revenue / Expenditure Summary ------------------------------------------------------------------------------------------------------------13

Introduction to Funds
The responsibility for the financial management of Ferndale School District rests with the school board, the superintendent and the staff
retained to manage the operations of the school district. However, the district’s financial management is regulated by state law and supervised
by the Washington State Superintendent of Public Instruction (OSPI). Ferndale School District must follow uniform guidelines for budgeting,
accounting and financial reporting practices. These guidelines ensure consistent and comparable data for each of the state’s school districts.
Additionally, the Washington State Auditor audits the school district financial records for compliance with laws and regulations, general
accounting practices, and adequate internal controls.
Each school district in the state is required to develop and adopt its own budget prior to the beginning of each school year. The budget process
is governed by state law, state regulations and instructions provided by the Superintendent of Public Instruction with budgets prepared on forms
strictly prescribed for this purpose.
Governmental accounting systems in the state of Washington are organized and operated on a fund basis. A fund is defined as a fiscal and
accounting entity with a self-balancing set of accounts recording cash and other financial resources, together with all related liabilities.
Because all governmental units receive financial resources that may be used only in accordance with restrictions established by law,
accounting systems must demonstrate compliance with such restrictions. This need has resulted in the development of the fund accounting
concept as a means of control.
The budget for Ferndale School District consists of five separate funds:
General Fund – The general fund is financed from local, county, state and federal sources. These revenues are generally used for financing
the current ordinary normal and recurring operations of the school district such as programs of instruction for students (including salaries and
benefits), food services, maintenance, data processing, printing and pupil transportation.
Associated Student Body Fund – The associated student body fund (ASB) is financed, in part, by the establishment and collection of fees
from students and non-students as a condition of their attendance at any optional non-credit extracurricular event of the district. While ASB
funds are considered to belong to the students, as a special revenue fund, the ASB fund is under the control, supervision and approval of the
board of directors, with the school district legally owning the resources accounted for in the fund.
Page 1
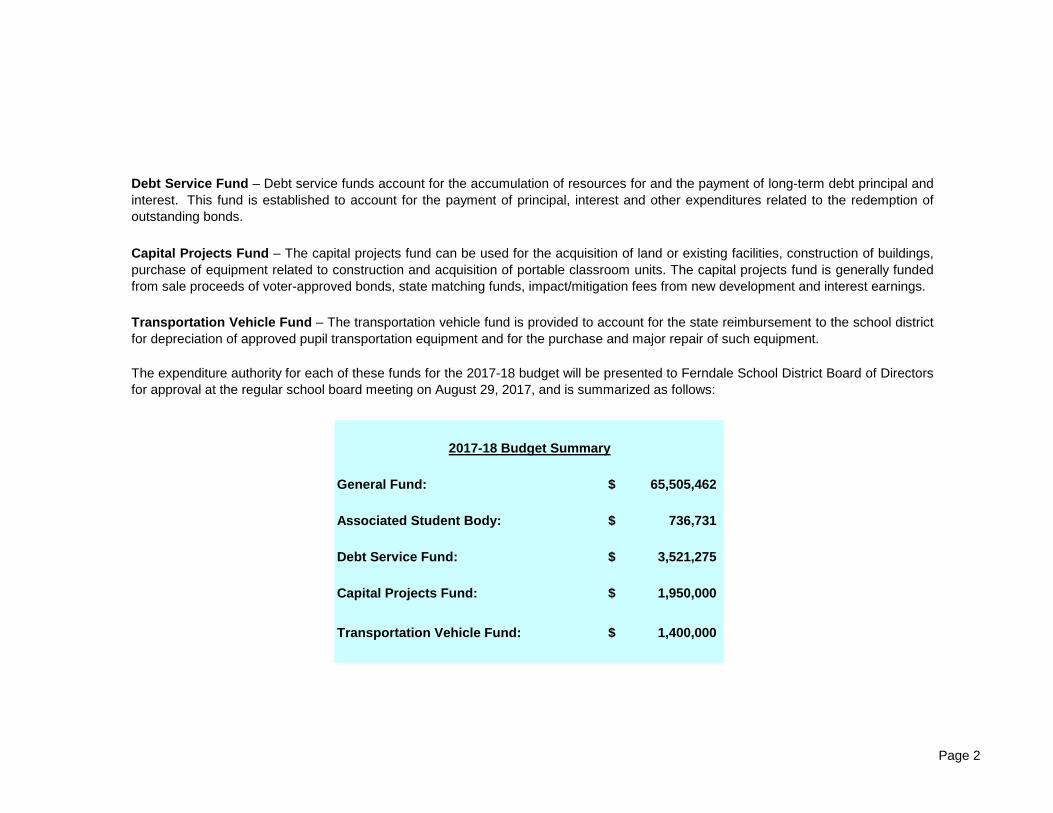
General Fund: 65,505,462$
Associated Student Body: 736,731$
Debt Service Fund: 3,521,275$
Capital Projects Fund: 1,950,000$
Transportation Vehicle Fund: 1,400,000$
2017-18 Budget Summary
Debt Service Fund – Debt service funds account for the accumulation of resources for and the payment of long-term debt principal and
interest. This fund is established to account for the payment of principal, interest and other expenditures related to the redemption of
outstanding bonds.
Capital Projects Fund – The capital projects fund can be used for the acquisition of land or existing facilities, construction of buildings,
purchase of equipment related to construction and acquisition of portable classroom units. The capital projects fund is generally funded
from sale proceeds of voter-approved bonds, state matching funds, impact/mitigation fees from new development and interest earnings.
Transportation Vehicle Fund – The transportation vehicle fund is provided to account for the state reimbursement to the school district
for depreciation of approved pupil transportation equipment and for the purchase and major repair of such equipment.
The expenditure authority for each of these funds for the 2017-18 budget will be presented to Ferndale School District Board of Directors
for approval at the regular school board meeting on August 29, 2017, and is summarized as follows:
Page 2
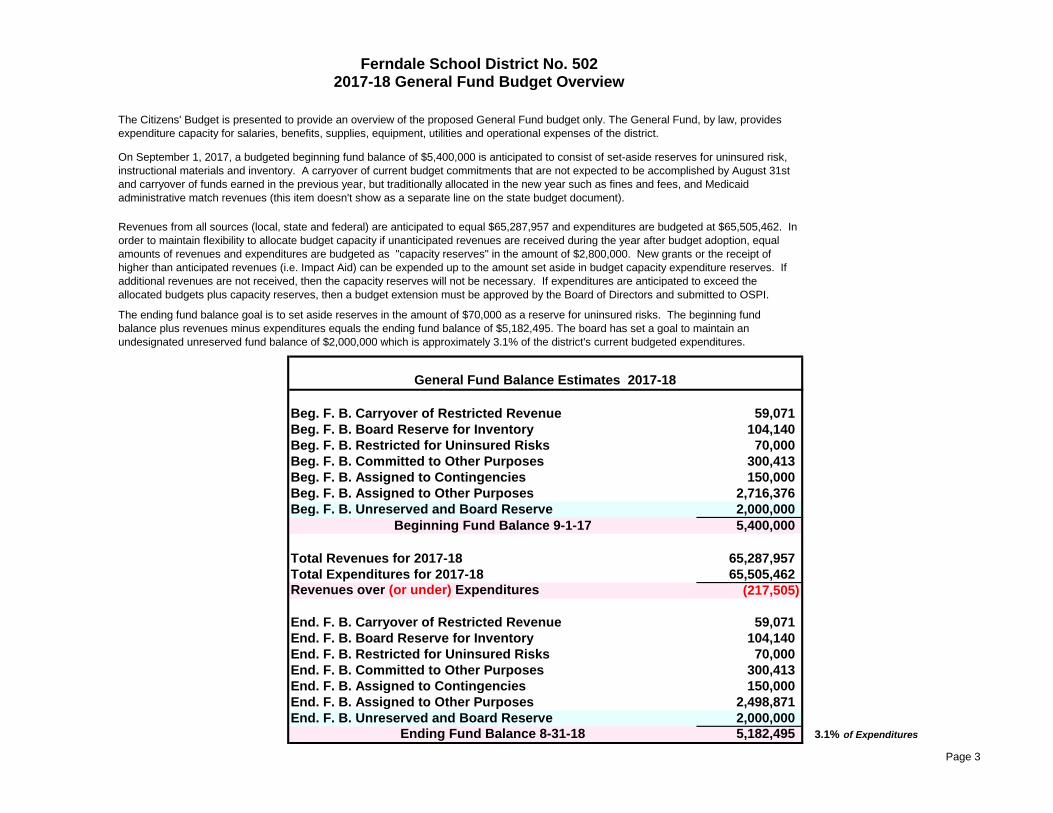
Beg. F. B. Carryover of Restricted Revenue 59,071
Beg. F. B. Board Reserve for Inventory 104,140
Beg. F. B. Restricted for Uninsured Risks 70,000
Beg. F. B. Committed to Other Purposes 300,413
Beg. F. B. Assigned to Contingencies 150,000
Beg. F. B. Assigned to Other Purposes 2,716,376
Beg. F. B. Unreserved and Board Reserve 2,000,000
Beginning Fund Balance 9-1-17 5,400,000
Total Revenues for 2017-18 65,287,957
Total Expenditures for 2017-18 65,505,462 Revenues over (or under) Expenditures (217,505)
End. F. B. Carryover of Restricted Revenue 59,071
End. F. B. Board Reserve for Inventory 104,140
End. F. B. Restricted for Uninsured Risks 70,000
End. F. B. Committed to Other Purposes 300,413
End. F. B. Assigned to Contingencies 150,000
End. F. B. Assigned to Other Purposes 2,498,871
End. F. B. Unreserved and Board Reserve 2,000,000
Ending Fund Balance 8-31-18 5,182,495 3.1% of Expenditures
General Fund Balance Estimates 2017-18
Ferndale School District No. 5022017-18 General Fund Budget Overview
The Citizens' Budget is presented to provide an overview of the proposed General Fund budget only. The General Fund, by law, provides
expenditure capacity for salaries, benefits, supplies, equipment, utilities and operational expenses of the district.
On September 1, 2017, a budgeted beginning fund balance of $5,400,000 is anticipated to consist of set-aside reserves for uninsured risk,
instructional materials and inventory. A carryover of current budget commitments that are not expected to be accomplished by August 31st
and carryover of funds earned in the previous year, but traditionally allocated in the new year such as fines and fees, and Medicaid
administrative match revenues (this item doesn't show as a separate line on the state budget document).
Revenues from all sources (local, state and federal) are anticipated to equal $65,287,957 and expenditures are budgeted at $65,505,462. In
order to maintain flexibility to allocate budget capacity if unanticipated revenues are received during the year after budget adoption, equal
amounts of revenues and expenditures are budgeted as "capacity reserves" in the amount of $2,800,000. New grants or the receipt of
higher than anticipated revenues (i.e. Impact Aid) can be expended up to the amount set aside in budget capacity expenditure reserves. If
additional revenues are not received, then the capacity reserves will not be necessary. If expenditures are anticipated to exceed the
allocated budgets plus capacity reserves, then a budget extension must be approved by the Board of Directors and submitted to OSPI.
The ending fund balance goal is to set aside reserves in the amount of $70,000 as a reserve for uninsured risks. The beginning fund
balance plus revenues minus expenditures equals the ending fund balance of $5,182,495. The board has set a goal to maintain an
undesignated unreserved fund balance of $2,000,000 which is approximately 3.1% of the district's current budgeted expenditures.
Page 3

Budgeted* Budgeted*
2011-12 2012-13 2013-14 2014-15 2015-16 2016-17 2017-18Average State
Allocation per FTE 5,060.57$ 5,247.87$ 5,598.86$ 5,811.36$ 6,358.07$ 6,576.89$ 7,183.08$
Grades K-4 1,729.50 1,732.53 1,656.94 1,569.40 1,707.22 1,644.00 1,669.00
Grades 5-6 791.85 746.20 750.26 726.37 693.11 678.00 722.00
Grades 7-12 2,301.32 2,335.48 2,311.13 2,191.30 2,085.87 2,003.00 2,034.00
4,822.67 4,814.21 4,718.33 4,487.07 4,486.20 4,325.00 4,425.00
Running Start 103.35 120.55 126.48 134.47 206.06 155.00 204.00
4,926.02 4,934.76 4,844.81 4,621.54 4,692.26 4,480.00 4,629.00
* Note: Enrollment data no longer includes Lummi Nation Schools
Enrollment
The majority of funding is derived from allocations from the state based on student enrollment. Funding is
received on an annual average of student full-time equivalents as reported on pre-determined "count" days for
the months of September through June (state reporting changes began including June beginning in 2011-12).
Fluctuations in enrollment are extremely difficult to predict and careful monitoring of the monthly enrollment is
important in order to adjust expenditures to the level of funding the enrollment provides.
-
500.00
1,000.00
1,500.00
2,000.00
2,500.00
2011-12 2012-13 2013-14 2014-15 2015-16 2016-17 2017-18
Grades K-4
Grades 5-6
Grades 7-12
Running Start
Page 4
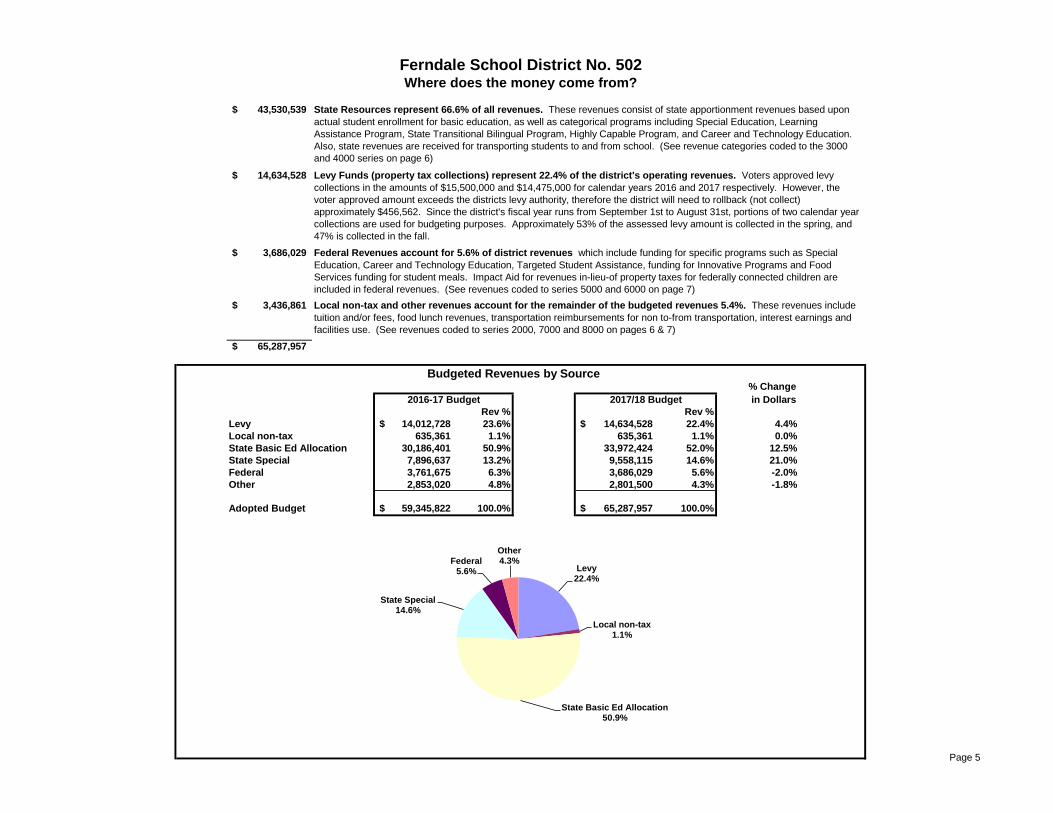
43,530,539$
14,634,528$
3,686,029$
3,436,861$
65,287,957$
% Change
in Dollars
Rev % Rev %
Levy 14,012,728$ 23.6% 14,634,528$ 22.4% 4.4%
Local non-tax 635,361 1.1% 635,361 1.1% 0.0%
State Basic Ed Allocation 30,186,401 50.9% 33,972,424 52.0% 12.5%
State Special 7,896,637 13.2% 9,558,115 14.6% 21.0%
Federal 3,761,675 6.3% 3,686,029 5.6% -2.0%
Other 2,853,020 4.8% 2,801,500 4.3% -1.8%
Adopted Budget 59,345,822$ 100.0% 65,287,957$ 100.0%
2016-17 Budget 2017/18 Budget
Budgeted Revenues by Source
Local non-tax and other revenues account for the remainder of the budgeted revenues 5.4%. These revenues include
tuition and/or fees, food lunch revenues, transportation reimbursements for non to-from transportation, interest earnings and
facilities use. (See revenues coded to series 2000, 7000 and 8000 on pages 6 & 7)
Ferndale School District No. 502Where does the money come from?
State Resources represent 66.6% of all revenues. These revenues consist of state apportionment revenues based upon
actual student enrollment for basic education, as well as categorical programs including Special Education, Learning
Assistance Program, State Transitional Bilingual Program, Highly Capable Program, and Career and Technology Education.
Also, state revenues are received for transporting students to and from school. (See revenue categories coded to the 3000
and 4000 series on page 6)
Levy Funds (property tax collections) represent 22.4% of the district's operating revenues. Voters approved levy
collections in the amounts of $15,500,000 and $14,475,000 for calendar years 2016 and 2017 respectively. However, the
voter approved amount exceeds the districts levy authority, therefore the district will need to rollback (not collect)
approximately $456,562. Since the district's fiscal year runs from September 1st to August 31st, portions of two calendar year
collections are used for budgeting purposes. Approximately 53% of the assessed levy amount is collected in the spring, and
47% is collected in the fall.
Federal Revenues account for 5.6% of district revenues which include funding for specific programs such as Special
Education, Career and Technology Education, Targeted Student Assistance, funding for Innovative Programs and Food
Services funding for student meals. Impact Aid for revenues in-lieu-of property taxes for federally connected children are
included in federal revenues. (See revenues coded to series 5000 and 6000 on page 7)
Levy 22.4%
Local non-tax1.1%
State Basic Ed Allocation50.9%
State Special14.6%
Federal5.6%
Other4.3%
Page 5

Ferndale School District
Revenues as Defined by State Codes
Revenue
Account Code Description 2015/16 Actual 2016/17 Budget 2017/18 Budget % Change $ Change
1100 LOCAL PROPERTY TAX $13,814,925 $14,010,861 $14,632,555 4.4% 621,694
1300 SALE OF TAX & TITLE PROPERTY
1500 TIMBER EXCISE TAX 1,818 1,867 1,973 5.7% 106
2100 STUDENT FEES & TUITION 20,284 16,500 16,500 0.0% 0
2171 TRAFFIC SAFETY FEES 121,285 82,686 82,686 0.0% 0
2173 SUMMER SCHOOL TUITIONS/FEES
2200 SALE OF SUPPLIES 23,362 19,150 19,150 0.0% 0
2231 SECONDARY VOCATIONAL 18,612 11,400 11,400 0.0% 0
2289 OTHER COMMUNITY SERVICE 60,806 15,500 15,500 0.0% 0
2298 SCHOOL FOOD SERVICES 285,624 325,000 325,000 0.0% 0
2300 INVESTMENT EARNINGS 46,134 20,000 20,000 0.0% 0
2500 GIFTS & DONATIONS 58,569 27,500 27,500 0.0% 0
2600 FINES DAMAGES & REFUNDS 11,010 2,625 2,625 0.0% 0
2700 RENTAL OF PROPERTY 17,115 10,000 10,000 0.0% 0
2800 INSURANCE RECOVERIES
2900 OTHER LOCAL REIMBURSEMENT 55,820 45,000 45,000 0.0% 0
2910 E-RATE 49,825 60,000 60,000 0.0% 0
3100 APPORTIONMENT - (BEA) 29,178,341 28,323,094 32,025,499 13.1% 3,702,405
3121 SPECIAL EDUCATION, GENERAL 1,170,544 1,141,883 1,225,501 7.3% 83,618
3300 LOCAL EFFORT ASSIST 383,908 721,424 721,424 0.0% 0
3600 STATE FORESTS
4100 SPECIAL PURPOSE, UNASSIGNED 2,236
4121 SPECIAL EDUCATION - STATE 4,077,761 3,774,584 4,500,524 19.2% 725,940
4122 SPECIAL EDUCATION - INFANT/TODDLER 248,098 270,204 473,584 75.3% 203,380
4134 MIDDLE SCHOOL CTE
4155 LEARNING ASSISTANCE 1,159,907 1,107,631 1,509,449 36.3% 401,818
4158 SPECIAL & PILOT PROG 232,520 209,138 280,000 33.9% 70,862
4165 TRANSITIONAL BILINGUAL 324,430 333,599 413,827 24.0% 80,228
4166 STUDENT ACHIEVEMENT
4174 HIGHLY CAPABLE 46,425 47,324 109,831 132.1% 62,507
4198 SCHOOL FOOD SERVICE 28,568 25,900 25,900 0.0% 0
4199 TRANSPORTATION OPERATIONS 2,128,241 2,128,257 2,245,000 5.5% 116,743
4300 OTHER STATE AGENCIES, UNASSIGNED
4358 SPECIAL & PILOT PROG, OTHER STATE
2016/17 vs 2017/18
Page 6
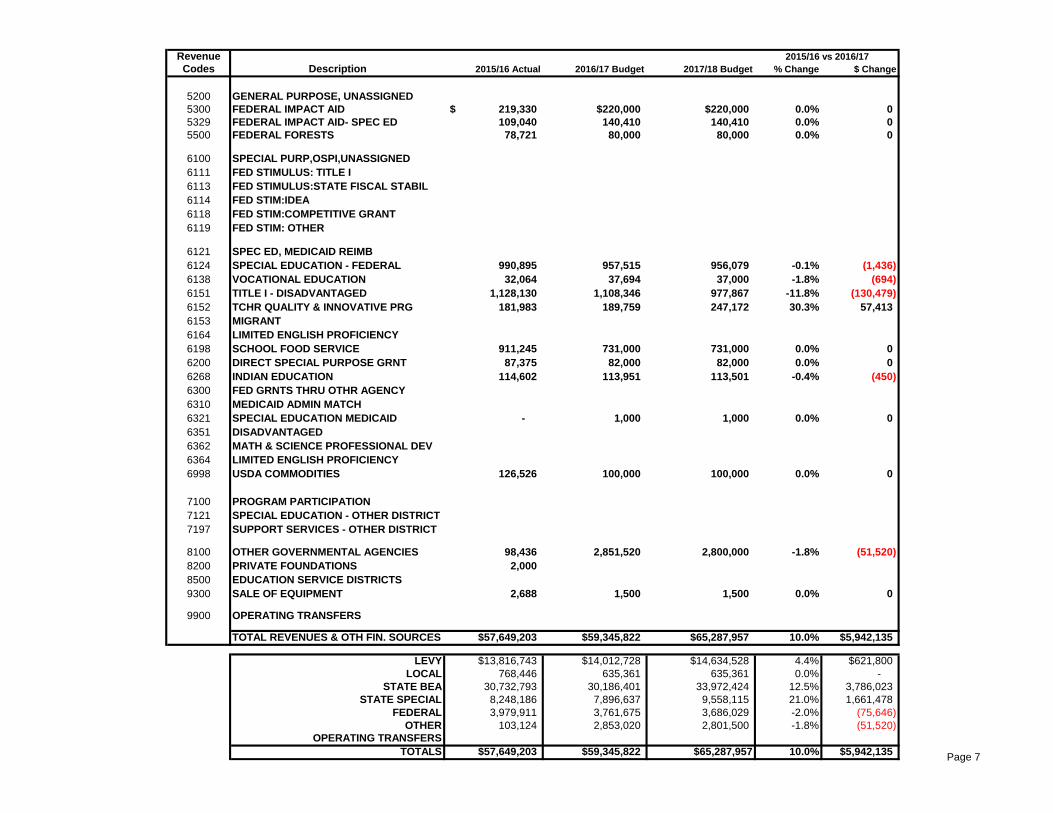
Revenue
Codes Description 2015/16 Actual 2016/17 Budget 2017/18 Budget % Change $ Change
5200 GENERAL PURPOSE, UNASSIGNED
5300 FEDERAL IMPACT AID 219,330$ $220,000 $220,000 0.0% 0
5329 FEDERAL IMPACT AID- SPEC ED 109,040 140,410 140,410 0.0% 0
5500 FEDERAL FORESTS 78,721 80,000 80,000 0.0% 0
6100 SPECIAL PURP,OSPI,UNASSIGNED
6111 FED STIMULUS: TITLE I
6113 FED STIMULUS:STATE FISCAL STABIL
6114 FED STIM:IDEA
6118 FED STIM:COMPETITIVE GRANT
6119 FED STIM: OTHER
6121 SPEC ED, MEDICAID REIMB
6124 SPECIAL EDUCATION - FEDERAL 990,895 957,515 956,079 -0.1% (1,436)
6138 VOCATIONAL EDUCATION 32,064 37,694 37,000 -1.8% (694)
6151 TITLE I - DISADVANTAGED 1,128,130 1,108,346 977,867 -11.8% (130,479)
6152 TCHR QUALITY & INNOVATIVE PRG 181,983 189,759 247,172 30.3% 57,413
6153 MIGRANT
6164 LIMITED ENGLISH PROFICIENCY
6198 SCHOOL FOOD SERVICE 911,245 731,000 731,000 0.0% 0
6200 DIRECT SPECIAL PURPOSE GRNT 87,375 82,000 82,000 0.0% 0
6268 INDIAN EDUCATION 114,602 113,951 113,501 -0.4% (450)
6300 FED GRNTS THRU OTHR AGENCY
6310 MEDICAID ADMIN MATCH
6321 SPECIAL EDUCATION MEDICAID - 1,000 1,000 0.0% 0
6351 DISADVANTAGED
6362 MATH & SCIENCE PROFESSIONAL DEV
6364 LIMITED ENGLISH PROFICIENCY
6998 USDA COMMODITIES 126,526 100,000 100,000 0.0% 0
7100 PROGRAM PARTICIPATION
7121 SPECIAL EDUCATION - OTHER DISTRICT
7197 SUPPORT SERVICES - OTHER DISTRICT
8100 OTHER GOVERNMENTAL AGENCIES 98,436 2,851,520 2,800,000 -1.8% (51,520)
8200 PRIVATE FOUNDATIONS 2,000
8500 EDUCATION SERVICE DISTRICTS
9300 SALE OF EQUIPMENT 2,688 1,500 1,500 0.0% 0
9900 OPERATING TRANSFERS
TOTAL REVENUES & OTH FIN. SOURCES $57,649,203 $59,345,822 $65,287,957 10.0% $5,942,135
LEVY $13,816,743 $14,012,728 $14,634,528 4.4% $621,800
LOCAL 768,446 635,361 635,361 0.0% -
STATE BEA 30,732,793 30,186,401 33,972,424 12.5% 3,786,023
STATE SPECIAL 8,248,186 7,896,637 9,558,115 21.0% 1,661,478
FEDERAL 3,979,911 3,761,675 3,686,029 -2.0% (75,646)
OTHER 103,124 2,853,020 2,801,500 -1.8% (51,520)
OPERATING TRANSFERS
TOTALS $57,649,203 $59,345,822 $65,287,957 10.0% $5,942,135
2015/16 vs 2016/17
Page 7
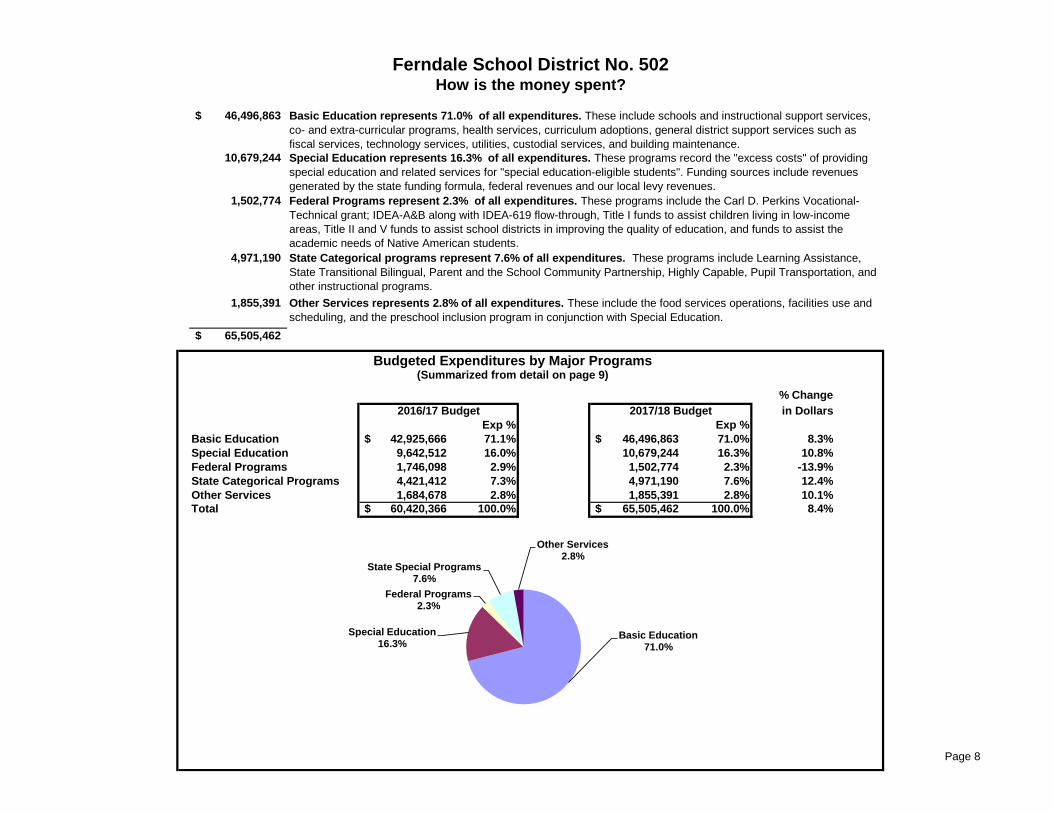
46,496,863$
10,679,244
1,502,774
4,971,190
1,855,391
65,505,462$
% Change
in Dollars
Exp % Exp %
Basic Education 42,925,666$ 71.1% 46,496,863$ 71.0% 8.3%
Special Education 9,642,512 16.0% 10,679,244 16.3% 10.8%
Federal Programs 1,746,098 2.9% 1,502,774 2.3% -13.9%
State Categorical Programs 4,421,412 7.3% 4,971,190 7.6% 12.4%
Other Services 1,684,678 2.8% 1,855,391 2.8% 10.1%
Total 60,420,366$ 100.0% 65,505,462$ 100.0% 8.4%
State Categorical programs represent 7.6% of all expenditures. These programs include Learning Assistance,
State Transitional Bilingual, Parent and the School Community Partnership, Highly Capable, Pupil Transportation, and
other instructional programs.
Ferndale School District No. 502How is the money spent?
Basic Education represents 71.0% of all expenditures. These include schools and instructional support services,
co- and extra-curricular programs, health services, curriculum adoptions, general district support services such as
fiscal services, technology services, utilities, custodial services, and building maintenance.
Special Education represents 16.3% of all expenditures. These programs record the "excess costs" of providing
special education and related services for "special education-eligible students". Funding sources include revenues
generated by the state funding formula, federal revenues and our local levy revenues.
Federal Programs represent 2.3% of all expenditures. These programs include the Carl D. Perkins Vocational-
Technical grant; IDEA-A&B along with IDEA-619 flow-through, Title I funds to assist children living in low-income
areas, Title II and V funds to assist school districts in improving the quality of education, and funds to assist the
academic needs of Native American students.
Budgeted Expenditures by Major Programs
2016/17 Budget 2017/18 Budget
(Summarized from detail on page 9)
Other Services represents 2.8% of all expenditures. These include the food services operations, facilities use and
scheduling, and the preschool inclusion program in conjunction with Special Education.
Basic Education 71.0%
Special Education 16.3%
Federal Programs2.3%
State Special Programs7.6%
Other Services2.8%
Page 8
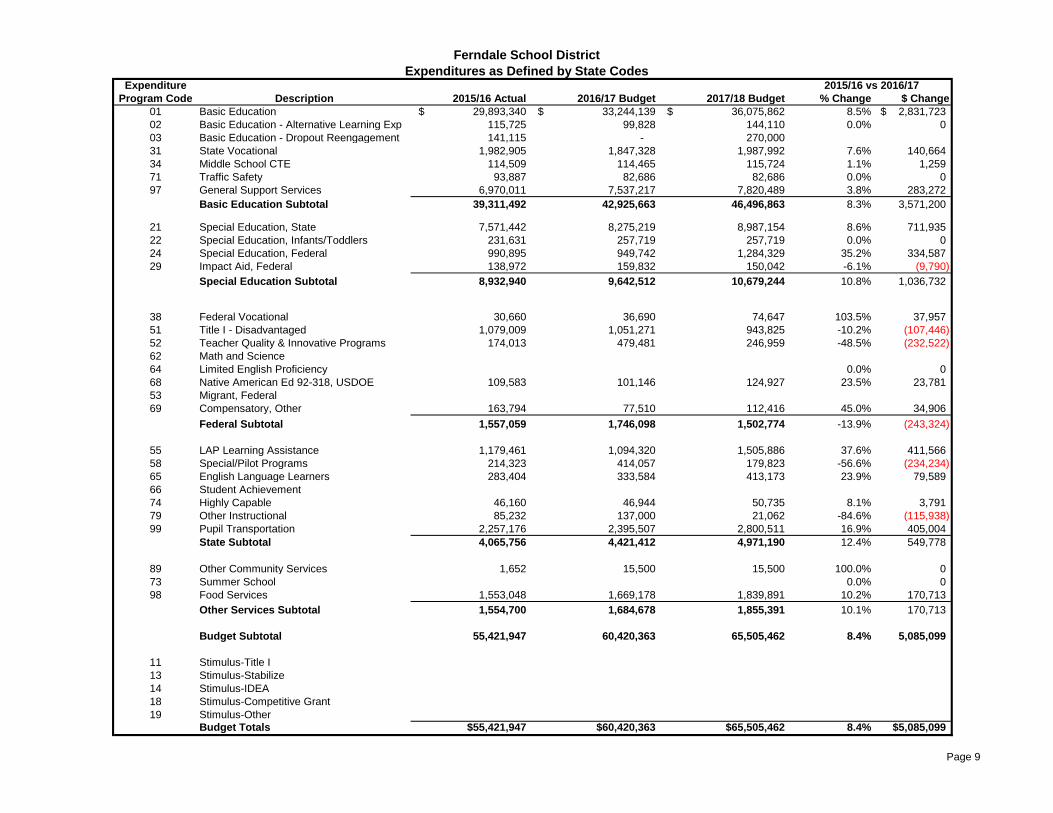
Ferndale School District
Expenditures as Defined by State CodesExpenditure
Program Code Description 2015/16 Actual 2016/17 Budget 2017/18 Budget % Change $ Change
01 Basic Education 29,893,340$ 33,244,139$ 36,075,862$ 8.5% 2,831,723$
02 Basic Education - Alternative Learning Exp 115,725 99,828 144,110 0.0% 0
03 Basic Education - Dropout Reengagement 141,115 - 270,000
31 State Vocational 1,982,905 1,847,328 1,987,992 7.6% 140,664
34 Middle School CTE 114,509 114,465 115,724 1.1% 1,259
71 Traffic Safety 93,887 82,686 82,686 0.0% 0
97 General Support Services 6,970,011 7,537,217 7,820,489 3.8% 283,272
Basic Education Subtotal 39,311,492 42,925,663 46,496,863 8.3% 3,571,200
21 Special Education, State 7,571,442 8,275,219 8,987,154 8.6% 711,935
22 Special Education, Infants/Toddlers 231,631 257,719 257,719 0.0% 0
24 Special Education, Federal 990,895 949,742 1,284,329 35.2% 334,587
29 Impact Aid, Federal 138,972 159,832 150,042 -6.1% (9,790)
Special Education Subtotal 8,932,940 9,642,512 10,679,244 10.8% 1,036,732
38 Federal Vocational 30,660 36,690 74,647 103.5% 37,957
51 Title I - Disadvantaged 1,079,009 1,051,271 943,825 -10.2% (107,446)
52 Teacher Quality & Innovative Programs 174,013 479,481 246,959 -48.5% (232,522)
62 Math and Science
64 Limited English Proficiency 0.0% 0
68 Native American Ed 92-318, USDOE 109,583 101,146 124,927 23.5% 23,781
53 Migrant, Federal
69 Compensatory, Other 163,794 77,510 112,416 45.0% 34,906
Federal Subtotal 1,557,059 1,746,098 1,502,774 -13.9% (243,324)
55 LAP Learning Assistance 1,179,461 1,094,320 1,505,886 37.6% 411,566
58 Special/Pilot Programs 214,323 414,057 179,823 -56.6% (234,234)
65 English Language Learners 283,404 333,584 413,173 23.9% 79,589
66 Student Achievement
74 Highly Capable 46,160 46,944 50,735 8.1% 3,791
79 Other Instructional 85,232 137,000 21,062 -84.6% (115,938)
99 Pupil Transportation 2,257,176 2,395,507 2,800,511 16.9% 405,004
State Subtotal 4,065,756 4,421,412 4,971,190 12.4% 549,778
89 Other Community Services 1,652 15,500 15,500 100.0% 0
73 Summer School 0.0% 0
98 Food Services 1,553,048 1,669,178 1,839,891 10.2% 170,713
Other Services Subtotal 1,554,700 1,684,678 1,855,391 10.1% 170,713
Budget Subtotal 55,421,947 60,420,363 65,505,462 8.4% 5,085,099
11 Stimulus-Title I
13 Stimulus-Stabilize
14 Stimulus-IDEA
18 Stimulus-Competitive Grant
19 Stimulus-Other
Budget Totals $55,421,947 $60,420,363 $65,505,462 8.4% $5,085,099
2015/16 vs 2016/17
Page 9
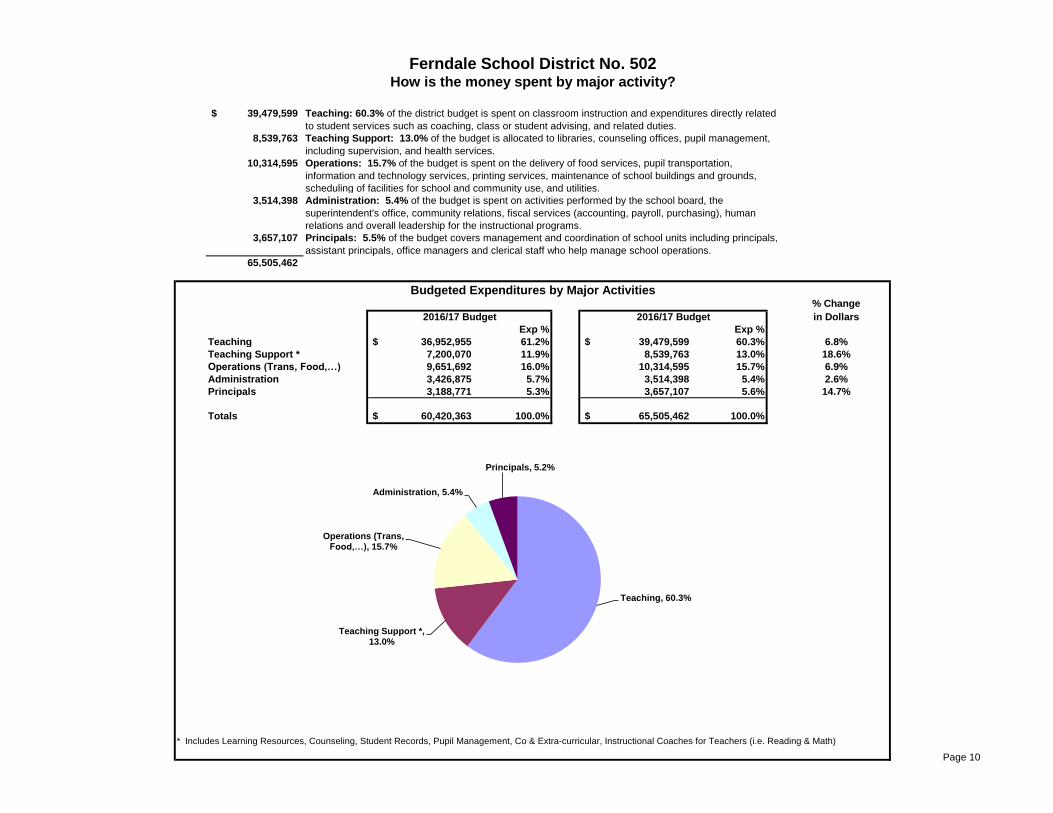
39,479,599$
8,539,763
10,314,595
3,514,398
3,657,107
65,505,462
% Change
in Dollars
Exp % Exp %
Teaching 36,952,955$ 61.2% 39,479,599$ 60.3% 6.8%
Teaching Support * 7,200,070 11.9% 8,539,763 13.0% 18.6%
Operations (Trans, Food,…) 9,651,692 16.0% 10,314,595 15.7% 6.9%
Administration 3,426,875 5.7% 3,514,398 5.4% 2.6%
Principals 3,188,771 5.3% 3,657,107 5.6% 14.7%
Totals 60,420,363$ 100.0% 65,505,462$ 100.0%
* Includes Learning Resources, Counseling, Student Records, Pupil Management, Co & Extra-curricular, Instructional Coaches for Teachers (i.e. Reading & Math)
Ferndale School District No. 502How is the money spent by major activity?
2016/17 Budget 2016/17 Budget
Budgeted Expenditures by Major Activities
Teaching: 60.3% of the district budget is spent on classroom instruction and expenditures directly related
to student services such as coaching, class or student advising, and related duties.
Teaching Support: 13.0% of the budget is allocated to libraries, counseling offices, pupil management,
including supervision, and health services.
Operations: 15.7% of the budget is spent on the delivery of food services, pupil transportation,
information and technology services, printing services, maintenance of school buildings and grounds,
scheduling of facilities for school and community use, and utilities.
Administration: 5.4% of the budget is spent on activities performed by the school board, the
superintendent's office, community relations, fiscal services (accounting, payroll, purchasing), human
relations and overall leadership for the instructional programs.
Principals: 5.5% of the budget covers management and coordination of school units including principals,
assistant principals, office managers and clerical staff who help manage school operations.
Teaching, 60.3%
Teaching Support *, 13.0%
Operations (Trans, Food,…), 15.7%
Administration, 5.4%
Principals, 5.2%
Page 10
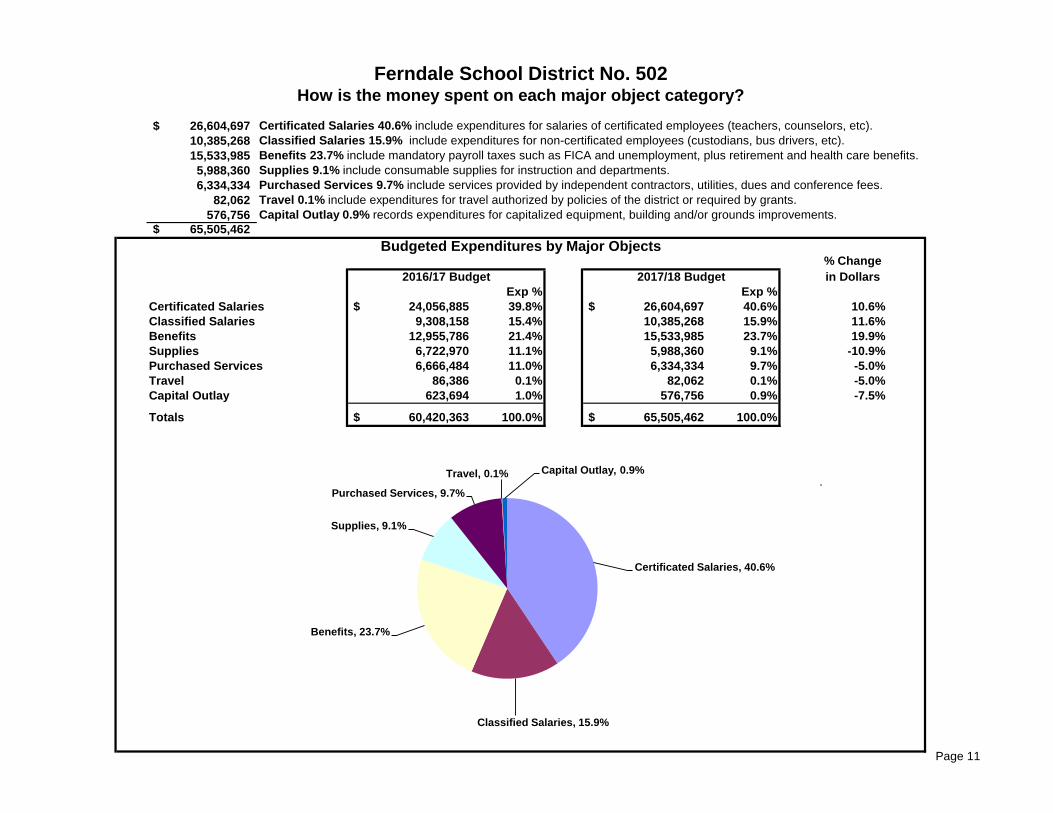
26,604,697$ Certificated Salaries 40.6% include expenditures for salaries of certificated employees (teachers, counselors, etc).
10,385,268 Classified Salaries 15.9% include expenditures for non-certificated employees (custodians, bus drivers, etc).
15,533,985 Benefits 23.7% include mandatory payroll taxes such as FICA and unemployment, plus retirement and health care benefits.
5,988,360 Supplies 9.1% include consumable supplies for instruction and departments.
6,334,334 Purchased Services 9.7% include services provided by independent contractors, utilities, dues and conference fees.
82,062 Travel 0.1% include expenditures for travel authorized by policies of the district or required by grants.
576,756 Capital Outlay 0.9% records expenditures for capitalized equipment, building and/or grounds improvements.
65,505,462$
% Change
in Dollars
Exp % Exp %
Certificated Salaries 24,056,885$ 39.8% 26,604,697$ 40.6% 10.6%
Classified Salaries 9,308,158 15.4% 10,385,268 15.9% 11.6%
Benefits 12,955,786 21.4% 15,533,985 23.7% 19.9%
Supplies 6,722,970 11.1% 5,988,360 9.1% -10.9%
Purchased Services 6,666,484 11.0% 6,334,334 9.7% -5.0%
Travel 86,386 0.1% 82,062 0.1% -5.0%
Capital Outlay 623,694 1.0% 576,756 0.9% -7.5%
Totals 60,420,363$ 100.0% 65,505,462$ 100.0%
.
2016/17 Budget 2017/18 Budget
Ferndale School District No. 502How is the money spent on each major object category?
Budgeted Expenditures by Major Objects
Certificated Salaries, 40.6%
Classified Salaries, 15.9%
Benefits, 23.7%
Supplies, 9.1%
Purchased Services, 9.7%
Travel, 0.1% Capital Outlay, 0.9%
Page 11
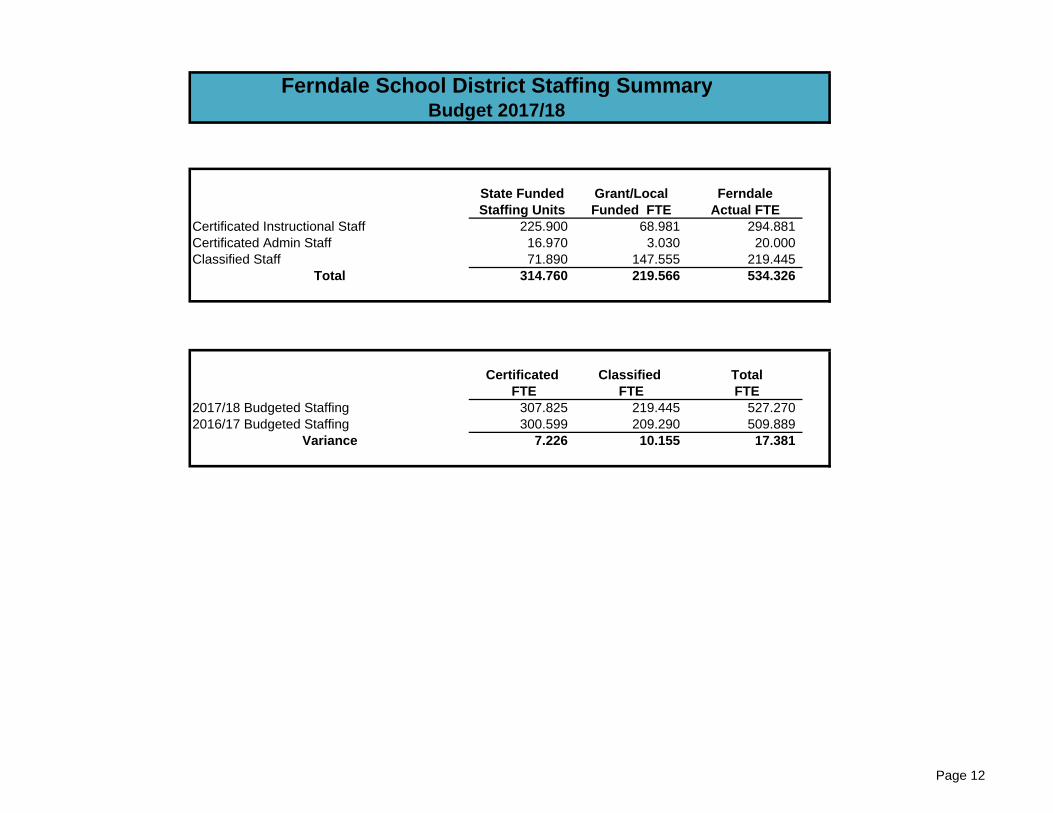
State Funded Grant/Local FerndaleStaffing Units Funded FTE Actual FTE
Certificated Instructional Staff 225.900 68.981 294.881 Certificated Admin Staff 16.970 3.030 20.000 Classified Staff 71.890 147.555 219.445
Total 314.760 219.566 534.326
Certificated Classified Total FTE FTE FTE
2017/18 Budgeted Staffing 307.825 219.445 527.270 2016/17 Budgeted Staffing 300.599 209.290 509.889
Variance 7.226 10.155 17.381
Ferndale School District Staffing SummaryBudget 2017/18
Page 12
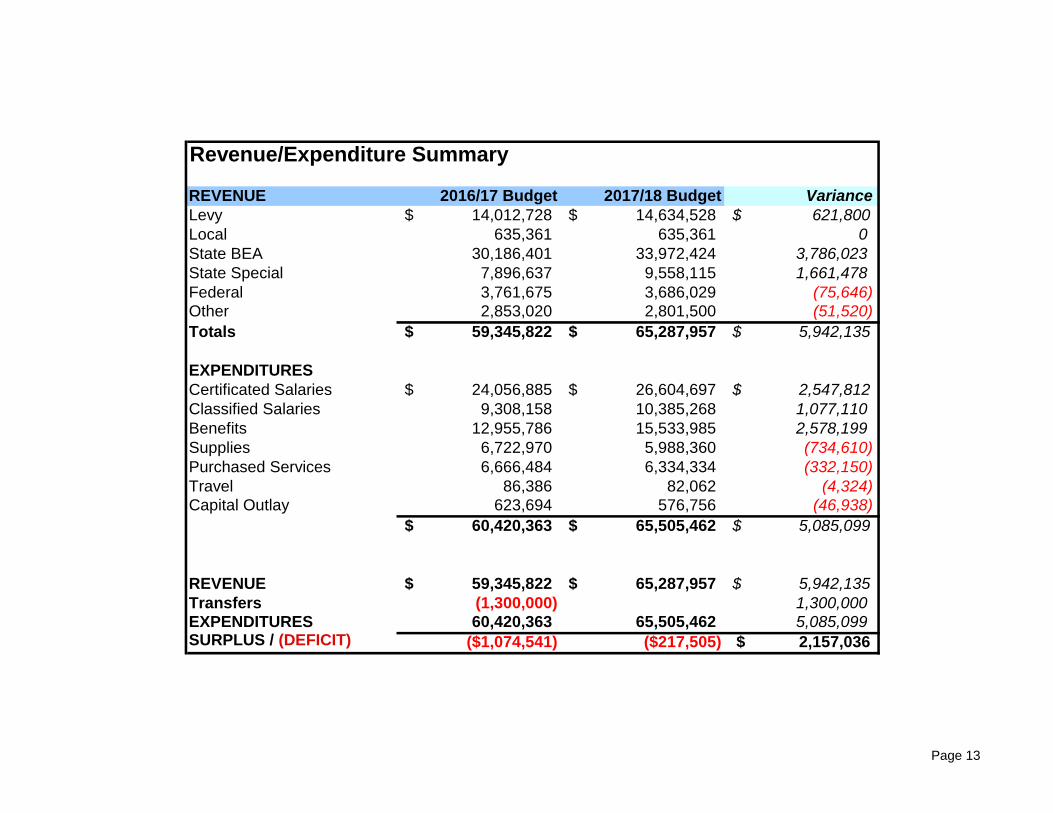
Revenue/Expenditure Summary
REVENUE 2016/17 Budget 2017/18 Budget Variance
Levy 14,012,728$ 14,634,528$ 621,800$
Local 635,361 635,361 0
State BEA 30,186,401 33,972,424 3,786,023
State Special 7,896,637 9,558,115 1,661,478
Federal 3,761,675 3,686,029 (75,646)
Other 2,853,020 2,801,500 (51,520)
Totals 59,345,822$ 65,287,957$ 5,942,135$
EXPENDITURES
Certificated Salaries 24,056,885$ 26,604,697$ 2,547,812$
Classified Salaries 9,308,158 10,385,268 1,077,110
Benefits 12,955,786 15,533,985 2,578,199
Supplies 6,722,970 5,988,360 (734,610)
Purchased Services 6,666,484 6,334,334 (332,150)
Travel 86,386 82,062 (4,324)
Capital Outlay 623,694 576,756 (46,938)
60,420,363$ 65,505,462$ 5,085,099$
REVENUE 59,345,822$ 65,287,957$ 5,942,135$
Transfers (1,300,000) 1,300,000
EXPENDITURES 60,420,363 65,505,462 5,085,099SURPLUS / (DEFICIT) ($1,074,541) ($217,505) 2,157,036$
Page 13