a citizen's guide to the federal budget
TRANSCRIPT

A CITIZEN’S GUIDE TO
THE FEDERAL BUDGET
BUDGET OF THE
UNITED STATES GOVERNMENT
FISCAL YEAR 2002

Table of Contents
A Note to the Reader . . . . . . . . . . . . . . . . . . . . iii
1. What Is the Budget? . . . . . . . . . . . . . . . . . . . 1
2. Where the Money Comes From—and Where ItGoes . . . . . . . . . . . . . . . . . . . . . . . . . . . . . 3
Revenues . . . . . . . . . . . . . . . . . . . . . . . . . . . . . . . . . . . . . . . 5
Spending . . . . . . . . . . . . . . . . . . . . . . . . . . . . . . . . . . . . . . . 8
“On” and “Off” Budget . . . . . . . . . . . . . . . . . . . . . . . . . . . . . 10
3. How Does the Government Create a Budget? . . 15The President’s Budget. . . . . . . . . . . . . . . . . . . . . . . . . . . . . . 15
Action in Congress . . . . . . . . . . . . . . . . . . . . . . . . . . . . . . . . 15
Monitoring the Budget . . . . . . . . . . . . . . . . . . . . . . . . . . . . . . 17
4. The Budget Surplus and Fiscal Discipline . . . . . 19Why a Budget Surplus is Important . . . . . . . . . . . . . . . . . . . . . . 22
Surplus and Debt. . . . . . . . . . . . . . . . . . . . . . . . . . . . . . . . . . 23
5. The President’s 2002 Budget . . . . . . . . . . . . . 25Thematic Highlights of President Bush's 2002 Budget . . . . . . . . . 25
The President's Policy Priorities . . . . . . . . . . . . . . . . . . . . . . . . 26
Additional Budget Highlights . . . . . . . . . . . . . . . . . . . . . . . . . . 29
Glossary . . . . . . . . . . . . . . . . . . . . . . . . . . . . . 31
List of Charts and Tables . . . . . . . . . . . . . . . . . . 35
i
Details in this document may not add tototals due to rounding.
02_guide.qxd 3/30/2001 2:58 PM Page i

iii
A Note to the Reader
Next year, your Federal Government will spend nearly $2.0 trillion.
Needless to say, that’s a lot of money. In fact, that’s almost $7,000 for everyman, woman, and child in the country; nearly $5.4 billion per day; and about$3.7 million per minute. And most of that money comes from taxes on theAmerican people.
The Government spends it on lots of things—on programs as large as SocialSecurity, and on activities as small and unknown as repairs to the NationalZoo. Together, these programs are what make up the Federal budget.
How much do you know about the budget? If your answer is “not much,”you’re not alone. In fact, hardly anybody knows everything that’s in thethousands of pages, and several books, that make up the budget each year.
But we know you care a lot about how the Government spends your money.That’s why A Citizen’s Guide to the Federal Budget was created. With thisseventh edition, we hope to make the budget more accessible andunderstandable.
The Guide is designed to give you a walking tour of the budget. In thesepages, we will outline for you how the Government raises revenues andspends money, how the President and Congress enact the budget, how theNation has been able to move from deficit to surplus, and what the Presidenthopes to accomplish with his 2002 Budget.
After you read these pages, we hope that you will think the tour was worthyour time.
This Citizen’s Guide and other more detailed and technical 2002Budget documents are available on the Internet. To accessdocuments through the World Wide Web, use the followingaddress:
http://www.whitehouse.gov/omb/budget
02_guide.qxd 3/30/2001 2:58 PM Page iii

1
1. What Is the Budget?
The Federal budget is:
• a plan for how the Government spends your money.
What activities are funded? How much does it spend for defense,national parks, the FBI, Medicare, and meat and fish inspection?
• a plan for how the Government pays for its activities.
How much revenue does it raise through different kinds of taxes—income taxes, excise taxes, and social insurance payroll taxes?
• a plan for Government borrowing or repayment of borrowing.
If revenues are greater than spending, the Government runs a surplus.When there is a surplus, the Government can reduce the nationaldebt—money it owes to American and foreign investors.
• something that affects the Nation’s economy.
Some types of spending on things like education and support forscience and technology are done in the hope they will increaseproductivity and raise incomes in the future.
Taxes, on the other hand, reduce incomes, leaving people with lessmoney to spend.
• something that is affected by the Nation’s economy.
When the economy is doing well, people earn more andunemployment is low. In this atmosphere, revenues increase and thesurplus grows.
• a historical record.
The budget reports on how the Government has spent money in thepast, and how that spending was financed.
The 2002 Budget is a document that embodies the President’s budgetproposal to Congress for fiscal 2002, the fiscal year that begins on October1, 2001. It reflects the President’s priorities and proposes that the entireSocial Security surplus be saved and set aside for Social Security and debt
02_guide.qxd 3/30/2001 2:58 PM Page 1

reduction. The President’s budget also moderates the recent extremely rapidgrowth in discretionary spending, while funding national priorities andproviding tax relief.
The Federal budget, of course, is not the only budget that affects theeconomy or the American people. The budgets of State and localgovernments have an impact as well. While Federal Government spendingwas 18 percent of the Gross Domestic Product (or GDP, which measures thesize of the economy) in 2000, State and local government spending wasabout another nine percent (see Chart 1–1).
State and local governments are independent of the Federal Government,and they have their own sources of revenue (taxes and borrowing). But theFederal Government supplements State and local revenues by making grantsto them. Of the $1,152 billion that State and local governments spent in2000, $242 billion came from Federal grants.
2
Pie 1
10
20
30
40
50
60
70
80
90
100
Total Federal Spending (18%)
Spending for DirectFederal Programs
(16%)
Spending from State and Local Revenues (9%)
Private72%
Total State andLocal Spending (12%)
Government28%
Total GovernmentSpending in the U.S. (28%)
Federal Grants to State and Local Governments (2%)
Chart 1–1. Government Spending as a Share of GDP, 2000
Total Government spending accounts for less than one-thirdof the national economy. Federal spending is about two-thirds
of this amount, or about 18 percent of GDP.
02_guide.qxd 3/30/2001 2:58 PM Page 2

2. Where the Money Comes From—and Where it Goes
In a typical American household, a father and mother might sit around thekitchen table to review the family budget. They might discuss how much theyexpect to earn each year, how much they can spend on food, shelter,clothing, transportation, and perhaps a vacation, and how much they mightbe able to save for their future needs.
If they do not have enough money to make ends meet, they might discusshow they can spend less, such as by cutting back on restaurants, movies, orother entertainment. They also might consider whether to try to earn moreby working more hours or taking another job. If they expect their shortfall tobe temporary, they might try to borrow.
3
Chart 2–1. Family Budgeting
Sources: Cash and Credit
?
?
?
??
?
?
?
Household Appliances
Housing
Transportation
ABCDEFGHIJKLMNOPQRSTUVWXYZ
Clothing
FoodEducation
Restaurants/Entertainment
02_guide.qxd 3/30/2001 2:58 PM Page 3

On the other hand, if they find themselves with more income than needed tomeet their usual needs, they might use some of the extra money to improvetheir situation in critical areas, such as buying better health insurance, and topay off the debts they built up in earlier years.
In some ways, the Federal Government plans its budget much like familiesdo. The President and Congress determine how much money they expect theGovernment to receive in each of the next several years, where it will comefrom, and how much to spend to reach their goals—goals for nationaldefense, foreign affairs, social insurance for the elderly, health insurance forthe elderly and poor, law enforcement, education, transportation, science andtechnology, and others. Unlike the Government though, a family can’t justdecide to take money from its neighbors when it wants to spend more thanit takes in.
Also, unlike a family, the Government must keep in mind that it gets itsrevenue from you, the taxpayer. When the Federal budget is in surplus, theGovernment debates not only how much of the surplus to invest in new
4
Chart 2–2. National Budgeting
?
??
?
?
??
?
Health Care
Environmental CleanupChild Nutrition
Research
Military
Crime Prevention
Education
Sources: Taxes and Borrowing
02_guide.qxd 3/30/2001 2:58 PM Page 4

spending, or to pay down past debt, but also how much to return to thetaxpayers in the form of tax relief. The Government also debates how itsspending and revenue decisions will help the economy grow.
In this chapter, we will discuss these decisions in some detail—that is, howthe Government raises revenues and where it spends money.
Revenues
The money that the Federal Government uses to pay its bills—its revenues orreceipts—comes mostly from taxes. In the past three years, revenues weregreater than spending, and the Government was able to reduce the nationaldebt with the difference between revenues and spending—that is, the surplus.
5
ExciseTaxes
3%
Other4%
CorporateIncomeTaxes10%
SocialInsuranceReceipts
33%
IndividualIncomeTaxes49%
Receipts $2,192 billion
Chart 2–3. The Federal Government Dollar—Where It Comes From
Over 90 percent of revenues come from three majorcategories of taxes: individual and corporate income taxes
and payroll-type taxes.
02_guide.qxd 3/30/2001 2:58 PM Page 5
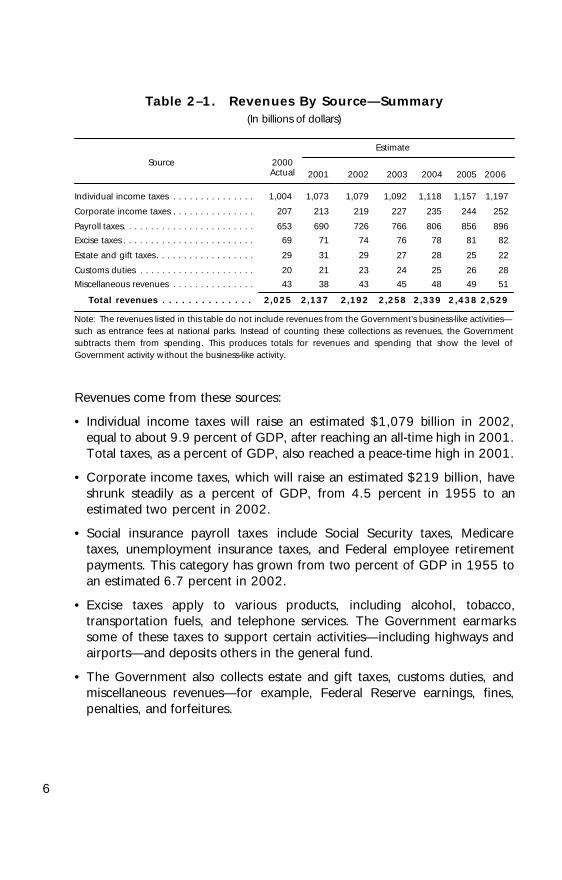
Revenues come from these sources:
• Individual income taxes will raise an estimated $1,079 billion in 2002,equal to about 9.9 percent of GDP, after reaching an all-time high in 2001.Total taxes, as a percent of GDP, also reached a peace-time high in 2001.
• Corporate income taxes, which will raise an estimated $219 billion, haveshrunk steadily as a percent of GDP, from 4.5 percent in 1955 to anestimated two percent in 2002.
• Social insurance payroll taxes include Social Security taxes, Medicaretaxes, unemployment insurance taxes, and Federal employee retirementpayments. This category has grown from two percent of GDP in 1955 toan estimated 6.7 percent in 2002.
• Excise taxes apply to various products, including alcohol, tobacco,transportation fuels, and telephone services. The Government earmarkssome of these taxes to support certain activities—including highways andairports—and deposits others in the general fund.
• The Government also collects estate and gift taxes, customs duties, andmiscellaneous revenues—for example, Federal Reserve earnings, fines,penalties, and forfeitures.
6
Table 2–1. Revenues By Source—Summary(In billions of dollars)
Estimate
Source 2000Actual 2001 2002 2003 2004 2005 2006
Individual income taxes . . . . . . . . . . . . . . . 1,004 1,073 1,079 1,092 1,118 1,157 1,197
Corporate income taxes . . . . . . . . . . . . . . . 207 213 219 227 235 244 252
Payroll taxes. . . . . . . . . . . . . . . . . . . . . . . . 653 690 726 766 806 856 896
Excise taxes . . . . . . . . . . . . . . . . . . . . . . . . 69 71 74 76 78 81 82
Estate and gift taxes . . . . . . . . . . . . . . . . . . 29 31 29 27 28 25 22
Customs duties . . . . . . . . . . . . . . . . . . . . . 20 21 23 24 25 26 28
Miscellaneous revenues . . . . . . . . . . . . . . . 43 38 43 45 48 49 51
Total revenues . . . . . . . . . . . . . . 2,025 2,137 2,192 2,258 2,339 2,438 2,529
Note: The revenues listed in this table do not include revenues from the Government’s business-like activities—such as entrance fees at national parks. Instead of counting these collections as revenues, the Governmentsubtracts them from spending. This produces totals for revenues and spending that show the level ofGovernment activity without the business-like activity.
02_guide.qxd 3/30/2001 2:58 PM Page 6

7
5
6
7
8
9
10
11
0
World War II Peak
New Record High
Percent of GDP
Chart 2–5. Constant Dollar Revenue Growth
500
750
1,000
1,250
1,500
1,750
2,000
Constant FY 1996 dollars in billions
Total Receipts, Adjusted for InflationTotal Revenues, Adjusted for Inflation
Chart 2–4. Individual Income Taxes as a Share of GDP atRecord High
02_guide.qxd 3/30/2001 2:58 PM Page 7

Spending
As noted, the Federal Government will collect around $2.2 trillion and spendnearly $2.0 trillion,1 which is divided into several categories as shown inChart 2–7, leaving a surplus of $231 billion in 2002.
• The largest Federal program is Social Security, which will provide monthlybenefits to more than 46 million retired and disabled workers, theirdependents, and survivors. It accounts for 23 percent of all Federalspending.
8
1956 1962 1968 1974 1980 1986 1992 1998 2004
0
20
40
60
80
100
Percent
OTHER
Social Insurance Taxes
Excise Taxes
Corporation Income Taxes
Individual Income Taxes
Other
Chart 2–6. Composition of Revenues
Between 1956 and 2000, payroll taxes increased substantially as apercent of total revenues, and corporate income taxes declined, but
the individual income tax share remained roughly constant.
1 This amount does not include all of the Government’s spending. As explained under“Revenues,” the Government subtracts collections from its business-like activities, such asentrance fees at national parks, from spending instead of adding them to revenues. Thesecollections are estimated to be $0.2 trillion in 2002. If they were not subtracted from spending,spending would total an estimated $2.2 trillion in 2002, not $2.0 trillion.
02_guide.qxd 3/30/2001 2:58 PM Page 8

• Medicare will provide health care coverage for more than 40 million elderlyAmericans and people with disabilities. Since its creation in 1965,Medicare has accounted for an ever-growing share of spending. In 2002,it will comprise 12 percent of all Federal spending.
• Medicaid will provide health care services to a little more than 34 millionAmericans, including the poor, people with disabilities, and senior citizensin nursing homes. Unlike Medicare, the Federal Government shares thecosts of Medicaid with the States, paying between 50 and 83 percent ofthe total (depending on each State’s requirements). Federal and State costsare growing rapidly, although the rate of growth has fallen from thedouble-digit pace of the late 1980s and early 1990s. In 2002, Medicaid willaccount for seven percent of the budget.
• Other means-tested entitlements provide benefits to people and familieswith incomes below certain minimum levels that vary from program toprogram. The major means-tested entitlements are Food Stamps,Supplemental Security Income, Child Nutrition, the Earned Income TaxCredit, and veterans’ pensions. This category will account for an estimatedsix percent of the budget.
9
Other Mandatory
7%
*Means-tested entitlements are those for which eligibility is based on income. The Medicaidprogram is also a means-tested entitlement.
OtherMeans-Tested Entitlements
6%
Receipts $2.2 trillion
Outlays $2.0 trillion
NetInterest
10%
National Defense
16%Social
Security23%
Medicare12%
Non-DefenseDiscretionary
19%
Medicaid7%
Debt Reduction or Contingency Reserve
Surplus
$2.0 trillion to be spent on
Tax Cut
Chart 2–7. How Your Tax Dollar Is Used
02_guide.qxd 3/30/2001 2:58 PM Page 9

10
• The remaining mandatory spending, which mainly consists of Federalretirement and insurance programs, unemployment insurance, and paymentsto farmers, makes up seven percent of the budget.
• National defense discretionary spending will total an estimated $319 billionin 2002, comprising 16 percent of the budget.
• Non-defense discretionary spending—a wide array of programs that includeeducation, training, science, technology, housing, transportation, and foreignaid—will total an estimated $373 billion in 2002, or 19 percent of thebudget.
• Interest payments, primarily the result of previous budget deficits, averagedseven percent of Federal spending in the 1960s and 1970s and rose to ahigh of 15 percent in 1996. Since 1998, the budget has been in surplus. Asa result, interest payments are estimated to drop to less than 10 percent ofthe budget in 2002.
• Slightly less than 11 percent of your Federal dollar (the budget surplus) willbe reserved for contingencies or used to reduce the Federal debt to ensurethe continued solvency of Social Security.
“On” and “Off” Budget
From time to time, you may hear the term “on-budget,” which refers to thebudget excluding certain programs that are legally designated as “off-budget.”
Traditionally, the President’s budget has focused on the totals for the unifiedbudget. The unified budget encompasses all of the budgetary activities of theGovernment, and the unified budget surplus or deficit is the measure thatdetermines how much the Government has to borrow from the public (in thecase of a deficit), or how much past borrowing can be repaid (in the case of asurplus).
More recently, the on-budget surplus has received increasing attention. For allpractical purposes, the off-budget surplus is the surplus in the Social Securityprogram. This means that the on-budget surplus is the budget surplus excludingthe Social Security surplus.2
2 The Postal Service is also designated as off-budget, which is why the off-budget surplus andthe Social Security surplus are not exactly the same.
02_guide.qxd 3/30/2001 2:58 PM Page 10

11
Table 2–2. Spending Summary(In billions of dollars)
Estimate
2001 2002 2003 2004 2005 2006
Outlays:
Discretionary . . . . . . . . . . . . . . . . . . . . . . . . . . . . 649 692 712 731 754 770
Mandatory:
Social Security . . . . . . . . . . . . . . . . . . . . . . . . . . 430 452 474 498 524 553Medicare . . . . . . . . . . . . . . . . . . . . . . . . . . . . . 216 226 239 252 279 292
Medicaid . . . . . . . . . . . . . . . . . . . . . . . . . . . . . 129 142 153 166 181 196Other mandatory . . . . . . . . . . . . . . . . . . . . . . . 226 260 264 268 286 285
Subtotal, mandatory . . . . . . . . . . . . . . . . . . . . . . . 1,001 1,081 1,129 1,184 1,270 1,326
Net interest . . . . . . . . . . . . . . . . . . . . . . . . . . . . . 206 188 175 161 145 127
Total, outlays . . . . . . . . . . . . . . . . . . . . . . . . . . . . . . 1,856 1,961 2,016 2,077 2,169 2,224
Receipts . . . . . . . . . . . . . . . . . . . . . . . . . . . . . . . . . 2,137 2,192 2,258 2,339 2,438 2,529
Unified surplus . . . . . . . . . . . . . . . . . . . . . . . . . . . 281 231 242 262 269 305
On-budget surplus/contingency . . . . . . . . . . . . . . 125 59 49 52 32 52
Off-budget surplus . . . . . . . . . . . . . . . . . . . . . . . . 156 172 193 211 237 252
1,000
1,250
1,500
1,750
2,000
Constant FY 1996 dollars in billions
Total Outlays, Adjusted for Inflation
Chart 2–8. Constant Dollar Spending Growth
02_guide.qxd 3/30/2001 2:58 PM Page 11

12
Table 2–3. Total Spending by Function(Outlays, in billions of dollars)
Function Actual Estimate
1998 1999 2000 2001 2002 2003 2004 2005 2006
National defense . . . . . . . . 268 274 294 299 319 322 333 347 354
International affairs . . . . . . . 13 15 17 17 21 21 21 22 22
General science,space, and technology . . . 18 18 19 20 21 21 22 23 23
Energy . . . . . . . . . . . . . . . . 1 1 −1 −1 −* −* −1 −* −*
Natural resourcesand environment . . . . . . . 22 24 25 27 27 28 28 28 29
Agriculture . . . . . . . . . . . . . 12 23 37 26 19 15 14 14 14
Commerce andhousing credit . . . . . . . . . 1 3 3 −1 7 5 4 4 2
Transportation . . . . . . . . . . . 40 43 47 51 55 57 60 62 64
Community andregional development . . . . 10 12 11 11 12 11 11 10 10
Education, training,employment, andsocial services . . . . . . . . . . 55 56 59 65 77 81 83 85 87
Health . . . . . . . . . . . . . . . . 131 141 155 175 202 224 243 251 265
Medicare . . . . . . . . . . . . . . 193 190 197 219 230 242 256 283 296
Income security . . . . . . . . . . 233 238 248 263 276 286 296 309 317
Social security . . . . . . . . . . . 379 390 409 434 455 477 502 528 557
Veterans benefitsand services . . . . . . . . . . . 42 43 47 45 52 54 56 60 60
Administration of justice . . . . . . . . . . . . . . . 23 26 28 29 32 35 35 35 36
General government . . . . . . 16 16 13 17 16 17 18 17 18
Net interest . . . . . . . . . . . . . 241 230 223 206 188 175 161 145 127
Allowances . . . . . . . . . . . . . . . . . . . . . . . . 2 4 5 5 6
Undistributed offsettingreceipts . . . . . . . . . . . . . . −47 −40 −43 −48 −49 −60 −71 −59 −62
Total . . . . . . . . . 1,653 1,703 1,789 1,856 1,961 2,016 2,077 2,169 2,224
* $500 million or less.
Note: Spending that is shown as a minus means that receipts exceed outlays.Note:
02_guide.qxd 3/30/2001 2:58 PM Page 12

13
Table 2–4. Discretionary Budget Authority by Agency(In billions of dollars)
Agency Actual Estimate1998 1999 2000 2001 2002 2003 2004 2005 2006
Legislative Branch . . . . . . . . . . . 2 3 3 3 3 3 3 3 3
Judicial Branch . . . . . . . . . . . . . 3 3 4 4 5 5 5 5 5
Agriculture . . . . . . . . . . . . . . . . 16 16 17 19 18 19 19 19 20
Commerce . . . . . . . . . . . . . . . . 4 5 9 5 5 5 5 5 6
Defense-Military . . . . . . . . . . . . . 260 275 287 296 310 319 328 337 347
Education . . . . . . . . . . . . . . . . . 30 29 29 40 45 46 47 48 49
Energy . . . . . . . . . . . . . . . . . . . 17 18 18 20 19 20 20 21 21
Health and Human Services . . . . 37 42 45 54 57 62 63 65 67
Housing and Urban Development 20 22 21 28 30 32 33 35 36
Interior . . . . . . . . . . . . . . . . . . . 8 8 8 10 10 10 10 10 11
Justice . . . . . . . . . . . . . . . . . . . . 18 18 19 21 20 22 22 22 23
Labor . . . . . . . . . . . . . . . . . . . . 11 11 9 12 11 12 12 12 13
State . . . . . . . . . . . . . . . . . . . . . 6 8 8 8 9 9 9 10 10
Transportation . . . . . . . . . . . . . . 13 14 14 18 16 17 18 18 18
Treasury . . . . . . . . . . . . . . . . . . 11 13 13 14 15 15 15 16 16
Veterans Affairs . . . . . . . . . . . . . 19 19 21 22 23 24 24 25 26
Corps of Engineers . . . . . . . . . . . 4 4 4 5 4 4 4 4 4
Other Defense Civil Programs . . . * * * * * * * * *
Environmental Protection Agency. 7 8 8 8 7 7 8 7 7
Executive Office of the President . * * * * * * * * *
Federal Emergency ManagementAgency . . . . . . . . . . . . . . . . . 3 3 4 2 2 2 2 2 2
General Services Administration . . * 1 −* * 1 1 1 1 1
International Assistance Programs . 11 31 14 13 13 13 13 14 14
National Aeronautics and Space
Administration . . . . . . . . . . . . 14 14 14 14 15 15 15 16 16
National Science Foundation . . . 3 4 4 4 4 5 5 5 5
Office of Personnel Management . * * * * * * * * *
Small Business Administration . . . 1 1 1 * 1 1 1 1 1
Social Security Administration . . . 5 5 6 6 6 7 7 7 7
Other Independent Agencies . . . 6 6 6 6 6 6 6 6 6
Allowances . . . . . . . . . . . . . . . . . . . . . . . . . . . . . . . . . . . . 5 5 6 6 6
Total . . . . . . . . . . . . . . . 530 582 584 635 661 685 703 720 738
* $500 million or less.
Notes: Discretionary budget authority is appropriated by Congress each year, in contrast to mandatory
authority, which is automatic under permanent law. For a more complete discussion of discretionary appropriations, see ``Action in Congress’’ in Chapter 3.Budget authority that is shown as a minus means that receipts exceed budget authority.
Note
02_guide.qxd 3/30/2001 2:58 PM Page 13

14
0
100
200
300
400
500
Dollars in billions
Unified Budget Surplus
On-Budget Surplus
Off-Budget Surplus(Reserved for Social Security)
Chart 2–9. On- and Off-Budget Surplus Projections
Social Security is running large surpluses right now, because payrolltaxes were raised dramatically in the early 1980s and because the relativelylarge “baby-boom” generation is big enough to provide the Social Securitybenefits provided to the relatively small generation of current retirees. Thesesurpluses have held down the unified deficit by offsetting part of the deficit inthe on-budget accounts. When the unified budget first booked a surplus of$69 billion in 1998, the on-budget accounts were still in deficit by $30billion. In 1999, the unified budget ran a $125 billion surplus, nearly all ofwhich was the result of the Social Security surplus. The on-budget accountswere almost exactly in balance. For 2002, $59 billion of the estimated $231billion surplus comes from the on-budget accounts.
Under the President’s proposals, the entire Social Security surplus would besaved and set aside for Social Security and debt reduction. The President’soverall budgetary framework is discussed in Chapter 5.
Chart 2–9 illustrates the relationship between on- and off-budget items, andthe unified budget.
02_guide.qxd 3/30/2001 2:58 PM Page 14
15
3. How Does the Government Createa Budget?
The President and Congress both play major roles in developing the Federalbudget.
The President’s Budget
The law specifies that, by the first Monday in February, the President submitto Congress his proposed Federal budget for the next fiscal year, whichbegins October 1.
In some years, it is not possible for the President to adhere to the normalschedule. The law does not require an outgoing President to transmit abudget, and it is impractical for an incoming President to complete a budgetwithin a few days of taking office. President George W. Bush submitted asummary budget plan, A Blueprint for New Beginnings—A ResponsibleBudget for America's Priorities, to Congress on February 28, 2001.
President Bush’s detailed budget—which includes a main book and severalaccompanying books1—covers thousands of pages and provides anabundance of information. These books, which were submitted in April2001, allow people from all walks of life to examine the budget from manydifferent perspectives.
Action in Congress
Congress first passes a “budget resolution”—a framework within which theMembers will make their decisions about spending and taxes. It includestargets for total spending, total revenues, and the surplus or deficit, andallocations within the spending target for the two types of spending—discretionary and mandatory—explained below.
• Discretionary spending, which accounts for one-third of all Federalspending, is what the President and Congress must decide to spend for thenext year through the 13 annual appropriations bills. It includes money for
1 They are the main budget book, entitled Budget of the United States Government:Fiscal Year 2002, as well as Analytical Perspectives, Appendix, Historical Tables, and A Citizen’s Guide to the Federal Budget, which you are now reading.
02_guide.qxd 3/30/2001 2:58 PM Page 15

16
such activities as the FBI and the Coast Guard, for housing and education,for space exploration and highway construction, and for defense and foreignaid.
• Mandatory spending, which accounts for two-thirds of all spending, isauthorized by permanent laws, not by the 13 annual appropriations bills. Itincludes entitlements—such as Social Security, Medicare, veterans’ benefits,and Food Stamps—through which individuals receive benefits because theyare eligible based on their age, income, or other criteria. It also includesinterest on the national debt, which the Government pays to individuals andinstitutions that hold Treasury bonds and other Government securities. ThePresident and Congress can change the law in order to change the spendingon entitlements and other mandatory programs—but they don’t have to.
Think of it this way: For discretionary programs, Congress and the Presidentmust act each year to provide spending authority. For mandatory programs,they may act to change the spending that current laws require.
Currently, the law imposes limits, or “caps,” through 2002 on annualdiscretionary spending. The budget proposes to revise these caps beginning in2001 to recognize changing fiscal conditions, and extend the caps atappropriate levels through 2006. Within the cap, however, the President andCongress can, and often do, change the spending levels from year to year forthe thousands of individual Federal spending programs.
In addition, the law requires that legislation that would raise mandatoryspending or lower revenues—compared to existing law—be offset by spendingcuts or revenue increases. This requirement, called “pay-as-you-go,” orPAYGO, is designed to prevent new legislation from reducing the surplus orincreasing the deficit. The budget also proposes extending the PAYGO system.
Once Congress passes the budget resolution, it turns its attention to passingthe 13 annual appropriations bills and, if it chooses, “authorizing” bills tochange the laws governing mandatory spending and revenues.
Congress begins by examining the President’s budget in detail. Scores ofcommittees and subcommittees hold hearings on proposals under theirjurisdiction. The House and Senate Armed Services Authorizing Committees,and the Defense and Military Construction Subcommittees of theAppropriations Committees, for instance, hold hearings on the President’sdefense plan. To consider the budget’s proposed changes in taxes, the HouseWays and Means and the Senate Finance Committees will hold hearings. TheBudget Director, Cabinet officers, and other Administration officials work withCongress as it accepts some of the President’s proposals, rejects others, and
02_guide.qxd 3/30/2001 2:58 PM Page 16
17
changes still others. Congressional rules require that these committees andsubcommittees take actions that are consistent with the budget resolution.
If you read through the President’s budget, the budget resolution, or theappropriations or authorizing bills that Congress drafts, you will notice thatthe Government measures spending in two ways—”budget authority” and“outlays.”
Budget authority (or BA) is what the law authorizes the Federal Governmentto spend for certain programs, projects, or activities. What the Governmentactually spends in a particular year, however, is an outlay. To see thedifference, consider what happens when the Government decides to build aspace exploration system.
The President and Congress may agree to spend $1 billion for the spacesystem. Congress appropriates $1 billion in BA. But the system may take 10years to build. Thus, the Government may spend $100 million in outlays inthe first year to begin construction and the remaining $900 million over thenext nine years as construction continues.
Monitoring the Budget
Once the President and Congress approve spending, the Governmentmonitors the budget through:
• agency program managers and budget officials, including the InspectorsGeneral, or IGs;
• the Office of Management and Budget;
• congressional committees; and
• the General Accounting Office, an auditing arm of Congress.
This oversight is designed to:
• ensure that agencies comply with legal limits on spending, and that they usebudget authority only for the purposes intended;
• see that programs are operating consistently with legal requirements andexisting policy; and
• ensure that programs are well managed and achieving the intended results.
02_guide.qxd 3/30/2001 2:58 PM Page 17

Prodded by Congress, the Executive Branch has begun to pay more attentionto good management of late, starting with the 1993 GovernmentPerformance and Results Act. This law is designed to improve Governmentprograms by using better measurements of their results in order to evaluatetheir effectiveness.
18
02_guide.qxd 3/30/2001 2:58 PM Page 18

4. The Budget Surplus and FiscalDiscipline
In 1998, the Federal budget reported its first surplus ($69 billion) since 1969.In 1999, the surplus nearly doubled to $125 billion, and then again in 2000to $236 billion. As a result of these surpluses, Federal debt held by the publichas been reduced from $3.8 trillion at the end of 1997 to $3.4 trillion at theend of 2000 and to an estimated $3.2 trillion in 2001. With continuedprudent fiscal policies, the budget can remain in surplus for many years.Under the President's budget proposals, $2.0 trillion in Federal debt held bythe public will be retired over the next 10 years—all of the debt that canresponsibly be retired.
Put simply, a surplus occurs when receipts exceed spending in any year—justas a deficit occurs when spending exceeds receipts. Generally, to finance pastdeficits, the Treasury has borrowed money. With certain exceptions, the debtis the sum total of our deficits, minus our surpluses, over the years.
The Government incurred its first deficit in 1792, and it generated 70 annualdeficits between 1900 and 1997.
Chart 4–1 provides the history of budget surpluses and deficits since 1940.
For most of the Nation's history, deficits were the result of either wars orrecessions. Wars necessitated major increases in military spending, whilerecessions reduced Federal tax receipts from businesses and individuals.
The Government generated deficits during the War of 1812, the recession of1837, the Civil War, the depression of the 1890s, and World War I. Oncethe war ended or the economy began to grow, the Government followed itsdeficits with budget surpluses, with which it paid down the debt.
Deficits returned in 1931 and remained for the rest of the decade—due tothe Great Depression and the spending associated with President Roosevelt'sNew Deal. Then, World War II forced the Nation to spend unprecedentedamounts on defense and to incur corresponding unprecedented deficits.
Since then—with Democratic and Republican Presidents, Democratic andRepublican Congresses—the Government has balanced its books only 11times, most recently last year.
19
02_guide.qxd 3/30/2001 2:58 PM Page 19

During the 1970s, large budget deficits emerged as the economy wasdisrupted by oil shocks and inflation. In the 1980s, this trend increased. By1992, the deficit reached $290 billion. Budget deficits have graduallydeclined since that high point, returning to balance in 1998. In 2000, thebudget surplus was $236 billion.
Why have we been able to move from deficit to balance? The main reasonis because strong economic growth has increased tax receipts faster than thegrowth in Federal spending. Also, the end of the Cold War allowed thegrowth in defense spending to slow.
Until recently, receipts have stayed relatively constant, at around 17 to 20percent of GDP, since the 1960s. However, strong economic growth sincethe mid-1990s has increased receipts to nearly 21 percent of GDP, thehighest level since World War II. In that same time, outlays grew from about
20
-300
-200
-100
0
100
200
300
Surplus (+)/deficit (-) in billions of dollars
Chart 4–1. Returning the Budget to Surplus
Deficits began increasing dramatically in the late 1970s and1980s, but have now been reversed.
02_guide.qxd 3/30/2001 2:58 PM Page 20

21
Chart 4–2. Constant Dollar Outlays by Category
17 percent of GDP in 1965 to nearly 24 percent in 1983 before falling to18 percent in 2000.
Nevertheless, since 1983, spending has grown dramatically across a widevariety of programs. Total spending in 2000 is 37 percent higher than in1983 in constant dollars. Medicare and Medicaid, combined, are 175percent higher and Social Security is 48 percent higher. Similarly, spendingfor net interest is 60 percent higher in 2000 than in 1983. In total,discretionary spending is six percent higher. But non-defense discretionaryspending is 30 percent higher while national defense discretionary spendingis 11 percent lower than in 1983. In recent years the growth in discretionaryspending has accelerated, especially since 1997. Between 1997 and 2000,total discretionary spending has increased five percent, with non-defensediscretionary spending increasing more than eight percent during this three-year period. (Note: all numbers adjusted for inflation). (See Chart 4–2.)
0
250
500
750
1,000
1,250
1,500
1,750
Constant FY 1996 dollars in billions
Non-Defense Discretionary
National Defense
Other Mandatory
Medicare/Medicaid
Social Security
Net Interest
Between 1966 and 2000, spending on Social Security,Medicare and Medicaid, and interest grew, while spending on
defense fell.
02_guide.qxd 3/30/2001 2:58 PM Page 21

22
Why a Budget Surplus is Important
As Chart 4–3 illustrates, this Nation has a good record when compared tothe recent history of four other major developed economies. (To makeaccurate comparisons with the governments of other nations, the U.S. datainclude the activities of State and local governments.)
The 2002 Budget forecasts surpluses for decades to come if we maintain apolicy of fiscal discipline.
Should we worry about the possibility of a return to budget deficits?
Deficits increase the Federal debt and, with it, the Government's obligationto pay interest. The more it must pay in interest, the less it has available tospend on education, defense, law enforcement, and other important services,
Chart 4–3. Total Government Surplus or Deficit as a Percentof GDP
1983 1985 1987 1989 1991 1993 1995 1997 1999
-10%
-5%
0%
5%
Source: Organization for Economic Cooperation and Development (OECD), calendar year data.
United Kingdom
Canada
Germany
United States
Japan
Surplus (+)/deficit (-) in billions of dollars
Of the five nations shown above, only the United States,Canada, and the United Kingdom eliminated their total
government budget deficits in recent years.
02_guide.qxd 3/30/2001 2:58 PM Page 22

or the more it must collect in taxes. As recently as 1997, the Governmentspent more than 15 percent of its budget to pay interest, in contrast to lessthan 10 percent projected for 2002. The President’s budget will reduce theseinterest payments dramatically in the next 10 years.
In the end, the surplus is a decision about our future. We can provide a solidfoundation for future generations, just as parents try to do within a family.For a Nation, this means a strong economy and low interest rates and debt.Alternatively, we can generate large deficits and debt for those who comeafter us.
Surplus and Debt
If the Government incurs a surplus, it generally repays debt held by the public.
Table 4–1 summarizes the relationship between the budget surplus and therepayment of Federal debt.
Federal borrowing involves the sale, to the public, of notes and bonds ofvarying sizes and time periods until maturity. The cumulative amount ofborrowing from the public—i.e., the debt held by the public—is the mostimportant measure of Federal debt because it is what the Government hasborrowed in the private markets over the years, and it determines how muchthe Government pays in interest to the public.
23
Table 4–1. Federal Government Financing and Debt(In billions of dollars)
2000 EstimateActual 2001 2002 2003 2004 2005 2006
Federal Government financing:
Unified budget surplus . . . . . . . . . . . . . 236 281 231 242 262 269 305On-budget surplus/reserve
for contingencies 1 . . . . . . . . . . . . 87 125 59 49 52 32 52
Off-budget surplus . . . . . . . . . . . . . . 150 156 172 193 211 237 252
Financing other than the change in debtheld by the public . . . . . . . . . . . . −13 −45 −4 −15 −16 −15 −14
Amount available to repay debt heldby the public; . . . . . . . . . . . . . . 223 236 227 227 246 254 291
Federal Government debt:Debt subject to legal limit . . . . . . . . . . . 5,592 5,588 5,627 5,688 5,749 5,822 5,881Gross Federal debt . . . . . . . . . . . . . . . . 5,629 5,625 5,664 5,724 5,784 5,856 5,913
Debt held by Government accounts. . 2,219 2,451 2,717 3,004 3,310 3,636 3,985Debt held by the public . . . . . . . . . . . 3,410 3,174 2,947 2,720 2,473 2,219 1,928
1 The actual amount of annual debt retirement will vary depending upon the availability of eligibleredeemable debt, and the use, if any, of the contingency reserve.
02_guide.qxd 3/30/2001 2:58 PM Page 23

24
Debt held by the public was $3.4 trillion at the end of 2000—roughly the neteffect of deficits and surpluses over the last 200 years. Debt held by the publicdoes not include debt the Government owes itself—the total of all trust fundsurpluses and deficits over the years, like the Social Security surplus, whichthe law says must be invested in Federal securities.
Because the large budget deficit has been turned into a surplus, the debt heldby the public was reduced for three years in a row, for the first time since1947–1949.
The sum of debt held by the public and debt the Government owes itself iscalled Gross Federal Debt. At the end of 2000, it totaled $5.6 trillion.
Another measure of Federal debt is debt subject to legal limit, which is similarto Gross Federal Debt. When the Government reaches the limit, it loses itsauthority to borrow more to finance its spending; then the President andCongress must either reduce the debt by raising receipts or reducingspending, or enact a law to increase the limit. Because the budget hasreturned to surplus and publicly held debt is being reduced, there will be noneed to increase the statutory limit in 2002.
The Government's ability to finance its debt is tied to the size and strength ofthe economy, or GDP. Debt held by the public was 35 percent of GDP at theend of 2000. As a percentage of GDP, debt held by the public was highestat the end of World War II, at 109 percent, then fell to 24 percent in 1974before gradually rising to a peak of 49 percent in the middle 1990s.
That decline, from 109 to 24 percent, occurred because the economy grewfaster than the debt accumulated; debt held by the public rose from $242billion to $344 billion in those years, but the economy grew faster.
Individuals and institutions in the United States hold about two-thirds of debtheld by the public. The rest is held in foreign countries.
02_guide.qxd 3/30/2001 2:58 PM Page 24

25
5. THE PRESIDENT’S 2002 BUDGET
A budget is much more than a collection of numbers. A budget is areflection of a nation’s priorities, needs, and promise. With this budget Iam confident that we can make a great Nation even better. In the midstof this budget’s heft and detail, there is a vision for a better and moreprosperous America.—President George W. Bush
President George W. Bush’s 2002 Budget is shaped around a clearly definedgoal —the belief that Government should be activist but limited. Governmentcannot create a strong economy, but it can create the conditions that permita free citizenry to do so.
At the same time, Government must also learn from the private sector,finding ways to increase efficiency and customer satisfaction. The President’sBudget moderates the rapid growth of discretionary spending that began withthe arrival of budget surpluses in 1998 while funding key Federal priorities ineducation, health, environment, and other programs.
Thematic Highlights of President Bush’s 2002 Budget
• Funds the Nation’s spending priorities. For example, the budgetstrengthens and reforms education, granting the Education Department thelargest percentage spending increase of any department (11.5 percentincrease in 2002).
• Moderates recent explosive growth in discretionary spending to 4.0 percentgrowth in 2002, an increase of $26 billion over 2001.
• Achieves historic levels of debt reduction, retiring the maximum amount ofdebt possible over 10 years ($2 trillion).
• Allocates projected $5.6 trillion surplus over 10 years. Breakdown ofsurplus:
—Saves all of Social Security surplus ($2.6 trillion) for Social Security and commits to reforming the program.
—Lets taxpayers keep roughly one-fourth of the surplus they produced($1.6 trillion over 10 years).
02_guide.qxd 3/30/2001 2:58 PM Page 25

26
—Creates an unprecedented $1.0 trillion reserve for additional needs andcontingencies.
• Modernizes and reforms Medicare, and spends every penny of Medicaretax and premium collections over the next 10 years only on Medicare.
• Restores commitment to military personnel and begins transition to a21stCentury force structure.
• Champions compassionate conservatism by supporting the critical rolethat faith-based and community organizations play in helping people at thelocal level.
• Saves taxpayers billions of dollars by making reductions in one-timespending, unjustified programs, duplicative programs, and programsthat have completed their mission in 2002.
The President’s Policy Priorities
The President’s Budget, which is balanced for 10 consecutive years, fundsAmerica’s priorities, retires an unprecedented $2 trillion in debt, providesneeded tax relief for everyone who pays income taxes, revitalizes education,reforms and modernizes Social Security and Medicare, brings defense strate-gy and spending in line with the challenges of the next half-century, supportsfaith-based and community outreach efforts, moderates Government spend-ing growth to a reasonable four percent, and establishes a first-ever $1 trillion contingency fund for unexpected needs.
• The President’s Budget commits to using today’s surpluses to reducethe Federal Government’s publicly held debt so that future generationsare not shackled with the responsibility of paying for the currentgeneration’s overspending. It commits to an unprecedented amount ofdebt retirement—$2 trillion in debt over the next 10 years and reducesFederal debt as a share of the economy to the lowest level in a century.
• The President’s Budget proposes a bold and fair tax relief plan that willreduce the inequities of the current tax code and help ensure thatAmerica remains prosperous. This tax relief plan promotes the values thatmake the American economy second to none—access to the middle class,family, equal opportunity, and the entrepreneurial spirit. This plan willreduce taxes for everyone who pays income taxes, and it will encourageenterprise by lowering marginal tax rates.
02_guide.qxd 3/30/2001 2:58 PM Page 26

27
• The Administration believes that every young American should have theopportunity to go to a good school and acquire the skills that will beneeded to advance in today’s high technology society. Today, America’spublic schools serve some children well. But some schools clearly do notteach adequately, nurture consistently, or offer a fair start in life. Membersof both parties and both Houses of Congress agree that Federal educationdollars should be spent in ways that restore local control; encourages Statesto set high standards; hold schools accountable for improving studentachievement, including by measuring achievement through frequentassessment; improve the quality of classroom instruction and school safety;and, where a school persistently fails, assist parents in finding betteroptions. Some education initiatives in this budget originated on one sideof the political aisle, some on the other. All stress results over promisesand accountability over process. Federal spending is a small part ofAmerica’s total education spending. The President’s Budget declares thatthe Federal Government must not spend for spending’s sake. This budgetputs together an education program and budget that ensures that “no childis left behind.”
• The President’s Budget shores up Social Security’s finances so that thisprogram can continue to provide retirement security for all futureretirees. Today, the Social Security program is in surplus. Beginningaround 2016, beyond the Government’s 10-year planning horizon, theprogram will begin to run a cash deficit. After 2038, the trust fund will bedepleted and payroll taxes at that time will cover only 73 percent ofpromised benefits. Returns have declined to such a point that futureretirees would do two or three times better if they invested their SocialSecurity taxes in low risk securities. Unless Social Security is reformed,many young people of following generations might not get back fromSocial Security what they put in. Social Security could be a losingproposition for them. Reform must make Social Security a sound programfor tomorrow’s retirees. The cost of saving Social Security goes up withevery passing year, and our ability to improve returns on total contributionsgoes down. With this budget, the Administration commits itself to workingwith both parties and Houses of Congress to fix Social Security now.
• The President is committed to shoring up Medicare’s finances as well,while providing better, more efficient coverage for our seniors.Medicare is already spending more than it takes in. Medicare spendingalready exceeds taxes and premiums by $66 billion this year. That willgrow to $216 billion (constant dollars) by 2020. The antiquated divisionof the program into hospital and non-hospital pieces does not encourage
02_guide.qxd 3/30/2001 2:58 PM Page 27

efficient medical care. Medicare has not adapted to 21st Centurymedicine. Medicare is often slow to incorporate new technologies andmethods of delivering health care. In addition, although medical careincreasingly relies on pharmaceuticals, it lacks prescription drug coverage.As in virtually all fields, technological and entrepreneurial innovation areamong the keys to creating more value for the dollar in health care.Reform that works for patients must make room for such innovation.Reform should expand patients’ choices—not restrict them. This budgetinitiates the process of Medicare modernization and delivers immediaterelief on prescription drugs for our neediest seniors.
• The Administration is committed to enhancing our national security.Today our Nation faces no major foreign adversary. Our military isunquestionably the strongest on earth. And yet our forces are deployedaround the world maintaining peace and keeping a watchful eye on ournational interests with increasing frequency. These deployments havecreated some stress on our military. To boost the morale of thesededicated men and women, the President’s budget will, in addition to thewell-deserved pay raises earned each year, include an additional $1.4billion to ensure better compensation for our troops. The budget alsoincludes $3 billion in additional funding to improve military housing andincrease research and development.
Furthermore, the United States must develop a strategic vision for the 21stCentury national security agenda that will inform research, development,and procurement decisions for the next generation of defense systems.This budget begins the process of force re-examination. And it commitsAmerica to developing, designing, and building a national missile defenseas fast as possible.
• The President’s plan will support community and faith-based efforts tohelp needy Americans. Today, Federal funds are denied to many faith-based and other community-based programs that have succeeded inhelping people curb criminal behavior, conquer addiction, strengthenfamilies, and overcome poverty.
Federal policy should become outcome-based, insisting on success andsteering resources to the effective and to the inspired. Federal tax policymust spark an outpouring of private philanthropy in America, spurringbillions more annually in charitable giving to neighborhood-serving groups,both sacred and secular. The Government must heed the growingconsensus across America that successful Government programs can workin fruitful partnership with community-serving and faith-based
28
02_guide.qxd 3/30/2001 2:58 PM Page 28

29
organizations, whether run by Methodists, Muslims, Mormons, or goodpeople of no faith at all. The United States must observe the bedrockprinciples of pluralism, nondiscrimination, evenhandedness, and neutrality.With this budget, private and charitable groups, including religious ones,will have the fullest opportunity permitted by law to compete on a levelplaying field for Federal funds, so long as they achieve valid publicpurposes. With this budget, the Federal Government rallied and supportsthese armies of compassion across America.
Additional Budget Highlights
• K-12 Education. Increases funding for elementary and secondary educationby $1.9 billion in 2002 over 2001 funding.
• Reading. Fully funds the President’s Reading First initiative, including EarlyReading First, at $975 million in 2002, more than tripling funding forreading.
• Medicare. Sets aside $153 billion over the next 10 years for the ImmediateHelping Hand initiative and Medicare modernization.
• National Institutes of Health (NIH). Continues commitment to double NIH,by providing a $2.8 billion increase, the largest annual funding increase inNIH’s history.
• WIC. Funds the Special Supplemental Nutrition Program for Women,Infants, and Children (WIC) at 7.25 million individuals a month,maintaining current program level.
• Conservation. Provides the highest ever request for the Land and WaterConservation Fund—fully funding the program at $900 million.
• Energy Assistance. Nearly doubles the existing Weatherization AssistanceProgram providing an increase of $1.4 billion over 10 years.
• Community Health Centers. Launches a doubling of the number of peopleserved by Community Health Centers by adding 1,200 sites.
• Provides tax relief to all Americans who pay income tax.
• Reduces the marriage penalty.
• Ends the death tax.
• Tax incentives. Provides other tax incentives for education, farmers, thedisabled, health care, the environment, and charitable purposes.
02_guide.qxd 3/30/2001 2:58 PM Page 29

30
• National Defense. Provides a $14 billion increase in Department of Defensespending in 2002 to begin to arrest the decline in national security,including $1.4 billion for military compensation to improve quality of lifeand reenlistment and retention of military personnel, $2.6 billion forresearch and development for new technologies (including missile defensealternatives), and $400 million to improve housing for our militarymembers and their families.
• Veterans’ Assistance: Increases funding to $1.1 billion to fully implementlegislation that will assist in the processing of veterans’ disability claims.
• International Security. Improves embassy security overseas, adding $1.2billion.
The time for bold action is now. We have the unprecedented opportuni-ty to fund our national priorities, reform critical programs, pay off all ofthe Federal debt that makes sense to, and provide needed tax relief. Ipresent this budget in the spirit of cooperation and with the great expec -tation that the will of the people and the needs of the Nation will guideour deliberations and lead us to success.—President George W. Bush
02_guide.qxd 3/30/2001 2:58 PM Page 30

Glossary
Appropriation
An appropriation is an act of Congress that enables Federal agencies tospend money for specific purposes.
Authorization
An authorization is an act of Congress that establishes or continues aFederal program or agency, and sets forth the guidelines to which it mustadhere.
Balanced Budget
A balanced budget occurs when total revenues equal total outlays for afiscal year.
Budget Authority (BA)
Budget authority is what the law authorizes, or allows, the FederalGovernment to spend for programs, projects, or activities.
Budget Enforcement Act (BEA) of 1990
The BEA is the law that was designed to limit discretionary spendingwhile ensuring that any new entitlement program or tax cuts did notmake the deficit worse. It set annual limits on total discretionary spendingand created “pay-as-you-go’’ rules for any changes in entitlements andtaxes (see “pay-as-you-go’’).
Balanced Budget and Emergency Deficit Control Act of 1985(Gramm-Rudman-Hollings, or GRH)
The Balanced Budget and Emergency Deficit Control Act of 1985 wasdesigned to end deficit spending. It set annual deficit targets for fiveyears, declining to a balanced budget in 1991. If necessary, it requiredacross-the-board cuts in programs to comply with the deficit targets. Itwas never fully implemented.
Budget Resolution
The budget resolution is the annual framework within which Congressmakes its decisions about spending and taxes. This framework includestargets for total spending, total revenues, and the deficit, as well as
31
02_guide.qxd 3/30/2001 2:58 PM Page 31

allocations, within the spending target, for discretionary and mandatoryspending.
“Cap’’
A “cap’’ is a legal limit on annual discretionary spending.
Deficit
The deficit is the difference produced when spending exceeds revenuesin a fiscal year.
Discretionary Spending
Discretionary spending is what the President and Congress must decideto spend for the next fiscal year through 13 annual appropriations bills.Examples include money for such activities as the FBI and the CoastGuard, housing and education, space exploration and highwayconstruction, and defense and foreign aid.
Entitlement
An entitlement is a program that legally obligates the FederalGovernment to make payments to any person who meets the legalcriteria for eligibility. Examples include Social Security, Medicare, andMedicaid.
Excise Taxes
Excise taxes apply to various products, including alcohol, tobacco,transportation fuels, and telephone service.
Federal Debt
The gross Federal debt is divided into two categories: debt held by thepublic, and debt the Government owes itself. Another category is debtsubject to legal limit.
Debt Held by the Public
Debt held by the public is the total of all Federal deficits, minus surplus,over the years. This is the cumulative amount of money the FederalGovernment has borrowed from the public, through the sale of notesand bonds of varying sizes and time periods until maturity.
Debt the Government Owes Itself
Debt the Government owes itself is the total of all trust fund surplusesover the years, like the Social Security surplus, that the law says mustbe invested in Federal securities.
32
02_guide.qxd 3/30/2001 2:58 PM Page 32
Debt Subject to Legal Limit
Debt subject to legal limit, which is roughly the same as gross Federaldebt, is the maximum amount of Federal securities that may be legallyoutstanding at any time. When the limit is reached, the President andCongress must enact a law to increase it.
Fiscal Year
The fiscal year is the Government’s accounting period. It begins October1 and ends on September 30. For example, fiscal 2002 ends September30, 2002.
Gramm-Rudman-Hollings
See Balanced Budget and Emergency Deficit Control Act of 1985.
Gross Domestic Product (GDP)
GDP is the standard measurement of the size of the economy. It is thetotal production of goods and services within the United States.
Mandatory Spending
Mandatory spending is authorized by permanent law. An example isSocial Security. The President and Congress can change the law tochange the level of spending on mandatory programs—but they don’thave to.
“Off-Budget’’
By law, the Government must distinguish “off-budget’’ programsseparate from the budget totals. Social Security and the Postal Serviceare “off-budget.’’
“On-Budget’’
Those programs not legally designated as off-budget.
Outlays
Outlays are the amount of money the Government actually spends in agiven fiscal year.
“Pay-As-You-Go’’
Set forth by the BEA, “pay-as-you-go’’ refers to requirements that newspending proposals on entitlements or tax cuts must be offset by cuts inother entitlements or by other tax increases, to ensure that the deficitdoes not rise (see BEA).
33
02_guide.qxd 3/30/2001 2:58 PM Page 33

Receipt
This is another word for revenue.
Revenue
This is another word for receipt. Revenues include the collections thatresult from Government activity, such as taxes. They do not includecollections that result from the Government’s business-like activities, suchas the entrance fees at national parks. Business-like collections aresubtracted from total spending to calculate outlays for the year.
Social Insurance Payroll Taxes
This tax category includes Social Security taxes, Medicare taxes,unemployment insurance taxes, and Federal employee retirementpayments.
Surplus
A surplus is the amount by which revenues exceed outlays.
Trust Funds
Trust funds are Government accounts, set forth by law as trust funds, forrevenues and spending designated for specific purposes.
Unified Federal Budget
The unified budget, the most comprehensive display of theGovernment’s finances, is the presentation of the Federal budget inwhich revenues from all sources and outlays to all activities areconsolidated.
34
02_guide.qxd 3/30/2001 2:58 PM Page 34

List of Charts and Tables
List of Charts Page
What Is the Budget?
1–1 Government Spending as a Share of GDP, 2000 . . . . . . . . . . 2
Where the Money Comes From—and Where It Goes
2–1 Family Budgeting . . . . . . . . . . . . . . . . . . . . . . . . . . . . . . . . 3
2–2 National Budgeting. . . . . . . . . . . . . . . . . . . . . . . . . . . . . . . 4
2–3 The Federal Government Dollar—Where It Comes From . . . . . 5
2–4 Individual Income Taxes as a Share of GDP at Record High . . . 7
2–5 Constant Dollar Revenue Growth . . . . . . . . . . . . . . . . . . . . . 7
2–6 Composition of Revenues . . . . . . . . . . . . . . . . . . . . . . . . . . 8
2–7 How Your Tax Dollar is Used . . . . . . . . . . . . . . . . . . . . . . . . 9
2–8 Constant Dollar Spending Growth . . . . . . . . . . . . . . . . . . . . 11
2–9 On- and Off-Budget Surplus Projections . . . . . . . . . . . . . . . . 14
The Budget Surplus and Fiscal Discipline
4–1 Returning the Budget to Surplus . . . . . . . . . . . . . . . . . . . . . 20
4–2 Constant Dollar Outlays by Category . . . . . . . . . . . . . . . . . . 21
4–3 Total Government Surplus or Deficit as a Percent of GDP . . . . 22
List of Tables Page
Where the Money Comes From—and Where It Goes
2–1 Revenues by Source—Summary . . . . . . . . . . . . . . . . . . . . . . 6
2–2 Spending Summary . . . . . . . . . . . . . . . . . . . . . . . . . . . . . . 11
2–3 Total Spending by Function . . . . . . . . . . . . . . . . . . . . . . . . . 12
2–4 Discretionary Budget Authority by Agency. . . . . . . . . . . . . . . 13
The Budget Surplus and Fiscal Discipline
4–1 Federal Government Financing and Debt. . . . . . . . . . . . . . . . 23
35
02_guide.qxd 3/30/2001 2:58 PM Page 35

ORDER FORM
MAIL ORDER FORM To:
Superintendent of DocumentsU.S. Government Printing OfficeWashington, DC 20402
Enclosed find $...........................(Check or money order payable to the Superintendent of Documents)(Please do not send cash or stamps.)Please send me the publications I have indicated.
Please charge this orderto my Deposit Account
Deposit Account Number
Name............................................................................................... ..........................................................................................
Street address...........................................................................................................................................................................
City and State............................................................................................................. ZIP Code ............................................
Credit Card Orders OnlyTotal charges $________ Fill in the boxes below.
CreditCard No.
Expiration Date (Month/Year)
No. ofcopies PUBLICATIONS Price
per copy Total cost
............ The Bud get of the United States Gov ern ment,FY 2002, S/N 041-001-00552-8................................................. $44.00 ..............
............ The Bud get of the United States Gov ern ment,FY 2002-Appendix, S/N 041-001-00553-6 ........................... $64.00 ..............
............ An a lyt i cal Per spec tives, FY 2002, S/N 041-001-00554-4 ................................................................................................... $49.00 ..............
............ His tor i cal Ta bles, FY 2001, S/N 041-001-00555-2........... $36.00 ..............
............ A Cit i zen’s Guide to the Fed eral Bud get, FY 2002,S/N 041-001-00556-1 ...................................................................... $3.50 ..............
............ The Bud get Sys tem and Con cepts, FY 2002,S/N 041-001-00557-9 ...................................................................... $3.00 ..............
............ The Bud get on CD-ROM, FY 2002, S/N 041-001-00558-7 ...................................................................... $19.00 ..............
To tal .......................................................................................................... ................ ..............
CHECK HERE IF YOU WISH TO RECEIVE PRIORITY ANNOUNCEMENTS OFFUTURE BUDGET PUBLICATIONS.
FOR OFFICE USE ONLYQuantity Charges
................Publications .....................
................Subscriptions .....................
Spe cial ShippingCharges.. .....................
In ter na tional Han dling ....... .....................
Spe cial Charges................ .....................
OPNR ................................ .....................
...................................UPNS ..................................Balance Due ..................................Discount ..................................Refund
All prices include regular domestic postge and handling and are good through October 2001.After this date, please call the Order and Information Desk at (202) 512-1800 to verify prices. To fax your orders and inquiries—(202) 512-2250.
—
There is a 25% discount on all orders for 100 or more copies of a single title mailed to a single address. Nodiscount is allowed if such orders are mailed tomultiple addresses.