uranium contamination of the aral sea
TRANSCRIPT

Journal of Marine Systems 76 (2009) 322–335
Contents lists available at ScienceDirect
Journal of Marine Systems
j ourna l homepage: www.e lsev ie r.com/ locate / jmarsys
Uranium contamination of the Aral Sea
Jana FriedrichAlfred Wegener Institute for Polar and Marine Research, Am Handelshafen 12, D-27570 Bremerhaven, Germany
a r t i c l e i n f o
E-mail address: [email protected]
0924-7963/$ – see front matter © 2008 Elsevier B.V.doi:10.1016/j.jmarsys.2008.03.020
a b s t r a c t
Article history:Received 16 February 2007Received in revised form 11 November 2007Accepted 12 March 2008Available online 16 August 2008
Located in an endorrheic basin, the Aral Sea is mainly fed by water from two large rivers, theSyrdarya and the Amudarya. As a result, contaminants in dissolved and suspended formdischarged by the rivers are accumulating in the lake. The northern Small Aral water contained37 µg l−1 uranium and water in the western basin of the Large Aral up to 141 µg l−1 uranium in2002, 2004 and 2006. The present day uranium concentrations in Aral Sea water mainlyoriginate from the Syrdarya River due to uraniummining and tailings in the river watershed, andhave been elevated up to 5 times compared to the pre-desiccation times by the ongoingdesiccation in the western basin of the Large Aral. Current data indicate that groundwater doesnot seem to contribute much to the uranium budget. The uranium concentration in the lake iscontrolled by internal lake processes. Due to the high ionic strength of the Aral Seawater uraniumis kept soluble. 238U/Cl− mass ratios range from 5.88 to 6.15 µg g−1 in the Small Aral and from 3.00to 3.32 µg g−1 in the Large Aral. Based on the 238U/Cl− mass ratios, a removal rate of 8% uraniumfrom the water column inventory to the sediments has been estimated for anoxic waters, and itranges between 2% and 5% in oxic waters, over periods of time without mixing. Most of theuranium removal seems to occur by co-precipitation with calcite and gypsum both in anoxic andoxic waters. According to simulations with PHREEQC, uraninite precipitation contributes little tothe removal from anoxic Aral Sea water. In most of the sampled locations, water column removalof uranium matches the sediment inventory. Based on budget calculations, the futuredevelopment of uranium load in the Aral Sea has been estimated for different scenarios. If theSyrdarya River discharge is below or in balance with the loss by evaporation, the uraniumconcentration in the Small Aral will increase from 37 µg l–1to 55 µg l−1 in 20 years time.When theriver discharge is larger than loss by evaporation, present-day uranium concentration in the lakemay be kept at the current level or even decrease slightly. From the ecotoxicological point of view,an increase in Syrdarya River discharge as the major water source will be crucial for the waterquality of the Small Aral, despite its high uranium load. However, as it is intended to restorefishery in the Small Aral, accumulation of uranium in fish has to be monitored. Since the westernbasin of the LargeAral receivednoSyrdarya Riverwater since 2005, andmaybecomedisconnectedfrom the eastern basin, the slightly higher observed uranium removal from anoxic waters mayresult in a decrease in uranium concentrations in the western basin by 20% in 20 years time.
© 2008 Elsevier B.V. All rights reserved.
Keywords:UraniumDesiccationWater qualitySustainable water managementAral SeaSyrdarya River
1. Introduction
The Aral Sea is an inland water body that experienceddramatic shrinkage in water volume since the 1960's due towater diversion for intensive irrigation from the two main
e.
All rights reserved.
inflowing rivers, the Syrdarya (Jaxartes) and the Amudarya(Oxus). All input of surface water into the lake comes via thosetwo rivers. The Syrdarya originates in the Tien Shanmountains,the Amudarya in the Pamir Mountains. The watersheds of bothrivers cover together about 530,000 km2. River discharge to theAral Sea decreased by a factor of 13 since the 1960s; froma totalof 56km3per year to about 4.2 km3per year in the 1980s. Beforethe decrease, the Amudarya contributed 5 times more water

323J. Friedrich / Journal of Marine Systems 76 (2009) 322–335
than the Syrdarya, whereas in the 1980s, both rivers con-tributed anequal share [Bortnik,1996]. Today, only the SyrdaryaRiver effectively discharges into the lake. The Amudarya almostceased to contribute to thewater balance. There is considerablyuncertainty about today's river water input. According to theUzbekHydrometeorological Service river input increased in the1990's to 9 km3 annually (Zavialov, 2005). Other estimates onrecent water budgets assign 4 km3 annually to river discharge(SyrdaryaRiver),1–4km3 toprecipitation and lossof 15–25km3
annually to evaporation (Zavialov, 2005). The total groundwaterflow into the pre-desiccation Aral Sea in the 1960s wasestimated as 3.2 km3 year−1 (Chernenko, 1983), which hadbeen about 12% of the total river discharge. More recentestimates of the groundwater input into the lake vary from zeroto about 8 km3 annually (Veselov et al., 2002) and (Benduhnand Renard, 2004), respectively. The Aral Sea has no outflows.
The surface and volume shrinkage is intensified by the aridclimate in the region. The lake's surface decreased by a factorof 3.5 to 19,000 km2 in 2003, and the volume shrank by afactor of 9 to 118 km3 (Zavialov, 2005). Considering thediffering estimates of today's river input, assuming an equalcontribution of Syrdarya River water to the different parts ofthe Aral Sea and average precipitation of 2.5 km3 year−1, thewater residence time ranges between 10 and 18 years.However, as loss due to evaporation is larger than waterinput, the water balance is negative in reality. The northernpart, the Small Aral, disconnected from the Large Aral around1990. However, a part of the Syrdarya River water thatdischarged into the Small Aral continued to flow south intothe Large Aral through the Berg Strait. This outflow has nowbeen interrupted by construction of a 13 km long dam in2005. Inflowing Syrdarya River water does not divert to theLarge Aral anymore, and as a result the water level in theSmall Aral has started to rise again, while parts of the LargeAral are subject to accelerated desiccation. This has changedwater residence times and balances considerably.
The desiccation leads to environmental problems in theAral Sea basin such as decrease in ground water table,decreasing water availability for irrigation, salinization ofgroundwater and soils, and blow-off of salts from the dry seabottom. The desiccation also leads to a continuous change inthe chemical composition of the Aral Sea water itself.Dissolved substances increase in concentration as desiccationproceeds until they start to precipitate or co-precipitate. As aresult, the mineralization of the Aral Seawater increased from10 g kg−1 in the 1960's (Mirabdullayev et al., 2004) to 82 g kg−1
in the western basin in 2002 (Zavialov et al., 2003; Friedrichand Oberhänsli, 2004) and 130 g kg−1 in the eastern basin ofthe Large Aral in 2005 (Zavialov et al., 2009-this issue). Theconcentration of contaminants in Aral Sea water which enterthe lake by windblown salts and river input increase by thesame process. Heavy metal contamination of the lake waterhas its source in the rivers. The headwatershed of the Syrdaryaand Amudarya Rivers has a history of metal and uranium oremining, dating back to the early 20th century. A comprehen-sive monitoring study for radionuclides in Central Asiantransboundary rivers (NAVRUZ experiment, Barber et al.,2005) identified sources of natural radionuclides and metalsin the watershed of the Aral Sea and analysed their distribu-tion in water, soil and biomass along the river courses.Uranium ores and relatedmining and ore processing activities
at Karatau ridge and Mailuu-Suu (Kyrgyzstan), and Shyili(Kazakhstan) are themajor sources of the radionuclide load inthe Syrdarya river (Kadyrzhanov et al., 2005). Of particularconcern are tailings and dumps near Mailuu-Suu Town andRiver. They contain 2.7 million m3 of toxic material containinguranium and its decay products with a total radioactivityequivalent to about 1.1×10¹⁵ Bq (UNECE, 2001). In addition,radioactive waste was accumulated from other countries suchas former Czechoslovakia and German Democratic Republic(Vasiliev et al., 2005). The Mailuu-Suu River is a tributary tothe Syrdarya near the Ferghana Valley. High seismic activity,mud flows and runoff in the region cause infiltration of toxicmaterial into the Mailuu-Suu River. Another hotspot, theuranium deposits near Shyily, is located further downstreamthe Syrdarya River. As the mineralization and the pH in thelower course of the Syrdarya and Amudarya rivers is ratherhigh (ca. 1–2 g kg−1 with a pH of about 8 (Passell et al., 2003),uranium is largely kept in dissolved form and is dischargedinto the Aral Sea. In the 1960's, at the onset of desiccation,rivers are reported to have discharged annually 387 tons ofdissolved uranium and 258 tons of uranium in the suspendedmatter into the Aral Sea (Kochenov and Baturin, 1967).
The uranium concentration in the Syrdarya River nearKazalinsk, located close to the Aral Sea, is about 16.07 µg l−1
(Kadyrzhanovet al., 2005). This iswell above theproposedWHOguideline for drinking water of about 2 µg l−1. The elevatedconcentrations of uranium in Syrdarya Riverwater and its fate inthe Aral Sea should be of environmental concern.
The work hypothesis of this study is that the main sourceof uranium in the Aral Sea is the inflowing river water andthat the desiccation leads to accumulation of uranium in thewater column reaching ecotoxicologically critical levels. Tomy knowledge, very few studies are available on thecontamination of the Aral Sea itself with radionuclides apartfrom Kochenov and Baturin (1967), dating from Soviet times.
The aim of my paper is to identify the sources of uraniumfor the Aral Sea and to look at its pathways within the AralSea. In this way our study ties in with the already mentionedradionuclide monitoring study by Barber et al. (2005) inCentral Asian Rivers.
2. Material and methods
2.1. Site description and sampling
The Aral Sea is logistically difficult to sample. Due to theretreat of the water it requires at least a day trip from asettlement at any side of the lake to the nearest activeshoreline with an all-terrain truck through the steppe and thedried seabed, along with sufficient petrol and freshwatersupplies. The water can only be reached by transportabledinghy or raft which has to be carried over the desiccatedseabed that consists of soft salty mud. No larger boats can beused.
The northernmost sampling site, Tastubek Bay in the SmallAral, is located at the northern shore of the Small Aral (Fig. 1).Thewater depths in the Small Aral ranged in 2002 between 11and 15m. Tschebas Bay is a lagoon on the north-western edgeof the Large Aral. The lagoon is very shallow; no deeper than6 m, and has only a narrow connection with the Large Aral.Chernyshov Bay is the northern tip of the Large Aral's western
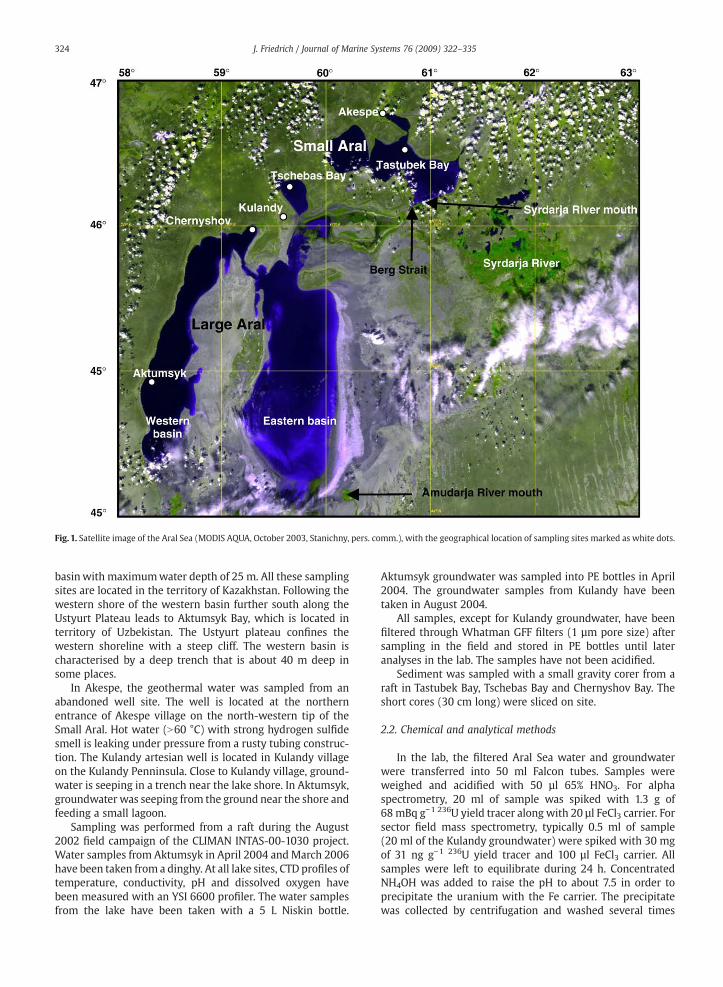
Fig. 1. Satellite image of the Aral Sea (MODIS AQUA, October 2003, Stanichny, pers. comm.), with the geographical location of sampling sites marked as white dots.
324 J. Friedrich / Journal of Marine Systems 76 (2009) 322–335
basinwith maximumwater depth of 25 m. All these samplingsites are located in the territory of Kazakhstan. Following thewestern shore of the western basin further south along theUstyurt Plateau leads to Aktumsyk Bay, which is located interritory of Uzbekistan. The Ustyurt plateau confines thewestern shoreline with a steep cliff. The western basin ischaracterised by a deep trench that is about 40 m deep insome places.
In Akespe, the geothermal water was sampled from anabandoned well site. The well is located at the northernentrance of Akespe village on the north-western tip of theSmall Aral. Hot water (N60 °C) with strong hydrogen sulfidesmell is leaking under pressure from a rusty tubing construc-tion. The Kulandy artesian well is located in Kulandy villageon the Kulandy Penninsula. Close to Kulandy village, ground-water is seeping in a trench near the lake shore. In Aktumsyk,groundwater was seeping from the ground near the shore andfeeding a small lagoon.
Sampling was performed from a raft during the August2002 field campaign of the CLIMAN INTAS-00-1030 project.Water samples from Aktumsyk in April 2004 and March 2006have been taken from a dinghy. At all lake sites, CTD profiles oftemperature, conductivity, pH and dissolved oxygen havebeen measured with an YSI 6600 profiler. The water samplesfrom the lake have been taken with a 5 L Niskin bottle.
Aktumsyk groundwater was sampled into PE bottles in April2004. The groundwater samples from Kulandy have beentaken in August 2004.
All samples, except for Kulandy groundwater, have beenfiltered through Whatman GFF filters (1 µm pore size) aftersampling in the field and stored in PE bottles until lateranalyses in the lab. The samples have not been acidified.
Sediment was sampled with a small gravity corer from araft in Tastubek Bay, Tschebas Bay and Chernyshov Bay. Theshort cores (30 cm long) were sliced on site.
2.2. Chemical and analytical methods
In the lab, the filtered Aral Sea water and groundwaterwere transferred into 50 ml Falcon tubes. Samples wereweighed and acidified with 50 µl 65% HNO3. For alphaspectrometry, 20 ml of sample was spiked with 1.3 g of68 mBq g−1 236U yield tracer along with 20 µl FeCl3 carrier. Forsector field mass spectrometry, typically 0.5 ml of sample(20 ml of the Kulandy groundwater) were spiked with 30 mgof 31 ng g−1 236U yield tracer and 100 µl FeCl3 carrier. Allsamples were left to equilibrate during 24 h. ConcentratedNH4OH was added to raise the pH to about 7.5 in order toprecipitate the uranium with the Fe carrier. The precipitatewas collected by centrifugation and washed several times
325J. Friedrich / Journal of Marine Systems 76 (2009) 322–335
with Milli-Q water. The precipitation and washing stepswere repeated twice to remove the salt load in the samples(17 to 110 g kg−1). The precipitate was then dissolved inHNO3 to a final concentration of 3 N HNO3. The samples wereloaded onto 3 N HNO3 preconditioned UTEVA Eichrom resin(UT-B50-A) columns, washed with 3 N HNO3 and 5 N HCl toremove the Fe, Ac, Ra, and Th fractions. Uranium was elutedwith 0.02 N HCl. Six representative aliquots of the water andgroundwater samples have been prepared without adding ayield tracer, to check for artificial Uranium isotopes. Foralpha spectrometry, the uranium fraction was electroplatedonto silver planchets. The silver planchets where alpha-counted for 236U, 238U and 234U on silicon surface-barrierdetectors (EG&G Ortec). Error estimates (1-sigma) representthe counting error.
For sector field mass spectrometry, the purified uraniumfractionwas dissolved in 1 N HNO3, and aspirated via an APEXnebuliser into a single-collector ICP mass spectrometer(Element 2, Thermo-Finnigan). All samples were measuredin counting mode in the sequence 234U (0.025 s), 235U(0.005 s) and 236U (0.005 s). The mass bias and detectorgain were assessed by using the 238U/235U ratio in a PTBnatural uranium standard solution. No correction for peaktailing was applied as tailing had been insignificant.
The correction of the measured 234U/235U ratio for 234Ucontained in the spike was below 1%. The (234U/238U)AR,where AR denotes activity ratio, has been calculated fromcorrected 234U/235U ratios applying a 238U/235U ratio of 137.88and half lives of 4.468×10⁹ for 238U and 2.453×10⁵ years(Lieser, 2000) for 234U. 234U has been calculated from 236U/234U ratio. 238U concentrations were calculated from mea-sured the measured 236U/235U ratio. Procedural blankscontained 0.1 ng uranium on average. The samples fromChernyshov Bay stationXI have beenmeasured for uraniumbyICP-MS (ELAN 5000 Perkin Elmer/SCIEX) at GeoForschungs-Zentrum Potsdam (GFZ).
Salt concentration in thehigh salinitywaterwasdeterminedbymeasuring themajor anions and cationswith ion chromato-graphy and ICP-OES, respectively, after diluting the sampleswith Milli-Q water by 1:100 to 1:1000. These values have beenused for an empirical relationship to convert conductivity datameasured with an YSI 6600 profiler into salinity (Friedrich andOberhänsli, 2004).When talking about the salt concentration, itwill be referred to as salt for simplicity.
In the lab, sediment samples were freeze-dried andhomogenized. After adding a yield tracer, total digestionwith HF, HNO3, HClO4 was performed on 0.1 g sediment. Thesamples were measured for uranium by ICP-MS (ELAN 5000Perkin Elmer/SCIEX) at GeoForschungsZentrum Potsdam(GFZ).
2.3. Data quality
High salt load in samples interferes with detection signalsfor most of the analytical methods. Doubts about the accuracyof our chemical data from Aral Sea water in earlier work(Friedrich and Oberhänsli, 2004) have been raised by Stanevet al. (2004). A precision test of the salt determination showedthat the ion balance of measured anions and cations deviatedonly between 0.6 and 5%. Data accuracy had been checked byparallel analysis of the water samples from Aktumsyk for
major ion composition by three different laboratories; AWI,GFZ and the Institute of Geology and Geophysics of the UzbekAcademy of Sciences. Anion analysis has been performed byion chromatography and potentiometric/volumetricmethods.Cation analysis has been performed with ICP-OES, AAS andtitration. The results from the three laboratories reveal astandard deviation for the individual anionic components ofless than 3%, for cationic components of less than 6%, and forsalt concentration of about 1%.
Supplementary to earlier counting of the samples foruranium isotopes by alpha spectrometry, water samples havebeen measured for uranium with a single-collector ICP massspectrometer (Element 2, Thermo-Finnigan). We obtained a1.2% standard deviation of the 234U/238U ratios and a 2.3%standard deviation of the uranium concentrations betweenthe two methods in parallel samples (n=11). For sedimentanalyses of uranium by ICP-MS (ELAN 5000 Perkin Elmer/SCIEX at GFZ) and alpha spectrometry the standard deviationof the individual determinations had been 10% (n=13), onaverage. For samples where parallel analyseswere performed,the ICP-MS data are listed in Table 1.
3. Results
The major ionic composition of the Aral Sea water is verydifferent from that of seawater. The SO4
2−/Cl−mass ratio rangesfrom 0.6 in the Small Aral to 1.0 in the western basin of theLarge Aral. For comparison, seawater has a SO4
2−/Cl− mass ratioof 0.05. Aral Sea water is enriched in sulphate due to itscontinental water source. In the Small Aral, the water isbrackish. In the western basin of the Large Aral salt rangesfrom 82 g kg−1 in the surface water to 110 g kg−1 near thebottom (as of 2002). A detailed account on the hydrochemicalproperties and CTD profiles of the Aral Sea water is given in(Friedrich and Oberhänsli, 2004). Uranium and water columndata are listed in Table 1.
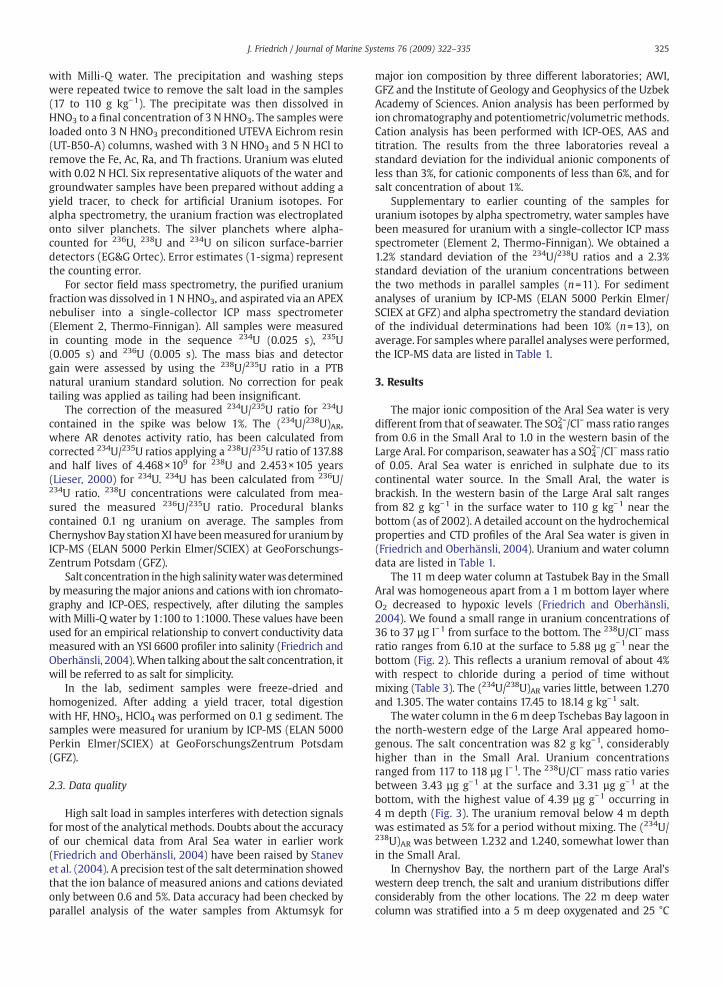
The 11 m deep water column at Tastubek Bay in the SmallAral was homogeneous apart from a 1 m bottom layer whereO2 decreased to hypoxic levels (Friedrich and Oberhänsli,2004). We found a small range in uranium concentrations of36 to 37 µg l−1 from surface to the bottom. The 238U/Cl− massratio ranges from 6.10 at the surface to 5.88 µg g−1 near thebottom (Fig. 2). This reflects a uranium removal of about 4%with respect to chloride during a period of time withoutmixing (Table 3). The (234U/238U)AR varies little, between 1.270and 1.305. The water contains 17.45 to 18.14 g kg−1 salt.
The water column in the 6 m deep Tschebas Bay lagoon inthe north-western edge of the Large Aral appeared homo-genous. The salt concentration was 82 g kg−1, considerablyhigher than in the Small Aral. Uranium concentrationsranged from 117 to 118 µg l−1. The 238U/Cl− mass ratio variesbetween 3.43 µg g−1 at the surface and 3.31 µg g−1 at thebottom, with the highest value of 4.39 µg g−1 occurring in4 m depth (Fig. 3). The uranium removal below 4 m depthwas estimated as 5% for a period without mixing. The (234U/238U)AR was between 1.232 and 1.240, somewhat lower thanin the Small Aral.
In Chernyshov Bay, the northern part of the Large Aral'swestern deep trench, the salt and uranium distributions differconsiderably from the other locations. The 22 m deep watercolumn was stratified into a 5 m deep oxygenated and 25 °C

Table 1pH, salt concentration, chlorinity, uranium concentration, uranium normalised to chlorinate, 238U and 234U activities and 234U/238U activity ratio in the water of theAral Sea, groundwaters and river waters
Location/sample Water depth(m)
pH Saltg kg−1
Chlorinityg kg−1
238Uµg l−1
2σ 238U/Cl−
µg g−1238UBq l−1
2σ 234UBq l−1
2σ (234U/238U) AR
2σ
Tastubek Bay (August 2002)46°33.212 N 60°42.054 EII-2⁎ 2 8.45 17.67 5.93 36.22 ± 0.28 6.00 0.450 ±0.003 0.584 ±0.008 1.270 ±0.020II-3⁎ 4 8.44 17.45 5.90 36.95 ± 0.29 6.15 0.460 ±0.004 0.598 ±0.008 1.300 ±0.021II-4⁎ 8 8.29 18.14 5.99 36.44 ± 0.30 5.98 0.453 ±0.004 0.582 ±0.003 1.282 ±0.013II-5⁎ 10 8.09 17.85 5.93 36.26 ± 0.34 6.01 0.451 ±0.004 0.585 ±0.005 1.272 ±0.016
46°33.164 N 60°41.890 EIII-1⁎ 0 8.49 17.54 5.98 37.15 ± 0.38 6.10 0.462 ±0.005 0.588 ±0.005 1.271 ±0.017III-2⁎ 2 8.49 17.32 5.94 36.79 ± 0.49 6.09 0.458 ±0.006 0.588 ±0.006 1.285 ±0.022III-3⁎ 4 8.49 16.95 5.92 36.65 ± 0.33 6.09 0.456 ±0.004 0.591 ±0.002 1.295 ±0.012III-4⁎ 8 8.49 16.78 5.95 36.72 ± 0.19 6.07 0.457 ±0.002 0.590 ±0.004 1.291 ±0.011III-5⁎ 10 8.34 16.72 5.98 35.78 ± 0.43 5.88 0.445 ±0.005 0.581 ±0.008 1.305 ±0.023
Tschebas Bay (August 2002)46°18.476 N 59°39.561 EV-1⁎ 0 8.24 81.64 31.65 117.49 ± 1.53 3.43 1.461 ±0.019 1.800 ±0.037 1.232 ±0.030V-2⁎ 2 8.25 82.32 31.61 118.35 ± 1.07 3.46 1.472 ±0.013 1.826 ±0.014 1.240 ±0.015V-3⁎ 4 8.26 81.88 31.35 118.23 ± 1.09 3.49 1.470 ±0.014 1.811 ±0.022 1.231 ±0.019V-4⁎ 6 8.27 84.03 32.70 117.50 ± 0.43 3.31 1.461 ±0.005 1.801 ±0.033 1.232 ±0.023
Chernyshov Bay (August 2002)45°59.333 N 59°14.288 EVIII-1⁎ 0 8.24 82.95 31.80 103.18 ± 0.60 3.00 1.283 ±0.007 1.572 ±0.007 1.216 ±0.009VIII-2⁎ 4 8.23 83.36 31.58 104.82 ± 0.56 3.06 1.303 ±0.007 1.597 ±0.008 1.216 ±0.009VIII-3⁎ 6 8.18 93.95 35.75 121.00 ± 0.40 3.09 1.505 ±0.005 1.838 ±0.008 1.214 ±0.007VIII-4⁎ 8 8.11 97.44 37.57 128.27 ± 0.56 3.11 1.595 ±0.007 1.957 ±0.016 1.219 ±0.012
45°59.076 N 59°14.844 EIX-1⁎⁎ 0 8.20 82.28 31.31 103.73 ± 2.90 3.06 1.291 ±0.036 1.457 ±0.039 1.129 ±0.044IX-2⁎⁎ 5 8.20 88.56 33.98 107.45 ± 3.30 2.91 1.337 ±0.041 1.574 ±0.046 1.177 ±0.050IX-3⁎⁎ 10 8.06 100.41 38.37 140.17 ± 5.70 3.32 1.744 ±0.071 1.995 ±0.076 1.140 ±0.064IX-4⁎⁎ 15 8.11 105.62 40.51 139.90 ± 4.34 3.12 1.741 ±0.054 2.113 ±0.061 1.214 ±0.052IX-5⁎⁎ 22 8.15 109.25 41.97 141.71 ± 3.65 3.04 1.763 ±0.045 2.134 ±0.052 1.210 ±0.043
45°58.953 N 59°15.203 EXI-1# 0 8.20 82.28 31.31 110.25 3.25 1.372 n.m. n.m.XI-2# 5 8.20 88.56 33.98 111.92 3.03 1.393 n.m n.mXI-3# 10 8.06 100.41 38.37 143.26 3.39 1.783 n.m n.mXI-4# 15 8.11 105.62 40.51 153.15 3.42 1.906 n.m n.mXI-5# 20 8.15 109.25 41.97 153.91 3.31 1.915 n.m n.m
Aktumsyk (April 2004)45°05.485 N 58°22.880 EAk-1⁎ 0 8.24 84.96 32.46 110.15 ± 1.02 3.13 1.370 ±0.013 1.673 ±0.016 1.221 ±0.016Ak-2⁎ 25 8.23 84.50 32.55 110.50 ± 0.94 3.13 1.374 ±0.012 1.659 ±0.018 1.207 ±0.017Ak-3⁎ 37 8.16 85.04 32.75 109.19 ± 1.06 3.07 1.358 ±0.013 1.649 ±0.012 1.214 ±0.015
45°05.506 N 58°20.708 E (March 2006)Ak-1⁎ 1 8.37 97.48 40.20 130.31 ± 0.61 2.96 1.620 0.008 1.980 ±0.010 1.215 ±0.008Ak-9⁎ 9 7.79 92.83 39.35 128.12 ± 1.11 2.98 1.593 0.014 1.944 ±0.013 1.212 ±0.013
Aktumsyk groundwater (April 2004)Ak-GW⁎ 7.52 46.19 20.09 154.65 ± 0.54 7.36 1.923 ±0.007 1.838 ±0.005 1.034 ±0.005
Aktumsyk groundwater lagoon (April 2004)Ak-GWL⁎ 8.06 64.75 28.52 176.74 ± 1.52 5.82 2.198 ±0.019 2.246 ±0.017 1.021 ±0.012
Akespe geothermal water (August 2002)46° 46' 60N 60° 30' 24E
As-TW⁎⁎ 6.06 22.70 11.84 1.45 ± 0.35 0.12 0.018 ±0.004 0.017 ±0.004 0.917 ±0.311Kulandy groundwater, near shore (August 2004)
⁎Ku-GW 7.94. 13.47 6.43 2.07 ± 0.01 0.32 0.026 ±0.002 0.032 ±0.001 1.242 ±0.022Kulandy, artesian well A (August 2004)
46°05'40 N 59°31'19 E⁎Ku-AW 8.87 1.86 0.4 0.04 ± 0.001 0.09 n.m. n.m. n.m.
§Syr Darja (near Kazalinsk) 7.90 1.45 n.m. 16.07 n.m. 0.200 n.m. n.m.§Amu Darja (near Kungrad) 7.85 1.40 n.m. 0.002 n.m. 0.0003 n.m. n.m.
Not measured — n.m.⁎Measured by sector field ICP-MS at AWI, ⁎⁎by alpha spectrometry at AWI, #by ICP-MS at GFZ Postdam, §from (Yuldashev et al., 2005).
326 J. Friedrich / Journal of Marine Systems 76 (2009) 322–335
warm surface mixed layer, a 12 °C cold intermediate layerbetween 5 and8mdepth, and awarmer anoxic layer below8mdepth down to the bottom (Fig. 4a). As the water turns anoxic,the Eh decreases to −0.14 V, at a pH of 8.22. The saltconcentration starts to increase at 4 m depth from 82 g kg−1
to 109 g kg−1 near the bottom. Uranium follows this trend andincreases sharply from 107 µg l−1 at 5 m to 140 µg l−1 in 10 mdepth and continues to increase slightly down to the bottom(Fig. 4b). The surface and the bottomwater concentrationsdifferby 50 µg l−1. In the nearshore profile VIII, uranium reaches
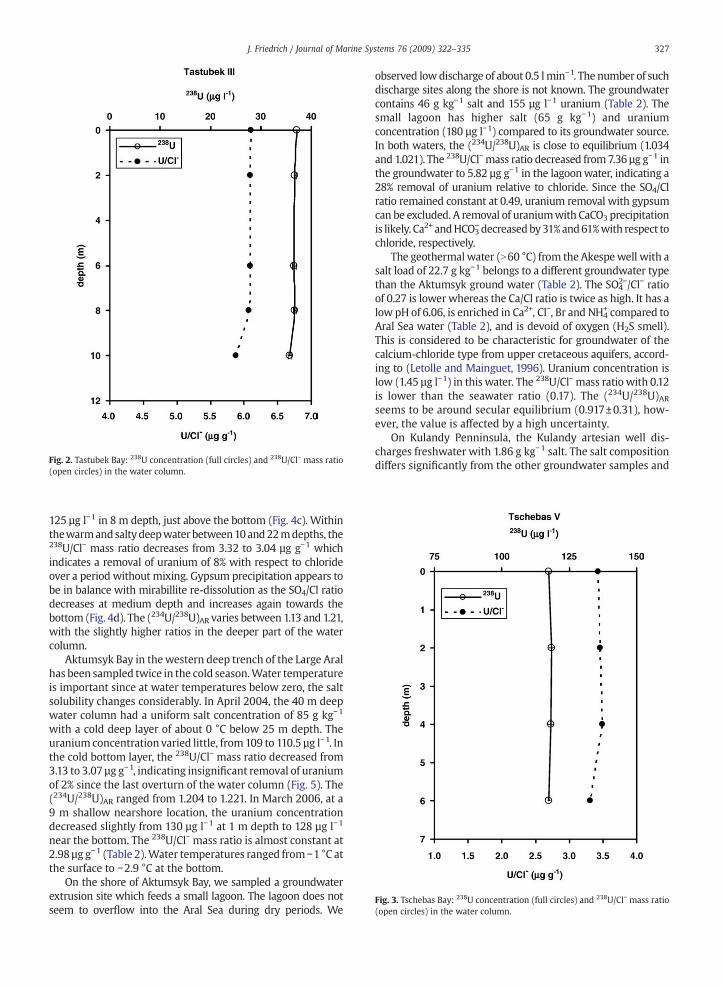
Fig. 2. Tastubek Bay: 238U concentration (full circles) and 238U/Cl− mass ratio(open circles) in the water column.
Fig. 3. Tschebas Bay: 238U concentration (full circles) and 238U/Cl− mass ratio(open circles) in the water column.
327J. Friedrich / Journal of Marine Systems 76 (2009) 322–335
125 µg l−1 in 8 m depth, just above the bottom (Fig. 4c). Withinthewarmandsaltydeepwater between10and22mdepths, the238U/Cl− mass ratio decreases from 3.32 to 3.04 µg g−1 whichindicates a removal of uranium of 8% with respect to chlorideover a period without mixing. Gypsum precipitation appears tobe in balance with mirabillite re-dissolution as the SO4/Cl ratiodecreases at medium depth and increases again towards thebottom (Fig. 4d). The (234U/238U)AR varies between 1.13 and 1.21,with the slightly higher ratios in the deeper part of the watercolumn.
Aktumsyk Bay in thewestern deep trench of the Large Aralhas been sampled twice in the cold season.Water temperatureis important since at water temperatures below zero, the saltsolubility changes considerably. In April 2004, the 40 m deepwater column had a uniform salt concentration of 85 g kg−1
with a cold deep layer of about 0 °C below 25 m depth. Theuranium concentration varied little, from109 to 110.5 µg l−1. Inthe cold bottom layer, the 238U/Cl− mass ratio decreased from3.13 to 3.07 µg g−1, indicating insignificant removal of uraniumof 2% since the last overturn of the water column (Fig. 5). The(234U/238U)AR ranged from 1.204 to 1.221. In March 2006, at a9 m shallow nearshore location, the uranium concentrationdecreased slightly from 130 µg l−1 at 1 m depth to 128 µg l−1
near the bottom. The 238U/Cl− mass ratio is almost constant at2.98 µg g−1 (Table 2).Water temperatures ranged from −1 °C atthe surface to −2.9 °C at the bottom.
On the shore of Aktumsyk Bay, we sampled a groundwaterextrusion site which feeds a small lagoon. The lagoon does notseem to overflow into the Aral Sea during dry periods. We
observed lowdischarge of about 0.5 lmin−1. The number of suchdischarge sites along the shore is not known. The groundwatercontains 46 g kg−1 salt and 155 µg l−1 uranium (Table 2). Thesmall lagoon has higher salt (65 g kg−1) and uraniumconcentration (180 µg l−1) compared to its groundwater source.In both waters, the (234U/238U)AR is close to equilibrium (1.034and 1.021). The 238U/Cl−mass ratio decreased from7.36 µg g−1 inthe groundwater to 5.82 µg g−1 in the lagoonwater, indicating a28% removal of uranium relative to chloride. Since the SO4/Clratio remained constant at 0.49, uranium removal with gypsumcan be excluded. A removal of uraniumwith CaCO3 precipitationis likely. Ca2+ andHCO3
− decreasedby31%and61%with respect tochloride, respectively.
The geothermal water (N60 °C) from the Akespewell with asalt load of 22.7 g kg−1 belongs to a different groundwater typethan the Aktumsyk ground water (Table 2). The SO4
2−/Cl− ratioof 0.27 is lower whereas the Ca/Cl ratio is twice as high. It has alow pH of 6.06, is enriched in Ca2+, Cl−, Br and NH4
+ compared toAral Sea water (Table 2), and is devoid of oxygen (H2S smell).This is considered to be characteristic for groundwater of thecalcium-chloride type from upper cretaceous aquifers, accord-ing to (Letolle and Mainguet, 1996). Uranium concentration islow (1.45 µg l−1) in this water. The 238U/Cl−mass ratio with 0.12is lower than the seawater ratio (0.17). The (234U/238U)ARseems to be around secular equilibrium (0.917±0.31), how-ever, the value is affected by a high uncertainty.
On Kulandy Penninsula, the Kulandy artesian well dis-charges freshwater with 1.86 g kg−1 salt. The salt compositiondiffers significantly from the other groundwater samples and

Fig. 4. (a) Profiles of temperature, salinity, pH and oxygen in Chernyshov Bay. (b) 238U concentration (full circles) and 238U/Cl−mass ratio (open circles) in the watercolumn in station IX. (c) 238U concentration (full circles) and 238U/Cl− mass ratio (open circles) in the water column in station VIII. (d) SO4
2−/Cl− profiles inChernyshov Bay.
328 J. Friedrich / Journal of Marine Systems 76 (2009) 322–335

Fig. 5. Aktumsuk Bay: 238U concentration (full circles) and 238U/Cl−mass ratio(open circles) in the water column.
329J. Friedrich / Journal of Marine Systems 76 (2009) 322–335
Aral Sea water. The mineralization of the water is dominatedby sodium, bicarbonate, chloride and sulphate. The uraniumconcentration is extremely low (40 ng l−1). The availablesample volumewas too low to determine the (234U/238U)AR inthis low uranium water with sufficient accuracy. In contrast,the brackish groundwater (13.47 kg−1 salt) from a trench nearthe shore of Kulandy had more uranium (2.07 µg l−1). The
Table 2Chemical composition of groundwaters on the western shore of the Aral Sea
pH HCO3− Cl− SO4
2− F− Br− Ca2+ Na+
g kg−1 g kg−1 g kg−1 mgkg−1 mgkg−1 g kg−1 g kg−
Akespe thermal groundwater (2002)6.06 0.15 11.84 3.24 1.00 36.00 0.98 6.10
Aktumsyk groundwater (2004)7.52 0.66 20.09 9.75 1.20 13.60 0.72 11.38
Aktumsyk lagoon (2004)8.06 0.37 28.52 13.96 1.80 19.10 0.73 16.04
AK-1 surface (2004)8.24 0.46 32.46 22.56 11.40 16.20 0.66 22.28
Kulandy groundwater, near shore (August 2004)7.94 0.27 6.43 2.207 n.m. n.m. 0.19 3.42
Kulandy, artesian well A (August 2004)8.87 0.56 0.40 0.294 b0.1 0.64 0.004 0.59
Surface water in Aktumsyk is given for comparison. Not measured — n.m.
(234U/238U)AR of 1.242 is similar to Aral Seawater. The 238U/Cl−
mass ratio is 0.32. The salt composition is comparable to thatof Aral Sea water at Tschebas Bay at lower salinity.
The uranium signal in the sediments represents a mixtureof suspended material discharged by the rivers and uraniumco-precipitated from the Aral Sea water column. The averageuranium concentration in the upper 20 cm of the Tastubek,Tschebas and Chernyshov Bay sediments is 9 ppm. Thisrepresents approximately 2 to 3 times the uranium concen-tration of the Syrdarya River sediment close to the Aral Seanear Kazalinsk as reported by Kadyrzhanov et al. (2005). InTastubek Bay sediments, the uranium content is 8 ppm at thesurface, 9 ppm in 20 cm depth, with a maximum of 14 ppm in11 cm depth. In Tschebas Bay, the uranium content rangesfrom 4 ppm at the surface to 8 ppm at 20 cm depth.Chernyshov Bay sediments contain 10 ppm uranium at thesurface and 5 ppm at 20 cm depth. In Chernyshov Bay, asediment depth of 20 cm corresponds to a sediment age of39 years, according to sediment dating by Heim (2005). Forthe late 1960's, uranium content in the sediments of 1 to5 ppm in coastal areas and up to 10 ppm for central areas inthe Aral Sea have been reported by Kochenov and Baturin,(1967).
4. Discussion
4.1. Sources of uranium
4.1.1. 234U/238U activity ratio as source tracerUranium occurs naturally in the sediments of the Earth's
crust with an average content of 2.7 ppm (Taylor andMcLennan, 1981) in its three isotopes 238U (99.27 mass %),235U (0.72%) and 234U (0.0055%). 234U is formed by decay of238U via three short-lived intermediate products. The halflives of 238U and 234U are 4.47 109 years and 2.44 105 yearsrespectively. In a closed system such as unweathered bedrock,radioactive decay and the production of daughter radio-nuclides produces radioisotopes that exist in secular
Mg2+ K+ Sr2+ salt TDP TDN Si
1 g kg−1 g kg−1 mgkg−1 g kg−1 µM µM µM
0.26 0.07 31.00 22.70 0.54 203.9 355.2
3.08 0.49 19.87 46.19 0.56 973.8 165.0
4.39 0.72 20.95 64.75 1.04 608.5 38.1
5.11 1.37 54.20 84.96 0.64 125.7 15.9
0.77 0.17 8.11 13.20 n.m n.m n.m
0.001 0.005 0.119 1.30 n.m n.m n.m

330 J. Friedrich / Journal of Marine Systems 76 (2009) 322–335
equilibrium with parent-daughter ratios within the samedecay chain, like (234U/238U)AR that equal unity (1.0). As rocksbecome exposed to physical and chemical weathering,disequilibria in the uranium decay chain develop. Suchisotope fractionation results from alpha recoil processes.Energetic decay of 238U causes alpha recoil which produces234U on damaged mineral lattice sites. During weathering,preferential oxidation and leaching from damaged sitesreleases 234U in excess of 238U. Oxidization and leachingtransforms insoluble U4+ to soluble U6+. Natural oxic surfacewater, where uranium is in its most oxidized state U6+
(Chabaux et al., 2003) is usually enriched in 234U, with a (234U/238U)AR greater than 1. Conversely, leached mineral grainsconsist usually of insoluble U4+ that has a (234U/238U)AR of lessthan unity. Once uranium is dissolved, minimal fractionationoccurs during adsorption/desorption, precipitation, com-plexation and redox-mediated processes since 238U and 234Uare chemically identical. Evaporation and the resultingaccumulation of uranium in the solute, as in the Aral Sea, donot affect the isotopic ratio, in contrast to the uraniumconcentration. Therefore, the (234U/238U)AR in allogenicuranium can be used as a source tracer when the isotopicsignature of the source is well defined, and as tracer for pastenvironmental conditions (Robinson et al., 2004).
The (234U/238U)AR might help to identify sources and controlsof uranium in the Aral Sea. Average (234U/238U)AR for rivers andstreams around the world are reported to be 1.171 (n=35)(Chabauxet al., 2003) and1.484 (n=132) (Hendersonet al., 2006).The (234U/238U)AR of Aral Sea of 1.207 to 1.305 falls within thisrange. Touse theactivity ratioas a source tool requiresknowledgeof the isotopic signatures of inflowing rivers as a major source ofuranium. No values for (234U/238U)AR in the Syrdarya and theAmudarya river waters have been found in the literature. ForMailuu-Suu river water on the boundary between KazakhstanandUzbekistan,which represents the closest available location tothe Syrdarya, an (234U/238U)AR of 1.32±0.02 and 1.8 µg U l−1 hasbeen measured by Vasiliev et al. (2005). Near the Aral Sea, theuranium concentration in the Syrdarya River at Kazalinsk townincreased to 16.07 µg l−1, due to uranium deposits and atransformer plant near Shyily. Processing of uraniumore releasesboth isotopes approximately in equilibrium. Due to the anthro-pogenic influences from the transformer plant and leaching fromunderground and tailings, it is likely that the uranium isotopicratio of the water entering the Aral Sea is lower today than inhistoric times before uranium mining and ore processing in thewatershed started. As a result, the (234U/238U)AR in the Aral Seamay have been lowered compared to the pre-mining times. The(234U/238U)AR in the Small Aral, which received proportionallymore Syrdarya River water, is between 1.270 and 1.305, slightlyhigher than in the Large Aral (between 1.129 and 1.221). Thelower activity ratio in the Large Aral may be a remnant of theAmudarya isotopic signature, as this river has been the majorwater source of the Aral Sea before the desiccation.
4.1.2. Rivers and desiccationSeawaterhas anaverageuraniumconcentrationof 3.24µg l−1
at 35 g kg−1 salt, an 238U/Cl− mass ratio of 0.17 and a constant(234U/238U)AR of 1.144 (Chen et al., 1986). In the Aral Sea, theuranium concentration is 10-fold higher (35 µg l−1 at 18 g kg−1
salt) in the Small Aral, and 48-fold higher in the western LargeAral (154µg l−1 at110gkg−1 salt) than in seawater.Normalised to
chloride, uranium is enriched by 35 times in the Small Aral andby 18 times in thewestern LargeAral, compared to seawater. TheSmall Aral Sea's (234U/238U)AR of 1.270 to 1.305 is higher than theseawater ratio.
I hypothesise that the accumulation of uranium in Aral Seawater is a result of the river water input, rich in uranium, andevaporation of lake water due to still ongoing desiccation. TheSyrdarya River, today themajor surfacewater source, dischargeswaterwith 16.07 µg l−1 uraniumand1.45g l−1 salt (Kadyrzhanovet al., 2005) into the Aral Sea. Upstream the mining activities, inthe Mailuu Suu River which is a tributary of the Syrdarya River,theuraniumconcentration is 1.2 µg l−1 (Vasiliev et al., 2005). Theaverage uranium concentration for theworld rivers is 0.51 µg l−1
(Chabaux et al., 2003). The high uranium concentration in theSyrdarya River seems be to directly related to the uraniummining, ore processing andmine tailings in thewatershed of theriver. The high carbonate and sulphate mineralization in thelower course of the river keeps uranium largely in dissolvedform. As a result, the river sediments are low in uranium(2.7ppmto3.9 ppm,Kadyrzhanovet al., 2005). These values areclose to the values reported for average crustal sediments of2.7 ppm by Taylor and McLennan (1981).
Beforemining started in thewatershed in the early twentiesof the 20th century, the uranium concentration in the riverwater was most likely much lower. Discharge of high uraniumwaters into the Aral Sea began approximately 80 years ago, thatis, about40years before theonset of thedesiccation. The annualuranium input from the Syrdarya River alone was approxi-mately 1.79×10⁵ kg at a discharge of 11.2 km3 after mining hadbegun and before the onset of desiccation.
Before the present desiccation, the Amudarya River wasthe major water source for the Aral Sea, dischargingapproximately 44.8 km3 per year (Bortnik, 1996). Assumingthat the low uranium concentration of 0.0024 µg l−1 for theAmudarya River near the Aral Sea is correct (NAVRUZ report,Passell et al., 2003), the pre-desiccation uranium input musthave been 108 kg per year. The Amudarya River seems to havebeen an insignificant source of uranium, whose input totals toonly 0.06% of the input from Syrdarya River.
4.1.3. GroundwaterRecent estimates of the role of groundwater on the present
lake water budget differ widely. Oberhänsli et al. (2009-thisvolume) see evidence for groundwater contribution to the lakewater balance in lowered hydrogen isotope and increaseddeuterium excess values but cannot provide quantitativeestimates. Estimates of groundwater extrusions vary fromzero to about 8 km3 annually (Veselov et al., 2002) and(Benduhn and Renard, 2004), respectively. Based on the waterbalance and hydraulic gradient analyses, (Jarsjö and Destouni,2004) conclude that the present groundwater discharge mightrange between the value of the 1960s and twice that number.This would mean that the relative importance of groundwaterdischarge on the overall water budget of the Aral Sea hasincreased. While the discharge into the Small Aral may nothave changed since the 1960s and the discharge along theshallow eastern shore may have largely decreased, theseauthors assume a large increase of groundwater dischargealong the steep western shore beneath the Ustyurt Plateau.
The lack of consensus on the groundwater inflow volumemakes it difficult to assess the uranium input fromgroundwater.

331J. Friedrich / Journal of Marine Systems 76 (2009) 322–335
One of the four collected groundwater samples, namely the onefrom Aktumsyk Cape on the western shore, had an extremelyhigh uranium concentration of 155 µg l−1. In contrast, threegroundwater samples from the northwestern shores (Akespeand Kulandy Penninsula) contained very little uranium. The(234U/238U)AR may help to identify groundwater sources.
The high uranium groundwater seeping at the base of theUstyurt plateau had a particular low (234U/238U)AR of 1.034. Ifsuch groundwater would contribute considerably to the lakewater in Aktumsyk, it should decrease the isotopic ratio in thewater column and increase uranium concentration in thewater column. However, such a feature is not seen, neither in9 m deep nearshore nor the deep offshore water profile fromAktumsyk (Fig. 7). The higher uranium concentrationsnearshore are a desiccation signal related to higher saltcontent. The high 238U/Cl− ratio of 7.36 in the groundwatercompared to 2.96 in the lake water is seen as enrichment inuranium compared to chloride within the aquifer. It issuspected that Aral Sea water may have infiltrated thisgroundwater reservoir at higher water level when salt waslower in the lake, since the salt composition of Aktumsyk lakewater and groundwater are comparable. The questionremains where the high uranium and (234U/238U)AR at secularequilibrium originates. The (234U/238U)AR close to 1 alongwithhigh uranium concentration may either result from highuranium dissolution in the aquifer faster relative to 234Urecoil, or, fromvery old groundwater; N1Mio years, where theexcess 234U had decayed away. The high uranium concentra-tion could result from the aquifer touching uranium sedi-mentary deposits. Within the northern Ustyurt and northernAral regions upper Oligocene sediments are reported whichbelong to the Karatomak, Chagrai, and Askaniya formations ofthe eastern Parathethys (Stolyarov and Ivleva, 2004). Thesesediments, similar to the Mangyshlak–Ergeni type, belong toa fish-facies which contains sulphide-phosphorus depositsenriched in uranium and REE. Groundwater draining theseformations are reported to contain 0.1 to 0.3% uranium and0.7 to 1.3% REE (Stolyarov and Ivleva, 2004).
Sandstones of the upper cretaceous and Palaeogene sandyrocks are considered as the most important groundwateraquifers in this region, which extend from the mountainousarea southeast of the Aral Sea as far as to the Caspian Sea(Letolle and Mainguet, 1996). The two deep artesian ground-waters; the hot and the salty Akespe spring and the coldKulandy freshwater well; are very low in uranium and displaya very different chemical composition. It is therefore assumedthat they originate from different aquifers, certainly not intouch with uranium bearing sediments. They do not con-tribute to the uranium load of the Aral Sea and are notinfluenced by Aral Sea water. Hot temperatures above 60 °C,elevated CO2 and pH around 6 decrease the stability of uranylcarbonate complexes and favour uraninite precipitation(Langmuir, 1978) and hence, explain the low dissolveduranium concentration in the Akespe thermal groundwater.Unfortunately, the Akespe thermal groundwater was notincluded in the oxygen and hydrogen isotope study byOberhänsli et al. (2009-this volume) which could have providedmore insights into the origin of this groundwater.
The Kulandy groundwater seeping from the near the shorenot far from the artesian well is brackish. The 13.5 g kg−1 saltand the (234U/238U)AR of 1.242 similar to Aral Sea water point
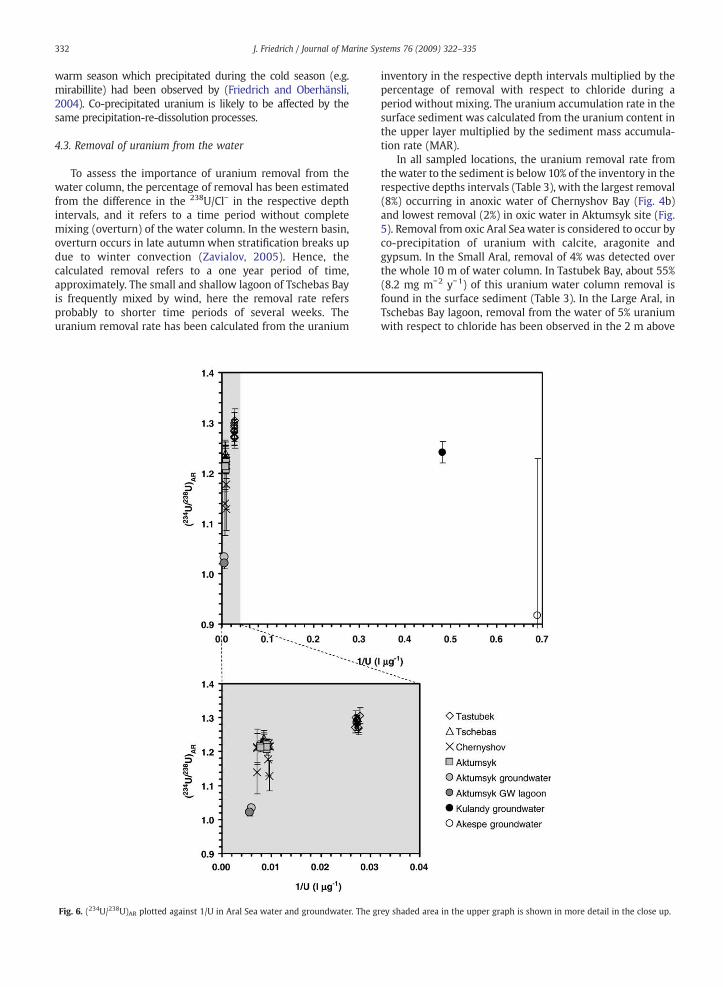
to infiltration of Aral Sea water into a shallow groundwaterreservoir. Lake water with a (234U/238U)AR similar to Cherny-shov or Tschebas Bay water may have infiltrated the reservoirwhen salt and uranium concentration in the lake water weremuch lower (Fig. 6). This assumption is supported by oxygenand hydrogen isotopic signatures (Oberhänsli et al., 2009-thisvolume). The infiltration likely happened at higher lake levelswhile now at lower water levels the shallow groundwater isseeping back into the Aral Sea. Based on the salt compositionand the low uranium concentration, I suspect that theinfiltration happened before mining in the watershed hadincreased uranium in the Aral Sea water.
Based on the present set of groundwater samples, one canconcluded that groundwater does not play a significant role asa source of uranium in the Aral Sea. The (234U/238U)AR helps tocharacterise the groundwater.
4.2. Controls on uranium in Aral Sea water
In the oxic waters of the Aral Sea, uranium is in soluble U6+
state. Due to the presence of 3.6 to 9.3 mM carbonate in thewater, the uranyl ion UO2
2+ is complexed with carbonate. At thealkaline pH of 8.0 to 8.5 and of Eh 0.2 to 0 V in the lake water,uranium formsUO2(CO3)4−complexes, according to the thermo-dynamic properties of uranium (Langmuir, 1978). Theoretically,in anoxic waters, the soluble U6+ is reduced to insoluble U4+ andtends to precipitate as insoluble uraninite (Chabauxet al., 2003).
In the western basin, under favourable conditions, a stabledensity stratification forms during the warm season. Due to thelow O2 solubility in the high saline water (O2 saturationconcentration is 118 µM at salinity of 110 and 20 °C), O2 israpidly consumed, leaving an anoxic bottom layer. This layer hasbeen found to contain H2S up to 80 mg l−1 (Zavialov, 2005).However, only part of the uranium is reduced to U4+. The pHabove 8 increases the solubility of the formed U4+ by complexa-tion with hydroxyl ions (formation of the U(OH)5− complex,Chabaux et al., 2003). U4+ coexists with U6+ which is complexedin the stable UO2(CO3)4− at ambient carbonate concentrations of9.3 mM. According to Langmuir's Eh–pH diagrams, the ambientEh–pH conditions in the deep Chernyshov Bay waters representboundary conditions for formation of UO2(CO3)4− and U(OH)5−
complexes. As a result, little decrease in Cl− normalised uraniumconcentrations in the hypoxic and anoxic waters of ChernyshovBay/western basinwas observed (Fig. 4b). To the contrary, in theshallow (10 m) nearshore location Chernyshov VIII, 238U/Cl−
increased from3.00 in the oxic surfacewater to 3.11 in the anoxicbottomwater. In the upper layer of the 25m deep central part ofChernyshov Bay, 238U/Cl− increased slightly from 3.06 in the oxicsurfacewater to3.32at10mdepth inanoxic intermediatewatersfollowed by slight decrease to 3.04 (8%) in the bottom layertowards 22m depth. The increase in 238U/Cl−may reflect mixingof western basin surface water and inflowing high uraniumeastern basin water with resulting complex salt re-dissolutionreactions. Simulations with PHREEQC (Parkhurst and Appelo,1999) suggest uraninite formation of less than 1% of the uraniumconcentration in this anoxic water. It is assumed that theobserved removal is likely to be related to co-precipitation withcalcite and gypsum. The SO4/Cl ratio which decreases slightlybetween 5 and 10mdepth, followed by a slight increase (Fig. 4d)reflects the balance of precipitation and re-dissolution ofsulphate salts. Large scale re-dissolution of salts during the
332 J. Friedrich / Journal of Marine Systems 76 (2009) 322–335
warm season which precipitated during the cold season (e.g.mirabillite) had been observed by (Friedrich and Oberhänsli,2004). Co-precipitated uranium is likely to be affected by thesame precipitation-re-dissolution processes.
4.3. Removal of uranium from the water
To assess the importance of uranium removal from thewater column, the percentage of removal has been estimatedfrom the difference in the 238U/Cl− in the respective depthintervals, and it refers to a time period without completemixing (overturn) of the water column. In the western basin,overturn occurs in late autumn when stratification breaks updue to winter convection (Zavialov, 2005). Hence, thecalculated removal refers to a one year period of time,approximately. The small and shallow lagoon of Tschebas Bayis frequently mixed by wind, here the removal rate refersprobably to shorter time periods of several weeks. Theuranium removal rate has been calculated from the uranium
Fig. 6. (234U/238U)AR plotted against 1/U in Aral Sea water and groundwater. The g
inventory in the respective depth intervals multiplied by thepercentage of removal with respect to chloride during aperiod without mixing. The uranium accumulation rate in thesurface sediment was calculated from the uranium content inthe upper layer multiplied by the sediment mass accumula-tion rate (MAR).
In all sampled locations, the uranium removal rate fromthe water to the sediment is below 10% of the inventory in therespective depths intervals (Table 3), with the largest removal(8%) occurring in anoxic water of Chernyshov Bay (Fig. 4b)and lowest removal (2%) in oxic water in Aktumsyk site (Fig.5). Removal from oxic Aral Seawater is considered to occur byco-precipitation of uranium with calcite, aragonite andgypsum. In the Small Aral, removal of 4% was detected overthe whole 10 m of water column. In Tastubek Bay, about 55%(8.2 mg m−2 y−1) of this uranium water column removal isfound in the surface sediment (Table 3). In the Large Aral, inTschebas Bay lagoon, removal from the water of 5% uraniumwith respect to chloride has been observed in the 2 m above
rey shaded area in the upper graph is shown in more detail in the close up.

Fig. 7. Uranium concentration plotted as function of salt concentration in waters related to the Aral Sea. The dotted line represents evaporation of Aral Sea water.The solid line represents mixing of Syrdarya River water with Aral Sea water and evaporation. The dashed-dotted represents evaporation of Syrdarya River water.⁎Syrdarya River value is taken from (Kadyrzhanov et al., 2005), marine water value is taken from (Chen et al., 1986).
333J. Friedrich / Journal of Marine Systems 76 (2009) 322–335
the bottom. Here, the uranium accumulation rate in thesurface sediment (4.2 mg m−2 y−1) matches only to 36% withthe removal rate from the water. The mismatch betweenwater column removal and sediment accumulation rate ofuranium may be due to complex re-suspension processesfrom the sediments as a result of wind-induced mixing inshallow waters. In Chernyshov Bay, the uranium accumula-tion rate in the surface sediment (32.2 mg m−2 y−1) matchesup thewater column removal (134.4 mgm−2 y−1) to only 24%.It can be suspected that the removal signal in the water isrelated to processes in the shallow eastern basin where thedeep water in Chernyshov Bay originates. At favourable windconditions, the eastern basin water flows through the 6 mdeep connecting channel westward. The warm (in summer)and saltier, and, hence, denser eastern basin water descendsdown the slope into the deeper parts of Chernyshov Baybelow the cold intermediate layer and thewestern basin. NearAktumsyk Cape, little removal of 2%was detected in the lower12 m in the offshore water column and no removal inshallower waters nearshore. This low removal rate can beexplained by the shorter period of time that elapsed afterwinter convection and complete mixing, as sampling hadbeen done in early spring.
4.4. Evolution of uranium in the Aral Sea
With the help of Fig. 7, I will discuss the evolution ofuranium concentration in the water during desiccation of theAral Sea: It is unknown what the uranium concentration inthe Aral Sea had been before the onset of mining anddesiccation. As the Aral Sea was brackish before the desicca-tion started due to the high evaporation in the arid climate(Letolle and Mainguet, 1996), the salt and uranium concen-tration had then already increased and moved away from the
origin (dotted line in Fig. 7). During that process, the uraniumload in the river increased due to mining in the watershed.Approximately 40 years later, the desiccation started andaccelerated the concentration of salt and uranium, moving itto present values of 100–150 µg l−1 of uranium and 110 g kg−1
of salt. Based on this linear relationship (y=1.357x, R2=0.96),the shallow eastern basinwater with 130 g kg−1 salt (Zavialovet al., 2009-this issue) is estimated to contain 176 µg l−1
uranium. However, Tastubek water from the Small Aral plotsabove the desiccation line. The Small Aral receives propor-tionally more uranium than the large Aral waters from theSyrdarya River. A linear regression (y=1.18x+15.06 R2=0.98,solid line) of Small Aral and Large Aral water values closelyconnects to Syrdarya River water. Syrdarya River close to theAral Sea contains 16.07 µg l−1 uranium and 1.45 g kg−1 salt;16.8 µg l−1 uranium has been estimated from the linearrelationship. This regression line represents the mixing ofhigh uranium Syrdarya River water with Small Aral and LargeAral water. Using this regression to calculate the uraniumconcentration for 10 g kg−1 salt in the Aral Sea as it was at theonset of desiccation yields 27 µg l−1 uranium for the 1960s,considering mining influence. This estimate is somewhatlower than 30–35 µg l−1 uranium measured near the rivermouth in the Aral Sea around 1967 (Kochenov and Baturin,1967). Those authors report 50–60 µg l−1 of uranium inwatersof the central Aral Sea for the same time period. This is muchhigher than what can be explained with the mixing andevaporation line in Fig. 7. Either the uranium concentration inthe Syrdarya river water has been much higher in the past orconsiderable uranium has been removed from the Aral waterby co-precipitation, with calcite and gypsum for example. Theprecipitation of uranylcarbonate secondary minerals isknown from mine tailing waters. It can be summarised thatthe present day uranium concentrations in the Aral Sea are a
334 J. Friedrich / Journal of Marine Systems 76 (2009) 322–335
result of desiccation of initial lower uranium lake water andthe mixing with high uranium Syrdarya River water.
4.5. Ecological consequences
Uraniumwould increase muchmore rapidly than salt in thewater if pure Syrdarya River water would be evaporated(dashed-dotted line in Fig. 7). Such a scenario has to beconsidered for the future of the Small Aral since as of 2005Syrdarya River water exclusively discharges into the Small Aral.The dam at Berg Strait had been constructed to stabilize orincrease the Small Aral's water level and to restore fisheries.However, this may have severe consequences for the waterquality if thewater balance does not become positive.With thepresent day Syrdarya River input of 3–4 km3 annually, the SmallAral is close to equilibrium between input and loss byevaporation (Zavialov, 2005). The worst-case scenario foruraniumaccumulation in the Small Aralwould be if all Syrdaryawater is diverted to the Small Aral, and river input andevaporation would be in balance or below. Then the present-day Small Aral uranium inventory of 840 tons (23 km3
volume×36.5 µg l−1 uranium)will increase by 64 tons uraniumevery year (4 km3 discharge×16 µg l−1 river uranium) at aconstant lake water level. This scenario yields a residence timeof 13 years for uranium in the Small Aral, meaning a doubling ofuranium concentration in 13 years time if no uranium isremoved from the water by any process. Considering co-precipitation and including an exponential removal rate of 4%uraniumper year in the Small Aral, asmeasured inTastubek Bay(Table 3), into the above budget would increase the uraniumconcentration to 55 µg l−1 in 20 years time, and level out at 66–70 µg l−1 in about 55 years time. It would also result in anincrease of uranium in the sediment. In a more positivescenario, where the river discharge would increase above theequilibrium value to about 4.5–5 km3 year−1, the Small Aralvolume would increase about twofold by 2025, and the saltconcentrationwould drop to 10 g kg−1 (Zavialov, 2005). For sucha scenario, by the year 2025 at a constant river uranium input of75 ton annually (16 µg l−1×4.7 km3) and a constant 4% per yearuranium removal rate, the uranium concentration in the SmallAral would decrease slightly to 34 µg l−1.
From the ecotoxicological point of view, the increase inSyrdarya river discharge as the major water source becomescrucial for the water quality of the Small Aral, despite its highuranium load. It may keep the present-day uranium concen-tration of 36.5 µg l−1 constant or even lower it slightly.However, as it is intended to restore fishery, accumulation of
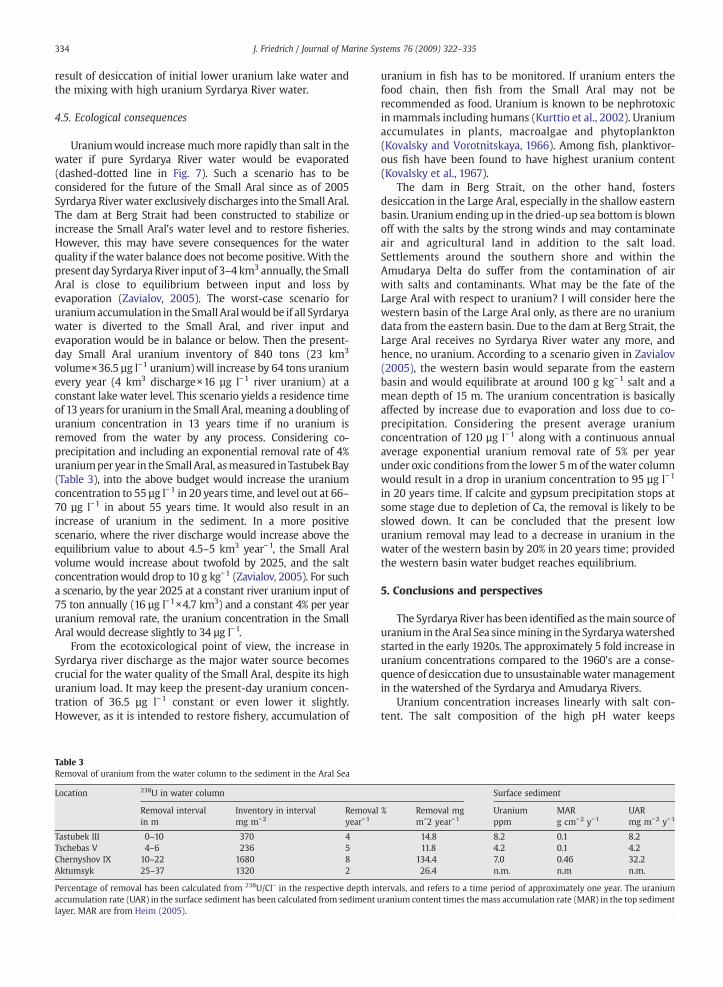
Table 3Removal of uranium from the water column to the sediment in the Aral Sea
Location 238U in water column
Removal intervalin m
Inventory in intervalmg m−2
Removalyear−1
Tastubek III 0–10 370 4Tschebas V 4–6 236 5Chernyshov IX 10–22 1680 8Aktumsyk 25–37 1320 2
Percentage of removal has been calculated from 238U/Cl− in the respective depth inaccumulation rate (UAR) in the surface sediment has been calculated from sedimentlayer. MAR are from Heim (2005).
uranium in fish has to be monitored. If uranium enters thefood chain, then fish from the Small Aral may not berecommended as food. Uranium is known to be nephrotoxicin mammals including humans (Kurttio et al., 2002). Uraniumaccumulates in plants, macroalgae and phytoplankton(Kovalsky and Vorotnitskaya, 1966). Among fish, planktivor-ous fish have been found to have highest uranium content(Kovalsky et al., 1967).
The dam in Berg Strait, on the other hand, fostersdesiccation in the Large Aral, especially in the shallow easternbasin. Uranium ending up in the dried-up sea bottom is blownoff with the salts by the strong winds and may contaminateair and agricultural land in addition to the salt load.Settlements around the southern shore and within theAmudarya Delta do suffer from the contamination of airwith salts and contaminants. What may be the fate of theLarge Aral with respect to uranium? I will consider here thewestern basin of the Large Aral only, as there are no uraniumdata from the eastern basin. Due to the dam at Berg Strait, theLarge Aral receives no Syrdarya River water any more, andhence, no uranium. According to a scenario given in Zavialov(2005), the western basin would separate from the easternbasin and would equilibrate at around 100 g kg−1 salt and amean depth of 15 m. The uranium concentration is basicallyaffected by increase due to evaporation and loss due to co-precipitation. Considering the present average uraniumconcentration of 120 µg l−1 along with a continuous annualaverage exponential uranium removal rate of 5% per yearunder oxic conditions from the lower 5m of thewater columnwould result in a drop in uranium concentration to 95 µg l−1
in 20 years time. If calcite and gypsum precipitation stops atsome stage due to depletion of Ca, the removal is likely to beslowed down. It can be concluded that the present lowuranium removal may lead to a decrease in uranium in thewater of the western basin by 20% in 20 years time; providedthe western basin water budget reaches equilibrium.
5. Conclusions and perspectives
The Syrdarya River has been identified as themain source ofuranium in the Aral Sea sincemining in the Syrdaryawatershedstarted in the early 1920s. The approximately 5 fold increase inuranium concentrations compared to the 1960's are a conse-quence of desiccation due to unsustainablewatermanagementin the watershed of the Syrdarya and Amudarya Rivers.
Uranium concentration increases linearly with salt con-tent. The salt composition of the high pH water keeps
Surface sediment
% Removal mgm−2 year−1
Uraniumppm
MARg cm−2 y−1
UARmg m−2 y−1
14.8 8.2 0.1 8.211.8 4.2 0.1 4.2
134.4 7.0 0.46 32.226.4 n.m. n.m n.m.
tervals, and refers to a time period of approximately one year. The uraniumuranium content times the mass accumulation rate (MAR) in the top sedimen
t
335J. Friedrich / Journal of Marine Systems 76 (2009) 322–335
uranium soluble by the formation of hydroxyl complexes anduranylcarbonate complexes. Uranium removal from anoxicwater and oxic waters is low, and is largely a result of co-precipitationwith calcite and gypsum. It is suspected that theobserved complex precipitation-re-dissolution equilibriumsof salts affect the uranium balance. This requires furtherinvestigation.
None of the realistic scenarios for the future of the Aral Seawill lead to a major decrease in lake water uraniumconcentration. The concentrations continue to be ecotoxico-logically critical. If fishery is restored in the Small Aral Sea, it isrecommended to monitor fish for uranium accumulation.
To close the gaps in the knowledge identified by presentstudy, a detailed study of mineralization, uranium isotopes,oxygen and hydrogen isotopes and radon on groundwaterextrusion sites along the western shore of the Aral Sea andwells on the Ustyurt plateau and Syrdarya and AmudaryaRivers would help to assess sources and role of groundwaterinput into the Aral Sea. These data should be complementedbywater columnprofiles in the Aral Sea near the groundwaterextrusion sites. Knowledge of (234U/238U)AR in the Syrdaryaand Amudarya rivers and the groundwater are crucial fordetermining the age of the Aral Sea since last completedrying-up.
Acknowledgements
Hedi Oberhänsli, Francois Demory, Peter Zavialov, DanisNurgaliev and the team from the Kazan University providedgreat support during the field campaigns in 2002 and 2004,and provided the 2006 Aktumsyk water samples. Sector fieldICP-MS analyses were done in collaboration with WalterGeibert. Klaus Dulski at GFZ Potsdam provided uranium dataof the sediment. Antje Eulenburg analysed the major anionand cation composition. I wish to thank all of them. Themanuscript benefited greatly from the constructive reviewsby Gideon Henderson and an anonymous reviewer. WalterGeibert and Michiel Rutgers van der Loeff provided helpfulcomments on an earlier version of the manuscript. Financialsupport to J.F. for the field trips and the meetings isacknowledged from INTAS 00-1030 CLIMAN and NATOCooperative Linkage Project EST.CLG 980445.
References
Barber, D.S., et al., 2005. The Navruz experiment: cooperative monitoring forradionuclides and metals in Central Asia transboundary rivers. J.Radioanal. Nucl. Chem. 263 (1), 213–218.
Benduhn, F., Renard, P., 2004. A dynamic model of the Aral Sea water and saltbalance. J. Mar. Syst. 47 (1–4), 35–50.
Bortnik, V.N., 1996. Changes in water level and hydrologic balance of the AralSea. In: Micklin, P.P., Williams, W.D. (Eds.), The Aral Sea Basin. SpringerVerlag, Berlin, pp. 25–32.
Chabaux, F., Riotte, J., Dequincey, O., 2003. U–Th–Ra fractionation duringwheathering and river transport. Rev. Mineral. Geochem. 52, 533–576.
Chen, J.H., Edwards, L.R., Wasserburg, G.J., 1986. 238U, 234U and 232Th inseawater. Earth Planet. Sci. Lett. 80, 241–251.
Chernenko, I.M., 1983. Water-salt balance and the use of the desiccating Aral.Problemy Osvoeniya Pustyn 2, 18–24 (in Russian).
Friedrich, J., Oberhänsli, H., 2004. Hydrochemical properties of the Aral Seawater in summer 2002. J. Mar. Syst. 47 (1–4), 77–88.
Heim, C., 2005. Geochemical composition of sediments and sedimentationprocesses of the past 100 years in the Aral Sea. masters Thesis, JohannWolfgang Goethe University/AWI, Frankfurt am Main/Bremerhaven,Masters thesis (in German) 89 pp.
Henderson, G.M., Hall, B.L., Smith, A., Robinson, L.F., 2006. Control on (234U/238U) in lake water: a study in the Dry Valleys of Antarctica. Chem. Geol.226, 298–308.
Jarsjö, J., Destouni, G., 2004. Groundwater discharge into the Aral Sea after1960. J. Mar. Syst. 47 (1–4), 109–120.
Kadyrzhanov, K.K., et al., 2005. Radionuclide contamination in the Syrdaryariver basin of Kazakhstan; results of the Navruz Project. J. Radioanal.Nucl. Chem. 263 (1), 197–205.
Kochenov, A.V., Baturin, G.N., 1967. Uranium distribution in Aral Seasediments. Oceanology 7 (4), 623–627 (in Russian).
Kovalsky, V.V., Vorotnitskaya, I.E., 1966. Regularities in the biogenic migrationof uranium. Ukr. Biokhim. Zh. 38, 419–424 (in Russian).
Kovalsky, V.V., Vorotnitskaya, I.E., Lekarev, V.S., 1967. Biogeochemical foodchains of uranium in aquatic and Terraneous organisms. In: Aberg, B.,Hungate, F.B. (Eds.), Radioecological Concentration Processes. PergamonPress Inc., Oxford, pp. 329–332.
Kurttio, P., et al., 2002. Renal effects of uranium in drinking water. Environ.Health Perspect. 110 (4), 337–342.
Langmuir, D., 1978. Uranium solution-mineral equilibria at low temperatureswith applications to sedimentary ore deposits. Geochim. Cosmochim.Acta 42, 547–569.
Letolle, R., Mainguet, M., 1996. Der Aralsee: Eine ökologischen Katastrophe.Springer Verlag, Berlin Heidelberg.
Lieser, K.H., 2000. Einführung in die Kernchemie. Wiley-VCH. 788 pp.Mirabdullayev, I.M., et al., 2004. Succession of the ecosystems of the Aral Sea
during its transition from oligohaline to polyhaline water body. J. Mar.Syst. 47 (1–4), 101–107.
Oberhänsli, H., Weise, S.M., Stanichny, S., 2009. Oxygen and hydrogenisotopic water characteristic of the Aral Sea, Central Asia. J. Mar. Syst. 76,310–321 (this volume). doi:10.1016/j.jmarsys.2008.03.019.
Parkhurst, D.L. Appelo, C.A.J., 1999. User's guide to PHREEQC (Version 2) — Acomputer program for speciation, batch-reaction, one-dimensionaltransport ans inverse geochemical calculations. 99-4259, U.S. Depart-ment of the Interior U.S. Geological Survey, Denver, Colorado.
Passell, H., et al., 2003. The Navruz experiment: Transboundary Monitoringfor Radionuclides and Metals in Central Asian Rivers. Sandia NationalLaboratories, Albuquerque.
Robinson, L.F., Henderson, G.M., Hall, B.L., Matthews, I., 2004. Climatic controlof riverine and seawater uranium-isotope ratios. Science 305, 851–854.
Stanev, E.V., Pebenva, E.L., Mercier, F., 2004. Temporal and spatial patterns ofsea level in inland basins: recent events in the Aral Sea. Geophys. Res.Lett. 31. doi:10.1029/2004GL020478 (L15505).
Stolyarov, A.S., Ivleva, E.I., 2004. Upper Oligocene sediments of theCiscaucasus, Volga–Don, and Mangyshlak regions (Central EasternParatethys): Communication 1. Main compositional and structuralfeatures. Lithol. Miner. Resour. 39 (3), 213–229.
Taylor, S.R., McLennan, S.M., 1981. The composition and evolution of thecontinental crust: rare earth element evidence from sedimentary rocks.Philos. Trans. R. Soc., A 301, 381–399.
UNECE, 2001. Environmental Performance Review of Uzbekistan. UnitedNations Economic Commission for Europe, Commitee on EnvironmentalPolicy. Chapter 9. Mineral Resources.
Vasiliev, I.A., et al., 2005. Uranium levels in the Naryn and Mailuu–Suu riversof Kyrgyz Republic. J. Radioanal. Nucl. Chem. 263 (1), 107–212.
Veselov, V.V., et al., 2002. Simulation of groundwater resources of Aral Seabasin. UNESCO project 00KZ11102 report, Institute of Hydrology andHydrophysics, Ministry of Education and Science, Kazakhstan.
Yuldashev, B.S., et al., 2005. Radioecological monitoring of transboundaryrivers of the Central Asian Region. J. Radioanal. Nucl. Chem. 263 (1),219–228.
Zavialov, P.O., 2005. Physical Oceanography of the Dying Aral Sea. Praxisbooks in Geophysical sciences. Springer, New York. 146 pp.
Zavialov, P.O., Ni, A.A., Kudyshkin, T.V., Kurbaniyazov, A.K., Dikarev, S.N., 2009.Five years offield hydrographic research in the Large Aral Sea (2002–2006).J. Mar. Syst. 76, 263–271 (this issue). doi:10.1016/j.jmarsys.2008.03.013.
Zavialov, P.O., et al., 2003. Hydrographic survey in the dying Aral Sea.Geophysical Research Letters, 30(13): art. no.-1659.