update march 23 2011 revised - san francisco unified ... march 23 2011_revised page 3 of 30...
TRANSCRIPT
STUDENT ASS IGNMENT
MARCH 2011 SCHOOL ASSIGNMENT OFFERS
Revised March 23, 2011
E D U C A T I O N A L P L A C E M E N T C E N T E R
5 5 5 F R A N K L I N S T R E E T , R O O M 1 0 0
S A N F R A N C I S C O , C A 9 4 1 0 2
Update March 23 2011_Revised Page 2 of 30
(Intentionally blank)
Update March 23 2011_Revised Page 3 of 30
Introduction
This document is designed to provide information about the San Francisco Unified School District’s March 2011 student assignment offers. It does this by describing:
• the portfolio of choices available to families;
• what parents requested;
• how the student assignment system works; and
• the outcomes of the March 2011 assignment process.
This document is not intended to be an analysis of how well the student assignment system is meeting the Board’s priorities and goals for the student assignment policy; that analysis will begin in the fall of 2011 once students are enrolled in schools. The assignment process for the 2011-12 school year will continue through August 2011, and a detailed report using fall enrollment data will be published by January 2012.
Update March 23 2011_Revised Page 4 of 30
Table of Contents
Page
HIGHLIGHTS ...........................................................................................................................................................5
SFUSD SCHOOLS AND PROGRAMS ............................................................................................................6
K5 SCHOOLS..............................................................................................................................................................6 K8 SCHOOLS..............................................................................................................................................................7 SECONDARY SCHOOLS...............................................................................................................................................7
WHAT PARENTS REQUESTED .......................................................................................................................8
LARGER APPLICANT POOLS .......................................................................................................................................8 DIVERSE APPLICANT POOLS ......................................................................................................................................8 ATTENDANCE AREAS AND CHOICE............................................................................................................................9 PROXIMITY AND CHOICE .........................................................................................................................................10 Kindergarten ......................................................................................................................................................10 6th Grade ...........................................................................................................................................................11 9th Grade ...........................................................................................................................................................11
LANGUAGE PATHWAYS & CHOICE ..........................................................................................................................12 K8 SCHOOLS & CHOICE...........................................................................................................................................13 SIBLINGS & CHOICE ................................................................................................................................................13 CTIP1 AND CHOICE.................................................................................................................................................14 DEMAND OUTPACES CAPACITY...............................................................................................................................15 Kindergarten ......................................................................................................................................................15 6th Grade Demand.............................................................................................................................................17 9th Grade Demand.............................................................................................................................................17
HOW THE STUDENT ASSIGNMENT SYSTEM WORKS .....................................................................18
CHOICE ASSIGNMENTS ............................................................................................................................................18 DESIGNATED ASSIGNMENTS ....................................................................................................................................19
MARCH 2011 ASSIGNMENT OFFERS .......................................................................................................20
KINDERGARTEN.......................................................................................................................................................20 6
TH GRADE ...............................................................................................................................................................21
9TH GRADE ...............................................................................................................................................................21
APPENDICES ........................................................................................................................................................22
A: PRE K TIEBREAKER ............................................................................................................................................23 B: LOW TEST SCORE AREAS (CTIP1)......................................................................................................................25 C: DENSITY TIEBREAKER ........................................................................................................................................26 D: NCLB/OPEN ENROLLMENT ................................................................................................................................27 E: SCHOOL OFFERS..................................................................................................................................................28 Kindergarten Offers ...........................................................................................................................................28 6th Grade Offers ................................................................................................................................................30 9th Grade Offers ................................................................................................................................................30
www.sfusd.edu/Enroll
Update March 23 2011_Revised Page 5 of 30
Highlights
• More interest overall in SFUSD o 4,931 kindergarten applicants, which is 237 more than last year (5% growth). o This year’s kindergarten pool has 900 more applicants than 2005 (22% growth). o 3,131 6th grade applicants, which is 211 more applicants than last year (7% growth). o We predict middle school enrollment will grow 31% by 2018.
• More African American and Latino on-time kindergarten applicants o African American applicant pool grew 20% (from 293 applicants to 352 applicants). o Latino applicant pool grew 17% (from 961 applicants to 1,122 applicants).
• Low demand based on closest school or attendance area school o 23% of kindergarten applicants listed their attendance area school as a 1st choice;
24% listed a city-wide school, and 53% listed another attendance area school as their 1st choice.
• The % ranged across attendance areas from 2% to 59%.
• The majority of attendance areas (42 out of 58) had fewer than 30% of students list their attendance area school as a first choice.
o 24% of kindergarten applicants, 28% of 6th grade applicants, and 26% of 9th grade applicants listed the school closest to where they live as a 1st choice.
• High demand for K8 schools o 20% of kindergartners listed a K8 school as a 1st choice.
• High demand for language pathways o 39% of kindergarten applicants listed a language pathway as a 1st choice.
• Demand outpaces capacity o First choice requests for:
• Chinese immersion are 219% of capacity;
• Japanese foreign language in elementary school are 174% of capacity;
• Spanish immersion are 147% of capacity; and
• K8 schools are 206% of capacity. o 14 schools were listed as a first choice for 50% of kindergarten applicants. o There were 11 requests for every opening at these 14 schools. o 74% of 6th grade applicants listed six out of 13 middle school options as a first
choice: Giannini, Presidio, Aptos, Hoover, Roosevelt, and Lick. o 80% of 9th grade applicants listed five out of 15 high school options as a first
choice: Lowell, Lincoln, Washington, Balboa, and Galileo.
• Percent who get choice similar to prior years o Four out of five applicants received one of their choices. o 75% received their 1st, 2nd, or 3rd choice. o Kindergarten: 74% received 1st, 2nd, or 3rd choice (81% received one of their
choices). o 6th Grade: 85% received 1st, 2nd, or 3rd choice (86% received one of their choices). o 9th Grade: 84% received 1st, 2nd, or 3rd choice (86% received one of their choices).
Update March 23 2011_Revised Page 6 of 30
SFUSD Schools and Programs
San Francisco Unified School District (SFUSD) offers a wide variety of high quality schools and programs, and students are enrolled in these schools and programs through a choice process. This section of the report provides a high-level overview of the variety of high quality schools and programs available as choices for families in San Francisco.
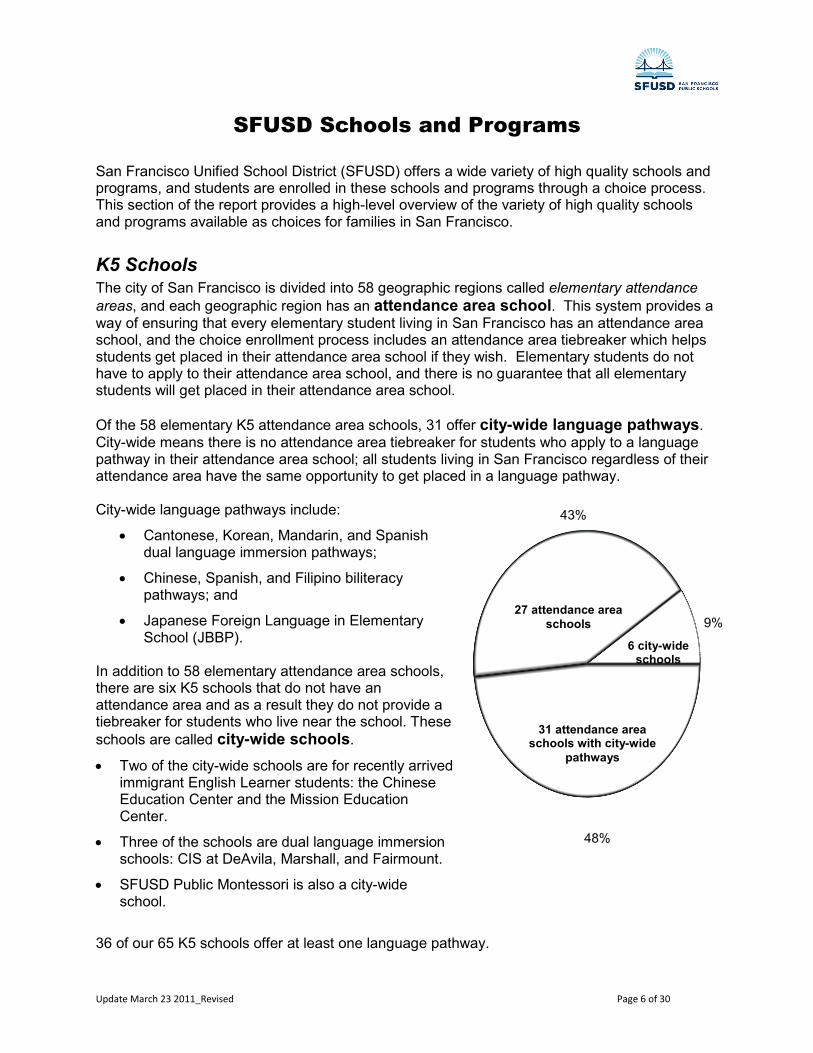
K5 Schools The city of San Francisco is divided into 58 geographic regions called elementary attendance
areas, and each geographic region has an attendance area school. This system provides a way of ensuring that every elementary student living in San Francisco has an attendance area school, and the choice enrollment process includes an attendance area tiebreaker which helps students get placed in their attendance area school if they wish. Elementary students do not have to apply to their attendance area school, and there is no guarantee that all elementary students will get placed in their attendance area school.
Of the 58 elementary K5 attendance area schools, 31 offer city-wide language pathways. City-wide means there is no attendance area tiebreaker for students who apply to a language pathway in their attendance area school; all students living in San Francisco regardless of their attendance area have the same opportunity to get placed in a language pathway. City-wide language pathways include:
• Cantonese, Korean, Mandarin, and Spanish dual language immersion pathways;
• Chinese, Spanish, and Filipino biliteracy pathways; and
• Japanese Foreign Language in Elementary School (JBBP).
In addition to 58 elementary attendance area schools, there are six K5 schools that do not have an attendance area and as a result they do not provide a tiebreaker for students who live near the school. These
schools are called city-wide schools.
• Two of the city-wide schools are for recently arrived immigrant English Learner students: the Chinese Education Center and the Mission Education Center.
• Three of the schools are dual language immersion schools: CIS at DeAvila, Marshall, and Fairmount.
• SFUSD Public Montessori is also a city-wide school.
36 of our 65 K5 schools offer at least one language pathway.
31 attendance area schools with city-wide
pathways
27 attendance area
schools
6 city-wide schools
48%
43%
9%

Update March 23 2011_Revised Page 7 of 30
K8 Schools K8 schools do not have an attendance area and as a result they do not provide a tiebreaker for students who live near the school. Five K8 schools offer language pathways:
Name Language Pathway 1. Alice Fong Yu Cantonese dual language immersion 2. Bessie Carmichael Filipino biliteracy and Spanish biliteracy 3. Buena Vista/Horace Mann Spanish dual language immersion 4. Lawton 5. Lilienthal Korean dual language immersion 6. Paul Revere Spanish dual language immersion 7. Rooftop 8. SF Community
Secondary Schools Secondary schools do not have attendance areas and as a result they do not provide a tiebreaker for students who live near the school. There are 12 middle schools (grades six through eight), 14 high schools (grades 9 through 12), and one school with grades six through 12. Middle Schools (grades six through eight)
1. Aptos 2. Denman 3. Everett 4. Francisco 5. Giannini 6. Hoover 7. King 8. Lick 9. Marina 10. Presidio 11. Roosevelt 12. Visitacion Valley
High Schools (grades 9 through 12) 1. AAS @ SOTA 2. Asawa SOTA 3. Balboa 4. Burton 5. Galileo 6. June Jordan 7. Lincoln 8. Lowell 9. Marshall 10. Mission 11. O’Connell 12. SF International 13. Wallenberg 14. Washington
Middle/High School (grades six through 12)
1. International Studies Academy Six middle schools (Everett, Francisco, Hoover, Lick, Marina, and Visitacion Valley) and six high schools (Galileo, Lincoln, Marshall, Mission, SF International, and Washington) offer one of the following language pathways:
• Chinese / Spanish Dual Language Pathway (SDLP);
• Chinese / Spanish / All Newcomer pathway.
31 attendance area schools with
city0wide pathways
Update March 23 2011_Revised Page 8 of 30
What Parents Requested
Larger Applicant Pools
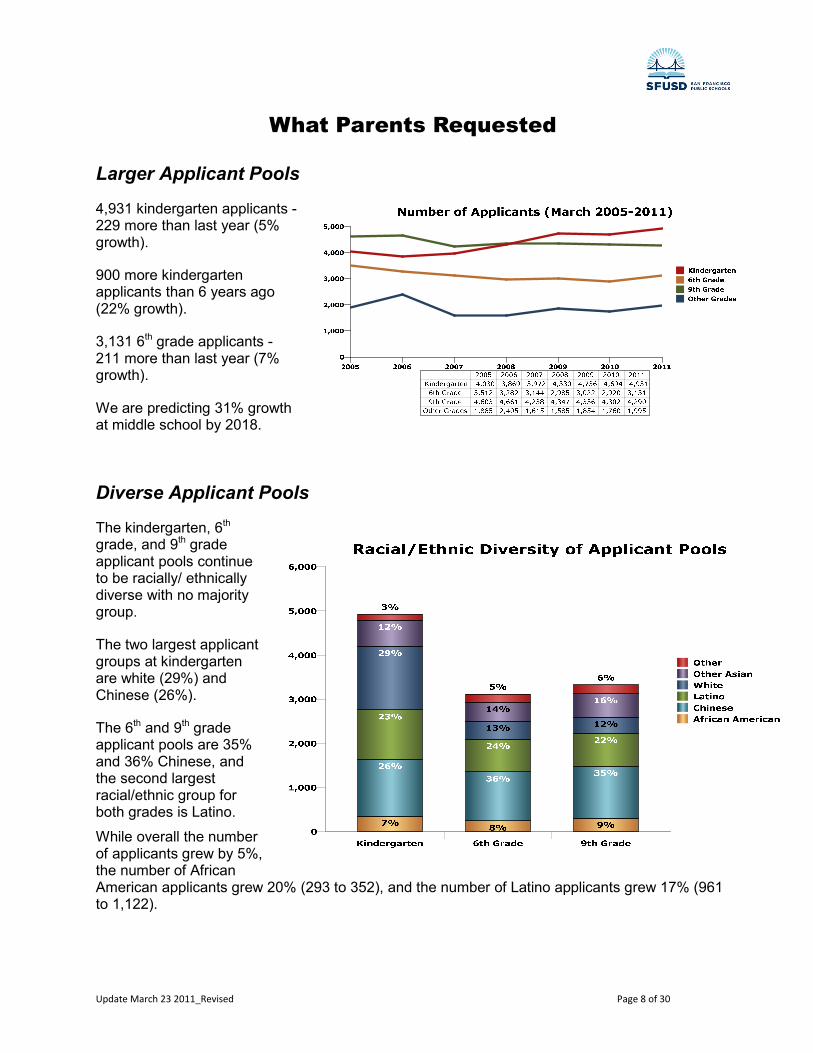
4,931 kindergarten applicants - 229 more than last year (5% growth).
900 more kindergarten applicants than 6 years ago (22% growth).
3,131 6th grade applicants - 211 more than last year (7% growth).
We are predicting 31% growth at middle school by 2018.
Diverse Applicant Pools
The kindergarten, 6th grade, and 9th grade applicant pools continue to be racially/ ethnically diverse with no majority group.
The two largest applicant groups at kindergarten are white (29%) and Chinese (26%).
The 6th and 9th grade applicant pools are 35% and 36% Chinese, and the second largest racial/ethnic group for both grades is Latino.
While overall the number of applicants grew by 5%, the number of African American applicants grew 20% (293 to 352), and the number of Latino applicants grew 17% (961 to 1,122).
Update March 23 2011_Revised Page 9 of 30
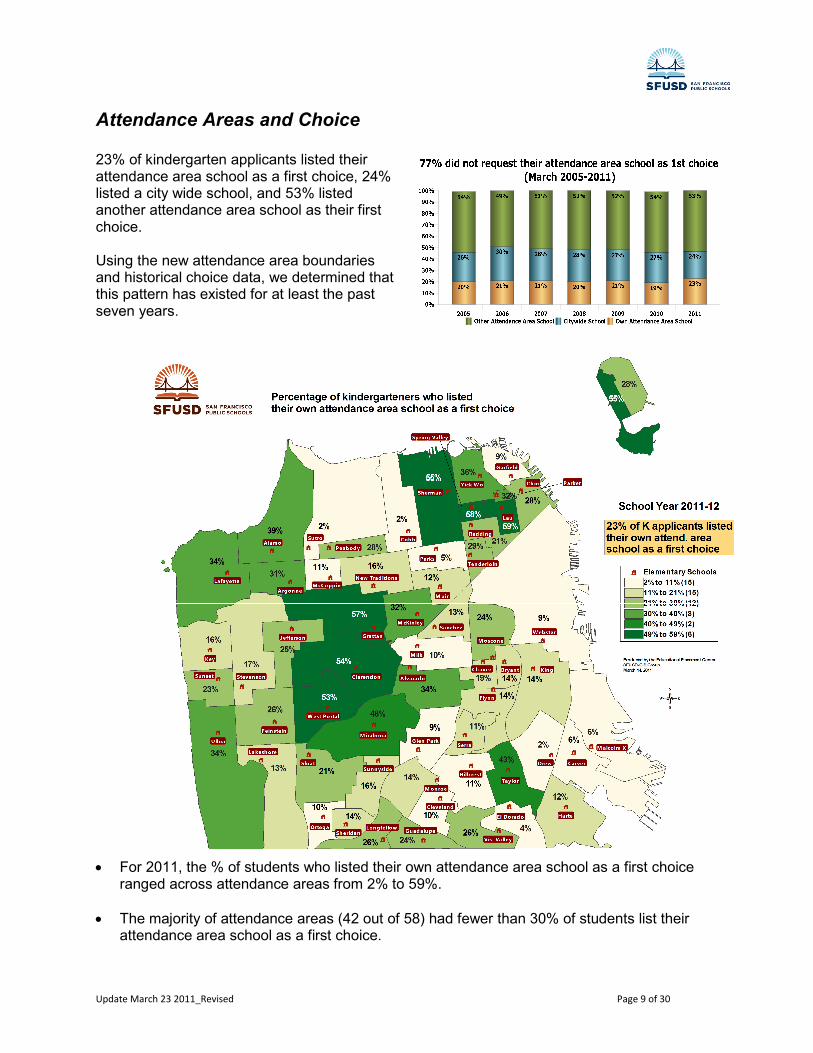
Attendance Areas and Choice 23% of kindergarten applicants listed their attendance area school as a first choice, 24% listed a city wide school, and 53% listed another attendance area school as their first choice. Using the new attendance area boundaries and historical choice data, we determined that this pattern has existed for at least the past seven years.
• For 2011, the % of students who listed their own attendance area school as a first choice ranged across attendance areas from 2% to 59%.
• The majority of attendance areas (42 out of 58) had fewer than 30% of students list their attendance area school as a first choice.

Update March 23 2011_Revised Page 10 of 30
Proximity and Choice
Kindergarten
24% of kindergarteners requested the school closest to where they live as a first choice, and 76% did not request their closest school. The map below shows where all kindergarten applicants for March 2011 live. Students who listed their closest school as a first choice are represented by a green triangle, and students who did not are represented by a red circle.
Of all the families who did not list their closest school as a first choice,
• 24% were younger siblings who listed their older sibling’s school as a first choice;
• 21% listed a city-wide school as a first choice;
• 9% listed their own attendance area as a first choice (not their closest school); and
• 46% listed another attendance area school as a first choice.
Update March 23 2011_Revised Page 11 of 30
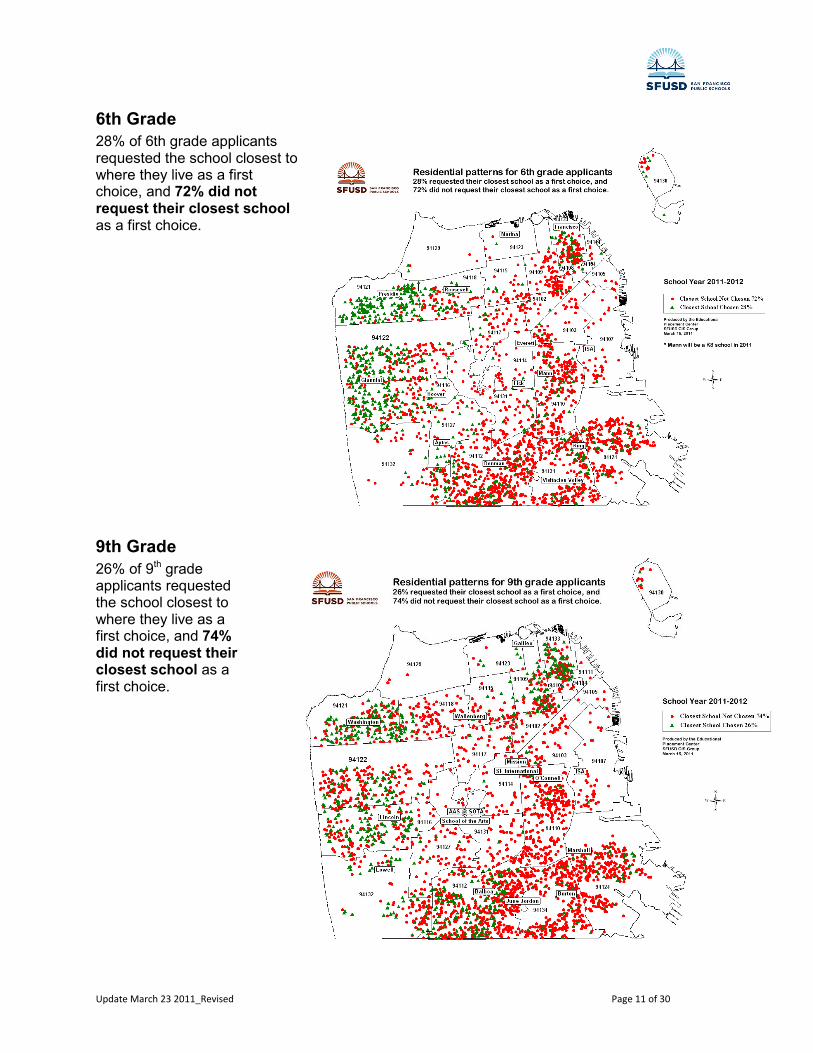
6th Grade
28% of 6th grade applicants requested the school closest to where they live as a first choice, and 72% did not request their closest school as a first choice.
9th Grade
26% of 9th grade applicants requested the school closest to where they live as a first choice, and 74% did not request their closest school as a first choice.
Update March 23 2011_Revised Page 12 of 30
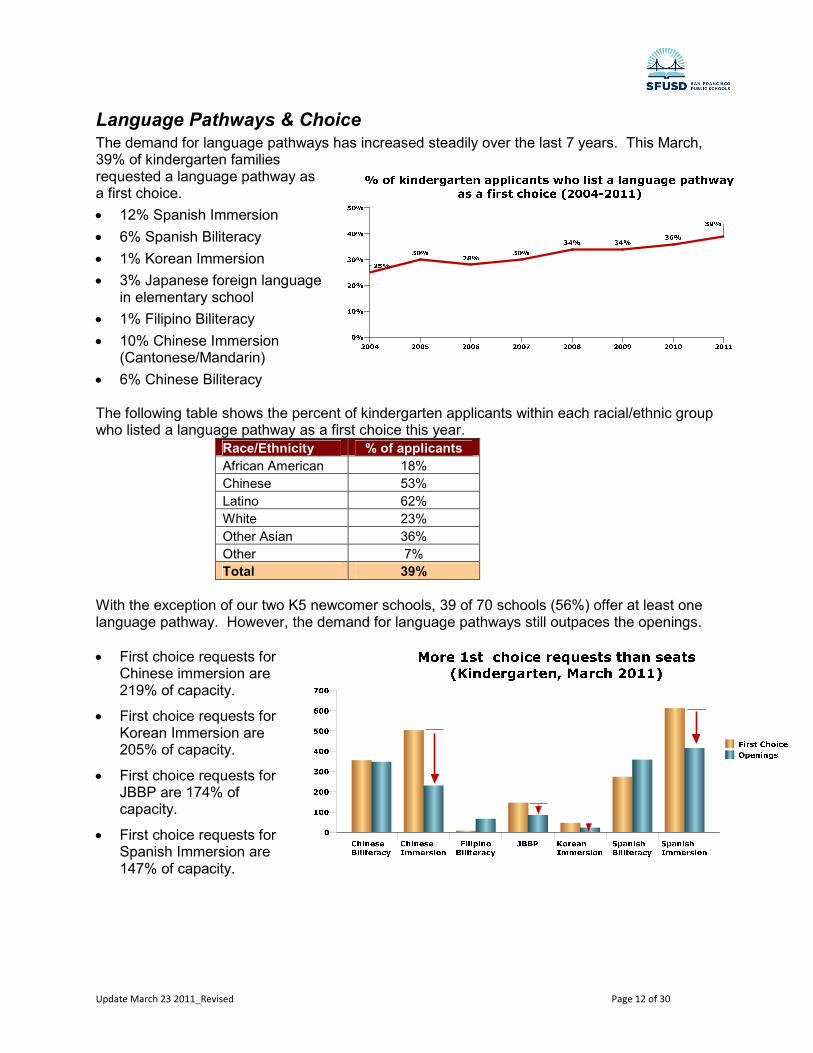
Language Pathways & Choice The demand for language pathways has increased steadily over the last 7 years. This March, 39% of kindergarten families requested a language pathway as a first choice.
• 12% Spanish Immersion
• 6% Spanish Biliteracy
• 1% Korean Immersion
• 3% Japanese foreign language in elementary school
• 1% Filipino Biliteracy
• 10% Chinese Immersion (Cantonese/Mandarin)
• 6% Chinese Biliteracy The following table shows the percent of kindergarten applicants within each racial/ethnic group who listed a language pathway as a first choice this year.
Race/Ethnicity % of applicants
African American 18%
Chinese 53%
Latino 62%
White 23%
Other Asian 36%
Other 7%
Total 39%
With the exception of our two K5 newcomer schools, 39 of 70 schools (56%) offer at least one language pathway. However, the demand for language pathways still outpaces the openings.
• First choice requests for Chinese immersion are 219% of capacity.
• First choice requests for Korean Immersion are 205% of capacity.
• First choice requests for JBBP are 174% of capacity.
• First choice requests for Spanish Immersion are 147% of capacity.

Update March 23 2011_Revised Page 13 of 30
K8 Schools & Choice
• 20% of kindergarten families request a K8 school as a first choice.
• First choice demand for K8 schools is 206% of capacity.
Siblings & Choice 1,270 of all kindergarten applicants (26%) listed an older sibling’s school as a first choice.
• 290 younger siblings (23%) live in the attendance area for the school they requested; and
• 980 younger siblings (77%) do not live in the attendance area for the school they requested.
The following schools had more than 20 younger siblings who listed the school as a first choice.
School Siblings who live in the attendance area
Siblings who do not live in the attendance area
Total Siblings
Alice Fong Yu No attendance area 41 41
Lilienthal No attendance area 41 41
Clarendon 10 30 40
Feinstein 3 36 39
W Portal 6 31 37
Miraloma 13 21 34
Stevenson 8 24 32
Guadalupe 10 21 31
Lafayette 12 16 28
Lau 11 16 27
Flynn 7 19 26
Fairmount No attendance area 25 25
Sloat 6 19 25
Sherman 6 18 24
Jefferson 5 19 24
Chavez 11 13 24
Rooftop No attendance area 23 23
Longfellow 7 16 23
Tenderloin 8 14 22
Alamo 9 13 22
Sunset 3 17 20
Lakeshore 2 18 20
Grattan 8 12 20
Argonne 6 14 20
Total 151 517 668
Update March 23 2011_Revised Page 14 of 30
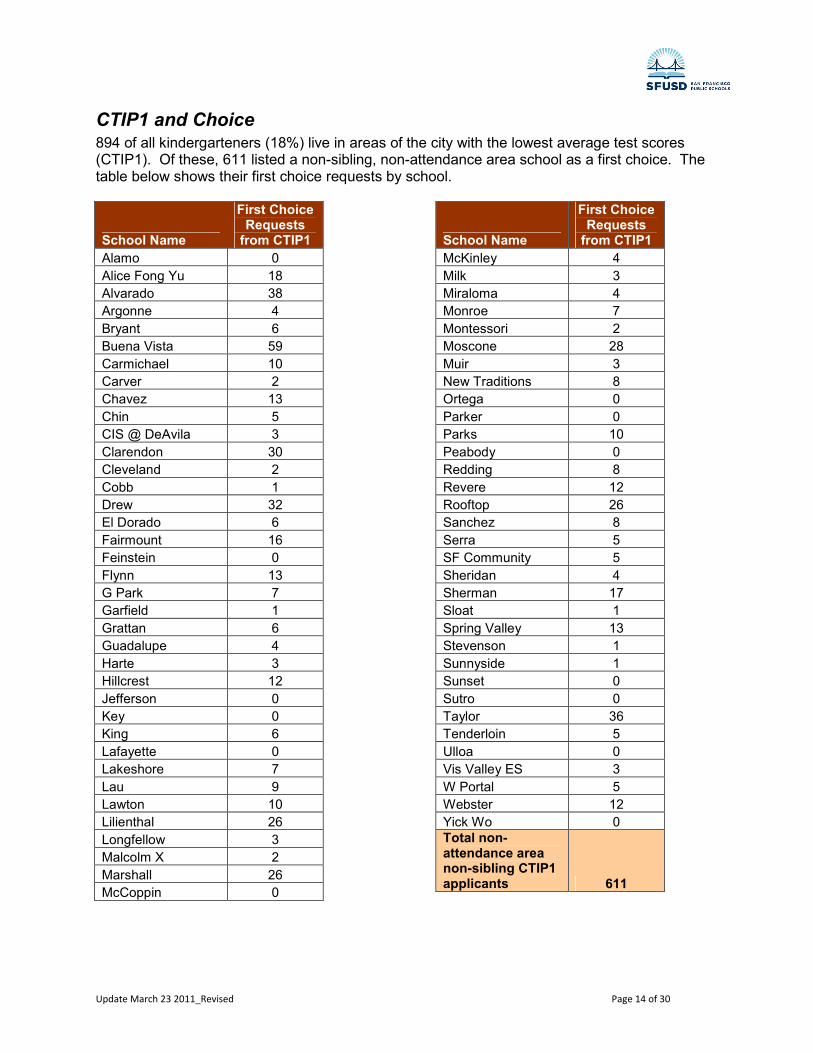
CTIP1 and Choice 894 of all kindergarteners (18%) live in areas of the city with the lowest average test scores (CTIP1). Of these, 611 listed a non-sibling, non-attendance area school as a first choice. The table below shows their first choice requests by school.
School Name
First Choice Requests from CTIP1
Alamo 0
Alice Fong Yu 18
Alvarado 38
Argonne 4
Bryant 6
Buena Vista 59
Carmichael 10
Carver 2
Chavez 13
Chin 5
CIS @ DeAvila 3
Clarendon 30
Cleveland 2
Cobb 1
Drew 32
El Dorado 6
Fairmount 16
Feinstein 0
Flynn 13
G Park 7
Garfield 1
Grattan 6
Guadalupe 4
Harte 3
Hillcrest 12
Jefferson 0
Key 0
King 6
Lafayette 0
Lakeshore 7
Lau 9
Lawton 10
Lilienthal 26
Longfellow 3
Malcolm X 2
Marshall 26
McCoppin 0
School Name
First Choice Requests from CTIP1
McKinley 4
Milk 3
Miraloma 4
Monroe 7
Montessori 2
Moscone 28
Muir 3
New Traditions 8
Ortega 0
Parker 0
Parks 10
Peabody 0
Redding 8
Revere 12
Rooftop 26
Sanchez 8
Serra 5
SF Community 5
Sheridan 4
Sherman 17
Sloat 1
Spring Valley 13
Stevenson 1
Sunnyside 1
Sunset 0
Sutro 0
Taylor 36
Tenderloin 5
Ulloa 0
Vis Valley ES 3
W Portal 5
Webster 12
Yick Wo 0
Total non-attendance area non-sibling CTIP1 applicants 611
Update March 23 2011_Revised Page 15 of 30
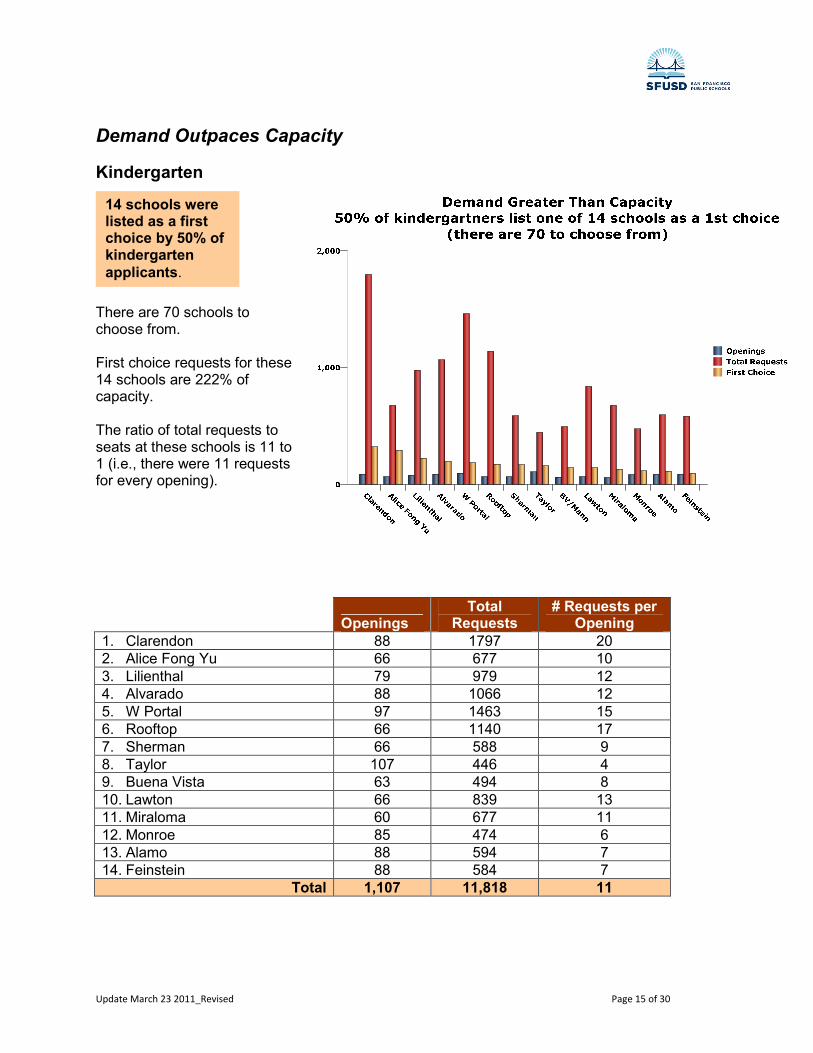
Demand Outpaces Capacity
Kindergarten
There are 70 schools to choose from. First choice requests for these 14 schools are 222% of capacity. The ratio of total requests to seats at these schools is 11 to 1 (i.e., there were 11 requests for every opening).
Openings Total
Requests # Requests per
Opening
1. Clarendon 88 1797 20
2. Alice Fong Yu 66 677 10
3. Lilienthal 79 979 12
4. Alvarado 88 1066 12
5. W Portal 97 1463 15
6. Rooftop 66 1140 17
7. Sherman 66 588 9
8. Taylor 107 446 4
9. Buena Vista 63 494 8
10. Lawton 66 839 13
11. Miraloma 60 677 11
12. Monroe 85 474 6
13. Alamo 88 594 7
14. Feinstein 88 584 7
Total 1,107 11,818 11
14 schools were listed as a first choice by 50% of kindergarten
applicants.
Update March 23 2011_Revised Page 16 of 30
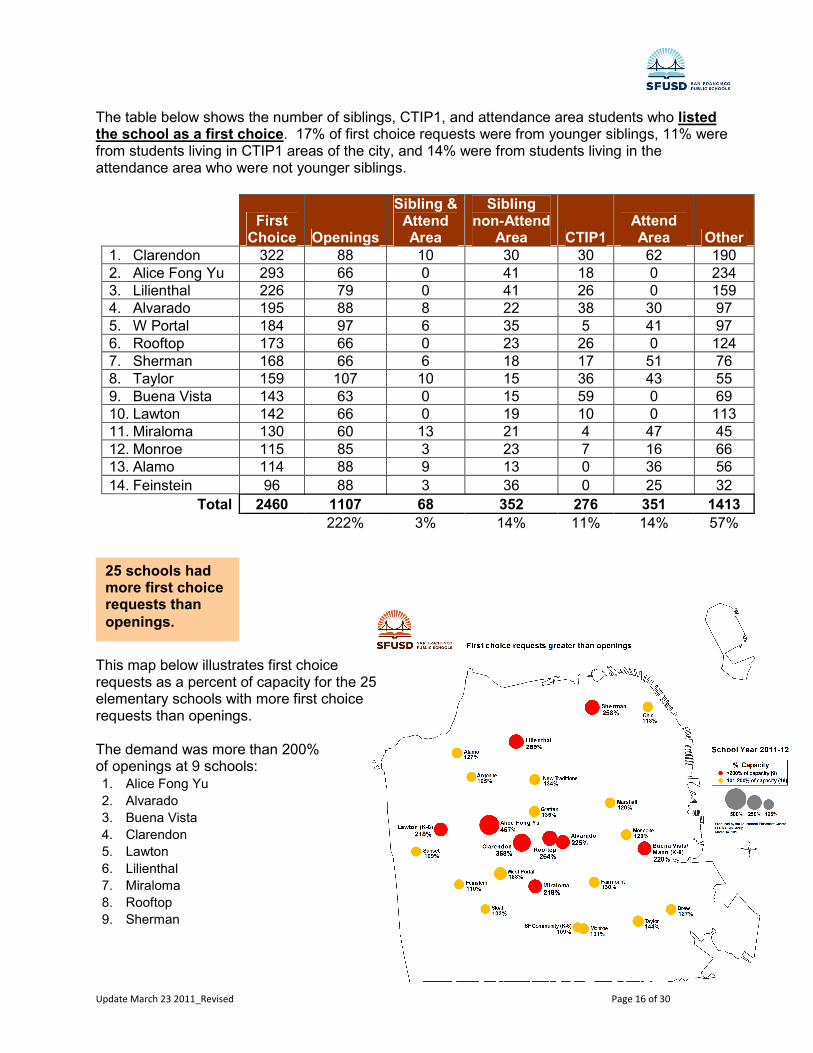
The table below shows the number of siblings, CTIP1, and attendance area students who listed the school as a first choice. 17% of first choice requests were from younger siblings, 11% were from students living in CTIP1 areas of the city, and 14% were from students living in the attendance area who were not younger siblings.
First Choice Openings
Sibling & Attend Area
Sibling non-Attend
Area CTIP1 Attend Area Other
1. Clarendon 322 88 10 30 30 62 190
2. Alice Fong Yu 293 66 0 41 18 0 234
3. Lilienthal 226 79 0 41 26 0 159
4. Alvarado 195 88 8 22 38 30 97
5. W Portal 184 97 6 35 5 41 97
6. Rooftop 173 66 0 23 26 0 124
7. Sherman 168 66 6 18 17 51 76
8. Taylor 159 107 10 15 36 43 55
9. Buena Vista 143 63 0 15 59 0 69
10. Lawton 142 66 0 19 10 0 113
11. Miraloma 130 60 13 21 4 47 45
12. Monroe 115 85 3 23 7 16 66
13. Alamo 114 88 9 13 0 36 56
14. Feinstein 96 88 3 36 0 25 32
Total 2460 1107 68 352 276 351 1413
222% 3% 14% 11% 14% 57%
This map below illustrates first choice requests as a percent of capacity for the 25 elementary schools with more first choice requests than openings. The demand was more than 200% of openings at 9 schools: 1. Alice Fong Yu
2. Alvarado
3. Buena Vista
4. Clarendon
5. Lawton
6. Lilienthal
7. Miraloma
8. Rooftop
9. Sherman
25 schools had more first choice requests than
openings.

Update March 23 2011_Revised Page 17 of 30
6th Grade Demand
First Choice Requests
• 50% of all applicants listed Giannini, Presidio, or Aptos as a first choice (there are 10 other middle school options)
• 74% listed six out of 13 middle school options as a first choice: Giannini, Presidio, Aptos, Hoover, Roosevelt, and Lick.
Openings First Choice
Total Requests
# Requests per Opening Siblings
Giannini 385 558 1359 4 68
Presidio 382 544 1335 3 56
Aptos 312 500 1206 4 49
9th Grade Demand
First Choice Requests
• 53% of all applicants listed Lowell, Lincoln, or Washington (there are 12 other high school options)
• 80% listed five out of 15 high school options as a first choice: Lowell, Lincoln, Washington, Balboa, and Galileo.
Openings First Choice
Total Requests
# Requests per Opening Siblings
Lincoln 488 628 2240 5 70
Washington 500 556 2162 4 99
Balboa 293 486 1436 5 69
Galileo 436 474 1663 4 95
Update March 23 2011_Revised Page 18 of 30
How the Student Assignment System Works
Students are assigned to schools through a choice process. The ability to assign students to a school of their choice is constrained by the number of requests for each school. As noted above requests outpace capacity – there are a select number of over subscribed schools and programs that cannot accommodate all students who request them. Therefore it is not possible to assign all students to a school of their choice. We’ve designed our assignment system to provide equitable access to the range of opportunities available in San Francisco’s public schools. When the number of requests for a school exceeds the number of spaces available tiebreakers are used to assign students to a school of their choice.
Choice Assignments Elementary Attendance Area Schools
1. Sibling. Requests from younger siblings of students who are enrolled in and will be attending the school during the year for which the younger sibling requests attendance.
2. Attendance Area SFUSD PreK. Requests from students who live in the attendance area of the school and are enrolled in an SFUSD PreK program in the same attendance area (see Appendix A).
3. CTIP1. Students who live in areas of the city with the lowest average test scores (see Appendix B).
4. Attendance Area. Requests from students who live in the attendance area of the school. 5. Density. Students who live in attendance areas that do
not have enough space to accommodate all the students living the attendance area (see Appendix C).
K5 and K8 Citywide Schools
1. Sibling. Requests from younger siblings of students who are enrolled in and will be attending the school during the year for which the younger sibling requests attendance.
2. PreK. Requests from students who attend in an SFUSD PreK program at the city-wide school they are applying to.
3. CTIP1. Students who live in areas of the city with the lowest average test scores (see Appendix B).
4. Density. Students who live in attendance areas that do not have enough space to accommodate all the students living the attendance area (see Appendix C).
Middle and High Schools1
1. Sibling. Requests from younger siblings of students who are enrolled in and will be attending the school during the year for which the younger sibling requests attendance.
2. CTIP1. Students who live in areas of the city with the lowest average test scores (see Appendix B).
1 Excluding Lowell and Asawa SOTA which have different admissions processes.
NCLB/Open Enrollment. For grades other than K, 6, or 9, the highest ranked tiebreaker is for students who attend a Program Improvement school or an Open Enrollment school (see Appendix D for more details).
Update March 23 2011_Revised Page 19 of 30
City-Wide Language Pathways
1. Current Language with Sibling. Requests from students who are currently enrolled in the language program and who are the younger sibling of students enrolled in the program. [The older sibling AND the younger sibling are in the language pathway.]
2. Current Language. Requests from students who are enrolled in and wish to continue in the language program.
3. Language Sibling. Requests from younger sibling of students who are enrolled in and will be enrolled in the program at the school at issue during the year for which the younger sibling requests attendance. [The older sibling is in a language pathway, but the younger sibling is not in a language pathway.]
4. CTIP1. Students who live in areas of the city with the lowest average test scores (see Appendix B for more details).
5. Density. Students who live in attendance areas that do not have enough space to accommodate all the students living the attendance area (see Appendix C for more details).
If tiebreakers do not resolve ties, then ties are resolved by a random number.
Designated Assignments Elementary students who cannot get assigned to a school of their choice because the number of requests is greater than the number of openings get a designated offer to their attendance area school if it has space. If there is no space in their attendance area school then students get a designated offer to the school closest to their home address with openings. Secondary students who cannot get assigned to a school of their choice because the number of requests is greater than the number of openings get a designated offer to the school closest to their home address with openings.
Update March 23 2011_Revised Page 20 of 30
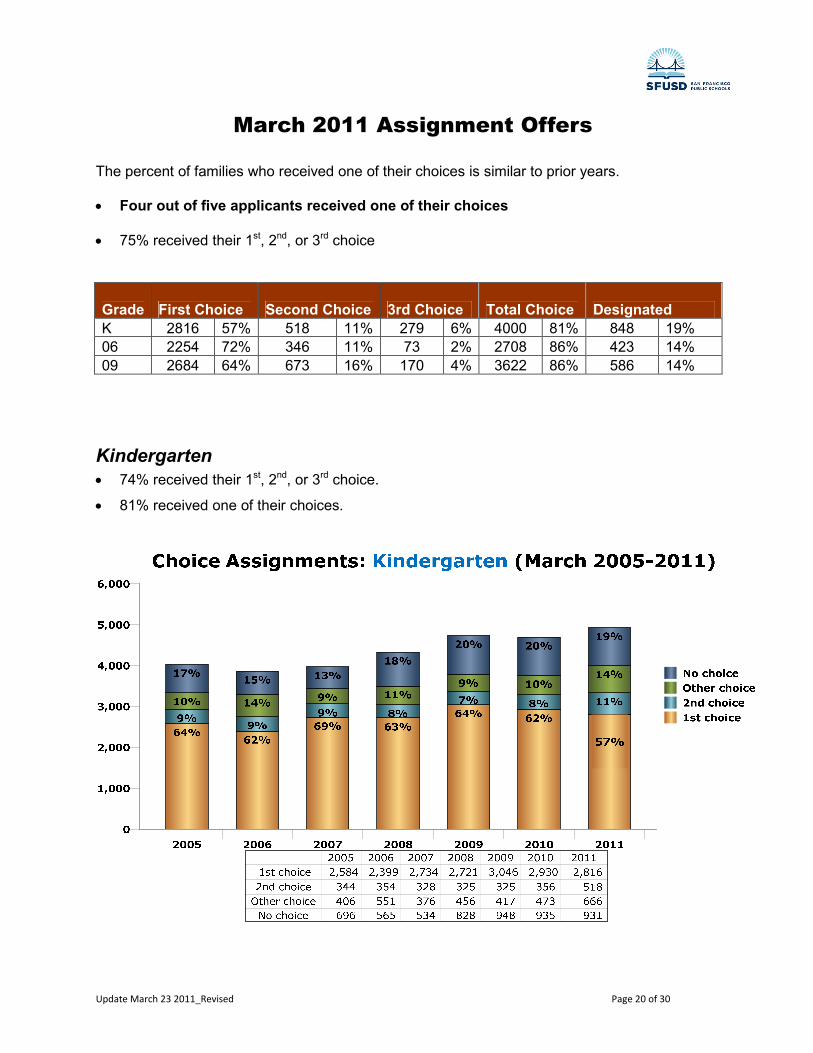
March 2011 Assignment Offers
The percent of families who received one of their choices is similar to prior years.
• Four out of five applicants received one of their choices
• 75% received their 1st, 2nd, or 3rd choice
Grade First Choice Second Choice 3rd Choice Total Choice Designated
K 2816 57% 518 11% 279 6% 4000 81% 848 19%
06 2254 72% 346 11% 73 2% 2708 86% 423 14%
09 2684 64% 673 16% 170 4% 3622 86% 586 14%
Kindergarten
• 74% received their 1st, 2nd, or 3rd choice.
• 81% received one of their choices.
Update March 23 2011_Revised Page 21 of 30
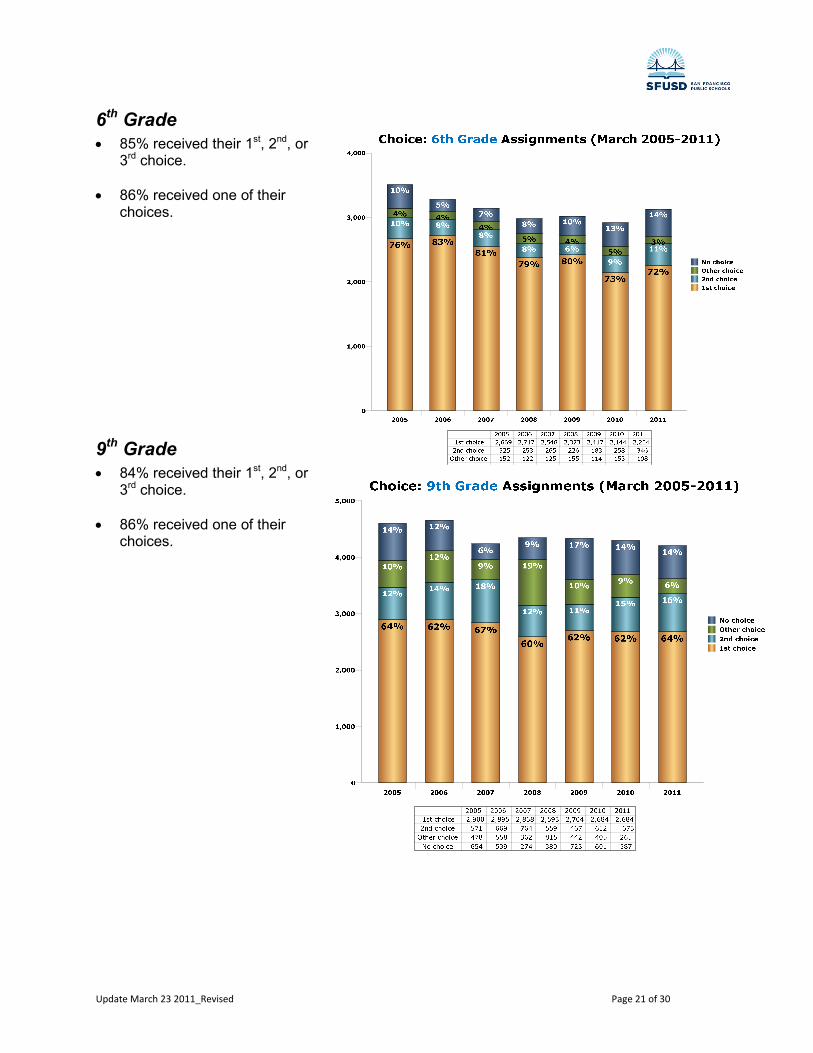
6th Grade
• 85% received their 1st, 2nd, or 3rd choice.
• 86% received one of their choices.
9th Grade
• 84% received their 1st, 2nd, or 3rd choice.
• 86% received one of their choices.
Update March 23 2011_Revised Page 22 of 30
Appendices
Update March 23 2011_Revised Page 23 of 30
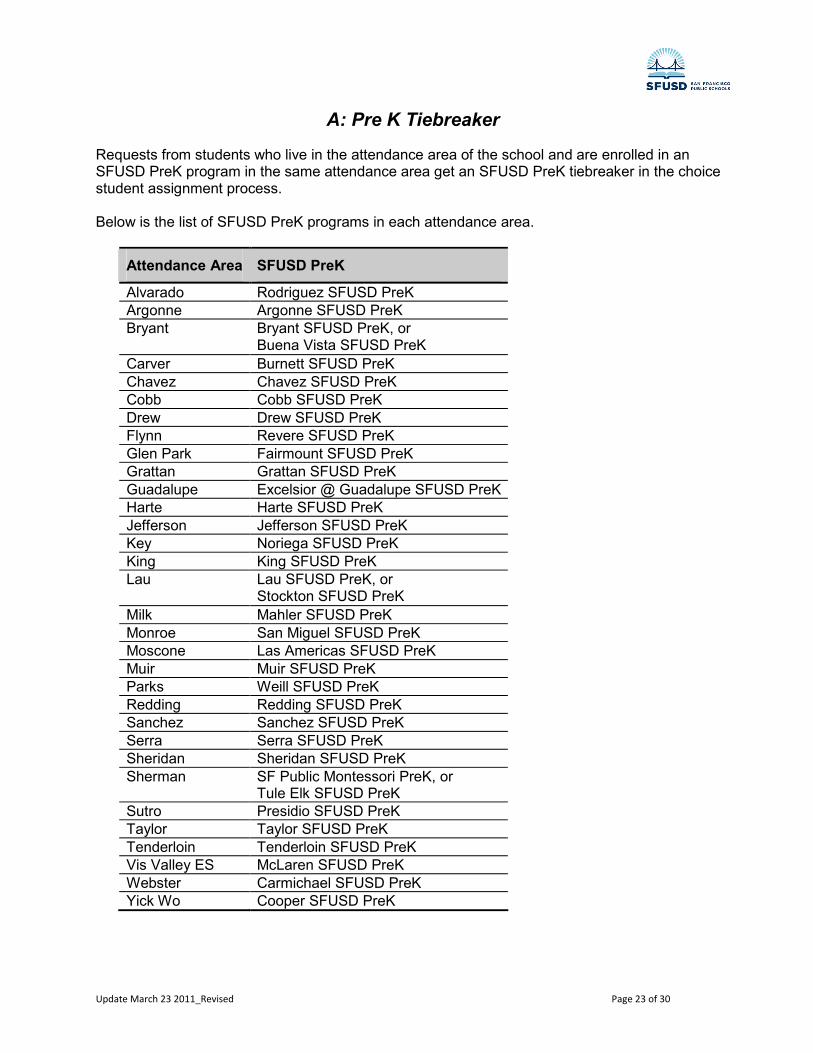
A: Pre K Tiebreaker
Requests from students who live in the attendance area of the school and are enrolled in an SFUSD PreK program in the same attendance area get an SFUSD PreK tiebreaker in the choice student assignment process. Below is the list of SFUSD PreK programs in each attendance area.
Attendance Area SFUSD PreK
Alvarado Rodriguez SFUSD PreK
Argonne Argonne SFUSD PreK
Bryant Bryant SFUSD PreK, or Buena Vista SFUSD PreK
Carver Burnett SFUSD PreK
Chavez Chavez SFUSD PreK
Cobb Cobb SFUSD PreK
Drew Drew SFUSD PreK
Flynn Revere SFUSD PreK
Glen Park Fairmount SFUSD PreK
Grattan Grattan SFUSD PreK
Guadalupe Excelsior @ Guadalupe SFUSD PreK
Harte Harte SFUSD PreK
Jefferson Jefferson SFUSD PreK
Key Noriega SFUSD PreK
King King SFUSD PreK
Lau Lau SFUSD PreK, or Stockton SFUSD PreK
Milk Mahler SFUSD PreK
Monroe San Miguel SFUSD PreK
Moscone Las Americas SFUSD PreK
Muir Muir SFUSD PreK
Parks Weill SFUSD PreK
Redding Redding SFUSD PreK
Sanchez Sanchez SFUSD PreK
Serra Serra SFUSD PreK
Sheridan Sheridan SFUSD PreK
Sherman SF Public Montessori PreK, or Tule Elk SFUSD PreK
Sutro Presidio SFUSD PreK
Taylor Taylor SFUSD PreK
Tenderloin Tenderloin SFUSD PreK
Vis Valley ES McLaren SFUSD PreK
Webster Carmichael SFUSD PreK
Yick Wo Cooper SFUSD PreK
Update March 23 2011_Revised Page 24 of 30
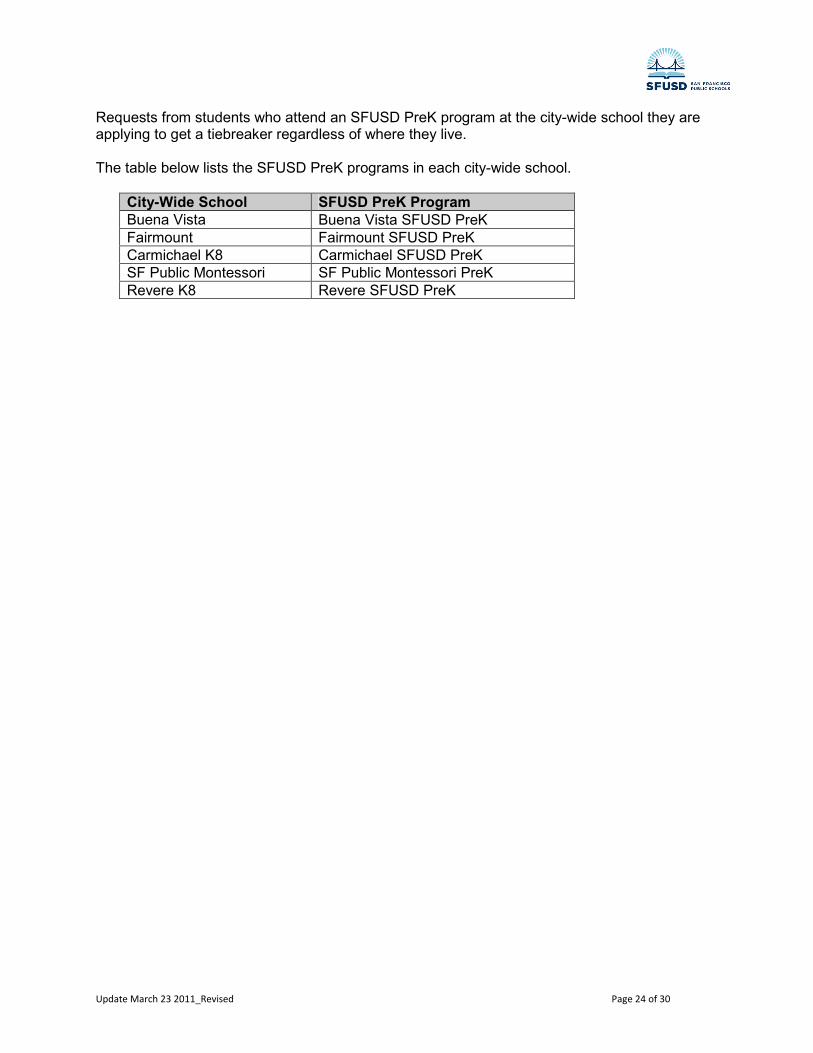
Requests from students who attend an SFUSD PreK program at the city-wide school they are applying to get a tiebreaker regardless of where they live. The table below lists the SFUSD PreK programs in each city-wide school.
City-Wide School SFUSD PreK Program
Buena Vista Buena Vista SFUSD PreK
Fairmount Fairmount SFUSD PreK
Carmichael K8 Carmichael SFUSD PreK
SF Public Montessori SF Public Montessori PreK
Revere K8 Revere SFUSD PreK
Update March 23 2011_Revised Page 25 of 30
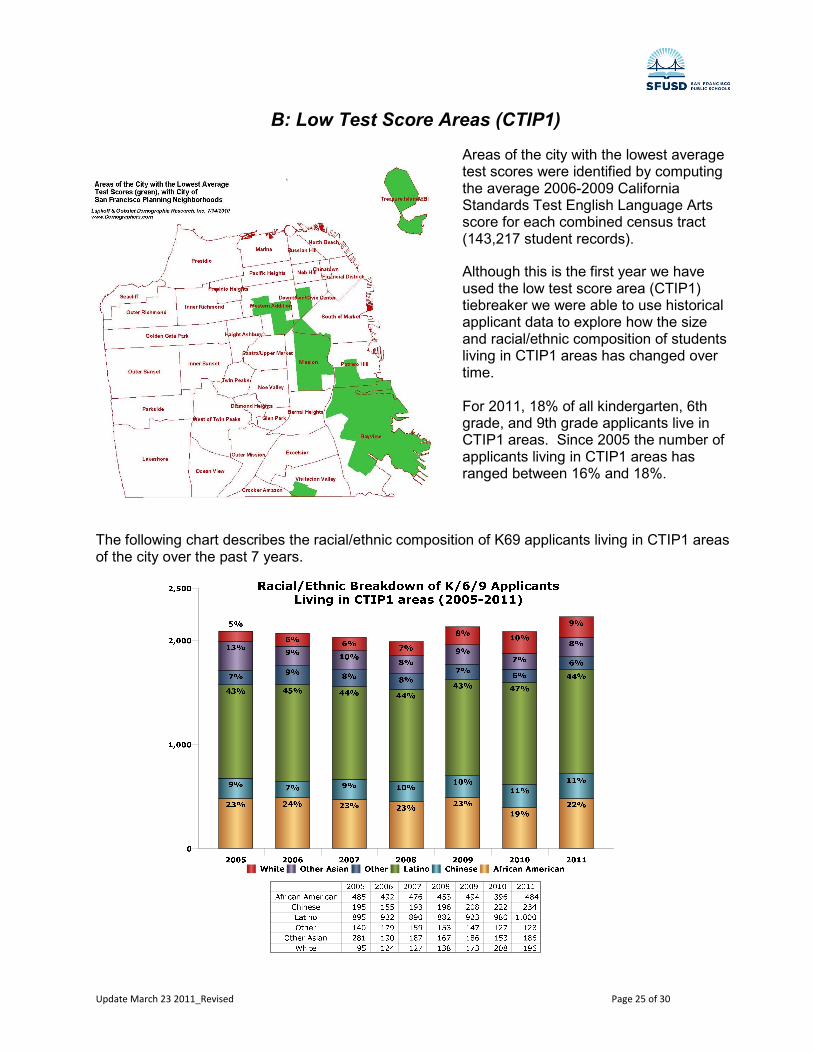
B: Low Test Score Areas (CTIP1)
Areas of the city with the lowest average test scores were identified by computing the average 2006-2009 California Standards Test English Language Arts score for each combined census tract (143,217 student records).
Although this is the first year we have used the low test score area (CTIP1) tiebreaker we were able to use historical applicant data to explore how the size and racial/ethnic composition of students living in CTIP1 areas has changed over time.
For 2011, 18% of all kindergarten, 6th grade, and 9th grade applicants live in CTIP1 areas. Since 2005 the number of applicants living in CTIP1 areas has ranged between 16% and 18%.
The following chart describes the racial/ethnic composition of K69 applicants living in CTIP1 areas of the city over the past 7 years.
Update March 23 2011_Revised Page 26 of 30
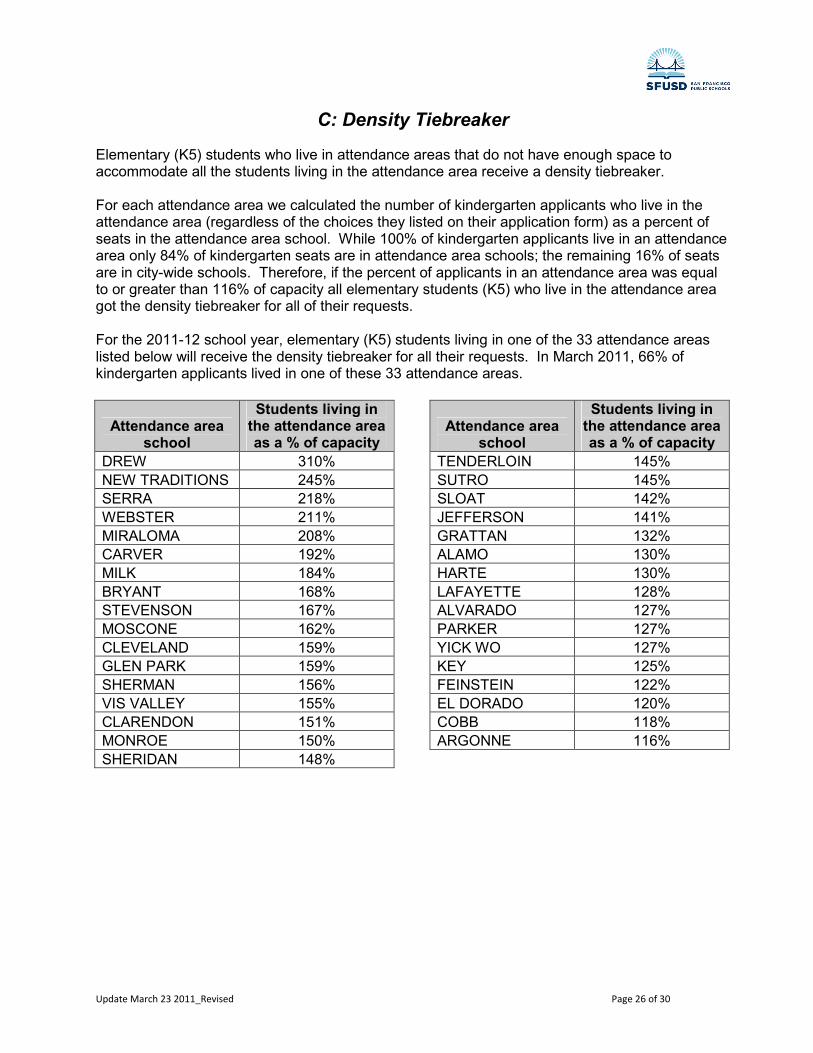
C: Density Tiebreaker
Elementary (K5) students who live in attendance areas that do not have enough space to accommodate all the students living in the attendance area receive a density tiebreaker. For each attendance area we calculated the number of kindergarten applicants who live in the attendance area (regardless of the choices they listed on their application form) as a percent of seats in the attendance area school. While 100% of kindergarten applicants live in an attendance area only 84% of kindergarten seats are in attendance area schools; the remaining 16% of seats are in city-wide schools. Therefore, if the percent of applicants in an attendance area was equal to or greater than 116% of capacity all elementary students (K5) who live in the attendance area got the density tiebreaker for all of their requests. For the 2011-12 school year, elementary (K5) students living in one of the 33 attendance areas listed below will receive the density tiebreaker for all their requests. In March 2011, 66% of kindergarten applicants lived in one of these 33 attendance areas.
Attendance area school
Students living in the attendance area as a % of capacity
DREW 310%
NEW TRADITIONS 245%
SERRA 218%
WEBSTER 211%
MIRALOMA 208%
CARVER 192%
MILK 184%
BRYANT 168%
STEVENSON 167%
MOSCONE 162%
CLEVELAND 159%
GLEN PARK 159%
SHERMAN 156%
VIS VALLEY 155%
CLARENDON 151%
MONROE 150%
SHERIDAN 148%
Attendance area school
Students living in the attendance area as a % of capacity
TENDERLOIN 145%
SUTRO 145%
SLOAT 142%
JEFFERSON 141%
GRATTAN 132%
ALAMO 130%
HARTE 130%
LAFAYETTE 128%
ALVARADO 127%
PARKER 127%
YICK WO 127%
KEY 125%
FEINSTEIN 122%
EL DORADO 120%
COBB 118%
ARGONNE 116%
Update March 23 2011_Revised Page 27 of 30
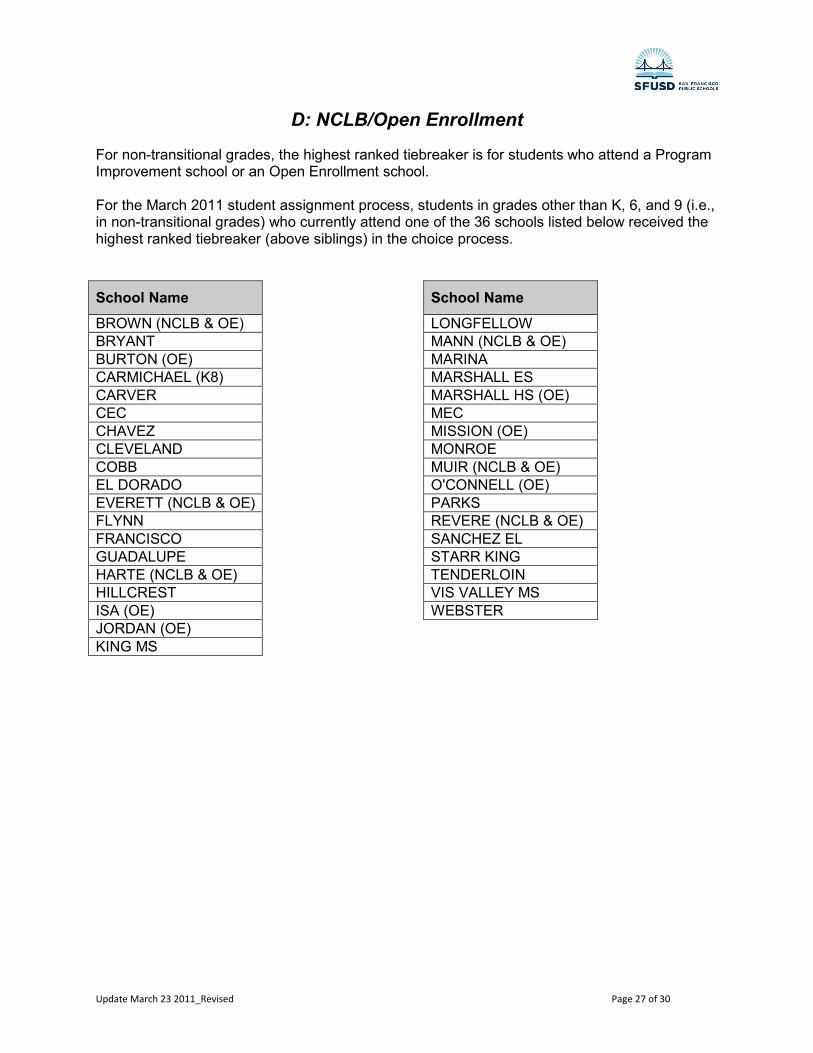
D: NCLB/Open Enrollment
For non-transitional grades, the highest ranked tiebreaker is for students who attend a Program Improvement school or an Open Enrollment school. For the March 2011 student assignment process, students in grades other than K, 6, and 9 (i.e., in non-transitional grades) who currently attend one of the 36 schools listed below received the highest ranked tiebreaker (above siblings) in the choice process.
School Name
BROWN (NCLB & OE)
BRYANT
BURTON (OE)
CARMICHAEL (K8)
CARVER
CEC
CHAVEZ
CLEVELAND
COBB
EL DORADO
EVERETT (NCLB & OE)
FLYNN
FRANCISCO
GUADALUPE
HARTE (NCLB & OE)
HILLCREST
ISA (OE)
JORDAN (OE)
KING MS
School Name
LONGFELLOW
MANN (NCLB & OE)
MARINA
MARSHALL ES
MARSHALL HS (OE)
MEC
MISSION (OE)
MONROE
MUIR (NCLB & OE)
O'CONNELL (OE)
PARKS
REVERE (NCLB & OE)
SANCHEZ EL
STARR KING
TENDERLOIN
VIS VALLEY MS
WEBSTER
Update March 23 2011_Revised Page 28 of 30
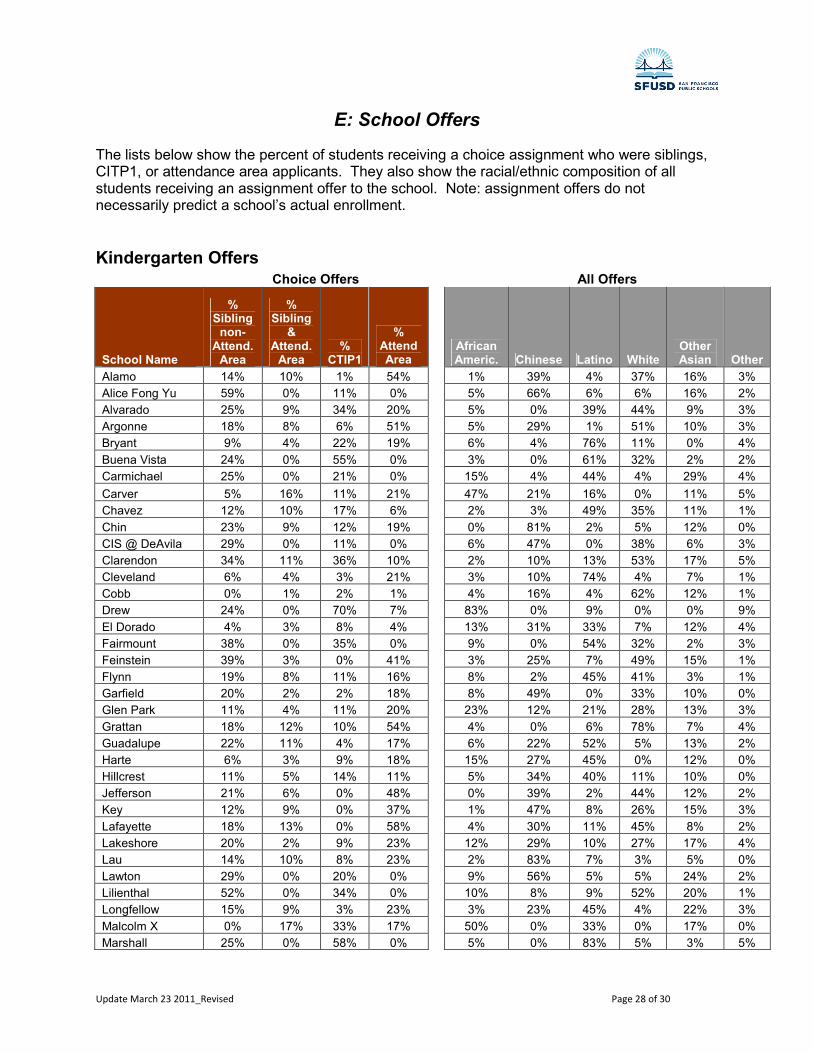
E: School Offers
The lists below show the percent of students receiving a choice assignment who were siblings, CITP1, or attendance area applicants. They also show the racial/ethnic composition of all students receiving an assignment offer to the school. Note: assignment offers do not necessarily predict a school’s actual enrollment.
Kindergarten Offers Choice Offers All Offers
School Name
% Sibling non-
Attend. Area
% Sibling
& Attend. Area
% CTIP1
% Attend Area
African Americ. Chinese Latino White
Other Asian Other
Alamo 14% 10% 1% 54% 1% 39% 4% 37% 16% 3%
Alice Fong Yu 59% 0% 11% 0% 5% 66% 6% 6% 16% 2%
Alvarado 25% 9% 34% 20% 5% 0% 39% 44% 9% 3%
Argonne 18% 8% 6% 51% 5% 29% 1% 51% 10% 3%
Bryant 9% 4% 22% 19% 6% 4% 76% 11% 0% 4%
Buena Vista 24% 0% 55% 0% 3% 0% 61% 32% 2% 2%
Carmichael 25% 0% 21% 0% 15% 4% 44% 4% 29% 4%
Carver 5% 16% 11% 21% 47% 21% 16% 0% 11% 5%
Chavez 12% 10% 17% 6% 2% 3% 49% 35% 11% 1%
Chin 23% 9% 12% 19% 0% 81% 2% 5% 12% 0%
CIS @ DeAvila 29% 0% 11% 0% 6% 47% 0% 38% 6% 3%
Clarendon 34% 11% 36% 10% 2% 10% 13% 53% 17% 5%
Cleveland 6% 4% 3% 21% 3% 10% 74% 4% 7% 1%
Cobb 0% 1% 2% 1% 4% 16% 4% 62% 12% 1%
Drew 24% 0% 70% 7% 83% 0% 9% 0% 0% 9%
El Dorado 4% 3% 8% 4% 13% 31% 33% 7% 12% 4%
Fairmount 38% 0% 35% 0% 9% 0% 54% 32% 2% 3%
Feinstein 39% 3% 0% 41% 3% 25% 7% 49% 15% 1%
Flynn 19% 8% 11% 16% 8% 2% 45% 41% 3% 1%
Garfield 20% 2% 2% 18% 8% 49% 0% 33% 10% 0%
Glen Park 11% 4% 11% 20% 23% 12% 21% 28% 13% 3%
Grattan 18% 12% 10% 54% 4% 0% 6% 78% 7% 4%
Guadalupe 22% 11% 4% 17% 6% 22% 52% 5% 13% 2%
Harte 6% 3% 9% 18% 15% 27% 45% 0% 12% 0%
Hillcrest 11% 5% 14% 11% 5% 34% 40% 11% 10% 0%
Jefferson 21% 6% 0% 48% 0% 39% 2% 44% 12% 2%
Key 12% 9% 0% 37% 1% 47% 8% 26% 15% 3%
Lafayette 18% 13% 0% 58% 4% 30% 11% 45% 8% 2%
Lakeshore 20% 2% 9% 23% 12% 29% 10% 27% 17% 4%
Lau 14% 10% 8% 23% 2% 83% 7% 3% 5% 0%
Lawton 29% 0% 20% 0% 9% 56% 5% 5% 24% 2%
Lilienthal 52% 0% 34% 0% 10% 8% 9% 52% 20% 1%
Longfellow 15% 9% 3% 23% 3% 23% 45% 4% 22% 3%
Malcolm X 0% 17% 33% 17% 50% 0% 33% 0% 17% 0%
Marshall 25% 0% 58% 0% 5% 0% 83% 5% 3% 5%
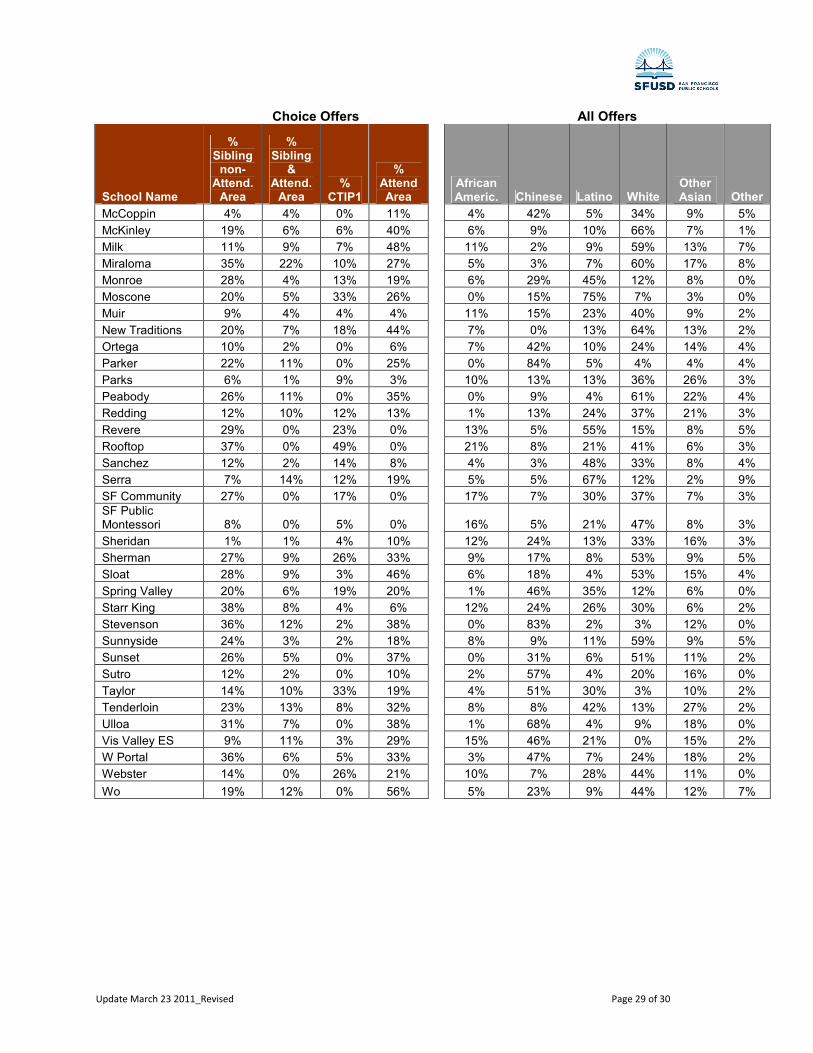
Update March 23 2011_Revised Page 29 of 30
Choice Offers All Offers
School Name
% Sibling non-
Attend. Area
% Sibling
& Attend. Area
% CTIP1
% Attend Area
African Americ. Chinese Latino White
Other Asian Other
McCoppin 4% 4% 0% 11% 4% 42% 5% 34% 9% 5%
McKinley 19% 6% 6% 40% 6% 9% 10% 66% 7% 1%
Milk 11% 9% 7% 48% 11% 2% 9% 59% 13% 7%
Miraloma 35% 22% 10% 27% 5% 3% 7% 60% 17% 8%
Monroe 28% 4% 13% 19% 6% 29% 45% 12% 8% 0%
Moscone 20% 5% 33% 26% 0% 15% 75% 7% 3% 0%
Muir 9% 4% 4% 4% 11% 15% 23% 40% 9% 2%
New Traditions 20% 7% 18% 44% 7% 0% 13% 64% 13% 2%
Ortega 10% 2% 0% 6% 7% 42% 10% 24% 14% 4%
Parker 22% 11% 0% 25% 0% 84% 5% 4% 4% 4%
Parks 6% 1% 9% 3% 10% 13% 13% 36% 26% 3%
Peabody 26% 11% 0% 35% 0% 9% 4% 61% 22% 4%
Redding 12% 10% 12% 13% 1% 13% 24% 37% 21% 3%
Revere 29% 0% 23% 0% 13% 5% 55% 15% 8% 5%
Rooftop 37% 0% 49% 0% 21% 8% 21% 41% 6% 3%
Sanchez 12% 2% 14% 8% 4% 3% 48% 33% 8% 4%
Serra 7% 14% 12% 19% 5% 5% 67% 12% 2% 9%
SF Community 27% 0% 17% 0% 17% 7% 30% 37% 7% 3%
SF Public Montessori 8% 0% 5% 0% 16% 5% 21% 47% 8% 3%
Sheridan 1% 1% 4% 10% 12% 24% 13% 33% 16% 3%
Sherman 27% 9% 26% 33% 9% 17% 8% 53% 9% 5%
Sloat 28% 9% 3% 46% 6% 18% 4% 53% 15% 4%
Spring Valley 20% 6% 19% 20% 1% 46% 35% 12% 6% 0%
Starr King 38% 8% 4% 6% 12% 24% 26% 30% 6% 2%
Stevenson 36% 12% 2% 38% 0% 83% 2% 3% 12% 0%
Sunnyside 24% 3% 2% 18% 8% 9% 11% 59% 9% 5%
Sunset 26% 5% 0% 37% 0% 31% 6% 51% 11% 2%
Sutro 12% 2% 0% 10% 2% 57% 4% 20% 16% 0%
Taylor 14% 10% 33% 19% 4% 51% 30% 3% 10% 2%
Tenderloin 23% 13% 8% 32% 8% 8% 42% 13% 27% 2%
Ulloa 31% 7% 0% 38% 1% 68% 4% 9% 18% 0%
Vis Valley ES 9% 11% 3% 29% 15% 46% 21% 0% 15% 2%
W Portal 36% 6% 5% 33% 3% 47% 7% 24% 18% 2%
Webster 14% 0% 26% 21% 10% 7% 28% 44% 11% 0%
Wo 19% 12% 0% 56% 5% 23% 9% 44% 12% 7%

Update March 23 2011_Revised Page 30 of 30
6th Grade Offers
Choice Offers All Offers
School Name %
Sibling %
CTIP1 African American Chinese Latino White
Other Asian Other
Aptos 13% 24% 10% 21% 32% 18% 13% 6%
Buena Vista/Mann 3% 30% 1% 0% 79% 10% 6% 3%
Denman 6% 5% 5% 28% 33% 6% 20% 8%
Everett 3% 13% 10% 20% 29% 20% 15% 6%
Francisco 9% 9% 9% 59% 13% 10% 6% 4%
Giannini 16% 10% 6% 50% 11% 13% 14% 6%
Hoover 14% 14% 5% 46% 23% 9% 12% 5%
ISA 16% 28% 26% 7% 35% 16% 5% 12%
King 9% 25% 16% 37% 18% 5% 19% 5%
Lick 11% 47% 10% 1% 65% 12% 4% 9%
Marina 8% 8% 6% 55% 15% 8% 11% 5%
Presidio 13% 11% 7% 39% 11% 19% 18% 6%
Roosevelt 11% 22% 4% 33% 15% 22% 19% 7%
Vis Valley MS 2% 11% 15% 28% 32% 4% 13% 8%
9th Grade Offers Choice Offers All Offers
School Name %
Sibling %
CTIP1 African American Chinese Latino White
Other Asian Other
AAS @ SOTA 2% 42% 13% 7% 46% 19% 10% 5%
Asawa SOTA* 0% 8% 7% 19% 12% 44% 12% 7%
Balboa 19% 30% 11% 25% 31% 9% 15% 9%
Burton 3% 6% 7% 27% 24% 9% 26% 8%
Galileo 14% 19% 6% 51% 18% 6% 14% 5%
ISA 4% 25% 29% 4% 33% 0% 25% 8%
Jordan 1% 33% 33% 4% 50% 4% 5% 5%
Lincoln 11% 18% 8% 42% 21% 9% 15% 5%
Lowell* 0% 9% 2% 39% 10% 22% 19% 8%
Marshall 8% 11% 12% 36% 14% 9% 19% 10%
Mission 5% 10% 10% 24% 25% 22% 15% 4%
O'Connell 3% 6% 7% 27% 23% 21% 14% 6%
SF International 0% 50% 0% 0% 50% 0% 50% 0%
Wallenberg 6% 18% 13% 40% 24% 10% 11% 1%
Washington 15% 20% 8% 43% 17% 10% 19% 4%
* Different admissions process for Lowell and SOTA