san francisco unified school district 16-17 - sfusd - first... · sacs financial reporting software...
TRANSCRIPT
Office of the Chief Financial Officer ffi
Budget Services
135 Van Ness Avenue
San Francisco, CA 94102
Board of Education
Office of the Superintendent
555 Franklin Street
San Francisco, CA 94102
San Francisco Unified School District
First Interim Budget
For Fiscal year
2016~17
December 13, 2016
BOARD OF EDUCATION
Matt Haney, President
SHAMANN WALTON , VICE PRESIDENT
SANDRA LEE FEWER
HYDRA MENDOZA-MCDONNELL
EMILY M. MURASE, PH.D.
RACHEL NORTON
JILL WYNNS
RECOMMENDED BY
MYONG LEIGH
INTERIM SUPERINTENDENT OF SCHOOLS
DECEMBER, 2016

San Francisco UnifiedSan Francisco County
First InterimDISTRICT CERTIFICATION OF INTERIM REPORT
For the Fiscal Year 2016-1738 68478 0000000
Form CI
California Dept of EducationSACS Financial Reporting Software - 2016.2.0File: ci (Rev 04/09/2015) Page 1 of 3 Printed: 12/9/2016 12:13 PM
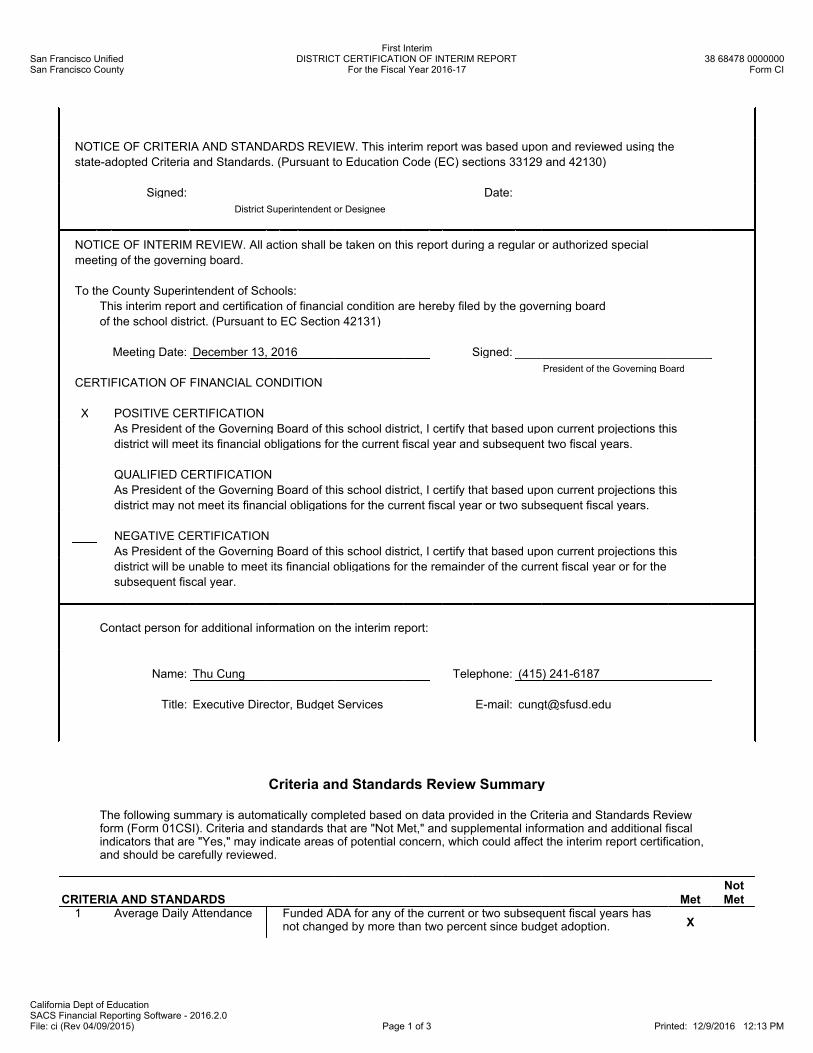
NOTICE OF CRITERIA AND STANDARDS REVIEW. This interim report was based upon and reviewed using the
state-adopted Criteria and Standards. (Pursuant to Education Code (EC) sections 33129 and 42130)
Signed: Date:
District Superintendent or Designee
NOTICE OF INTERIM REVIEW. All action shall be taken on this report during a regular or authorized special
meeting of the governing board.
To the County Superintendent of Schools:
This interim report and certification of financial condition are hereby filed by the governing board
of the school district. (Pursuant to EC Section 42131)
Meeting Date: December 13, 2016 Signed:
President of the Governing Board
CERTIFICATION OF FINANCIAL CONDITION
X POSITIVE CERTIFICATION
As President of the Governing Board of this school district, I certify that based upon current projections this
district will meet its financial obligations for the current fiscal year and subsequent two fiscal years.
QUALIFIED CERTIFICATION
As President of the Governing Board of this school district, I certify that based upon current projections this
district may not meet its financial obligations for the current fiscal year or two subsequent fiscal years.
NEGATIVE CERTIFICATION
As President of the Governing Board of this school district, I certify that based upon current projections this
district will be unable to meet its financial obligations for the remainder of the current fiscal year or for the
subsequent fiscal year.
Contact person for additional information on the interim report:
Name: Thu Cung Telephone: (415) 241-6187
Title: Executive Director, Budget Services E-mail: [email protected]
Criteria and Standards Review Summary
The following summary is automatically completed based on data provided in the Criteria and Standards Reviewform (Form 01CSI). Criteria and standards that are "Not Met," and supplemental information and additional fiscalindicators that are "Yes," may indicate areas of potential concern, which could affect the interim report certification,and should be carefully reviewed.
CRITERIA AND STANDARDS Met
Not
Met1 Average Daily Attendance Funded ADA for any of the current or two subsequent fiscal years has
not changed by more than two percent since budget adoption. X
San Francisco UnifiedSan Francisco County
First InterimDISTRICT CERTIFICATION OF INTERIM REPORT
For the Fiscal Year 2016-1738 68478 0000000
Form CI
California Dept of EducationSACS Financial Reporting Software - 2016.2.0File: ci (Rev 04/09/2015) Page 2 of 3 Printed: 12/9/2016 12:13 PM
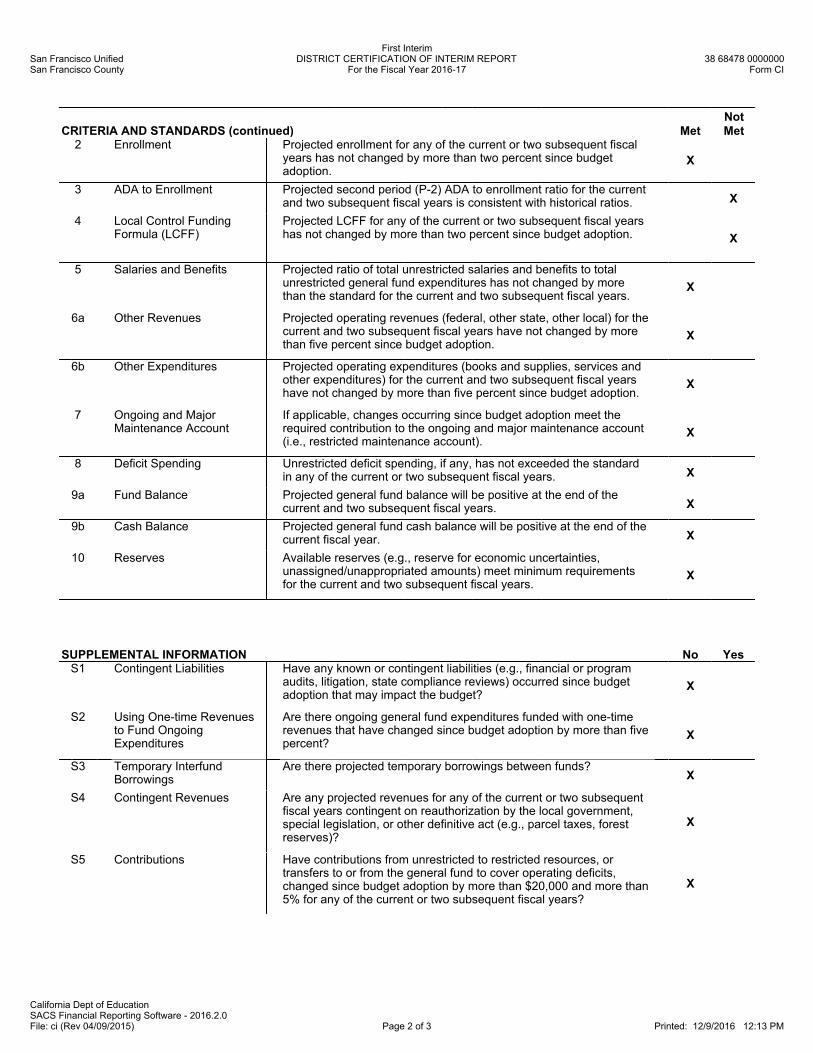
CRITERIA AND STANDARDS (continued) Met
Not
Met2 Enrollment Projected enrollment for any of the current or two subsequent fiscal
years has not changed by more than two percent since budgetadoption.
X
3 ADA to Enrollment Projected second period (P-2) ADA to enrollment ratio for the currentand two subsequent fiscal years is consistent with historical ratios. X
4 Local Control FundingFormula (LCFF)
Projected LCFF for any of the current or two subsequent fiscal yearshas not changed by more than two percent since budget adoption. X
5 Salaries and Benefits Projected ratio of total unrestricted salaries and benefits to totalunrestricted general fund expenditures has not changed by morethan the standard for the current and two subsequent fiscal years.
X
6a Other Revenues Projected operating revenues (federal, other state, other local) for thecurrent and two subsequent fiscal years have not changed by morethan five percent since budget adoption.
X
6b Other Expenditures Projected operating expenditures (books and supplies, services andother expenditures) for the current and two subsequent fiscal yearshave not changed by more than five percent since budget adoption.
X
7 Ongoing and MajorMaintenance Account
If applicable, changes occurring since budget adoption meet therequired contribution to the ongoing and major maintenance account(i.e., restricted maintenance account).
X
8 Deficit Spending Unrestricted deficit spending, if any, has not exceeded the standardin any of the current or two subsequent fiscal years. X
9a Fund Balance Projected general fund balance will be positive at the end of thecurrent and two subsequent fiscal years. X
9b Cash Balance Projected general fund cash balance will be positive at the end of thecurrent fiscal year. X
10 Reserves Available reserves (e.g., reserve for economic uncertainties,unassigned/unappropriated amounts) meet minimum requirementsfor the current and two subsequent fiscal years.
X
SUPPLEMENTAL INFORMATION No YesS1 Contingent Liabilities Have any known or contingent liabilities (e.g., financial or program
audits, litigation, state compliance reviews) occurred since budgetadoption that may impact the budget?
X
S2 Using One-time Revenuesto Fund OngoingExpenditures
Are there ongoing general fund expenditures funded with one-timerevenues that have changed since budget adoption by more than fivepercent?
X
S3 Temporary InterfundBorrowings
Are there projected temporary borrowings between funds?X
S4 Contingent Revenues Are any projected revenues for any of the current or two subsequentfiscal years contingent on reauthorization by the local government,special legislation, or other definitive act (e.g., parcel taxes, forestreserves)?
X
S5 Contributions Have contributions from unrestricted to restricted resources, ortransfers to or from the general fund to cover operating deficits,changed since budget adoption by more than $20,000 and more than5% for any of the current or two subsequent fiscal years?
X
San Francisco UnifiedSan Francisco County
First InterimDISTRICT CERTIFICATION OF INTERIM REPORT
For the Fiscal Year 2016-1738 68478 0000000
Form CI
California Dept of EducationSACS Financial Reporting Software - 2016.2.0File: ci (Rev 04/09/2015) Page 3 of 3 Printed: 12/9/2016 12:13 PM
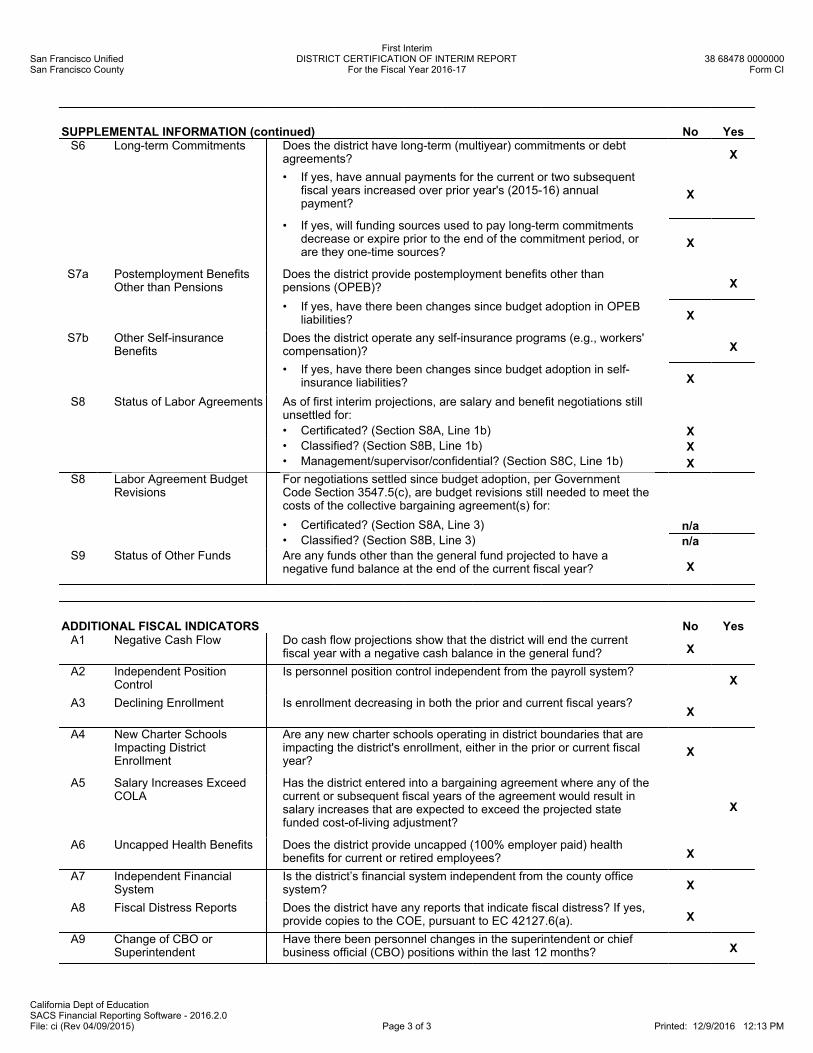
SUPPLEMENTAL INFORMATION (continued) No YesS6 Long-term Commitments Does the district have long-term (multiyear) commitments or debt
agreements? X
• If yes, have annual payments for the current or two subsequentfiscal years increased over prior year's (2015-16) annualpayment?
X
• If yes, will funding sources used to pay long-term commitmentsdecrease or expire prior to the end of the commitment period, orare they one-time sources?
X
S7a Postemployment BenefitsOther than Pensions
Does the district provide postemployment benefits other thanpensions (OPEB)? X
• If yes, have there been changes since budget adoption in OPEBliabilities? X
S7b Other Self-insuranceBenefits
Does the district operate any self-insurance programs (e.g., workers'compensation)? X
• If yes, have there been changes since budget adoption in self-insurance liabilities? X
S8 Status of Labor Agreements As of first interim projections, are salary and benefit negotiations stillunsettled for:
• Certificated? (Section S8A, Line 1b) X
• Classified? (Section S8B, Line 1b) X
• Management/supervisor/confidential? (Section S8C, Line 1b) X
S8 Labor Agreement BudgetRevisions
For negotiations settled since budget adoption, per GovernmentCode Section 3547.5(c), are budget revisions still needed to meet thecosts of the collective bargaining agreement(s) for:
• Certificated? (Section S8A, Line 3) n/a
• Classified? (Section S8B, Line 3) n/a
S9 Status of Other Funds Are any funds other than the general fund projected to have anegative fund balance at the end of the current fiscal year? X
ADDITIONAL FISCAL INDICATORS No YesA1 Negative Cash Flow Do cash flow projections show that the district will end the current
fiscal year with a negative cash balance in the general fund? X
A2 Independent PositionControl
Is personnel position control independent from the payroll system?X
A3 Declining Enrollment Is enrollment decreasing in both the prior and current fiscal years?X
A4 New Charter SchoolsImpacting DistrictEnrollment
Are any new charter schools operating in district boundaries that areimpacting the district's enrollment, either in the prior or current fiscalyear?
X
A5 Salary Increases ExceedCOLA
Has the district entered into a bargaining agreement where any of thecurrent or subsequent fiscal years of the agreement would result insalary increases that are expected to exceed the projected statefunded cost-of-living adjustment?
X
A6 Uncapped Health Benefits Does the district provide uncapped (100% employer paid) healthbenefits for current or retired employees? X
A7 Independent FinancialSystem
Is the district’s financial system independent from the county officesystem? X
A8 Fiscal Distress Reports Does the district have any reports that indicate fiscal distress? If yes,provide copies to the COE, pursuant to EC 42127.6(a). X
A9 Change of CBO orSuperintendent
Have there been personnel changes in the superintendent or chiefbusiness official (CBO) positions within the last 12 months? X

This Page Is Intentionally Left Blank
San Francisco UnifiedSan Francisco County
2016-17 First InterimGeneral Fund
School District Criteria and Standards Review38 68478 0000000
Form 01CSI
California Dept of EducationSACS Financial Reporting Software - 2016.2.0File: csi (Rev 06/07/2016) Page 1 of 26 Printed: 12/9/2016 12:12 PM
Provide methodology and assumptions used to estimate ADA, enrollment, revenues, expenditures, reserves and fund balance, and multiyear commitments (including cost-of-living adjustments).
Deviations from the standards must be explained and may affect the interim certification.
CRITERIA AND STANDARDS
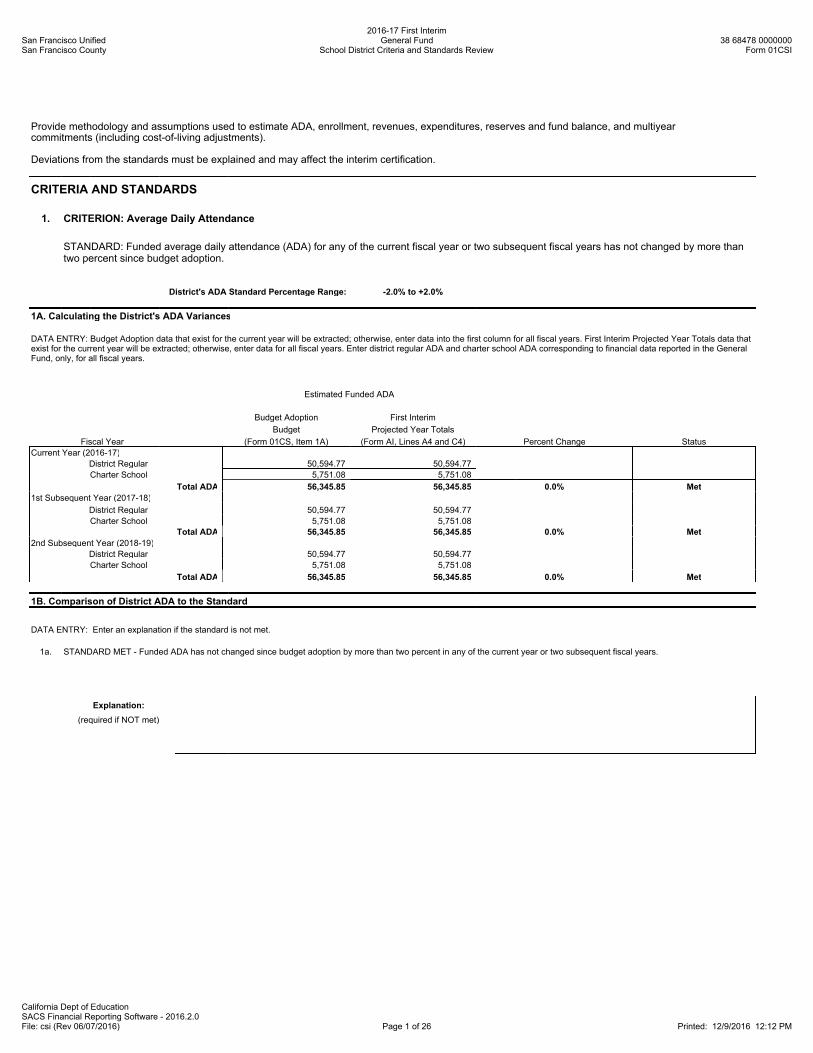
1. CRITERION: Average Daily Attendance
STANDARD: Funded average daily attendance (ADA) for any of the current fiscal year or two subsequent fiscal years has not changed by more thantwo percent since budget adoption.
District's ADA Standard Percentage Range: -2.0% to +2.0%
1A. Calculating the District's ADA Variances
DATA ENTRY: Budget Adoption data that exist for the current year will be extracted; otherwise, enter data into the first column for all fiscal years. First Interim Projected Year Totals data thatexist for the current year will be extracted; otherwise, enter data for all fiscal years. Enter district regular ADA and charter school ADA corresponding to financial data reported in the GeneralFund, only, for all fiscal years.
Estimated Funded ADA
Budget Adoption First Interim
Budget Projected Year Totals
Fiscal Year (Form 01CS, Item 1A) (Form AI, Lines A4 and C4) Percent Change Status
Current Year (2016-17)
District Regular 50,594.77 50,594.77
Charter School 5,751.08 5,751.08
Total ADA 56,345.85 56,345.85 0.0% Met
1st Subsequent Year (2017-18)
District Regular 50,594.77 50,594.77
Charter School 5,751.08 5,751.08
Total ADA 56,345.85 56,345.85 0.0% Met
2nd Subsequent Year (2018-19)
District Regular 50,594.77 50,594.77
Charter School 5,751.08 5,751.08
Total ADA 56,345.85 56,345.85 0.0% Met
1B. Comparison of District ADA to the Standard
DATA ENTRY: Enter an explanation if the standard is not met.
1a. STANDARD MET - Funded ADA has not changed since budget adoption by more than two percent in any of the current year or two subsequent fiscal years.
Explanation:
(required if NOT met)
San Francisco UnifiedSan Francisco County
2016-17 First InterimGeneral Fund
School District Criteria and Standards Review38 68478 0000000
Form 01CSI
California Dept of EducationSACS Financial Reporting Software - 2016.2.0File: csi (Rev 06/07/2016) Page 2 of 26 Printed: 12/9/2016 12:12 PM
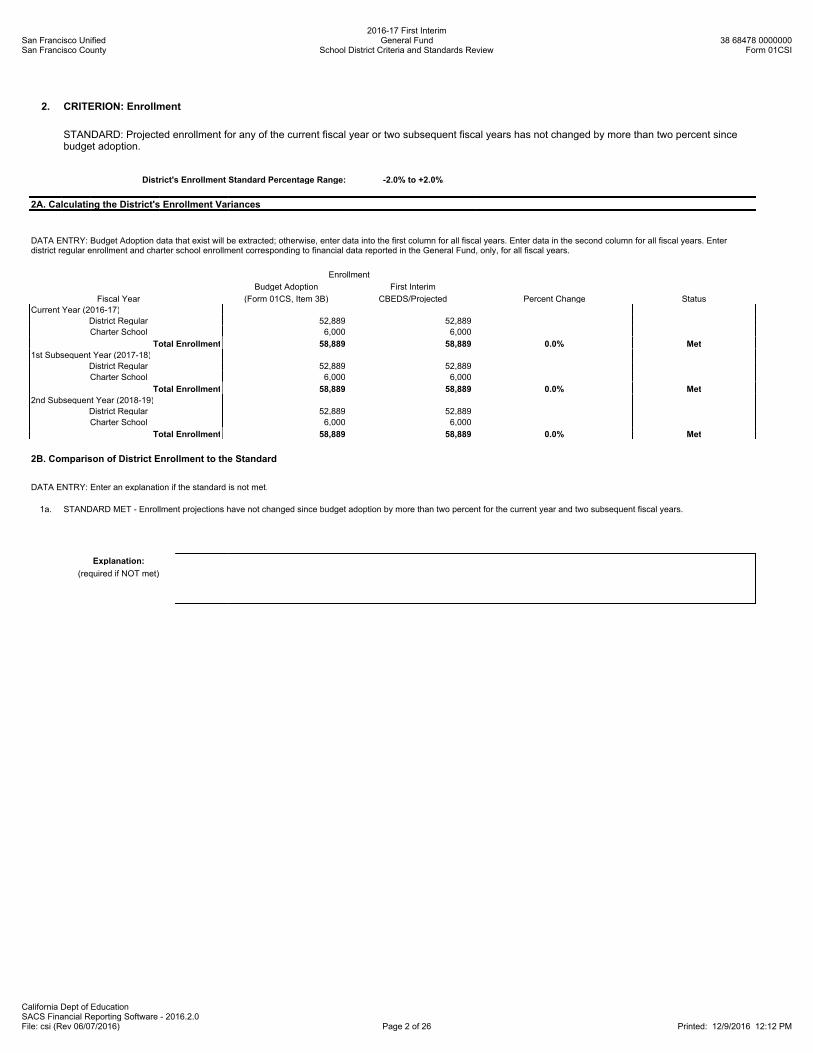
2. CRITERION: Enrollment
STANDARD: Projected enrollment for any of the current fiscal year or two subsequent fiscal years has not changed by more than two percent sincebudget adoption.
District's Enrollment Standard Percentage Range: -2.0% to +2.0%
2A. Calculating the District's Enrollment Variances
DATA ENTRY: Budget Adoption data that exist will be extracted; otherwise, enter data into the first column for all fiscal years. Enter data in the second column for all fiscal years. Enterdistrict regular enrollment and charter school enrollment corresponding to financial data reported in the General Fund, only, for all fiscal years.
Enrollment
Budget Adoption First Interim
Fiscal Year (Form 01CS, Item 3B) CBEDS/Projected Percent Change Status
Current Year (2016-17)
District Regular 52,889 52,889
Charter School 6,000 6,000
Total Enrollment 58,889 58,889 0.0% Met
1st Subsequent Year (2017-18)
District Regular 52,889 52,889
Charter School 6,000 6,000
Total Enrollment 58,889 58,889 0.0% Met
2nd Subsequent Year (2018-19)
District Regular 52,889 52,889
Charter School 6,000 6,000
Total Enrollment 58,889 58,889 0.0% Met
2B. Comparison of District Enrollment to the Standard
DATA ENTRY: Enter an explanation if the standard is not met.
1a. STANDARD MET - Enrollment projections have not changed since budget adoption by more than two percent for the current year and two subsequent fiscal years.
Explanation:
(required if NOT met)
San Francisco UnifiedSan Francisco County
2016-17 First InterimGeneral Fund
School District Criteria and Standards Review38 68478 0000000
Form 01CSI
California Dept of EducationSACS Financial Reporting Software - 2016.2.0File: csi (Rev 06/07/2016) Page 3 of 26 Printed: 12/9/2016 12:12 PM
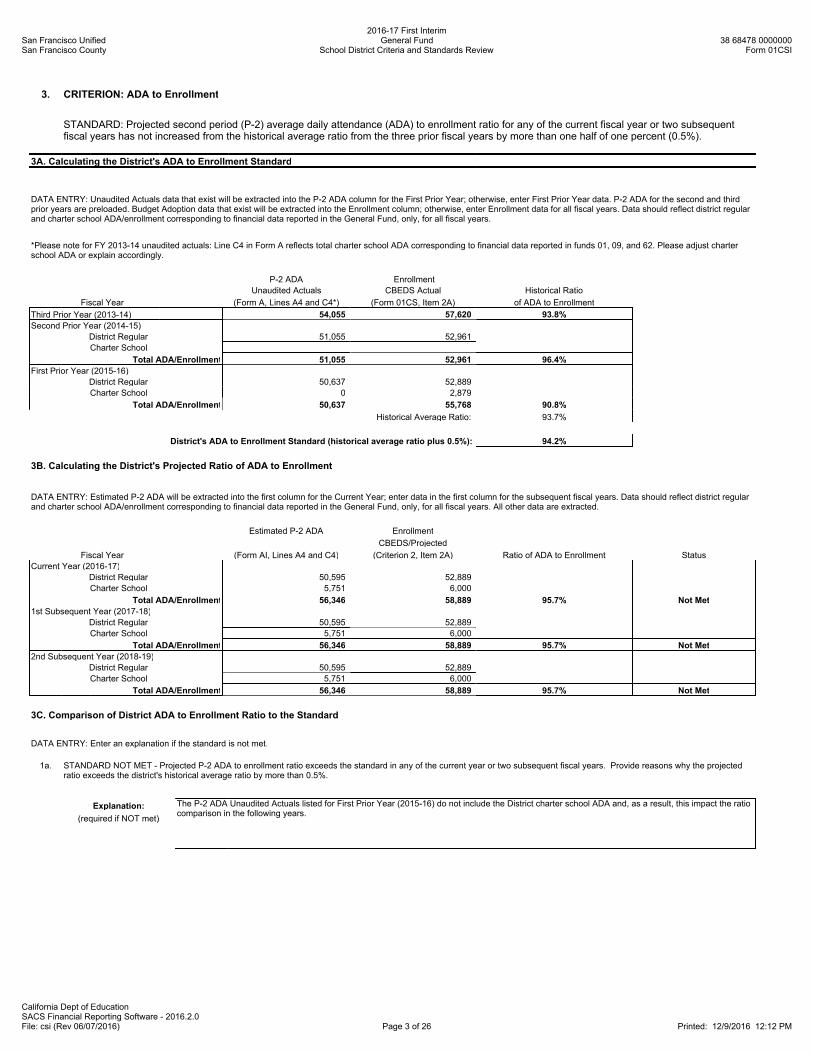
3. CRITERION: ADA to Enrollment
STANDARD: Projected second period (P-2) average daily attendance (ADA) to enrollment ratio for any of the current fiscal year or two subsequentfiscal years has not increased from the historical average ratio from the three prior fiscal years by more than one half of one percent (0.5%).
3A. Calculating the District's ADA to Enrollment Standard
DATA ENTRY: Unaudited Actuals data that exist will be extracted into the P-2 ADA column for the First Prior Year; otherwise, enter First Prior Year data. P-2 ADA for the second and thirdprior years are preloaded. Budget Adoption data that exist will be extracted into the Enrollment column; otherwise, enter Enrollment data for all fiscal years. Data should reflect district regularand charter school ADA/enrollment corresponding to financial data reported in the General Fund, only, for all fiscal years.
*Please note for FY 2013-14 unaudited actuals: Line C4 in Form A reflects total charter school ADA corresponding to financial data reported in funds 01, 09, and 62. Please adjust charterschool ADA or explain accordingly.
P-2 ADA Enrollment
Unaudited Actuals CBEDS Actual Historical Ratio
Fiscal Year (Form A, Lines A4 and C4*) (Form 01CS, Item 2A) of ADA to Enrollment
Third Prior Year (2013-14) 54,055 57,620 93.8%
Second Prior Year (2014-15)
District Regular 51,055 52,961
Charter School
Total ADA/Enrollment 51,055 52,961 96.4%
First Prior Year (2015-16)
District Regular 50,637 52,889
Charter School 0 2,879
Total ADA/Enrollment 50,637 55,768 90.8%
Historical Average Ratio: 93.7%
District's ADA to Enrollment Standard (historical average ratio plus 0.5%): 94.2%
3B. Calculating the District's Projected Ratio of ADA to Enrollment
DATA ENTRY: Estimated P-2 ADA will be extracted into the first column for the Current Year; enter data in the first column for the subsequent fiscal years. Data should reflect district regularand charter school ADA/enrollment corresponding to financial data reported in the General Fund, only, for all fiscal years. All other data are extracted.
Estimated P-2 ADA Enrollment
CBEDS/Projected
Fiscal Year (Form AI, Lines A4 and C4) (Criterion 2, Item 2A) Ratio of ADA to Enrollment Status
Current Year (2016-17)
District Regular 50,595 52,889
Charter School 5,751 6,000
Total ADA/Enrollment 56,346 58,889 95.7% Not Met
1st Subsequent Year (2017-18)
District Regular 50,595 52,889
Charter School 5,751 6,000
Total ADA/Enrollment 56,346 58,889 95.7% Not Met
2nd Subsequent Year (2018-19)
District Regular 50,595 52,889
Charter School 5,751 6,000
Total ADA/Enrollment 56,346 58,889 95.7% Not Met
3C. Comparison of District ADA to Enrollment Ratio to the Standard
DATA ENTRY: Enter an explanation if the standard is not met.
1a. STANDARD NOT MET - Projected P-2 ADA to enrollment ratio exceeds the standard in any of the current year or two subsequent fiscal years. Provide reasons why the projectedratio exceeds the district's historical average ratio by more than 0.5%.
Explanation:
(required if NOT met)
The P-2 ADA Unaudited Actuals listed for First Prior Year (2015-16) do not include the District charter school ADA and, as a result, this impact the ratiocomparison in the following years.
San Francisco UnifiedSan Francisco County
2016-17 First InterimGeneral Fund
School District Criteria and Standards Review38 68478 0000000
Form 01CSI
California Dept of EducationSACS Financial Reporting Software - 2016.2.0File: csi (Rev 06/07/2016) Page 4 of 26 Printed: 12/9/2016 12:12 PM
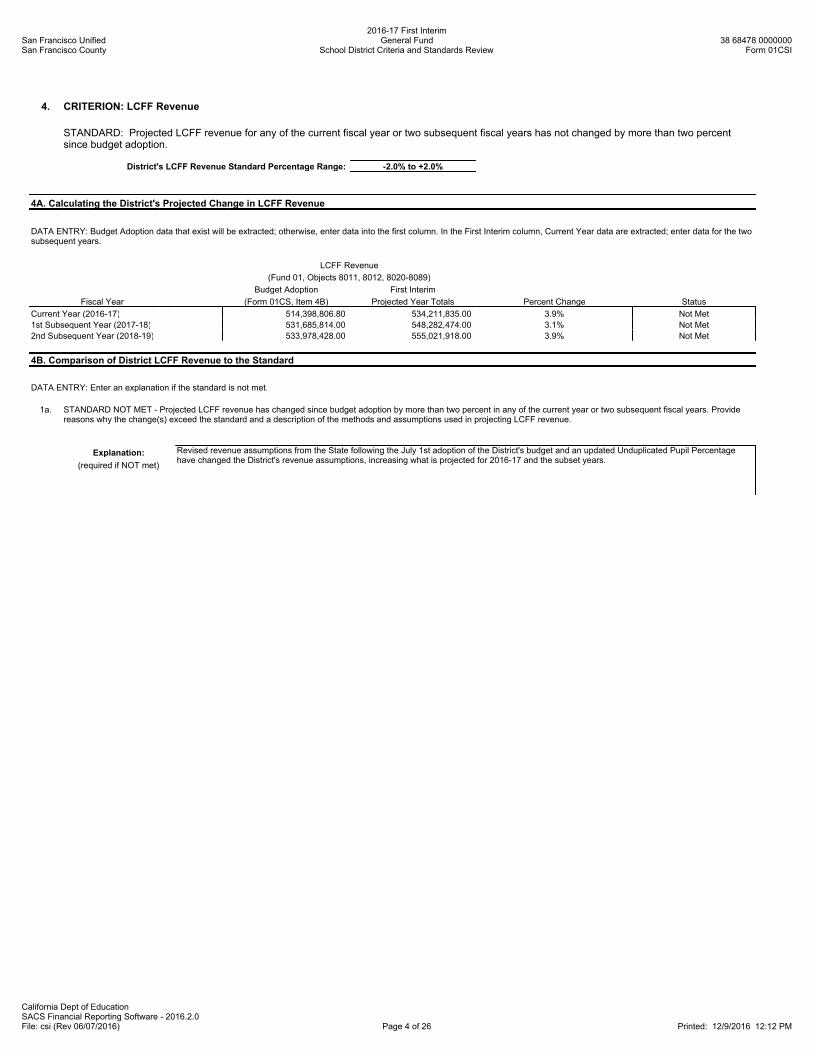
4. CRITERION: LCFF Revenue
STANDARD: Projected LCFF revenue for any of the current fiscal year or two subsequent fiscal years has not changed by more than two percentsince budget adoption.
District's LCFF Revenue Standard Percentage Range: -2.0% to +2.0%
4A. Calculating the District's Projected Change in LCFF Revenue
DATA ENTRY: Budget Adoption data that exist will be extracted; otherwise, enter data into the first column. In the First Interim column, Current Year data are extracted; enter data for the twosubsequent years.
LCFF Revenue
(Fund 01, Objects 8011, 8012, 8020-8089)
Budget Adoption First Interim
Fiscal Year (Form 01CS, Item 4B) Projected Year Totals Percent Change Status
Current Year (2016-17) 514,398,806.80 534,211,835.00 3.9% Not Met
1st Subsequent Year (2017-18) 531,685,814.00 548,282,474.00 3.1% Not Met
2nd Subsequent Year (2018-19) 533,978,428.00 555,021,918.00 3.9% Not Met
4B. Comparison of District LCFF Revenue to the Standard
DATA ENTRY: Enter an explanation if the standard is not met.
1a. STANDARD NOT MET - Projected LCFF revenue has changed since budget adoption by more than two percent in any of the current year or two subsequent fiscal years. Providereasons why the change(s) exceed the standard and a description of the methods and assumptions used in projecting LCFF revenue.
Explanation:
(required if NOT met)
Revised revenue assumptions from the State following the July 1st adoption of the District's budget and an updated Unduplicated Pupil Percentagehave changed the District's revenue assumptions, increasing what is projected for 2016-17 and the subset years.
San Francisco UnifiedSan Francisco County
2016-17 First InterimGeneral Fund
School District Criteria and Standards Review38 68478 0000000
Form 01CSI
California Dept of EducationSACS Financial Reporting Software - 2016.2.0File: csi (Rev 06/07/2016) Page 5 of 26 Printed: 12/9/2016 12:12 PM
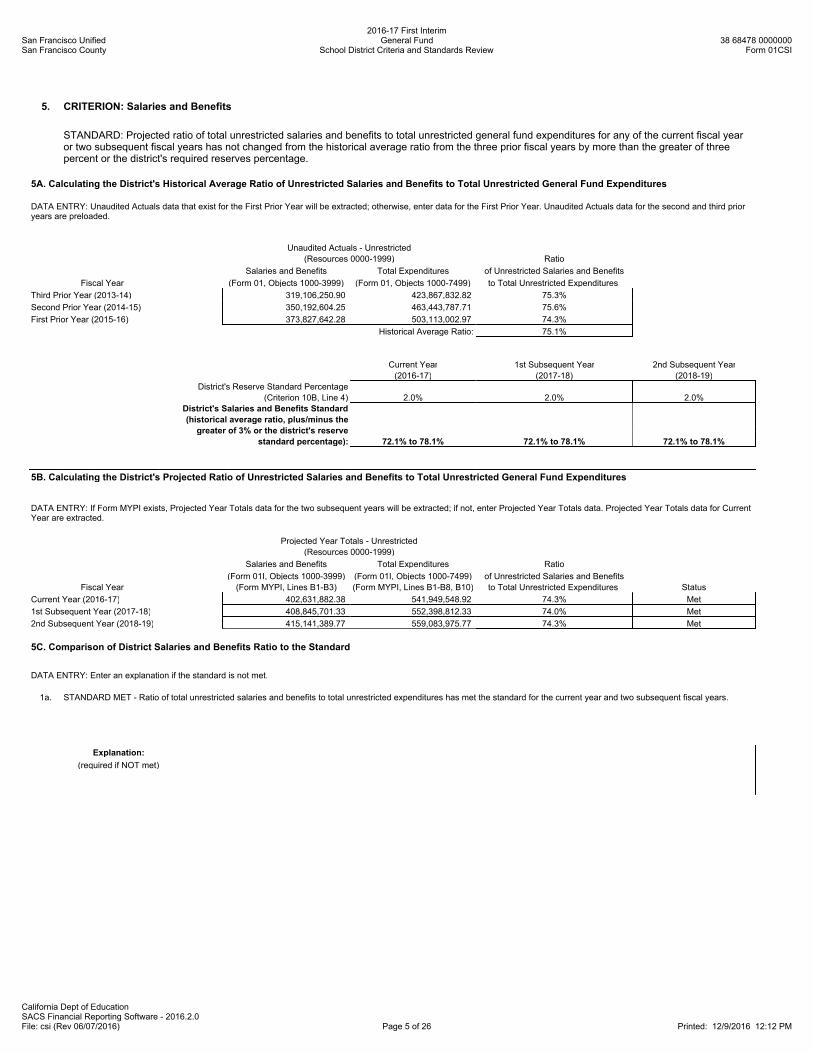
5. CRITERION: Salaries and Benefits
STANDARD: Projected ratio of total unrestricted salaries and benefits to total unrestricted general fund expenditures for any of the current fiscal yearor two subsequent fiscal years has not changed from the historical average ratio from the three prior fiscal years by more than the greater of threepercent or the district's required reserves percentage.
5A. Calculating the District's Historical Average Ratio of Unrestricted Salaries and Benefits to Total Unrestricted General Fund Expenditures
DATA ENTRY: Unaudited Actuals data that exist for the First Prior Year will be extracted; otherwise, enter data for the First Prior Year. Unaudited Actuals data for the second and third prioryears are preloaded.
Unaudited Actuals - Unrestricted
(Resources 0000-1999) Ratio
Salaries and Benefits Total Expenditures of Unrestricted Salaries and Benefits
Fiscal Year (Form 01, Objects 1000-3999) (Form 01, Objects 1000-7499) to Total Unrestricted Expenditures
Third Prior Year (2013-14) 319,106,250.90 423,867,832.82 75.3%
Second Prior Year (2014-15) 350,192,604.25 463,443,787.71 75.6%
First Prior Year (2015-16) 373,827,642.28 503,113,002.97 74.3%
Historical Average Ratio: 75.1%
Current Year 1st Subsequent Year 2nd Subsequent Year
(2016-17) (2017-18) (2018-19)
District's Reserve Standard Percentage
(Criterion 10B, Line 4) 2.0% 2.0% 2.0%
District's Salaries and Benefits Standard
(historical average ratio, plus/minus the
greater of 3% or the district's reserve
standard percentage): 72.1% to 78.1% 72.1% to 78.1% 72.1% to 78.1%
5B. Calculating the District's Projected Ratio of Unrestricted Salaries and Benefits to Total Unrestricted General Fund Expenditures
DATA ENTRY: If Form MYPI exists, Projected Year Totals data for the two subsequent years will be extracted; if not, enter Projected Year Totals data. Projected Year Totals data for CurrentYear are extracted.
Projected Year Totals - Unrestricted
(Resources 0000-1999)
Salaries and Benefits Total Expenditures Ratio
(Form 01I, Objects 1000-3999) (Form 01I, Objects 1000-7499) of Unrestricted Salaries and Benefits
Fiscal Year (Form MYPI, Lines B1-B3) (Form MYPI, Lines B1-B8, B10) to Total Unrestricted Expenditures Status
Current Year (2016-17) 402,631,882.38 541,949,548.92 74.3% Met
1st Subsequent Year (2017-18) 408,845,701.33 552,398,812.33 74.0% Met
2nd Subsequent Year (2018-19) 415,141,389.77 559,083,975.77 74.3% Met
5C. Comparison of District Salaries and Benefits Ratio to the Standard
DATA ENTRY: Enter an explanation if the standard is not met.
1a. STANDARD MET - Ratio of total unrestricted salaries and benefits to total unrestricted expenditures has met the standard for the current year and two subsequent fiscal years.
Explanation:
(required if NOT met)
San Francisco UnifiedSan Francisco County
2016-17 First InterimGeneral Fund
School District Criteria and Standards Review38 68478 0000000
Form 01CSI
California Dept of EducationSACS Financial Reporting Software - 2016.2.0File: csi (Rev 06/07/2016) Page 6 of 26 Printed: 12/9/2016 12:12 PM
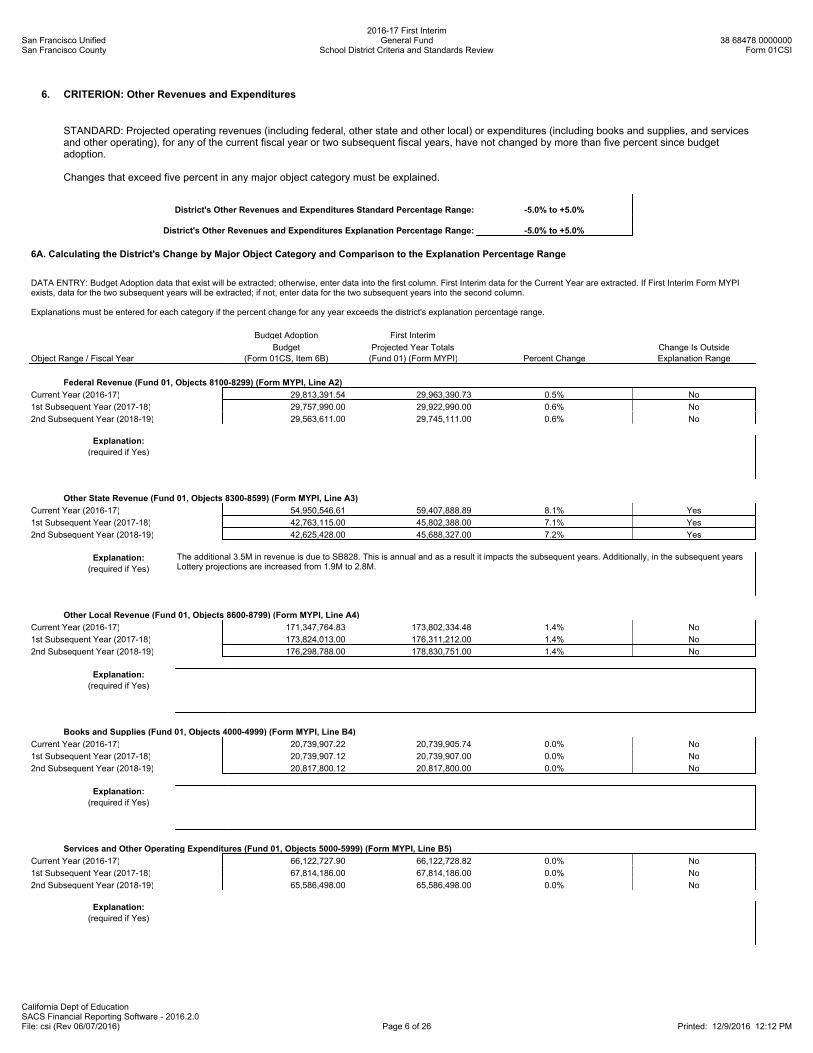
6. CRITERION: Other Revenues and Expenditures
STANDARD: Projected operating revenues (including federal, other state and other local) or expenditures (including books and supplies, and servicesand other operating), for any of the current fiscal year or two subsequent fiscal years, have not changed by more than five percent since budgetadoption.
Changes that exceed five percent in any major object category must be explained.
District's Other Revenues and Expenditures Standard Percentage Range: -5.0% to +5.0%
District's Other Revenues and Expenditures Explanation Percentage Range: -5.0% to +5.0%
6A. Calculating the District's Change by Major Object Category and Comparison to the Explanation Percentage Range
DATA ENTRY: Budget Adoption data that exist will be extracted; otherwise, enter data into the first column. First Interim data for the Current Year are extracted. If First Interim Form MYPIexists, data for the two subsequent years will be extracted; if not, enter data for the two subsequent years into the second column.
Explanations must be entered for each category if the percent change for any year exceeds the district's explanation percentage range.
Budget Adoption First Interim
Budget Projected Year Totals Change Is Outside
Object Range / Fiscal Year (Form 01CS, Item 6B) (Fund 01) (Form MYPI) Percent Change Explanation Range
Federal Revenue (Fund 01, Objects 8100-8299) (Form MYPI, Line A2)
Current Year (2016-17) 29,813,391.54 29,963,390.73 0.5% No
1st Subsequent Year (2017-18) 29,757,990.00 29,922,990.00 0.6% No
2nd Subsequent Year (2018-19) 29,563,611.00 29,745,111.00 0.6% No
Explanation:
(required if Yes)
Other State Revenue (Fund 01, Objects 8300-8599) (Form MYPI, Line A3)
Current Year (2016-17) 54,950,546.61 59,407,888.89 8.1% Yes
1st Subsequent Year (2017-18) 42,763,115.00 45,802,388.00 7.1% Yes
2nd Subsequent Year (2018-19) 42,625,428.00 45,688,327.00 7.2% Yes
Explanation:
(required if Yes)
The additional 3.5M in revenue is due to SB828. This is annual and as a result it impacts the subsequent years. Additionally, in the subsequent yearsLottery projections are increased from 1.9M to 2.8M.
Other Local Revenue (Fund 01, Objects 8600-8799) (Form MYPI, Line A4)
Current Year (2016-17) 171,347,764.83 173,802,334.48 1.4% No
1st Subsequent Year (2017-18) 173,824,013.00 176,311,212.00 1.4% No
2nd Subsequent Year (2018-19) 176,298,788.00 178,830,751.00 1.4% No
Explanation:
(required if Yes)
Books and Supplies (Fund 01, Objects 4000-4999) (Form MYPI, Line B4)
Current Year (2016-17) 20,739,907.22 20,739,905.74 0.0% No
1st Subsequent Year (2017-18) 20,739,907.12 20,739,907.00 0.0% No
2nd Subsequent Year (2018-19) 20,817,800.12 20,817,800.00 0.0% No
Explanation:
(required if Yes)
Services and Other Operating Expenditures (Fund 01, Objects 5000-5999) (Form MYPI, Line B5)
Current Year (2016-17) 66,122,727.90 66,122,728.82 0.0% No
1st Subsequent Year (2017-18) 67,814,186.00 67,814,186.00 0.0% No
2nd Subsequent Year (2018-19) 65,586,498.00 65,586,498.00 0.0% No
Explanation:
(required if Yes)
San Francisco UnifiedSan Francisco County
2016-17 First InterimGeneral Fund
School District Criteria and Standards Review38 68478 0000000
Form 01CSI
California Dept of EducationSACS Financial Reporting Software - 2016.2.0File: csi (Rev 06/07/2016) Page 7 of 26 Printed: 12/9/2016 12:12 PM
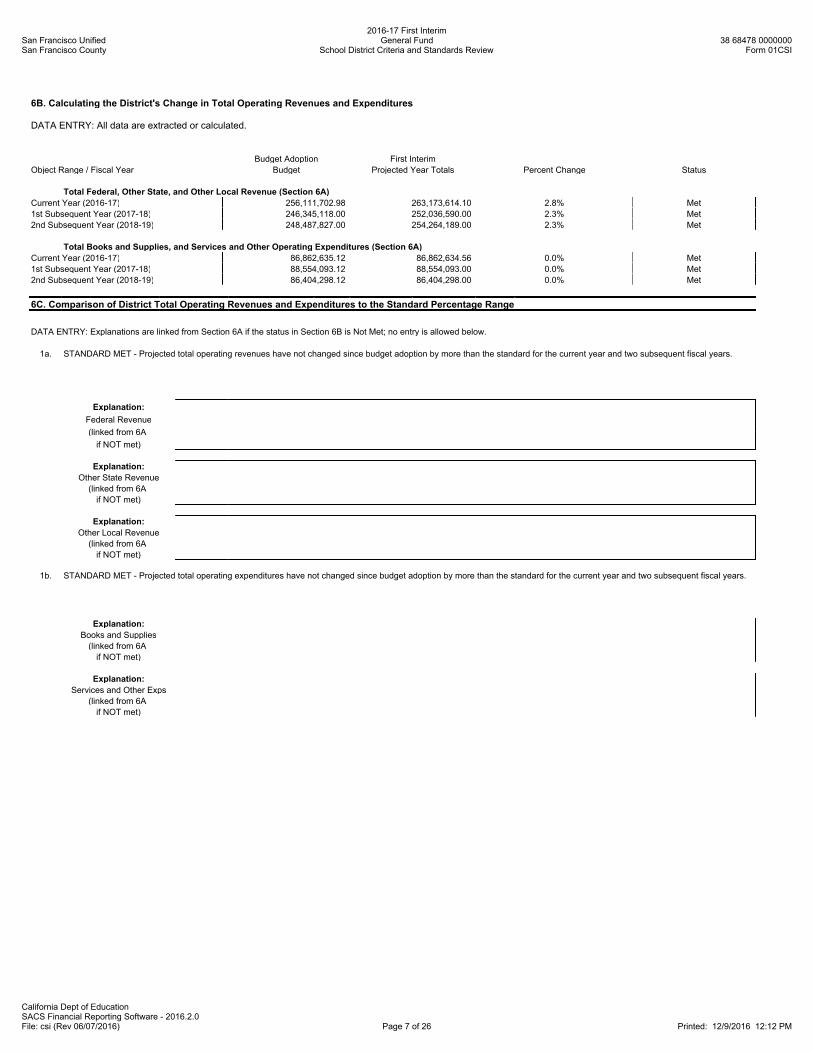
6B. Calculating the District's Change in Total Operating Revenues and Expenditures
DATA ENTRY: All data are extracted or calculated.
Budget Adoption First Interim
Object Range / Fiscal Year Budget Projected Year Totals Percent Change Status
Total Federal, Other State, and Other Local Revenue (Section 6A)
Current Year (2016-17) 256,111,702.98 263,173,614.10 2.8% Met
1st Subsequent Year (2017-18) 246,345,118.00 252,036,590.00 2.3% Met
2nd Subsequent Year (2018-19) 248,487,827.00 254,264,189.00 2.3% Met
Total Books and Supplies, and Services and Other Operating Expenditures (Section 6A)
Current Year (2016-17) 86,862,635.12 86,862,634.56 0.0% Met
1st Subsequent Year (2017-18) 88,554,093.12 88,554,093.00 0.0% Met
2nd Subsequent Year (2018-19) 86,404,298.12 86,404,298.00 0.0% Met
6C. Comparison of District Total Operating Revenues and Expenditures to the Standard Percentage Range
DATA ENTRY: Explanations are linked from Section 6A if the status in Section 6B is Not Met; no entry is allowed below.
1a. STANDARD MET - Projected total operating revenues have not changed since budget adoption by more than the standard for the current year and two subsequent fiscal years.
Explanation:
Federal Revenue
(linked from 6A
if NOT met)
Explanation:
Other State Revenue
(linked from 6A
if NOT met)
Explanation:
Other Local Revenue
(linked from 6A
if NOT met)
1b. STANDARD MET - Projected total operating expenditures have not changed since budget adoption by more than the standard for the current year and two subsequent fiscal years.
Explanation:
Books and Supplies
(linked from 6A
if NOT met)
Explanation:
Services and Other Exps
(linked from 6A
if NOT met)
San Francisco UnifiedSan Francisco County
2016-17 First InterimGeneral Fund
School District Criteria and Standards Review38 68478 0000000
Form 01CSI
California Dept of EducationSACS Financial Reporting Software - 2016.2.0File: csi (Rev 06/07/2016) Page 8 of 26 Printed: 12/9/2016 12:12 PM
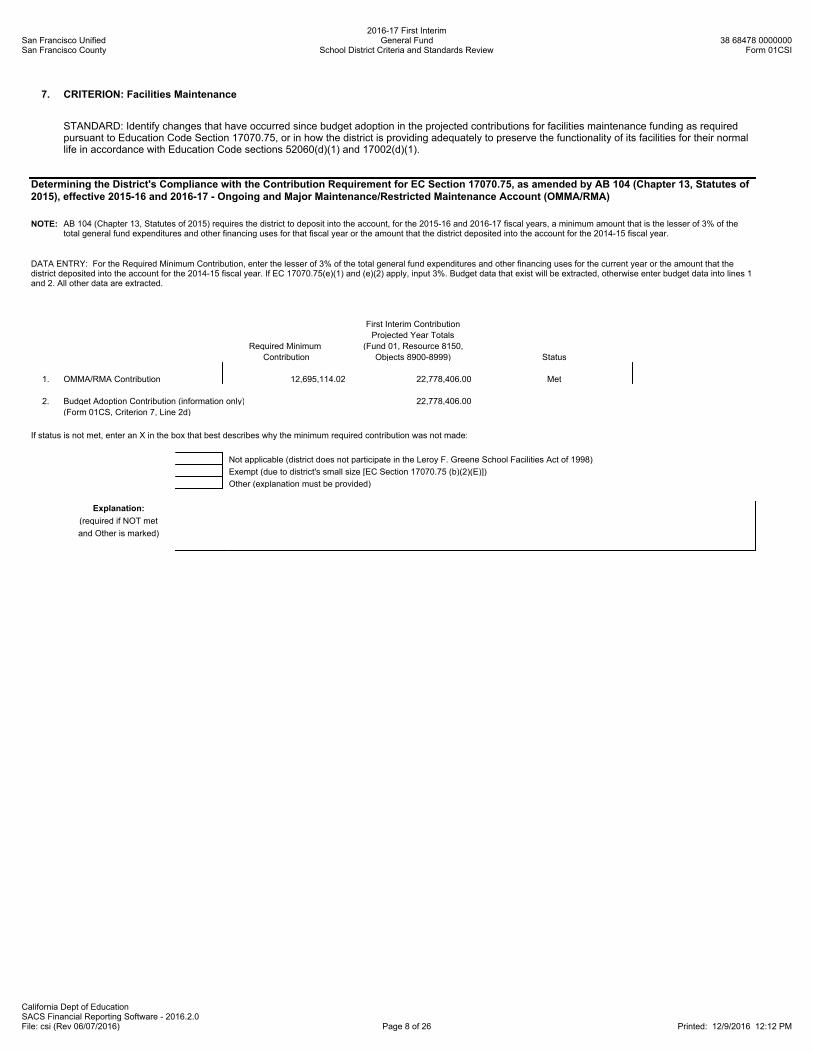
7. CRITERION: Facilities Maintenance
STANDARD: Identify changes that have occurred since budget adoption in the projected contributions for facilities maintenance funding as requiredpursuant to Education Code Section 17070.75, or in how the district is providing adequately to preserve the functionality of its facilities for their normallife in accordance with Education Code sections 52060(d)(1) and 17002(d)(1).
Determining the District's Compliance with the Contribution Requirement for EC Section 17070.75, as amended by AB 104 (Chapter 13, Statutes of2015), effective 2015-16 and 2016-17 - Ongoing and Major Maintenance/Restricted Maintenance Account (OMMA/RMA)
NOTE: AB 104 (Chapter 13, Statutes of 2015) requires the district to deposit into the account, for the 2015-16 and 2016-17 fiscal years, a minimum amount that is the lesser of 3% of thetotal general fund expenditures and other financing uses for that fiscal year or the amount that the district deposited into the account for the 2014-15 fiscal year.
DATA ENTRY: For the Required Minimum Contribution, enter the lesser of 3% of the total general fund expenditures and other financing uses for the current year or the amount that thedistrict deposited into the account for the 2014-15 fiscal year. If EC 17070.75(e)(1) and (e)(2) apply, input 3%. Budget data that exist will be extracted, otherwise enter budget data into lines 1and 2. All other data are extracted.
First Interim Contribution
Projected Year Totals
Required Minimum (Fund 01, Resource 8150,
Contribution Objects 8900-8999) Status
1. OMMA/RMA Contribution 12,695,114.02 22,778,406.00 Met
2. Budget Adoption Contribution (information only) 22,778,406.00
(Form 01CS, Criterion 7, Line 2d)
If status is not met, enter an X in the box that best describes why the minimum required contribution was not made:
Not applicable (district does not participate in the Leroy F. Greene School Facilities Act of 1998)
Exempt (due to district's small size [EC Section 17070.75 (b)(2)(E)])
Other (explanation must be provided)
Explanation:
(required if NOT met
and Other is marked)
San Francisco UnifiedSan Francisco County
2016-17 First InterimGeneral Fund
School District Criteria and Standards Review38 68478 0000000
Form 01CSI
California Dept of EducationSACS Financial Reporting Software - 2016.2.0File: csi (Rev 06/07/2016) Page 9 of 26 Printed: 12/9/2016 12:12 PM
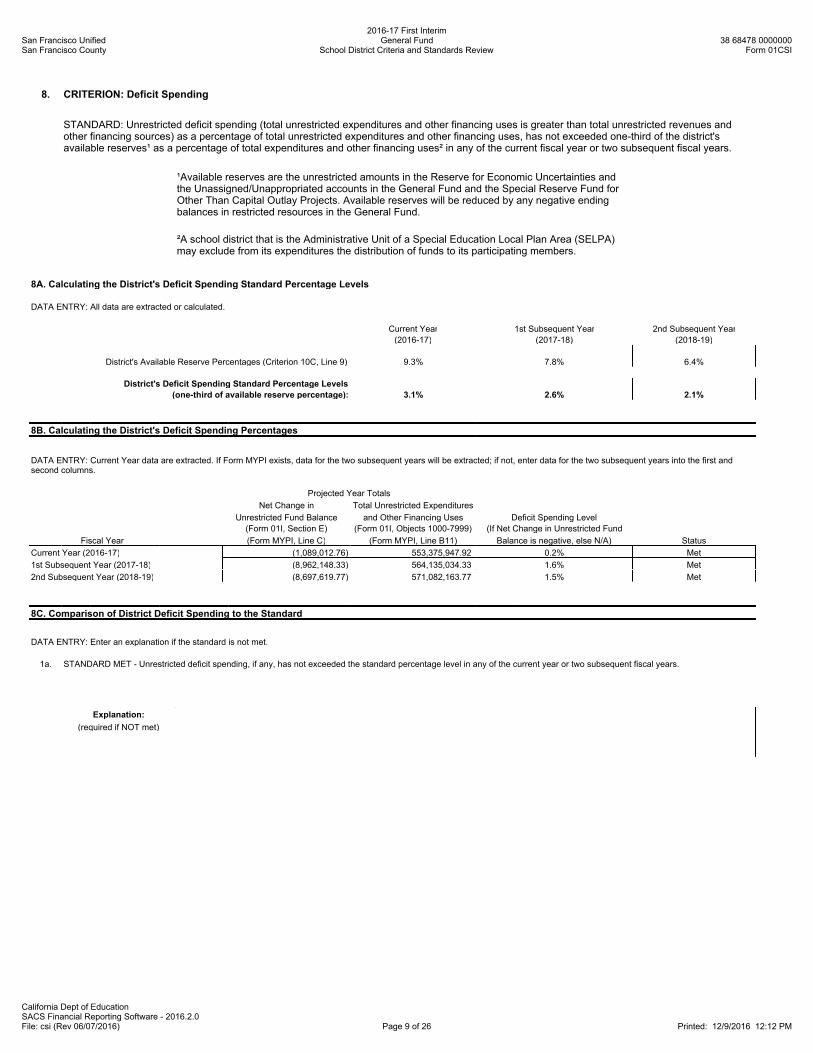
8. CRITERION: Deficit Spending
STANDARD: Unrestricted deficit spending (total unrestricted expenditures and other financing uses is greater than total unrestricted revenues andother financing sources) as a percentage of total unrestricted expenditures and other financing uses, has not exceeded one-third of the district'savailable reserves¹ as a percentage of total expenditures and other financing uses² in any of the current fiscal year or two subsequent fiscal years.
¹Available reserves are the unrestricted amounts in the Reserve for Economic Uncertainties andthe Unassigned/Unappropriated accounts in the General Fund and the Special Reserve Fund forOther Than Capital Outlay Projects. Available reserves will be reduced by any negative endingbalances in restricted resources in the General Fund.
²A school district that is the Administrative Unit of a Special Education Local Plan Area (SELPA)may exclude from its expenditures the distribution of funds to its participating members.
8A. Calculating the District's Deficit Spending Standard Percentage Levels
DATA ENTRY: All data are extracted or calculated.
Current Year 1st Subsequent Year 2nd Subsequent Year
(2016-17) (2017-18) (2018-19)
District's Available Reserve Percentages (Criterion 10C, Line 9) 9.3% 7.8% 6.4%
District's Deficit Spending Standard Percentage Levels
(one-third of available reserve percentage): 3.1% 2.6% 2.1%
8B. Calculating the District's Deficit Spending Percentages
DATA ENTRY: Current Year data are extracted. If Form MYPI exists, data for the two subsequent years will be extracted; if not, enter data for the two subsequent years into the first andsecond columns.
Projected Year Totals
Net Change in Total Unrestricted Expenditures
Unrestricted Fund Balance and Other Financing Uses Deficit Spending Level
(Form 01I, Section E) (Form 01I, Objects 1000-7999) (If Net Change in Unrestricted Fund
Fiscal Year (Form MYPI, Line C) (Form MYPI, Line B11) Balance is negative, else N/A) Status
Current Year (2016-17) (1,089,012.76) 553,375,947.92 0.2% Met
1st Subsequent Year (2017-18) (8,962,148.33) 564,135,034.33 1.6% Met
2nd Subsequent Year (2018-19) (8,697,619.77) 571,082,163.77 1.5% Met
8C. Comparison of District Deficit Spending to the Standard
DATA ENTRY: Enter an explanation if the standard is not met.
1a. STANDARD MET - Unrestricted deficit spending, if any, has not exceeded the standard percentage level in any of the current year or two subsequent fiscal years.
Explanation:
(required if NOT met)
San Francisco UnifiedSan Francisco County
2016-17 First InterimGeneral Fund
School District Criteria and Standards Review38 68478 0000000
Form 01CSI
California Dept of EducationSACS Financial Reporting Software - 2016.2.0File: csi (Rev 06/07/2016) Page 10 of 26 Printed: 12/9/2016 12:12 PM
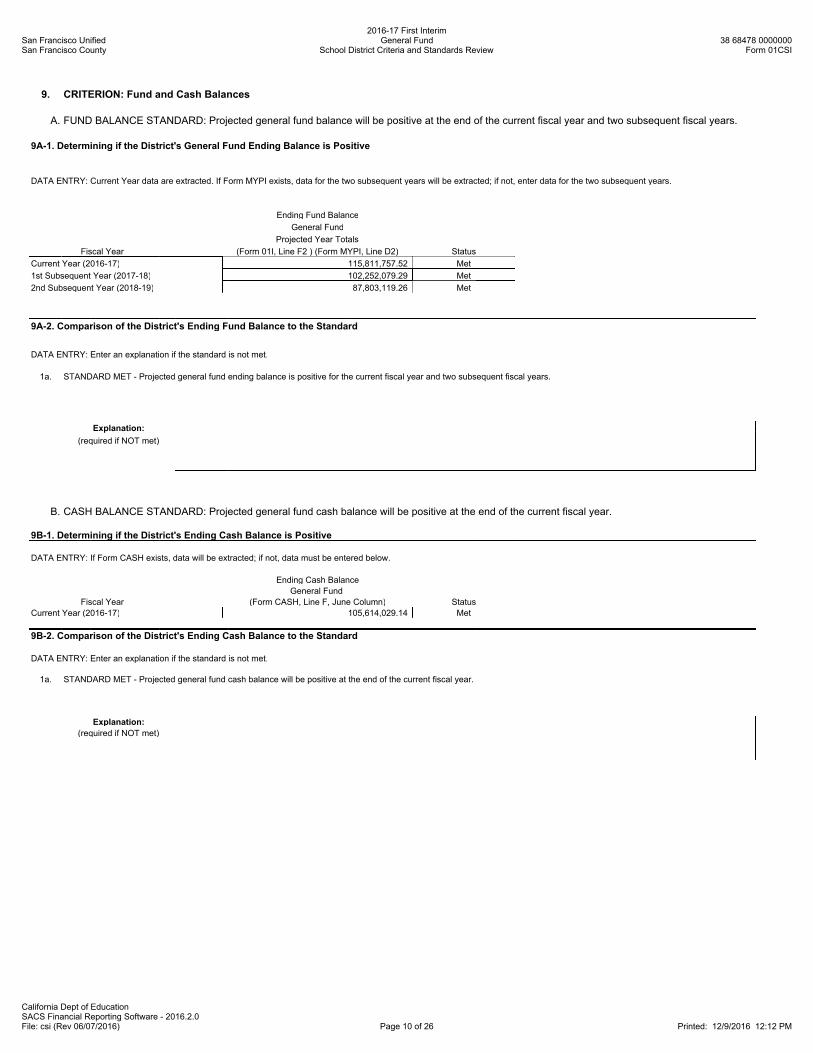
9. CRITERION: Fund and Cash Balances
A. FUND BALANCE STANDARD: Projected general fund balance will be positive at the end of the current fiscal year and two subsequent fiscal years.
9A-1. Determining if the District's General Fund Ending Balance is Positive
DATA ENTRY: Current Year data are extracted. If Form MYPI exists, data for the two subsequent years will be extracted; if not, enter data for the two subsequent years.
Ending Fund Balance
General Fund
Projected Year Totals
Fiscal Year (Form 01I, Line F2 ) (Form MYPI, Line D2) Status
Current Year (2016-17) 115,811,757.52 Met
1st Subsequent Year (2017-18) 102,252,079.29 Met
2nd Subsequent Year (2018-19) 87,803,119.26 Met
9A-2. Comparison of the District's Ending Fund Balance to the Standard
DATA ENTRY: Enter an explanation if the standard is not met.
1a. STANDARD MET - Projected general fund ending balance is positive for the current fiscal year and two subsequent fiscal years.
Explanation:
(required if NOT met)
B. CASH BALANCE STANDARD: Projected general fund cash balance will be positive at the end of the current fiscal year.
9B-1. Determining if the District's Ending Cash Balance is Positive
DATA ENTRY: If Form CASH exists, data will be extracted; if not, data must be entered below.
Ending Cash Balance
General Fund
Fiscal Year (Form CASH, Line F, June Column) Status
Current Year (2016-17) 105,614,029.14 Met
9B-2. Comparison of the District's Ending Cash Balance to the Standard
DATA ENTRY: Enter an explanation if the standard is not met.
1a. STANDARD MET - Projected general fund cash balance will be positive at the end of the current fiscal year.
Explanation:
(required if NOT met)
San Francisco UnifiedSan Francisco County
2016-17 First InterimGeneral Fund
School District Criteria and Standards Review38 68478 0000000
Form 01CSI
California Dept of EducationSACS Financial Reporting Software - 2016.2.0File: csi (Rev 06/07/2016) Page 11 of 26 Printed: 12/9/2016 12:12 PM
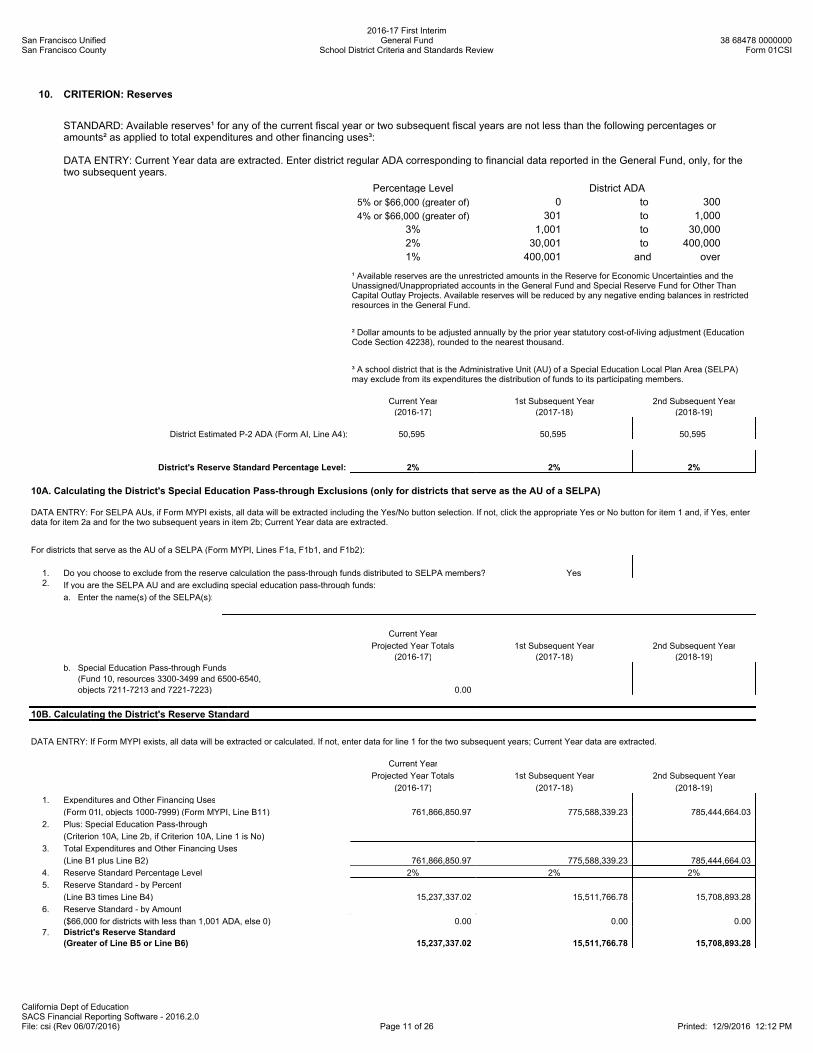
10. CRITERION: Reserves
STANDARD: Available reserves¹ for any of the current fiscal year or two subsequent fiscal years are not less than the following percentages oramounts² as applied to total expenditures and other financing uses³:
DATA ENTRY: Current Year data are extracted. Enter district regular ADA corresponding to financial data reported in the General Fund, only, for thetwo subsequent years.
Percentage Level District ADA
5% or $66,000 (greater of) 0 to 300
4% or $66,000 (greater of) 301 to 1,000
3% 1,001 to 30,000
2% 30,001 to 400,000
1% 400,001 and over
¹ Available reserves are the unrestricted amounts in the Reserve for Economic Uncertainties and theUnassigned/Unappropriated accounts in the General Fund and Special Reserve Fund for Other ThanCapital Outlay Projects. Available reserves will be reduced by any negative ending balances in restrictedresources in the General Fund.
² Dollar amounts to be adjusted annually by the prior year statutory cost-of-living adjustment (EducationCode Section 42238), rounded to the nearest thousand.
³ A school district that is the Administrative Unit (AU) of a Special Education Local Plan Area (SELPA)may exclude from its expenditures the distribution of funds to its participating members.
Current Year 1st Subsequent Year 2nd Subsequent Year
(2016-17) (2017-18) (2018-19)
District Estimated P-2 ADA (Form AI, Line A4): 50,595 50,595 50,595
District's Reserve Standard Percentage Level: 2% 2% 2%
10A. Calculating the District's Special Education Pass-through Exclusions (only for districts that serve as the AU of a SELPA)
DATA ENTRY: For SELPA AUs, if Form MYPI exists, all data will be extracted including the Yes/No button selection. If not, click the appropriate Yes or No button for item 1 and, if Yes, enterdata for item 2a and for the two subsequent years in item 2b; Current Year data are extracted.
For districts that serve as the AU of a SELPA (Form MYPI, Lines F1a, F1b1, and F1b2):
1. Do you choose to exclude from the reserve calculation the pass-through funds distributed to SELPA members? Yes2. If you are the SELPA AU and are excluding special education pass-through funds:
a. Enter the name(s) of the SELPA(s):
Current Year
Projected Year Totals 1st Subsequent Year 2nd Subsequent Year
(2016-17) (2017-18) (2018-19)
b. Special Education Pass-through Funds
(Fund 10, resources 3300-3499 and 6500-6540,
objects 7211-7213 and 7221-7223) 0.00
10B. Calculating the District's Reserve Standard
DATA ENTRY: If Form MYPI exists, all data will be extracted or calculated. If not, enter data for line 1 for the two subsequent years; Current Year data are extracted.
Current Year
Projected Year Totals 1st Subsequent Year 2nd Subsequent Year
(2016-17) (2017-18) (2018-19)
1. Expenditures and Other Financing Uses
(Form 01I, objects 1000-7999) (Form MYPI, Line B11) 761,866,850.97 775,588,339.23 785,444,664.03
2. Plus: Special Education Pass-through
(Criterion 10A, Line 2b, if Criterion 10A, Line 1 is No)
3. Total Expenditures and Other Financing Uses
(Line B1 plus Line B2) 761,866,850.97 775,588,339.23 785,444,664.03
4. Reserve Standard Percentage Level 2% 2% 2%
5. Reserve Standard - by Percent
(Line B3 times Line B4) 15,237,337.02 15,511,766.78 15,708,893.28
6. Reserve Standard - by Amount
($66,000 for districts with less than 1,001 ADA, else 0) 0.00 0.00 0.00
7. District's Reserve Standard
(Greater of Line B5 or Line B6) 15,237,337.02 15,511,766.78 15,708,893.28
San Francisco UnifiedSan Francisco County
2016-17 First InterimGeneral Fund
School District Criteria and Standards Review38 68478 0000000
Form 01CSI
California Dept of EducationSACS Financial Reporting Software - 2016.2.0File: csi (Rev 06/07/2016) Page 12 of 26 Printed: 12/9/2016 12:12 PM
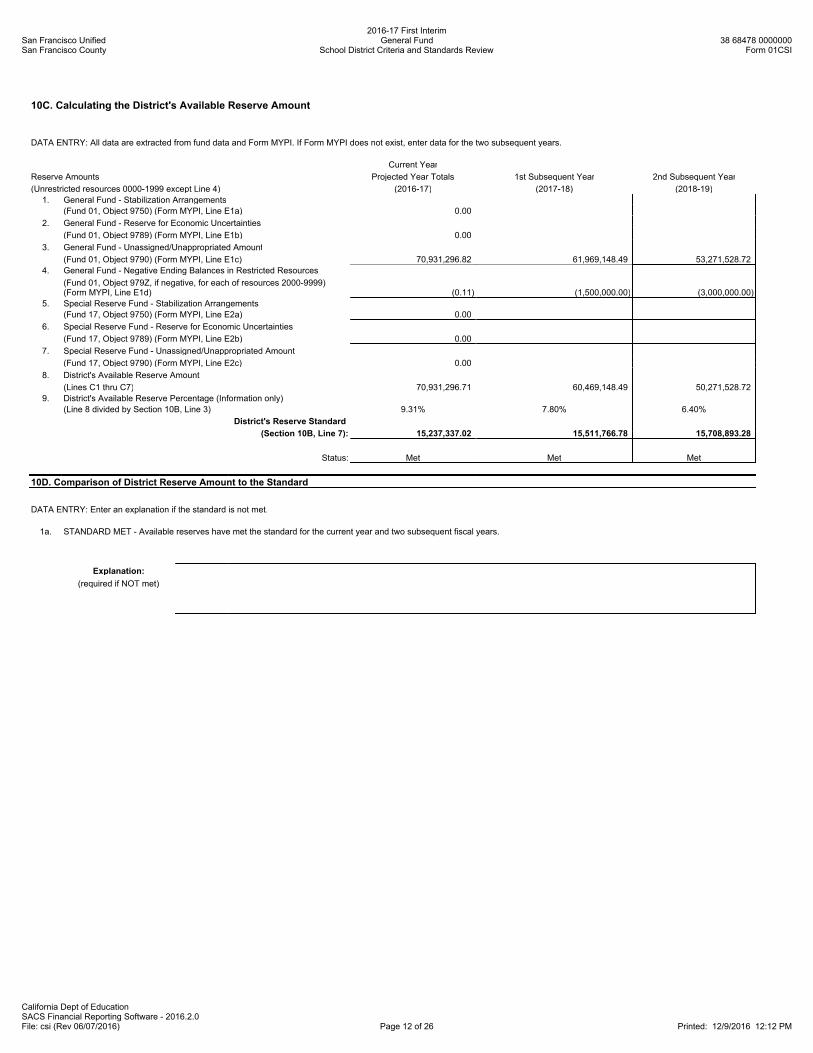
10C. Calculating the District's Available Reserve Amount
DATA ENTRY: All data are extracted from fund data and Form MYPI. If Form MYPI does not exist, enter data for the two subsequent years.
Current Year
Reserve Amounts Projected Year Totals 1st Subsequent Year 2nd Subsequent Year
(Unrestricted resources 0000-1999 except Line 4) (2016-17) (2017-18) (2018-19)
1. General Fund - Stabilization Arrangements
(Fund 01, Object 9750) (Form MYPI, Line E1a) 0.00
2. General Fund - Reserve for Economic Uncertainties
(Fund 01, Object 9789) (Form MYPI, Line E1b) 0.00
3. General Fund - Unassigned/Unappropriated Amount
(Fund 01, Object 9790) (Form MYPI, Line E1c) 70,931,296.82 61,969,148.49 53,271,528.72
4. General Fund - Negative Ending Balances in Restricted Resources
(Fund 01, Object 979Z, if negative, for each of resources 2000-9999)(Form MYPI, Line E1d) (0.11) (1,500,000.00) (3,000,000.00)
5. Special Reserve Fund - Stabilization Arrangements
(Fund 17, Object 9750) (Form MYPI, Line E2a) 0.00
6. Special Reserve Fund - Reserve for Economic Uncertainties
(Fund 17, Object 9789) (Form MYPI, Line E2b) 0.00
7. Special Reserve Fund - Unassigned/Unappropriated Amount
(Fund 17, Object 9790) (Form MYPI, Line E2c) 0.00
8. District's Available Reserve Amount
(Lines C1 thru C7) 70,931,296.71 60,469,148.49 50,271,528.72
9. District's Available Reserve Percentage (Information only)
(Line 8 divided by Section 10B, Line 3) 9.31% 7.80% 6.40%
District's Reserve Standard
(Section 10B, Line 7): 15,237,337.02 15,511,766.78 15,708,893.28
Status: Met Met Met
10D. Comparison of District Reserve Amount to the Standard
DATA ENTRY: Enter an explanation if the standard is not met.
1a. STANDARD MET - Available reserves have met the standard for the current year and two subsequent fiscal years.
Explanation:
(required if NOT met)
San Francisco UnifiedSan Francisco County
2016-17 First InterimGeneral Fund
School District Criteria and Standards Review38 68478 0000000
Form 01CSI
California Dept of EducationSACS Financial Reporting Software - 2016.2.0File: csi (Rev 06/07/2016) Page 13 of 26 Printed: 12/9/2016 12:12 PM
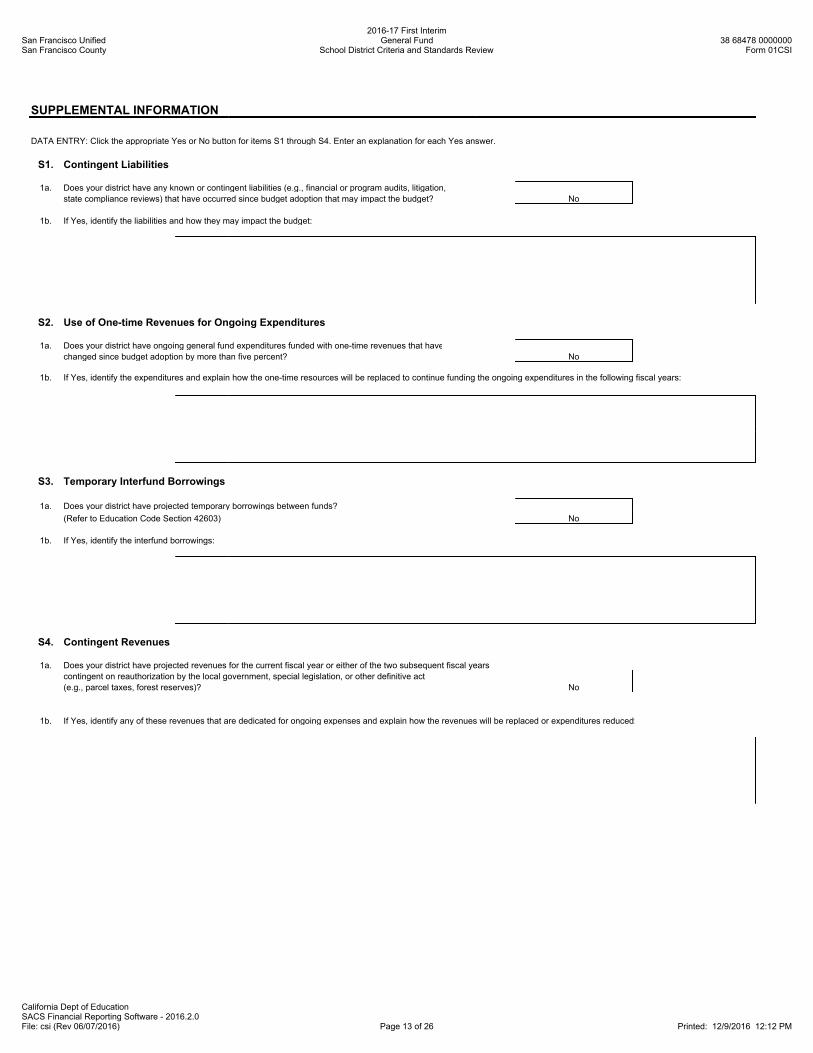
SUPPLEMENTAL INFORMATION
DATA ENTRY: Click the appropriate Yes or No button for items S1 through S4. Enter an explanation for each Yes answer.
S1. Contingent Liabilities
1a. Does your district have any known or contingent liabilities (e.g., financial or program audits, litigation,
state compliance reviews) that have occurred since budget adoption that may impact the budget? No
1b. If Yes, identify the liabilities and how they may impact the budget:
S2. Use of One-time Revenues for Ongoing Expenditures
1a. Does your district have ongoing general fund expenditures funded with one-time revenues that have
changed since budget adoption by more than five percent? No
1b. If Yes, identify the expenditures and explain how the one-time resources will be replaced to continue funding the ongoing expenditures in the following fiscal years:
S3. Temporary Interfund Borrowings
1a. Does your district have projected temporary borrowings between funds?
(Refer to Education Code Section 42603) No
1b. If Yes, identify the interfund borrowings:
S4. Contingent Revenues
1a. Does your district have projected revenues for the current fiscal year or either of the two subsequent fiscal years
contingent on reauthorization by the local government, special legislation, or other definitive act
(e.g., parcel taxes, forest reserves)? No
1b. If Yes, identify any of these revenues that are dedicated for ongoing expenses and explain how the revenues will be replaced or expenditures reduced:
San Francisco UnifiedSan Francisco County
2016-17 First InterimGeneral Fund
School District Criteria and Standards Review38 68478 0000000
Form 01CSI
California Dept of EducationSACS Financial Reporting Software - 2016.2.0File: csi (Rev 06/07/2016) Page 14 of 26 Printed: 12/9/2016 12:12 PM
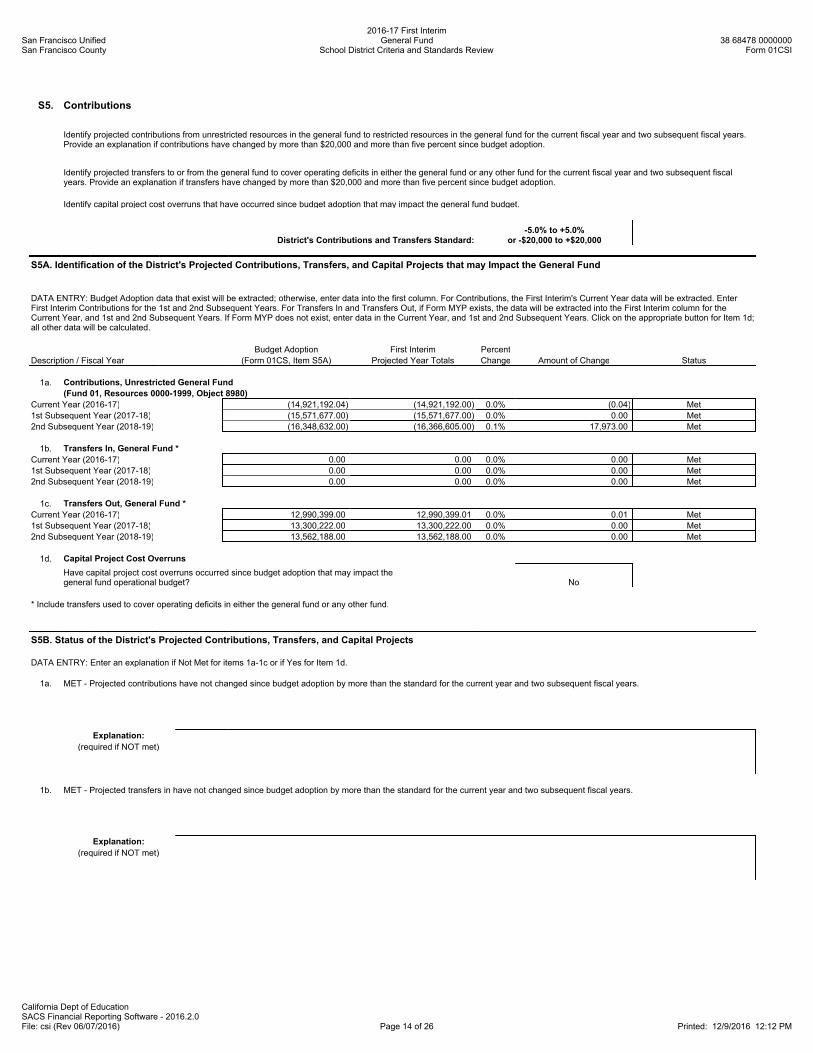
S5. Contributions
Identify projected contributions from unrestricted resources in the general fund to restricted resources in the general fund for the current fiscal year and two subsequent fiscal years.Provide an explanation if contributions have changed by more than $20,000 and more than five percent since budget adoption.
Identify projected transfers to or from the general fund to cover operating deficits in either the general fund or any other fund for the current fiscal year and two subsequent fiscalyears. Provide an explanation if transfers have changed by more than $20,000 and more than five percent since budget adoption.
Identify capital project cost overruns that have occurred since budget adoption that may impact the general fund budget.
District's Contributions and Transfers Standard:-5.0% to +5.0%
or -$20,000 to +$20,000
S5A. Identification of the District's Projected Contributions, Transfers, and Capital Projects that may Impact the General Fund
DATA ENTRY: Budget Adoption data that exist will be extracted; otherwise, enter data into the first column. For Contributions, the First Interim's Current Year data will be extracted. EnterFirst Interim Contributions for the 1st and 2nd Subsequent Years. For Transfers In and Transfers Out, if Form MYP exists, the data will be extracted into the First Interim column for theCurrent Year, and 1st and 2nd Subsequent Years. If Form MYP does not exist, enter data in the Current Year, and 1st and 2nd Subsequent Years. Click on the appropriate button for Item 1d;all other data will be calculated.
Budget Adoption First Interim Percent
Description / Fiscal Year (Form 01CS, Item S5A) Projected Year Totals Change Amount of Change Status
1a. Contributions, Unrestricted General Fund
(Fund 01, Resources 0000-1999, Object 8980)
Current Year (2016-17) (14,921,192.04) (14,921,192.00) 0.0% (0.04) Met
1st Subsequent Year (2017-18) (15,571,677.00) (15,571,677.00) 0.0% 0.00 Met
2nd Subsequent Year (2018-19) (16,348,632.00) (16,366,605.00) 0.1% 17,973.00 Met
1b. Transfers In, General Fund *
Current Year (2016-17) 0.00 0.00 0.0% 0.00 Met
1st Subsequent Year (2017-18) 0.00 0.00 0.0% 0.00 Met
2nd Subsequent Year (2018-19) 0.00 0.00 0.0% 0.00 Met
1c. Transfers Out, General Fund *
Current Year (2016-17) 12,990,399.00 12,990,399.01 0.0% 0.01 Met
1st Subsequent Year (2017-18) 13,300,222.00 13,300,222.00 0.0% 0.00 Met
2nd Subsequent Year (2018-19) 13,562,188.00 13,562,188.00 0.0% 0.00 Met
1d. Capital Project Cost Overruns
Have capital project cost overruns occurred since budget adoption that may impact thegeneral fund operational budget? No
* Include transfers used to cover operating deficits in either the general fund or any other fund.
S5B. Status of the District's Projected Contributions, Transfers, and Capital Projects
DATA ENTRY: Enter an explanation if Not Met for items 1a-1c or if Yes for Item 1d.
1a. MET - Projected contributions have not changed since budget adoption by more than the standard for the current year and two subsequent fiscal years.
Explanation:
(required if NOT met)
1b. MET - Projected transfers in have not changed since budget adoption by more than the standard for the current year and two subsequent fiscal years.
Explanation:
(required if NOT met)
San Francisco UnifiedSan Francisco County
2016-17 First InterimGeneral Fund
School District Criteria and Standards Review38 68478 0000000
Form 01CSI
California Dept of EducationSACS Financial Reporting Software - 2016.2.0File: csi (Rev 06/07/2016) Page 15 of 26 Printed: 12/9/2016 12:12 PM
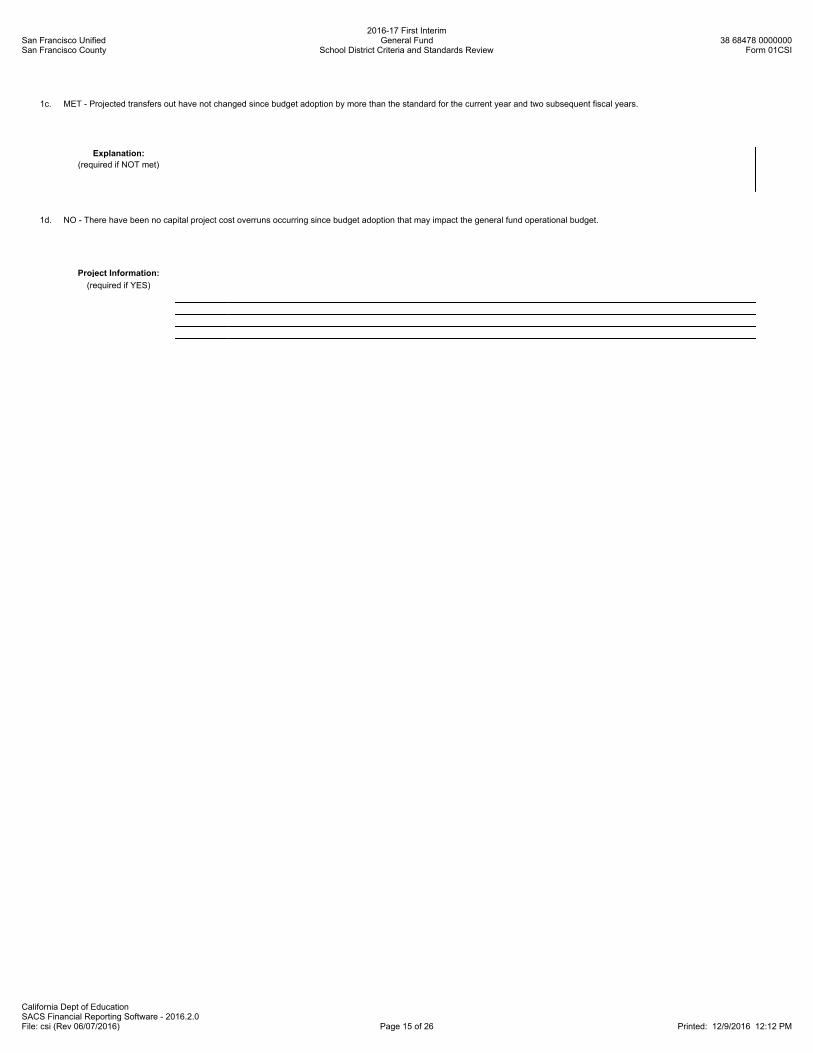
1c. MET - Projected transfers out have not changed since budget adoption by more than the standard for the current year and two subsequent fiscal years.
Explanation:
(required if NOT met)
1d. NO - There have been no capital project cost overruns occurring since budget adoption that may impact the general fund operational budget.
Project Information:
(required if YES)
San Francisco UnifiedSan Francisco County
2016-17 First InterimGeneral Fund
School District Criteria and Standards Review38 68478 0000000
Form 01CSI
California Dept of EducationSACS Financial Reporting Software - 2016.2.0File: csi (Rev 06/07/2016) Page 16 of 26 Printed: 12/9/2016 12:12 PM
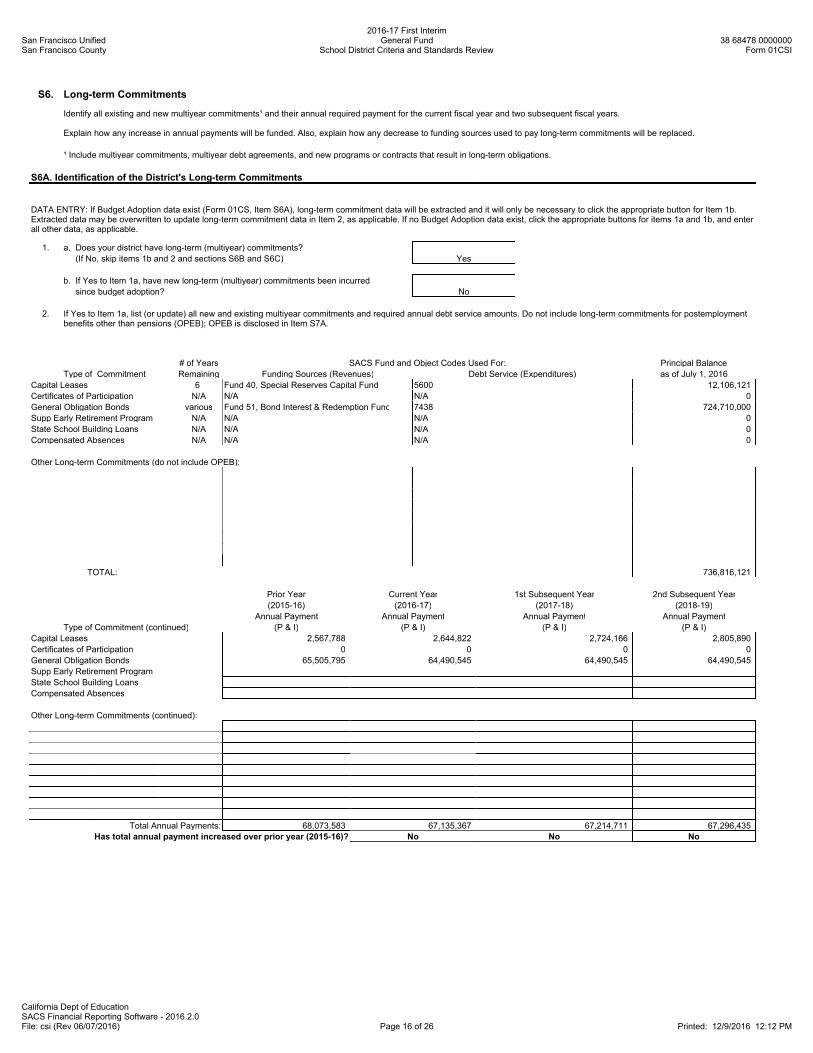
S6. Long-term Commitments
Identify all existing and new multiyear commitments¹ and their annual required payment for the current fiscal year and two subsequent fiscal years.
Explain how any increase in annual payments will be funded. Also, explain how any decrease to funding sources used to pay long-term commitments will be replaced.
¹ Include multiyear commitments, multiyear debt agreements, and new programs or contracts that result in long-term obligations.
S6A. Identification of the District's Long-term Commitments
DATA ENTRY: If Budget Adoption data exist (Form 01CS, Item S6A), long-term commitment data will be extracted and it will only be necessary to click the appropriate button for Item 1b.Extracted data may be overwritten to update long-term commitment data in Item 2, as applicable. If no Budget Adoption data exist, click the appropriate buttons for items 1a and 1b, and enterall other data, as applicable.
1. a. Does your district have long-term (multiyear) commitments?
(If No, skip items 1b and 2 and sections S6B and S6C) Yes
b. If Yes to Item 1a, have new long-term (multiyear) commitments been incurred
since budget adoption? No
2. If Yes to Item 1a, list (or update) all new and existing multiyear commitments and required annual debt service amounts. Do not include long-term commitments for postemploymentbenefits other than pensions (OPEB); OPEB is disclosed in Item S7A.
# of Years SACS Fund and Object Codes Used For: Principal Balance
Type of Commitment Remaining Funding Sources (Revenues) Debt Service (Expenditures) as of July 1, 2016
Capital Leases 6 Fund 40, Special Reserves Capital Fund 5600 12,106,121
Certificates of Participation N/A N/A N/A 0
General Obligation Bonds various Fund 51, Bond Interest & Redemption Fund 7438 724,710,000
Supp Early Retirement Program N/A N/A N/A 0
State School Building Loans N/A N/A N/A 0
Compensated Absences N/A N/A N/A 0
Other Long-term Commitments (do not include OPEB):
TOTAL: 736,816,121
Prior Year Current Year 1st Subsequent Year 2nd Subsequent Year
(2015-16) (2016-17) (2017-18) (2018-19)
Annual Payment Annual Payment Annual Payment Annual Payment
Type of Commitment (continued) (P & I) (P & I) (P & I) (P & I)
Capital Leases 2,567,788 2,644,822 2,724,166 2,805,890
Certificates of Participation 0 0 0 0
General Obligation Bonds 65,505,795 64,490,545 64,490,545 64,490,545
Supp Early Retirement Program
State School Building Loans
Compensated Absences
Other Long-term Commitments (continued):
Total Annual Payments: 68,073,583 67,135,367 67,214,711 67,296,435
Has total annual payment increased over prior year (2015-16)? No No No

San Francisco UnifiedSan Francisco County
2016-17 First InterimGeneral Fund
School District Criteria and Standards Review38 68478 0000000
Form 01CSI
California Dept of EducationSACS Financial Reporting Software - 2016.2.0File: csi (Rev 06/07/2016) Page 17 of 26 Printed: 12/9/2016 12:12 PM
S6B. Comparison of the District's Annual Payments to Prior Year Annual Payment
DATA ENTRY: Enter an explanation if Yes.
1a. No - Annual payments for long-term commitments have not increased in one or more of the current and two subsequent fiscal years.
Explanation:
(Required if Yes
to increase in total
annual payments)
S6C. Identification of Decreases to Funding Sources Used to Pay Long-term Commitments
DATA ENTRY: Click the appropriate Yes or No button in Item 1; if Yes, an explanation is required in Item 2.
1. Will funding sources used to pay long-term commitments decrease or expire prior to the end of the commitment period, or are they one-time sources?
No
2. No - Funding sources will not decrease or expire prior to the end of the commitment period, and one-time funds are not being used for long-term commitment.
Explanation:
(Required if Yes)
San Francisco UnifiedSan Francisco County
2016-17 First InterimGeneral Fund
School District Criteria and Standards Review38 68478 0000000
Form 01CSI
California Dept of EducationSACS Financial Reporting Software - 2016.2.0File: csi (Rev 06/07/2016) Page 18 of 26 Printed: 12/9/2016 12:12 PM
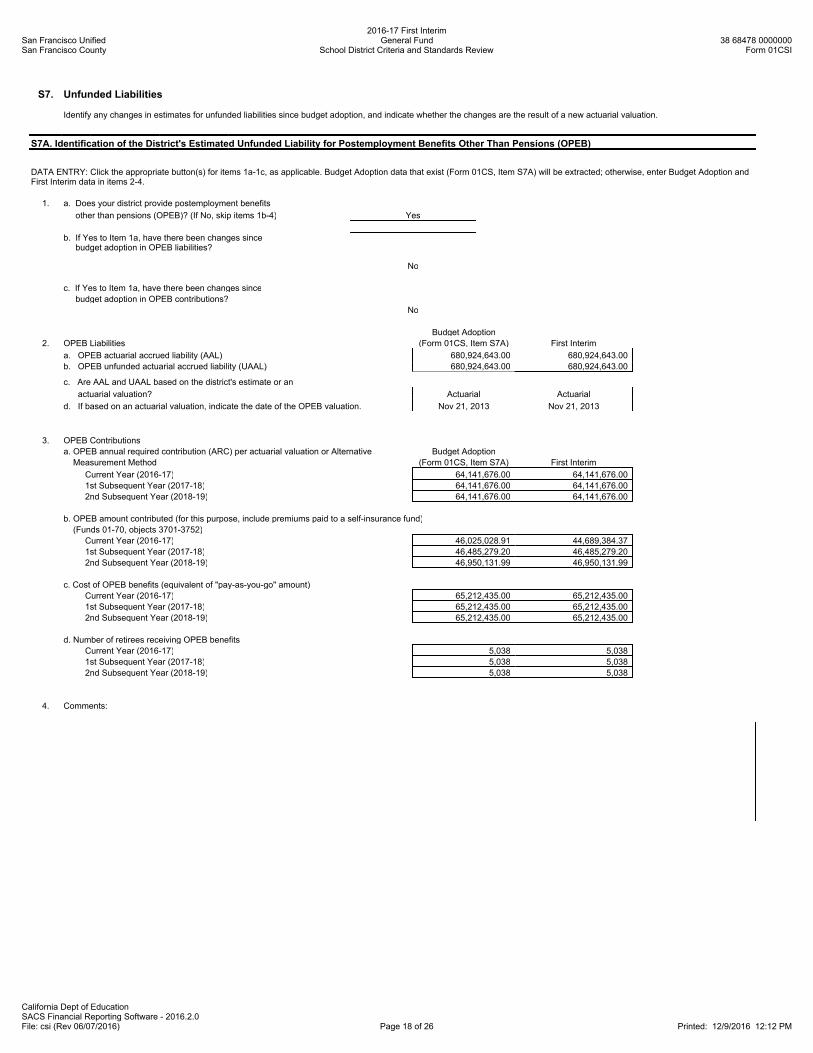
S7. Unfunded Liabilities
Identify any changes in estimates for unfunded liabilities since budget adoption, and indicate whether the changes are the result of a new actuarial valuation.
S7A. Identification of the District's Estimated Unfunded Liability for Postemployment Benefits Other Than Pensions (OPEB)
DATA ENTRY: Click the appropriate button(s) for items 1a-1c, as applicable. Budget Adoption data that exist (Form 01CS, Item S7A) will be extracted; otherwise, enter Budget Adoption andFirst Interim data in items 2-4.
1. a. Does your district provide postemployment benefits
other than pensions (OPEB)? (If No, skip items 1b-4) Yes
b. If Yes to Item 1a, have there been changes since budget adoption in OPEB liabilities?
No
c. If Yes to Item 1a, have there been changes since
budget adoption in OPEB contributions?
No
Budget Adoption
2. OPEB Liabilities (Form 01CS, Item S7A) First Interim
a. OPEB actuarial accrued liability (AAL) 680,924,643.00 680,924,643.00
b. OPEB unfunded actuarial accrued liability (UAAL) 680,924,643.00 680,924,643.00
c. Are AAL and UAAL based on the district's estimate or an
actuarial valuation? Actuarial Actuarial
d. If based on an actuarial valuation, indicate the date of the OPEB valuation. Nov 21, 2013 Nov 21, 2013
3. OPEB Contributions
a. OPEB annual required contribution (ARC) per actuarial valuation or Alternative Budget Adoption
Measurement Method (Form 01CS, Item S7A) First Interim
Current Year (2016-17) 64,141,676.00 64,141,676.00
1st Subsequent Year (2017-18) 64,141,676.00 64,141,676.00
2nd Subsequent Year (2018-19) 64,141,676.00 64,141,676.00
b. OPEB amount contributed (for this purpose, include premiums paid to a self-insurance fund)
(Funds 01-70, objects 3701-3752)
Current Year (2016-17) 46,025,028.91 44,689,384.37
1st Subsequent Year (2017-18) 46,485,279.20 46,485,279.20
2nd Subsequent Year (2018-19) 46,950,131.99 46,950,131.99
c. Cost of OPEB benefits (equivalent of "pay-as-you-go" amount)
Current Year (2016-17) 65,212,435.00 65,212,435.00
1st Subsequent Year (2017-18) 65,212,435.00 65,212,435.00
2nd Subsequent Year (2018-19) 65,212,435.00 65,212,435.00
d. Number of retirees receiving OPEB benefits
Current Year (2016-17) 5,038 5,038
1st Subsequent Year (2017-18) 5,038 5,038
2nd Subsequent Year (2018-19) 5,038 5,038
4. Comments:
San Francisco UnifiedSan Francisco County
2016-17 First InterimGeneral Fund
School District Criteria and Standards Review38 68478 0000000
Form 01CSI
California Dept of EducationSACS Financial Reporting Software - 2016.2.0File: csi (Rev 06/07/2016) Page 19 of 26 Printed: 12/9/2016 12:12 PM
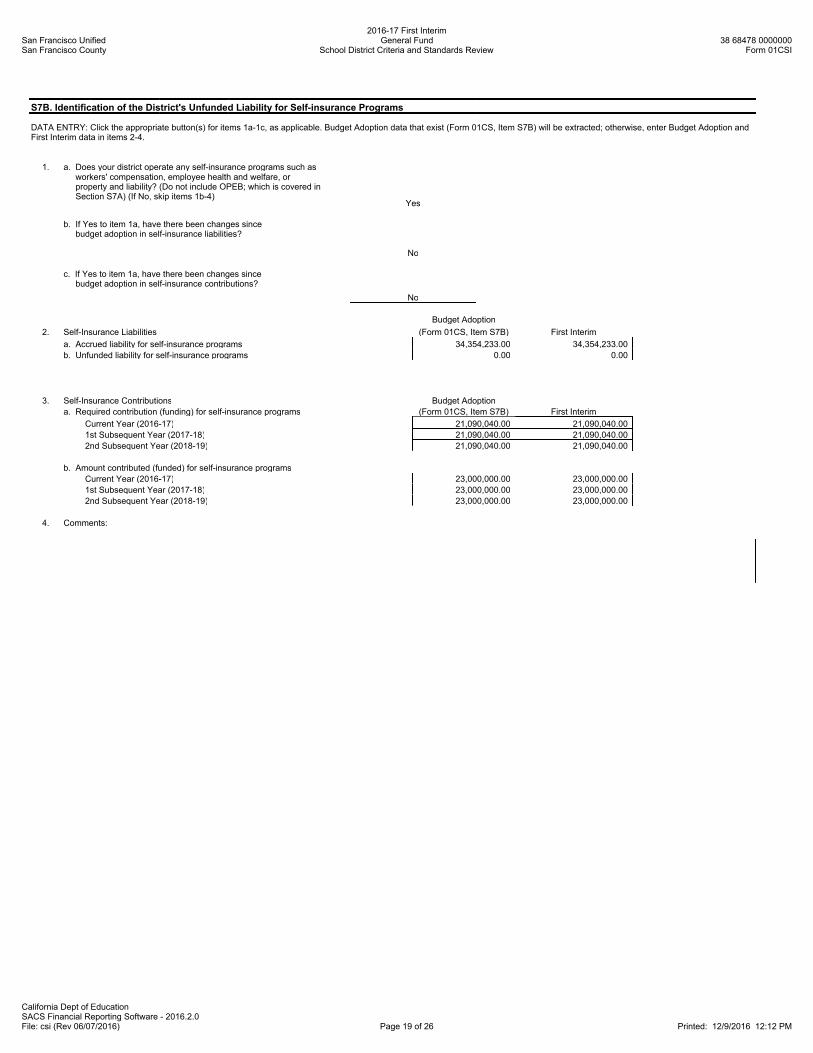
S7B. Identification of the District's Unfunded Liability for Self-insurance Programs
DATA ENTRY: Click the appropriate button(s) for items 1a-1c, as applicable. Budget Adoption data that exist (Form 01CS, Item S7B) will be extracted; otherwise, enter Budget Adoption andFirst Interim data in items 2-4.
1. a. Does your district operate any self-insurance programs such as workers' compensation, employee health and welfare, or property and liability? (Do not include OPEB; which is covered in Section S7A) (If No, skip items 1b-4)
Yes
b. If Yes to item 1a, have there been changes since budget adoption in self-insurance liabilities?
No
c. If Yes to item 1a, have there been changes since budget adoption in self-insurance contributions?
No
Budget Adoption
2. Self-Insurance Liabilities (Form 01CS, Item S7B) First Interim
a. Accrued liability for self-insurance programs 34,354,233.00 34,354,233.00
b. Unfunded liability for self-insurance programs 0.00 0.00
3. Self-Insurance Contributions Budget Adoption
a. Required contribution (funding) for self-insurance programs (Form 01CS, Item S7B) First Interim
Current Year (2016-17) 21,090,040.00 21,090,040.00
1st Subsequent Year (2017-18) 21,090,040.00 21,090,040.00
2nd Subsequent Year (2018-19) 21,090,040.00 21,090,040.00
b. Amount contributed (funded) for self-insurance programs
Current Year (2016-17) 23,000,000.00 23,000,000.00
1st Subsequent Year (2017-18) 23,000,000.00 23,000,000.00
2nd Subsequent Year (2018-19) 23,000,000.00 23,000,000.00
4. Comments:
San Francisco UnifiedSan Francisco County
2016-17 First InterimGeneral Fund
School District Criteria and Standards Review38 68478 0000000
Form 01CSI
California Dept of EducationSACS Financial Reporting Software - 2016.2.0File: csi (Rev 06/07/2016) Page 20 of 26 Printed: 12/9/2016 12:12 PM
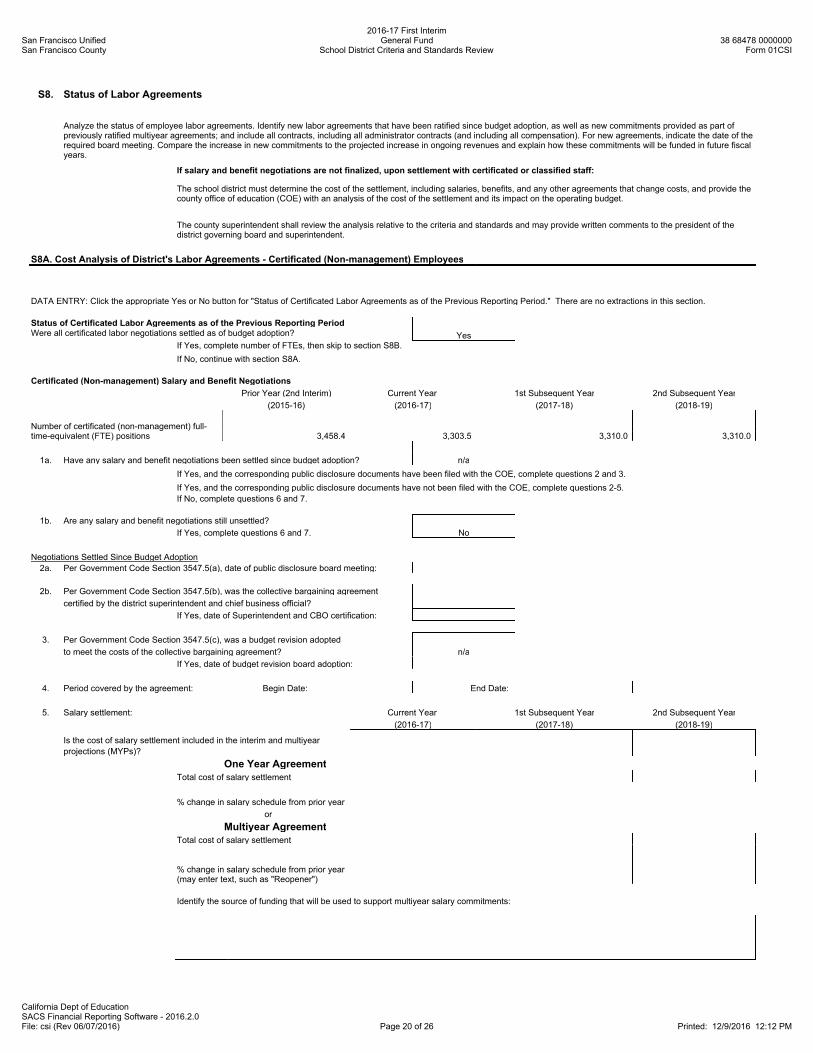
S8. Status of Labor Agreements
Analyze the status of employee labor agreements. Identify new labor agreements that have been ratified since budget adoption, as well as new commitments provided as part ofpreviously ratified multiyear agreements; and include all contracts, including all administrator contracts (and including all compensation). For new agreements, indicate the date of therequired board meeting. Compare the increase in new commitments to the projected increase in ongoing revenues and explain how these commitments will be funded in future fiscalyears.
If salary and benefit negotiations are not finalized, upon settlement with certificated or classified staff:
The school district must determine the cost of the settlement, including salaries, benefits, and any other agreements that change costs, and provide thecounty office of education (COE) with an analysis of the cost of the settlement and its impact on the operating budget.
The county superintendent shall review the analysis relative to the criteria and standards and may provide written comments to the president of thedistrict governing board and superintendent.
S8A. Cost Analysis of District's Labor Agreements - Certificated (Non-management) Employees
DATA ENTRY: Click the appropriate Yes or No button for "Status of Certificated Labor Agreements as of the Previous Reporting Period." There are no extractions in this section.
Status of Certificated Labor Agreements as of the Previous Reporting PeriodWere all certificated labor negotiations settled as of budget adoption? Yes
If Yes, complete number of FTEs, then skip to section S8B.
If No, continue with section S8A.
Certificated (Non-management) Salary and Benefit Negotiations
Prior Year (2nd Interim) Current Year 1st Subsequent Year 2nd Subsequent Year
(2015-16) (2016-17) (2017-18) (2018-19)
Number of certificated (non-management) full-time-equivalent (FTE) positions 3,458.4 3,303.5 3,310.0 3,310.0
1a. Have any salary and benefit negotiations been settled since budget adoption? n/a
If Yes, and the corresponding public disclosure documents have been filed with the COE, complete questions 2 and 3.
If Yes, and the corresponding public disclosure documents have not been filed with the COE, complete questions 2-5.
If No, complete questions 6 and 7.
1b. Are any salary and benefit negotiations still unsettled?
If Yes, complete questions 6 and 7. No
Negotiations Settled Since Budget Adoption
2a. Per Government Code Section 3547.5(a), date of public disclosure board meeting:
2b. Per Government Code Section 3547.5(b), was the collective bargaining agreement
certified by the district superintendent and chief business official?
If Yes, date of Superintendent and CBO certification:
3. Per Government Code Section 3547.5(c), was a budget revision adopted
to meet the costs of the collective bargaining agreement? n/a
If Yes, date of budget revision board adoption:
4. Period covered by the agreement: Begin Date: End Date:
5. Salary settlement: Current Year 1st Subsequent Year 2nd Subsequent Year
(2016-17) (2017-18) (2018-19)
Is the cost of salary settlement included in the interim and multiyear
projections (MYPs)?
One Year Agreement
Total cost of salary settlement
% change in salary schedule from prior year
or
Multiyear Agreement
Total cost of salary settlement
% change in salary schedule from prior year(may enter text, such as "Reopener")
Identify the source of funding that will be used to support multiyear salary commitments:
San Francisco UnifiedSan Francisco County
2016-17 First InterimGeneral Fund
School District Criteria and Standards Review38 68478 0000000
Form 01CSI
California Dept of EducationSACS Financial Reporting Software - 2016.2.0File: csi (Rev 06/07/2016) Page 21 of 26 Printed: 12/9/2016 12:12 PM
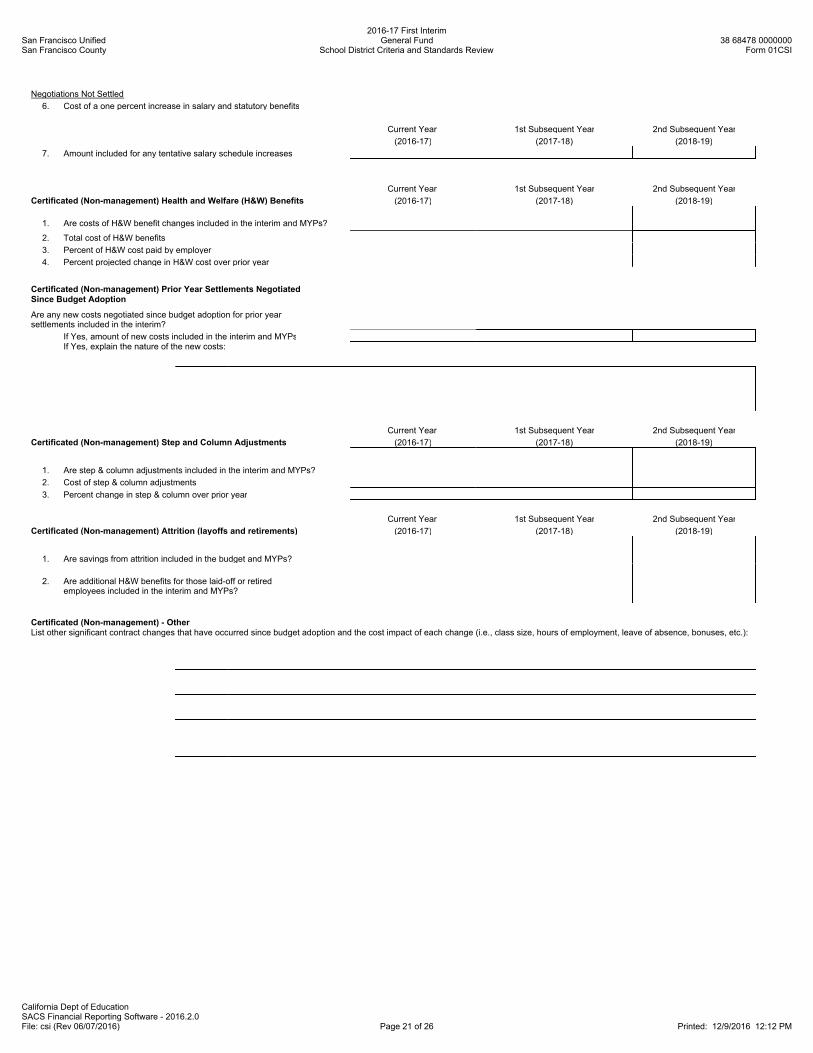
Negotiations Not Settled
6. Cost of a one percent increase in salary and statutory benefits
Current Year 1st Subsequent Year 2nd Subsequent Year
(2016-17) (2017-18) (2018-19)
7. Amount included for any tentative salary schedule increases
Current Year 1st Subsequent Year 2nd Subsequent Year
Certificated (Non-management) Health and Welfare (H&W) Benefits (2016-17) (2017-18) (2018-19)
1. Are costs of H&W benefit changes included in the interim and MYPs?
2. Total cost of H&W benefits
3. Percent of H&W cost paid by employer
4. Percent projected change in H&W cost over prior year
Certificated (Non-management) Prior Year Settlements NegotiatedSince Budget Adoption
Are any new costs negotiated since budget adoption for prior yearsettlements included in the interim?
If Yes, amount of new costs included in the interim and MYPsIf Yes, explain the nature of the new costs:
Current Year 1st Subsequent Year 2nd Subsequent Year
Certificated (Non-management) Step and Column Adjustments (2016-17) (2017-18) (2018-19)
1. Are step & column adjustments included in the interim and MYPs?
2. Cost of step & column adjustments
3. Percent change in step & column over prior year
Current Year 1st Subsequent Year 2nd Subsequent Year
Certificated (Non-management) Attrition (layoffs and retirements) (2016-17) (2017-18) (2018-19)
1. Are savings from attrition included in the budget and MYPs?
2. Are additional H&W benefits for those laid-off or retiredemployees included in the interim and MYPs?
Certificated (Non-management) - OtherList other significant contract changes that have occurred since budget adoption and the cost impact of each change (i.e., class size, hours of employment, leave of absence, bonuses, etc.):
San Francisco UnifiedSan Francisco County
2016-17 First InterimGeneral Fund
School District Criteria and Standards Review38 68478 0000000
Form 01CSI
California Dept of EducationSACS Financial Reporting Software - 2016.2.0File: csi (Rev 06/07/2016) Page 22 of 26 Printed: 12/9/2016 12:12 PM
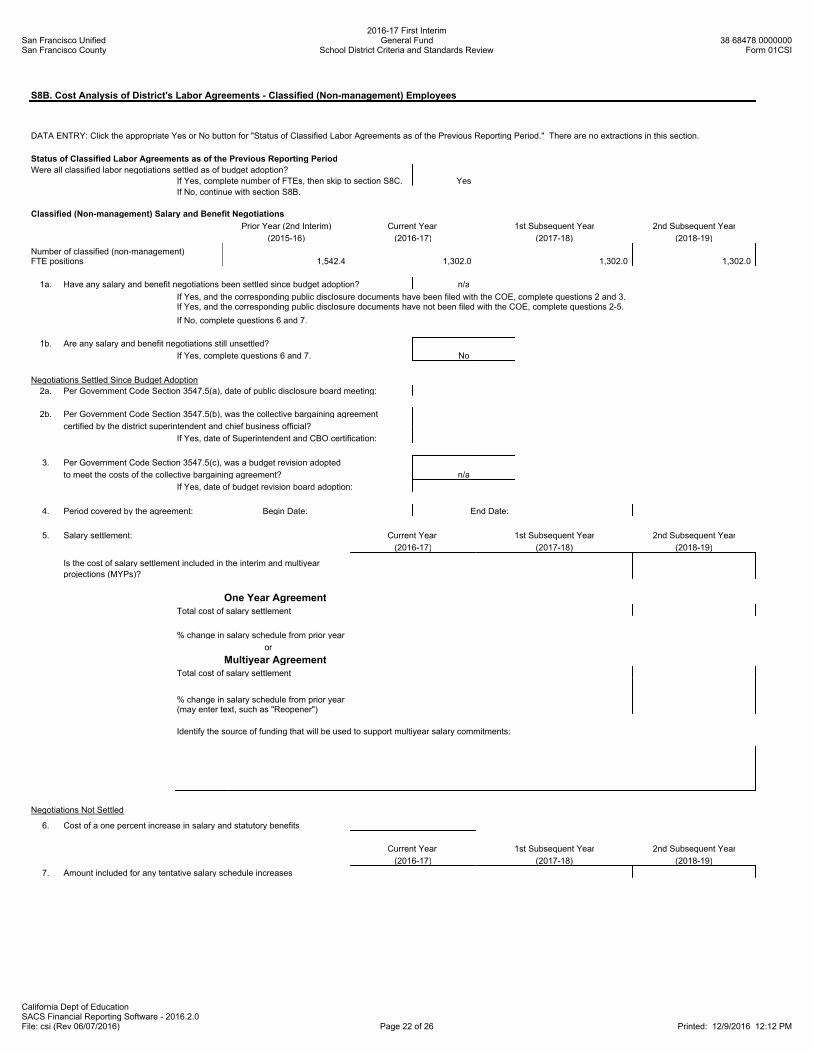
S8B. Cost Analysis of District's Labor Agreements - Classified (Non-management) Employees
DATA ENTRY: Click the appropriate Yes or No button for "Status of Classified Labor Agreements as of the Previous Reporting Period." There are no extractions in this section.
Status of Classified Labor Agreements as of the Previous Reporting Period
Were all classified labor negotiations settled as of budget adoption?
If Yes, complete number of FTEs, then skip to section S8C. Yes
If No, continue with section S8B.
Classified (Non-management) Salary and Benefit Negotiations
Prior Year (2nd Interim) Current Year 1st Subsequent Year 2nd Subsequent Year
(2015-16) (2016-17) (2017-18) (2018-19)
Number of classified (non-management)FTE positions 1,542.4 1,302.0 1,302.0 1,302.0
1a. Have any salary and benefit negotiations been settled since budget adoption? n/a
If Yes, and the corresponding public disclosure documents have been filed with the COE, complete questions 2 and 3.If Yes, and the corresponding public disclosure documents have not been filed with the COE, complete questions 2-5.
If No, complete questions 6 and 7.
1b. Are any salary and benefit negotiations still unsettled?
If Yes, complete questions 6 and 7. No
Negotiations Settled Since Budget Adoption
2a. Per Government Code Section 3547.5(a), date of public disclosure board meeting:
2b. Per Government Code Section 3547.5(b), was the collective bargaining agreement
certified by the district superintendent and chief business official?
If Yes, date of Superintendent and CBO certification:
3. Per Government Code Section 3547.5(c), was a budget revision adopted
to meet the costs of the collective bargaining agreement? n/a
If Yes, date of budget revision board adoption:
4. Period covered by the agreement: Begin Date: End Date:
5. Salary settlement: Current Year 1st Subsequent Year 2nd Subsequent Year
(2016-17) (2017-18) (2018-19)
Is the cost of salary settlement included in the interim and multiyear
projections (MYPs)?
One Year Agreement
Total cost of salary settlement
% change in salary schedule from prior year
or
Multiyear Agreement
Total cost of salary settlement
% change in salary schedule from prior year(may enter text, such as "Reopener")
Identify the source of funding that will be used to support multiyear salary commitments:
Negotiations Not Settled
6. Cost of a one percent increase in salary and statutory benefits
Current Year 1st Subsequent Year 2nd Subsequent Year
(2016-17) (2017-18) (2018-19)
7. Amount included for any tentative salary schedule increases
San Francisco UnifiedSan Francisco County
2016-17 First InterimGeneral Fund
School District Criteria and Standards Review38 68478 0000000
Form 01CSI
California Dept of EducationSACS Financial Reporting Software - 2016.2.0File: csi (Rev 06/07/2016) Page 23 of 26 Printed: 12/9/2016 12:12 PM
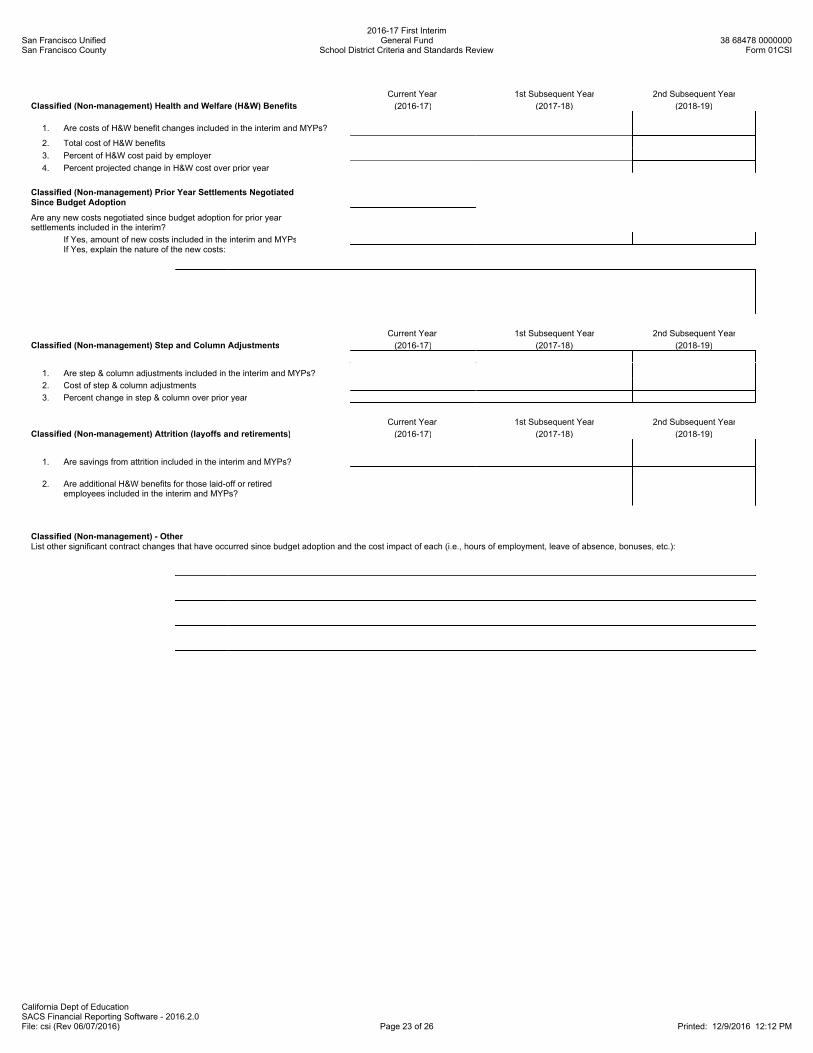
Current Year 1st Subsequent Year 2nd Subsequent Year
Classified (Non-management) Health and Welfare (H&W) Benefits (2016-17) (2017-18) (2018-19)
1. Are costs of H&W benefit changes included in the interim and MYPs?
2. Total cost of H&W benefits
3. Percent of H&W cost paid by employer
4. Percent projected change in H&W cost over prior year
Classified (Non-management) Prior Year Settlements NegotiatedSince Budget Adoption
Are any new costs negotiated since budget adoption for prior yearsettlements included in the interim?
If Yes, amount of new costs included in the interim and MYPsIf Yes, explain the nature of the new costs:
Current Year 1st Subsequent Year 2nd Subsequent Year
Classified (Non-management) Step and Column Adjustments (2016-17) (2017-18) (2018-19)
1. Are step & column adjustments included in the interim and MYPs?
2. Cost of step & column adjustments
3. Percent change in step & column over prior year
Current Year 1st Subsequent Year 2nd Subsequent Year
Classified (Non-management) Attrition (layoffs and retirements) (2016-17) (2017-18) (2018-19)
1. Are savings from attrition included in the interim and MYPs?
2. Are additional H&W benefits for those laid-off or retiredemployees included in the interim and MYPs?
Classified (Non-management) - OtherList other significant contract changes that have occurred since budget adoption and the cost impact of each (i.e., hours of employment, leave of absence, bonuses, etc.):
San Francisco UnifiedSan Francisco County
2016-17 First InterimGeneral Fund
School District Criteria and Standards Review38 68478 0000000
Form 01CSI
California Dept of EducationSACS Financial Reporting Software - 2016.2.0File: csi (Rev 06/07/2016) Page 24 of 26 Printed: 12/9/2016 12:12 PM
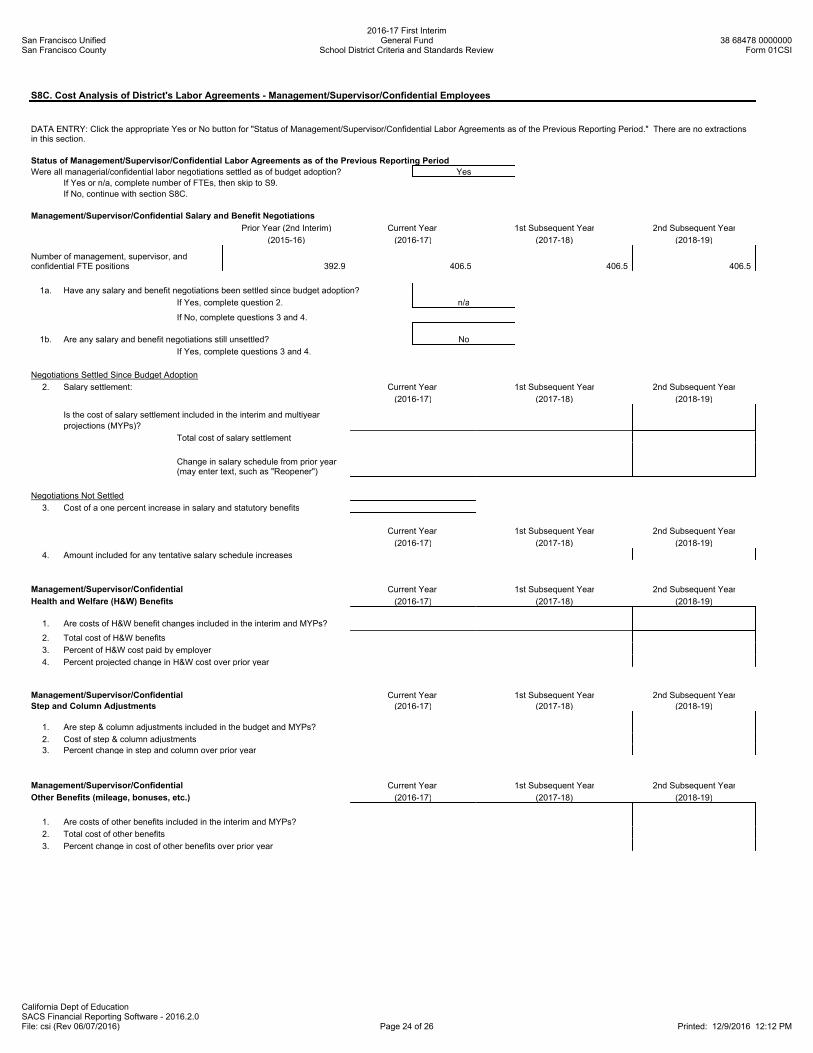
S8C. Cost Analysis of District's Labor Agreements - Management/Supervisor/Confidential Employees
DATA ENTRY: Click the appropriate Yes or No button for "Status of Management/Supervisor/Confidential Labor Agreements as of the Previous Reporting Period." There are no extractionsin this section.
Status of Management/Supervisor/Confidential Labor Agreements as of the Previous Reporting Period
Were all managerial/confidential labor negotiations settled as of budget adoption? Yes
If Yes or n/a, complete number of FTEs, then skip to S9.
If No, continue with section S8C.
Management/Supervisor/Confidential Salary and Benefit Negotiations
Prior Year (2nd Interim) Current Year 1st Subsequent Year 2nd Subsequent Year
(2015-16) (2016-17) (2017-18) (2018-19)
Number of management, supervisor, andconfidential FTE positions 392.9 406.5 406.5 406.5
1a. Have any salary and benefit negotiations been settled since budget adoption?
If Yes, complete question 2. n/a
If No, complete questions 3 and 4.
1b. Are any salary and benefit negotiations still unsettled? No
If Yes, complete questions 3 and 4.
Negotiations Settled Since Budget Adoption
2. Salary settlement: Current Year 1st Subsequent Year 2nd Subsequent Year
(2016-17) (2017-18) (2018-19)
Is the cost of salary settlement included in the interim and multiyear
projections (MYPs)?
Total cost of salary settlement
Change in salary schedule from prior year(may enter text, such as "Reopener")
Negotiations Not Settled
3. Cost of a one percent increase in salary and statutory benefits
Current Year 1st Subsequent Year 2nd Subsequent Year
(2016-17) (2017-18) (2018-19)
4. Amount included for any tentative salary schedule increases
Management/Supervisor/Confidential Current Year 1st Subsequent Year 2nd Subsequent Year
Health and Welfare (H&W) Benefits (2016-17) (2017-18) (2018-19)
1. Are costs of H&W benefit changes included in the interim and MYPs?
2. Total cost of H&W benefits
3. Percent of H&W cost paid by employer
4. Percent projected change in H&W cost over prior year
Management/Supervisor/Confidential Current Year 1st Subsequent Year 2nd Subsequent Year
Step and Column Adjustments (2016-17) (2017-18) (2018-19)
1. Are step & column adjustments included in the budget and MYPs?
2. Cost of step & column adjustments
3. Percent change in step and column over prior year
Management/Supervisor/Confidential Current Year 1st Subsequent Year 2nd Subsequent Year
Other Benefits (mileage, bonuses, etc.) (2016-17) (2017-18) (2018-19)
1. Are costs of other benefits included in the interim and MYPs?
2. Total cost of other benefits
3. Percent change in cost of other benefits over prior year
San Francisco UnifiedSan Francisco County
2016-17 First InterimGeneral Fund
School District Criteria and Standards Review38 68478 0000000
Form 01CSI
California Dept of EducationSACS Financial Reporting Software - 2016.2.0File: csi (Rev 06/07/2016) Page 25 of 26 Printed: 12/9/2016 12:12 PM
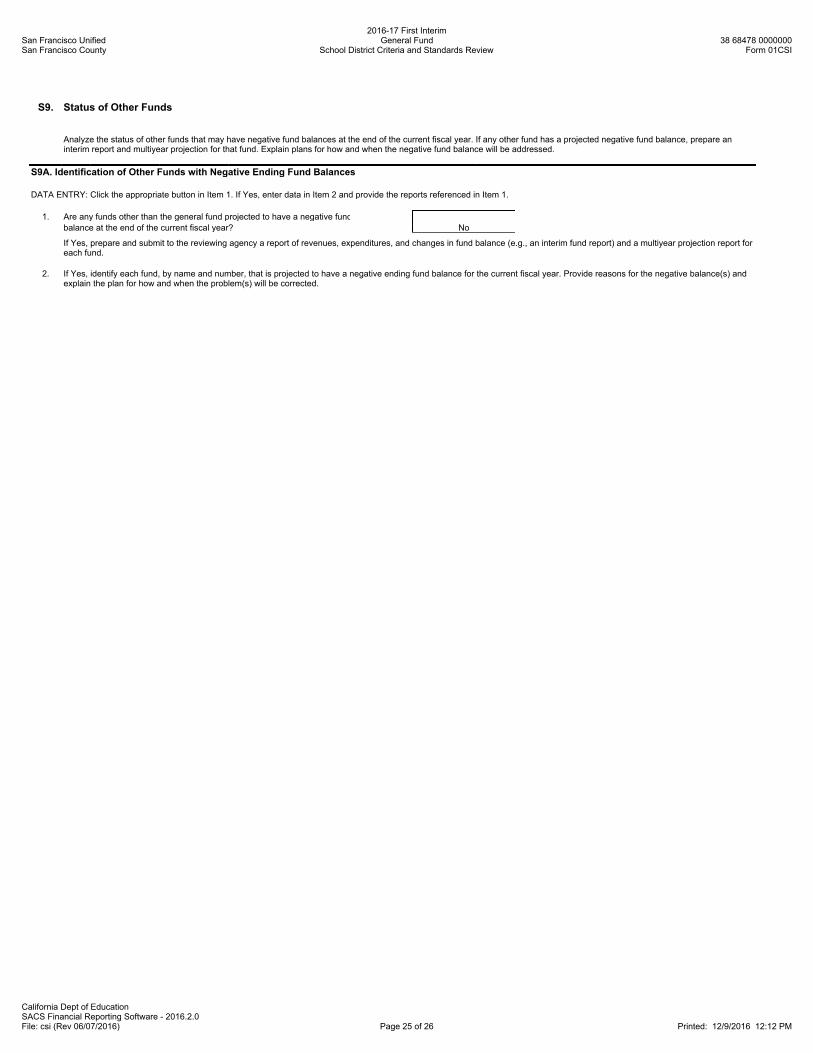
S9. Status of Other Funds
Analyze the status of other funds that may have negative fund balances at the end of the current fiscal year. If any other fund has a projected negative fund balance, prepare aninterim report and multiyear projection for that fund. Explain plans for how and when the negative fund balance will be addressed.
S9A. Identification of Other Funds with Negative Ending Fund Balances
DATA ENTRY: Click the appropriate button in Item 1. If Yes, enter data in Item 2 and provide the reports referenced in Item 1.
1. Are any funds other than the general fund projected to have a negative fund
balance at the end of the current fiscal year? No
If Yes, prepare and submit to the reviewing agency a report of revenues, expenditures, and changes in fund balance (e.g., an interim fund report) and a multiyear projection report foreach fund.
2. If Yes, identify each fund, by name and number, that is projected to have a negative ending fund balance for the current fiscal year. Provide reasons for the negative balance(s) andexplain the plan for how and when the problem(s) will be corrected.
San Francisco UnifiedSan Francisco County
2016-17 First InterimGeneral Fund
School District Criteria and Standards Review38 68478 0000000
Form 01CSI
California Dept of EducationSACS Financial Reporting Software - 2016.2.0File: csi (Rev 06/07/2016) Page 26 of 26 Printed: 12/9/2016 12:12 PM
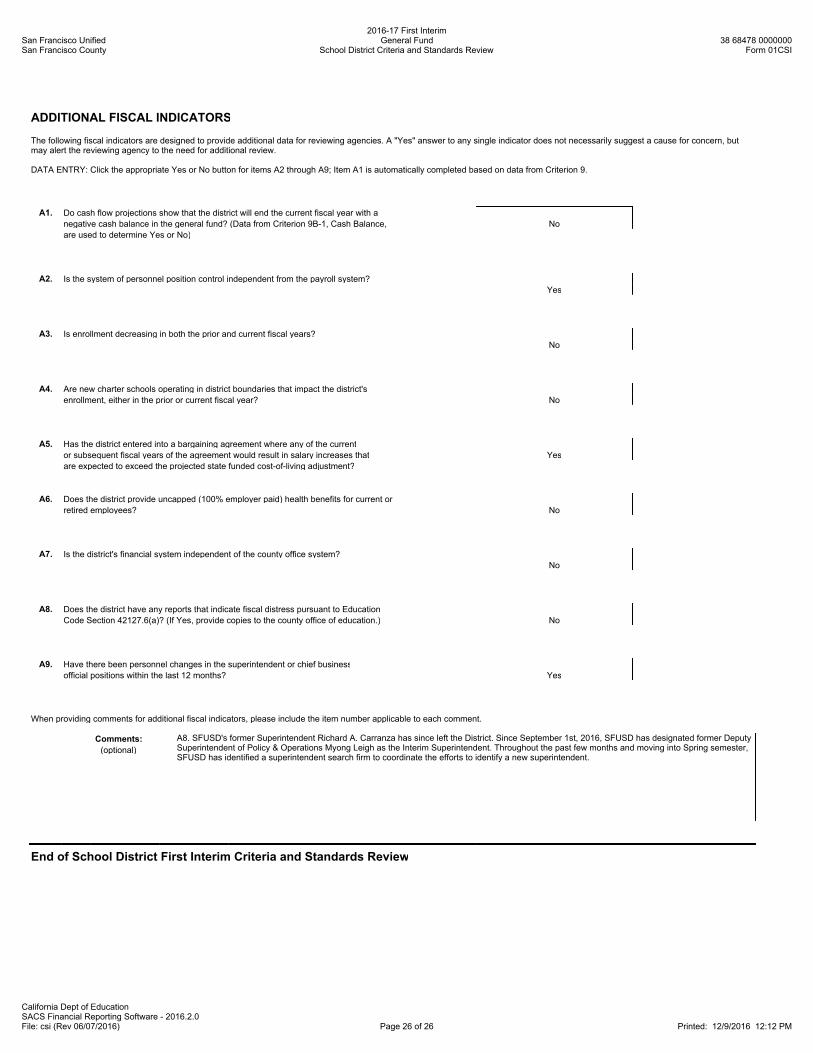
ADDITIONAL FISCAL INDICATORS
The following fiscal indicators are designed to provide additional data for reviewing agencies. A "Yes" answer to any single indicator does not necessarily suggest a cause for concern, butmay alert the reviewing agency to the need for additional review.
DATA ENTRY: Click the appropriate Yes or No button for items A2 through A9; Item A1 is automatically completed based on data from Criterion 9.
A1. Do cash flow projections show that the district will end the current fiscal year with a
negative cash balance in the general fund? (Data from Criterion 9B-1, Cash Balance, No
are used to determine Yes or No)
A2. Is the system of personnel position control independent from the payroll system?
Yes
A3. Is enrollment decreasing in both the prior and current fiscal years?
No
A4. Are new charter schools operating in district boundaries that impact the district's
enrollment, either in the prior or current fiscal year? No
A5. Has the district entered into a bargaining agreement where any of the current
or subsequent fiscal years of the agreement would result in salary increases that Yes
are expected to exceed the projected state funded cost-of-living adjustment?
A6. Does the district provide uncapped (100% employer paid) health benefits for current or
retired employees? No
A7. Is the district's financial system independent of the county office system?
No
A8. Does the district have any reports that indicate fiscal distress pursuant to Education
Code Section 42127.6(a)? (If Yes, provide copies to the county office of education.) No
A9. Have there been personnel changes in the superintendent or chief business
official positions within the last 12 months? Yes
When providing comments for additional fiscal indicators, please include the item number applicable to each comment.
Comments:
(optional)
A8. SFUSD's former Superintendent Richard A. Carranza has since left the District. Since September 1st, 2016, SFUSD has designated former DeputySuperintendent of Policy & Operations Myong Leigh as the Interim Superintendent. Throughout the past few months and moving into Spring semester,SFUSD has identified a superintendent search firm to coordinate the efforts to identify a new superintendent.
End of School District First Interim Criteria and Standards Review
San Francisco UnifiedSan Francisco County
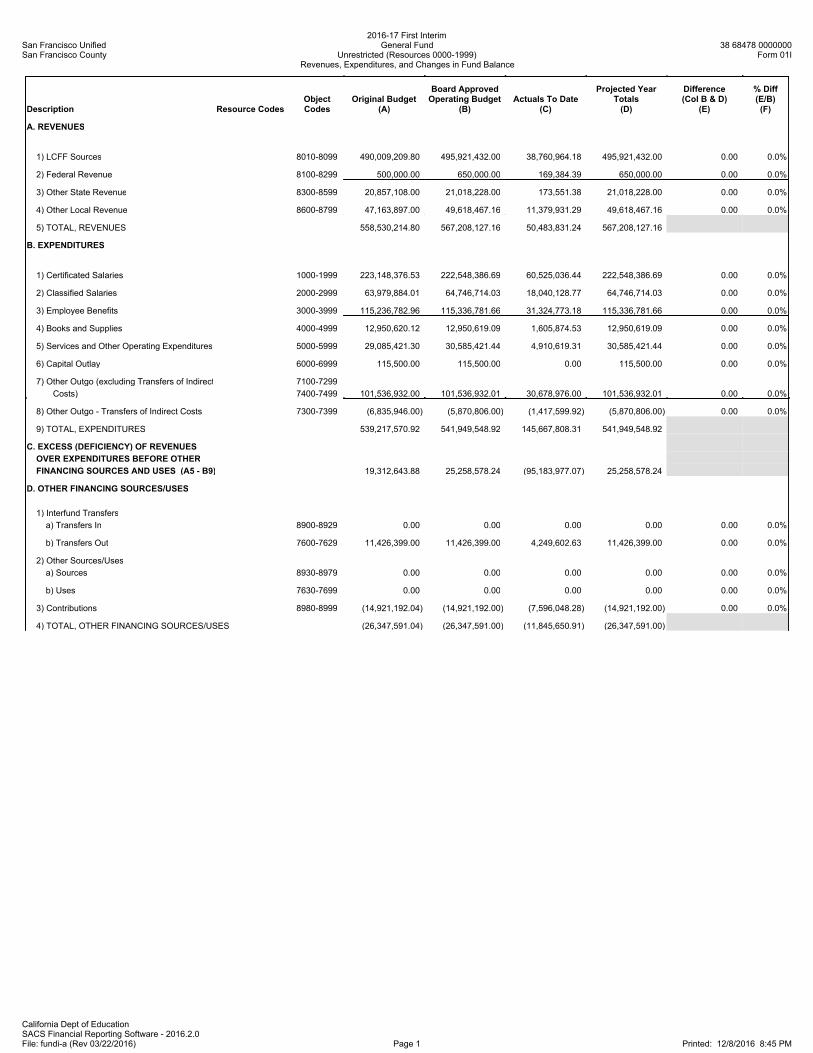
2016-17 First InterimGeneral Fund
Unrestricted (Resources 0000-1999)Revenues, Expenditures, and Changes in Fund Balance
38 68478 0000000Form 01I
California Dept of EducationSACS Financial Reporting Software - 2016.2.0File: fundi-a (Rev 03/22/2016) Page 1 Printed: 12/8/2016 8:45 PM
Description Resource CodesObjectCodes
Original Budget(A)
Board ApprovedOperating Budget
(B)Actuals To Date
(C)
Projected YearTotals(D)
Difference(Col B & D)
(E)
% Diff(E/B)(F)
A. REVENUES
1) LCFF Sources 8010-8099 490,009,209.80 495,921,432.00 38,760,964.18 495,921,432.00 0.00 0.0%
2) Federal Revenue 8100-8299 500,000.00 650,000.00 169,384.39 650,000.00 0.00 0.0%
3) Other State Revenue 8300-8599 20,857,108.00 21,018,228.00 173,551.38 21,018,228.00 0.00 0.0%
4) Other Local Revenue 8600-8799 47,163,897.00 49,618,467.16 11,379,931.29 49,618,467.16 0.00 0.0%
5) TOTAL, REVENUES 558,530,214.80 567,208,127.16 50,483,831.24 567,208,127.16
B. EXPENDITURES
1) Certificated Salaries 1000-1999 223,148,376.53 222,548,386.69 60,525,036.44 222,548,386.69 0.00 0.0%
2) Classified Salaries 2000-2999 63,979,884.01 64,746,714.03 18,040,128.77 64,746,714.03 0.00 0.0%
3) Employee Benefits 3000-3999 115,236,782.96 115,336,781.66 31,324,773.18 115,336,781.66 0.00 0.0%
4) Books and Supplies 4000-4999 12,950,620.12 12,950,619.09 1,605,874.53 12,950,619.09 0.00 0.0%
5) Services and Other Operating Expenditures 5000-5999 29,085,421.30 30,585,421.44 4,910,619.31 30,585,421.44 0.00 0.0%
6) Capital Outlay 6000-6999 115,500.00 115,500.00 0.00 115,500.00 0.00 0.0%
7) Other Outgo (excluding Transfers of Indirect 7100-7299
Costs) 7400-7499 101,536,932.00 101,536,932.01 30,678,976.00 101,536,932.01 0.00 0.0%
8) Other Outgo - Transfers of Indirect Costs 7300-7399 (6,835,946.00) (5,870,806.00) (1,417,599.92) (5,870,806.00) 0.00 0.0%
9) TOTAL, EXPENDITURES 539,217,570.92 541,949,548.92 145,667,808.31 541,949,548.92
C. EXCESS (DEFICIENCY) OF REVENUES
OVER EXPENDITURES BEFORE OTHER
FINANCING SOURCES AND USES (A5 - B9) 19,312,643.88 25,258,578.24 (95,183,977.07) 25,258,578.24
D. OTHER FINANCING SOURCES/USES
1) Interfund Transfers
a) Transfers In 8900-8929 0.00 0.00 0.00 0.00 0.00 0.0%
b) Transfers Out 7600-7629 11,426,399.00 11,426,399.00 4,249,602.63 11,426,399.00 0.00 0.0%
2) Other Sources/Uses
a) Sources 8930-8979 0.00 0.00 0.00 0.00 0.00 0.0%
b) Uses 7630-7699 0.00 0.00 0.00 0.00 0.00 0.0%
3) Contributions 8980-8999 (14,921,192.04) (14,921,192.00) (7,596,048.28) (14,921,192.00) 0.00 0.0%
4) TOTAL, OTHER FINANCING SOURCES/USES (26,347,591.04) (26,347,591.00) (11,845,650.91) (26,347,591.00)
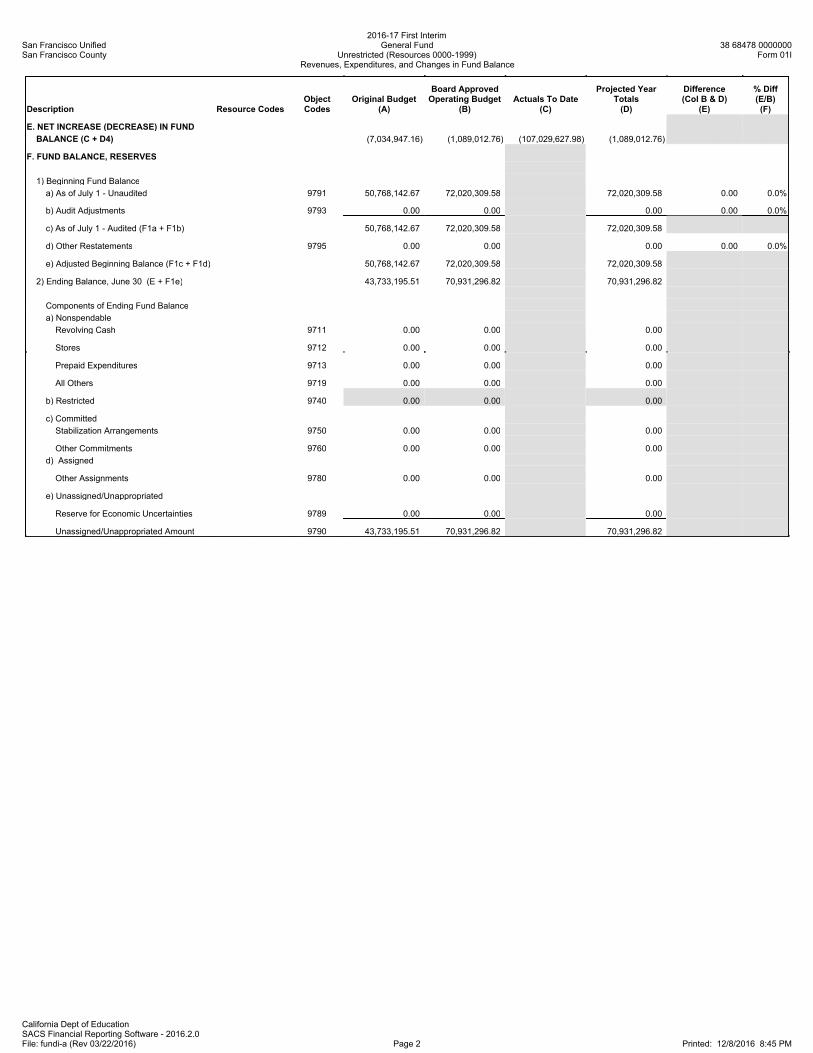
San Francisco UnifiedSan Francisco County
2016-17 First InterimGeneral Fund
Unrestricted (Resources 0000-1999)Revenues, Expenditures, and Changes in Fund Balance
38 68478 0000000Form 01I
California Dept of EducationSACS Financial Reporting Software - 2016.2.0File: fundi-a (Rev 03/22/2016) Page 2 Printed: 12/8/2016 8:45 PM
Description Resource CodesObjectCodes
Original Budget(A)
Board ApprovedOperating Budget
(B)Actuals To Date
(C)
Projected YearTotals(D)
Difference(Col B & D)
(E)
% Diff(E/B)(F)
E. NET INCREASE (DECREASE) IN FUND
BALANCE (C + D4) (7,034,947.16) (1,089,012.76) (107,029,627.98) (1,089,012.76)
F. FUND BALANCE, RESERVES
1) Beginning Fund Balance
a) As of July 1 - Unaudited 9791 50,768,142.67 72,020,309.58 72,020,309.58 0.00 0.0%
b) Audit Adjustments 9793 0.00 0.00 0.00 0.00 0.0%
c) As of July 1 - Audited (F1a + F1b) 50,768,142.67 72,020,309.58 72,020,309.58
d) Other Restatements 9795 0.00 0.00 0.00 0.00 0.0%
e) Adjusted Beginning Balance (F1c + F1d) 50,768,142.67 72,020,309.58 72,020,309.58
2) Ending Balance, June 30 (E + F1e) 43,733,195.51 70,931,296.82 70,931,296.82
Components of Ending Fund Balance
a) Nonspendable
Revolving Cash 9711 0.00 0.00 0.00
Stores 9712 0.00 0.00 0.00
Prepaid Expenditures 9713 0.00 0.00 0.00
All Others 9719 0.00 0.00 0.00
b) Restricted 9740 0.00 0.00 0.00
c) Committed
Stabilization Arrangements 9750 0.00 0.00 0.00
Other Commitments 9760 0.00 0.00 0.00
d) Assigned
Other Assignments 9780 0.00 0.00 0.00
e) Unassigned/Unappropriated
Reserve for Economic Uncertainties 9789 0.00 0.00 0.00
Unassigned/Unappropriated Amount 9790 43,733,195.51 70,931,296.82 70,931,296.82
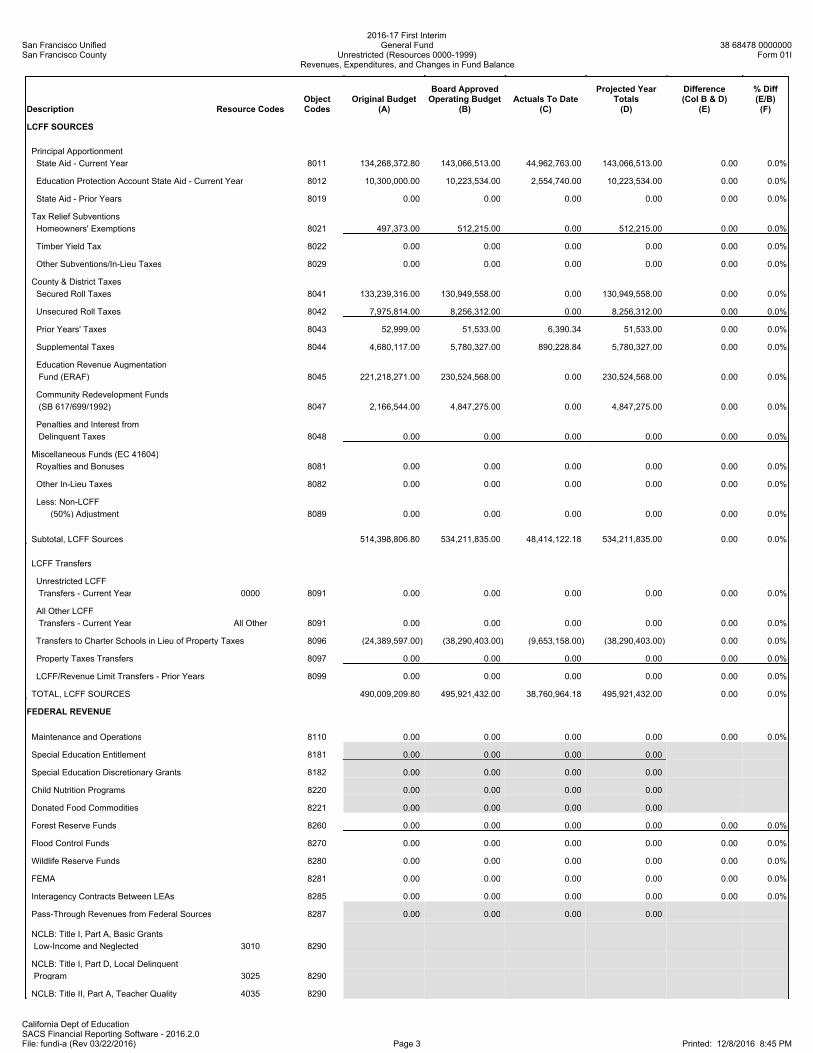
San Francisco UnifiedSan Francisco County
2016-17 First InterimGeneral Fund
Unrestricted (Resources 0000-1999)Revenues, Expenditures, and Changes in Fund Balance
38 68478 0000000Form 01I
California Dept of EducationSACS Financial Reporting Software - 2016.2.0File: fundi-a (Rev 03/22/2016) Page 3 Printed: 12/8/2016 8:45 PM
Description Resource CodesObjectCodes
Original Budget(A)
Board ApprovedOperating Budget
(B)Actuals To Date
(C)
Projected YearTotals(D)
Difference(Col B & D)
(E)
% Diff(E/B)(F)
LCFF SOURCES
Principal Apportionment
State Aid - Current Year 8011 134,268,372.80 143,066,513.00 44,962,763.00 143,066,513.00 0.00 0.0%
Education Protection Account State Aid - Current Year 8012 10,300,000.00 10,223,534.00 2,554,740.00 10,223,534.00 0.00 0.0%
State Aid - Prior Years 8019 0.00 0.00 0.00 0.00 0.00 0.0%
Tax Relief Subventions
Homeowners' Exemptions 8021 497,373.00 512,215.00 0.00 512,215.00 0.00 0.0%
Timber Yield Tax 8022 0.00 0.00 0.00 0.00 0.00 0.0%
Other Subventions/In-Lieu Taxes 8029 0.00 0.00 0.00 0.00 0.00 0.0%
County & District Taxes
Secured Roll Taxes 8041 133,239,316.00 130,949,558.00 0.00 130,949,558.00 0.00 0.0%
Unsecured Roll Taxes 8042 7,975,814.00 8,256,312.00 0.00 8,256,312.00 0.00 0.0%
Prior Years' Taxes 8043 52,999.00 51,533.00 6,390.34 51,533.00 0.00 0.0%
Supplemental Taxes 8044 4,680,117.00 5,780,327.00 890,228.84 5,780,327.00 0.00 0.0%
Education Revenue Augmentation
Fund (ERAF) 8045 221,218,271.00 230,524,568.00 0.00 230,524,568.00 0.00 0.0%
Community Redevelopment Funds
(SB 617/699/1992) 8047 2,166,544.00 4,847,275.00 0.00 4,847,275.00 0.00 0.0%
Penalties and Interest from
Delinquent Taxes 8048 0.00 0.00 0.00 0.00 0.00 0.0%
Miscellaneous Funds (EC 41604)
Royalties and Bonuses 8081 0.00 0.00 0.00 0.00 0.00 0.0%
Other In-Lieu Taxes 8082 0.00 0.00 0.00 0.00 0.00 0.0%
Less: Non-LCFF
(50%) Adjustment 8089 0.00 0.00 0.00 0.00 0.00 0.0%
Subtotal, LCFF Sources 514,398,806.80 534,211,835.00 48,414,122.18 534,211,835.00 0.00 0.0%
LCFF Transfers
Unrestricted LCFF
Transfers - Current Year 0000 8091 0.00 0.00 0.00 0.00 0.00 0.0%
All Other LCFF
Transfers - Current Year All Other 8091 0.00 0.00 0.00 0.00 0.00 0.0%
Transfers to Charter Schools in Lieu of Property Taxes 8096 (24,389,597.00) (38,290,403.00) (9,653,158.00) (38,290,403.00) 0.00 0.0%
Property Taxes Transfers 8097 0.00 0.00 0.00 0.00 0.00 0.0%
LCFF/Revenue Limit Transfers - Prior Years 8099 0.00 0.00 0.00 0.00 0.00 0.0%
TOTAL, LCFF SOURCES 490,009,209.80 495,921,432.00 38,760,964.18 495,921,432.00 0.00 0.0%
FEDERAL REVENUE
Maintenance and Operations 8110 0.00 0.00 0.00 0.00 0.00 0.0%
Special Education Entitlement 8181 0.00 0.00 0.00 0.00
Special Education Discretionary Grants 8182 0.00 0.00 0.00 0.00
Child Nutrition Programs 8220 0.00 0.00 0.00 0.00
Donated Food Commodities 8221 0.00 0.00 0.00 0.00
Forest Reserve Funds 8260 0.00 0.00 0.00 0.00 0.00 0.0%
Flood Control Funds 8270 0.00 0.00 0.00 0.00 0.00 0.0%
Wildlife Reserve Funds 8280 0.00 0.00 0.00 0.00 0.00 0.0%
FEMA 8281 0.00 0.00 0.00 0.00 0.00 0.0%
Interagency Contracts Between LEAs 8285 0.00 0.00 0.00 0.00 0.00 0.0%
Pass-Through Revenues from Federal Sources 8287 0.00 0.00 0.00 0.00
NCLB: Title I, Part A, Basic Grants
Low-Income and Neglected 3010 8290
NCLB: Title I, Part D, Local Delinquent
Program 3025 8290
NCLB: Title II, Part A, Teacher Quality 4035 8290
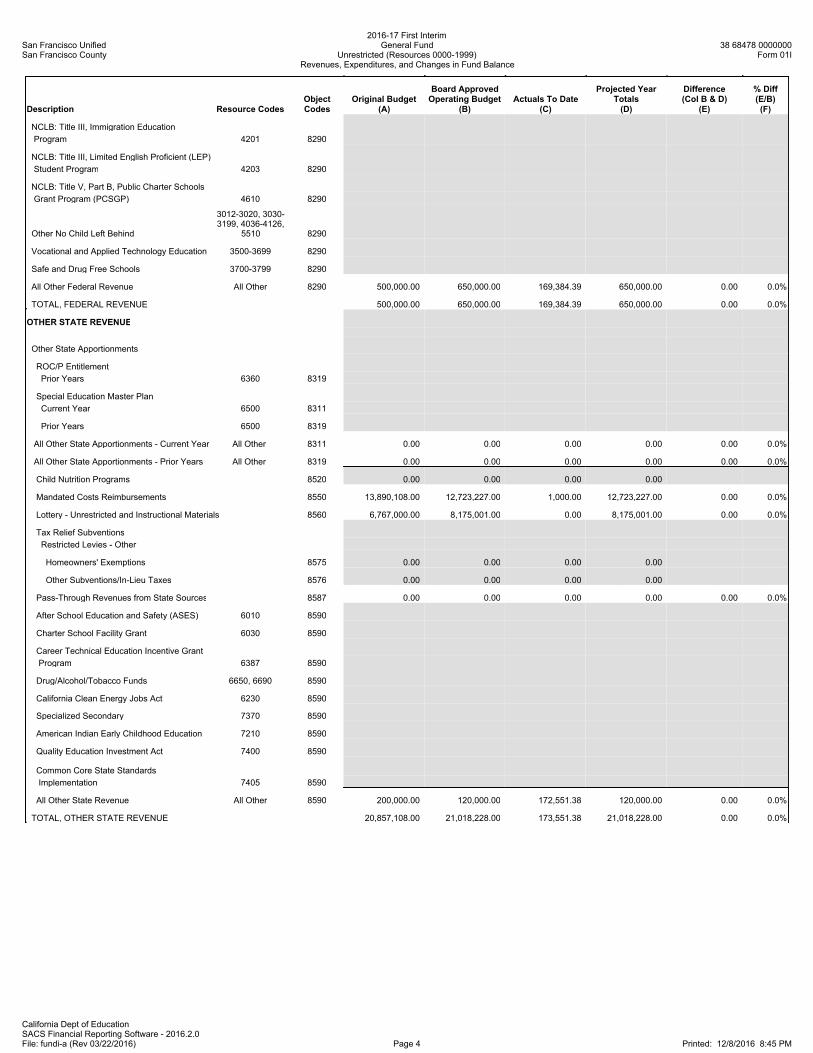
San Francisco UnifiedSan Francisco County
2016-17 First InterimGeneral Fund
Unrestricted (Resources 0000-1999)Revenues, Expenditures, and Changes in Fund Balance
38 68478 0000000Form 01I
California Dept of EducationSACS Financial Reporting Software - 2016.2.0File: fundi-a (Rev 03/22/2016) Page 4 Printed: 12/8/2016 8:45 PM
Description Resource CodesObjectCodes
Original Budget(A)
Board ApprovedOperating Budget
(B)Actuals To Date
(C)
Projected YearTotals(D)
Difference(Col B & D)
(E)
% Diff(E/B)(F)
NCLB: Title III, Immigration Education
Program 4201 8290
NCLB: Title III, Limited English Proficient (LEP)
Student Program 4203 8290
NCLB: Title V, Part B, Public Charter Schools
Grant Program (PCSGP) 4610 8290
Other No Child Left Behind
3012-3020, 3030-3199, 4036-4126,
5510 8290
Vocational and Applied Technology Education 3500-3699 8290
Safe and Drug Free Schools 3700-3799 8290
All Other Federal Revenue All Other 8290 500,000.00 650,000.00 169,384.39 650,000.00 0.00 0.0%
TOTAL, FEDERAL REVENUE 500,000.00 650,000.00 169,384.39 650,000.00 0.00 0.0%
OTHER STATE REVENUE
Other State Apportionments
ROC/P Entitlement
Prior Years 6360 8319
Special Education Master Plan
Current Year 6500 8311
Prior Years 6500 8319
All Other State Apportionments - Current Year All Other 8311 0.00 0.00 0.00 0.00 0.00 0.0%
All Other State Apportionments - Prior Years All Other 8319 0.00 0.00 0.00 0.00 0.00 0.0%
Child Nutrition Programs 8520 0.00 0.00 0.00 0.00
Mandated Costs Reimbursements 8550 13,890,108.00 12,723,227.00 1,000.00 12,723,227.00 0.00 0.0%
Lottery - Unrestricted and Instructional Materials 8560 6,767,000.00 8,175,001.00 0.00 8,175,001.00 0.00 0.0%
Tax Relief Subventions
Restricted Levies - Other
Homeowners' Exemptions 8575 0.00 0.00 0.00 0.00
Other Subventions/In-Lieu Taxes 8576 0.00 0.00 0.00 0.00
Pass-Through Revenues from State Sources 8587 0.00 0.00 0.00 0.00 0.00 0.0%
After School Education and Safety (ASES) 6010 8590
Charter School Facility Grant 6030 8590
Career Technical Education Incentive Grant
Program 6387 8590
Drug/Alcohol/Tobacco Funds 6650, 6690 8590
California Clean Energy Jobs Act 6230 8590
Specialized Secondary 7370 8590
American Indian Early Childhood Education 7210 8590
Quality Education Investment Act 7400 8590
Common Core State Standards
Implementation 7405 8590
All Other State Revenue All Other 8590 200,000.00 120,000.00 172,551.38 120,000.00 0.00 0.0%
TOTAL, OTHER STATE REVENUE 20,857,108.00 21,018,228.00 173,551.38 21,018,228.00 0.00 0.0%
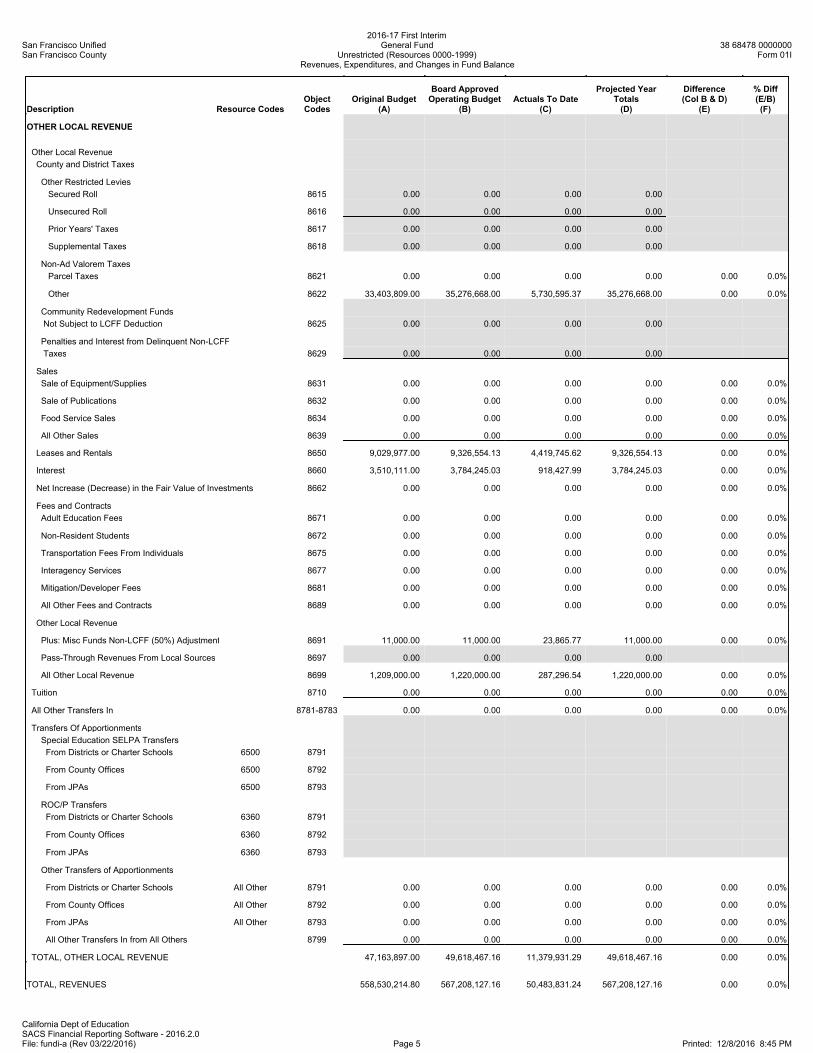
San Francisco UnifiedSan Francisco County
2016-17 First InterimGeneral Fund
Unrestricted (Resources 0000-1999)Revenues, Expenditures, and Changes in Fund Balance
38 68478 0000000Form 01I
California Dept of EducationSACS Financial Reporting Software - 2016.2.0File: fundi-a (Rev 03/22/2016) Page 5 Printed: 12/8/2016 8:45 PM
Description Resource CodesObjectCodes
Original Budget(A)
Board ApprovedOperating Budget
(B)Actuals To Date
(C)
Projected YearTotals(D)
Difference(Col B & D)
(E)
% Diff(E/B)(F)
OTHER LOCAL REVENUE
Other Local Revenue
County and District Taxes
Other Restricted Levies
Secured Roll 8615 0.00 0.00 0.00 0.00
Unsecured Roll 8616 0.00 0.00 0.00 0.00
Prior Years' Taxes 8617 0.00 0.00 0.00 0.00
Supplemental Taxes 8618 0.00 0.00 0.00 0.00
Non-Ad Valorem Taxes
Parcel Taxes 8621 0.00 0.00 0.00 0.00 0.00 0.0%
Other 8622 33,403,809.00 35,276,668.00 5,730,595.37 35,276,668.00 0.00 0.0%
Community Redevelopment Funds
Not Subject to LCFF Deduction 8625 0.00 0.00 0.00 0.00
Penalties and Interest from Delinquent Non-LCFF
Taxes 8629 0.00 0.00 0.00 0.00
Sales
Sale of Equipment/Supplies 8631 0.00 0.00 0.00 0.00 0.00 0.0%
Sale of Publications 8632 0.00 0.00 0.00 0.00 0.00 0.0%
Food Service Sales 8634 0.00 0.00 0.00 0.00 0.00 0.0%
All Other Sales 8639 0.00 0.00 0.00 0.00 0.00 0.0%
Leases and Rentals 8650 9,029,977.00 9,326,554.13 4,419,745.62 9,326,554.13 0.00 0.0%
Interest 8660 3,510,111.00 3,784,245.03 918,427.99 3,784,245.03 0.00 0.0%
Net Increase (Decrease) in the Fair Value of Investments 8662 0.00 0.00 0.00 0.00 0.00 0.0%
Fees and Contracts
Adult Education Fees 8671 0.00 0.00 0.00 0.00 0.00 0.0%
Non-Resident Students 8672 0.00 0.00 0.00 0.00 0.00 0.0%
Transportation Fees From Individuals 8675 0.00 0.00 0.00 0.00 0.00 0.0%
Interagency Services 8677 0.00 0.00 0.00 0.00 0.00 0.0%
Mitigation/Developer Fees 8681 0.00 0.00 0.00 0.00 0.00 0.0%
All Other Fees and Contracts 8689 0.00 0.00 0.00 0.00 0.00 0.0%
Other Local Revenue
Plus: Misc Funds Non-LCFF (50%) Adjustment 8691 11,000.00 11,000.00 23,865.77 11,000.00 0.00 0.0%
Pass-Through Revenues From Local Sources 8697 0.00 0.00 0.00 0.00
All Other Local Revenue 8699 1,209,000.00 1,220,000.00 287,296.54 1,220,000.00 0.00 0.0%
Tuition 8710 0.00 0.00 0.00 0.00 0.00 0.0%
All Other Transfers In 8781-8783 0.00 0.00 0.00 0.00 0.00 0.0%
Transfers Of Apportionments
Special Education SELPA Transfers
From Districts or Charter Schools 6500 8791
From County Offices 6500 8792
From JPAs 6500 8793
ROC/P Transfers
From Districts or Charter Schools 6360 8791
From County Offices 6360 8792
From JPAs 6360 8793
Other Transfers of Apportionments
From Districts or Charter Schools All Other 8791 0.00 0.00 0.00 0.00 0.00 0.0%
From County Offices All Other 8792 0.00 0.00 0.00 0.00 0.00 0.0%
From JPAs All Other 8793 0.00 0.00 0.00 0.00 0.00 0.0%
All Other Transfers In from All Others 8799 0.00 0.00 0.00 0.00 0.00 0.0%
TOTAL, OTHER LOCAL REVENUE 47,163,897.00 49,618,467.16 11,379,931.29 49,618,467.16 0.00 0.0%
TOTAL, REVENUES 558,530,214.80 567,208,127.16 50,483,831.24 567,208,127.16 0.00 0.0%
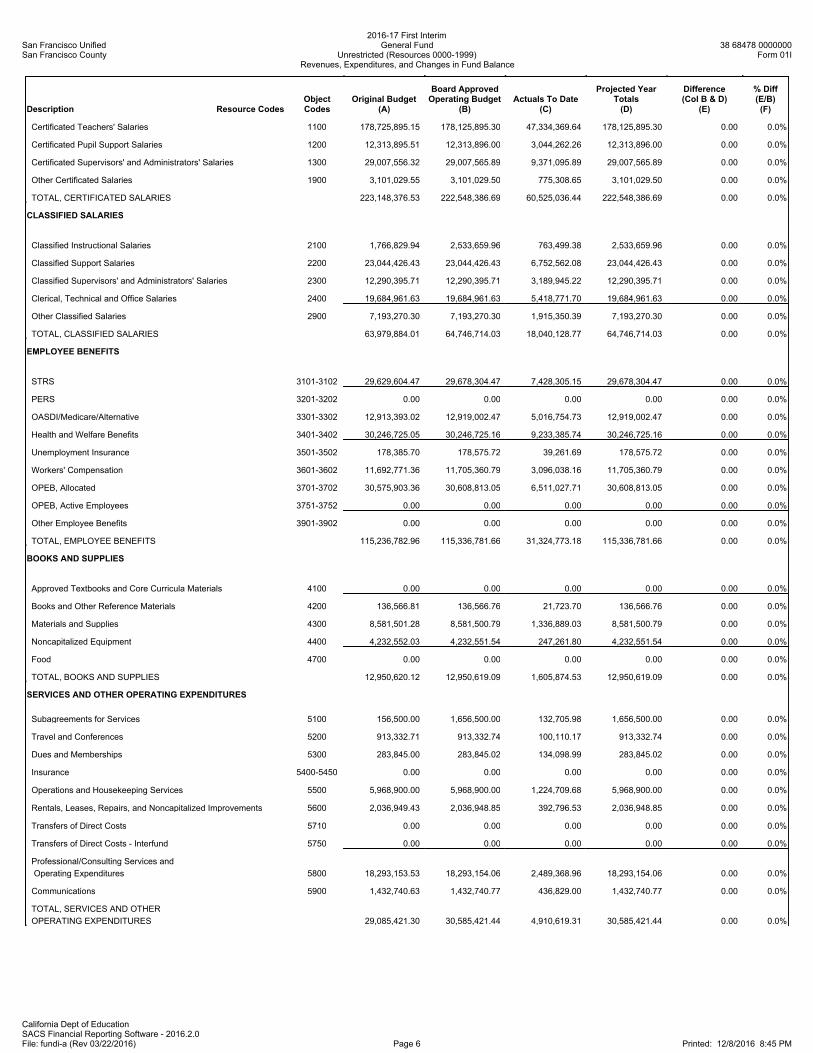
San Francisco UnifiedSan Francisco County
2016-17 First InterimGeneral Fund
Unrestricted (Resources 0000-1999)Revenues, Expenditures, and Changes in Fund Balance
38 68478 0000000Form 01I
California Dept of EducationSACS Financial Reporting Software - 2016.2.0File: fundi-a (Rev 03/22/2016) Page 6 Printed: 12/8/2016 8:45 PM
Description Resource CodesObjectCodes
Original Budget(A)
Board ApprovedOperating Budget
(B)Actuals To Date
(C)
Projected YearTotals(D)
Difference(Col B & D)
(E)
% Diff(E/B)(F)
Certificated Teachers' Salaries 1100 178,725,895.15 178,125,895.30 47,334,369.64 178,125,895.30 0.00 0.0%
Certificated Pupil Support Salaries 1200 12,313,895.51 12,313,896.00 3,044,262.26 12,313,896.00 0.00 0.0%
Certificated Supervisors' and Administrators' Salaries 1300 29,007,556.32 29,007,565.89 9,371,095.89 29,007,565.89 0.00 0.0%
Other Certificated Salaries 1900 3,101,029.55 3,101,029.50 775,308.65 3,101,029.50 0.00 0.0%
TOTAL, CERTIFICATED SALARIES 223,148,376.53 222,548,386.69 60,525,036.44 222,548,386.69 0.00 0.0%
CLASSIFIED SALARIES
Classified Instructional Salaries 2100 1,766,829.94 2,533,659.96 763,499.38 2,533,659.96 0.00 0.0%
Classified Support Salaries 2200 23,044,426.43 23,044,426.43 6,752,562.08 23,044,426.43 0.00 0.0%
Classified Supervisors' and Administrators' Salaries 2300 12,290,395.71 12,290,395.71 3,189,945.22 12,290,395.71 0.00 0.0%
Clerical, Technical and Office Salaries 2400 19,684,961.63 19,684,961.63 5,418,771.70 19,684,961.63 0.00 0.0%
Other Classified Salaries 2900 7,193,270.30 7,193,270.30 1,915,350.39 7,193,270.30 0.00 0.0%
TOTAL, CLASSIFIED SALARIES 63,979,884.01 64,746,714.03 18,040,128.77 64,746,714.03 0.00 0.0%
EMPLOYEE BENEFITS
STRS 3101-3102 29,629,604.47 29,678,304.47 7,428,305.15 29,678,304.47 0.00 0.0%
PERS 3201-3202 0.00 0.00 0.00 0.00 0.00 0.0%
OASDI/Medicare/Alternative 3301-3302 12,913,393.02 12,919,002.47 5,016,754.73 12,919,002.47 0.00 0.0%
Health and Welfare Benefits 3401-3402 30,246,725.05 30,246,725.16 9,233,385.74 30,246,725.16 0.00 0.0%
Unemployment Insurance 3501-3502 178,385.70 178,575.72 39,261.69 178,575.72 0.00 0.0%
Workers' Compensation 3601-3602 11,692,771.36 11,705,360.79 3,096,038.16 11,705,360.79 0.00 0.0%
OPEB, Allocated 3701-3702 30,575,903.36 30,608,813.05 6,511,027.71 30,608,813.05 0.00 0.0%
OPEB, Active Employees 3751-3752 0.00 0.00 0.00 0.00 0.00 0.0%
Other Employee Benefits 3901-3902 0.00 0.00 0.00 0.00 0.00 0.0%
TOTAL, EMPLOYEE BENEFITS 115,236,782.96 115,336,781.66 31,324,773.18 115,336,781.66 0.00 0.0%
BOOKS AND SUPPLIES
Approved Textbooks and Core Curricula Materials 4100 0.00 0.00 0.00 0.00 0.00 0.0%
Books and Other Reference Materials 4200 136,566.81 136,566.76 21,723.70 136,566.76 0.00 0.0%
Materials and Supplies 4300 8,581,501.28 8,581,500.79 1,336,889.03 8,581,500.79 0.00 0.0%
Noncapitalized Equipment 4400 4,232,552.03 4,232,551.54 247,261.80 4,232,551.54 0.00 0.0%
Food 4700 0.00 0.00 0.00 0.00 0.00 0.0%
TOTAL, BOOKS AND SUPPLIES 12,950,620.12 12,950,619.09 1,605,874.53 12,950,619.09 0.00 0.0%
SERVICES AND OTHER OPERATING EXPENDITURES
Subagreements for Services 5100 156,500.00 1,656,500.00 132,705.98 1,656,500.00 0.00 0.0%
Travel and Conferences 5200 913,332.71 913,332.74 100,110.17 913,332.74 0.00 0.0%
Dues and Memberships 5300 283,845.00 283,845.02 134,098.99 283,845.02 0.00 0.0%
Insurance 5400-5450 0.00 0.00 0.00 0.00 0.00 0.0%
Operations and Housekeeping Services 5500 5,968,900.00 5,968,900.00 1,224,709.68 5,968,900.00 0.00 0.0%
Rentals, Leases, Repairs, and Noncapitalized Improvements 5600 2,036,949.43 2,036,948.85 392,796.53 2,036,948.85 0.00 0.0%
Transfers of Direct Costs 5710 0.00 0.00 0.00 0.00 0.00 0.0%
Transfers of Direct Costs - Interfund 5750 0.00 0.00 0.00 0.00 0.00 0.0%
Professional/Consulting Services and
Operating Expenditures 5800 18,293,153.53 18,293,154.06 2,489,368.96 18,293,154.06 0.00 0.0%
Communications 5900 1,432,740.63 1,432,740.77 436,829.00 1,432,740.77 0.00 0.0%
TOTAL, SERVICES AND OTHER
OPERATING EXPENDITURES 29,085,421.30 30,585,421.44 4,910,619.31 30,585,421.44 0.00 0.0%
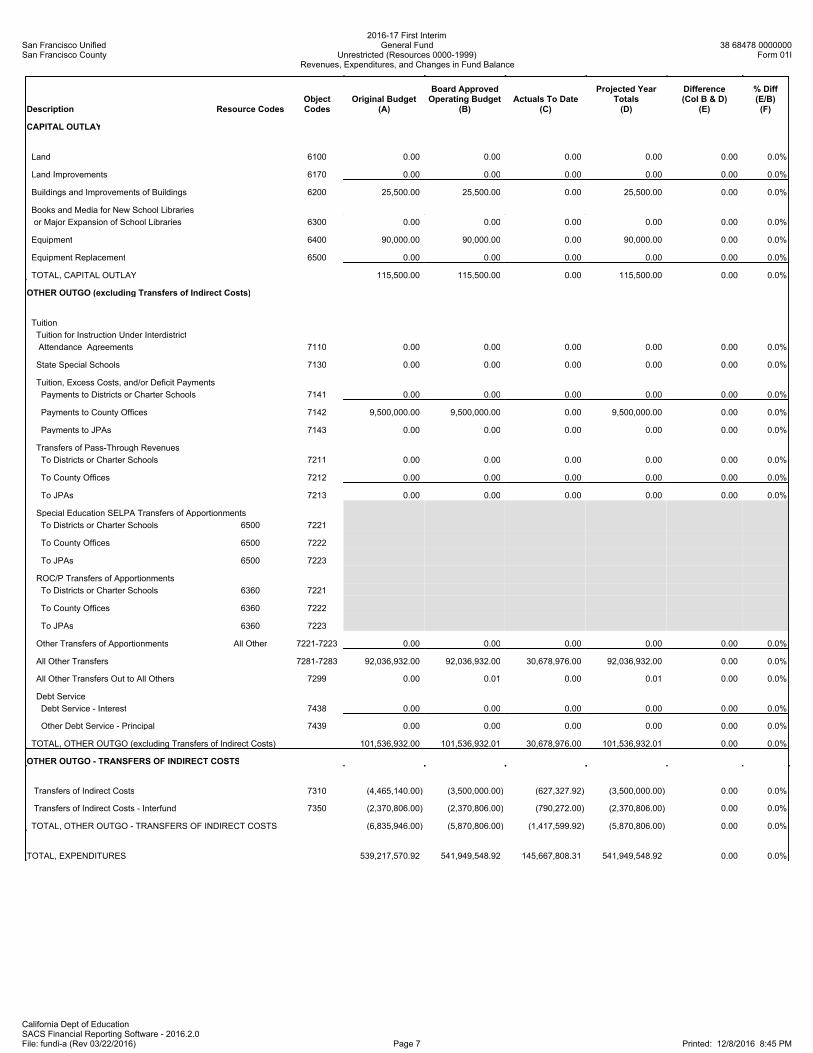
San Francisco UnifiedSan Francisco County
2016-17 First InterimGeneral Fund
Unrestricted (Resources 0000-1999)Revenues, Expenditures, and Changes in Fund Balance
38 68478 0000000Form 01I
California Dept of EducationSACS Financial Reporting Software - 2016.2.0File: fundi-a (Rev 03/22/2016) Page 7 Printed: 12/8/2016 8:45 PM
Description Resource CodesObjectCodes
Original Budget(A)
Board ApprovedOperating Budget
(B)Actuals To Date
(C)
Projected YearTotals(D)
Difference(Col B & D)
(E)
% Diff(E/B)(F)
CAPITAL OUTLAY
Land 6100 0.00 0.00 0.00 0.00 0.00 0.0%
Land Improvements 6170 0.00 0.00 0.00 0.00 0.00 0.0%
Buildings and Improvements of Buildings 6200 25,500.00 25,500.00 0.00 25,500.00 0.00 0.0%
Books and Media for New School Libraries
or Major Expansion of School Libraries 6300 0.00 0.00 0.00 0.00 0.00 0.0%
Equipment 6400 90,000.00 90,000.00 0.00 90,000.00 0.00 0.0%
Equipment Replacement 6500 0.00 0.00 0.00 0.00 0.00 0.0%
TOTAL, CAPITAL OUTLAY 115,500.00 115,500.00 0.00 115,500.00 0.00 0.0%
OTHER OUTGO (excluding Transfers of Indirect Costs)
Tuition
Tuition for Instruction Under Interdistrict
Attendance Agreements 7110 0.00 0.00 0.00 0.00 0.00 0.0%
State Special Schools 7130 0.00 0.00 0.00 0.00 0.00 0.0%
Tuition, Excess Costs, and/or Deficit Payments
Payments to Districts or Charter Schools 7141 0.00 0.00 0.00 0.00 0.00 0.0%
Payments to County Offices 7142 9,500,000.00 9,500,000.00 0.00 9,500,000.00 0.00 0.0%
Payments to JPAs 7143 0.00 0.00 0.00 0.00 0.00 0.0%
Transfers of Pass-Through Revenues
To Districts or Charter Schools 7211 0.00 0.00 0.00 0.00 0.00 0.0%
To County Offices 7212 0.00 0.00 0.00 0.00 0.00 0.0%
To JPAs 7213 0.00 0.00 0.00 0.00 0.00 0.0%
Special Education SELPA Transfers of Apportionments
To Districts or Charter Schools 6500 7221
To County Offices 6500 7222
To JPAs 6500 7223
ROC/P Transfers of Apportionments
To Districts or Charter Schools 6360 7221
To County Offices 6360 7222
To JPAs 6360 7223
Other Transfers of Apportionments All Other 7221-7223 0.00 0.00 0.00 0.00 0.00 0.0%
All Other Transfers 7281-7283 92,036,932.00 92,036,932.00 30,678,976.00 92,036,932.00 0.00 0.0%
All Other Transfers Out to All Others 7299 0.00 0.01 0.00 0.01 0.00 0.0%
Debt Service
Debt Service - Interest 7438 0.00 0.00 0.00 0.00 0.00 0.0%
Other Debt Service - Principal 7439 0.00 0.00 0.00 0.00 0.00 0.0%
TOTAL, OTHER OUTGO (excluding Transfers of Indirect Costs) 101,536,932.00 101,536,932.01 30,678,976.00 101,536,932.01 0.00 0.0%
OTHER OUTGO - TRANSFERS OF INDIRECT COSTS
Transfers of Indirect Costs 7310 (4,465,140.00) (3,500,000.00) (627,327.92) (3,500,000.00) 0.00 0.0%
Transfers of Indirect Costs - Interfund 7350 (2,370,806.00) (2,370,806.00) (790,272.00) (2,370,806.00) 0.00 0.0%
TOTAL, OTHER OUTGO - TRANSFERS OF INDIRECT COSTS (6,835,946.00) (5,870,806.00) (1,417,599.92) (5,870,806.00) 0.00 0.0%
TOTAL, EXPENDITURES 539,217,570.92 541,949,548.92 145,667,808.31 541,949,548.92 0.00 0.0%
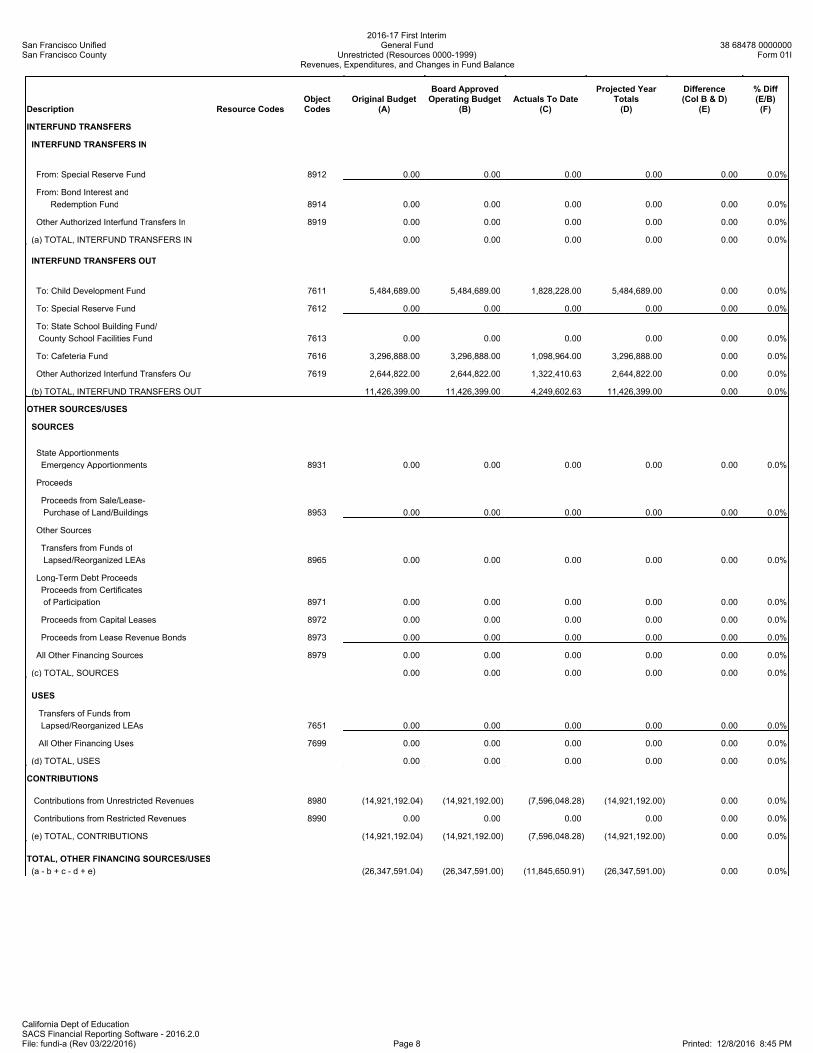
San Francisco UnifiedSan Francisco County
2016-17 First InterimGeneral Fund
Unrestricted (Resources 0000-1999)Revenues, Expenditures, and Changes in Fund Balance
38 68478 0000000Form 01I
California Dept of EducationSACS Financial Reporting Software - 2016.2.0File: fundi-a (Rev 03/22/2016) Page 8 Printed: 12/8/2016 8:45 PM
Description Resource CodesObjectCodes
Original Budget(A)
Board ApprovedOperating Budget
(B)Actuals To Date
(C)
Projected YearTotals(D)
Difference(Col B & D)
(E)
% Diff(E/B)(F)
INTERFUND TRANSFERS
INTERFUND TRANSFERS IN
From: Special Reserve Fund 8912 0.00 0.00 0.00 0.00 0.00 0.0%
From: Bond Interest and
Redemption Fund 8914 0.00 0.00 0.00 0.00 0.00 0.0%
Other Authorized Interfund Transfers In 8919 0.00 0.00 0.00 0.00 0.00 0.0%
(a) TOTAL, INTERFUND TRANSFERS IN 0.00 0.00 0.00 0.00 0.00 0.0%
INTERFUND TRANSFERS OUT
To: Child Development Fund 7611 5,484,689.00 5,484,689.00 1,828,228.00 5,484,689.00 0.00 0.0%
To: Special Reserve Fund 7612 0.00 0.00 0.00 0.00 0.00 0.0%
To: State School Building Fund/
County School Facilities Fund 7613 0.00 0.00 0.00 0.00 0.00 0.0%
To: Cafeteria Fund 7616 3,296,888.00 3,296,888.00 1,098,964.00 3,296,888.00 0.00 0.0%
Other Authorized Interfund Transfers Out 7619 2,644,822.00 2,644,822.00 1,322,410.63 2,644,822.00 0.00 0.0%
(b) TOTAL, INTERFUND TRANSFERS OUT 11,426,399.00 11,426,399.00 4,249,602.63 11,426,399.00 0.00 0.0%
OTHER SOURCES/USES
SOURCES
State Apportionments
Emergency Apportionments 8931 0.00 0.00 0.00 0.00 0.00 0.0%
Proceeds
Proceeds from Sale/Lease-
Purchase of Land/Buildings 8953 0.00 0.00 0.00 0.00 0.00 0.0%
Other Sources
Transfers from Funds of
Lapsed/Reorganized LEAs 8965 0.00 0.00 0.00 0.00 0.00 0.0%
Long-Term Debt Proceeds
Proceeds from Certificates
of Participation 8971 0.00 0.00 0.00 0.00 0.00 0.0%
Proceeds from Capital Leases 8972 0.00 0.00 0.00 0.00 0.00 0.0%
Proceeds from Lease Revenue Bonds 8973 0.00 0.00 0.00 0.00 0.00 0.0%
All Other Financing Sources 8979 0.00 0.00 0.00 0.00 0.00 0.0%
(c) TOTAL, SOURCES 0.00 0.00 0.00 0.00 0.00 0.0%
USES
Transfers of Funds from
Lapsed/Reorganized LEAs 7651 0.00 0.00 0.00 0.00 0.00 0.0%
All Other Financing Uses 7699 0.00 0.00 0.00 0.00 0.00 0.0%
(d) TOTAL, USES 0.00 0.00 0.00 0.00 0.00 0.0%
CONTRIBUTIONS
Contributions from Unrestricted Revenues 8980 (14,921,192.04) (14,921,192.00) (7,596,048.28) (14,921,192.00) 0.00 0.0%
Contributions from Restricted Revenues 8990 0.00 0.00 0.00 0.00 0.00 0.0%
(e) TOTAL, CONTRIBUTIONS (14,921,192.04) (14,921,192.00) (7,596,048.28) (14,921,192.00) 0.00 0.0%
TOTAL, OTHER FINANCING SOURCES/USES
(a - b + c - d + e) (26,347,591.04) (26,347,591.00) (11,845,650.91) (26,347,591.00) 0.00 0.0%
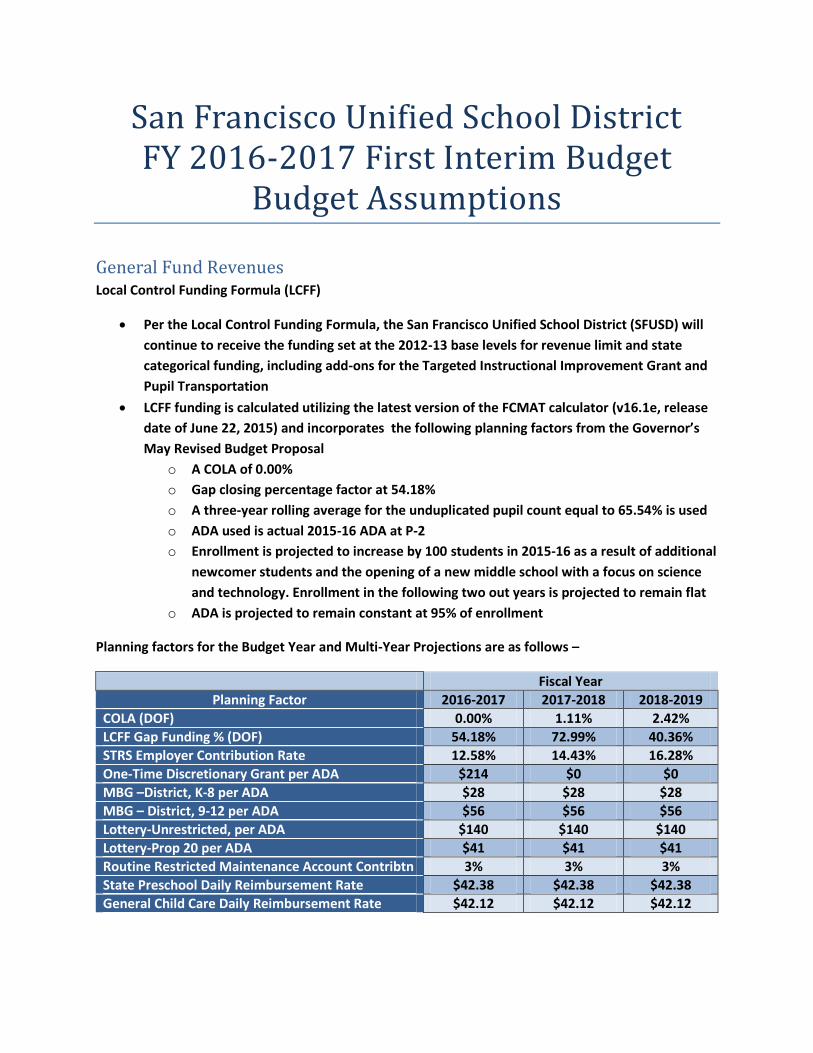
San Francisco Unified School District FY 2016-2017 First Interim Budget
Budget Assumptions
General Fund Revenues Local Control Funding Formula (LCFF)
Per the Local Control Funding Formula, the San Francisco Unified School District (SFUSD) will
continue to receive the funding set at the 2012-13 base levels for revenue limit and state
categorical funding, including add-ons for the Targeted Instructional Improvement Grant and
Pupil Transportation
LCFF funding is calculated utilizing the latest version of the FCMAT calculator (v16.1e, release
date of June 22, 2015) and incorporates the following planning factors from the Governor’s
May Revised Budget Proposal
o A COLA of 0.00%
o Gap closing percentage factor at 54.18%
o A three-year rolling average for the unduplicated pupil count equal to 65.54% is used
o ADA used is actual 2015-16 ADA at P-2
o Enrollment is projected to increase by 100 students in 2015-16 as a result of additional
newcomer students and the opening of a new middle school with a focus on science
and technology. Enrollment in the following two out years is projected to remain flat
o ADA is projected to remain constant at 95% of enrollment
Planning factors for the Budget Year and Multi-Year Projections are as follows –
Fiscal Year
Planning Factor 2016-2017 2017-2018 2018-2019
COLA (DOF) 0.00% 1.11% 2.42%
LCFF Gap Funding % (DOF) 54.18% 72.99% 40.36%
STRS Employer Contribution Rate 12.58% 14.43% 16.28%
One-Time Discretionary Grant per ADA $214 $0 $0
MBG –District, K-8 per ADA $28 $28 $28
MBG – District, 9-12 per ADA $56 $56 $56
Lottery-Unrestricted, per ADA $140 $140 $140
Lottery-Prop 20 per ADA $41 $41 $41
Routine Restricted Maintenance Account Contribtn 3% 3% 3%
State Preschool Daily Reimbursement Rate $42.38 $42.38 $42.38
General Child Care Daily Reimbursement Rate $42.12 $42.12 $42.12
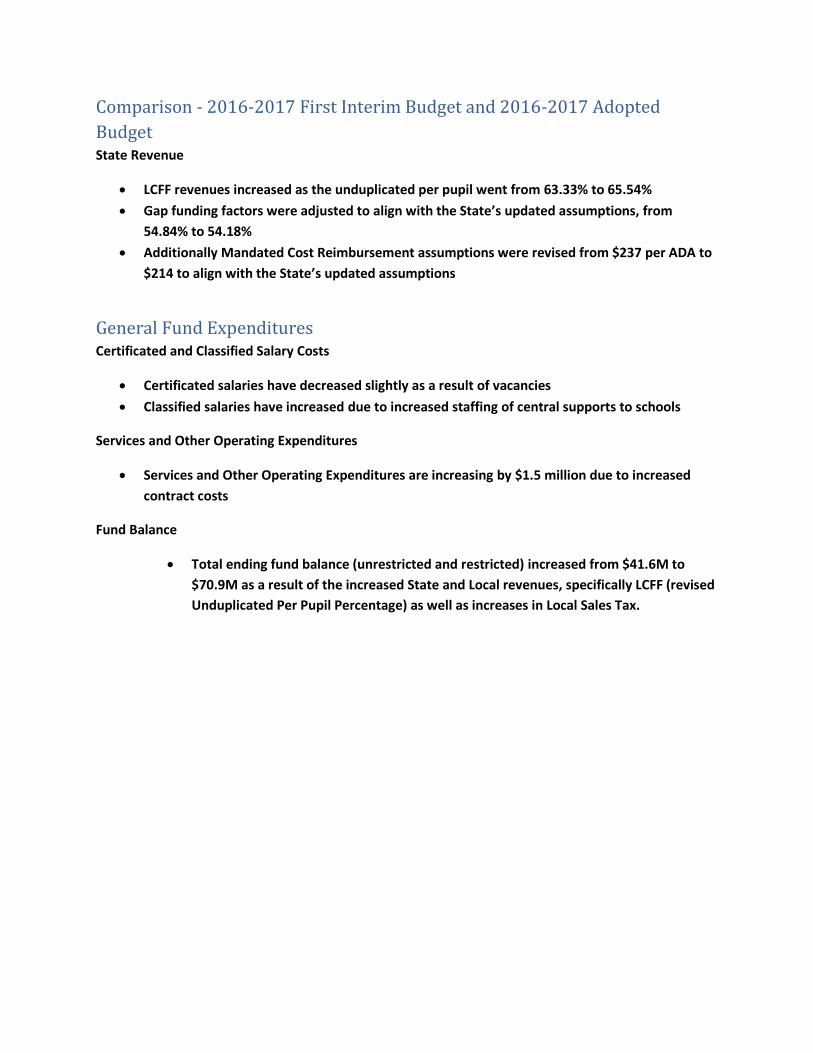
Comparison - 2016-2017 First Interim Budget and 2016-2017 Adopted
Budget State Revenue
LCFF revenues increased as the unduplicated per pupil went from 63.33% to 65.54%
Gap funding factors were adjusted to align with the State’s updated assumptions, from
54.84% to 54.18%
Additionally Mandated Cost Reimbursement assumptions were revised from $237 per ADA to
$214 to align with the State’s updated assumptions
General Fund Expenditures Certificated and Classified Salary Costs
Certificated salaries have decreased slightly as a result of vacancies
Classified salaries have increased due to increased staffing of central supports to schools
Services and Other Operating Expenditures
Services and Other Operating Expenditures are increasing by $1.5 million due to increased
contract costs
Fund Balance
Total ending fund balance (unrestricted and restricted) increased from $41.6M to
$70.9M as a result of the increased State and Local revenues, specifically LCFF (revised
Unduplicated Per Pupil Percentage) as well as increases in Local Sales Tax.
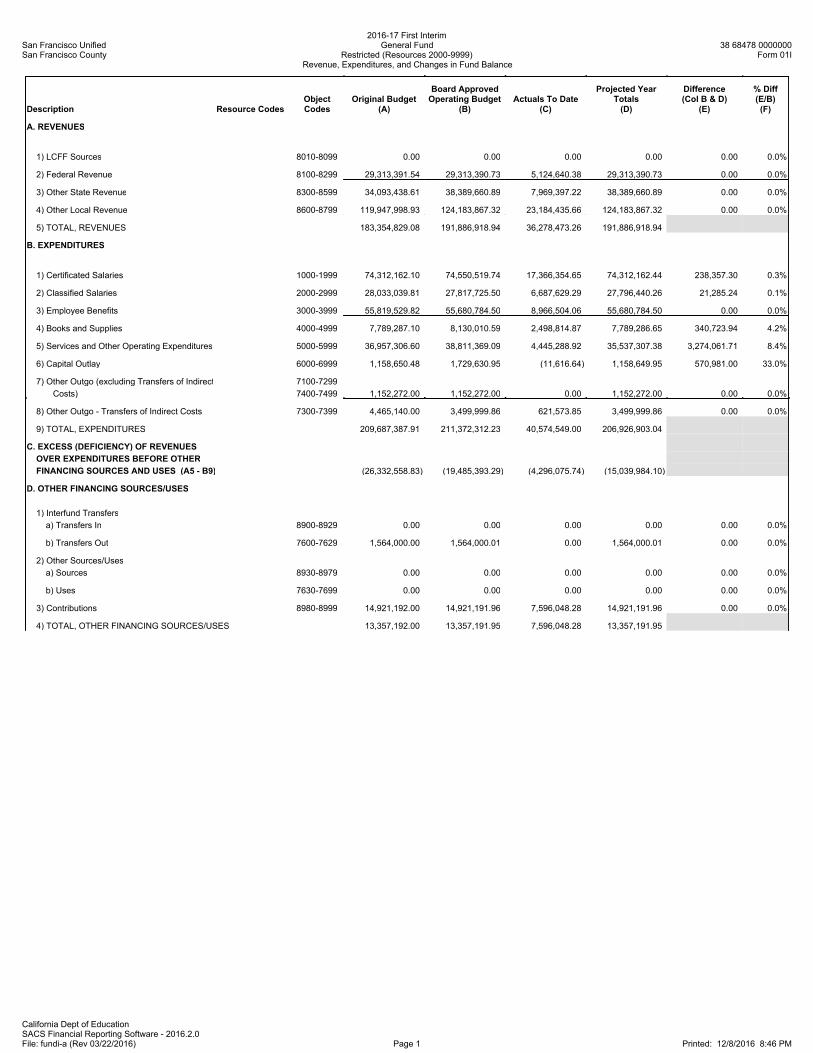
San Francisco UnifiedSan Francisco County
2016-17 First InterimGeneral Fund
Restricted (Resources 2000-9999)Revenue, Expenditures, and Changes in Fund Balance
38 68478 0000000Form 01I
California Dept of EducationSACS Financial Reporting Software - 2016.2.0File: fundi-a (Rev 03/22/2016) Page 1 Printed: 12/8/2016 8:46 PM
Description Resource CodesObjectCodes
Original Budget(A)
Board ApprovedOperating Budget
(B)Actuals To Date
(C)
Projected YearTotals(D)
Difference(Col B & D)
(E)
% Diff(E/B)(F)
A. REVENUES
1) LCFF Sources 8010-8099 0.00 0.00 0.00 0.00 0.00 0.0%
2) Federal Revenue 8100-8299 29,313,391.54 29,313,390.73 5,124,640.38 29,313,390.73 0.00 0.0%
3) Other State Revenue 8300-8599 34,093,438.61 38,389,660.89 7,969,397.22 38,389,660.89 0.00 0.0%
4) Other Local Revenue 8600-8799 119,947,998.93 124,183,867.32 23,184,435.66 124,183,867.32 0.00 0.0%
5) TOTAL, REVENUES 183,354,829.08 191,886,918.94 36,278,473.26 191,886,918.94
B. EXPENDITURES
1) Certificated Salaries 1000-1999 74,312,162.10 74,550,519.74 17,366,354.65 74,312,162.44 238,357.30 0.3%
2) Classified Salaries 2000-2999 28,033,039.81 27,817,725.50 6,687,629.29 27,796,440.26 21,285.24 0.1%
3) Employee Benefits 3000-3999 55,819,529.82 55,680,784.50 8,966,504.06 55,680,784.50 0.00 0.0%
4) Books and Supplies 4000-4999 7,789,287.10 8,130,010.59 2,498,814.87 7,789,286.65 340,723.94 4.2%
5) Services and Other Operating Expenditures 5000-5999 36,957,306.60 38,811,369.09 4,445,288.92 35,537,307.38 3,274,061.71 8.4%
6) Capital Outlay 6000-6999 1,158,650.48 1,729,630.95 (11,616.64) 1,158,649.95 570,981.00 33.0%
7) Other Outgo (excluding Transfers of Indirect 7100-7299
Costs) 7400-7499 1,152,272.00 1,152,272.00 0.00 1,152,272.00 0.00 0.0%
8) Other Outgo - Transfers of Indirect Costs 7300-7399 4,465,140.00 3,499,999.86 621,573.85 3,499,999.86 0.00 0.0%
9) TOTAL, EXPENDITURES 209,687,387.91 211,372,312.23 40,574,549.00 206,926,903.04
C. EXCESS (DEFICIENCY) OF REVENUES
OVER EXPENDITURES BEFORE OTHER
FINANCING SOURCES AND USES (A5 - B9) (26,332,558.83) (19,485,393.29) (4,296,075.74) (15,039,984.10)
D. OTHER FINANCING SOURCES/USES
1) Interfund Transfers
a) Transfers In 8900-8929 0.00 0.00 0.00 0.00 0.00 0.0%
b) Transfers Out 7600-7629 1,564,000.00 1,564,000.01 0.00 1,564,000.01 0.00 0.0%
2) Other Sources/Uses
a) Sources 8930-8979 0.00 0.00 0.00 0.00 0.00 0.0%
b) Uses 7630-7699 0.00 0.00 0.00 0.00 0.00 0.0%
3) Contributions 8980-8999 14,921,192.00 14,921,191.96 7,596,048.28 14,921,191.96 0.00 0.0%
4) TOTAL, OTHER FINANCING SOURCES/USES 13,357,192.00 13,357,191.95 7,596,048.28 13,357,191.95
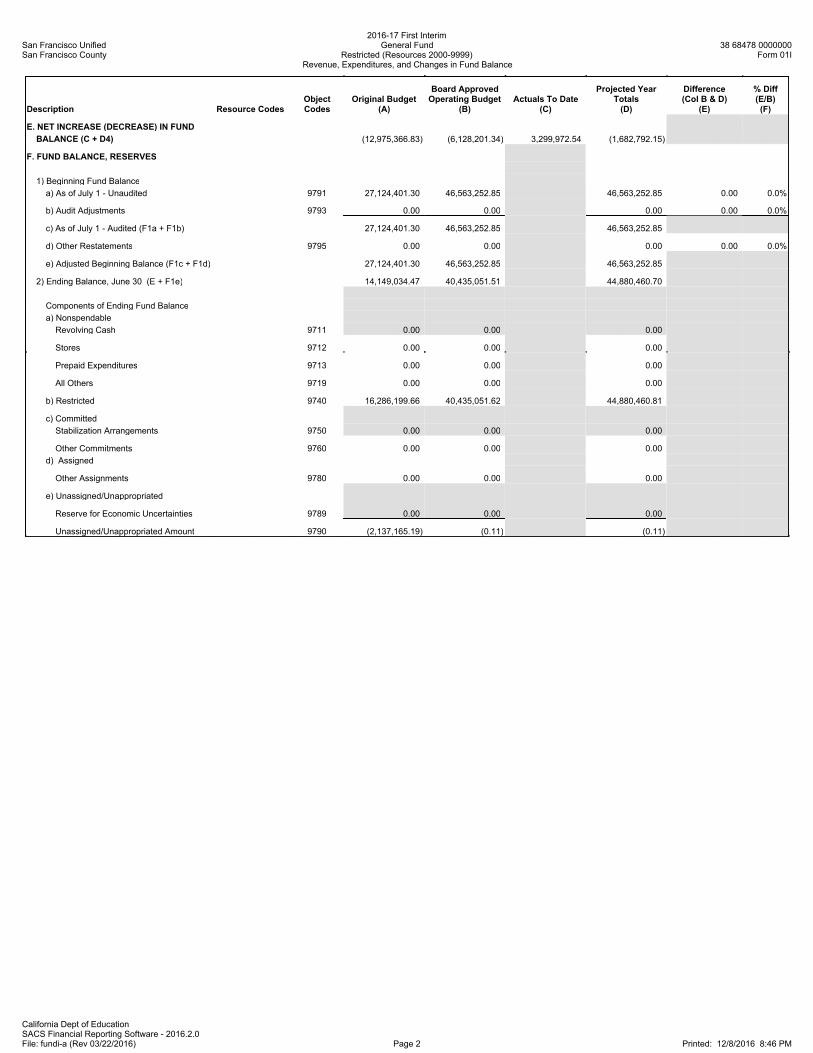
San Francisco UnifiedSan Francisco County
2016-17 First InterimGeneral Fund
Restricted (Resources 2000-9999)Revenue, Expenditures, and Changes in Fund Balance
38 68478 0000000Form 01I
California Dept of EducationSACS Financial Reporting Software - 2016.2.0File: fundi-a (Rev 03/22/2016) Page 2 Printed: 12/8/2016 8:46 PM
Description Resource CodesObjectCodes
Original Budget(A)
Board ApprovedOperating Budget
(B)Actuals To Date
(C)
Projected YearTotals(D)
Difference(Col B & D)
(E)
% Diff(E/B)(F)
E. NET INCREASE (DECREASE) IN FUND
BALANCE (C + D4) (12,975,366.83) (6,128,201.34) 3,299,972.54 (1,682,792.15)
F. FUND BALANCE, RESERVES
1) Beginning Fund Balance
a) As of July 1 - Unaudited 9791 27,124,401.30 46,563,252.85 46,563,252.85 0.00 0.0%
b) Audit Adjustments 9793 0.00 0.00 0.00 0.00 0.0%
c) As of July 1 - Audited (F1a + F1b) 27,124,401.30 46,563,252.85 46,563,252.85
d) Other Restatements 9795 0.00 0.00 0.00 0.00 0.0%
e) Adjusted Beginning Balance (F1c + F1d) 27,124,401.30 46,563,252.85 46,563,252.85
2) Ending Balance, June 30 (E + F1e) 14,149,034.47 40,435,051.51 44,880,460.70
Components of Ending Fund Balance
a) Nonspendable
Revolving Cash 9711 0.00 0.00 0.00
Stores 9712 0.00 0.00 0.00
Prepaid Expenditures 9713 0.00 0.00 0.00
All Others 9719 0.00 0.00 0.00
b) Restricted 9740 16,286,199.66 40,435,051.62 44,880,460.81
c) Committed
Stabilization Arrangements 9750 0.00 0.00 0.00
Other Commitments 9760 0.00 0.00 0.00
d) Assigned
Other Assignments 9780 0.00 0.00 0.00
e) Unassigned/Unappropriated
Reserve for Economic Uncertainties 9789 0.00 0.00 0.00
Unassigned/Unappropriated Amount 9790 (2,137,165.19) (0.11) (0.11)
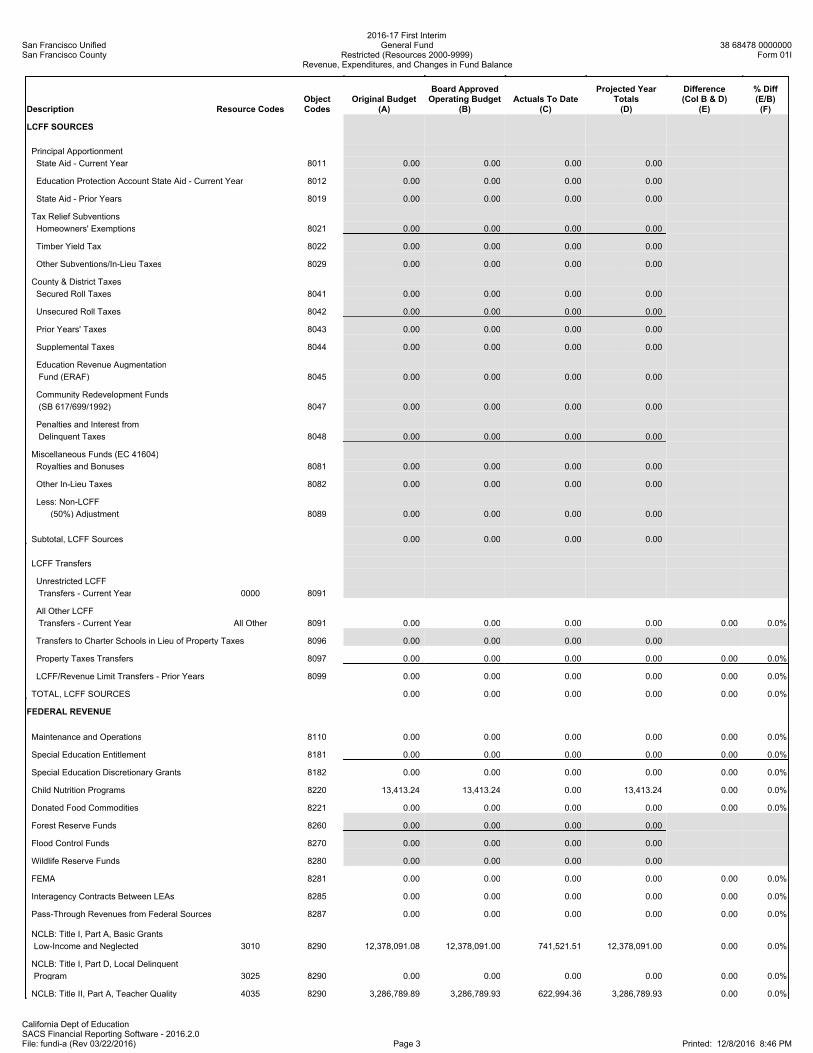
San Francisco UnifiedSan Francisco County
2016-17 First InterimGeneral Fund
Restricted (Resources 2000-9999)Revenue, Expenditures, and Changes in Fund Balance
38 68478 0000000Form 01I
California Dept of EducationSACS Financial Reporting Software - 2016.2.0File: fundi-a (Rev 03/22/2016) Page 3 Printed: 12/8/2016 8:46 PM
Description Resource CodesObjectCodes
Original Budget(A)
Board ApprovedOperating Budget
(B)Actuals To Date
(C)
Projected YearTotals(D)
Difference(Col B & D)
(E)
% Diff(E/B)(F)
LCFF SOURCES
Principal Apportionment
State Aid - Current Year 8011 0.00 0.00 0.00 0.00
Education Protection Account State Aid - Current Year 8012 0.00 0.00 0.00 0.00
State Aid - Prior Years 8019 0.00 0.00 0.00 0.00
Tax Relief Subventions
Homeowners' Exemptions 8021 0.00 0.00 0.00 0.00
Timber Yield Tax 8022 0.00 0.00 0.00 0.00
Other Subventions/In-Lieu Taxes 8029 0.00 0.00 0.00 0.00
County & District Taxes
Secured Roll Taxes 8041 0.00 0.00 0.00 0.00
Unsecured Roll Taxes 8042 0.00 0.00 0.00 0.00
Prior Years' Taxes 8043 0.00 0.00 0.00 0.00
Supplemental Taxes 8044 0.00 0.00 0.00 0.00
Education Revenue Augmentation
Fund (ERAF) 8045 0.00 0.00 0.00 0.00
Community Redevelopment Funds
(SB 617/699/1992) 8047 0.00 0.00 0.00 0.00
Penalties and Interest from
Delinquent Taxes 8048 0.00 0.00 0.00 0.00
Miscellaneous Funds (EC 41604)
Royalties and Bonuses 8081 0.00 0.00 0.00 0.00
Other In-Lieu Taxes 8082 0.00 0.00 0.00 0.00
Less: Non-LCFF
(50%) Adjustment 8089 0.00 0.00 0.00 0.00
Subtotal, LCFF Sources 0.00 0.00 0.00 0.00
LCFF Transfers
Unrestricted LCFF
Transfers - Current Year 0000 8091
All Other LCFF
Transfers - Current Year All Other 8091 0.00 0.00 0.00 0.00 0.00 0.0%
Transfers to Charter Schools in Lieu of Property Taxes 8096 0.00 0.00 0.00 0.00
Property Taxes Transfers 8097 0.00 0.00 0.00 0.00 0.00 0.0%
LCFF/Revenue Limit Transfers - Prior Years 8099 0.00 0.00 0.00 0.00 0.00 0.0%
TOTAL, LCFF SOURCES 0.00 0.00 0.00 0.00 0.00 0.0%
FEDERAL REVENUE
Maintenance and Operations 8110 0.00 0.00 0.00 0.00 0.00 0.0%
Special Education Entitlement 8181 0.00 0.00 0.00 0.00 0.00 0.0%
Special Education Discretionary Grants 8182 0.00 0.00 0.00 0.00 0.00 0.0%
Child Nutrition Programs 8220 13,413.24 13,413.24 0.00 13,413.24 0.00 0.0%
Donated Food Commodities 8221 0.00 0.00 0.00 0.00 0.00 0.0%
Forest Reserve Funds 8260 0.00 0.00 0.00 0.00
Flood Control Funds 8270 0.00 0.00 0.00 0.00
Wildlife Reserve Funds 8280 0.00 0.00 0.00 0.00
FEMA 8281 0.00 0.00 0.00 0.00 0.00 0.0%
Interagency Contracts Between LEAs 8285 0.00 0.00 0.00 0.00 0.00 0.0%
Pass-Through Revenues from Federal Sources 8287 0.00 0.00 0.00 0.00 0.00 0.0%
NCLB: Title I, Part A, Basic Grants
Low-Income and Neglected 3010 8290 12,378,091.08 12,378,091.00 741,521.51 12,378,091.00 0.00 0.0%
NCLB: Title I, Part D, Local Delinquent
Program 3025 8290 0.00 0.00 0.00 0.00 0.00 0.0%
NCLB: Title II, Part A, Teacher Quality 4035 8290 3,286,789.89 3,286,789.93 622,994.36 3,286,789.93 0.00 0.0%

San Francisco UnifiedSan Francisco County
2016-17 First InterimGeneral Fund
Restricted (Resources 2000-9999)Revenue, Expenditures, and Changes in Fund Balance
38 68478 0000000Form 01I
California Dept of EducationSACS Financial Reporting Software - 2016.2.0File: fundi-a (Rev 03/22/2016) Page 4 Printed: 12/8/2016 8:46 PM
Description Resource CodesObjectCodes
Original Budget(A)
Board ApprovedOperating Budget
(B)Actuals To Date
(C)
Projected YearTotals(D)
Difference(Col B & D)
(E)
% Diff(E/B)(F)
NCLB: Title III, Immigration Education
Program 4201 8290 249,379.00 249,379.00 12,390.00 249,379.00 0.00 0.0%
NCLB: Title III, Limited English Proficient (LEP)
Student Program 4203 8290 1,509,730.00 1,509,730.00 352,364.96 1,509,730.00 0.00 0.0%
NCLB: Title V, Part B, Public Charter Schools
Grant Program (PCSGP) 4610 8290 0.00 0.00 0.00 0.00 0.00 0.0%
Other No Child Left Behind
3012-3020, 3030-3199, 4036-4126,
5510 8290 8,248,234.12 8,248,234.00 1,854,680.29 8,248,234.00 0.00 0.0%
Vocational and Applied Technology Education 3500-3699 8290 0.00 0.00 0.00 0.00 0.00 0.0%
Safe and Drug Free Schools 3700-3799 8290 0.00 0.00 0.00 0.00 0.00 0.0%
All Other Federal Revenue All Other 8290 3,627,754.21 3,627,753.56 1,540,689.26 3,627,753.56 0.00 0.0%
TOTAL, FEDERAL REVENUE 29,313,391.54 29,313,390.73 5,124,640.38 29,313,390.73 0.00 0.0%
OTHER STATE REVENUE
Other State Apportionments
ROC/P Entitlement
Prior Years 6360 8319 0.00 0.00 0.00 0.00 0.00 0.0%
Special Education Master Plan
Current Year 6500 8311 0.00 0.00 0.00 0.00 0.00 0.0%
Prior Years 6500 8319 0.00 0.00 0.00 0.00 0.00 0.0%
All Other State Apportionments - Current Year All Other 8311 0.00 0.00 0.00 0.00 0.00 0.0%
All Other State Apportionments - Prior Years All Other 8319 0.00 0.00 0.00 0.00 0.00 0.0%
Child Nutrition Programs 8520 0.00 0.00 0.00 0.00 0.00 0.0%
Mandated Costs Reimbursements 8550 0.00 0.00 0.00 0.00 0.00 0.0%
Lottery - Unrestricted and Instructional Materials 8560 1,919,000.00 2,850,196.00 0.00 2,850,196.00 0.00 0.0%
Tax Relief Subventions
Restricted Levies - Other
Homeowners' Exemptions 8575 0.00 0.00 0.00 0.00 0.00 0.0%
Other Subventions/In-Lieu Taxes 8576 0.00 0.00 0.00 0.00 0.00 0.0%
Pass-Through Revenues from State Sources 8587 0.00 0.00 0.00 0.00 0.00 0.0%
After School Education and Safety (ASES) 6010 8590 10,816,069.98 10,816,070.00 5,304,606.05 10,816,070.00 0.00 0.0%
Charter School Facility Grant 6030 8590 0.00 0.00 0.00 0.00 0.00 0.0%
Career Technical Education Incentive Grant
Program 6387 8590 2,690,096.00 2,690,096.00 1,647,897.50 2,690,096.00 0.00 0.0%
Drug/Alcohol/Tobacco Funds 6650, 6690 8590 495,712.98 495,712.98 0.00 495,712.98 0.00 0.0%
California Clean Energy Jobs Act 6230 8590 350,000.00 350,000.00 0.00 350,000.00 0.00 0.0%
Specialized Secondary 7370 8590 0.00 0.00 0.00 0.00 0.00 0.0%
American Indian Early Childhood Education 7210 8590 0.00 0.00 0.00 0.00 0.00 0.0%
Quality Education Investment Act 7400 8590 0.00 0.00 0.00 0.00 0.00 0.0%
Common Core State Standards
Implementation 7405 8590 0.00 0.00 0.00 0.00 0.00 0.0%
All Other State Revenue All Other 8590 17,822,559.65 21,187,585.91 1,016,893.67 21,187,585.91 0.00 0.0%
TOTAL, OTHER STATE REVENUE 34,093,438.61 38,389,660.89 7,969,397.22 38,389,660.89 0.00 0.0%
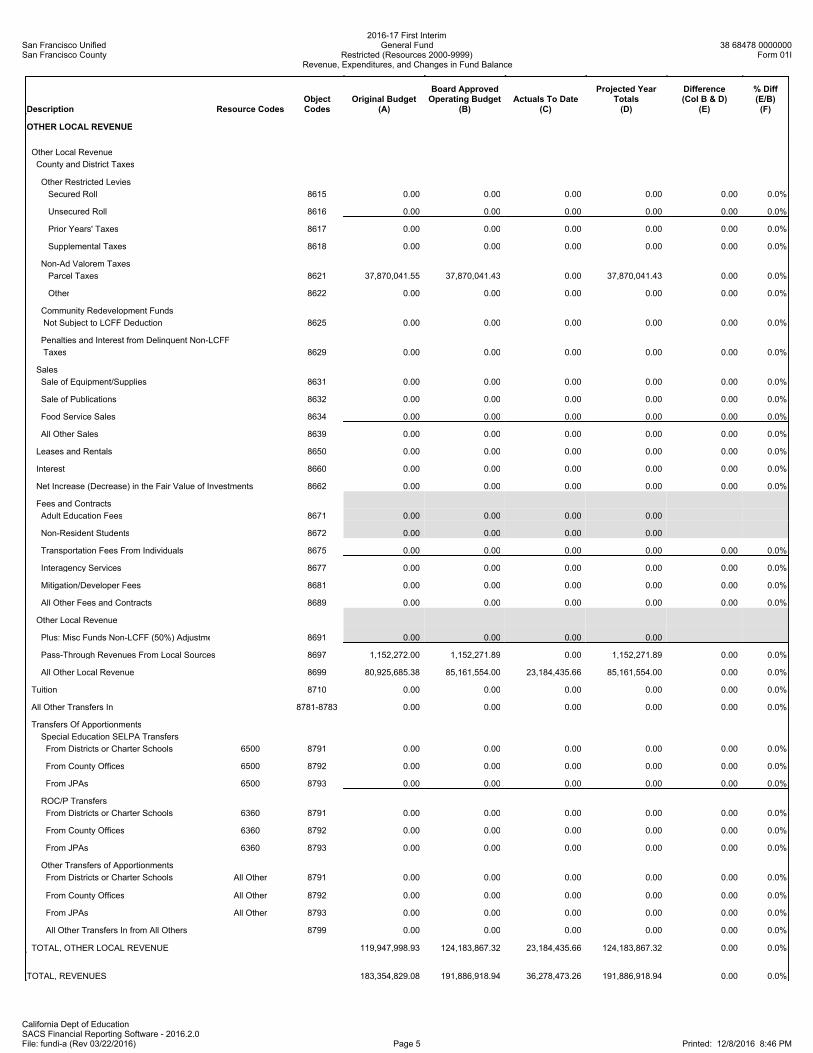
San Francisco UnifiedSan Francisco County
2016-17 First InterimGeneral Fund
Restricted (Resources 2000-9999)Revenue, Expenditures, and Changes in Fund Balance
38 68478 0000000Form 01I
California Dept of EducationSACS Financial Reporting Software - 2016.2.0File: fundi-a (Rev 03/22/2016) Page 5 Printed: 12/8/2016 8:46 PM
Description Resource CodesObjectCodes
Original Budget(A)
Board ApprovedOperating Budget
(B)Actuals To Date
(C)
Projected YearTotals(D)
Difference(Col B & D)
(E)
% Diff(E/B)(F)
OTHER LOCAL REVENUE
Other Local Revenue
County and District Taxes
Other Restricted Levies
Secured Roll 8615 0.00 0.00 0.00 0.00 0.00 0.0%
Unsecured Roll 8616 0.00 0.00 0.00 0.00 0.00 0.0%
Prior Years' Taxes 8617 0.00 0.00 0.00 0.00 0.00 0.0%
Supplemental Taxes 8618 0.00 0.00 0.00 0.00 0.00 0.0%
Non-Ad Valorem Taxes
Parcel Taxes 8621 37,870,041.55 37,870,041.43 0.00 37,870,041.43 0.00 0.0%
Other 8622 0.00 0.00 0.00 0.00 0.00 0.0%
Community Redevelopment Funds
Not Subject to LCFF Deduction 8625 0.00 0.00 0.00 0.00 0.00 0.0%
Penalties and Interest from Delinquent Non-LCFF
Taxes 8629 0.00 0.00 0.00 0.00 0.00 0.0%
Sales
Sale of Equipment/Supplies 8631 0.00 0.00 0.00 0.00 0.00 0.0%
Sale of Publications 8632 0.00 0.00 0.00 0.00 0.00 0.0%
Food Service Sales 8634 0.00 0.00 0.00 0.00 0.00 0.0%
All Other Sales 8639 0.00 0.00 0.00 0.00 0.00 0.0%
Leases and Rentals 8650 0.00 0.00 0.00 0.00 0.00 0.0%
Interest 8660 0.00 0.00 0.00 0.00 0.00 0.0%
Net Increase (Decrease) in the Fair Value of Investments 8662 0.00 0.00 0.00 0.00 0.00 0.0%
Fees and Contracts
Adult Education Fees 8671 0.00 0.00 0.00 0.00
Non-Resident Students 8672 0.00 0.00 0.00 0.00
Transportation Fees From Individuals 8675 0.00 0.00 0.00 0.00 0.00 0.0%
Interagency Services 8677 0.00 0.00 0.00 0.00 0.00 0.0%
Mitigation/Developer Fees 8681 0.00 0.00 0.00 0.00 0.00 0.0%
All Other Fees and Contracts 8689 0.00 0.00 0.00 0.00 0.00 0.0%
Other Local Revenue
Plus: Misc Funds Non-LCFF (50%) Adjustment 8691 0.00 0.00 0.00 0.00
Pass-Through Revenues From Local Sources 8697 1,152,272.00 1,152,271.89 0.00 1,152,271.89 0.00 0.0%
All Other Local Revenue 8699 80,925,685.38 85,161,554.00 23,184,435.66 85,161,554.00 0.00 0.0%
Tuition 8710 0.00 0.00 0.00 0.00 0.00 0.0%
All Other Transfers In 8781-8783 0.00 0.00 0.00 0.00 0.00 0.0%
Transfers Of Apportionments
Special Education SELPA Transfers
From Districts or Charter Schools 6500 8791 0.00 0.00 0.00 0.00 0.00 0.0%
From County Offices 6500 8792 0.00 0.00 0.00 0.00 0.00 0.0%
From JPAs 6500 8793 0.00 0.00 0.00 0.00 0.00 0.0%
ROC/P Transfers
From Districts or Charter Schools 6360 8791 0.00 0.00 0.00 0.00 0.00 0.0%
From County Offices 6360 8792 0.00 0.00 0.00 0.00 0.00 0.0%
From JPAs 6360 8793 0.00 0.00 0.00 0.00 0.00 0.0%
Other Transfers of Apportionments
From Districts or Charter Schools All Other 8791 0.00 0.00 0.00 0.00 0.00 0.0%0.00
From County Offices All Other 8792 0.00 0.00 0.00 0.00 0.00 0.0%
From JPAs All Other 8793 0.00 0.00 0.00 0.00 0.00 0.0%
All Other Transfers In from All Others 8799 0.00 0.00 0.00 0.00 0.00 0.0%
TOTAL, OTHER LOCAL REVENUE 119,947,998.93 124,183,867.32 23,184,435.66 124,183,867.32 0.00 0.0%
TOTAL, REVENUES 183,354,829.08 191,886,918.94 36,278,473.26 191,886,918.94 0.00 0.0%
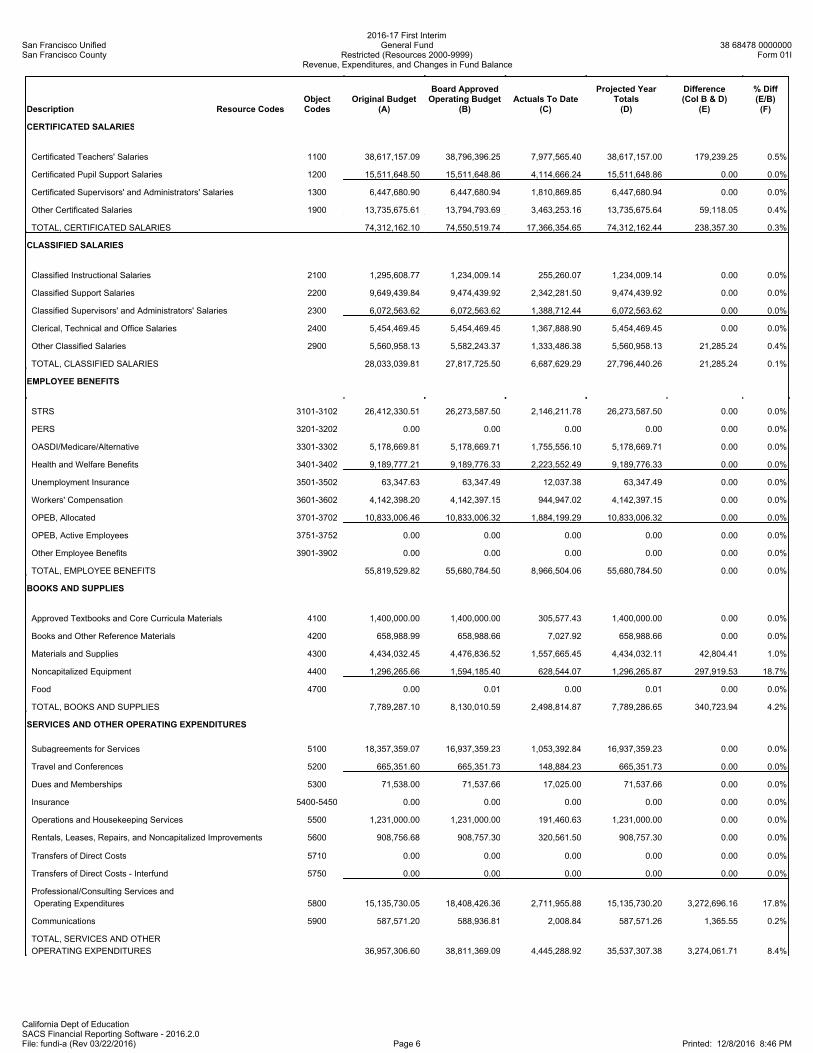
San Francisco UnifiedSan Francisco County
2016-17 First InterimGeneral Fund
Restricted (Resources 2000-9999)Revenue, Expenditures, and Changes in Fund Balance
38 68478 0000000Form 01I
California Dept of EducationSACS Financial Reporting Software - 2016.2.0File: fundi-a (Rev 03/22/2016) Page 6 Printed: 12/8/2016 8:46 PM
Description Resource CodesObjectCodes
Original Budget(A)
Board ApprovedOperating Budget
(B)Actuals To Date
(C)
Projected YearTotals(D)
Difference(Col B & D)
(E)
% Diff(E/B)(F)
CERTIFICATED SALARIES
Certificated Teachers' Salaries 1100 38,617,157.09 38,796,396.25 7,977,565.40 38,617,157.00 179,239.25 0.5%
Certificated Pupil Support Salaries 1200 15,511,648.50 15,511,648.86 4,114,666.24 15,511,648.86 0.00 0.0%
Certificated Supervisors' and Administrators' Salaries 1300 6,447,680.90 6,447,680.94 1,810,869.85 6,447,680.94 0.00 0.0%
Other Certificated Salaries 1900 13,735,675.61 13,794,793.69 3,463,253.16 13,735,675.64 59,118.05 0.4%
TOTAL, CERTIFICATED SALARIES 74,312,162.10 74,550,519.74 17,366,354.65 74,312,162.44 238,357.30 0.3%
CLASSIFIED SALARIES
Classified Instructional Salaries 2100 1,295,608.77 1,234,009.14 255,260.07 1,234,009.14 0.00 0.0%
Classified Support Salaries 2200 9,649,439.84 9,474,439.92 2,342,281.50 9,474,439.92 0.00 0.0%
Classified Supervisors' and Administrators' Salaries 2300 6,072,563.62 6,072,563.62 1,388,712.44 6,072,563.62 0.00 0.0%
Clerical, Technical and Office Salaries 2400 5,454,469.45 5,454,469.45 1,367,888.90 5,454,469.45 0.00 0.0%
Other Classified Salaries 2900 5,560,958.13 5,582,243.37 1,333,486.38 5,560,958.13 21,285.24 0.4%
TOTAL, CLASSIFIED SALARIES 28,033,039.81 27,817,725.50 6,687,629.29 27,796,440.26 21,285.24 0.1%
EMPLOYEE BENEFITS
STRS 3101-3102 26,412,330.51 26,273,587.50 2,146,211.78 26,273,587.50 0.00 0.0%
PERS 3201-3202 0.00 0.00 0.00 0.00 0.00 0.0%
OASDI/Medicare/Alternative 3301-3302 5,178,669.81 5,178,669.71 1,755,556.10 5,178,669.71 0.00 0.0%
Health and Welfare Benefits 3401-3402 9,189,777.21 9,189,776.33 2,223,552.49 9,189,776.33 0.00 0.0%
Unemployment Insurance 3501-3502 63,347.63 63,347.49 12,037.38 63,347.49 0.00 0.0%
Workers' Compensation 3601-3602 4,142,398.20 4,142,397.15 944,947.02 4,142,397.15 0.00 0.0%
OPEB, Allocated 3701-3702 10,833,006.46 10,833,006.32 1,884,199.29 10,833,006.32 0.00 0.0%
OPEB, Active Employees 3751-3752 0.00 0.00 0.00 0.00 0.00 0.0%
Other Employee Benefits 3901-3902 0.00 0.00 0.00 0.00 0.00 0.0%
TOTAL, EMPLOYEE BENEFITS 55,819,529.82 55,680,784.50 8,966,504.06 55,680,784.50 0.00 0.0%
BOOKS AND SUPPLIES
Approved Textbooks and Core Curricula Materials 4100 1,400,000.00 1,400,000.00 305,577.43 1,400,000.00 0.00 0.0%
Books and Other Reference Materials 4200 658,988.99 658,988.66 7,027.92 658,988.66 0.00 0.0%
Materials and Supplies 4300 4,434,032.45 4,476,836.52 1,557,665.45 4,434,032.11 42,804.41 1.0%
Noncapitalized Equipment 4400 1,296,265.66 1,594,185.40 628,544.07 1,296,265.87 297,919.53 18.7%
Food 4700 0.00 0.01 0.00 0.01 0.00 0.0%
TOTAL, BOOKS AND SUPPLIES 7,789,287.10 8,130,010.59 2,498,814.87 7,789,286.65 340,723.94 4.2%
SERVICES AND OTHER OPERATING EXPENDITURES
Subagreements for Services 5100 18,357,359.07 16,937,359.23 1,053,392.84 16,937,359.23 0.00 0.0%
Travel and Conferences 5200 665,351.60 665,351.73 148,884.23 665,351.73 0.00 0.0%
Dues and Memberships 5300 71,538.00 71,537.66 17,025.00 71,537.66 0.00 0.0%
Insurance 5400-5450 0.00 0.00 0.00 0.00 0.00 0.0%
Operations and Housekeeping Services 5500 1,231,000.00 1,231,000.00 191,460.63 1,231,000.00 0.00 0.0%
Rentals, Leases, Repairs, and Noncapitalized Improvements 5600 908,756.68 908,757.30 320,561.50 908,757.30 0.00 0.0%
Transfers of Direct Costs 5710 0.00 0.00 0.00 0.00 0.00 0.0%
Transfers of Direct Costs - Interfund 5750 0.00 0.00 0.00 0.00 0.00 0.0%
Professional/Consulting Services and
Operating Expenditures 5800 15,135,730.05 18,408,426.36 2,711,955.88 15,135,730.20 3,272,696.16 17.8%
Communications 5900 587,571.20 588,936.81 2,008.84 587,571.26 1,365.55 0.2%
TOTAL, SERVICES AND OTHER
OPERATING EXPENDITURES 36,957,306.60 38,811,369.09 4,445,288.92 35,537,307.38 3,274,061.71 8.4%
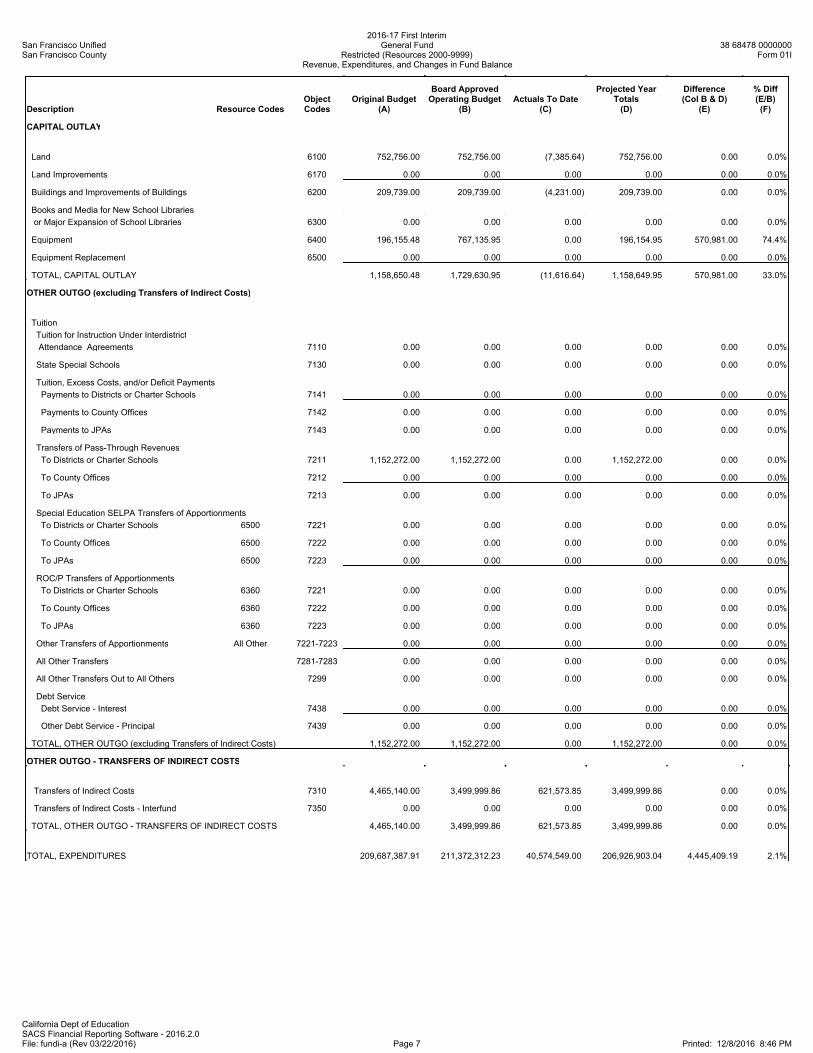
San Francisco UnifiedSan Francisco County
2016-17 First InterimGeneral Fund
Restricted (Resources 2000-9999)Revenue, Expenditures, and Changes in Fund Balance
38 68478 0000000Form 01I
California Dept of EducationSACS Financial Reporting Software - 2016.2.0File: fundi-a (Rev 03/22/2016) Page 7 Printed: 12/8/2016 8:46 PM
Description Resource CodesObjectCodes
Original Budget(A)
Board ApprovedOperating Budget
(B)Actuals To Date
(C)
Projected YearTotals(D)
Difference(Col B & D)
(E)
% Diff(E/B)(F)
CAPITAL OUTLAY
Land 6100 752,756.00 752,756.00 (7,385.64) 752,756.00 0.00 0.0%
Land Improvements 6170 0.00 0.00 0.00 0.00 0.00 0.0%
Buildings and Improvements of Buildings 6200 209,739.00 209,739.00 (4,231.00) 209,739.00 0.00 0.0%
Books and Media for New School Libraries
or Major Expansion of School Libraries 6300 0.00 0.00 0.00 0.00 0.00 0.0%
Equipment 6400 196,155.48 767,135.95 0.00 196,154.95 570,981.00 74.4%
Equipment Replacement 6500 0.00 0.00 0.00 0.00 0.00 0.0%
TOTAL, CAPITAL OUTLAY 1,158,650.48 1,729,630.95 (11,616.64) 1,158,649.95 570,981.00 33.0%
OTHER OUTGO (excluding Transfers of Indirect Costs)
Tuition
Tuition for Instruction Under Interdistrict
Attendance Agreements 7110 0.00 0.00 0.00 0.00 0.00 0.0%
State Special Schools 7130 0.00 0.00 0.00 0.00 0.00 0.0%
Tuition, Excess Costs, and/or Deficit Payments
Payments to Districts or Charter Schools 7141 0.00 0.00 0.00 0.00 0.00 0.0%
Payments to County Offices 7142 0.00 0.00 0.00 0.00 0.00 0.0%
Payments to JPAs 7143 0.00 0.00 0.00 0.00 0.00 0.0%
Transfers of Pass-Through Revenues
To Districts or Charter Schools 7211 1,152,272.00 1,152,272.00 0.00 1,152,272.00 0.00 0.0%
To County Offices 7212 0.00 0.00 0.00 0.00 0.00 0.0%
To JPAs 7213 0.00 0.00 0.00 0.00 0.00 0.0%
Special Education SELPA Transfers of Apportionments
To Districts or Charter Schools 6500 7221 0.00 0.00 0.00 0.00 0.00 0.0%
To County Offices 6500 7222 0.00 0.00 0.00 0.00 0.00 0.0%
To JPAs 6500 7223 0.00 0.00 0.00 0.00 0.00 0.0%
ROC/P Transfers of Apportionments
To Districts or Charter Schools 6360 7221 0.00 0.00 0.00 0.00 0.00 0.0%
To County Offices 6360 7222 0.00 0.00 0.00 0.00 0.00 0.0%
To JPAs 6360 7223 0.00 0.00 0.00 0.00 0.00 0.0%
Other Transfers of Apportionments All Other 7221-7223 0.00 0.00 0.00 0.00 0.00 0.0%
All Other Transfers 7281-7283 0.00 0.00 0.00 0.00 0.00 0.0%
All Other Transfers Out to All Others 7299 0.00 0.00 0.00 0.00 0.00 0.0%
Debt Service
Debt Service - Interest 7438 0.00 0.00 0.00 0.00 0.00 0.0%
Other Debt Service - Principal 7439 0.00 0.00 0.00 0.00 0.00 0.0%
TOTAL, OTHER OUTGO (excluding Transfers of Indirect Costs) 1,152,272.00 1,152,272.00 0.00 1,152,272.00 0.00 0.0%
OTHER OUTGO - TRANSFERS OF INDIRECT COSTS
Transfers of Indirect Costs 7310 4,465,140.00 3,499,999.86 621,573.85 3,499,999.86 0.00 0.0%
Transfers of Indirect Costs - Interfund 7350 0.00 0.00 0.00 0.00 0.00 0.0%
TOTAL, OTHER OUTGO - TRANSFERS OF INDIRECT COSTS 4,465,140.00 3,499,999.86 621,573.85 3,499,999.86 0.00 0.0%
TOTAL, EXPENDITURES 209,687,387.91 211,372,312.23 40,574,549.00 206,926,903.04 4,445,409.19 2.1%
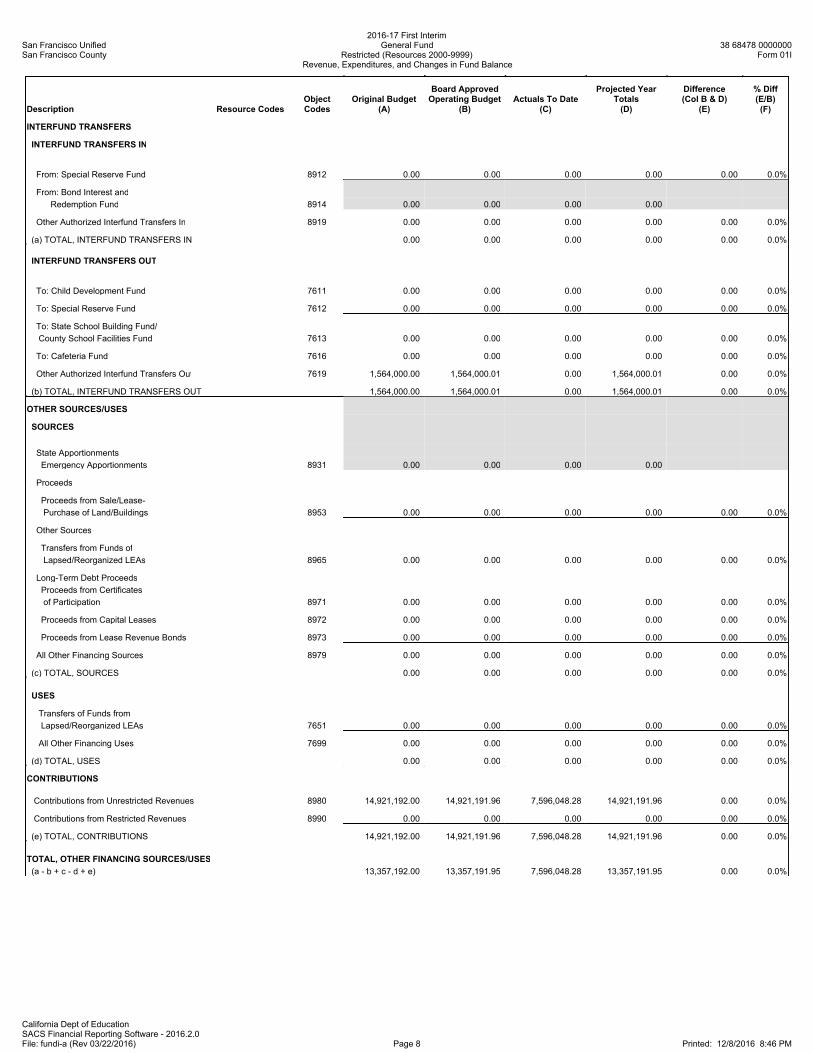
San Francisco UnifiedSan Francisco County
2016-17 First InterimGeneral Fund
Restricted (Resources 2000-9999)Revenue, Expenditures, and Changes in Fund Balance
38 68478 0000000Form 01I
California Dept of EducationSACS Financial Reporting Software - 2016.2.0File: fundi-a (Rev 03/22/2016) Page 8 Printed: 12/8/2016 8:46 PM
Description Resource CodesObjectCodes
Original Budget(A)
Board ApprovedOperating Budget
(B)Actuals To Date
(C)
Projected YearTotals(D)
Difference(Col B & D)
(E)
% Diff(E/B)(F)
INTERFUND TRANSFERS
INTERFUND TRANSFERS IN
From: Special Reserve Fund 8912 0.00 0.00 0.00 0.00 0.00 0.0%
From: Bond Interest and
Redemption Fund 8914 0.00 0.00 0.00 0.00
Other Authorized Interfund Transfers In 8919 0.00 0.00 0.00 0.00 0.00 0.0%
(a) TOTAL, INTERFUND TRANSFERS IN 0.00 0.00 0.00 0.00 0.00 0.0%
INTERFUND TRANSFERS OUT
To: Child Development Fund 7611 0.00 0.00 0.00 0.00 0.00 0.0%
To: Special Reserve Fund 7612 0.00 0.00 0.00 0.00 0.00 0.0%
To: State School Building Fund/
County School Facilities Fund 7613 0.00 0.00 0.00 0.00 0.00 0.0%
To: Cafeteria Fund 7616 0.00 0.00 0.00 0.00 0.00 0.0%
Other Authorized Interfund Transfers Out 7619 1,564,000.00 1,564,000.01 0.00 1,564,000.01 0.00 0.0%
(b) TOTAL, INTERFUND TRANSFERS OUT 1,564,000.00 1,564,000.01 0.00 1,564,000.01 0.00 0.0%
OTHER SOURCES/USES
SOURCES
State Apportionments
Emergency Apportionments 8931 0.00 0.00 0.00 0.00
Proceeds
Proceeds from Sale/Lease-
Purchase of Land/Buildings 8953 0.00 0.00 0.00 0.00 0.00 0.0%
Other Sources
Transfers from Funds of
Lapsed/Reorganized LEAs 8965 0.00 0.00 0.00 0.00 0.00 0.0%
Long-Term Debt Proceeds
Proceeds from Certificates
of Participation 8971 0.00 0.00 0.00 0.00 0.00 0.0%
Proceeds from Capital Leases 8972 0.00 0.00 0.00 0.00 0.00 0.0%
Proceeds from Lease Revenue Bonds 8973 0.00 0.00 0.00 0.00 0.00 0.0%
All Other Financing Sources 8979 0.00 0.00 0.00 0.00 0.00 0.0%
(c) TOTAL, SOURCES 0.00 0.00 0.00 0.00 0.00 0.0%
USES
Transfers of Funds from
Lapsed/Reorganized LEAs 7651 0.00 0.00 0.00 0.00 0.00 0.0%
All Other Financing Uses 7699 0.00 0.00 0.00 0.00 0.00 0.0%
(d) TOTAL, USES 0.00 0.00 0.00 0.00 0.00 0.0%
CONTRIBUTIONS
Contributions from Unrestricted Revenues 8980 14,921,192.00 14,921,191.96 7,596,048.28 14,921,191.96 0.00 0.0%
Contributions from Restricted Revenues 8990 0.00 0.00 0.00 0.00 0.00 0.0%
(e) TOTAL, CONTRIBUTIONS 14,921,192.00 14,921,191.96 7,596,048.28 14,921,191.96 0.00 0.0%
TOTAL, OTHER FINANCING SOURCES/USES
(a - b + c - d + e) 13,357,192.00 13,357,191.95 7,596,048.28 13,357,191.95 0.00 0.0%
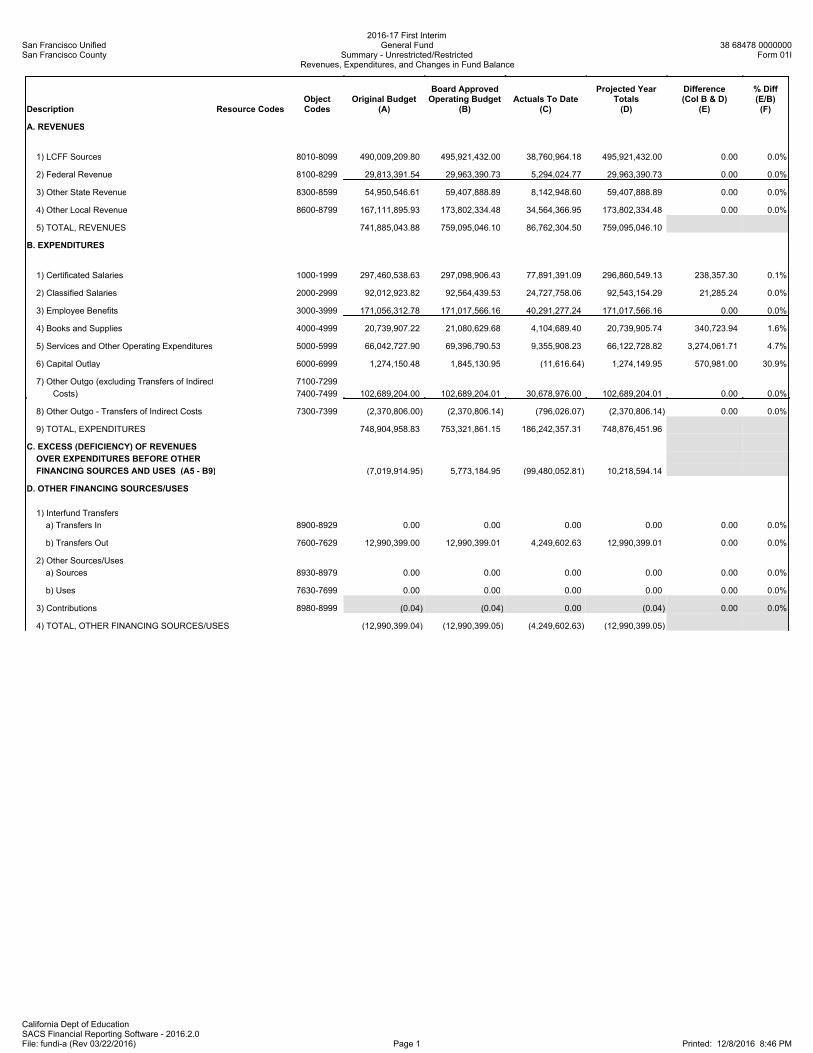
San Francisco UnifiedSan Francisco County
2016-17 First InterimGeneral Fund
Summary - Unrestricted/RestrictedRevenues, Expenditures, and Changes in Fund Balance
38 68478 0000000Form 01I
California Dept of EducationSACS Financial Reporting Software - 2016.2.0File: fundi-a (Rev 03/22/2016) Page 1 Printed: 12/8/2016 8:46 PM
Description Resource CodesObjectCodes
Original Budget(A)
Board ApprovedOperating Budget
(B)Actuals To Date
(C)
Projected YearTotals(D)
Difference(Col B & D)
(E)
% Diff(E/B)(F)
A. REVENUES
1) LCFF Sources 8010-8099 490,009,209.80 495,921,432.00 38,760,964.18 495,921,432.00 0.00 0.0%
2) Federal Revenue 8100-8299 29,813,391.54 29,963,390.73 5,294,024.77 29,963,390.73 0.00 0.0%
3) Other State Revenue 8300-8599 54,950,546.61 59,407,888.89 8,142,948.60 59,407,888.89 0.00 0.0%
4) Other Local Revenue 8600-8799 167,111,895.93 173,802,334.48 34,564,366.95 173,802,334.48 0.00 0.0%
5) TOTAL, REVENUES 741,885,043.88 759,095,046.10 86,762,304.50 759,095,046.10
B. EXPENDITURES
1) Certificated Salaries 1000-1999 297,460,538.63 297,098,906.43 77,891,391.09 296,860,549.13 238,357.30 0.1%
2) Classified Salaries 2000-2999 92,012,923.82 92,564,439.53 24,727,758.06 92,543,154.29 21,285.24 0.0%
3) Employee Benefits 3000-3999 171,056,312.78 171,017,566.16 40,291,277.24 171,017,566.16 0.00 0.0%
4) Books and Supplies 4000-4999 20,739,907.22 21,080,629.68 4,104,689.40 20,739,905.74 340,723.94 1.6%
5) Services and Other Operating Expenditures 5000-5999 66,042,727.90 69,396,790.53 9,355,908.23 66,122,728.82 3,274,061.71 4.7%
6) Capital Outlay 6000-6999 1,274,150.48 1,845,130.95 (11,616.64) 1,274,149.95 570,981.00 30.9%
7) Other Outgo (excluding Transfers of Indirect 7100-7299
Costs) 7400-7499 102,689,204.00 102,689,204.01 30,678,976.00 102,689,204.01 0.00 0.0%
8) Other Outgo - Transfers of Indirect Costs 7300-7399 (2,370,806.00) (2,370,806.14) (796,026.07) (2,370,806.14) 0.00 0.0%
9) TOTAL, EXPENDITURES 748,904,958.83 753,321,861.15 186,242,357.31 748,876,451.96
C. EXCESS (DEFICIENCY) OF REVENUES
OVER EXPENDITURES BEFORE OTHER
FINANCING SOURCES AND USES (A5 - B9) (7,019,914.95) 5,773,184.95 (99,480,052.81) 10,218,594.14
D. OTHER FINANCING SOURCES/USES
1) Interfund Transfers
a) Transfers In 8900-8929 0.00 0.00 0.00 0.00 0.00 0.0%
b) Transfers Out 7600-7629 12,990,399.00 12,990,399.01 4,249,602.63 12,990,399.01 0.00 0.0%
2) Other Sources/Uses
a) Sources 8930-8979 0.00 0.00 0.00 0.00 0.00 0.0%
b) Uses 7630-7699 0.00 0.00 0.00 0.00 0.00 0.0%
3) Contributions 8980-8999 (0.04) (0.04) 0.00 (0.04) 0.00 0.0%
4) TOTAL, OTHER FINANCING SOURCES/USES (12,990,399.04) (12,990,399.05) (4,249,602.63) (12,990,399.05)
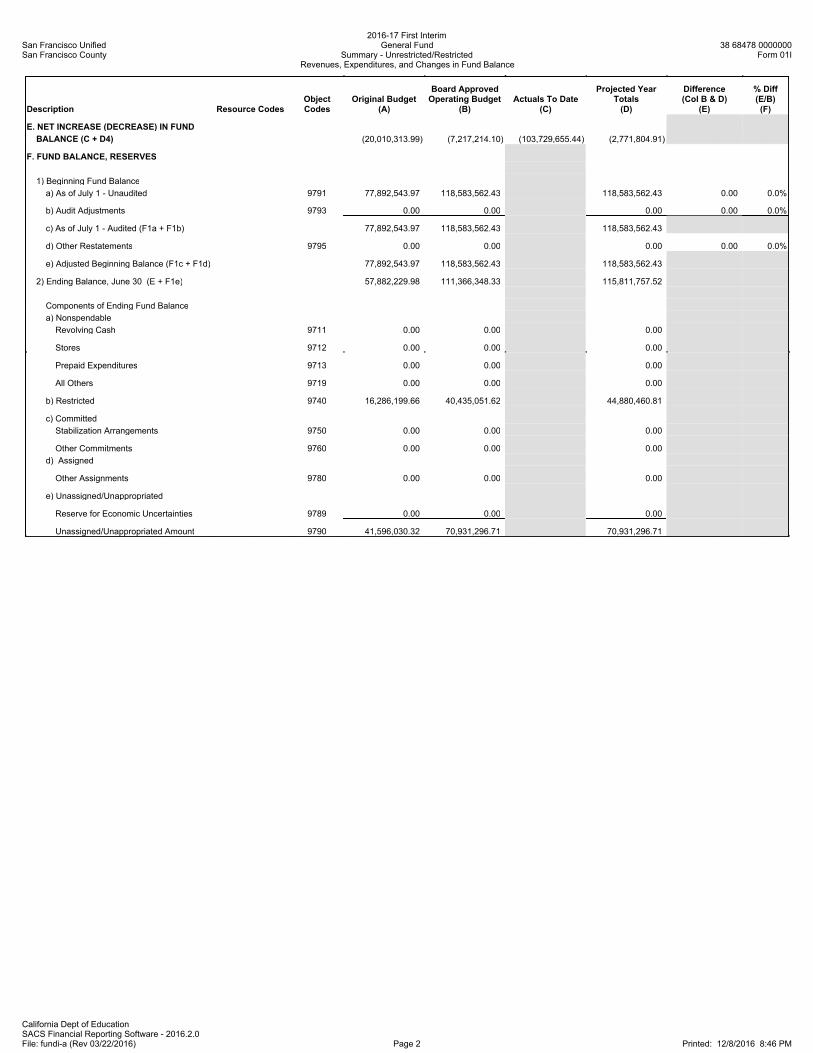
San Francisco UnifiedSan Francisco County
2016-17 First InterimGeneral Fund
Summary - Unrestricted/RestrictedRevenues, Expenditures, and Changes in Fund Balance
38 68478 0000000Form 01I
California Dept of EducationSACS Financial Reporting Software - 2016.2.0File: fundi-a (Rev 03/22/2016) Page 2 Printed: 12/8/2016 8:46 PM
Description Resource CodesObjectCodes
Original Budget(A)
Board ApprovedOperating Budget
(B)Actuals To Date
(C)
Projected YearTotals(D)
Difference(Col B & D)
(E)
% Diff(E/B)(F)
E. NET INCREASE (DECREASE) IN FUND
BALANCE (C + D4) (20,010,313.99) (7,217,214.10) (103,729,655.44) (2,771,804.91)
F. FUND BALANCE, RESERVES
1) Beginning Fund Balance
a) As of July 1 - Unaudited 9791 77,892,543.97 118,583,562.43 118,583,562.43 0.00 0.0%
b) Audit Adjustments 9793 0.00 0.00 0.00 0.00 0.0%
c) As of July 1 - Audited (F1a + F1b) 77,892,543.97 118,583,562.43 118,583,562.43
d) Other Restatements 9795 0.00 0.00 0.00 0.00 0.0%
e) Adjusted Beginning Balance (F1c + F1d) 77,892,543.97 118,583,562.43 118,583,562.43
2) Ending Balance, June 30 (E + F1e) 57,882,229.98 111,366,348.33 115,811,757.52
Components of Ending Fund Balance
a) Nonspendable
Revolving Cash 9711 0.00 0.00 0.00
Stores 9712 0.00 0.00 0.00
Prepaid Expenditures 9713 0.00 0.00 0.00
All Others 9719 0.00 0.00 0.00
b) Restricted 9740 16,286,199.66 40,435,051.62 44,880,460.81
c) Committed
Stabilization Arrangements 9750 0.00 0.00 0.00
Other Commitments 9760 0.00 0.00 0.00
d) Assigned
Other Assignments 9780 0.00 0.00 0.00
e) Unassigned/Unappropriated
Reserve for Economic Uncertainties 9789 0.00 0.00 0.00
Unassigned/Unappropriated Amount 9790 41,596,030.32 70,931,296.71 70,931,296.71
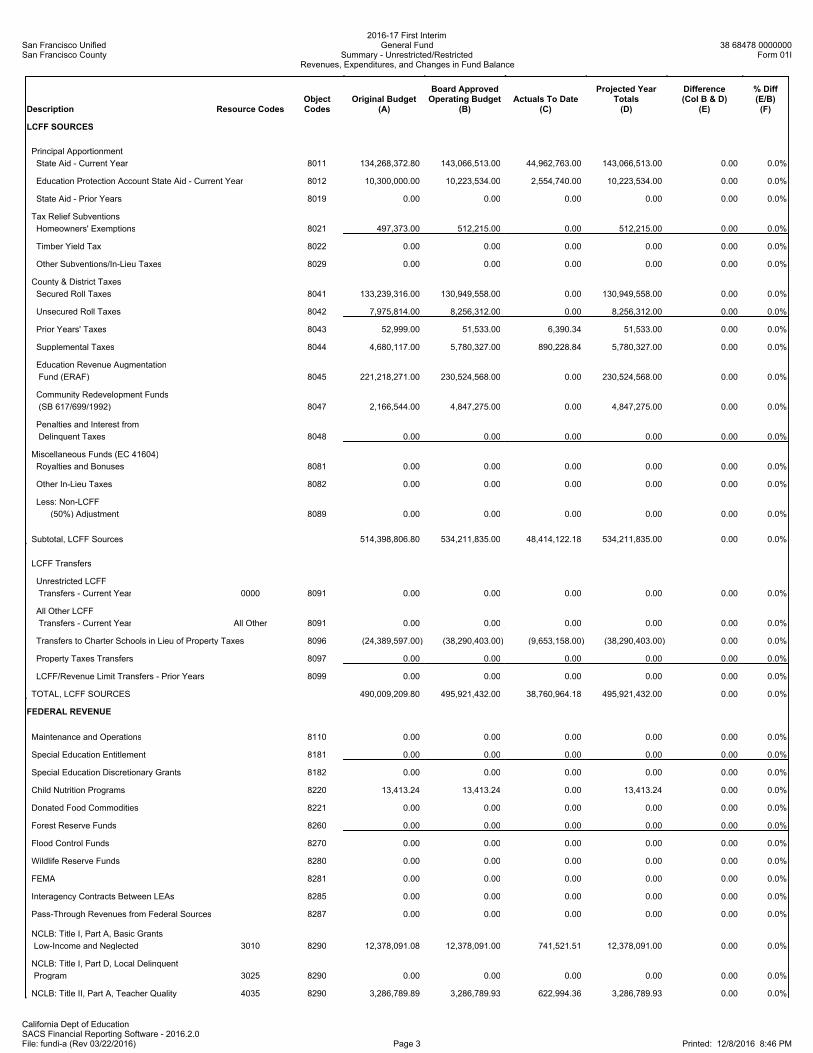
San Francisco UnifiedSan Francisco County
2016-17 First InterimGeneral Fund
Summary - Unrestricted/RestrictedRevenues, Expenditures, and Changes in Fund Balance
38 68478 0000000Form 01I
California Dept of EducationSACS Financial Reporting Software - 2016.2.0File: fundi-a (Rev 03/22/2016) Page 3 Printed: 12/8/2016 8:46 PM
Description Resource CodesObjectCodes
Original Budget(A)
Board ApprovedOperating Budget
(B)Actuals To Date
(C)
Projected YearTotals(D)
Difference(Col B & D)
(E)
% Diff(E/B)(F)
LCFF SOURCES
Principal Apportionment
State Aid - Current Year 8011 134,268,372.80 143,066,513.00 44,962,763.00 143,066,513.00 0.00 0.0%
Education Protection Account State Aid - Current Year 8012 10,300,000.00 10,223,534.00 2,554,740.00 10,223,534.00 0.00 0.0%
State Aid - Prior Years 8019 0.00 0.00 0.00 0.00 0.00 0.0%
Tax Relief Subventions
Homeowners' Exemptions 8021 497,373.00 512,215.00 0.00 512,215.00 0.00 0.0%
Timber Yield Tax 8022 0.00 0.00 0.00 0.00 0.00 0.0%
Other Subventions/In-Lieu Taxes 8029 0.00 0.00 0.00 0.00 0.00 0.0%
County & District Taxes
Secured Roll Taxes 8041 133,239,316.00 130,949,558.00 0.00 130,949,558.00 0.00 0.0%
Unsecured Roll Taxes 8042 7,975,814.00 8,256,312.00 0.00 8,256,312.00 0.00 0.0%
Prior Years' Taxes 8043 52,999.00 51,533.00 6,390.34 51,533.00 0.00 0.0%
Supplemental Taxes 8044 4,680,117.00 5,780,327.00 890,228.84 5,780,327.00 0.00 0.0%
Education Revenue Augmentation
Fund (ERAF) 8045 221,218,271.00 230,524,568.00 0.00 230,524,568.00 0.00 0.0%
Community Redevelopment Funds
(SB 617/699/1992) 8047 2,166,544.00 4,847,275.00 0.00 4,847,275.00 0.00 0.0%
Penalties and Interest from
Delinquent Taxes 8048 0.00 0.00 0.00 0.00 0.00 0.0%
Miscellaneous Funds (EC 41604)
Royalties and Bonuses 8081 0.00 0.00 0.00 0.00 0.00 0.0%
Other In-Lieu Taxes 8082 0.00 0.00 0.00 0.00 0.00 0.0%
Less: Non-LCFF
(50%) Adjustment 8089 0.00 0.00 0.00 0.00 0.00 0.0%
Subtotal, LCFF Sources 514,398,806.80 534,211,835.00 48,414,122.18 534,211,835.00 0.00 0.0%
LCFF Transfers
Unrestricted LCFF
Transfers - Current Year 0000 8091 0.00 0.00 0.00 0.00 0.00 0.0%
All Other LCFF
Transfers - Current Year All Other 8091 0.00 0.00 0.00 0.00 0.00 0.0%
Transfers to Charter Schools in Lieu of Property Taxes 8096 (24,389,597.00) (38,290,403.00) (9,653,158.00) (38,290,403.00) 0.00 0.0%
Property Taxes Transfers 8097 0.00 0.00 0.00 0.00 0.00 0.0%
LCFF/Revenue Limit Transfers - Prior Years 8099 0.00 0.00 0.00 0.00 0.00 0.0%
TOTAL, LCFF SOURCES 490,009,209.80 495,921,432.00 38,760,964.18 495,921,432.00 0.00 0.0%
FEDERAL REVENUE
Maintenance and Operations 8110 0.00 0.00 0.00 0.00 0.00 0.0%
Special Education Entitlement 8181 0.00 0.00 0.00 0.00 0.00 0.0%
Special Education Discretionary Grants 8182 0.00 0.00 0.00 0.00 0.00 0.0%
Child Nutrition Programs 8220 13,413.24 13,413.24 0.00 13,413.24 0.00 0.0%
Donated Food Commodities 8221 0.00 0.00 0.00 0.00 0.00 0.0%
Forest Reserve Funds 8260 0.00 0.00 0.00 0.00 0.00 0.0%
Flood Control Funds 8270 0.00 0.00 0.00 0.00 0.00 0.0%
Wildlife Reserve Funds 8280 0.00 0.00 0.00 0.00 0.00 0.0%
FEMA 8281 0.00 0.00 0.00 0.00 0.00 0.0%
Interagency Contracts Between LEAs 8285 0.00 0.00 0.00 0.00 0.00 0.0%
Pass-Through Revenues from Federal Sources 8287 0.00 0.00 0.00 0.00 0.00 0.0%
NCLB: Title I, Part A, Basic Grants
Low-Income and Neglected 3010 8290 12,378,091.08 12,378,091.00 741,521.51 12,378,091.00 0.00 0.0%
NCLB: Title I, Part D, Local Delinquent
Program 3025 8290 0.00 0.00 0.00 0.00 0.00 0.0%
NCLB: Title II, Part A, Teacher Quality 4035 8290 3,286,789.89 3,286,789.93 622,994.36 3,286,789.93 0.00 0.0%
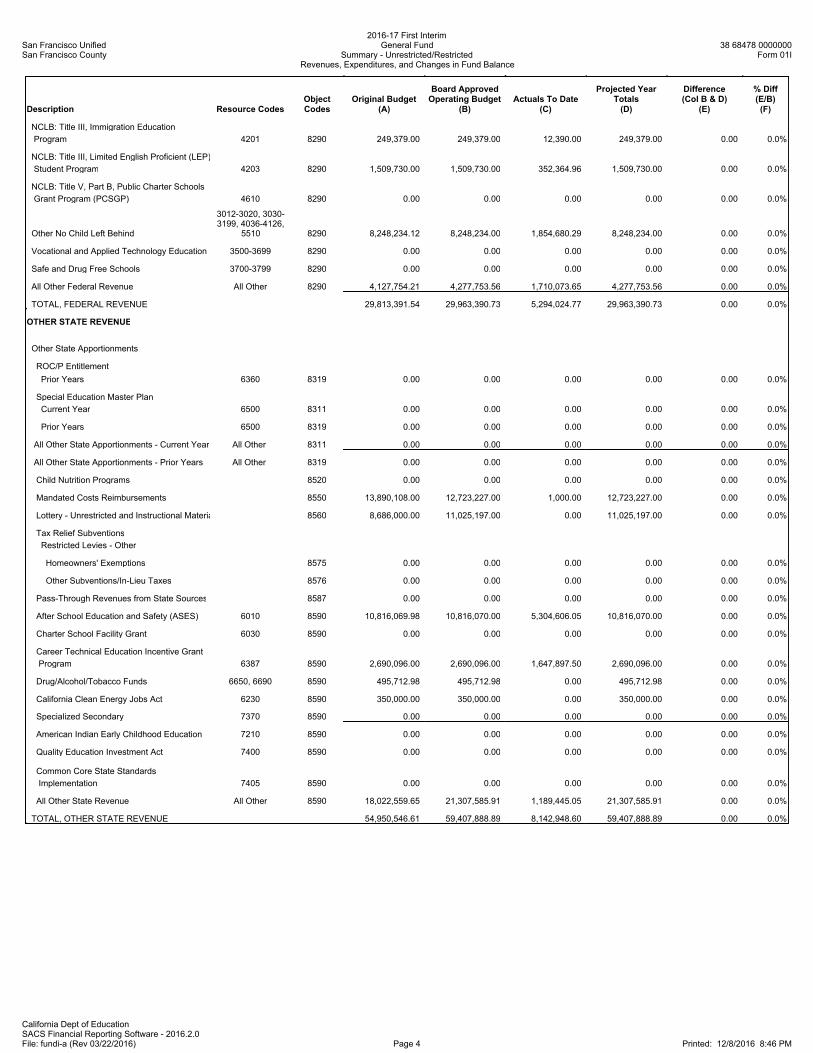
San Francisco UnifiedSan Francisco County
2016-17 First InterimGeneral Fund
Summary - Unrestricted/RestrictedRevenues, Expenditures, and Changes in Fund Balance
38 68478 0000000Form 01I
California Dept of EducationSACS Financial Reporting Software - 2016.2.0File: fundi-a (Rev 03/22/2016) Page 4 Printed: 12/8/2016 8:46 PM
Description Resource CodesObjectCodes
Original Budget(A)
Board ApprovedOperating Budget
(B)Actuals To Date
(C)
Projected YearTotals(D)
Difference(Col B & D)
(E)
% Diff(E/B)(F)
NCLB: Title III, Immigration Education
Program 4201 8290 249,379.00 249,379.00 12,390.00 249,379.00 0.00 0.0%
NCLB: Title III, Limited English Proficient (LEP)
Student Program 4203 8290 1,509,730.00 1,509,730.00 352,364.96 1,509,730.00 0.00 0.0%
NCLB: Title V, Part B, Public Charter Schools
Grant Program (PCSGP) 4610 8290 0.00 0.00 0.00 0.00 0.00 0.0%
Other No Child Left Behind
3012-3020, 3030-3199, 4036-4126,
5510 8290 8,248,234.12 8,248,234.00 1,854,680.29 8,248,234.00 0.00 0.0%
Vocational and Applied Technology Education 3500-3699 8290 0.00 0.00 0.00 0.00 0.00 0.0%
Safe and Drug Free Schools 3700-3799 8290 0.00 0.00 0.00 0.00 0.00 0.0%
All Other Federal Revenue All Other 8290 4,127,754.21 4,277,753.56 1,710,073.65 4,277,753.56 0.00 0.0%
TOTAL, FEDERAL REVENUE 29,813,391.54 29,963,390.73 5,294,024.77 29,963,390.73 0.00 0.0%
OTHER STATE REVENUE
Other State Apportionments
ROC/P Entitlement
Prior Years 6360 8319 0.00 0.00 0.00 0.00 0.00 0.0%
Special Education Master Plan
Current Year 6500 8311 0.00 0.00 0.00 0.00 0.00 0.0%
Prior Years 6500 8319 0.00 0.00 0.00 0.00 0.00 0.0%
All Other State Apportionments - Current Year All Other 8311 0.00 0.00 0.00 0.00 0.00 0.0%
All Other State Apportionments - Prior Years All Other 8319 0.00 0.00 0.00 0.00 0.00 0.0%
Child Nutrition Programs 8520 0.00 0.00 0.00 0.00 0.00 0.0%
Mandated Costs Reimbursements 8550 13,890,108.00 12,723,227.00 1,000.00 12,723,227.00 0.00 0.0%
Lottery - Unrestricted and Instructional Materials 8560 8,686,000.00 11,025,197.00 0.00 11,025,197.00 0.00 0.0%
Tax Relief Subventions
Restricted Levies - Other
Homeowners' Exemptions 8575 0.00 0.00 0.00 0.00 0.00 0.0%
Other Subventions/In-Lieu Taxes 8576 0.00 0.00 0.00 0.00 0.00 0.0%
Pass-Through Revenues from State Sources 8587 0.00 0.00 0.00 0.00 0.00 0.0%
After School Education and Safety (ASES) 6010 8590 10,816,069.98 10,816,070.00 5,304,606.05 10,816,070.00 0.00 0.0%
Charter School Facility Grant 6030 8590 0.00 0.00 0.00 0.00 0.00 0.0%
Career Technical Education Incentive Grant
Program 6387 8590 2,690,096.00 2,690,096.00 1,647,897.50 2,690,096.00 0.00 0.0%
Drug/Alcohol/Tobacco Funds 6650, 6690 8590 495,712.98 495,712.98 0.00 495,712.98 0.00 0.0%
California Clean Energy Jobs Act 6230 8590 350,000.00 350,000.00 0.00 350,000.00 0.00 0.0%
Specialized Secondary 7370 8590 0.00 0.00 0.00 0.00 0.00 0.0%
American Indian Early Childhood Education 7210 8590 0.00 0.00 0.00 0.00 0.00 0.0%
Quality Education Investment Act 7400 8590 0.00 0.00 0.00 0.00 0.00 0.0%
Common Core State Standards
Implementation 7405 8590 0.00 0.00 0.00 0.00 0.00 0.0%
All Other State Revenue All Other 8590 18,022,559.65 21,307,585.91 1,189,445.05 21,307,585.91 0.00 0.0%
TOTAL, OTHER STATE REVENUE 54,950,546.61 59,407,888.89 8,142,948.60 59,407,888.89 0.00 0.0%
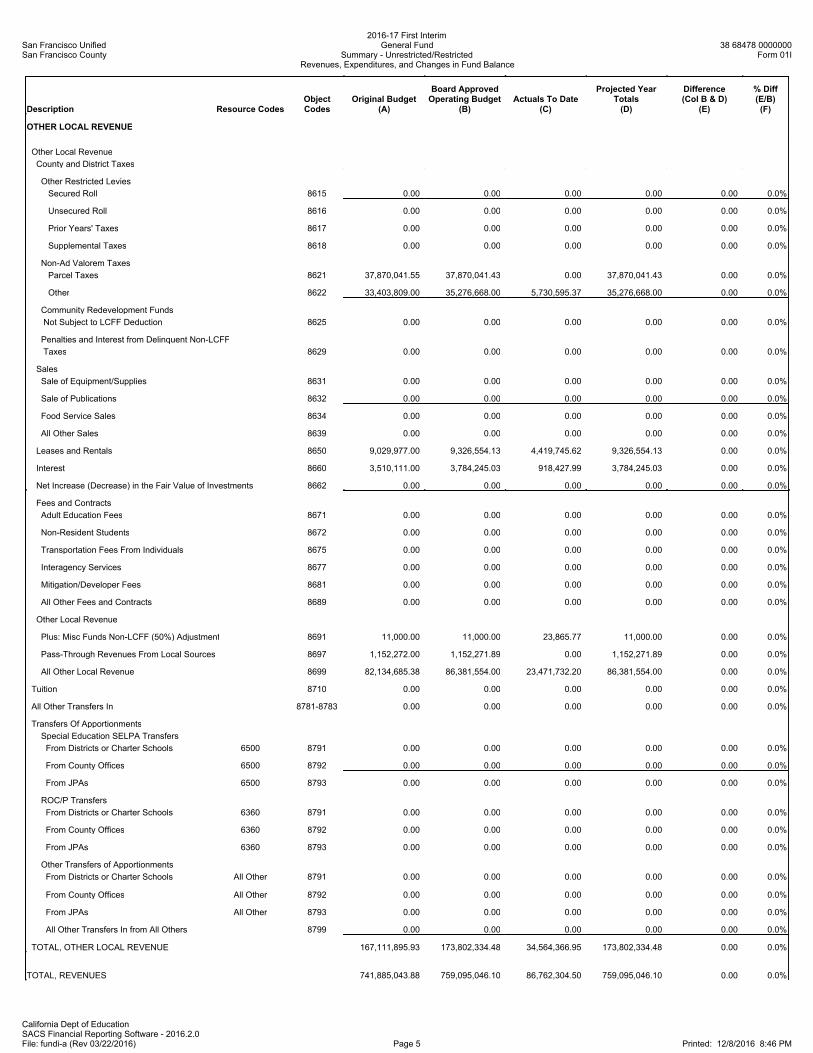
San Francisco UnifiedSan Francisco County
2016-17 First InterimGeneral Fund
Summary - Unrestricted/RestrictedRevenues, Expenditures, and Changes in Fund Balance
38 68478 0000000Form 01I
California Dept of EducationSACS Financial Reporting Software - 2016.2.0File: fundi-a (Rev 03/22/2016) Page 5 Printed: 12/8/2016 8:46 PM
Description Resource CodesObjectCodes
Original Budget(A)
Board ApprovedOperating Budget
(B)Actuals To Date
(C)
Projected YearTotals(D)
Difference(Col B & D)
(E)
% Diff(E/B)(F)
OTHER LOCAL REVENUE
Other Local Revenue
County and District Taxes
Other Restricted Levies
Secured Roll 8615 0.00 0.00 0.00 0.00 0.00 0.0%
Unsecured Roll 8616 0.00 0.00 0.00 0.00 0.00 0.0%
Prior Years' Taxes 8617 0.00 0.00 0.00 0.00 0.00 0.0%
Supplemental Taxes 8618 0.00 0.00 0.00 0.00 0.00 0.0%
Non-Ad Valorem Taxes
Parcel Taxes 8621 37,870,041.55 37,870,041.43 0.00 37,870,041.43 0.00 0.0%
Other 8622 33,403,809.00 35,276,668.00 5,730,595.37 35,276,668.00 0.00 0.0%
Community Redevelopment Funds
Not Subject to LCFF Deduction 8625 0.00 0.00 0.00 0.00 0.00 0.0%
Penalties and Interest from Delinquent Non-LCFF
Taxes 8629 0.00 0.00 0.00 0.00 0.00 0.0%
Sales
Sale of Equipment/Supplies 8631 0.00 0.00 0.00 0.00 0.00 0.0%
Sale of Publications 8632 0.00 0.00 0.00 0.00 0.00 0.0%
Food Service Sales 8634 0.00 0.00 0.00 0.00 0.00 0.0%
All Other Sales 8639 0.00 0.00 0.00 0.00 0.00 0.0%
Leases and Rentals 8650 9,029,977.00 9,326,554.13 4,419,745.62 9,326,554.13 0.00 0.0%
Interest 8660 3,510,111.00 3,784,245.03 918,427.99 3,784,245.03 0.00 0.0%
Net Increase (Decrease) in the Fair Value of Investments 8662 0.00 0.00 0.00 0.00 0.00 0.0%
Fees and Contracts
Adult Education Fees 8671 0.00 0.00 0.00 0.00 0.00 0.0%
Non-Resident Students 8672 0.00 0.00 0.00 0.00 0.00 0.0%
Transportation Fees From Individuals 8675 0.00 0.00 0.00 0.00 0.00 0.0%
Interagency Services 8677 0.00 0.00 0.00 0.00 0.00 0.0%
Mitigation/Developer Fees 8681 0.00 0.00 0.00 0.00 0.00 0.0%
All Other Fees and Contracts 8689 0.00 0.00 0.00 0.00 0.00 0.0%
Other Local Revenue
Plus: Misc Funds Non-LCFF (50%) Adjustment 8691 11,000.00 11,000.00 23,865.77 11,000.00 0.00 0.0%
Pass-Through Revenues From Local Sources 8697 1,152,272.00 1,152,271.89 0.00 1,152,271.89 0.00 0.0%
All Other Local Revenue 8699 82,134,685.38 86,381,554.00 23,471,732.20 86,381,554.00 0.00 0.0%
Tuition 8710 0.00 0.00 0.00 0.00 0.00 0.0%
All Other Transfers In 8781-8783 0.00 0.00 0.00 0.00 0.00 0.0%
Transfers Of Apportionments
Special Education SELPA Transfers
From Districts or Charter Schools 6500 8791 0.00 0.00 0.00 0.00 0.00 0.0%
From County Offices 6500 8792 0.00 0.00 0.00 0.00 0.00 0.0%
From JPAs 6500 8793 0.00 0.00 0.00 0.00 0.00 0.0%
ROC/P Transfers
From Districts or Charter Schools 6360 8791 0.00 0.00 0.00 0.00 0.00 0.0%
From County Offices 6360 8792 0.00 0.00 0.00 0.00 0.00 0.0%
From JPAs 6360 8793 0.00 0.00 0.00 0.00 0.00 0.0%
Other Transfers of Apportionments
From Districts or Charter Schools All Other 8791 0.00 0.00 0.00 0.00 0.00 0.0%0.00 0.00 0.00 0.00
From County Offices All Other 8792 0.00 0.00 0.00 0.00 0.00 0.0%
From JPAs All Other 8793 0.00 0.00 0.00 0.00 0.00 0.0%
All Other Transfers In from All Others 8799 0.00 0.00 0.00 0.00 0.00 0.0%
TOTAL, OTHER LOCAL REVENUE 167,111,895.93 173,802,334.48 34,564,366.95 173,802,334.48 0.00 0.0%
TOTAL, REVENUES 741,885,043.88 759,095,046.10 86,762,304.50 759,095,046.10 0.00 0.0%
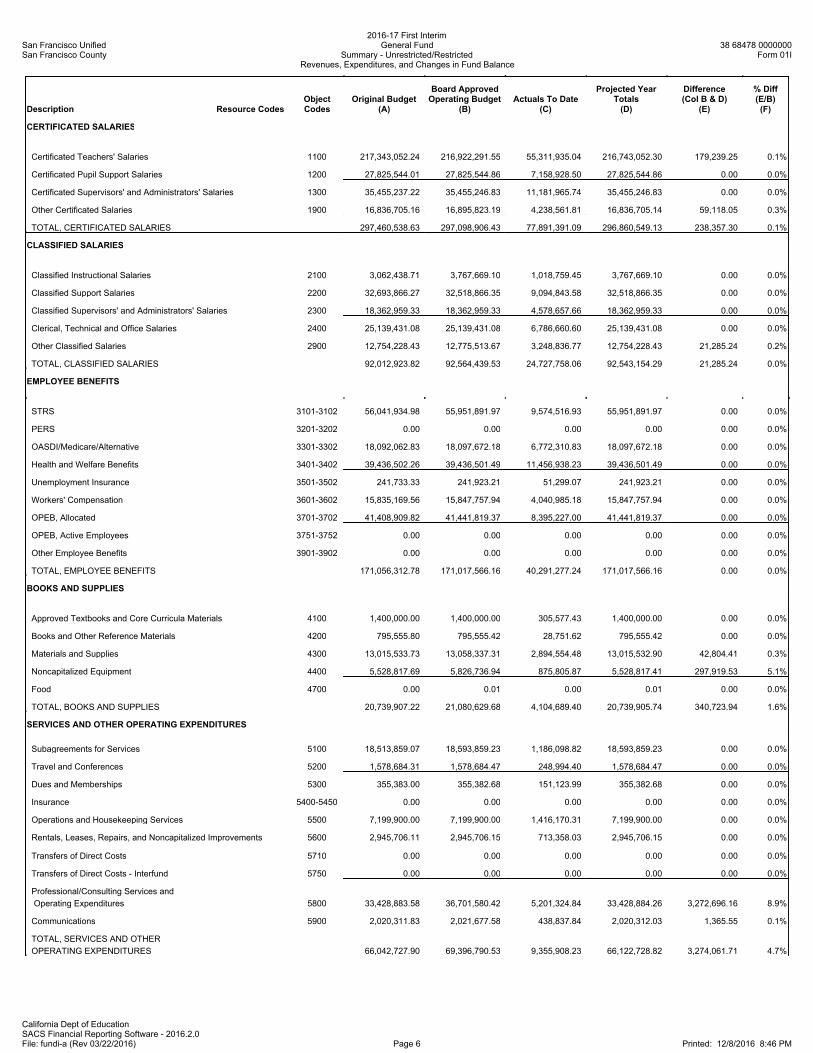
San Francisco UnifiedSan Francisco County
2016-17 First InterimGeneral Fund
Summary - Unrestricted/RestrictedRevenues, Expenditures, and Changes in Fund Balance
38 68478 0000000Form 01I
California Dept of EducationSACS Financial Reporting Software - 2016.2.0File: fundi-a (Rev 03/22/2016) Page 6 Printed: 12/8/2016 8:46 PM
Description Resource CodesObjectCodes
Original Budget(A)
Board ApprovedOperating Budget
(B)Actuals To Date
(C)
Projected YearTotals(D)
Difference(Col B & D)
(E)
% Diff(E/B)(F)
CERTIFICATED SALARIES
Certificated Teachers' Salaries 1100 217,343,052.24 216,922,291.55 55,311,935.04 216,743,052.30 179,239.25 0.1%
Certificated Pupil Support Salaries 1200 27,825,544.01 27,825,544.86 7,158,928.50 27,825,544.86 0.00 0.0%
Certificated Supervisors' and Administrators' Salaries 1300 35,455,237.22 35,455,246.83 11,181,965.74 35,455,246.83 0.00 0.0%
Other Certificated Salaries 1900 16,836,705.16 16,895,823.19 4,238,561.81 16,836,705.14 59,118.05 0.3%
TOTAL, CERTIFICATED SALARIES 297,460,538.63 297,098,906.43 77,891,391.09 296,860,549.13 238,357.30 0.1%
CLASSIFIED SALARIES
Classified Instructional Salaries 2100 3,062,438.71 3,767,669.10 1,018,759.45 3,767,669.10 0.00 0.0%
Classified Support Salaries 2200 32,693,866.27 32,518,866.35 9,094,843.58 32,518,866.35 0.00 0.0%
Classified Supervisors' and Administrators' Salaries 2300 18,362,959.33 18,362,959.33 4,578,657.66 18,362,959.33 0.00 0.0%
Clerical, Technical and Office Salaries 2400 25,139,431.08 25,139,431.08 6,786,660.60 25,139,431.08 0.00 0.0%
Other Classified Salaries 2900 12,754,228.43 12,775,513.67 3,248,836.77 12,754,228.43 21,285.24 0.2%
TOTAL, CLASSIFIED SALARIES 92,012,923.82 92,564,439.53 24,727,758.06 92,543,154.29 21,285.24 0.0%
EMPLOYEE BENEFITS
STRS 3101-3102 56,041,934.98 55,951,891.97 9,574,516.93 55,951,891.97 0.00 0.0%
PERS 3201-3202 0.00 0.00 0.00 0.00 0.00 0.0%
OASDI/Medicare/Alternative 3301-3302 18,092,062.83 18,097,672.18 6,772,310.83 18,097,672.18 0.00 0.0%
Health and Welfare Benefits 3401-3402 39,436,502.26 39,436,501.49 11,456,938.23 39,436,501.49 0.00 0.0%
Unemployment Insurance 3501-3502 241,733.33 241,923.21 51,299.07 241,923.21 0.00 0.0%
Workers' Compensation 3601-3602 15,835,169.56 15,847,757.94 4,040,985.18 15,847,757.94 0.00 0.0%
OPEB, Allocated 3701-3702 41,408,909.82 41,441,819.37 8,395,227.00 41,441,819.37 0.00 0.0%
OPEB, Active Employees 3751-3752 0.00 0.00 0.00 0.00 0.00 0.0%
Other Employee Benefits 3901-3902 0.00 0.00 0.00 0.00 0.00 0.0%
TOTAL, EMPLOYEE BENEFITS 171,056,312.78 171,017,566.16 40,291,277.24 171,017,566.16 0.00 0.0%
BOOKS AND SUPPLIES
Approved Textbooks and Core Curricula Materials 4100 1,400,000.00 1,400,000.00 305,577.43 1,400,000.00 0.00 0.0%
Books and Other Reference Materials 4200 795,555.80 795,555.42 28,751.62 795,555.42 0.00 0.0%
Materials and Supplies 4300 13,015,533.73 13,058,337.31 2,894,554.48 13,015,532.90 42,804.41 0.3%
Noncapitalized Equipment 4400 5,528,817.69 5,826,736.94 875,805.87 5,528,817.41 297,919.53 5.1%
Food 4700 0.00 0.01 0.00 0.01 0.00 0.0%
TOTAL, BOOKS AND SUPPLIES 20,739,907.22 21,080,629.68 4,104,689.40 20,739,905.74 340,723.94 1.6%
SERVICES AND OTHER OPERATING EXPENDITURES
Subagreements for Services 5100 18,513,859.07 18,593,859.23 1,186,098.82 18,593,859.23 0.00 0.0%
Travel and Conferences 5200 1,578,684.31 1,578,684.47 248,994.40 1,578,684.47 0.00 0.0%
Dues and Memberships 5300 355,383.00 355,382.68 151,123.99 355,382.68 0.00 0.0%
Insurance 5400-5450 0.00 0.00 0.00 0.00 0.00 0.0%
Operations and Housekeeping Services 5500 7,199,900.00 7,199,900.00 1,416,170.31 7,199,900.00 0.00 0.0%
Rentals, Leases, Repairs, and Noncapitalized Improvements 5600 2,945,706.11 2,945,706.15 713,358.03 2,945,706.15 0.00 0.0%0.00 0.00 0.00 0.0%
Transfers of Direct Costs 5710 0.00 0.00 0.00 0.00 0.00 0.0%
Transfers of Direct Costs - Interfund 5750 0.00 0.00 0.00 0.00 0.00 0.0%
Professional/Consulting Services and
Operating Expenditures 5800 33,428,883.58 36,701,580.42 5,201,324.84 33,428,884.26 3,272,696.16 8.9%
Communications 5900 2,020,311.83 2,021,677.58 438,837.84 2,020,312.03 1,365.55 0.1%
TOTAL, SERVICES AND OTHER
OPERATING EXPENDITURES 66,042,727.90 69,396,790.53 9,355,908.23 66,122,728.82 3,274,061.71 4.7%
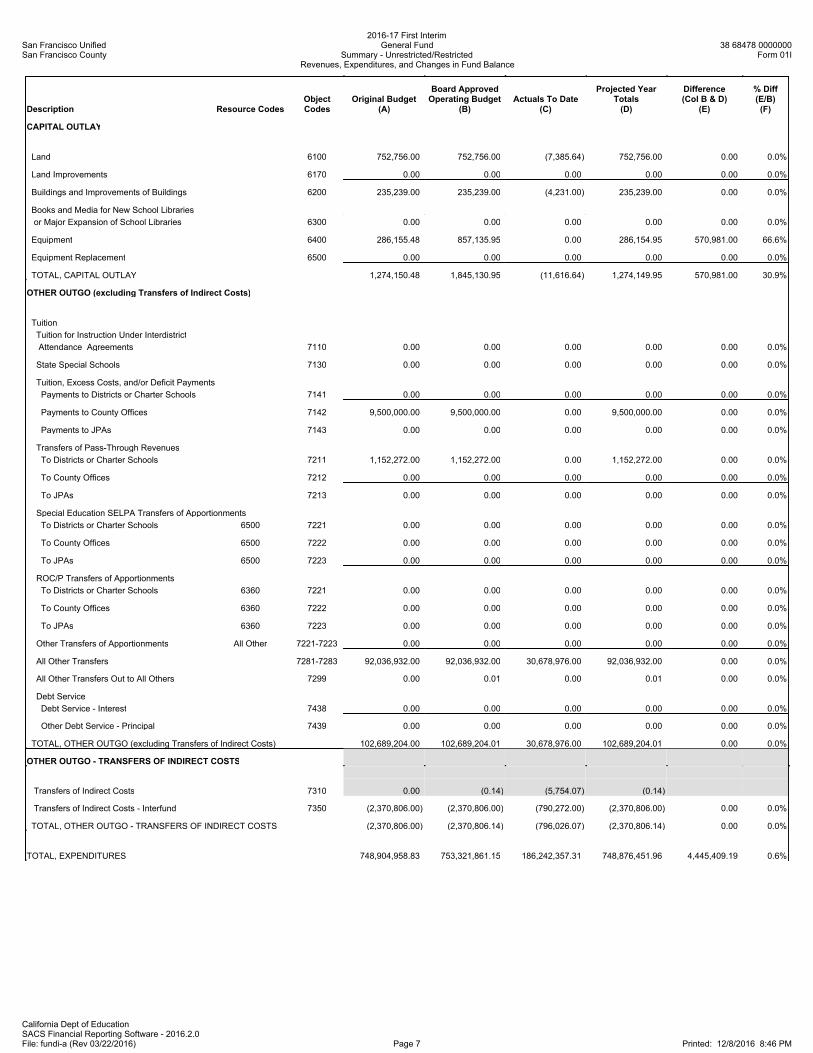
San Francisco UnifiedSan Francisco County
2016-17 First InterimGeneral Fund
Summary - Unrestricted/RestrictedRevenues, Expenditures, and Changes in Fund Balance
38 68478 0000000Form 01I
California Dept of EducationSACS Financial Reporting Software - 2016.2.0File: fundi-a (Rev 03/22/2016) Page 7 Printed: 12/8/2016 8:46 PM
Description Resource CodesObjectCodes
Original Budget(A)
Board ApprovedOperating Budget
(B)Actuals To Date
(C)
Projected YearTotals(D)
Difference(Col B & D)
(E)
% Diff(E/B)(F)
CAPITAL OUTLAY
Land 6100 752,756.00 752,756.00 (7,385.64) 752,756.00 0.00 0.0%
Land Improvements 6170 0.00 0.00 0.00 0.00 0.00 0.0%
Buildings and Improvements of Buildings 6200 235,239.00 235,239.00 (4,231.00) 235,239.00 0.00 0.0%
Books and Media for New School Libraries
or Major Expansion of School Libraries 6300 0.00 0.00 0.00 0.00 0.00 0.0%
Equipment 6400 286,155.48 857,135.95 0.00 286,154.95 570,981.00 66.6%
Equipment Replacement 6500 0.00 0.00 0.00 0.00 0.00 0.0%
TOTAL, CAPITAL OUTLAY 1,274,150.48 1,845,130.95 (11,616.64) 1,274,149.95 570,981.00 30.9%
OTHER OUTGO (excluding Transfers of Indirect Costs)
Tuition
Tuition for Instruction Under Interdistrict
Attendance Agreements 7110 0.00 0.00 0.00 0.00 0.00 0.0%
State Special Schools 7130 0.00 0.00 0.00 0.00 0.00 0.0%
Tuition, Excess Costs, and/or Deficit Payments
Payments to Districts or Charter Schools 7141 0.00 0.00 0.00 0.00 0.00 0.0%
Payments to County Offices 7142 9,500,000.00 9,500,000.00 0.00 9,500,000.00 0.00 0.0%
Payments to JPAs 7143 0.00 0.00 0.00 0.00 0.00 0.0%
Transfers of Pass-Through Revenues
To Districts or Charter Schools 7211 1,152,272.00 1,152,272.00 0.00 1,152,272.00 0.00 0.0%
To County Offices 7212 0.00 0.00 0.00 0.00 0.00 0.0%
To JPAs 7213 0.00 0.00 0.00 0.00 0.00 0.0%
Special Education SELPA Transfers of Apportionments
To Districts or Charter Schools 6500 7221 0.00 0.00 0.00 0.00 0.00 0.0%
To County Offices 6500 7222 0.00 0.00 0.00 0.00 0.00 0.0%
To JPAs 6500 7223 0.00 0.00 0.00 0.00 0.00 0.0%
ROC/P Transfers of Apportionments
To Districts or Charter Schools 6360 7221 0.00 0.00 0.00 0.00 0.00 0.0%
To County Offices 6360 7222 0.00 0.00 0.00 0.00 0.00 0.0%
To JPAs 6360 7223 0.00 0.00 0.00 0.00 0.00 0.0%
Other Transfers of Apportionments All Other 7221-7223 0.00 0.00 0.00 0.00 0.00 0.0%
All Other Transfers 7281-7283 92,036,932.00 92,036,932.00 30,678,976.00 92,036,932.00 0.00 0.0%
All Other Transfers Out to All Others 7299 0.00 0.01 0.00 0.01 0.00 0.0%
Debt Service
Debt Service - Interest 7438 0.00 0.00 0.00 0.00 0.00 0.0%
Other Debt Service - Principal 7439 0.00 0.00 0.00 0.00 0.00 0.0%
TOTAL, OTHER OUTGO (excluding Transfers of Indirect Costs) 102,689,204.00 102,689,204.01 30,678,976.00 102,689,204.01 0.00 0.0%
OTHER OUTGO - TRANSFERS OF INDIRECT COSTS
Transfers of Indirect Costs 7310 0.00 (0.14) (5,754.07) (0.14)
Transfers of Indirect Costs - Interfund 7350 (2,370,806.00) (2,370,806.00) (790,272.00) (2,370,806.00) 0.00 0.0%
TOTAL, OTHER OUTGO - TRANSFERS OF INDIRECT COSTS (2,370,806.00) (2,370,806.14) (796,026.07) (2,370,806.14) 0.00 0.0%
TOTAL, EXPENDITURES 748,904,958.83 753,321,861.15 186,242,357.31 748,876,451.96 4,445,409.19 0.6%
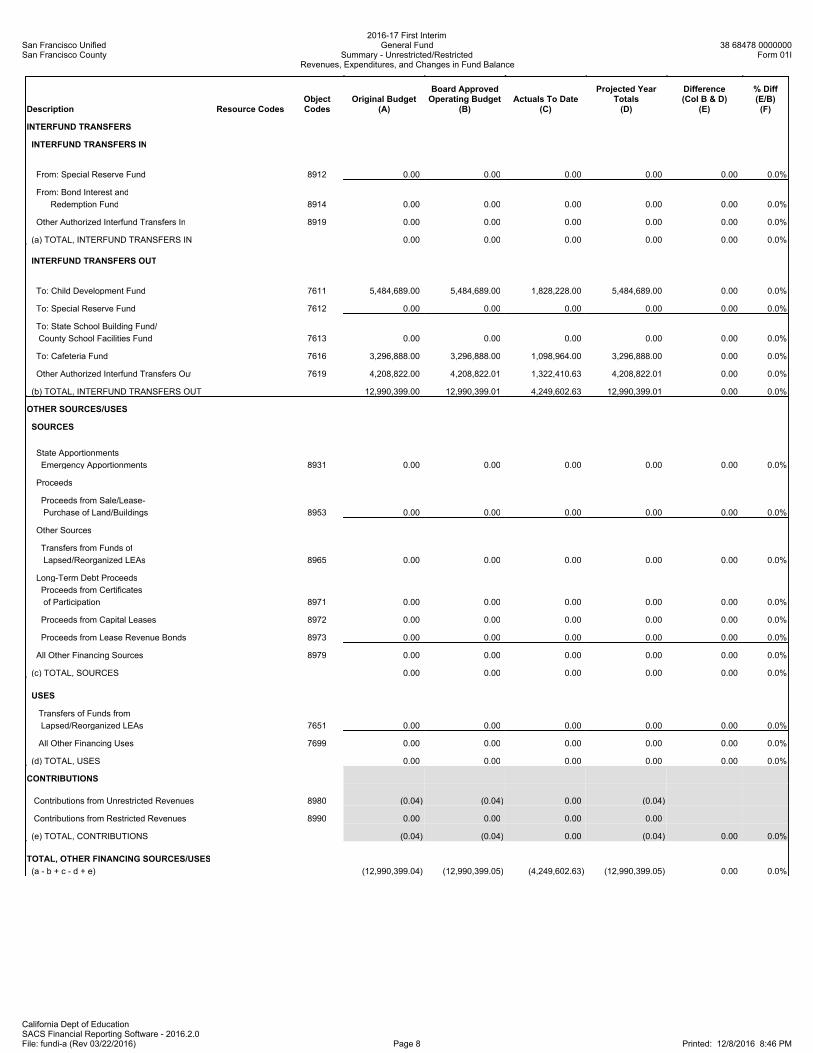
San Francisco UnifiedSan Francisco County
2016-17 First InterimGeneral Fund
Summary - Unrestricted/RestrictedRevenues, Expenditures, and Changes in Fund Balance
38 68478 0000000Form 01I
California Dept of EducationSACS Financial Reporting Software - 2016.2.0File: fundi-a (Rev 03/22/2016) Page 8 Printed: 12/8/2016 8:46 PM
Description Resource CodesObjectCodes
Original Budget(A)
Board ApprovedOperating Budget
(B)Actuals To Date
(C)
Projected YearTotals(D)
Difference(Col B & D)
(E)
% Diff(E/B)(F)
INTERFUND TRANSFERS
INTERFUND TRANSFERS IN
From: Special Reserve Fund 8912 0.00 0.00 0.00 0.00 0.00 0.0%
From: Bond Interest and
Redemption Fund 8914 0.00 0.00 0.00 0.00 0.00 0.0%
Other Authorized Interfund Transfers In 8919 0.00 0.00 0.00 0.00 0.00 0.0%
(a) TOTAL, INTERFUND TRANSFERS IN 0.00 0.00 0.00 0.00 0.00 0.0%
INTERFUND TRANSFERS OUT
To: Child Development Fund 7611 5,484,689.00 5,484,689.00 1,828,228.00 5,484,689.00 0.00 0.0%
To: Special Reserve Fund 7612 0.00 0.00 0.00 0.00 0.00 0.0%
To: State School Building Fund/
County School Facilities Fund 7613 0.00 0.00 0.00 0.00 0.00 0.0%
To: Cafeteria Fund 7616 3,296,888.00 3,296,888.00 1,098,964.00 3,296,888.00 0.00 0.0%
Other Authorized Interfund Transfers Out 7619 4,208,822.00 4,208,822.01 1,322,410.63 4,208,822.01 0.00 0.0%
(b) TOTAL, INTERFUND TRANSFERS OUT 12,990,399.00 12,990,399.01 4,249,602.63 12,990,399.01 0.00 0.0%
OTHER SOURCES/USES
SOURCES
State Apportionments
Emergency Apportionments 8931 0.00 0.00 0.00 0.00 0.00 0.0%
Proceeds
Proceeds from Sale/Lease-
Purchase of Land/Buildings 8953 0.00 0.00 0.00 0.00 0.00 0.0%
Other Sources
Transfers from Funds of
Lapsed/Reorganized LEAs 8965 0.00 0.00 0.00 0.00 0.00 0.0%
Long-Term Debt Proceeds
Proceeds from Certificates
of Participation 8971 0.00 0.00 0.00 0.00 0.00 0.0%
Proceeds from Capital Leases 8972 0.00 0.00 0.00 0.00 0.00 0.0%
Proceeds from Lease Revenue Bonds 8973 0.00 0.00 0.00 0.00 0.00 0.0%
All Other Financing Sources 8979 0.00 0.00 0.00 0.00 0.00 0.0%
(c) TOTAL, SOURCES 0.00 0.00 0.00 0.00 0.00 0.0%
USES
Transfers of Funds from
Lapsed/Reorganized LEAs 7651 0.00 0.00 0.00 0.00 0.00 0.0%
All Other Financing Uses 7699 0.00 0.00 0.00 0.00 0.00 0.0%
(d) TOTAL, USES 0.00 0.00 0.00 0.00 0.00 0.0%
CONTRIBUTIONS
Contributions from Unrestricted Revenues 8980 (0.04) (0.04) 0.00 (0.04)
Contributions from Restricted Revenues 8990 0.00 0.00 0.00 0.00
(e) TOTAL, CONTRIBUTIONS (0.04) (0.04) 0.00 (0.04) 0.00 0.0%
TOTAL, OTHER FINANCING SOURCES/USES
(a - b + c - d + e) (12,990,399.04) (12,990,399.05) (4,249,602.63) (12,990,399.05) 0.00 0.0%
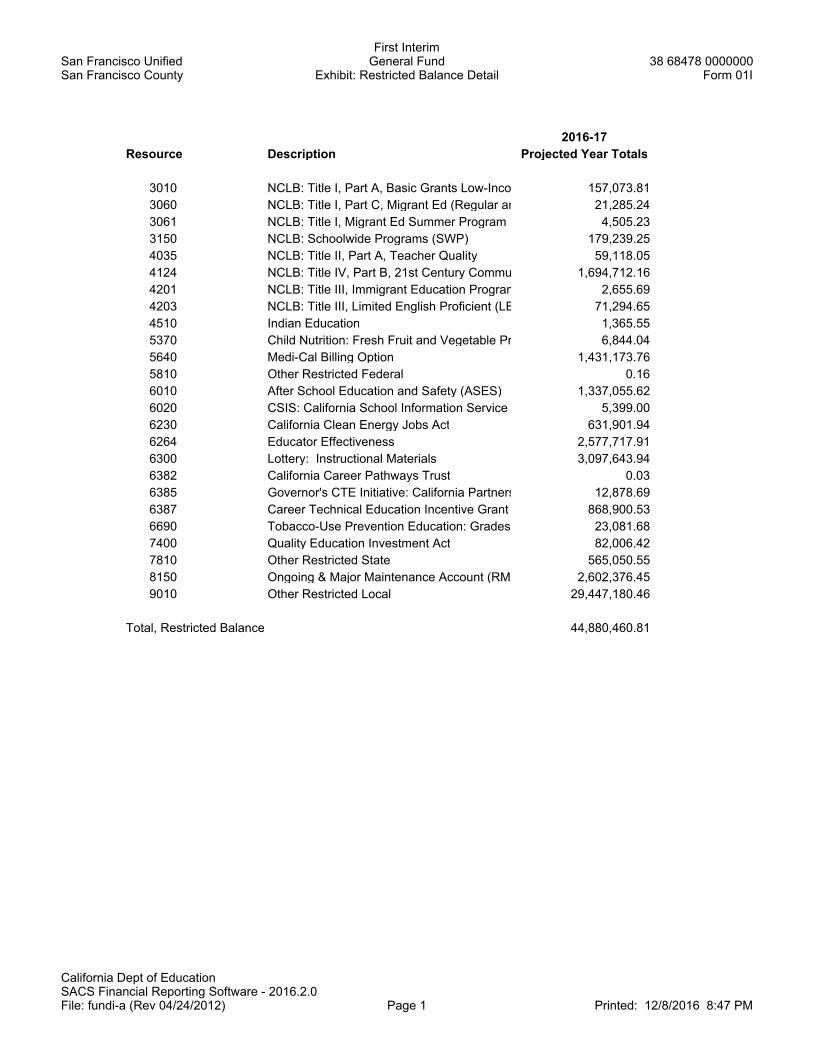
San Francisco UnifiedSan Francisco County
First InterimGeneral Fund
Exhibit: Restricted Balance Detail38 68478 0000000
Form 01I
California Dept of EducationSACS Financial Reporting Software - 2016.2.0File: fundi-a (Rev 04/24/2012) Page 1 Printed: 12/8/2016 8:47 PM
2016-17
Resource Description Projected Year Totals
3010 NCLB: Title I, Part A, Basic Grants Low-Income and Neglected157,073.81
3060 NCLB: Title I, Part C, Migrant Ed (Regular and Summer Program)21,285.24
3061 NCLB: Title I, Migrant Ed Summer Program 4,505.23
3150 NCLB: Schoolwide Programs (SWP) 179,239.25
4035 NCLB: Title II, Part A, Teacher Quality 59,118.05
4124 NCLB: Title IV, Part B, 21st Century Community Learning Centers Program1,694,712.16
4201 NCLB: Title III, Immigrant Education Program 2,655.69
4203 NCLB: Title III, Limited English Proficient (LEP) Student Program71,294.65
4510 Indian Education 1,365.55
5370 Child Nutrition: Fresh Fruit and Vegetable Program 6,844.04
5640 Medi-Cal Billing Option 1,431,173.76
5810 Other Restricted Federal 0.16
6010 After School Education and Safety (ASES) 1,337,055.62
6020 CSIS: California School Information Service (13-14) 5,399.00
6230 California Clean Energy Jobs Act 631,901.94
6264 Educator Effectiveness 2,577,717.91
6300 Lottery: Instructional Materials 3,097,643.94
6382 California Career Pathways Trust 0.03
6385 Governor's CTE Initiative: California Partnership Academies12,878.69
6387 Career Technical Education Incentive Grant Program 868,900.53
6690 Tobacco-Use Prevention Education: Grades Six Through Twelve23,081.68
7400 Quality Education Investment Act 82,006.42
7810 Other Restricted State 565,050.55
8150 Ongoing & Major Maintenance Account (RMA: Education Code Section 17070.75)2,602,376.45
9010 Other Restricted Local 29,447,180.46
Total, Restricted Balance 44,880,460.81

This Page Is Intentionally Left Blank
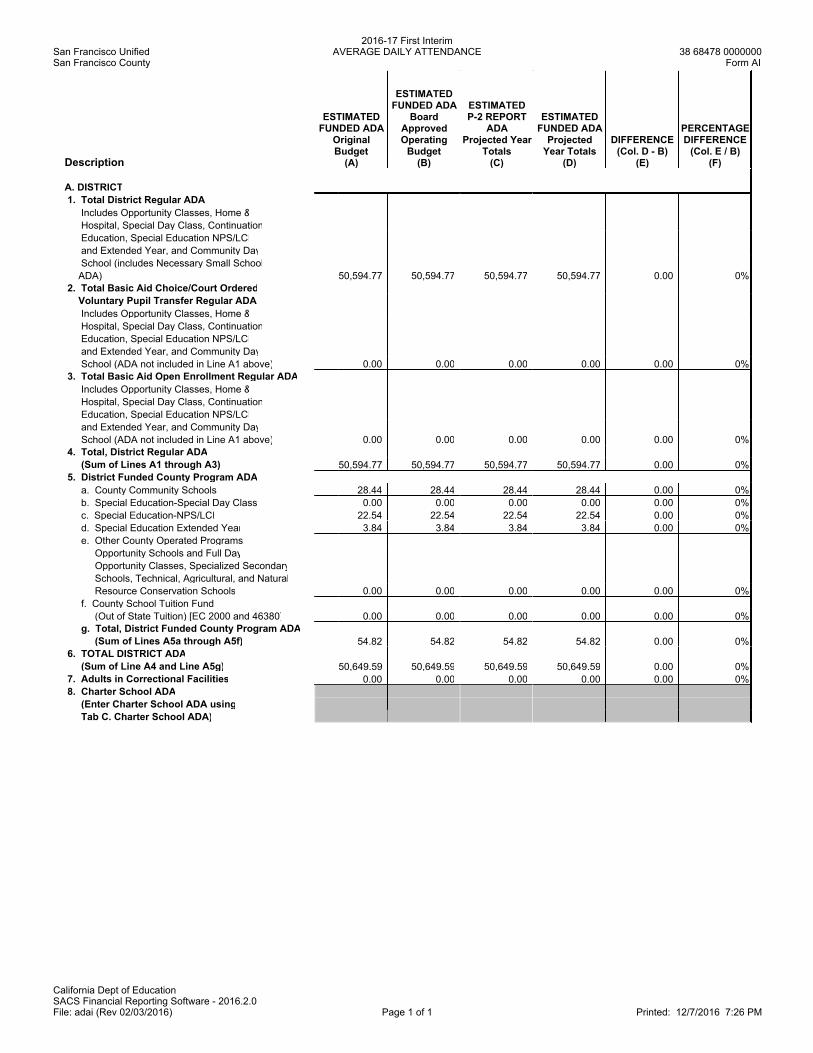
San Francisco UnifiedSan Francisco County
2016-17 First InterimAVERAGE DAILY ATTENDANCE 38 68478 0000000
Form AI
California Dept of EducationSACS Financial Reporting Software - 2016.2.0File: adai (Rev 02/03/2016) Page 1 of 1 Printed: 12/7/2016 7:26 PM
Description
ESTIMATEDFUNDED ADA
OriginalBudget
(A)
ESTIMATEDFUNDED ADA
BoardApprovedOperatingBudget
(B)
ESTIMATEDP-2 REPORT
ADAProjected Year
Totals(C)
ESTIMATEDFUNDED ADA
ProjectedYear Totals
(D)
DIFFERENCE(Col. D - B)
(E)
PERCENTAGEDIFFERENCE
(Col. E / B)(F)
A. DISTRICT
1. Total District Regular ADA
Includes Opportunity Classes, Home &
Hospital, Special Day Class, Continuation
Education, Special Education NPS/LCI
and Extended Year, and Community Day
School (includes Necessary Small School
ADA) 50,594.77 50,594.77 50,594.77 50,594.77 0.00 0%
2. Total Basic Aid Choice/Court Ordered
Voluntary Pupil Transfer Regular ADA
Includes Opportunity Classes, Home &
Hospital, Special Day Class, Continuation
Education, Special Education NPS/LCI
and Extended Year, and Community Day
School (ADA not included in Line A1 above) 0.00 0.00 0.00 0.00 0.00 0%
3. Total Basic Aid Open Enrollment Regular ADA
Includes Opportunity Classes, Home &
Hospital, Special Day Class, Continuation
Education, Special Education NPS/LCI
and Extended Year, and Community Day
School (ADA not included in Line A1 above) 0.00 0.00 0.00 0.00 0.00 0%
4. Total, District Regular ADA
(Sum of Lines A1 through A3) 50,594.77 50,594.77 50,594.77 50,594.77 0.00 0%
5. District Funded County Program ADA
a. County Community Schools 28.44 28.44 28.44 28.44 0.00 0%
b. Special Education-Special Day Class 0.00 0.00 0.00 0.00 0.00 0%
c. Special Education-NPS/LCI 22.54 22.54 22.54 22.54 0.00 0%
d. Special Education Extended Year 3.84 3.84 3.84 3.84 0.00 0%
e. Other County Operated Programs:
Opportunity Schools and Full Day
Opportunity Classes, Specialized Secondary
Schools, Technical, Agricultural, and Natural
Resource Conservation Schools 0.00 0.00 0.00 0.00 0.00 0%
f. County School Tuition Fund
(Out of State Tuition) [EC 2000 and 46380] 0.00 0.00 0.00 0.00 0.00 0%
g. Total, District Funded County Program ADA
(Sum of Lines A5a through A5f) 54.82 54.82 54.82 54.82 0.00 0%
6. TOTAL DISTRICT ADA
(Sum of Line A4 and Line A5g) 50,649.59 50,649.59 50,649.59 50,649.59 0.00 0%
7. Adults in Correctional Facilities 0.00 0.00 0.00 0.00 0.00 0%
8. Charter School ADA
(Enter Charter School ADA using
Tab C. Charter School ADA)
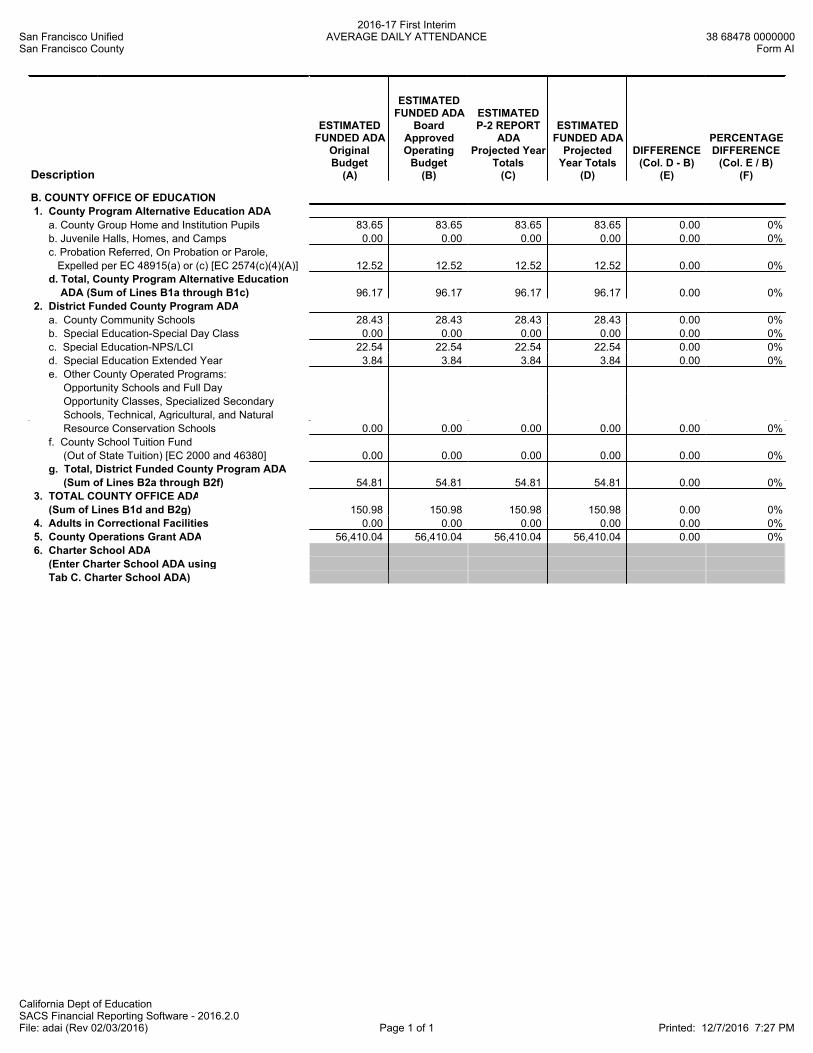
San Francisco UnifiedSan Francisco County
2016-17 First InterimAVERAGE DAILY ATTENDANCE 38 68478 0000000
Form AI
California Dept of EducationSACS Financial Reporting Software - 2016.2.0File: adai (Rev 02/03/2016) Page 1 of 1 Printed: 12/7/2016 7:27 PM
Description
ESTIMATEDFUNDED ADA
OriginalBudget
(A)
ESTIMATEDFUNDED ADA
BoardApprovedOperatingBudget
(B)
ESTIMATEDP-2 REPORT
ADAProjected Year
Totals(C)
ESTIMATEDFUNDED ADA
ProjectedYear Totals
(D)
DIFFERENCE(Col. D - B)
(E)
PERCENTAGEDIFFERENCE(Col. E / B)
(F)
B. COUNTY OFFICE OF EDUCATION
1. County Program Alternative Education ADA
a. County Group Home and Institution Pupils 83.65 83.65 83.65 83.65 0.00 0%
b. Juvenile Halls, Homes, and Camps 0.00 0.00 0.00 0.00 0.00 0%
c. Probation Referred, On Probation or Parole,
Expelled per EC 48915(a) or (c) [EC 2574(c)(4)(A)] 12.52 12.52 12.52 12.52 0.00 0%
d. Total, County Program Alternative Education
ADA (Sum of Lines B1a through B1c) 96.17 96.17 96.17 96.17 0.00 0%
2. District Funded County Program ADA
a. County Community Schools 28.43 28.43 28.43 28.43 0.00 0%
b. Special Education-Special Day Class 0.00 0.00 0.00 0.00 0.00 0%
c. Special Education-NPS/LCI 22.54 22.54 22.54 22.54 0.00 0%
d. Special Education Extended Year 3.84 3.84 3.84 3.84 0.00 0%
e. Other County Operated Programs:
Opportunity Schools and Full Day
Opportunity Classes, Specialized Secondary
Schools, Technical, Agricultural, and Natural
Resource Conservation Schools 0.00 0.00 0.00 0.00 0.00 0%
f. County School Tuition Fund
(Out of State Tuition) [EC 2000 and 46380] 0.00 0.00 0.00 0.00 0.00 0%
g. Total, District Funded County Program ADA
(Sum of Lines B2a through B2f) 54.81 54.81 54.81 54.81 0.00 0%
3. TOTAL COUNTY OFFICE ADA
(Sum of Lines B1d and B2g) 150.98 150.98 150.98 150.98 0.00 0%
4. Adults in Correctional Facilities 0.00 0.00 0.00 0.00 0.00 0%
5. County Operations Grant ADA 56,410.04 56,410.04 56,410.04 56,410.04 0.00 0%
6. Charter School ADA
(Enter Charter School ADA using
Tab C. Charter School ADA)
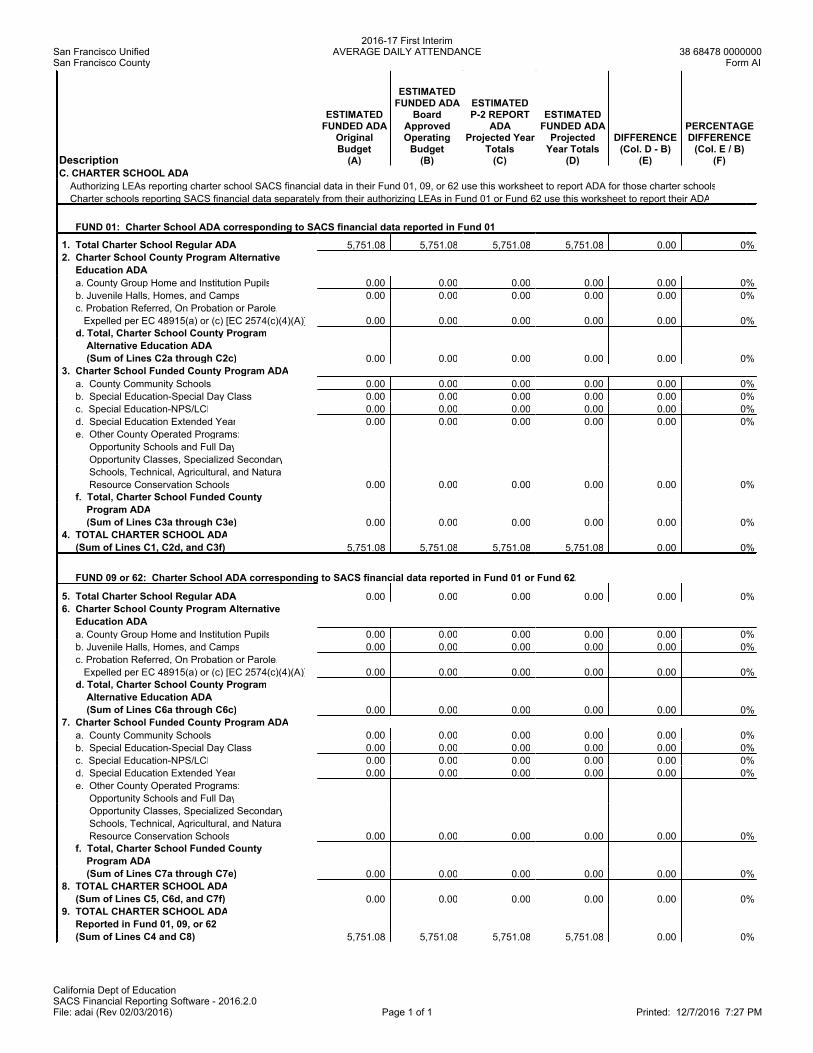
San Francisco UnifiedSan Francisco County
2016-17 First InterimAVERAGE DAILY ATTENDANCE 38 68478 0000000
Form AI
California Dept of EducationSACS Financial Reporting Software - 2016.2.0File: adai (Rev 02/03/2016) Page 1 of 1 Printed: 12/7/2016 7:27 PM
Description
ESTIMATEDFUNDED ADA
OriginalBudget
(A)
ESTIMATEDFUNDED ADA
BoardApprovedOperatingBudget
(B)
ESTIMATEDP-2 REPORT
ADAProjected Year
Totals(C)
ESTIMATEDFUNDED ADA
ProjectedYear Totals
(D)
DIFFERENCE(Col. D - B)
(E)
PERCENTAGEDIFFERENCE(Col. E / B)
(F)
C. CHARTER SCHOOL ADA
Authorizing LEAs reporting charter school SACS financial data in their Fund 01, 09, or 62 use this worksheet to report ADA for those charter schools. Authorizing LEAs reporting charter school SACS financial data in their Fund 01, 09, or 62 use this worksheet to report ADA for those charter schools.
Charter schools reporting SACS financial data separately from their authorizing LEAs in Fund 01 or Fund 62 use this worksheet to report their ADA. Charter schools reporting SACS financial data separately from their authorizing LEAs in Fund 01 or Fund 62 use this worksheet to report their ADA.
FUND 01: Charter School ADA corresponding to SACS financial data reported in Fund 01. FUND 01: Charter School ADA corresponding to SACS financial data reported in Fund 01.
1. Total Charter School Regular ADA 5,751.08 5,751.08 5,751.08 5,751.08 0.00 0%
2. Charter School County Program Alternative
Education ADA
a. County Group Home and Institution Pupils 0.00 0.00 0.00 0.00 0.00 0%
b. Juvenile Halls, Homes, and Camps 0.00 0.00 0.00 0.00 0.00 0%
c. Probation Referred, On Probation or Parole,
Expelled per EC 48915(a) or (c) [EC 2574(c)(4)(A)] 0.00 0.00 0.00 0.00 0.00 0%
d. Total, Charter School County Program
Alternative Education ADA
(Sum of Lines C2a through C2c) 0.00 0.00 0.00 0.00 0.00 0%
3. Charter School Funded County Program ADA
a. County Community Schools 0.00 0.00 0.00 0.00 0.00 0%
b. Special Education-Special Day Class 0.00 0.00 0.00 0.00 0.00 0%
c. Special Education-NPS/LCI 0.00 0.00 0.00 0.00 0.00 0%
d. Special Education Extended Year 0.00 0.00 0.00 0.00 0.00 0%
e. Other County Operated Programs:
Opportunity Schools and Full Day
Opportunity Classes, Specialized Secondary
Schools, Technical, Agricultural, and Natural
Resource Conservation Schools 0.00 0.00 0.00 0.00 0.00 0%
f. Total, Charter School Funded County
Program ADA
(Sum of Lines C3a through C3e) 0.00 0.00 0.00 0.00 0.00 0%
4. TOTAL CHARTER SCHOOL ADA
(Sum of Lines C1, C2d, and C3f) 5,751.08 5,751.08 5,751.08 5,751.08 0.00 0%
FUND 09 or 62: Charter School ADA corresponding to SACS financial data reported in Fund 01 or Fund 62.
5. Total Charter School Regular ADA 0.00 0.00 0.00 0.00 0.00 0%
6. Charter School County Program Alternative
Education ADA
a. County Group Home and Institution Pupils 0.00 0.00 0.00 0.00 0.00 0%
b. Juvenile Halls, Homes, and Camps 0.00 0.00 0.00 0.00 0.00 0%
c. Probation Referred, On Probation or Parole,
Expelled per EC 48915(a) or (c) [EC 2574(c)(4)(A)] 0.00 0.00 0.00 0.00 0.00 0%
d. Total, Charter School County Program
Alternative Education ADA
(Sum of Lines C6a through C6c) 0.00 0.00 0.00 0.00 0.00 0%
7. Charter School Funded County Program ADA
a. County Community Schools 0.00 0.00 0.00 0.00 0.00 0%
b. Special Education-Special Day Class 0.00 0.00 0.00 0.00 0.00 0%
c. Special Education-NPS/LCI 0.00 0.00 0.00 0.00 0.00 0%
d. Special Education Extended Year 0.00 0.00 0.00 0.00 0.00 0%
e. Other County Operated Programs:
Opportunity Schools and Full Day
Opportunity Classes, Specialized Secondary
Schools, Technical, Agricultural, and Natural
Resource Conservation Schools 0.00 0.00 0.00 0.00 0.00 0%
f. Total, Charter School Funded County
Program ADA
(Sum of Lines C7a through C7e) 0.00 0.00 0.00 0.00 0.00 0%
8. TOTAL CHARTER SCHOOL ADA
(Sum of Lines C5, C6d, and C7f) 0.00 0.00 0.00 0.00 0.00 0%
9. TOTAL CHARTER SCHOOL ADA
Reported in Fund 01, 09, or 62
(Sum of Lines C4 and C8) 5,751.08 5,751.08 5,751.08 5,751.08 0.00 0%

This Page Is Intentionally Left Blank
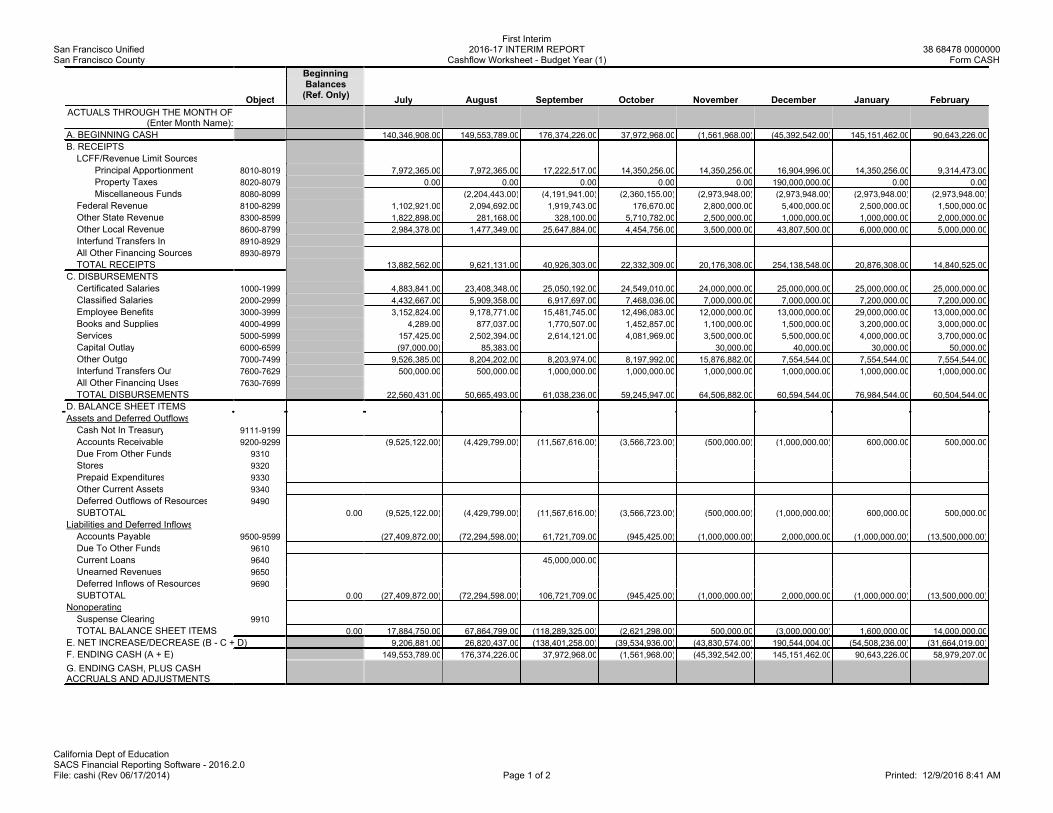
San Francisco UnifiedSan Francisco County
First Interim2016-17 INTERIM REPORT
Cashflow Worksheet - Budget Year (1)38 68478 0000000
Form CASH
California Dept of EducationSACS Financial Reporting Software - 2016.2.0File: cashi (Rev 06/17/2014) Page 1 of 2 Printed: 12/9/2016 8:41 AM
Beginning
Object
Balances(Ref. Only)
July August September October November December January February
ACTUALS THROUGH THE MONTH OF(Enter Month Name):
A. BEGINNING CASH 140,346,908.00 149,553,789.00 176,374,226.00 37,972,968.00 (1,561,968.00) (45,392,542.00) 145,151,462.00 90,643,226.00
B. RECEIPTS
LCFF/Revenue Limit Sources
Principal Apportionment 8010-8019 7,972,365.00 7,972,365.00 17,222,517.00 14,350,256.00 14,350,256.00 16,904,996.00 14,350,256.00 9,314,473.00
Property Taxes 8020-8079 0.00 0.00 0.00 0.00 0.00 190,000,000.00 0.00 0.00
Miscellaneous Funds 8080-8099 (2,204,443.00) (4,191,941.00) (2,360,155.00) (2,973,948.00) (2,973,948.00) (2,973,948.00) (2,973,948.00)
Federal Revenue 8100-8299 1,102,921.00 2,094,692.00 1,919,743.00 176,670.00 2,800,000.00 5,400,000.00 2,500,000.00 1,500,000.00
Other State Revenue 8300-8599 1,822,898.00 281,168.00 328,100.00 5,710,782.00 2,500,000.00 1,000,000.00 1,000,000.00 2,000,000.00
Other Local Revenue 8600-8799 2,984,378.00 1,477,349.00 25,647,884.00 4,454,756.00 3,500,000.00 43,807,500.00 6,000,000.00 5,000,000.00
Interfund Transfers In 8910-8929
All Other Financing Sources 8930-8979
TOTAL RECEIPTS 13,882,562.00 9,621,131.00 40,926,303.00 22,332,309.00 20,176,308.00 254,138,548.00 20,876,308.00 14,840,525.00
C. DISBURSEMENTS
Certificated Salaries 1000-1999 4,883,841.00 23,408,348.00 25,050,192.00 24,549,010.00 24,000,000.00 25,000,000.00 25,000,000.00 25,000,000.00
Classified Salaries 2000-2999 4,432,667.00 5,909,358.00 6,917,697.00 7,468,036.00 7,000,000.00 7,000,000.00 7,200,000.00 7,200,000.00
Employee Benefits 3000-3999 3,152,824.00 9,178,771.00 15,481,745.00 12,496,083.00 12,000,000.00 13,000,000.00 29,000,000.00 13,000,000.00
Books and Supplies 4000-4999 4,289.00 877,037.00 1,770,507.00 1,452,857.00 1,100,000.00 1,500,000.00 3,200,000.00 3,000,000.00
Services 5000-5999 157,425.00 2,502,394.00 2,614,121.00 4,081,969.00 3,500,000.00 5,500,000.00 4,000,000.00 3,700,000.00
Capital Outlay 6000-6599 (97,000.00) 85,383.00 30,000.00 40,000.00 30,000.00 50,000.00
Other Outgo 7000-7499 9,526,385.00 8,204,202.00 8,203,974.00 8,197,992.00 15,876,882.00 7,554,544.00 7,554,544.00 7,554,544.00
Interfund Transfers Out 7600-7629 500,000.00 500,000.00 1,000,000.00 1,000,000.00 1,000,000.00 1,000,000.00 1,000,000.00 1,000,000.00
All Other Financing Uses 7630-7699
TOTAL DISBURSEMENTS 22,560,431.00 50,665,493.00 61,038,236.00 59,245,947.00 64,506,882.00 60,594,544.00 76,984,544.00 60,504,544.00
D. BALANCE SHEET ITEMS
Assets and Deferred Outflows
Cash Not In Treasury 9111-9199
Accounts Receivable 9200-9299 (9,525,122.00) (4,429,799.00) (11,567,616.00) (3,566,723.00) (500,000.00) (1,000,000.00) 600,000.00 500,000.00
Due From Other Funds 9310
Stores 9320
Prepaid Expenditures 9330
Other Current Assets 9340
Deferred Outflows of Resources 9490
SUBTOTAL 0.00 (9,525,122.00) (4,429,799.00) (11,567,616.00) (3,566,723.00) (500,000.00) (1,000,000.00) 600,000.00 500,000.00
Liabilities and Deferred Inflows
Accounts Payable 9500-9599 (27,409,872.00) (72,294,598.00) 61,721,709.00 (945,425.00) (1,000,000.00) 2,000,000.00 (1,000,000.00) (13,500,000.00)
Due To Other Funds 9610
Current Loans 9640 45,000,000.00
Unearned Revenues 9650
Deferred Inflows of Resources 9690
SUBTOTAL 0.00 (27,409,872.00) (72,294,598.00) 106,721,709.00 (945,425.00) (1,000,000.00) 2,000,000.00 (1,000,000.00) (13,500,000.00)
Nonoperating
Suspense Clearing 9910
TOTAL BALANCE SHEET ITEMS 0.00 17,884,750.00 67,864,799.00 (118,289,325.00) (2,621,298.00) 500,000.00 (3,000,000.00) 1,600,000.00 14,000,000.00
E. NET INCREASE/DECREASE (B - C + D) 9,206,881.00 26,820,437.00 (138,401,258.00) (39,534,936.00) (43,830,574.00) 190,544,004.00 (54,508,236.00) (31,664,019.00)
F. ENDING CASH (A + E) 149,553,789.00 176,374,226.00 37,972,968.00 (1,561,968.00) (45,392,542.00) 145,151,462.00 90,643,226.00 58,979,207.00
G. ENDING CASH, PLUS CASHACCRUALS AND ADJUSTMENTS
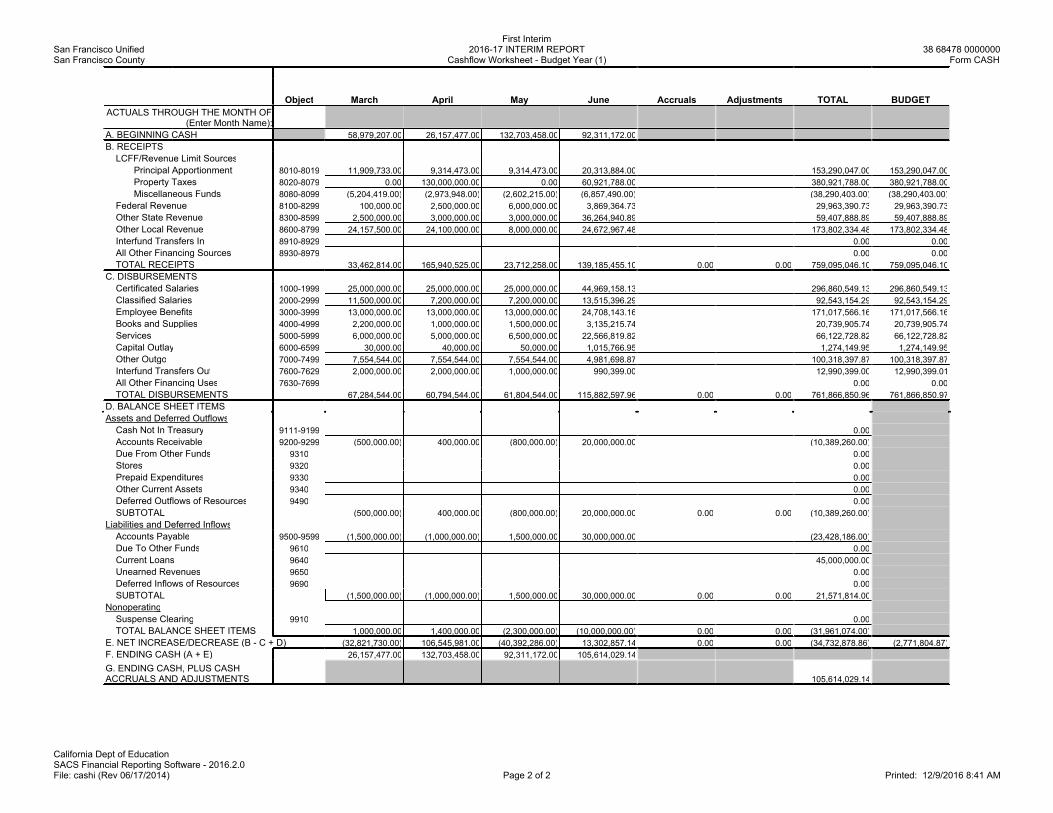
San Francisco UnifiedSan Francisco County
First Interim2016-17 INTERIM REPORT
Cashflow Worksheet - Budget Year (1)38 68478 0000000
Form CASH
California Dept of EducationSACS Financial Reporting Software - 2016.2.0File: cashi (Rev 06/17/2014) Page 2 of 2 Printed: 12/9/2016 8:41 AM
Object
ACTUALS THROUGH THE MONTH OF(Enter Month Name):
A. BEGINNING CASH
B. RECEIPTS
LCFF/Revenue Limit Sources
Principal Apportionment 8010-8019
Property Taxes 8020-8079
Miscellaneous Funds 8080-8099
Federal Revenue 8100-8299
Other State Revenue 8300-8599
Other Local Revenue 8600-8799
Interfund Transfers In 8910-8929
All Other Financing Sources 8930-8979
TOTAL RECEIPTS
C. DISBURSEMENTS
Certificated Salaries 1000-1999
Classified Salaries 2000-2999
Employee Benefits 3000-3999
Books and Supplies 4000-4999
Services 5000-5999
Capital Outlay 6000-6599
Other Outgo 7000-7499
Interfund Transfers Out 7600-7629
All Other Financing Uses 7630-7699
TOTAL DISBURSEMENTS
D. BALANCE SHEET ITEMS
Assets and Deferred Outflows
Cash Not In Treasury 9111-9199
Accounts Receivable 9200-9299
Due From Other Funds 9310
Stores 9320
Prepaid Expenditures 9330
Other Current Assets 9340
Deferred Outflows of Resources 9490
SUBTOTAL
Liabilities and Deferred Inflows
Accounts Payable 9500-9599
Due To Other Funds 9610
Current Loans 9640
Unearned Revenues 9650
Deferred Inflows of Resources 9690
SUBTOTAL
Nonoperating
Suspense Clearing 9910
TOTAL BALANCE SHEET ITEMS
E. NET INCREASE/DECREASE (B - C + D)
F. ENDING CASH (A + E)
G. ENDING CASH, PLUS CASHACCRUALS AND ADJUSTMENTS
March April May June Accruals Adjustments TOTAL BUDGET
58,979,207.00 26,157,477.00 132,703,458.00 92,311,172.00
11,909,733.00 9,314,473.00 9,314,473.00 20,313,884.00 153,290,047.00 153,290,047.00
0.00 130,000,000.00 0.00 60,921,788.00 380,921,788.00 380,921,788.00
(5,204,419.00) (2,973,948.00) (2,602,215.00) (6,857,490.00) (38,290,403.00) (38,290,403.00)
100,000.00 2,500,000.00 6,000,000.00 3,869,364.73 29,963,390.73 29,963,390.73
2,500,000.00 3,000,000.00 3,000,000.00 36,264,940.89 59,407,888.89 59,407,888.89
24,157,500.00 24,100,000.00 8,000,000.00 24,672,967.48 173,802,334.48 173,802,334.48
0.00 0.00
0.00 0.00
33,462,814.00 165,940,525.00 23,712,258.00 139,185,455.10 0.00 0.00 759,095,046.10 759,095,046.10
25,000,000.00 25,000,000.00 25,000,000.00 44,969,158.13 296,860,549.13 296,860,549.13
11,500,000.00 7,200,000.00 7,200,000.00 13,515,396.29 92,543,154.29 92,543,154.29
13,000,000.00 13,000,000.00 13,000,000.00 24,708,143.16 171,017,566.16 171,017,566.16
2,200,000.00 1,000,000.00 1,500,000.00 3,135,215.74 20,739,905.74 20,739,905.74
6,000,000.00 5,000,000.00 6,500,000.00 22,566,819.82 66,122,728.82 66,122,728.82
30,000.00 40,000.00 50,000.00 1,015,766.95 1,274,149.95 1,274,149.95
7,554,544.00 7,554,544.00 7,554,544.00 4,981,698.87 100,318,397.87 100,318,397.87
2,000,000.00 2,000,000.00 1,000,000.00 990,399.00 12,990,399.00 12,990,399.01
0.00 0.00
67,284,544.00 60,794,544.00 61,804,544.00 115,882,597.96 0.00 0.00 761,866,850.96 761,866,850.97
0.00
(500,000.00) 400,000.00 (800,000.00) 20,000,000.00 (10,389,260.00)
0.00
0.00
0.00
0.00
0.00
(500,000.00) 400,000.00 (800,000.00) 20,000,000.00 0.00 0.00 (10,389,260.00)
(1,500,000.00) (1,000,000.00) 1,500,000.00 30,000,000.00 (23,428,186.00)
0.00
45,000,000.00
0.00
0.00
(1,500,000.00) (1,000,000.00) 1,500,000.00 30,000,000.00 0.00 0.00 21,571,814.00
0.00
1,000,000.00 1,400,000.00 (2,300,000.00) (10,000,000.00) 0.00 0.00 (31,961,074.00)
(32,821,730.00) 106,545,981.00 (40,392,286.00) 13,302,857.14 0.00 0.00 (34,732,878.86) (2,771,804.87)
26,157,477.00 132,703,458.00 92,311,172.00 105,614,029.14
105,614,029.14
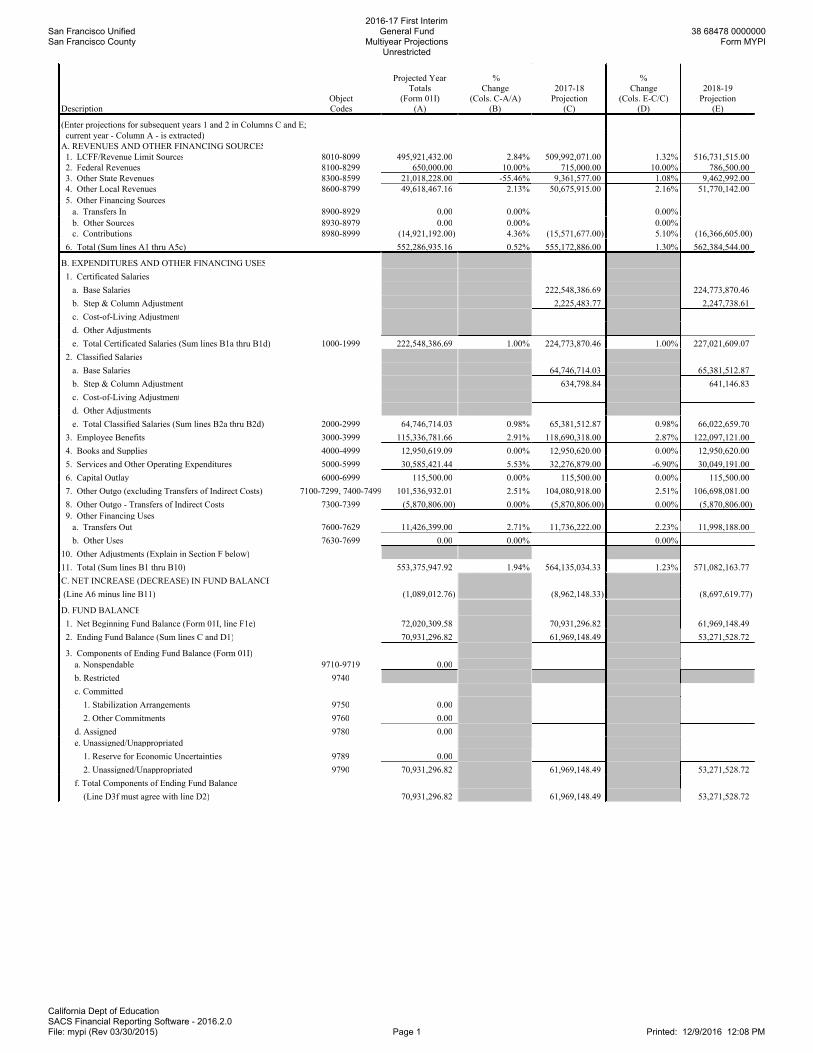
San Francisco UnifiedSan Francisco County
2016-17 First InterimGeneral Fund
Multiyear ProjectionsUnrestricted
38 68478 0000000Form MYPI
California Dept of EducationSACS Financial Reporting Software - 2016.2.0File: mypi (Rev 03/30/2015) Page 1 Printed: 12/9/2016 12:08 PM
Description
Object
Codes
Projected Year
Totals
(Form 01I)
(A)
%
Change
(Cols. C-A/A)
(B)
2017-18
Projection
(C)
%
Change
(Cols. E-C/C)
(D)
2018-19
Projection
(E)
(Enter projections for subsequent years 1 and 2 in Columns C and E;
current year - Column A - is extracted)
A. REVENUES AND OTHER FINANCING SOURCES
1. LCFF/Revenue Limit Sources 8010-8099 495,921,432.00 2.84% 509,992,071.00 1.32% 516,731,515.00
2. Federal Revenues 8100-8299 650,000.00 10.00% 715,000.00 10.00% 786,500.00
3. Other State Revenues 8300-8599 21,018,228.00 -55.46% 9,361,577.00 1.08% 9,462,992.00
4. Other Local Revenues 8600-8799 49,618,467.16 2.13% 50,675,915.00 2.16% 51,770,142.00
5. Other Financing Sources
a. Transfers In 8900-8929 0.00 0.00% 0.00%
b. Other Sources 8930-8979 0.00 0.00% 0.00%
c. Contributions 8980-8999 (14,921,192.00) 4.36% (15,571,677.00) 5.10% (16,366,605.00)
6. Total (Sum lines A1 thru A5c) 552,286,935.16 0.52% 555,172,886.00 1.30% 562,384,544.00
B. EXPENDITURES AND OTHER FINANCING USES
1. Certificated Salaries
a. Base Salaries 222,548,386.69 224,773,870.46
b. Step & Column Adjustment 2,225,483.77 2,247,738.61
c. Cost-of-Living Adjustment
d. Other Adjustments
e. Total Certificated Salaries (Sum lines B1a thru B1d) 1000-1999 222,548,386.69 1.00% 224,773,870.46 1.00% 227,021,609.07
2. Classified Salaries
a. Base Salaries 64,746,714.03 65,381,512.87
b. Step & Column Adjustment 634,798.84 641,146.83
c. Cost-of-Living Adjustment
d. Other Adjustments
e. Total Classified Salaries (Sum lines B2a thru B2d) 2000-2999 64,746,714.03 0.98% 65,381,512.87 0.98% 66,022,659.70
3. Employee Benefits 3000-3999 115,336,781.66 2.91% 118,690,318.00 2.87% 122,097,121.00
4. Books and Supplies 4000-4999 12,950,619.09 0.00% 12,950,620.00 0.00% 12,950,620.00
5. Services and Other Operating Expenditures 5000-5999 30,585,421.44 5.53% 32,276,879.00 -6.90% 30,049,191.00
6. Capital Outlay 6000-6999 115,500.00 0.00% 115,500.00 0.00% 115,500.00
7. Other Outgo (excluding Transfers of Indirect Costs) 7100-7299, 7400-7499 101,536,932.01 2.51% 104,080,918.00 2.51% 106,698,081.00
8. Other Outgo - Transfers of Indirect Costs 7300-7399 (5,870,806.00) 0.00% (5,870,806.00) 0.00% (5,870,806.00)
9. Other Financing Uses
a. Transfers Out 7600-7629 11,426,399.00 2.71% 11,736,222.00 2.23% 11,998,188.00
b. Other Uses 7630-7699 0.00 0.00% 0.00%
10. Other Adjustments (Explain in Section F below)
11. Total (Sum lines B1 thru B10) 553,375,947.92 1.94% 564,135,034.33 1.23% 571,082,163.77
C. NET INCREASE (DECREASE) IN FUND BALANCE
(Line A6 minus line B11) (1,089,012.76) (8,962,148.33) (8,697,619.77)
D. FUND BALANCE
1. Net Beginning Fund Balance (Form 01I, line F1e) 72,020,309.58 70,931,296.82 61,969,148.49
2. Ending Fund Balance (Sum lines C and D1) 70,931,296.82 61,969,148.49 53,271,528.72
3. Components of Ending Fund Balance (Form 01I)
a. Nonspendable 9710-9719 0.00
b. Restricted 9740
c. Committed
1. Stabilization Arrangements 9750 0.00
2. Other Commitments 9760 0.00
d. Assigned 9780 0.00
e. Unassigned/Unappropriated
1. Reserve for Economic Uncertainties 9789 0.00
2. Unassigned/Unappropriated 9790 70,931,296.82 61,969,148.49 53,271,528.72
f. Total Components of Ending Fund Balance
(Line D3f must agree with line D2) 70,931,296.82 61,969,148.49 53,271,528.72
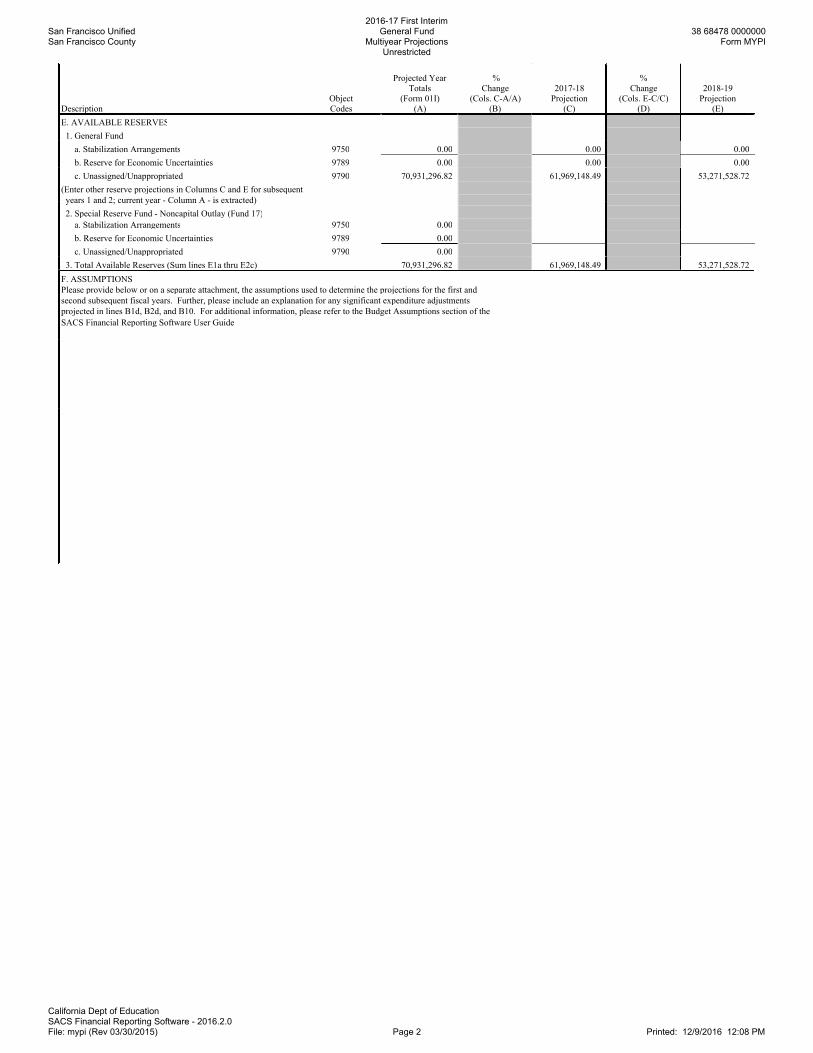
San Francisco UnifiedSan Francisco County
2016-17 First InterimGeneral Fund
Multiyear ProjectionsUnrestricted
38 68478 0000000Form MYPI
California Dept of EducationSACS Financial Reporting Software - 2016.2.0File: mypi (Rev 03/30/2015) Page 2 Printed: 12/9/2016 12:08 PM
Description
Object
Codes
Projected Year
Totals
(Form 01I)
(A)
%
Change
(Cols. C-A/A)
(B)
2017-18
Projection
(C)
%
Change
(Cols. E-C/C)
(D)
2018-19
Projection
(E)
E. AVAILABLE RESERVES
1. General Fund
a. Stabilization Arrangements 9750 0.00 0.00 0.00
b. Reserve for Economic Uncertainties 9789 0.00 0.00 0.00
c. Unassigned/Unappropriated 9790 70,931,296.82 61,969,148.49 53,271,528.72
(Enter other reserve projections in Columns C and E for subsequent
years 1 and 2; current year - Column A - is extracted)
2. Special Reserve Fund - Noncapital Outlay (Fund 17)
a. Stabilization Arrangements 9750 0.00
b. Reserve for Economic Uncertainties 9789 0.00
c. Unassigned/Unappropriated 9790 0.00
3. Total Available Reserves (Sum lines E1a thru E2c) 70,931,296.82 61,969,148.49 53,271,528.72
F. ASSUMPTIONS
Please provide below or on a separate attachment, the assumptions used to determine the projections for the first and
second subsequent fiscal years. Further, please include an explanation for any significant expenditure adjustments
projected in lines B1d, B2d, and B10. For additional information, please refer to the Budget Assumptions section of the
SACS Financial Reporting Software User Guide.

San Francisco UnifiedSan Francisco County
2016-17 First InterimGeneral Fund
Multiyear ProjectionsRestricted
38 68478 0000000Form MYPI
California Dept of EducationSACS Financial Reporting Software - 2016.2.0File: mypi (Rev 03/30/2015) Page 1 Printed: 12/9/2016 12:09 PM
Description
Object
Codes
Projected Year
Totals
(Form 01I)
(A)
%
Change
(Cols. C-A/A)
(B)
2017-18
Projection
(C)
%
Change
(Cols. E-C/C)
(D)
2018-19
Projection
(E)
(Enter projections for subsequent years 1 and 2 in Columns C and E;
current year - Column A - is extracted)
A. REVENUES AND OTHER FINANCING SOURCES
1. LCFF/Revenue Limit Sources 8010-8099 0.00 0.00% 0.00%
2. Federal Revenues 8100-8299 29,313,390.73 -0.36% 29,207,990.00 -0.85% 28,958,611.00
3. Other State Revenues 8300-8599 38,389,660.89 -5.08% 36,440,811.00 -0.59% 36,225,335.00
4. Other Local Revenues 8600-8799 124,183,867.32 1.17% 125,635,297.00 1.13% 127,060,609.00
5. Other Financing Sources
a. Transfers In 8900-8929 0.00 0.00% 0.00%
b. Other Sources 8930-8979 0.00 0.00% 0.00%
c. Contributions 8980-8999 14,921,191.96 4.36% 15,571,677.00 5.10% 16,366,605.00
6. Total (Sum lines A1 thru A5c) 206,808,110.90 0.02% 206,855,775.00 0.85% 208,611,160.00
B. EXPENDITURES AND OTHER FINANCING USES
1. Certificated Salaries
a. Base Salaries 74,312,162.44 75,080,414.24
b. Step & Column Adjustment 768,251.80 775,934.32
c. Cost-of-Living Adjustment
d. Other Adjustments
e. Total Certificated Salaries (Sum lines B1a thru B1d) 1000-1999 74,312,162.44 1.03% 75,080,414.24 1.03% 75,856,348.56
2. Classified Salaries
a. Base Salaries 27,796,440.26 28,074,404.66
b. Step & Column Adjustment 277,964.40 280,744.04
c. Cost-of-Living Adjustment
d. Other Adjustments
e. Total Classified Salaries (Sum lines B2a thru B2d) 2000-2999 27,796,440.26 1.00% 28,074,404.66 1.00% 28,355,148.70
3. Employee Benefits 3000-3999 55,680,784.50 3.57% 57,670,042.00 3.08% 59,444,666.00
4. Books and Supplies 4000-4999 7,789,286.65 0.00% 7,789,287.00 1.00% 7,867,180.00
5. Services and Other Operating Expenditures 5000-5999 35,537,307.38 0.00% 35,537,307.00 0.00% 35,537,307.00
6. Capital Outlay 6000-6999 1,158,649.95 0.00% 1,158,650.00 0.00% 1,158,650.00
7. Other Outgo (excluding Transfers of Indirect Costs) 7100-7299, 7400-7499 1,152,272.00 -6.34% 1,079,200.00 0.00% 1,079,200.00
8. Other Outgo - Transfers of Indirect Costs 7300-7399 3,499,999.86 0.00% 3,500,000.00 0.00% 3,500,000.00
9. Other Financing Uses
a. Transfers Out 7600-7629 1,564,000.01 0.00% 1,564,000.00 0.00% 1,564,000.00
b. Other Uses 7630-7699 0.00 0.00% 0.00%
10. Other Adjustments (Explain in Section F below)
11. Total (Sum lines B1 thru B10) 208,490,903.05 1.42% 211,453,304.90 1.38% 214,362,500.26
C. NET INCREASE (DECREASE) IN FUND BALANCE
(Line A6 minus line B11) (1,682,792.15) (4,597,529.90) (5,751,340.26)
D. FUND BALANCE
1. Net Beginning Fund Balance (Form 01I, line F1e) 46,563,252.85 44,880,460.70 40,282,930.80
2. Ending Fund Balance (Sum lines C and D1) 44,880,460.70 40,282,930.80 34,531,590.54
3. Components of Ending Fund Balance (Form 01I)
a. Nonspendable 9710-9719 0.00
b. Restricted 9740 44,880,460.81 41,782,930.80 37,531,590.54
c. Committed
1. Stabilization Arrangements 9750
2. Other Commitments 9760
d. Assigned 9780
e. Unassigned/Unappropriated
1. Reserve for Economic Uncertainties 9789
2. Unassigned/Unappropriated 9790 (0.11) (1,500,000.00) (3,000,000.00)
f. Total Components of Ending Fund Balance
(Line D3f must agree with line D2) 44,880,460.70 40,282,930.80 34,531,590.54
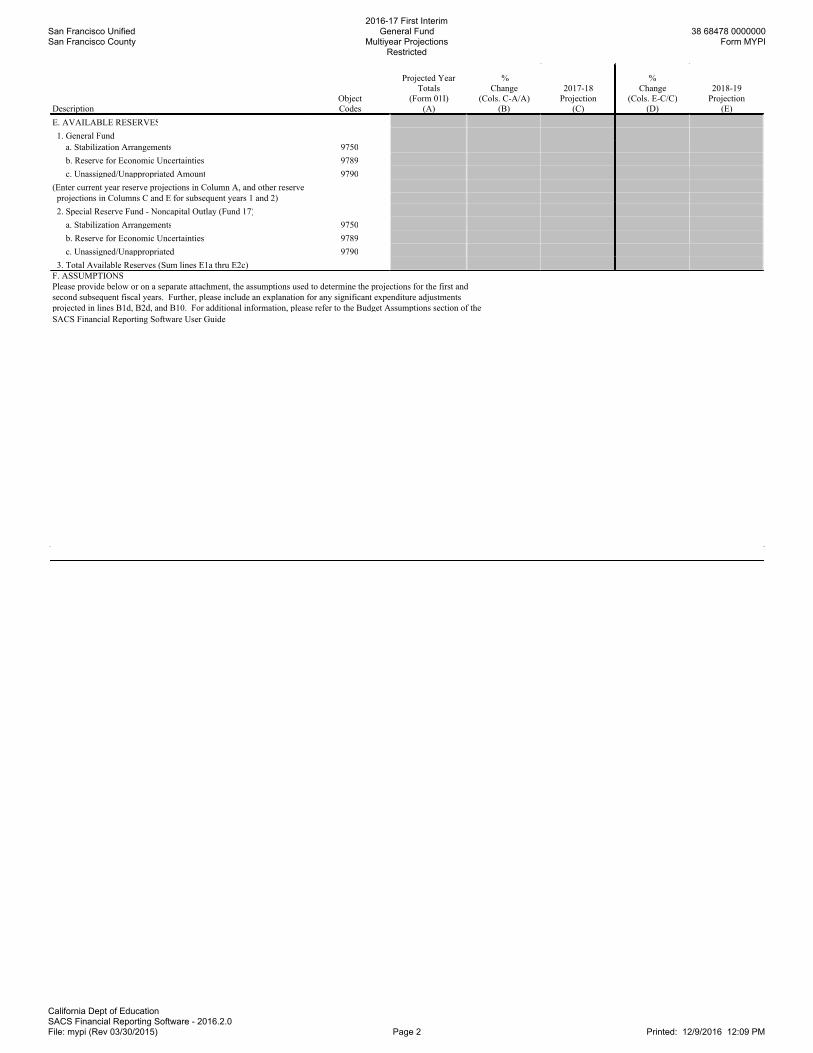
San Francisco UnifiedSan Francisco County
2016-17 First InterimGeneral Fund
Multiyear ProjectionsRestricted
38 68478 0000000Form MYPI
California Dept of EducationSACS Financial Reporting Software - 2016.2.0File: mypi (Rev 03/30/2015) Page 2 Printed: 12/9/2016 12:09 PM
Description
Object
Codes
Projected Year
Totals
(Form 01I)
(A)
%
Change
(Cols. C-A/A)
(B)
2017-18
Projection
(C)
%
Change
(Cols. E-C/C)
(D)
2018-19
Projection
(E)
E. AVAILABLE RESERVES
1. General Fund
a. Stabilization Arrangements 9750
b. Reserve for Economic Uncertainties 9789
c. Unassigned/Unappropriated Amount 9790
(Enter current year reserve projections in Column A, and other reserve
projections in Columns C and E for subsequent years 1 and 2)
2. Special Reserve Fund - Noncapital Outlay (Fund 17)
a. Stabilization Arrangements 9750
b. Reserve for Economic Uncertainties 9789
c. Unassigned/Unappropriated 9790
3. Total Available Reserves (Sum lines E1a thru E2c)
F. ASSUMPTIONS
Please provide below or on a separate attachment, the assumptions used to determine the projections for the first and
second subsequent fiscal years. Further, please include an explanation for any significant expenditure adjustments
projected in lines B1d, B2d, and B10. For additional information, please refer to the Budget Assumptions section of the
SACS Financial Reporting Software User Guide.
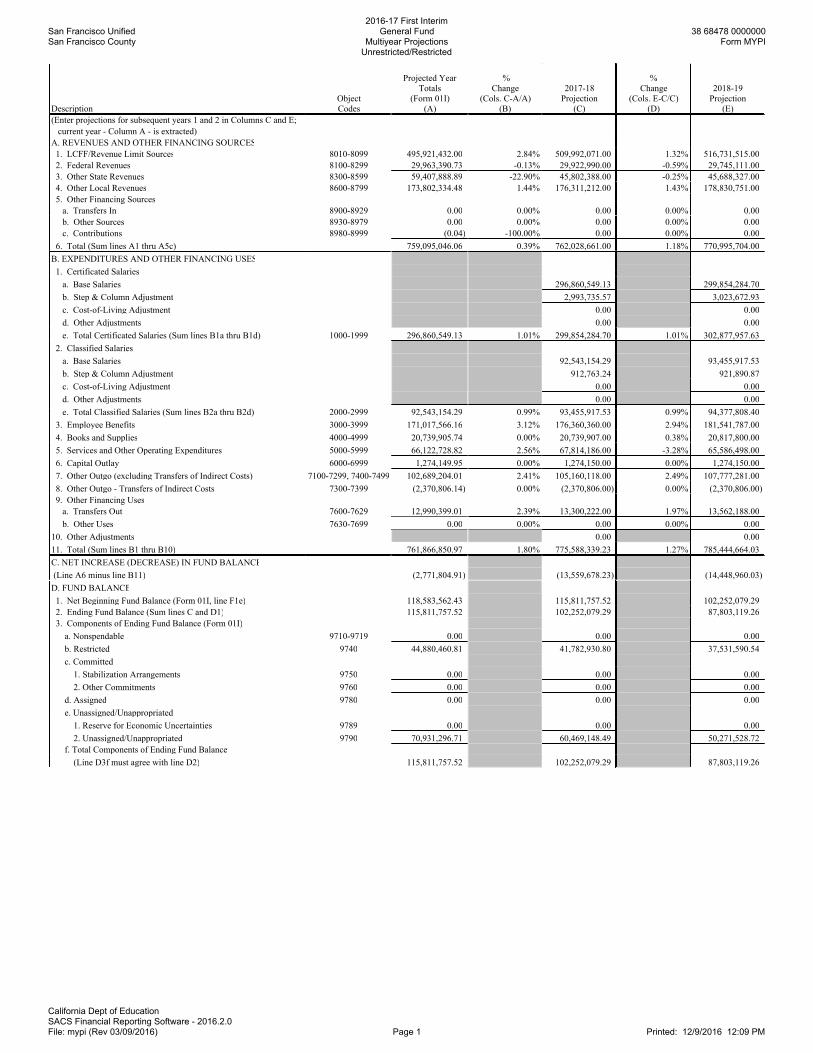
San Francisco UnifiedSan Francisco County
2016-17 First InterimGeneral Fund
Multiyear ProjectionsUnrestricted/Restricted
38 68478 0000000Form MYPI
California Dept of EducationSACS Financial Reporting Software - 2016.2.0File: mypi (Rev 03/09/2016) Page 1 Printed: 12/9/2016 12:09 PM
Description
Object
Codes
Projected Year
Totals
(Form 01I)
(A)
%
Change
(Cols. C-A/A)
(B)
2017-18
Projection
(C)
%
Change
(Cols. E-C/C)
(D)
2018-19
Projection
(E)
(Enter projections for subsequent years 1 and 2 in Columns C and E;
current year - Column A - is extracted)
A. REVENUES AND OTHER FINANCING SOURCES
1. LCFF/Revenue Limit Sources 8010-8099 495,921,432.00 2.84% 509,992,071.00 1.32% 516,731,515.00
2. Federal Revenues 8100-8299 29,963,390.73 -0.13% 29,922,990.00 -0.59% 29,745,111.00
3. Other State Revenues 8300-8599 59,407,888.89 -22.90% 45,802,388.00 -0.25% 45,688,327.00
4. Other Local Revenues 8600-8799 173,802,334.48 1.44% 176,311,212.00 1.43% 178,830,751.00
5. Other Financing Sources
a. Transfers In 8900-8929 0.00 0.00% 0.00 0.00% 0.00
b. Other Sources 8930-8979 0.00 0.00% 0.00 0.00% 0.00
c. Contributions 8980-8999 (0.04) -100.00% 0.00 0.00% 0.00
6. Total (Sum lines A1 thru A5c) 759,095,046.06 0.39% 762,028,661.00 1.18% 770,995,704.00
B. EXPENDITURES AND OTHER FINANCING USES
1. Certificated Salaries
a. Base Salaries 296,860,549.13 299,854,284.70
b. Step & Column Adjustment 2,993,735.57 3,023,672.93
c. Cost-of-Living Adjustment 0.00 0.00
d. Other Adjustments 0.00 0.00
e. Total Certificated Salaries (Sum lines B1a thru B1d) 1000-1999 296,860,549.13 1.01% 299,854,284.70 1.01% 302,877,957.63
2. Classified Salaries
a. Base Salaries 92,543,154.29 93,455,917.53
b. Step & Column Adjustment 912,763.24 921,890.87
c. Cost-of-Living Adjustment 0.00 0.00
d. Other Adjustments 0.00 0.00
e. Total Classified Salaries (Sum lines B2a thru B2d) 2000-2999 92,543,154.29 0.99% 93,455,917.53 0.99% 94,377,808.40
3. Employee Benefits 3000-3999 171,017,566.16 3.12% 176,360,360.00 2.94% 181,541,787.00
4. Books and Supplies 4000-4999 20,739,905.74 0.00% 20,739,907.00 0.38% 20,817,800.00
5. Services and Other Operating Expenditures 5000-5999 66,122,728.82 2.56% 67,814,186.00 -3.28% 65,586,498.00
6. Capital Outlay 6000-6999 1,274,149.95 0.00% 1,274,150.00 0.00% 1,274,150.00
7. Other Outgo (excluding Transfers of Indirect Costs) 7100-7299, 7400-7499 102,689,204.01 2.41% 105,160,118.00 2.49% 107,777,281.00
8. Other Outgo - Transfers of Indirect Costs 7300-7399 (2,370,806.14) 0.00% (2,370,806.00) 0.00% (2,370,806.00)
9. Other Financing Uses
a. Transfers Out 7600-7629 12,990,399.01 2.39% 13,300,222.00 1.97% 13,562,188.00
b. Other Uses 7630-7699 0.00 0.00% 0.00 0.00% 0.00
10. Other Adjustments 0.00 0.00
11. Total (Sum lines B1 thru B10) 761,866,850.97 1.80% 775,588,339.23 1.27% 785,444,664.03
C. NET INCREASE (DECREASE) IN FUND BALANCE
(Line A6 minus line B11) (2,771,804.91) (13,559,678.23) (14,448,960.03)
D. FUND BALANCE
1. Net Beginning Fund Balance (Form 01I, line F1e) 118,583,562.43 115,811,757.52 102,252,079.29
2. Ending Fund Balance (Sum lines C and D1) 115,811,757.52 102,252,079.29 87,803,119.26
3. Components of Ending Fund Balance (Form 01I)
a. Nonspendable 9710-9719 0.00 0.00 0.00
b. Restricted 9740 44,880,460.81 41,782,930.80 37,531,590.54
c. Committed
1. Stabilization Arrangements 9750 0.00 0.00 0.00
2. Other Commitments 9760 0.00 0.00 0.00
d. Assigned 9780 0.00 0.00 0.00
e. Unassigned/Unappropriated
1. Reserve for Economic Uncertainties 9789 0.00 0.00 0.00
2. Unassigned/Unappropriated 9790 70,931,296.71 60,469,148.49 50,271,528.72
f. Total Components of Ending Fund Balance
(Line D3f must agree with line D2) 115,811,757.52 102,252,079.29 87,803,119.26
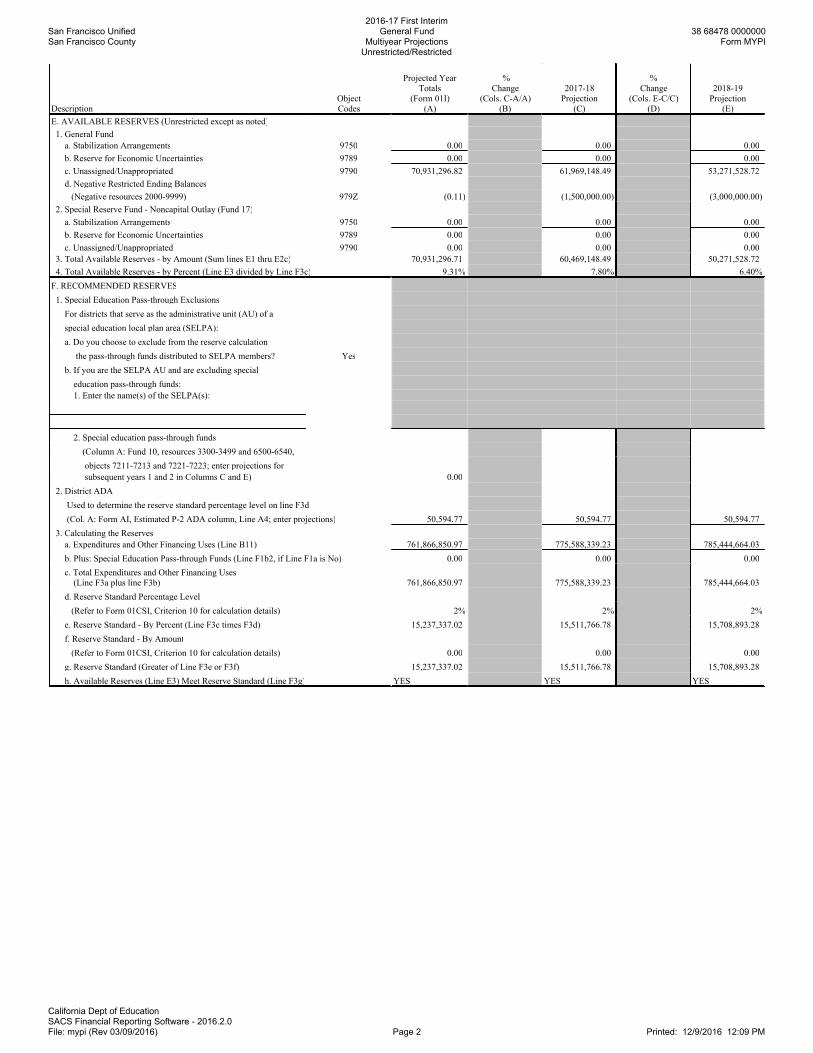
San Francisco UnifiedSan Francisco County
2016-17 First InterimGeneral Fund
Multiyear ProjectionsUnrestricted/Restricted
38 68478 0000000Form MYPI
California Dept of EducationSACS Financial Reporting Software - 2016.2.0File: mypi (Rev 03/09/2016) Page 2 Printed: 12/9/2016 12:09 PM
Description
Object
Codes
Projected Year
Totals
(Form 01I)
(A)
%
Change
(Cols. C-A/A)
(B)
2017-18
Projection
(C)
%
Change
(Cols. E-C/C)
(D)
2018-19
Projection
(E)
E. AVAILABLE RESERVES (Unrestricted except as noted)
1. General Fund
a. Stabilization Arrangements 9750 0.00 0.00 0.00
b. Reserve for Economic Uncertainties 9789 0.00 0.00 0.00
c. Unassigned/Unappropriated 9790 70,931,296.82 61,969,148.49 53,271,528.72
d. Negative Restricted Ending Balances
(Negative resources 2000-9999) 979Z (0.11) (1,500,000.00) (3,000,000.00)
2. Special Reserve Fund - Noncapital Outlay (Fund 17)
a. Stabilization Arrangements 9750 0.00 0.00 0.00
b. Reserve for Economic Uncertainties 9789 0.00 0.00 0.00
c. Unassigned/Unappropriated 9790 0.00 0.00 0.00
3. Total Available Reserves - by Amount (Sum lines E1 thru E2c) 70,931,296.71 60,469,148.49 50,271,528.72
4. Total Available Reserves - by Percent (Line E3 divided by Line F3c) 9.31% 7.80% 6.40%
F. RECOMMENDED RESERVES
1. Special Education Pass-through Exclusions
For districts that serve as the administrative unit (AU) of a
special education local plan area (SELPA):
a. Do you choose to exclude from the reserve calculation
the pass-through funds distributed to SELPA members? Yes
b. If you are the SELPA AU and are excluding special
education pass-through funds:
1. Enter the name(s) of the SELPA(s):
2. Special education pass-through funds
(Column A: Fund 10, resources 3300-3499 and 6500-6540,
objects 7211-7213 and 7221-7223; enter projections for
subsequent years 1 and 2 in Columns C and E) 0.00
2. District ADA
Used to determine the reserve standard percentage level on line F3d
(Col. A: Form AI, Estimated P-2 ADA column, Line A4; enter projections) 50,594.77 50,594.77 50,594.77
3. Calculating the Reserves
a. Expenditures and Other Financing Uses (Line B11) 761,866,850.97 775,588,339.23 785,444,664.03
b. Plus: Special Education Pass-through Funds (Line F1b2, if Line F1a is No) 0.00 0.00 0.00
c. Total Expenditures and Other Financing Uses
(Line F3a plus line F3b) 761,866,850.97 775,588,339.23 785,444,664.03
d. Reserve Standard Percentage Level
(Refer to Form 01CSI, Criterion 10 for calculation details) 2% 2% 2%
e. Reserve Standard - By Percent (Line F3c times F3d) 15,237,337.02 15,511,766.78 15,708,893.28
f. Reserve Standard - By Amount
(Refer to Form 01CSI, Criterion 10 for calculation details) 0.00 0.00 0.00
g. Reserve Standard (Greater of Line F3e or F3f) 15,237,337.02 15,511,766.78 15,708,893.28
h. Available Reserves (Line E3) Meet Reserve Standard (Line F3g) YES YES YES
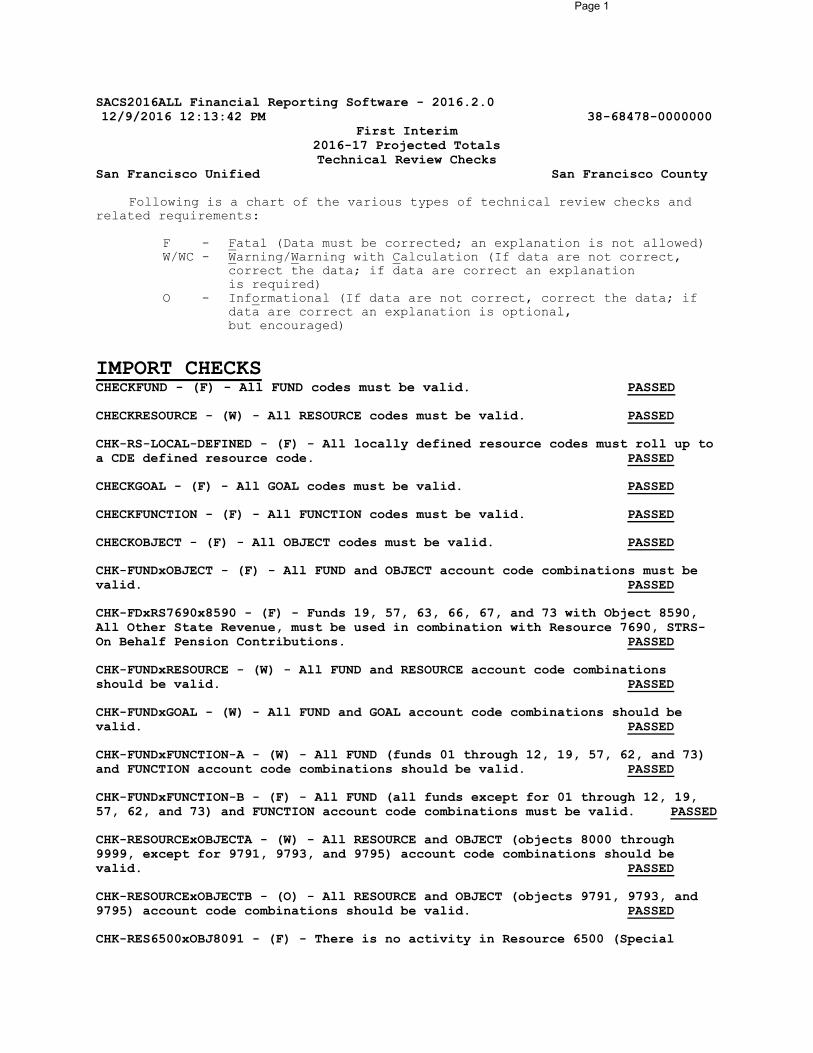
Page 1
SACS2016ALL Financial Reporting Software - 2016.2.012/9/2016 12:13:42 PM 38-68478-0000000
First Interim2016-17 Projected TotalsTechnical Review Checks
San Francisco Unified San Francisco County
Following is a chart of the various types of technical review checks and related requirements:
F - Fatal (Data must be corrected; an explanation is not allowed)W/WC - Warning/Warning with Calculation (If data are not correct,
correct the data; if data are correct an explanation is required)
O - Informational (If data are not correct, correct the data; if data are correct an explanation is optional, but encouraged)
IMPORT CHECKSCHECKFUND - (F) - All FUND codes must be valid. PASSED
CHECKRESOURCE - (W) - All RESOURCE codes must be valid. PASSED
CHK-RS-LOCAL-DEFINED - (F) - All locally defined resource codes must roll up to a CDE defined resource code. PASSED
CHECKGOAL - (F) - All GOAL codes must be valid. PASSED
CHECKFUNCTION - (F) - All FUNCTION codes must be valid. PASSED
CHECKOBJECT - (F) - All OBJECT codes must be valid. PASSED
CHK-FUNDxOBJECT - (F) - All FUND and OBJECT account code combinations must be valid. PASSED
CHK-FDxRS7690x8590 - (F) - Funds 19, 57, 63, 66, 67, and 73 with Object 8590, All Other State Revenue, must be used in combination with Resource 7690, STRS-On Behalf Pension Contributions. PASSED
CHK-FUNDxRESOURCE - (W) - All FUND and RESOURCE account code combinations should be valid. PASSED
CHK-FUNDxGOAL - (W) - All FUND and GOAL account code combinations should be valid. PASSED
CHK-FUNDxFUNCTION-A - (W) - All FUND (funds 01 through 12, 19, 57, 62, and 73) and FUNCTION account code combinations should be valid. PASSED
CHK-FUNDxFUNCTION-B - (F) - All FUND (all funds except for 01 through 12, 19, 57, 62, and 73) and FUNCTION account code combinations must be valid. PASSED
CHK-RESOURCExOBJECTA - (W) - All RESOURCE and OBJECT (objects 8000 through 9999, except for 9791, 9793, and 9795) account code combinations should be valid. PASSED
CHK-RESOURCExOBJECTB - (O) - All RESOURCE and OBJECT (objects 9791, 9793, and 9795) account code combinations should be valid. PASSED
CHK-RES6500xOBJ8091 - (F) - There is no activity in Resource 6500 (Special
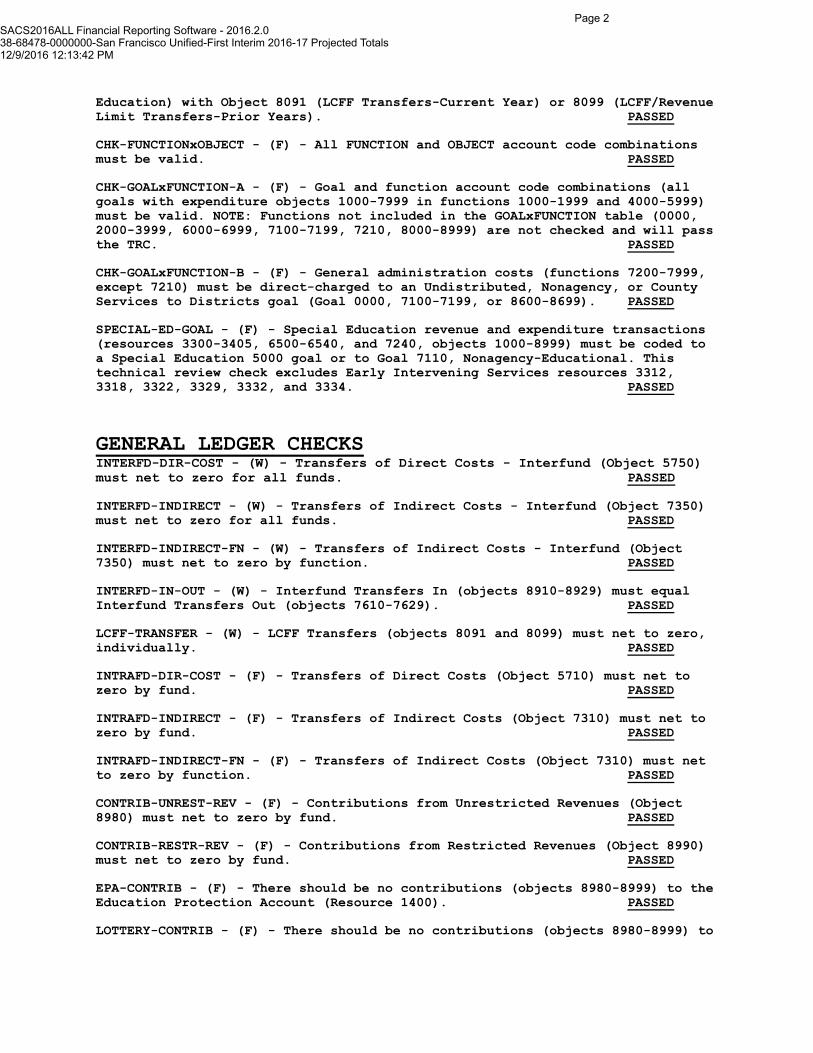
Page 2
SACS2016ALL Financial Reporting Software - 2016.2.038-68478-0000000-San Francisco Unified-First Interim 2016-17 Projected Totals12/9/2016 12:13:42 PM
Education) with Object 8091 (LCFF Transfers-Current Year) or 8099 (LCFF/Revenue Limit Transfers-Prior Years). PASSED
CHK-FUNCTIONxOBJECT - (F) - All FUNCTION and OBJECT account code combinations must be valid. PASSED
CHK-GOALxFUNCTION-A - (F) - Goal and function account code combinations (all goals with expenditure objects 1000-7999 in functions 1000-1999 and 4000-5999) must be valid. NOTE: Functions not included in the GOALxFUNCTION table (0000, 2000-3999, 6000-6999, 7100-7199, 7210, 8000-8999) are not checked and will pass the TRC. PASSED
CHK-GOALxFUNCTION-B - (F) - General administration costs (functions 7200-7999, except 7210) must be direct-charged to an Undistributed, Nonagency, or County Services to Districts goal (Goal 0000, 7100-7199, or 8600-8699). PASSED
SPECIAL-ED-GOAL - (F) - Special Education revenue and expenditure transactions (resources 3300-3405, 6500-6540, and 7240, objects 1000-8999) must be coded to a Special Education 5000 goal or to Goal 7110, Nonagency-Educational. This technical review check excludes Early Intervening Services resources 3312, 3318, 3322, 3329, 3332, and 3334. PASSED
GENERAL LEDGER CHECKSINTERFD-DIR-COST - (W) - Transfers of Direct Costs - Interfund (Object 5750) must net to zero for all funds. PASSED
INTERFD-INDIRECT - (W) - Transfers of Indirect Costs - Interfund (Object 7350) must net to zero for all funds. PASSED
INTERFD-INDIRECT-FN - (W) - Transfers of Indirect Costs - Interfund (Object 7350) must net to zero by function. PASSED
INTERFD-IN-OUT - (W) - Interfund Transfers In (objects 8910-8929) must equal Interfund Transfers Out (objects 7610-7629). PASSED
LCFF-TRANSFER - (W) - LCFF Transfers (objects 8091 and 8099) must net to zero, individually. PASSED
INTRAFD-DIR-COST - (F) - Transfers of Direct Costs (Object 5710) must net to zero by fund. PASSED
INTRAFD-INDIRECT - (F) - Transfers of Indirect Costs (Object 7310) must net to zero by fund. PASSED
INTRAFD-INDIRECT-FN - (F) - Transfers of Indirect Costs (Object 7310) must net to zero by function. PASSED
CONTRIB-UNREST-REV - (F) - Contributions from Unrestricted Revenues (Object 8980) must net to zero by fund. PASSED
CONTRIB-RESTR-REV - (F) - Contributions from Restricted Revenues (Object 8990) must net to zero by fund. PASSED
EPA-CONTRIB - (F) - There should be no contributions (objects 8980-8999) to the Education Protection Account (Resource 1400). PASSED
LOTTERY-CONTRIB - (F) - There should be no contributions (objects 8980-8999) to
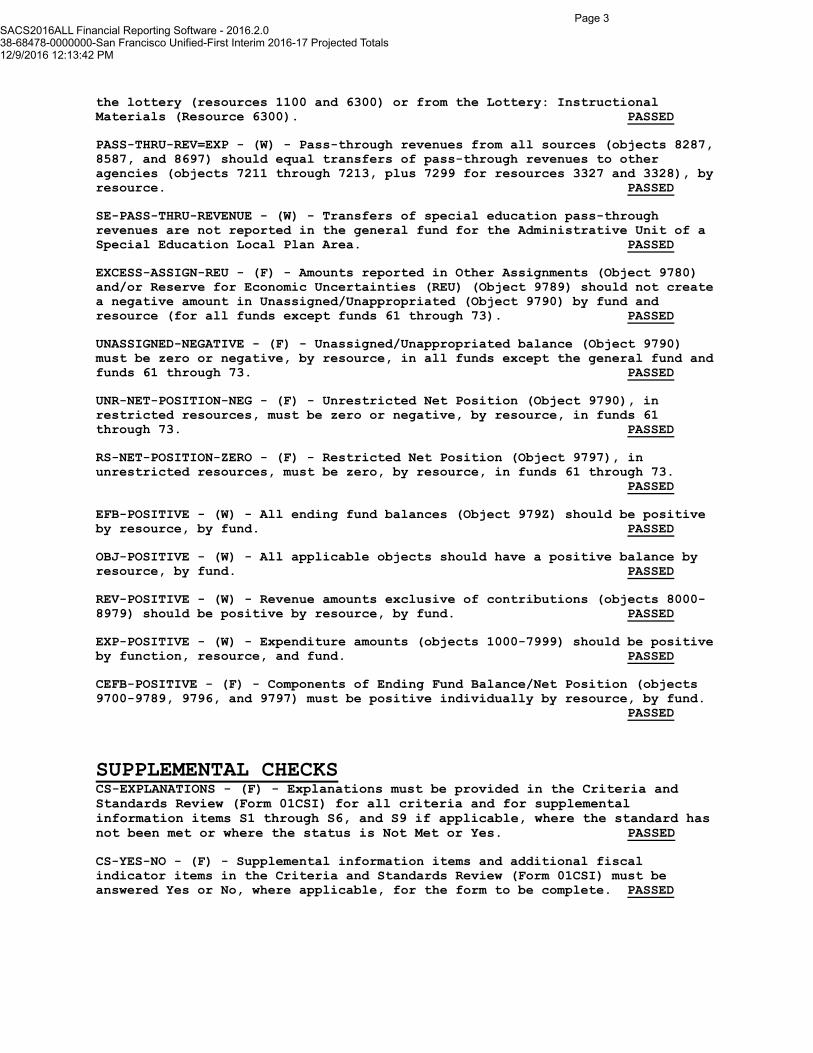
Page 3
SACS2016ALL Financial Reporting Software - 2016.2.038-68478-0000000-San Francisco Unified-First Interim 2016-17 Projected Totals12/9/2016 12:13:42 PM
the lottery (resources 1100 and 6300) or from the Lottery: Instructional Materials (Resource 6300). PASSED
PASS-THRU-REV=EXP - (W) - Pass-through revenues from all sources (objects 8287, 8587, and 8697) should equal transfers of pass-through revenues to other agencies (objects 7211 through 7213, plus 7299 for resources 3327 and 3328), by resource. PASSED
SE-PASS-THRU-REVENUE - (W) - Transfers of special education pass-through revenues are not reported in the general fund for the Administrative Unit of a Special Education Local Plan Area. PASSED
EXCESS-ASSIGN-REU - (F) - Amounts reported in Other Assignments (Object 9780) and/or Reserve for Economic Uncertainties (REU) (Object 9789) should not create a negative amount in Unassigned/Unappropriated (Object 9790) by fund and resource (for all funds except funds 61 through 73). PASSED
UNASSIGNED-NEGATIVE - (F) - Unassigned/Unappropriated balance (Object 9790) must be zero or negative, by resource, in all funds except the general fund and funds 61 through 73. PASSED
UNR-NET-POSITION-NEG - (F) - Unrestricted Net Position (Object 9790), in restricted resources, must be zero or negative, by resource, in funds 61 through 73. PASSED
RS-NET-POSITION-ZERO - (F) - Restricted Net Position (Object 9797), in unrestricted resources, must be zero, by resource, in funds 61 through 73.
PASSED
EFB-POSITIVE - (W) - All ending fund balances (Object 979Z) should be positive by resource, by fund. PASSED
OBJ-POSITIVE - (W) - All applicable objects should have a positive balance by resource, by fund. PASSED
REV-POSITIVE - (W) - Revenue amounts exclusive of contributions (objects 8000-8979) should be positive by resource, by fund. PASSED
EXP-POSITIVE - (W) - Expenditure amounts (objects 1000-7999) should be positive by function, resource, and fund. PASSED
CEFB-POSITIVE - (F) - Components of Ending Fund Balance/Net Position (objects 9700-9789, 9796, and 9797) must be positive individually by resource, by fund.
PASSED
SUPPLEMENTAL CHECKSCS-EXPLANATIONS - (F) - Explanations must be provided in the Criteria and Standards Review (Form 01CSI) for all criteria and for supplemental information items S1 through S6, and S9 if applicable, where the standard has not been met or where the status is Not Met or Yes. PASSED
CS-YES-NO - (F) - Supplemental information items and additional fiscal indicator items in the Criteria and Standards Review (Form 01CSI) must be answered Yes or No, where applicable, for the form to be complete. PASSED
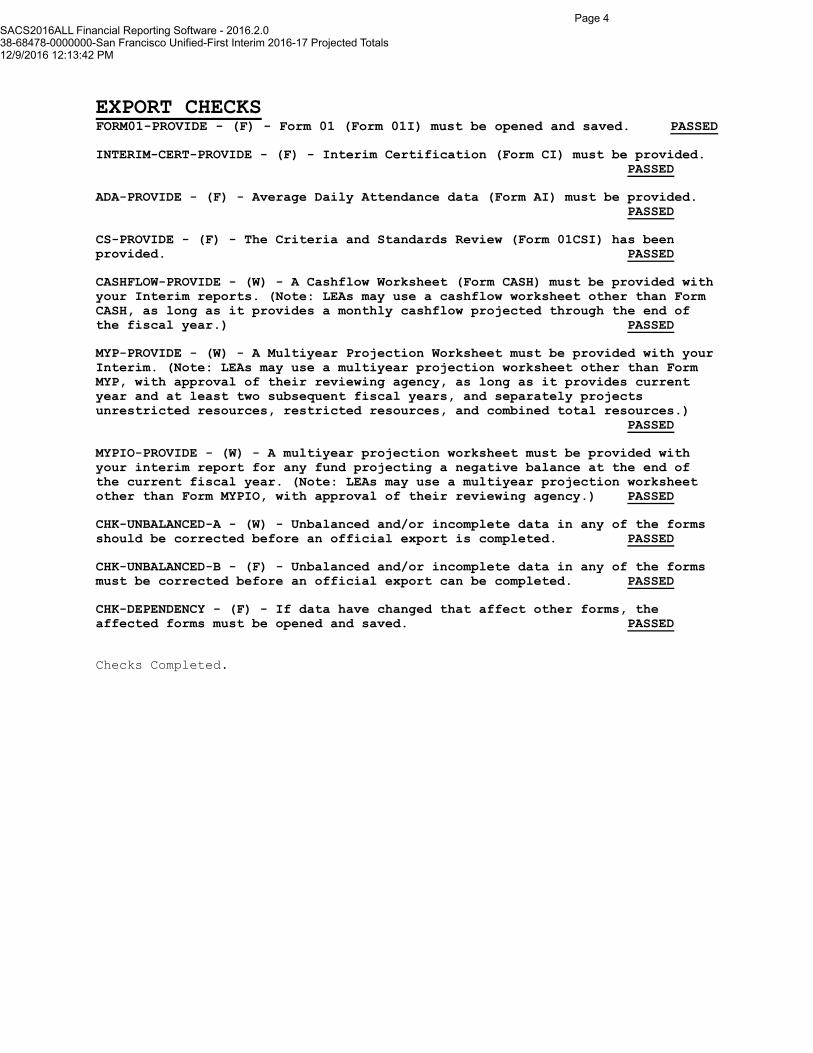
Page 4
SACS2016ALL Financial Reporting Software - 2016.2.038-68478-0000000-San Francisco Unified-First Interim 2016-17 Projected Totals12/9/2016 12:13:42 PM
EXPORT CHECKSFORM01-PROVIDE - (F) - Form 01 (Form 01I) must be opened and saved. PASSED
INTERIM-CERT-PROVIDE - (F) - Interim Certification (Form CI) must be provided.PASSED
ADA-PROVIDE - (F) - Average Daily Attendance data (Form AI) must be provided.PASSED
CS-PROVIDE - (F) - The Criteria and Standards Review (Form 01CSI) has been provided. PASSED
CASHFLOW-PROVIDE - (W) - A Cashflow Worksheet (Form CASH) must be provided with your Interim reports. (Note: LEAs may use a cashflow worksheet other than Form CASH, as long as it provides a monthly cashflow projected through the end of the fiscal year.) PASSED
MYP-PROVIDE - (W) - A Multiyear Projection Worksheet must be provided with your Interim. (Note: LEAs may use a multiyear projection worksheet other than Form MYP, with approval of their reviewing agency, as long as it provides current year and at least two subsequent fiscal years, and separately projects unrestricted resources, restricted resources, and combined total resources.)
PASSED
MYPIO-PROVIDE - (W) - A multiyear projection worksheet must be provided with your interim report for any fund projecting a negative balance at the end of the current fiscal year. (Note: LEAs may use a multiyear projection worksheet other than Form MYPIO, with approval of their reviewing agency.) PASSED
CHK-UNBALANCED-A - (W) - Unbalanced and/or incomplete data in any of the forms should be corrected before an official export is completed. PASSED
CHK-UNBALANCED-B - (F) - Unbalanced and/or incomplete data in any of the forms must be corrected before an official export can be completed. PASSED
CHK-DEPENDENCY - (F) - If data have changed that affect other forms, the affected forms must be opened and saved. PASSED
Checks Completed.