san francisco unified school district - sfusd: home 2016-17 … · · 2016-06-24san francisco...
TRANSCRIPT

Office of the Chief Financial Officer
Budget Division 135 Van Ness Avenue
San Francisco, CA 94102
Board of Education Office of the Superintendent
555 Franklin Street San Francisco, CA 94102
San Francisco Unified School District
Adopted budget For Fiscal year
2016~17
June 28, 2016
BOARD OF EDUCATION
MATT HANEY, PRESIDENT Shamann Walton, Vice President
SANDRA LEE FEWER HYDRA MENDOZA-MCDONNELL
EMILY M. MURASE, PH.D. RACHEL NORTON
JILL WYNNS
RECOMMENDED BY
RICHARD A. CARRANZA SUPERINTENDENT OF SCHOOLS
JUNE, 2016

This Page Is Intentionally Left Blank

Section Break
Insert Tab Here


San Francisco UnifiedSan Francisco County
July 1 BudgetFINANCIAL REPORTS
2016-17 BudgetSchool District Certification
38 68478 0000000Form CB
California Dept of EducationSACS Financial Reporting Software - 2016.1.0File: cb (Rev 04/12/2016) Page 1 of 4 Printed: 6/23/2016 5:01 PM
ANNUAL BUDGET REPORT:
July 1, 2016 Budget Adoption
Insert "X" in applicable boxes:
X This budget was developed using the state-adopted Criteria and Standards. It includes the expenditures
necessary to implement the Local Control and Accountability Plan (LCAP) or annual update to the LCAP that
will be effective for the budget year. The budget was filed and adopted subsequent to a public hearing by the
governing board of the school district pursuant to Education Code sections 33129, 42127, 52060, 52061, and
52062.
X If the budget includes a combined assigned and unassigned ending fund balance above the minimum
recommended reserve for economic uncertainties, at its public hearing, the school district complied with
the requirements of subparagraphs (B) and (C) of paragraph (2) of subdivision (a) of Education Code
Section 42127.
Budget available for inspection at: Public Hearing:
Place: 555 Franklin Street Board Office Place: 555 Franklin Street, San Francisco, CA 94102
Date: June 24, 2016 Date: June 28, 2016
Time: 6.00 P.M.
Adoption Date: June 28, 2016
Signed:
Clerk/Secretary of the Governing Board
(Original signature required)
Contact person for additional information on the budget reports:
Name: Thu Cung Telephone: (415) 241-6187, ext 1503
Title: Executive Director, Budget Services E-mail: [email protected]
Criteria and Standards Review Summary
The following summary is automatically completed based on data provided in the Criteria and Standards Review(Form 01CS). Criteria and standards that are "Not Met," and supplemental information and additional fiscalindicators that are "Yes," may indicate areas of potential concern for fiscal solvency purposes and should becarefully reviewed.
CRITERIA AND STANDARDS MetNotMet
1 Average Daily Attendance Budgeted (funded) ADA has not been overestimated by more than thestandard for the prior fiscal year, or two or more of the previous threefiscal years.
X

San Francisco UnifiedSan Francisco County
July 1 BudgetFINANCIAL REPORTS
2016-17 BudgetSchool District Certification
38 68478 0000000Form CB
California Dept of EducationSACS Financial Reporting Software - 2016.1.0File: cb (Rev 04/12/2016) Page 2 of 4 Printed: 6/23/2016 5:01 PM
CRITERIA AND STANDARDS (continued) MetNotMet
2 Enrollment Enrollment has not been overestimated by more than the standardfor the prior fiscal year, or two or more of the previous three fiscalyears.
X
3 ADA to Enrollment Projected second period (P-2) ADA to enrollment ratio is consistent withhistorical ratios for the budget and two subsequent fiscal years. X
4 Local Control FundingFormula (LCFF)
Projected change in LCFF is within the standard for the budget andtwo subsequent fiscal years. X
5 Salaries and Benefits Projected ratios of total unrestricted salaries and benefits to totalunrestricted general fund expenditures are consistent with historicalratios for the budget and two subsequent fiscal years.
X
6a Other Revenues Projected operating revenues (e.g., federal, other state, and otherlocal) are within the standard for the budget and two subsequentfiscal years.
X
6b Other Expenditures Projected operating expenditures (e.g., books and supplies, andservices and other operating) are within the standard for the budgetand two subsequent fiscal years.
X
7 Ongoing and MajorMaintenance Account
If applicable, required contribution to the ongoing and majormaintenance account (i.e., restricted maintenance account) isincluded in the budget.
X
8 Deficit Spending Unrestricted deficit spending, if any, has not exceeded the standardfor two or more of the last three fiscal years. X
9 Fund Balance Unrestricted general fund beginning balance has not beenoverestimated by more than the standard for two or more of the lastthree fiscal years.
X
10 Reserves Projected available reserves (e.g., reserve for economicuncertainties, unassigned/unappropriated amounts) meet minimumrequirements for the budget and two subsequent fiscal years.
X
SUPPLEMENTAL INFORMATION No YesS1 Contingent Liabilities Are there known or contingent liabilities (e.g., financial or program
audits, litigation, state compliance reviews) that may impact thebudget?
X
S2 Using One-time Revenuesto Fund OngoingExpenditures
Are there ongoing general fund expenditures in excess of onepercent of the total general fund expenditures that are funded withone-time resources?
X
S3 Using Ongoing Revenuesto Fund One-timeExpenditures
Are there large non-recurring general fund expenditures that arefunded with ongoing general fund revenues? X
S4 Contingent Revenues Are any projected revenues for the budget or two subsequent fiscalyears contingent on reauthorization by the local government, speciallegislation, or other definitive act (e.g., parcel taxes, forest reserves)? X
S5 Contributions Have contributions from unrestricted to restricted resources, ortransfers to or from the general fund to cover operating deficits,changed by more than the standard for the budget or twosubsequent fiscal years?
X

San Francisco UnifiedSan Francisco County
July 1 BudgetFINANCIAL REPORTS
2016-17 BudgetSchool District Certification
38 68478 0000000Form CB
California Dept of EducationSACS Financial Reporting Software - 2016.1.0File: cb (Rev 04/12/2016) Page 3 of 4 Printed: 6/23/2016 5:01 PM
SUPPLEMENTAL INFORMATION (continued) No YesS6 Long-term Commitments Does the district have long-term (multiyear) commitments or debt
agreements? X
• If yes, have annual payments for the budget or two subsequentfiscal years increased over prior year's (2015-16) annualpayment?
X
S7a Postemployment BenefitsOther than Pensions
Does the district provide postemployment benefits other thanpensions (OPEB)? X
• If yes, are they lifetime benefits? X
• If yes, do benefits continue beyond age 65? X
• If yes, are benefits funded by pay-as-you-go? X
S7b Other Self-insuranceBenefits
Does the district provide other self-insurance benefits (e.g., workers'compensation)? X
S8 Status of Labor Are salary and benefit negotiations still open for:
Agreements • Certificated? (Section S8A, Line 1) X
• Classified? (Section S8B, Line 1) X
• Management/supervisor/confidential? (Section S8C, Line 1) X
S9 Local Control andAccountability Plan (LCAP)
• Did or will the school district's governing board adopt an LCAP orapprove an update to the LCAP effective for the budget year? X
• Approval date for adoption of the LCAP or approval of an updateto the LCAP: Jun 28, 2016Jun 28, 2016
S10 LCAP Expenditures Does the school district's budget include the expenditures necessaryto implement the LCAP or annual update to the LCAP as describedin the Local Control and Accountability Plan and Annual UpdateTemplate, Section 3: Actions, Services, and Expenditures?
X
ADDITIONAL FISCAL INDICATORS No YesA1 Negative Cash Flow Do cash flow projections show that the district will end the budget
year with a negative cash balance in the general fund? X
A2 Independent PositionControl
Is personnel position control independent from the payroll system?X
A3 Declining Enrollment Is enrollment decreasing in both the prior fiscal year and budgetyear? X
A4 New Charter SchoolsImpacting DistrictEnrollment
Are any new charter schools operating in district boundaries that areimpacting the district's enrollment, either in the prior fiscal year orbudget year?
X
A5 Salary Increases ExceedCOLA
Has the district entered into a bargaining agreement where any of thebudget or subsequent fiscal years of the agreement would result insalary increases that are expected to exceed the projected statefunded cost-of-living adjustment?
X

San Francisco UnifiedSan Francisco County
July 1 BudgetFINANCIAL REPORTS
2016-17 BudgetSchool District Certification
38 68478 0000000Form CB
California Dept of EducationSACS Financial Reporting Software - 2016.1.0File: cb (Rev 04/12/2016) Page 4 of 4 Printed: 6/23/2016 5:01 PM
ADDITIONAL FISCAL INDICATORS (continued) No YesA6 Uncapped Health Benefits Does the district provide uncapped (100% employer paid) health
benefits for current or retired employees? X
A7 Independent FinancialSystem
Is the district’s financial system independent from the county officesystem? X
A8 Fiscal Distress Reports Does the district have any reports that indicate fiscal distress? If yes,provide copies to the COE, pursuant to EC 42127.6(a). X
A9 Change of CBO orSuperintendent
Have there been personnel changes in the superintendent or chiefbusiness official (CBO) positions within the last 12 months? X


This Page Is Intentionally Left Blank

Section Break
Insert Tab Here


San Francisco UnifiedSan Francisco County
2016-17 July 1 BudgetGeneral Fund
School District Criteria and Standards Review38 68478 0000000
Form 01CS
California Dept of EducationSACS Financial Reporting Software - 2016.1.0File: cs-a (Rev 06/01/2016) Page 1 of 28 Printed: 6/23/2016 4:42 PM
Provide methodology and assumptions used to estimate ADA, enrollment, revenues, expenditures, reserves and fund balance, and multiyear commitments (including cost-of-living adjustments).
Deviations from the standards must be explained and may affect the approval of the budget.
CRITERIA AND STANDARDS
1. CRITERION: Average Daily Attendance
STANDARD: Funded average daily attendance (ADA) has not been overestimated in 1) the first prior fiscal year OR in 2) two or more of the previous three fiscal years by more than the following percentage levels:
Percentage Level District ADA
3.0% 0 to 300
2.0% 301 to 1,000
1.0% 1,001 and over
District ADA (Form A, Estimated P-2 ADA column, lines A4 and C4): 56,346
District's ADA Standard Percentage Level: 1.0%
1A. Calculating the District's ADA Variances
DATA ENTRY: For the Third Prior Year, enter Revenue Limit ADA data in the Original Budget Funded ADA column. For the Second and First Prior Years, enter Estimated Funded ADA in theOriginal Budget Funded ADA column; enter district regular ADA and charter school ADA corresponding to financial data reported in the General Fund, only, for the Second and First Prior Years.All other data are extracted.
*Please note for FY 2013-14 estimated/unaudited actuals and 2014-15 original budget: Line C4 in Form A reflects total charter school ADA corresponding to financial data reported in funds 01,09, and 62. Please adjust charter school ADA or explain accordingly.
Original Budget Estimated/Unaudited Actuals ADA Variance Level
Funded ADA Funded ADA
(Form RL, Line 5c) (Form A, Lines A4 and C4)*
(Form A, Lines A4 and C4)* (Form A, Lines A4 and C4)
(Form A, Lines A4 and C4) (Form A, Lines A4 and C4) (If Budget is greater
Fiscal Year (Form A, Lines A4 and C4) than Actuals, else N/A) Status
Third Prior Year (2013-14) 51,166.23 51,124.31 0.1% Met
Second Prior Year (2014-15)
District Regular 51,142.79 51,064.07
Charter School
Total ADA 51,142.79 51,064.07 0.2% Met
First Prior Year (2015-16)
District Regular 51,027.32 50,594.77
Charter School 5,751.08
Total ADA 51,027.32 56,345.85 N/A Met
Budget Year (2016-17)
District Regular 50,594.77
Charter School 5,751.08
Total ADA 56,345.85
1B. Comparison of District ADA to the Standard
DATA ENTRY: Enter an explanation if the standard is not met.
1a. STANDARD MET - Funded ADA has not been overestimated by more than the standard percentage level for the first prior year.
Explanation:
(required if NOT met)
1b. STANDARD MET - Funded ADA has not been overestimated by more than the standard percentage level for two or more of the previous three years.
Explanation:
(required if NOT met)

San Francisco UnifiedSan Francisco County
2016-17 July 1 BudgetGeneral Fund
School District Criteria and Standards Review38 68478 0000000
Form 01CS
California Dept of EducationSACS Financial Reporting Software - 2016.1.0File: cs-a (Rev 06/01/2016) Page 2 of 28 Printed: 6/23/2016 4:42 PM

San Francisco UnifiedSan Francisco County
2016-17 July 1 BudgetGeneral Fund
School District Criteria and Standards Review38 68478 0000000
Form 01CS
California Dept of EducationSACS Financial Reporting Software - 2016.1.0File: cs-a (Rev 06/01/2016) Page 3 of 28 Printed: 6/23/2016 4:42 PM
2. CRITERION: Enrollment
STANDARD: Projected enrollment has not been overestimated in 1) the first prior fiscal year OR in 2) two or more of the previous three fiscal years by more than the following percentage levels:
Percentage Level District ADA
3.0% 0 to 300
2.0% 301 to 1,000
1.0% 1,001 and over
District ADA (Form A, Estimated P-2 ADA column, lines A4 and C4): 56,346
District's Enrollment Standard Percentage Level: 1.0%
2A. Calculating the District's Enrollment Variances
DATA ENTRY: Enter data in the Enrollment, Budget, column for all fiscal years and in the Enrollment, CBEDS Actual column for the First Prior Year; all other data are extracted or calculated.CBEDS Actual enrollment data preloaded in the District Regular lines will include both District Regular and Charter School enrollment. Districts will need to adjust the District Regular enrollmentlines and the Charter School enrollment lines accordingly. Enter district regular enrollment and charter school enrollment corresponding to financial data reported in the General Fund, only, forthe Budget, First and Second Prior Years.
Enrollment Variance Level
Enrollment (If Budget is greater
Fiscal Year Budget CBEDS Actual than Actual, else N/A) Status
Third Prior Year (2013-14) 53,033 57,620 N/A Met
Second Prior Year (2014-15)
District Regular 53,028 52,961
Charter School
Total Enrollment 53,028 52,961 0.1% Met
First Prior Year (2015-16)
District Regular 52,889 52,889
Charter School 2,879 2,879
Total Enrollment 55,768 55,768 0.0% Met
Budget Year (2016-17)
District Regular 52,889
Charter School 6,000
Total Enrollment 58,889
2B. Comparison of District Enrollment to the Standard
DATA ENTRY: Enter an explanation if the standard is not met.
1a. STANDARD MET - Enrollment has not been overestimated by more than the standard percentage level for the first prior year.
Explanation:
(required if NOT met)
1b. STANDARD MET - Enrollment has not been overestimated by more than the standard percentage level for two or more of the previous three years.
Explanation:
(required if NOT met)

San Francisco UnifiedSan Francisco County
2016-17 July 1 BudgetGeneral Fund
School District Criteria and Standards Review38 68478 0000000
Form 01CS
California Dept of EducationSACS Financial Reporting Software - 2016.1.0File: cs-a (Rev 06/01/2016) Page 4 of 28 Printed: 6/23/2016 4:42 PM
3. CRITERION: ADA to Enrollment
STANDARD: Projected second period (P-2) average daily attendance (ADA) to enrollment ratio for any of the budget year or two subsequent fiscal yearshas not increased from the historical average ratio from the three prior fiscal years by more than one half of one percent (0.5%).
3A. Calculating the District's ADA to Enrollment Standard
DATA ENTRY: All data are extracted or calculated. Data should reflect district regular and charter school ADA/enrollment corresponding to financial data reported in the General Fund, only, forall fiscal years.
*Please note for Fiscal Year 2013-14 estimated/unaudited actuals: Line C4 in Form A reflects total charter school ADA corresponding to financial data reported in funds 01, 09, and 62. Pleaseadjust charter school ADA or explain accordingly.
P-2 ADA
Estimated/Unaudited Actuals
(Form A, Lines A4 and C4)* Enrollment
(Form A, Lines A4 and C4) CBEDS Actual Historical Ratio
Fiscal Year (Form A, Lines A4 and C4) (Criterion 2, Item 2A) of ADA to Enrollment
Third Prior Year (2013-14) 54,055 57,620 93.8%
Second Prior Year (2014-15)
District Regular 51,055 52,961
Charter School
Total ADA/Enrollment 51,055 52,961 96.4%
First Prior Year (2015-16)
District Regular 50,595 52,889
Charter School 5,751 2,879
Total ADA/Enrollment 56,346 55,768 101.0%
Historical Average Ratio: 97.1%
District's ADA to Enrollment Standard (historical average ratio plus 0.5%): 97.6%
3B. Calculating the District's Projected Ratio of ADA to Enrollment
DATA ENTRY: Enter data in the Estimated P-2 ADA column for the two subsequent years. Enter data in the Enrollment column for the two subsequent years. Data should reflect district regularand charter school ADA/enrollment corresponding to financial data reported in the General Fund only, for all fiscal years. All other data are extracted or calculated.
Estimated P-2 ADA Enrollment
Budget Budget/Projected
Fiscal Year (Form A, Lines A4 and C4) (Criterion 2, Item 2A) Ratio of ADA to Enrollment Status
Budget Year (2016-17)
District Regular 50,595 52,889
Charter School 5,751 6,000
Total ADA/Enrollment 56,346 58,889 95.7% Met
1st Subsequent Year (2017-18)
District Regular 50,595 52,889
Charter School 5,751 6,000
Total ADA/Enrollment 56,346 58,889 95.7% Met
2nd Subsequent Year (2018-19)
District Regular 50,595 52,889
Charter School 5,751 6,000
Total ADA/Enrollment 56,346 58,889 95.7% Met
3C. Comparison of District ADA to Enrollment Ratio to the Standard
DATA ENTRY: Enter an explanation if the standard is not met.
1a. STANDARD MET - Projected P-2 ADA to enrollment ratio has not exceeded the standard for the budget and two subsequent fiscal years.
Explanation:
(required if NOT met)

San Francisco UnifiedSan Francisco County
2016-17 July 1 BudgetGeneral Fund
School District Criteria and Standards Review38 68478 0000000
Form 01CS
California Dept of EducationSACS Financial Reporting Software - 2016.1.0File: cs-a (Rev 06/01/2016) Page 5 of 28 Printed: 6/23/2016 4:42 PM
4. CRITERION: LCFF Revenue
STANDARD: Projected local control funding formula (LCFF) revenue for any of the budget year or two subsequent fiscal years has not changed from theprior fiscal year by more than the change in population, plus the district's gap funding or cost-of-living adjustment (COLA)¹ and its economic recoverytarget payment, plus or minus one percent.
For basic aid districts, projected LCFF revenue has not changed from the prior fiscal year by more than the percent change in property tax revenues plusor minus one percent.
For districts funded by necessary small school formulas, projected LCFF revenue has not changed from the prior fiscal year amount by more than thedistrict's gap funding or COLA¹ and its economic recovery target payment, plus or minus one percent.
¹Districts that are already at or above their LCFF target funding as described in Education Code Section 42238.03(d) receive no gap funding. These districts have a COLA applied totheir LCFF target, but their year-over-year revenue increase might be less than the statutory COLA due to certain local factors and components of the funding formula.
4A. District's LCFF Revenue Standard
Indicate which standard applies:
LCFF Revenue
Basic Aid
Necessary Small School
The District must select which LCFF revenue standard applies.
LCFF Revenue Standard selected: LCFF Revenue
4A1. Calculating the District's LCFF Revenue Standard
DATA ENTRY: Enter LCFF Target amounts for the budget and two subsequent fiscal years.Enter data in Step 1a for the two subsequent fiscal years. All other data is extracted or calculated.Enter data for Steps 2a through 2d. All other data is calculated.
Projected LCFF Revenue
Has the District reached its LCFFIf Yes, then COLA amount in Line 2b2 is used in Line 2e Total calculation.If No, then Gap Funding in Line 2c is used in Line 2e Total calculation.
target funding level? No
Budget Year 1st Subsequent Year 2nd Subsequent Year
(2016-17) (2017-18) (2018-19)
LCFF Target (Reference Only) 508,984,122.00 513,382,602.00 524,830,166.00
Prior Year Budget Year 1st Subsequent Year 2nd Subsequent Year
Step 1 - Change in Population (2015-16) (2016-17) (2017-18) (2018-19)a. ADA (Funded)
(Form A, lines A6 and C4) 56,400.67 56,400.67 56,400.67 56,400.67
b. Prior Year ADA (Funded) 56,400.67 56,400.67 56,400.67
c. Difference (Step 1a minus Step 1b) 0.00 0.00 0.00
d. Percent Change Due to Population
(Step 1c divided by Step 1b) 0.00% 0.00% 0.00%
Step 2 - Change in Funding Level
a. Prior Year LCFF Funding 485,941,956.00 508,984,122.00 513,382,602.00
b1. COLA percentage (if district is at target) Not Applicable
b2. COLA amount (proxy for purposes of thiscriterion) Not Applicable 0.00 0.00 0.00
c. Gap Funding (if district is not at target) 23,042,166.00 17,186,831.00 7,227,391.00d. Economic Recovery Target Funding
(current year increment)
e. Total (Lines 2b2 or 2c, as applicable, plus Line 2d) 23,042,166.00 17,186,831.00 7,227,391.00
f. Percent Change Due to Funding Level
(Step 2e divided by Step 2a) 4.74% 3.38% 1.41%
Step 3 - Total Change in Population and Funding Level
(Step 1d plus Step 2f) 4.74% 3.38% 1.41%
LCFF Revenue Standard (Step 3, plus/minus 1%): 3.74% to 5.74% 2.38% to 4.38% .41% to 2.41%

San Francisco UnifiedSan Francisco County
2016-17 July 1 BudgetGeneral Fund
School District Criteria and Standards Review38 68478 0000000
Form 01CS
California Dept of EducationSACS Financial Reporting Software - 2016.1.0File: cs-a (Rev 06/01/2016) Page 6 of 28 Printed: 6/23/2016 4:42 PM
4A2. Alternate LCFF Revenue Standard - Basic Aid
DATA ENTRY: If applicable to your district, input data in the 1st and 2nd Subsequent Year columns for projected local property taxes; all other data are extracted or calculated.
Basic Aid District Projected LCFF Revenue
Prior Year Budget Year 1st Subsequent Year 2nd Subsequent Year
(2015-16) (2016-17) (2017-18) (2018-19)
Projected Local Property Taxes
(Form 01, Objects 8021 - 8089) 369,830,434.00 369,830,434.00 369,830,434.00 369,830,434.00
Percent Change from Previous Year N/A N/A N/ABasic Aid Standard
(percent change from
previous year, plus/minus 1%): N/A N/A N/A
4A3. Alternate LCFF Revenue Standard - Necessary Small School
DATA ENTRY: All data are extracted or calculated.
Necessary Small School District Projected LCFF Revenue
Budget Year 1st Subsequent Year 2nd Subsequent Year
(2016-17) (2017-18) (2018-19)
Necessary Small School Standard
(Gap Funding or COLA, plus Economic Recovery Target Payment, Step 2f,plus/minus 1%): N/A N/A N/A
4B. Calculating the District's Projected Change in LCFF Revenue
DATA ENTRY: Enter data in the 1st and 2nd Subsequent Year columns for LCFF Revenue; all other data are extracted or calculated.
Prior Year Budget Year 1st Subsequent Year 2nd Subsequent Year
(2015-16) (2016-17) (2017-18) (2018-19)
LCFF Revenue
(Fund 01, Objects 8011, 8012, 8020-8089) 493,607,940.00 514,398,806.80 531,685,814.00 533,978,428.00
District's Projected Change in LCFF Revenue: 4.21% 3.36% 0.43%
LCFF Revenue Standard: 3.74% to 5.74% 2.38% to 4.38% .41% to 2.41%
Status: Met Met Met
4C. Comparison of District LCFF Revenue to the Standard
DATA ENTRY: Enter an explanation if the standard is not met.
1a. STANDARD MET - Projected change in LCFF revenue has met the standard for the budget and two subsequent fiscal years.
Explanation:
(required if NOT met)

San Francisco UnifiedSan Francisco County
2016-17 July 1 BudgetGeneral Fund
School District Criteria and Standards Review38 68478 0000000
Form 01CS
California Dept of EducationSACS Financial Reporting Software - 2016.1.0File: cs-a (Rev 06/01/2016) Page 7 of 28 Printed: 6/23/2016 4:42 PM
5. CRITERION: Salaries and Benefits
STANDARD: Projected ratio of total unrestricted salaries and benefits to total unrestricted general fund expenditures for any of the budget year or twosubsequent fiscal years has not changed from the historical average ratio from the three prior fiscal years by more than the greater of three percent or thedistrict's required reserves percentage.
It is likely that for many districts the 2014-15 and 2015-16 change from the historical average ratio will exceed the standard because certain revenues thatwere restricted prior to the LCFF are now unrestricted within the LCFF.
5A. Calculating the District's Historical Average Ratio of Unrestricted Salaries and Benefits to Total Unrestricted General Fund Expenditures
DATA ENTRY: All data are extracted or calculated.
Estimated/Unaudited Actuals - Unrestricted
(Resources 0000-1999) Ratio
Salaries and Benefits Total Expenditures of Unrestricted Salaries and Benefits
Fiscal Year (Form 01, Objects 1000-3999) (Form 01, Objects 1000-7499) to Total Unrestricted Expenditures
Third Prior Year (2013-14) 319,106,250.90 423,867,832.82 75.3%
Second Prior Year (2014-15) 350,192,604.25 463,443,787.71 75.6%
First Prior Year (2015-16) 378,292,982.00 506,902,645.59 74.6%
Historical Average Ratio: 75.2%
Budget Year 1st Subsequent Year 2nd Subsequent Year
(2016-17) (2017-18) (2018-19)
District's Reserve Standard Percentage(Criterion 10B, Line 4): 2.0% 2.0% 2.0%
District's Salaries and Benefits Standard
(historical average ratio, plus/minus the greater
of 3% or the district's reserve standard percentage): 72.2% to 78.2% 72.2% to 78.2% 72.2% to 78.2%
5B. Calculating the District's Projected Ratio of Unrestricted Salaries and Benefits to Total Unrestricted General Fund Expenditures
DATA ENTRY: If Form MYP exists, Unrestricted Salaries and Benefits, and Total Unrestricted Expenditures data for the 1st and 2nd Subsequent Years will be extracted; if not,
enter data for the two subsequent years. All other data are extracted or calculated.
Budget - Unrestricted
(Resources 0000-1999)
Salaries and Benefits Total Expenditures Ratio
(Form 01, Objects 1000-3999) (Form 01, Objects 1000-7499) of Unrestricted Salaries and Benefits
Fiscal Year (Form MYP, Lines B1-B3) (Form MYP, Lines B1-B8, B10) to Total Unrestricted Expenditures Status
Budget Year (2016-17) 401,365,043.50 539,717,570.92 74.4% Met
1st Subsequent Year (2017-18) 407,578,861.15 550,166,832.27 74.1% Met
2nd Subsequent Year (2018-19) 413,874,549.58 556,851,995.70 74.3% Met
5C. Comparison of District Salaries and Benefits Ratio to the Standard
DATA ENTRY: Enter an explanation if the standard is not met.
1a. STANDARD MET - Ratio of total unrestricted salaries and benefits to total unrestricted expenditures has met the standard for the budget and two subsequent fiscal years.
Explanation:
(required if NOT met)

San Francisco UnifiedSan Francisco County
2016-17 July 1 BudgetGeneral Fund
School District Criteria and Standards Review38 68478 0000000
Form 01CS
California Dept of EducationSACS Financial Reporting Software - 2016.1.0File: cs-a (Rev 06/01/2016) Page 8 of 28 Printed: 6/23/2016 4:42 PM
6. CRITERION: Other Revenues and Expenditures
STANDARD: Projected operating revenues (including federal, other state, and other local) or expenditures (including books and supplies,
and services and other operating), for any of the budget year or two subsequent fiscal years, have not changed from the prior fiscal year amount by morethan the percentage change in population and the funded cost-of-living adjustment (COLA) plus or minus ten percent.
For each major object category, changes that exceed the percentage change in population and the funded COLA plus or minus five percent must beexplained.
6A. Calculating the District's Other Revenues and Expenditures Standard Percentage Ranges
DATA ENTRY: All data are extracted or calculated.
Budget Year 1st Subsequent Year 2nd Subsequent Year
(2016-17) (2017-18) (2018-19)
1. District's Change in Population and Funding Level
(Criterion 4A1, Step 3): 4.74% 3.38% 1.41%
2. District's Other Revenues and Expenditures
Standard Percentage Range (Line 1, plus/minus 10%): -5.26% to 14.74% -6.62% to 13.38% -8.59% to 11.41%
3. District's Other Revenues and Expenditures
Explanation Percentage Range (Line 1, plus/minus 5%): -.26% to 9.74% -1.62% to 8.38% -3.59% to 6.41%
6B. Calculating the District's Change by Major Object Category and Comparison to the Explanation Percentage Range (Section 6A, Line 3)
DATA ENTRY: If Form MYP exists, the 1st and 2nd Subsequent Year data for each revenue and expenditure section will be extracted; if not, enter data for the two subsequent
years. All other data are extracted or calculated.
Explanations must be entered for each category if the percent change for any year exceeds the district's explanation percentage range.
Percent Change Change Is Outside
Object Range / Fiscal Year Amount Over Previous Year Explanation Range
Federal Revenue (Fund 01, Objects 8100-8299) (Form MYP, Line A2)
First Prior Year (2015-16) 32,713,102.09
Budget Year (2016-17) 29,813,391.54 -8.86% Yes
1st Subsequent Year (2017-18) 29,757,990.00 -0.19% No
2nd Subsequent Year (2018-19) 29,563,611.00 -0.65% No
Explanation:
(required if Yes)
The reduction in federal revenue in the budget year as compared to the first prior year id due to a reduction in Title IA, Title IIA and Title IV entitlements.
Other State Revenue (Fund 01, Objects 8300-8599) (Form MYP, Line A3)
First Prior Year (2015-16) 74,404,502.30
Budget Year (2016-17) 54,950,546.61 -26.15% Yes
1st Subsequent Year (2017-18) 42,763,115.00 -22.18% Yes
2nd Subsequent Year (2018-19) 42,625,428.00 -0.32% No
Explanation:
(required if Yes)
The reduction in Other State Revenue in the Budget Year and 1st Subsequent Year is due to a significant reduction in the one-time state discretionaryaward from $27 million in FY 2015-16 to $12 million in FY 2016-17 to $0 in FY 2017-18.
Other Local Revenue (Fund 01, Objects 8600-8799) (Form MYP, Line A4)
First Prior Year (2015-16) 176,768,998.61
Budget Year (2016-17) 171,347,764.83 -3.07% Yes
1st Subsequent Year (2017-18) 173,824,013.00 1.45% No
2nd Subsequent Year (2018-19) 176,298,788.00 1.42% No
Explanation:
(required if Yes)
Other Local Revenue in the First Prior Year ( FY 2015-16) included a one-time legal settlement amount of $3.5 million.
Books and Supplies (Fund 01, Objects 4000-4999) (Form MYP, Line B4)
First Prior Year (2015-16) 28,645,253.96
Budget Year (2016-17) 20,739,907.22 -27.60% Yes
1st Subsequent Year (2017-18) 20,739,907.12 0.00% No
2nd Subsequent Year (2018-19) 20,817,800.12 0.38% No
Explanation:
(required if Yes)
The reduction in Books and Supplies is because the FY 2015-16 projected expenditures include expenditure of prior year fund balances. Carryover fundsare not budgeted for the Budget Year.

San Francisco UnifiedSan Francisco County
2016-17 July 1 BudgetGeneral Fund
School District Criteria and Standards Review38 68478 0000000
Form 01CS
California Dept of EducationSACS Financial Reporting Software - 2016.1.0File: cs-a (Rev 06/01/2016) Page 9 of 28 Printed: 6/23/2016 4:42 PM
Services and Other Operating Expenditures (Fund 01, Objects 5000-5999) (Form MYP, Line B5)
First Prior Year (2015-16) 65,439,493.05
Budget Year (2016-17) 66,122,727.90 1.04% No
1st Subsequent Year (2017-18) 67,814,186.00 2.56% No
2nd Subsequent Year (2018-19) 65,586,498.00 -3.28% No
Explanation:
(required if Yes)
6C. Calculating the District's Change in Total Operating Revenues and Expenditures (Section 6A, Line 2)
DATA ENTRY: All data are extracted or calculated.
Percent Change
Object Range / Fiscal Year Amount Over Previous Year Status
Total Federal, Other State, and Other Local Revenue (Criterion 6B)
First Prior Year (2015-16) 283,886,603.00
Budget Year (2016-17) 256,111,702.98 -9.78% Not Met
1st Subsequent Year (2017-18) 246,345,118.00 -3.81% Met
2nd Subsequent Year (2018-19) 248,487,827.00 0.87% Met
Total Books and Supplies, and Services and Other Operating Expenditures (Criterion 6B)
First Prior Year (2015-16) 94,084,747.01
Budget Year (2016-17) 86,862,635.12 -7.68% Not Met
1st Subsequent Year (2017-18) 88,554,093.12 1.95% Met
2nd Subsequent Year (2018-19) 86,404,298.12 -2.43% Met
6D. Comparison of District Total Operating Revenues and Expenditures to the Standard Percentage Range
DATA ENTRY: Explanations are linked from Section 6B if the status in Section 6C is not met; no entry is allowed below.
1a. STANDARD NOT MET - Projected total operating revenues have changed by more than the standard in one or more of the budget or two subsequent fiscal years. Reasons for theprojected change, descriptions of the methods and assumptions used in the projections, and what changes, if any, will be made to bring the projected operating revenues within thestandard must be entered in Section 6A above and will also display in the explanation box below.
Explanation:
Federal Revenue
(linked from 6B
if NOT met)
The reduction in federal revenue in the budget year as compared to the first prior year id due to a reduction in Title IA, Title IIA and Title IV entitlements.
Explanation:
Other State Revenue
(linked from 6B
if NOT met)
The reduction in Other State Revenue in the Budget Year and 1st Subsequent Year is due to a significant reduction in the one-time state discretionaryaward from $27 million in FY 2015-16 to $12 million in FY 2016-17 to $0 in FY 2017-18.
Explanation:
Other Local Revenue
(linked from 6B
if NOT met)
Other Local Revenue in the First Prior Year ( FY 2015-16) included a one-time legal settlement amount of $3.5 million.
1b. STANDARD NOT MET - Projected total operating expenditures have changed by more than the standard in one or more of the budget or two subsequent fiscal years. Reasons for theprojected change, descriptions of the methods and assumptions used in the projections, and what changes, if any, will be made to bring the projected operating expenditures within thestandard must be entered in Section 6A above and will also display in the explanation box below.
Explanation:
Books and Supplies
(linked from 6B
if NOT met)
The reduction in Books and Supplies is because the FY 2015-16 projected expenditures include expenditure of prior year fund balances. Carryover fundsare not budgeted for the Budget Year.
Explanation:
Services and Other Exps
(linked from 6B
if NOT met)

San Francisco UnifiedSan Francisco County
2016-17 July 1 BudgetGeneral Fund
School District Criteria and Standards Review38 68478 0000000
Form 01CS
California Dept of EducationSACS Financial Reporting Software - 2016.1.0File: cs-a (Rev 06/01/2016) Page 10 of 28 Printed: 6/23/2016 4:42 PM
7. CRITERION: Facilities Maintenance
STANDARD: Confirm that the annual contribution for facilities maintenance funding is not less than the amount required pursuant to Education CodeSection 17070.75, if applicable, and that the district is providing adequately to preserve the functionality of its facilities for their normal life in accordancewith Education Code sections 52060(d)(1) and 17002(d)(1).
Determining the District's Compliance with the Contribution Requirement for EC Section 17070.75 as amended by AB 104 (Chapter 13, Statutes of 2015), effective2015-16 and 2016-17 - Ongoing and Major Maintenance/Restricted Maintenance Account (OMMA/RMA)
NOTE: AB 104 (Chapter 13, Statutes of 2015) requires the district to deposit into the account, for the 2015-16 and 2016-17 fiscal years, a minimum amount that is the lesser of 3% of the totalgeneral fund expenditures and other financing uses for that fiscal year or the amount that the district deposited into the account for the 2014-15 fiscal year.
DATA ENTRY: Click the appropriate Yes or No button for special education local plan area (SELPA) administrative units (AUs); all other data are extracted or calculated. If standard is not met,enter an X in the appropriate box and enter an explanation, if applicable.
1. a. For districts that are the AU of a SELPA, do you choose to exclude revenues that are passed through to participating members of
the SELPA from the OMMA/RMA required minimum contribution calculation? Yes
b. Pass-through revenues and apportionments that may be excluded from the OMMA/RMA calculation per EC Section 17070.75(b)(2)(D)
(Fund 10, resources 3300-3499 and 6500-6540, objects 7211-7213 and 7221-7223) 0.00
2. Ongoing and Major Maintenance/Restricted Maintenance Account
a. Budgeted Expenditures
and Other Financing Uses
(Form 01, objects 1000-7999) 760,600,014.65 3% of Total Current Year Required
b. Plus: Pass-through Revenues General Fund Expenditures Minimum Contribution/
and Apportionments and Other Financing Uses Amount Deposited¹ Lesser of Current Year or
(Line 1b, if line 1a is No) (Line 2c times 3%) for 2014-15 Fiscal Year 2014-15 Fiscal Year
c. Net Budgeted Expenditures
and Other Financing Uses 760,600,014.65 22,818,000.44 12,695,114.02 12,695,114.02
Budgeted Contribution ¹
to the Ongoing and Major
Maintenance Account Status
d. OMMA/RMA Contribution 22,778,406.00 Met
¹ Fund 01, Resource 8150, Objects 8900-8999
If standard is not met, enter an X in the box that best describes why the minimum required contribution was not made:
Not applicable (district does not participate in the Leroy F. Greene School Facilities Act of 1998)
Exempt (due to district's small size [EC Section 17070.75 (b)(2)(E)])
Other (explanation must be provided)
Explanation:
(required if NOT met
and Other is marked)

San Francisco UnifiedSan Francisco County
2016-17 July 1 BudgetGeneral Fund
School District Criteria and Standards Review38 68478 0000000
Form 01CS
California Dept of EducationSACS Financial Reporting Software - 2016.1.0File: cs-a (Rev 06/01/2016) Page 11 of 28 Printed: 6/23/2016 4:42 PM
8. CRITERION: Deficit Spending
STANDARD: Unrestricted deficit spending (total unrestricted expenditures and other financing uses is greater than total unrestricted revenues and otherfinancing sources) as a percentage of total unrestricted expenditures and other financing uses, has not exceeded one-third of the district's availablereserves¹ as a percentage of total expenditures and other financing uses² in two out of three prior fiscal years.
8A. Calculating the District's Deficit Spending Standard Percentage Levels
DATA ENTRY: All data are extracted or calculated.
Third Prior Year Second Prior Year First Prior Year
(2013-14) (2014-15) (2015-16)
1. District's Available Reserve Amounts (resources 0000-1999)
a. Reserve for Economic Uncertainties
(Funds 01 and 17, Object 9789) 12,125,058.00 13,043,451.00 0.00
b. Unassigned/Unappropriated
(Funds 01 and 17, Object 9790) 7,982,205.42 25,277,233.62 59,419,787.54
c. Negative General Fund Ending Balances in Restricted
Resources (Fund 01, Object 979Z, if negative, for each of
resources 2000-9999) (0.02) (0.02) 0.00
d. Available Reserves (Lines 1a through 1c) 20,107,263.40 38,320,684.60 59,419,787.54
2. Expenditures and Other Financing Uses
a. District's Total Expenditures and Other Financing Uses
(Fund 01, objects 1000-7999) 606,252,921.84 652,172,548.27 732,417,869.68
b. Plus: Special Education Pass-through Funds (Fund 10, resources
3300-3499 and 6500-6540, objects 7211-7213 and 7221-7223) 0.00
c. Total Expenditures and Other Financing Uses
(Line 2a plus Line 2b) 606,252,921.84 652,172,548.27 732,417,869.68
3. District's Available Reserve Percentage
(Line 1d divided by Line 2c) 3.3% 5.9% 8.1%
District's Deficit Spending Standard Percentage Levels
(Line 3 times 1/3): 1.1% 2.0% 2.7%
¹Available reserves are the unrestricted amounts in the Reserve for Economic Uncertainties
and the Unassigned/Unappropriated accounts in the General Fund and the Special Reserve
Fund for Other Than Capital Outlay Projects. Available reserves will be reduced by any negative
ending balances in restricted resources in the General Fund.
²A school district that is the Administrative Unit of a Special Education Local Plan Area (SELPA)
may exclude from its expenditures the distribution of funds to its participating members.
8B. Calculating the District's Deficit Spending Percentages
DATA ENTRY: All data are extracted or calculated.
Net Change in Total Unrestricted Expenditures Deficit Spending Level
Unrestricted Fund Balance and Other Financing Uses (If Net Change in Unrestricted Fund
Fiscal Year (Form 01, Section E) (Form 01, Objects 1000-7999) Balance is negative, else N/A) Status
Third Prior Year (2013-14) (11,695,282.91) 433,517,828.82 2.7% Not Met
Second Prior Year (2014-15) 14,540,826.48 471,128,122.90 N/A Met
First Prior Year (2015-16) 23,002,223.41 518,177,224.59 N/A Met
Budget Year (2016-17) (Information only) (7,534,947.16) 551,143,969.92
8C. Comparison of District Deficit Spending to the Standard
DATA ENTRY: Enter an explanation if the standard is not met.
1a. STANDARD MET - Unrestricted deficit spending, if any, has not exceeded the standard percentage level in two or more of the three prior years.
Explanation:
(required if NOT met)
The deficit spending in the Third Prior Year (2013-14) was due to the reinstatement of salaries to the full instructional calendar and elimination of furloughdays that had been implemented in the prior year across the District to address revenue shortfalls. In addition to the elimination of furloughs, the District'sagreement with its certificated bargaining unit to offset $5.5 million of certificated salaries and benefits from the unrestricted general fund to the QualityTeacher Education Actparcel tax also expired, and these expenditures reverted to the unrestricted general fund.

San Francisco UnifiedSan Francisco County
2016-17 July 1 BudgetGeneral Fund
School District Criteria and Standards Review38 68478 0000000
Form 01CS
California Dept of EducationSACS Financial Reporting Software - 2016.1.0File: cs-a (Rev 06/01/2016) Page 12 of 28 Printed: 6/23/2016 4:42 PM
9. CRITERION: Fund Balance
STANDARD: Budgeted beginning unrestricted general fund balance has not been overestimated for two out of three prior fiscal years by more than thefollowing percentage levels:
Percentage Level ¹ District ADA
1.7% 0 to 300
1.3% 301 to 1,000
1.0% 1,001 to 30,000
0.7% 30,001 to 400,000
0.3% 400,001 and over
¹ Percentage levels equate to a rate of deficit spending which would eliminate recommended reserves foreconomic uncertainties over a three year period.
District Estimated P-2 ADA (Form A, Lines A6 and C4): 56,401
District's Fund Balance Standard Percentage Level: 0.7%
9A. Calculating the District's Unrestricted General Fund Beginning Balance Percentages
DATA ENTRY: Enter data in the Original Budget column for the First, Second, and Third Prior Years; all other data are extracted or calculated.
Unrestricted General Fund Beginning Balance ² Beginning Fund Balance
(Form 01, Line F1e, Unrestricted Column) Variance Level
Fiscal Year Original Budget Estimated/Unaudited Actuals (If overestimated, else N/A) Status
Third Prior Year (2013-14) 34,102,155.00 36,073,429.56 N/A Met
Second Prior Year (2014-15) 24,548,793.68 24,378,146.65 0.7% Met
First Prior Year (2015-16) 33,540,828.58 36,417,564.13 N/A Met
Budget Year (2016-17) (Information only) 59,419,787.54
² Adjusted beginning balance, including audit adjustments and other restatements (objects 9791-9795)
9B. Comparison of District Unrestricted Beginning Fund Balance to the Standard
DATA ENTRY: Enter an explanation if the standard is not met.
1a. STANDARD MET - Unrestricted general fund beginning fund balance has not been overestimated by more than the standard percentage level for two or more of the previous threeyears.
Explanation:
(required if NOT met)

San Francisco UnifiedSan Francisco County
2016-17 July 1 BudgetGeneral Fund
School District Criteria and Standards Review38 68478 0000000
Form 01CS
California Dept of EducationSACS Financial Reporting Software - 2016.1.0File: cs-a (Rev 06/01/2016) Page 13 of 28 Printed: 6/23/2016 4:42 PM
10. CRITERION: Reserves
STANDARD: Available reserves¹ for any of the budget year or two subsequent fiscal years are not less than the following percentages or amounts² asapplied to total expenditures and other financing uses³:
DATA ENTRY: Budget Year data are extracted. Enter district regular ADA corresponding to financial data reported in the General Fund, only, for the twosubsequent years.
Percentage Level District ADA
5% or $66,000 (greater of) 0 to 300
4% or $66,000 (greater of) 301 to 1,000
3% 1,001 to 30,000
2% 30,001 to 400,000
1% 400,001 and over
¹ Available reserves are the unrestricted amounts in the Reserve for Economic Uncertainties and theUnassigned/Unappropriated accounts in the General Fund and the Special Reserve Fund for Other ThanCapital Outlay Projects. Available reserves will be reduced by any negative ending balances in restrictedresources in the General Fund.
² Dollar amounts to be adjusted annually by the prior year statutory cost-of-living adjustment (EducationCode Section 42238), rounded to the nearest thousand.
³ A school district that is the Administrative Unit (AU) of a Special Education Local Plan Area (SELPA) mayexclude from its expenditures the distribution of funds to its participating members.
Budget Year 1st Subsequent Year 2nd Subsequent Year
(2016-17) (2017-18) (2018-19)
District Estimated P-2 ADA (Form A, Line A4): 50,595 50,595 50,595
District's Reserve Standard Percentage Level: 2% 2% 2%
10A. Calculating the District's Special Education Pass-through Exclusions (only for districts that serve as the AU of a SELPA)
DATA ENTRY: For SELPA AUs, if Form MYP exists, all data will be extracted including the Yes/No button selection. If not, click the appropriate Yes or No button
for item 1 and, if Yes, enter data for item 2a and for the two subsequent years in item 2b; Budget Year data are extracted.
For districts that serve as the AU of a SELPA (Form MYP, Lines F1a, F1b1, and F1b2):
1. Do you choose to exclude from the reserve calculation the pass-through funds distributed to SELPA members? Yes2. If you are the SELPA AU and are excluding special education pass-through funds:
a. Enter the name(s) of the SELPA(s):
Budget Year 1st Subsequent Year 2nd Subsequent Year
(2016-17) (2017-18) (2018-19)
b. Special Education Pass-through Funds
(Fund 10, resources 3300-3499 and 6500-6540,
objects 7211-7213 and 7221-7223) 0.00
10B. Calculating the District's Reserve Standard
DATA ENTRY: If Form MYP exists, 1st and 2nd Subsequent Year data for lines 1 and 2 will be extracted; if not, enter data for the two subsequent years.
All other data are extracted or calculated.
Budget Year 1st Subsequent Year 2nd Subsequent Year
(2016-17) (2017-18) (2018-19)
1. Expenditures and Other Financing Uses
(Fund 01, objects 1000-7999) (Form MYP, Line B11) 760,600,014.65 774,296,348.20 784,127,311.51
2. Plus: Special Education Pass-through
(Criterion 10A, Line 2b, if Criterion 10A, Line 1 is No)
3. Total Expenditures and Other Financing Uses
(Line B1 plus Line B2) 760,600,014.65 774,296,348.20 784,127,311.51
4. Reserve Standard Percentage Level 2% 2% 2%
5. Reserve Standard - by Percent
(Line B3 times Line B4) 15,212,000.29 15,485,926.96 15,682,546.23
6. Reserve Standard - by Amount
($66,000 for districts with 0 to 1,000 ADA, else 0) 0.00 0.00 0.00
7. District's Reserve Standard
(Greater of Line B5 or Line B6) 15,212,000.29 15,485,926.96 15,682,546.23

San Francisco UnifiedSan Francisco County
2016-17 July 1 BudgetGeneral Fund
School District Criteria and Standards Review38 68478 0000000
Form 01CS
California Dept of EducationSACS Financial Reporting Software - 2016.1.0File: cs-a (Rev 06/01/2016) Page 14 of 28 Printed: 6/23/2016 4:42 PM
10C. Calculating the District's Budgeted Reserve Amount
DATA ENTRY: If Form MYP exists, 1st and 2nd Subsequent Year data for lines 1 through 7 will be extracted; if not, enter data for the two subsequent years.
All other data are extracted or calculated.
Reserve Amounts(Unrestricted resources 0000-1999 except Line 4):
Budget Year(2016-17)
1st Subsequent Year(2017-18)
2nd Subsequent Year(2018-19)
1. General Fund - Stabilization Arrangements
(Fund 01, Object 9750) (Form MYP, Line E1a) 0.00
2. General Fund - Reserve for Economic Uncertainties
(Fund 01, Object 9789) (Form MYP, Line E1b) 0.00 15,509,578.00 15,697,205.00
3. General Fund - Unassigned/Unappropriated Amount
(Fund 01, Object 9790) (Form MYP, Line E1c) 51,884,840.38 22,245,335.11 6,261,217.41
4. General Fund - Negative Ending Balances in Restricted Resources
(Fund 01, Object 979Z, if negative, for each of resources 2000-9999)
(Form MYP, Line E1d) (0.25) 0.00 0.00
5. Special Reserve Fund - Stabilization Arrangements
(Fund 17, Object 9750) (Form MYP, Line E2a) 0.00
6. Special Reserve Fund - Reserve for Economic Uncertainties
(Fund 17, Object 9789) (Form MYP, Line E2b) 0.00
7. Special Reserve Fund - Unassigned/Unappropriated Amount
(Fund 17, Object 9790) (Form MYP, Line E2c) 0.00
8. District's Budgeted Reserve Amount
(Lines C1 thru C7) 51,884,840.13 37,754,913.11 21,958,422.41
9. District's Budgeted Reserve Percentage (Information only)
(Line 8 divided by Section 10B, Line 3) 6.82% 4.88% 2.80%
District's Reserve Standard
(Section 10B, Line 7): 15,212,000.29 15,485,926.96 15,682,546.23
Status: Met Met Met
10D. Comparison of District Reserve Amount to the Standard
DATA ENTRY: Enter an explanation if the standard is not met.
1a. STANDARD MET - Projected available reserves have met the standard for the budget and two subsequent fiscal years.
Explanation:
(required if NOT met)

San Francisco UnifiedSan Francisco County
2016-17 July 1 BudgetGeneral Fund
School District Criteria and Standards Review38 68478 0000000
Form 01CS
California Dept of EducationSACS Financial Reporting Software - 2016.1.0File: cs-a (Rev 06/01/2016) Page 15 of 28 Printed: 6/23/2016 4:42 PM
SUPPLEMENTAL INFORMATION
DATA ENTRY: Click the appropriate Yes or No button for items S1 through S4. Enter an explanation for each Yes answer.
S1. Contingent Liabilities
1a. Does your district have any known or contingent liabilities (e.g., financial or program audits, litigation,
state compliance reviews) that may impact the budget? No
1b. If Yes, identify the liabilities and how they may impact the budget:
S2. Use of One-time Revenues for Ongoing Expenditures
1a. Does your district have ongoing general fund expenditures in the budget in excess of one percent of
the total general fund expenditures that are funded with one-time resources? No
1b. If Yes, identify the expenditures and explain how the one-time resources will be replaced to continue funding the ongoing expenditures in the following fiscal years:
S3. Use of Ongoing Revenues for One-time Expenditures
1a. Does your district have large non-recurring general fund expenditures that are funded with ongoing
general fund revenues? Yes
1b. If Yes, identify the expenditures:
The District has budgeted $4.75 Million in FY 2016-17 and an additional $1million in FY 2017-18 for IT software upgrades, including implementation ofnew human resource management and budget development systems.
S4. Contingent Revenues
1a. Does your district have projected revenues for the budget year or either of the two subsequent fiscal years
contingent on reauthorization by the local government, special legislation, or other definitive act
(e.g., parcel taxes, forest reserves)? No
1b. If Yes, identify any of these revenues that are dedicated for ongoing expenses and explain how the revenues will be replaced or expenditures reduced:

San Francisco UnifiedSan Francisco County
2016-17 July 1 BudgetGeneral Fund
School District Criteria and Standards Review38 68478 0000000
Form 01CS
California Dept of EducationSACS Financial Reporting Software - 2016.1.0File: cs-a (Rev 06/01/2016) Page 16 of 28 Printed: 6/23/2016 4:42 PM
S5. Contributions
Identify projected contributions from unrestricted resources in the general fund to restricted resources in the general fund for the budget year and two subsequent fiscal years. Providean explanation if contributions have changed from the prior fiscal year amounts by more than $20,000 and more than ten percent. Explanation should include whether contributions areongoing or one-time in nature.
Identify projected transfers to or from the general fund to cover operating deficits in either the general fund or any other fund for the budget year and two subsequent fiscal years.Provide an explanation if transfers have changed from the prior fiscal year amounts by more than $20,000 and more than ten percent. Explanation should include whether transfers areongoing or one-time in nature.
Estimate the impact of any capital projects on the general fund operational budget.
District's Contributions and Transfers Standard:-10.0% to +10.0%
or -$20,000 to +$20,000
S5A. Identification of the District's Projected Contributions, Transfers, and Capital Projects that may Impact the General Fund
DATA ENTRY: For Contributions, enter data in the Projection column for the 1st and 2nd Subsequent Years. Contributions for the First Prior Year and Budget Year will be extracted. ForTransfers In and Transfers Out, enter data in the First Prior Year. If Form MYP exists, the data will be extracted for the Budget Year, and 1st and 2nd Subsequent Years. If Form MYP does notexist, enter data in the Budget Year, 1st and 2nd subsequent Years. Click the appropriate button for item 1d; all other data will be calculated.
Description / Fiscal Year Projection Amount of Change Percent Change Status
1a. Contributions, Unrestricted General Fund (Fund 01, Resources 0000-1999, Object 8980)
First Prior Year (2015-16) (14,146,348.00)
Budget Year (2016-17) (14,921,192.04) 774,844.04 5.5% Met
1st Subsequent Year (2017-18) (15,571,677.00) 650,484.96 4.4% Met
2nd Subsequent Year (2018-19) (16,348,632.00) 776,955.00 5.0% Met
1b. Transfers In, General Fund *
First Prior Year (2015-16) 0.00
Budget Year (2016-17) 0.00 0.00 0.0% Met
1st Subsequent Year (2017-18) 0.00 0.00 0.0% Met
2nd Subsequent Year (2018-19) 0.00 0.00 0.0% Met
1c. Transfers Out, General Fund *
First Prior Year (2015-16) 12,838,579.00
Budget Year (2016-17) 12,990,399.00 151,820.00 1.2% Met
1st Subsequent Year (2017-18) 13,300,222.00 309,823.00 2.4% Met
2nd Subsequent Year (2018-19) 13,562,188.00 261,966.00 2.0% Met
1d. Impact of Capital Projects
Do you have any capital projects that may impact the general fund operational budget? No
* Include transfers used to cover operating deficits in either the general fund or any other fund.
S5B. Status of the District's Projected Contributions, Transfers, and Capital Projects
DATA ENTRY: Enter an explanation if Not Met for items 1a-1c or if Yes for item 1d.
1a. MET - Projected contributions have not changed by more than the standard for the budget and two subsequent fiscal years.
Explanation:
(required if NOT met)
1b. MET - Projected transfers in have not changed by more than the standard for the budget and two subsequent fiscal years.
Explanation:
(required if NOT met)

San Francisco UnifiedSan Francisco County
2016-17 July 1 BudgetGeneral Fund
School District Criteria and Standards Review38 68478 0000000
Form 01CS
California Dept of EducationSACS Financial Reporting Software - 2016.1.0File: cs-a (Rev 06/01/2016) Page 17 of 28 Printed: 6/23/2016 4:43 PM
1c. MET - Projected transfers out have not changed by more than the standard for the budget and two subsequent fiscal years.
Explanation:
(required if NOT met)
1d. NO - There are no capital projects that may impact the general fund operational budget.
Project Information:
(required if YES)
San Francisco UnifiedSan Francisco County
2016-17 July 1 BudgetGeneral Fund
School District Criteria and Standards Review38 68478 0000000
Form 01CS
California Dept of EducationSACS Financial Reporting Software - 2016.1.0File: cs-a (Rev 06/01/2016) Page 18 of 28 Printed: 6/23/2016 4:43 PM
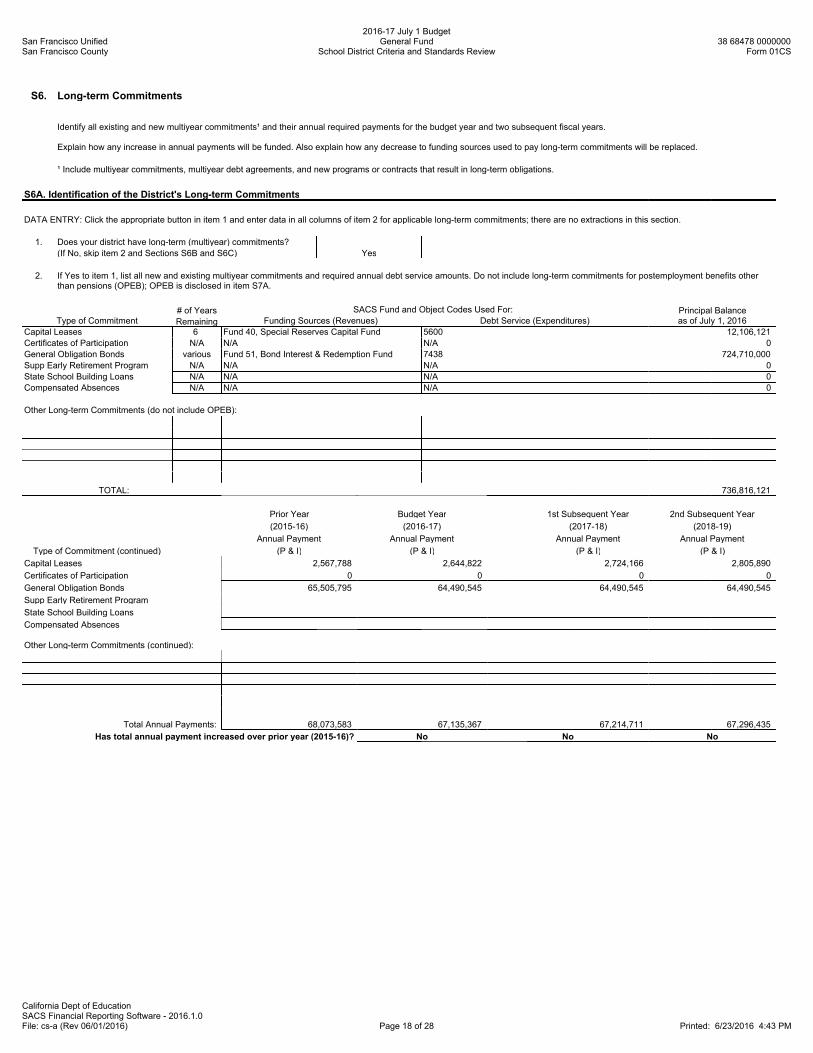
S6. Long-term Commitments
Identify all existing and new multiyear commitments¹ and their annual required payments for the budget year and two subsequent fiscal years.
Explain how any increase in annual payments will be funded. Also explain how any decrease to funding sources used to pay long-term commitments will be replaced.
¹ Include multiyear commitments, multiyear debt agreements, and new programs or contracts that result in long-term obligations.
S6A. Identification of the District's Long-term Commitments
DATA ENTRY: Click the appropriate button in item 1 and enter data in all columns of item 2 for applicable long-term commitments; there are no extractions in this section.
1. Does your district have long-term (multiyear) commitments?
(If No, skip item 2 and Sections S6B and S6C) Yes
2. If Yes to item 1, list all new and existing multiyear commitments and required annual debt service amounts. Do not include long-term commitments for postemployment benefits otherthan pensions (OPEB); OPEB is disclosed in item S7A.
# of Years SACS Fund and Object Codes Used For: Principal BalanceType of Commitment Remaining Funding Sources (Revenues) Debt Service (Expenditures) as of July 1, 2016
Capital Leases 6 Fund 40, Special Reserves Capital Fund 5600 12,106,121
Certificates of Participation N/A N/A N/A 0
General Obligation Bonds various Fund 51, Bond Interest & Redemption Fund 7438 724,710,000
Supp Early Retirement Program N/A N/A N/A 0
State School Building Loans N/A N/A N/A 0
Compensated Absences N/A N/A N/A 0
Other Long-term Commitments (do not include OPEB):
TOTAL: 736,816,121
Prior Year Budget Year 1st Subsequent Year 2nd Subsequent Year
(2015-16) (2016-17) (2017-18) (2018-19)
Annual Payment Annual Payment Annual Payment Annual Payment
Type of Commitment (continued) (P & I) (P & I) (P & I) (P & I)
Capital Leases 2,567,788 2,644,822 2,724,166 2,805,890
Certificates of Participation 0 0 0 0
General Obligation Bonds 65,505,795 64,490,545 64,490,545 64,490,545
Supp Early Retirement Program
State School Building Loans
Compensated Absences
Other Long-term Commitments (continued):
Total Annual Payments: 68,073,583 67,135,367 67,214,711 67,296,435
Has total annual payment increased over prior year (2015-16)? No No No

San Francisco UnifiedSan Francisco County
2016-17 July 1 BudgetGeneral Fund
School District Criteria and Standards Review38 68478 0000000
Form 01CS
California Dept of EducationSACS Financial Reporting Software - 2016.1.0File: cs-a (Rev 06/01/2016) Page 19 of 28 Printed: 6/23/2016 4:43 PM
S6B. Comparison of the District's Annual Payments to Prior Year Annual Payment
DATA ENTRY: Enter an explanation if Yes.
1a. No - Annual payments for long-term commitments have not increased in one or more of the budget and two subsequent fiscal years.
Explanation:
(required if Yes
to increase in total
annual payments)
S6C. Identification of Decreases to Funding Sources Used to Pay Long-term Commitments
DATA ENTRY: Click the appropriate Yes or No button in item 1; if Yes, an explanation is required in item 2.
1. Will funding sources used to pay long-term commitments decrease or expire prior to the end of the commitment period, or are they one-time sources?
No
2.
No - Funding sources will not decrease or expire prior to the end of the commitment period, and one-time funds are not being used for long-term commitment annual payments.
Explanation:
(required if Yes)

San Francisco UnifiedSan Francisco County
2016-17 July 1 BudgetGeneral Fund
School District Criteria and Standards Review38 68478 0000000
Form 01CS
California Dept of EducationSACS Financial Reporting Software - 2016.1.0File: cs-a (Rev 06/01/2016) Page 20 of 28 Printed: 6/23/2016 4:43 PM
S7. Unfunded Liabilities
Estimate the unfunded liability for postemployment benefits other than pensions (OPEB) based on an actuarial valuation, if required, or other method; identify or estimate the annualrequired contribution; and indicate how the obligation is funded (pay-as-you-go, amortized over a specific period, etc.).
Estimate the unfunded liability for self-insurance programs such as workers' compensation based on an actuarial valuation, if required, or other method; identify or estimate the requiredcontribution; and indicate how the obligation is funded (level of risk retained, funding approach, etc.).
S7A. Identification of the District's Estimated Unfunded Liability for Postemployment Benefits Other than Pensions (OPEB)
DATA ENTRY: Click the appropriate button in item 1 and enter data in all other applicable items; there are no extractions in this section except the budget year data on line 5b.
1. Does your district provide postemployment benefits other
than pensions (OPEB)? (If No, skip items 2-5) Yes
2. For the district's OPEB:
a. Are they lifetime benefits? No
b. Do benefits continue past age 65? No
c. Describe any other characteristics of the district's OPEB program including eligibility criteria and amounts, if any, that retirees are required to contribute toward their own benefits:
The District's post-employment benefits plan is a defined benefits health plan administered by the Health Services System of the City and County of SanFrancisco. The plan provides medical insurance benefits to eligible retirees and their spouses.Thenon-Medicare eligible retirees pay 50% of the activeemployees contributions up to cap, and the Medicare retirees pay 50% of the difference between medicare and active employee contributions up to cap.
3. a. Are OPEB financed on a pay-as-you-go, actuarial cost, or other method? Pay-as-you-go
b. Indicate any accumulated amounts earmarked for OPEB in a self-insurance or Self-Insurance Fund Governmental Fund
governmental fund 0 0
4. OPEB Liabilities
a. OPEB actuarial accrued liability (AAL) 680,924,643.00
b. OPEB unfunded actuarial accrued liability (UAAL) 680,924,643.00
c. Are AAL and UAAL based on the district's estimate or an
actuarial valuation? Actuarial
d. If based on an actuarial valuation, indicate the date of the OPEB valuation Nov 21, 2013
Budget Year 1st Subsequent Year 2nd Subsequent Year
5. OPEB Contributions (2016-17) (2017-18) (2018-19)
a. OPEB annual required contribution (ARC) per
actuarial valuation or Alternative Measurement
Method 64,141,676.00 64,141,676.00 64,141,676.00b. OPEB amount contributed (for this purpose, include premiums paid to a self-insurance fund) (funds 01-70, objects 3701-3752) 46,025,028.91 46,485,279.20 46,950,131.99
c. Cost of OPEB benefits (equivalent of "pay-as-you-go" amount) 65,212,435.00 65,212,435.00 65,212,435.00
d. Number of retirees receiving OPEB benefits 5,038 5,038 5,038

San Francisco UnifiedSan Francisco County
2016-17 July 1 BudgetGeneral Fund
School District Criteria and Standards Review38 68478 0000000
Form 01CS
California Dept of EducationSACS Financial Reporting Software - 2016.1.0File: cs-a (Rev 06/01/2016) Page 21 of 28 Printed: 6/23/2016 4:43 PM
S7B. Identification of the District's Unfunded Liability for Self-Insurance Programs
DATA ENTRY: Click the appropriate button in item 1 and enter data in all other applicable items; there are no extractions in this section.
1. Does your district operate any self-insurance programs such as workers' compensation,employee health and welfare, or property and liability? (Do not include OPEB, which iscovered in Section S7A) (If No, skip items 2-4)
Yes
2. Describe each self-insurance program operated by the district, including details for each such as level of risk retained, funding approach, basis for valuation (district's estimate oractuarial), and date of the valuation:
the District is self-insured for workers' compensation claims up to $500,000, and participates in the Schools Excess Liability Fund (SELF) for excesscoverage. The District is also self-insured for dental claims.
3. Self-Insurance Liabilities
a. Accrued liability for self-insurance programs 34,354,233.00
b. Unfunded liability for self-insurance programs 0.00
Budget Year 1st Subsequent Year 2nd Subsequent Year
4. Self-Insurance Contributions (2016-17) (2017-18) (2018-19)
a. Required contribution (funding) for self-insurance programs 21,090,040.00 21,090,040.00 21,090,040.00
b. Amount contributed (funded) for self-insurance programs 23,000,000.00 23,000,000.00 23,000,000.00

San Francisco UnifiedSan Francisco County
2016-17 July 1 BudgetGeneral Fund
School District Criteria and Standards Review38 68478 0000000
Form 01CS
California Dept of EducationSACS Financial Reporting Software - 2016.1.0File: cs-a (Rev 06/01/2016) Page 22 of 28 Printed: 6/23/2016 4:43 PM
S8. Status of Labor Agreements
Analyze the status of employee labor agreements. Identify new labor agreements, as well as new commitments provided as part of previously ratified multiyear agreements; and includeall contracts, including all administrator contracts (and including all compensation). For new agreements, indicate the date of the required board meeting. Compare the increase in newcommitments to the projected increase in ongoing revenues, and explain how these commitments will be funded in future fiscal years.
If salary and benefit negotiations are not finalized at budget adoption, upon settlement with certificated or classified staff:
The school district must determine the cost of the settlement, including salaries, benefits, and any other agreements that change costs, and provide thecounty office of education (COE) with an analysis of the cost of the settlement and its impact on the operating budget.
The county superintendent shall review the analysis relative to the criteria and standards, and may provide written comments to the president of the districtgoverning board and superintendent.
S8A. Cost Analysis of District's Labor Agreements - Certificated (Non-management) Employees
DATA ENTRY: Enter all applicable data items; there are no extractions in this section.
Prior Year (2nd Interim) Budget Year 1st Subsequent Year 2nd Subsequent Year
(2015-16) (2016-17) (2017-18) (2018-19)
Number of certificated (non-management)full-time-equivalent (FTE) positions 3,458.4 3,303.5 3,310.0 3,310.0
Certificated (Non-management) Salary and Benefit Negotiations
1. Are salary and benefit negotiations settled for the budget year? Yes
If Yes, and the corresponding public disclosure documentshave been filed with the COE, complete questions 2 and 3.
If Yes, and the corresponding public disclosure documentshave not been filed with the COE, complete questions 2-5.
If No, identify the unsettled negotiations including any prior year unsettled negotiations and then complete questions 6 and 7.
Negotiations Settled
2a. Per Government Code Section 3547.5(a), date of public disclosure board meeting: Dec 09, 2014
2b. Per Government Code Section 3547.5(b), was the agreement certified
by the district superintendent and chief business official? Yes
If Yes, date of Superintendent and CBO certification: Dec. 09, 2014
3. Per Government Code Section 3547.5(c), was a budget revision adopted
to meet the costs of the agreement? No
If Yes, date of budget revision board adoption:
4. Period covered by the agreement: Begin Date: Jul 01, 2014 End Date: Jun 30, 2017
5. Salary settlement: Budget Year 1st Subsequent Year 2nd Subsequent Year
(2016-17) (2017-18) (2018-19)
Is the cost of salary settlement included in the budget and multiyear
projections (MYPs)? Yes Yes Yes
One Year Agreement
Total cost of salary settlement
% change in salary schedule from prior year
or
Multiyear Agreement
Total cost of salary settlement 16,686,995 16,686,995 16,686,995
% change in salary schedule from prior year(may enter text, such as "Reopener") 5.0% reopener N/A
Identify the source of funding that will be used to support multiyear salary commitments:
District General Funds, including contributions to the Child Development and Cafeteria Funds, contributions into the District's General Fund from theQuality Teacher Education Act ($5,157,214 each year).

San Francisco UnifiedSan Francisco County
2016-17 July 1 BudgetGeneral Fund
School District Criteria and Standards Review38 68478 0000000
Form 01CS
California Dept of EducationSACS Financial Reporting Software - 2016.1.0File: cs-a (Rev 06/01/2016) Page 23 of 28 Printed: 6/23/2016 4:43 PM
Negotiations Not Settled
6. Cost of a one percent increase in salary and statutory benefits
Budget Year 1st Subsequent Year 2nd Subsequent Year
(2016-17) (2017-18) (2018-19)
7. Amount included for any tentative salary schedule increases
Budget Year 1st Subsequent Year 2nd Subsequent Year
Certificated (Non-management) Health and Welfare (H&W) Benefits (2016-17) (2017-18) (2018-19)
1. Are costs of H&W benefit changes included in the budget and MYPs? Yes Yes Yes
2. Total cost of H&W benefits
3. Percent of H&W cost paid by employer
4. Percent projected change in H&W cost over prior year
Certificated (Non-management) Prior Year Settlements
Are any new costs from prior year settlements included in the budget?
If Yes, amount of new costs included in the budget and MYPsIf Yes, explain the nature of the new costs:
Budget Year 1st Subsequent Year 2nd Subsequent Year
Certificated (Non-management) Step and Column Adjustments (2016-17) (2017-18) (2018-19)
1. Are step & column adjustments included in the budget and MYPs?
2. Cost of step & column adjustments
3. Percent change in step & column over prior year
Budget Year 1st Subsequent Year 2nd Subsequent Year
Certificated (Non-management) Attrition (layoffs and retirements) (2016-17) (2017-18) (2018-19)
1. Are savings from attrition included in the budget and MYPs?
2. Are additional H&W benefits for those laid-off or retired employeesincluded in the budget and MYPs?
Certificated (Non-management) - OtherList other significant contract changes and the cost impact of each change (i.e., class size, hours of employment, leave of absence, bonuses, etc.):
San Francisco UnifiedSan Francisco County
2016-17 July 1 BudgetGeneral Fund
School District Criteria and Standards Review38 68478 0000000
Form 01CS
California Dept of EducationSACS Financial Reporting Software - 2016.1.0File: cs-a (Rev 06/01/2016) Page 24 of 28 Printed: 6/23/2016 4:43 PM
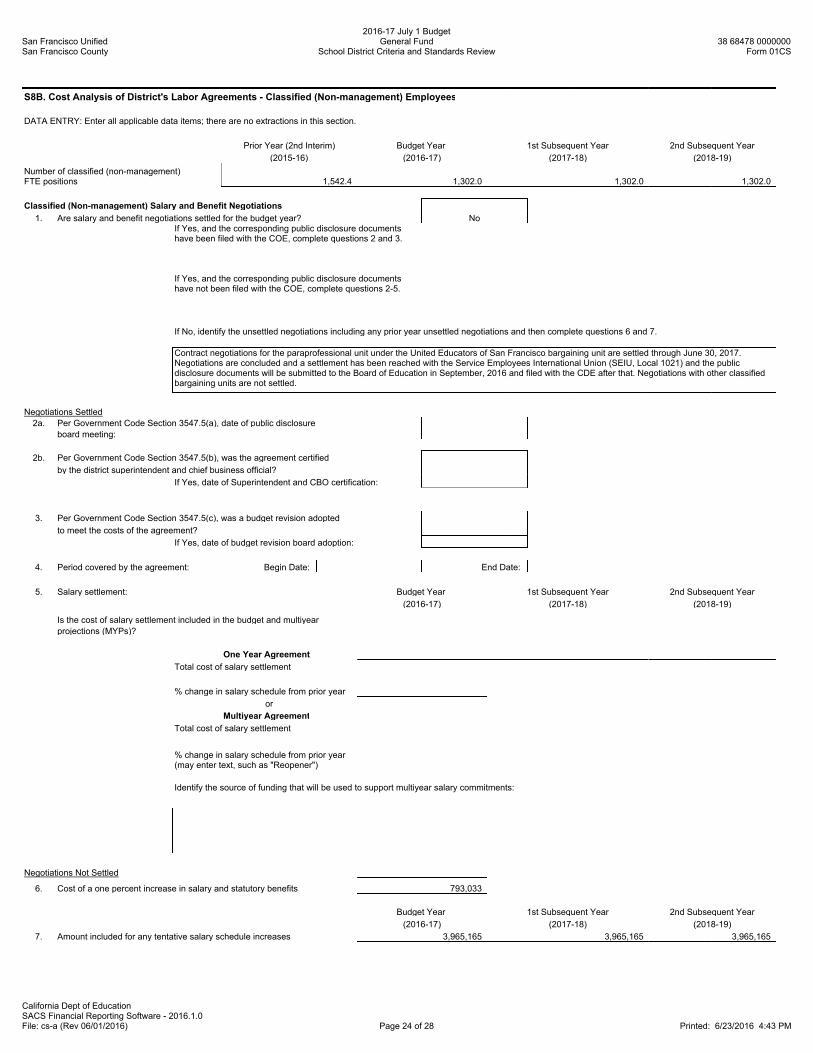
S8B. Cost Analysis of District's Labor Agreements - Classified (Non-management) Employees
DATA ENTRY: Enter all applicable data items; there are no extractions in this section.
Prior Year (2nd Interim) Budget Year 1st Subsequent Year 2nd Subsequent Year
(2015-16) (2016-17) (2017-18) (2018-19)
Number of classified (non-management)FTE positions 1,542.4 1,302.0 1,302.0 1,302.0
Classified (Non-management) Salary and Benefit Negotiations
1. Are salary and benefit negotiations settled for the budget year? NoIf Yes, and the corresponding public disclosure documentshave been filed with the COE, complete questions 2 and 3.
If Yes, and the corresponding public disclosure documentshave not been filed with the COE, complete questions 2-5.
If No, identify the unsettled negotiations including any prior year unsettled negotiations and then complete questions 6 and 7.
Contract negotiations for the paraprofessional unit under the United Educators of San Francisco bargaining unit are settled through June 30, 2017.Negotiations are concluded and a settlement has been reached with the Service Employees International Union (SEIU, Local 1021) and the publicdisclosure documents will be submitted to the Board of Education in September, 2016 and filed with the CDE after that. Negotiations with other classifiedbargaining units are not settled.
Negotiations Settled
2a. Per Government Code Section 3547.5(a), date of public disclosure
board meeting:
2b. Per Government Code Section 3547.5(b), was the agreement certified
by the district superintendent and chief business official?
If Yes, date of Superintendent and CBO certification:
3. Per Government Code Section 3547.5(c), was a budget revision adopted
to meet the costs of the agreement?
If Yes, date of budget revision board adoption:
4. Period covered by the agreement: Begin Date: End Date:
5. Salary settlement: Budget Year 1st Subsequent Year 2nd Subsequent Year
(2016-17) (2017-18) (2018-19)
Is the cost of salary settlement included in the budget and multiyear
projections (MYPs)?
One Year Agreement
Total cost of salary settlement
% change in salary schedule from prior year
or
Multiyear Agreement
Total cost of salary settlement
% change in salary schedule from prior year(may enter text, such as "Reopener")
Identify the source of funding that will be used to support multiyear salary commitments:
Negotiations Not Settled
6. Cost of a one percent increase in salary and statutory benefits 793,033
Budget Year 1st Subsequent Year 2nd Subsequent Year
(2016-17) (2017-18) (2018-19)
7. Amount included for any tentative salary schedule increases 3,965,165 3,965,165 3,965,165

San Francisco UnifiedSan Francisco County
2016-17 July 1 BudgetGeneral Fund
School District Criteria and Standards Review38 68478 0000000
Form 01CS
California Dept of EducationSACS Financial Reporting Software - 2016.1.0File: cs-a (Rev 06/01/2016) Page 25 of 28 Printed: 6/23/2016 4:43 PM
Budget Year 1st Subsequent Year 2nd Subsequent Year
Classified (Non-management) Health and Welfare (H&W) Benefits (2016-17) (2017-18) (2018-19)
1. Are costs of H&W benefit changes included in the budget and MYPs? Yes Yes Yes
2. Total cost of H&W benefits 11,978,400 11,978,400 11,978,400
3. Percent of H&W cost paid by employer 33.0% 33.0% 33.0%
4. Percent projected change in H&W cost over prior year 1.0% 1.0% 1.0%
Classified (Non-management) Prior Year Settlements
Are any new costs from prior year settlements included in the budget? No
If Yes, amount of new costs included in the budget and MYPsIf Yes, explain the nature of the new costs:
Budget Year 1st Subsequent Year 2nd Subsequent Year
Classified (Non-management) Step and Column Adjustments (2016-17) (2017-18) (2018-19)
1. Are step & column adjustments included in the budget and MYPs? Yes Yes Yes
2. Cost of step & column adjustments 793,033 793,033 793,033
3. Percent change in step & column over prior year 1.0% 1.0% 1.0%
Budget Year 1st Subsequent Year 2nd Subsequent Year
Classified (Non-management) Attrition (layoffs and retirements) (2016-17) (2017-18) (2018-19)
1. Are savings from attrition included in the budget and MYPs? Yes Yes Yes
2. Are additional H&W benefits for those laid-off or retired employeesincluded in the budget and MYPs? Yes Yes Yes
Classified (Non-management) - OtherList other significant contract changes and the cost impact of each change (i.e., hours of employment, leave of absence, bonuses, etc.):

San Francisco UnifiedSan Francisco County
2016-17 July 1 BudgetGeneral Fund
School District Criteria and Standards Review38 68478 0000000
Form 01CS
California Dept of EducationSACS Financial Reporting Software - 2016.1.0File: cs-a (Rev 06/01/2016) Page 26 of 28 Printed: 6/23/2016 4:43 PM
S8C. Cost Analysis of District's Labor Agreements - Management/Supervisor/Confidential Employees
DATA ENTRY: Enter all applicable data items; there are no extractions in this section.
Prior Year (2nd Interim) Budget Year 1st Subsequent Year 2nd Subsequent Year
(2015-16) (2016-17) (2017-18) (2018-19)
Number of management, supervisor, andconfidential FTE positions 392.9 406.5 406.5 406.5
Management/Supervisor/Confidential
Salary and Benefit Negotiations
1. Are salary and benefit negotiations settled for the budget year? Yes
If Yes, complete question 2.
If No, identify the unsettled negotiations including any prior year unsettled negotiations and then complete questions 3 and 4.
If n/a, skip the remainder of Section S8C.
Negotiations Settled
2. Salary settlement: Budget Year 1st Subsequent Year 2nd Subsequent Year
(2016-17) (2017-18) (2018-19)
Is the cost of salary settlement included in the budget and multiyear
projections (MYPs)? Yes Yes Yes
Total cost of salary settlement 3,061,165 3,061,165 3,061,165
% change in salary schedule from prior year(may enter text, such as "Reopener") 5.0% Reopener N/A
Negotiations Not Settled
3. Cost of a one percent increase in salary and statutory benefits
Budget Year 1st Subsequent Year 2nd Subsequent Year
(2016-17) (2017-18) (2018-19)
4. Amount included for any tentative salary schedule increases
Management/Supervisor/Confidential Budget Year 1st Subsequent Year 2nd Subsequent Year
Health and Welfare (H&W) Benefits (2016-17) (2017-18) (2018-19)
1. Are costs of H&W benefit changes included in the budget and MYPs?
2. Total cost of H&W benefits
3. Percent of H&W cost paid by employer
4. Percent projected change in H&W cost over prior year
Management/Supervisor/Confidential Budget Year 1st Subsequent Year 2nd Subsequent Year
Step and Column Adjustments (2016-17) (2017-18) (2018-19)
1. Are step & column adjustments included in the budget and MYPs?
2. Cost of step and column adjustments
3. Percent change in step & column over prior year
Management/Supervisor/Confidential Budget Year 1st Subsequent Year 2nd Subsequent Year
Other Benefits (mileage, bonuses, etc.) (2016-17) (2017-18) (2018-19)
1. Are costs of other benefits included in the budget and MYPs?
2. Total cost of other benefits
3. Percent change in cost of other benefits over prior year

San Francisco UnifiedSan Francisco County
2016-17 July 1 BudgetGeneral Fund
School District Criteria and Standards Review38 68478 0000000
Form 01CS
California Dept of EducationSACS Financial Reporting Software - 2016.1.0File: cs-a (Rev 06/01/2016) Page 27 of 28 Printed: 6/23/2016 4:43 PM
S9. Local Control and Accountability Plan (LCAP)
Confirm that the school district's governing board has adopted an LCAP or an update to the LCAP effective for the budget year.
DATA ENTRY: Click the appropriate Yes or No button in item 1, and enter the date in item 2.
1. Did or will the school district's governing board adopt an LCAP or approve an update to the LCAP effective for the budget year? Yes
2. Approval date for adoption of the LCAP or approval of an update to the LCAP. Jun 28, 2016
S10. LCAP Expenditures
Confirm that the school district's budget includes the expenditures necessary to implement the LCAP or annual update to the LCAP.
DATA ENTRY: Click the appropriate Yes or No button.
Does the school district's budget include the expenditures necessary to implement the LCAP or annual update to the LCAP as described
in the Local Control and Accountability Plan and Annual Update Template, Section 3: Actions, Services and Expenditures? Yes

San Francisco UnifiedSan Francisco County
2016-17 July 1 BudgetGeneral Fund
School District Criteria and Standards Review38 68478 0000000
Form 01CS
California Dept of EducationSACS Financial Reporting Software - 2016.1.0File: cs-a (Rev 06/01/2016) Page 28 of 28 Printed: 6/23/2016 4:43 PM
ADDITIONAL FISCAL INDICATORS
The following fiscal indicators are designed to provide additional data for reviewing agencies. A "Yes" answer to any single indicator does not necessarily suggest a cause for concern, but mayalert the reviewing agency to the need for additional review.
DATA ENTRY: Click the appropriate Yes or No button for items A1 through A9 except item A3, which is automatically completed based on data in Criterion 2.
A1. Do cash flow projections show that the district will end the budget year with a
negative cash balance in the general fund? No
A2. Is the system of personnel position control independent from the payroll system?
Yes
A3. Is enrollment decreasing in both the prior fiscal year and budget year? (Data from the
enrollment budget column and actual column of Criterion 2A are used to determine Yes or No) No
A4. Are new charter schools operating in district boundaries that impact the district's
enrollment, either in the prior fiscal year or budget year? No
A5. Has the district entered into a bargaining agreement where any of the budget
or subsequent years of the agreement would result in salary increases that Yes
are expected to exceed the projected state funded cost-of-living adjustment?
A6. Does the district provide uncapped (100% employer paid) health benefits for current or
retired employees? No
A7. Is the district's financial system independent of the county office system?
No
A8. Does the district have any reports that indicate fiscal distress pursuant to Education
Code Section 42127.6(a)? (If Yes, provide copies to the county office of education) No
A9. Have there been personnel changes in the superintendent or chief business
official positions within the last 12 months? No
When providing comments for additional fiscal indicators, please include the item number applicable to each comment.
Comments:
(optional)
End of School District Budget Criteria and Standards Review

Section Break
Insert Tab Here


San Francisco Unified School District FY 2016-2017 Adopted Budget
Budget Assumptions
General Fund Revenues Local Control Funding Formula (LCFF)
Per the Local Control Funding Formula, the San Francisco Unified School District (SFUSD) will
continue to receive the funding set at the 2012-13 base levels for revenue limit and state
categorical funding, including add-ons for the Targeted Instructional Improvement Grant and
Pupil Transportation
LCFF funding is calculated utilizing the latest version of the FCMAT calculator (v16.1c, release
date of April 13, 2015) and incorporates the following planning factors from the Governor’s
May Revised Budget Proposal
o A COLA of 0.00%
o Gap closing percentage factor at 54.84%
o A three-year rolling average for the unduplicated pupil count equal to 63.33% is used
o ADA used is actual 2015-16 ADA at P-2
o Enrollment is projected to increase by 100 students in 2015-16 as a result of additional
newcomer students and the opening of a new middle school with a focus on science
and technology. Enrollment in the following two out years is projected to remain flat
o ADA is projected to remain constant at 95% of enrollment
Planning factors for the Budget Year and Multi-Year Projections are as follows –
Fiscal Year
Planning Factor 2016-2017 2017-2018 2018-2019
COLA (DOF) 0.00% 1.11% 2.42%
LCFF Gap Funding % (DOF) 54.84% 73.96% 41.22%
STRS Employer Contribution Rate 12.58% 14.43% 16.28%
One-Time Discretionary Grant per ADA $237 $0 $0
MBG –District, K-8 per ADA $28 $28 $28
MBG – District, 9-12 per ADA $56 $56 $56
Lottery-Unrestricted, per ADA $140 $140 $140
Lottery-Prop 20 per ADA $41 $41 $41
Routine Restricted Maintenance Account Contribtn 3% 3% 3%
State Preschool Daily Reimbursement Rate $42.38 $42.38 $42.38
General Child Care Daily Reimbursement Rate $42.12 $42.12 $42.12
Comparison - 2016-2017 Adopted Budget and FY 2015-2016 Estimated
Actuals
Federal Revenue
Federal revenue is projected to reduce by approximately $2.8 million due to the following
reasons
o Approximately $2 million reduction in Title IA and Title II award due to the poverty
rate for San Francisco being above the state average resulting in the District receiving
a “hold harmless” level of funding at 85% of the prior year award
o Deferred revenue from existing federal awards are not budgeted in the Adopted
Budget
State Revenue
State revenue is projected to decrease for the following reasons
o A decrease of approximately $15 million over prior year level for the one-time
discretionary block grant budgeted at $237 per ADA
o A slight increase in state lottery revenue State Lottery revenue which is projected at
$140 per ADA for base (unrestricted) funding, and $41 per ADA for the restricted
(Proposition 20) apportionment
o Reduction of QEIA funding
Local Revenue
Local revenues are projected to reduce by $5.4 MM primarily due to reductions in local grants
and offsets in other miscellaneous local revenue
General Fund Expenditures Certificated and Classified Salary Costs
Total salaries show an increase of $23.7 million related to the following
o Step and column increases prorated for the actual number of months the increase is
effective in the fiscal year
o Cumulative increase of staggered 3% in 2015-16 and 5% effective in 2016-17. The
District has bargaining agreements in place for all its bargaining units through June 30,
2017
o Increased staffing, both direct site-based and central supports to schools
Employee Benefits

Employee benefits reflect an increase of $8.4 million as a result of the following
o $5.5 million increase due to an increase in the employer contribution rate for STRS
from 10.73% to 12.58%
o $2.9 million as a result of the increase in the base salaries due to bargaining outcomes
Books and Supplies
Books and Supplies are lower by $7.9 million because expenditure of unspent balances from
current year awards are not budgeted in the Adopted Budget
Services and Other Operating Expenditures
Services and Other Operating Expenditures are increasing by $0.7 million due to increased
contract costs
Capital Outlay
Expenditures on capital outlay are increasing by $0.3 million due to additional warehouse and
facilities costs.
Once the District’s books are closed for the current year, unspent balances will be appropriated in the
2016-17 budget and the Books and Supplies, Services & Contracts, and Capital Outlay expenditure
budgets may increase.
Other Outgo
Other outgo/District contribution to the COE is projected to increase by $2.9 MM due to the
following
o Increase in the District contribution to the Special Education program resulting from
increased personnel costs related to negotiated salary increases, increases in the
CALSTRS employer contribution rate, and increased tuition costs for non-public school
placements ($1.0 million)
o Renewal of the bus transportation contract for a 5 year period resulting in a $1.9
million increase over the previous contract
Inter-fund Transfers
Inter-fund transfers are projected to increase by $0.2 million due primarily to an increase in
the District’s support to Cafeteria programs
Indirect Costs
Indirect costs are charged to restricted programs where allowable at the CDE approved rate of
4.01% for 2016-17. Indirect costs are budgeted by program for transfer to offset
administrative costs in the unrestricted general fund. Indirect cost charges are projected to

increase as new awards and carryover balances are received and budgeted during the course
of the fiscal year.
Fund Balance
Total ending fund balance (unrestricted and restricted) is projected to decrease by
approximately $7.5 million primarily due to reductions in revenue and increases in
expenditure, particularly in salaries and benefits in accordance with collective bargaining
agreements and Cal STRS increases.

San Francisco UnifiedSan Francisco County
July 1 BudgetGeneral Fund
Unrestricted and RestrictedExpenditures by Object
38 68478 0000000Form 01
California Dept of EducationSACS Financial Reporting Software - 2016.1.0File: fund-a (Rev 03/22/2016) Page 1 Printed: 6/23/2016 4:37 PM
2015-16 Estimated Actuals 2016-17 Budget
Description Resource CodesObjectCodes
Unrestricted(A)
Restricted(B)
Total Fundcol. A + B
(C)Unrestricted
(D)Restricted
(E)
Total Fundcol. D + E
(F)
% DiffColumnC & F
A. REVENUES
1) LCFF Sources 8010-8099 469,218,343.00 0.00 469,218,343.00 490,009,209.80 0.00 490,009,209.80 4.4%
2) Federal Revenue 8100-8299 621,696.00 32,091,406.09 32,713,102.09 500,000.00 29,313,391.54 29,813,391.54 -8.9%
3) Other State Revenue 8300-8599 35,760,747.00 38,643,755.30 74,404,502.30 20,857,108.00 34,093,438.61 54,950,546.61 -26.1%
4) Other Local Revenue 8600-8799 49,725,010.00 127,043,988.61 176,768,998.61 47,163,897.00 124,183,867.83 171,347,764.83 -3.1%
5) TOTAL, REVENUES 555,325,796.00 197,779,150.00 753,104,946.00 558,530,214.80 187,590,697.98 746,120,912.78 -0.9%
B. EXPENDITURES
1) Certificated Salaries 1000-1999 211,600,000.00 69,472,815.02 281,072,815.02 222,548,376.53 74,312,162.10 296,860,538.63 5.6%
2) Classified Salaries 2000-2999 58,500,000.00 24,889,152.67 83,389,152.67 63,479,884.01 27,796,439.81 91,276,323.82 9.5%
3) Employee Benefits 3000-3999 108,192,982.00 54,458,307.25 162,651,289.25 115,336,782.96 55,680,786.64 171,017,569.60 5.1%
4) Books and Supplies 4000-4999 12,368,000.00 16,277,253.96 28,645,253.96 12,950,620.12 7,789,287.10 20,739,907.22 -27.6%
5) Services and Other Operating Expenditures 5000-5999 23,700,000.00 41,739,493.05 65,439,493.05 30,585,421.30 35,537,306.60 66,122,727.90 1.0%
6) Capital Outlay 6000-6999 15,000.00 1,004,327.00 1,019,327.00 115,500.00 1,158,650.48 1,274,150.48 25.0%
7) Other Outgo (excluding Transfers of Indirect 7100-7299
Costs) 7400-7499 98,647,367.00 1,079,199.70 99,726,566.70 101,536,932.00 1,152,272.00 102,689,204.00 3.0%
8) Other Outgo - Transfers of Indirect Costs 7300-7399 (6,120,703.41) 3,756,096.44 (2,364,606.97) (6,835,946.00) 4,465,140.00 (2,370,806.00) 0.3%
9) TOTAL, EXPENDITURES 506,902,645.59 212,676,645.09 719,579,290.68 539,717,570.92 207,892,044.73 747,609,615.65 3.9%
C. EXCESS (DEFICIENCY) OF REVENUES
OVER EXPENDITURES BEFORE OTHER
FINANCING SOURCES AND USES (A5 - B9) 48,423,150.41 (14,897,495.09) 33,525,655.32 18,812,643.88 (20,301,346.75) (1,488,702.87) -104.4%
D. OTHER FINANCING SOURCES/USES
1) Interfund Transfers
a) Transfers In 8900-8929 0.00 0.00 0.00 0.00 0.00 0.00 0.0%
b) Transfers Out 7600-7629 11,274,579.00 1,564,000.00 12,838,579.00 11,426,399.00 1,564,000.00 12,990,399.00 1.2%
2) Other Sources/Uses
a) Sources 8930-8979 0.00 0.00 0.00 0.00 0.00 0.00 0.0%
b) Uses 7630-7699 0.00 0.00 0.00 0.00 0.00 0.00 0.0%
3) Contributions 8980-8999 (14,146,348.00) 14,146,347.22 (0.78) (14,921,192.04) 14,921,192.00 (0.04) -94.9%
4) TOTAL, OTHER FINANCING SOURCES/USES (25,420,927.00) 12,582,347.22 (12,838,579.78) (26,347,591.04) 13,357,192.00 (12,990,399.04) 1.2%

San Francisco UnifiedSan Francisco County
July 1 BudgetGeneral Fund
Unrestricted and RestrictedExpenditures by Object
38 68478 0000000Form 01
California Dept of EducationSACS Financial Reporting Software - 2016.1.0File: fund-a (Rev 03/22/2016) Page 2 Printed: 6/23/2016 4:37 PM
2015-16 Estimated Actuals 2016-17 Budget
Description Resource CodesObjectCodes
Unrestricted(A)
Restricted(B)
Total Fundcol. A + B
(C)Unrestricted
(D)Restricted
(E)
Total Fundcol. D + E
(F)
% DiffColumnC & F
E. NET INCREASE (DECREASE) IN FUND
BALANCE (C + D4) 23,002,223.41 (2,315,147.87) 20,687,075.54 (7,534,947.16) (6,944,154.75) (14,479,101.91) -170.0%
F. FUND BALANCE, RESERVES
1) Beginning Fund Balance
a) As of July 1 - Unaudited 9791 38,918,973.13 32,898,938.56 71,817,911.69 59,419,787.54 30,583,790.69 90,003,578.23 25.3%
b) Audit Adjustments 9793 (2,501,409.00) 0.00 (2,501,409.00) 0.00 0.00 0.00 -100.0%
c) As of July 1 - Audited (F1a + F1b) 36,417,564.13 32,898,938.56 69,316,502.69 59,419,787.54 30,583,790.69 90,003,578.23 29.8%
d) Other Restatements 9795 0.00 0.00 0.00 0.00 0.00 0.00 0.0%
e) Adjusted Beginning Balance (F1c + F1d) 36,417,564.13 32,898,938.56 69,316,502.69 59,419,787.54 30,583,790.69 90,003,578.23 29.8%
2) Ending Balance, June 30 (E + F1e) 59,419,787.54 30,583,790.69 90,003,578.23 51,884,840.38 23,639,635.94 75,524,476.32 -16.1%
Components of Ending Fund Balance
a) Nonspendable
Revolving Cash 9711 0.00 0.00 0.00 0.00 0.00 0.00 0.0%
Stores 9712 0.00 0.00 0.00 0.00 0.00 0.00 0.0%
Prepaid Expenditures 9713 0.00 0.00 0.00 0.00 0.00 0.00 0.0%
All Others 9719 0.00 0.00 0.00 0.00 0.00 0.00 0.0%
b) Restricted 9740 0.00 30,583,790.69 30,583,790.69 0.00 23,639,636.19 23,639,636.19 -22.7%
c) Committed
Stabilization Arrangements 9750 0.00 0.00 0.00 0.00 0.00 0.00 0.0%
Other Commitments 9760 0.00 0.00 0.00 0.00 0.00 0.00 0.0%
d) Assigned
Other Assignments 9780 0.00 0.00 0.00 0.00 0.00 0.00 0.0%
e) Unassigned/unappropriated
Reserve for Economic Uncertainties 9789 0.00 0.00 0.00 0.00 0.00 0.00 0.0%
Unassigned/Unappropriated Amount 9790 59,419,787.54 0.00 59,419,787.54 51,884,840.38 (0.25) 51,884,840.13 -12.7%

San Francisco UnifiedSan Francisco County
July 1 BudgetGeneral Fund
Unrestricted and RestrictedExpenditures by Object
38 68478 0000000Form 01
California Dept of EducationSACS Financial Reporting Software - 2016.1.0File: fund-a (Rev 03/22/2016) Page 3 Printed: 6/23/2016 4:37 PM
2015-16 Estimated Actuals 2016-17 Budget
Description Resource CodesObjectCodes
Unrestricted(A)
Restricted(B)
Total Fundcol. A + B
(C)Unrestricted
(D)Restricted
(E)
Total Fundcol. D + E
(F)
% DiffColumnC & F
G. ASSETS
1) Cash
a) in County Treasury 9110 0.00 0.00 0.00
1) Fair Value Adjustment to Cash in County Treasury 9111 0.00 0.00 0.00
b) in Banks 9120 0.00 0.00 0.00
c) in Revolving Fund 9130 0.00 0.00 0.00
d) with Fiscal Agent 9135 0.00 0.00 0.00
e) collections awaiting deposit 9140 0.00 0.00 0.00
2) Investments 9150 0.00 0.00 0.00
3) Accounts Receivable 9200 0.00 0.00 0.00
4) Due from Grantor Government 9290 0.00 0.00 0.00
5) Due from Other Funds 9310 0.00 0.00 0.00
6) Stores 9320 0.00 0.00 0.00
7) Prepaid Expenditures 9330 0.00 0.00 0.00
8) Other Current Assets 9340 0.00 0.00 0.00
9) TOTAL, ASSETS 0.00 0.00 0.00
H. DEFERRED OUTFLOWS OF RESOURCES
1) Deferred Outflows of Resources 9490 0.00 0.00 0.00
2) TOTAL, DEFERRED OUTFLOWS 0.00 0.00 0.00
I. LIABILITIES
1) Accounts Payable 9500 0.00 0.00 0.00
2) Due to Grantor Governments 9590 0.00 0.00 0.00
3) Due to Other Funds 9610 0.00 0.00 0.00
4) Current Loans 9640 0.00 0.00 0.00
5) Unearned Revenue 9650 0.00 0.00 0.00
6) TOTAL, LIABILITIES 0.00 0.00 0.00
J. DEFERRED INFLOWS OF RESOURCES
1) Deferred Inflows of Resources 9690 0.00 0.00 0.00
2) TOTAL, DEFERRED INFLOWS 0.00 0.00 0.00
K. FUND EQUITY
Ending Fund Balance, June 30

San Francisco UnifiedSan Francisco County
July 1 BudgetGeneral Fund
Unrestricted and RestrictedExpenditures by Object
38 68478 0000000Form 01
California Dept of EducationSACS Financial Reporting Software - 2016.1.0File: fund-a (Rev 03/22/2016) Page 4 Printed: 6/23/2016 4:37 PM
2015-16 Estimated Actuals 2016-17 Budget
Description Resource CodesObjectCodes
Unrestricted(A)
Restricted(B)
Total Fundcol. A + B
(C)Unrestricted
(D)Restricted
(E)
Total Fundcol. D + E
(F)
% DiffColumnC & F
(G9 + H2) - (I6 + J2) 0.00 0.00 0.00

San Francisco UnifiedSan Francisco County
July 1 BudgetGeneral Fund
Unrestricted and RestrictedExpenditures by Object
38 68478 0000000Form 01
California Dept of EducationSACS Financial Reporting Software - 2016.1.0File: fund-a (Rev 03/22/2016) Page 5 Printed: 6/23/2016 4:37 PM
2015-16 Estimated Actuals 2016-17 Budget
Description Resource CodesObjectCodes
Unrestricted(A)
Restricted(B)
Total Fundcol. A + B
(C)Unrestricted
(D)Restricted
(E)
Total Fundcol. D + E
(F)
% DiffColumnC & F
LCFF SOURCES
Principal Apportionment
State Aid - Current Year 8011 113,477,506.00 0.00 113,477,506.00 134,268,372.80 0.00 134,268,372.80 18.3%
Education Protection Account State Aid - Current Year 8012 10,300,000.00 0.00 10,300,000.00 10,300,000.00 0.00 10,300,000.00 0.0%
State Aid - Prior Years 8019 0.00 0.00 0.00 0.00 0.00 0.00 0.0%
Tax Relief Subventions
Homeowners' Exemptions 8021 497,373.00 0.00 497,373.00 497,373.00 0.00 497,373.00 0.0%
Timber Yield Tax 8022 0.00 0.00 0.00 0.00 0.00 0.00 0.0%
Other Subventions/In-Lieu Taxes 8029 0.00 0.00 0.00 0.00 0.00 0.00 0.0%
County & District Taxes
Secured Roll Taxes 8041 133,239,316.00 0.00 133,239,316.00 133,239,316.00 0.00 133,239,316.00 0.0%
Unsecured Roll Taxes 8042 7,975,814.00 0.00 7,975,814.00 7,975,814.00 0.00 7,975,814.00 0.0%
Prior Years' Taxes 8043 52,999.00 0.00 52,999.00 52,999.00 0.00 52,999.00 0.0%
Supplemental Taxes 8044 4,680,117.00 0.00 4,680,117.00 4,680,117.00 0.00 4,680,117.00 0.0%
Education Revenue Augmentation
Fund (ERAF) 8045 221,218,271.00 0.00 221,218,271.00 221,218,271.00 0.00 221,218,271.00 0.0%
Community Redevelopment Funds
(SB 617/699/1992) 8047 2,166,544.00 0.00 2,166,544.00 2,166,544.00 0.00 2,166,544.00 0.0%
Penalties and Interest from
Delinquent Taxes 8048 0.00 0.00 0.00 0.00 0.00 0.00 0.0%
Miscellaneous Funds (EC 41604)
Royalties and Bonuses 8081 0.00 0.00 0.00 0.00 0.00 0.00 0.0%
Other In-Lieu Taxes 8082 0.00 0.00 0.00 0.00 0.00 0.00 0.0%
Less: Non-LCFF
(50%) Adjustment 8089 0.00 0.00 0.00 0.00 0.00 0.00 0.0%
Subtotal, LCFF Sources 493,607,940.00 0.00 493,607,940.00 514,398,806.80 0.00 514,398,806.80 4.2%
LCFF Transfers
Unrestricted LCFF Transfers -
Current Year 0000 8091 0.00 0.00 0.00 0.00 0.0%
All Other LCFF Transfers -
Current Year All Other 8091 0.00 0.00 0.00 0.00 0.00 0.00 0.0%
Transfers to Charter Schools in Lieu of Property Taxes 8096 (24,389,597.00) 0.00 (24,389,597.00) (24,389,597.00) 0.00 (24,389,597.00) 0.0%
Property Taxes Transfers 8097 0.00 0.00 0.00 0.00 0.00 0.00 0.0%

San Francisco UnifiedSan Francisco County
July 1 BudgetGeneral Fund
Unrestricted and RestrictedExpenditures by Object
38 68478 0000000Form 01
California Dept of EducationSACS Financial Reporting Software - 2016.1.0File: fund-a (Rev 03/22/2016) Page 6 Printed: 6/23/2016 4:38 PM
2015-16 Estimated Actuals 2016-17 Budget
Description Resource CodesObjectCodes
Unrestricted(A)
Restricted(B)
Total Fundcol. A + B
(C)Unrestricted
(D)Restricted
(E)
Total Fundcol. D + E
(F)
% DiffColumnC & F
LCFF/Revenue Limit Transfers - Prior Years 8099 0.00 0.00 0.00 0.00 0.00 0.00 0.0%
TOTAL, LCFF SOURCES 469,218,343.00 0.00 469,218,343.00 490,009,209.80 0.00 490,009,209.80 4.4%
FEDERAL REVENUE
Maintenance and Operations 8110 0.00 0.00 0.00 0.00 0.00 0.00 0.0%
Special Education Entitlement 8181 0.00 0.00 0.00 0.00 0.00 0.00 0.0%
Special Education Discretionary Grants 8182 0.00 0.00 0.00 0.00 0.00 0.00 0.0%
Child Nutrition Programs 8220 0.00 13,260.00 13,260.00 0.00 13,413.24 13,413.24 1.2%
Donated Food Commodities 8221 0.00 0.00 0.00 0.00 0.00 0.00 0.0%
Forest Reserve Funds 8260 0.00 0.00 0.00 0.00 0.00 0.00 0.0%
Flood Control Funds 8270 0.00 0.00 0.00 0.00 0.00 0.00 0.0%
Wildlife Reserve Funds 8280 0.00 0.00 0.00 0.00 0.00 0.00 0.0%
FEMA 8281 0.00 0.00 0.00 0.00 0.00 0.00 0.0%
Interagency Contracts Between LEAs 8285 0.00 0.00 0.00 0.00 0.00 0.00 0.0%
Pass-Through Revenues from
Federal Sources 8287 0.00 0.00 0.00 0.00 0.00 0.00 0.0%
NCLB: Title I, Part A, Basic Grants Low-
Income and Neglected 3010 8290 12,860,106.37 12,860,106.37 12,378,091.08 12,378,091.08 -3.7%
NCLB: Title I, Part D, Local Delinquent
Programs 3025 8290 0.00 0.00 0.00 0.00 0.0%
NCLB: Title II, Part A, Teacher Quality 4035 8290 3,803,428.00 3,803,428.00 3,286,789.89 3,286,789.89 -13.6%
NCLB: Title III, Immigrant Education
Program 4201 8290 0.00 0.00 249,379.00 249,379.00 New

San Francisco UnifiedSan Francisco County
July 1 BudgetGeneral Fund
Unrestricted and RestrictedExpenditures by Object
38 68478 0000000Form 01
California Dept of EducationSACS Financial Reporting Software - 2016.1.0File: fund-a (Rev 03/22/2016) Page 7 Printed: 6/23/2016 4:38 PM
2015-16 Estimated Actuals 2016-17 Budget
Description Resource CodesObjectCodes
Unrestricted(A)
Restricted(B)
Total Fundcol. A + B
(C)Unrestricted
(D)Restricted
(E)
Total Fundcol. D + E
(F)
% DiffColumnC & F
NCLB: Title III, Limited English Proficient
(LEP) Student Program 4203 8290 1,946,897.00 1,946,897.00 1,509,730.00 1,509,730.00 -22.5%
NCLB: Title V, Part B, Public Charter
Schools Grant Program (PCSGP) 4610 8290 0.00 0.00 0.00 0.00 0.0%
Other No Child Left Behind
3012-3020, 3030-3199, 4036-4126,
5510 8290 9,991,506.99 9,991,506.99 8,248,234.12 8,248,234.12 -17.4%
Vocational and Applied
Technology Education 3500-3699 8290 0.00 0.00 0.00 0.00 0.0%
Safe and Drug Free Schools 3700-3799 8290 0.00 0.00 0.00 0.00 0.0%
All Other Federal Revenue All Other 8290 621,696.00 3,476,207.73 4,097,903.73 500,000.00 3,627,754.21 4,127,754.21 0.7%
TOTAL, FEDERAL REVENUE 621,696.00 32,091,406.09 32,713,102.09 500,000.00 29,313,391.54 29,813,391.54 -8.9%
OTHER STATE REVENUE
Other State Apportionments
ROC/P Entitlement
Prior Years 6360 8319 0.00 0.00 0.00 0.00 0.0%
Special Education Master Plan
Current Year 6500 8311 0.00 0.00 0.00 0.00 0.0%
Prior Years 6500 8319 0.00 0.00 0.00 0.00 0.0%
All Other State Apportionments - Current Year All Other 8311 0.00 0.00 0.00 0.00 0.00 0.00 0.0%
All Other State Apportionments - Prior Years All Other 8319 0.00 0.00 0.00 0.00 0.00 0.00 0.0%
Child Nutrition Programs 8520 0.00 0.00 0.00 0.00 0.00 0.00 0.0%
Mandated Costs Reimbursements 8550 28,860,747.00 0.00 28,860,747.00 13,890,108.00 0.00 13,890,108.00 -51.9%
Lottery - Unrestricted and Instructional Materials 8560 6,700,000.00 1,900,000.00 8,600,000.00 6,767,000.00 1,919,000.00 8,686,000.00 1.0%
Tax Relief Subventions
Restricted Levies - Other
Homeowners' Exemptions 8575 0.00 0.00 0.00 0.00 0.00 0.00 0.0%
Other Subventions/In-Lieu Taxes 8576 0.00 0.00 0.00 0.00 0.00 0.00 0.0%
Pass-Through Revenues from
State Sources 8587 0.00 0.00 0.00 0.00 0.00 0.00 0.0%
School Based Coordination Program 7250 8590 0.00 0.00 0.00 0.00 0.0%
After School Education and Safety (ASES) 6010 8590 10,753,992.50 10,753,992.50 10,816,069.98 10,816,069.98 0.6%
Charter School Facility Grant 6030 8590 0.00 0.00 0.00 0.00 0.0%
Drug/Alcohol/Tobacco Funds 6650, 6690 8590 674,635.35 674,635.35 495,712.98 495,712.98 -26.5%

San Francisco UnifiedSan Francisco County
July 1 BudgetGeneral Fund
Unrestricted and RestrictedExpenditures by Object
38 68478 0000000Form 01
California Dept of EducationSACS Financial Reporting Software - 2016.1.0File: fund-a (Rev 03/22/2016) Page 8 Printed: 6/23/2016 4:38 PM
2015-16 Estimated Actuals 2016-17 Budget
Description Resource CodesObjectCodes
Unrestricted(A)
Restricted(B)
Total Fundcol. A + B
(C)Unrestricted
(D)Restricted
(E)
Total Fundcol. D + E
(F)
% DiffColumnC & F
California Clean Energy Jobs Act 6230 8590 105,878.00 105,878.00 350,000.00 350,000.00 230.6%
Career Technical Education Incentive
Grant Program 6387 8590 0.00 0.00 2,690,096.00 2,690,096.00 New
American Indian Early Childhood Education 7210 8590 0.00 0.00 0.00 0.00 0.0%
Specialized Secondary 7370 8590 0.00 0.00 0.00 0.00 0.0%
Quality Education Investment Act 7400 8590 0.00 0.00 0.00 0.00 0.0%
Common Core State Standards
Implementation 7405 8590 0.00 0.00 0.00 0.00 0.0%
All Other State Revenue All Other 8590 200,000.00 25,209,249.45 25,409,249.45 200,000.00 17,822,559.65 18,022,559.65 -29.1%
TOTAL, OTHER STATE REVENUE 35,760,747.00 38,643,755.30 74,404,502.30 20,857,108.00 34,093,438.61 54,950,546.61 -26.1%

San Francisco UnifiedSan Francisco County
July 1 BudgetGeneral Fund
Unrestricted and RestrictedExpenditures by Object
38 68478 0000000Form 01
California Dept of EducationSACS Financial Reporting Software - 2016.1.0File: fund-a (Rev 03/22/2016) Page 9 Printed: 6/23/2016 4:38 PM
2015-16 Estimated Actuals 2016-17 Budget
Description Resource CodesObjectCodes
Unrestricted(A)
Restricted(B)
Total Fundcol. A + B
(C)Unrestricted
(D)Restricted
(E)
Total Fundcol. D + E
(F)
% DiffColumnC & F
OTHER LOCAL REVENUE
Other Local Revenue
County and District Taxes
Other Restricted Levies
Secured Roll 8615 0.00 0.00 0.00 0.00 0.00 0.00 0.0%
Unsecured Roll 8616 0.00 0.00 0.00 0.00 0.00 0.00 0.0%
Prior Years' Taxes 8617 0.00 0.00 0.00 0.00 0.00 0.00 0.0%
Supplemental Taxes 8618 0.00 0.00 0.00 0.00 0.00 0.00 0.0%
Non-Ad Valorem Taxes
Parcel Taxes 8621 0.00 37,960,661.00 37,960,661.00 0.00 37,870,041.55 37,870,041.55 -0.2%
Other 8622 32,589,082.00 0.00 32,589,082.00 33,403,809.00 0.00 33,403,809.00 2.5%
Community Redevelopment Funds
Not Subject to LCFF Deduction 8625 0.00 0.00 0.00 0.00 0.00 0.00 0.0%
Penalties and Interest from
Delinquent Non-LCFF
Taxes 8629 0.00 0.00 0.00 0.00 0.00 0.00 0.0%
Sales
Sale of Equipment/Supplies 8631 0.00 0.00 0.00 0.00 0.00 0.00 0.0%
Sale of Publications 8632 0.00 0.00 0.00 0.00 0.00 0.00 0.0%
Food Service Sales 8634 0.00 0.00 0.00 0.00 0.00 0.00 0.0%
All Other Sales 8639 0.00 0.00 0.00 0.00 0.00 0.00 0.0%
Leases and Rentals 8650 8,940,571.00 0.00 8,940,571.00 9,029,977.00 0.00 9,029,977.00 1.0%
Interest 8660 3,475,357.00 0.00 3,475,357.00 3,510,111.00 0.00 3,510,111.00 1.0%
Net Increase (Decrease) in the Fair Value
of Investments 8662 0.00 0.00 0.00 0.00 0.00 0.00 0.0%
Fees and Contracts
Adult Education Fees 8671 0.00 0.00 0.00 0.00 0.00 0.00 0.0%
Non-Resident Students 8672 0.00 0.00 0.00 0.00 0.00 0.00 0.0%
Transportation Fees From Individuals 8675 0.00 0.00 0.00 0.00 0.00 0.00 0.0%
Interagency Services 8677 0.00 0.00 0.00 0.00 0.00 0.00 0.0%
Mitigation/Developer Fees 8681 0.00 0.00 0.00 0.00 0.00 0.00 0.0%
All Other Fees and Contracts 8689 0.00 0.00 0.00 0.00 0.00 0.00 0.0%
Other Local Revenue
Plus: Misc Funds Non-LCFF

San Francisco UnifiedSan Francisco County
July 1 BudgetGeneral Fund
Unrestricted and RestrictedExpenditures by Object
38 68478 0000000Form 01
California Dept of EducationSACS Financial Reporting Software - 2016.1.0File: fund-a (Rev 03/22/2016) Page 10 Printed: 6/23/2016 4:38 PM
2015-16 Estimated Actuals 2016-17 Budget
Description Resource CodesObjectCodes
Unrestricted(A)
Restricted(B)
Total Fundcol. A + B
(C)Unrestricted
(D)Restricted
(E)
Total Fundcol. D + E
(F)
% DiffColumnC & F
(50%) Adjustment 8691 0.00 0.00 0.00 11,000.00 0.00 11,000.00 New
Pass-Through Revenues From
Local Sources 8697 0.00 1,079,199.70 1,079,199.70 0.00 1,152,272.00 1,152,272.00 6.8%
All Other Local Revenue 8699 4,720,000.00 88,004,127.91 92,724,127.91 1,209,000.00 85,161,554.28 86,370,554.28 -6.9%
Tuition 8710 0.00 0.00 0.00 0.00 0.00 0.00 0.0%
All Other Transfers In 8781-8783 0.00 0.00 0.00 0.00 0.00 0.00 0.0%
Transfers of Apportionments
Special Education SELPA Transfers
From Districts or Charter Schools 6500 8791 0.00 0.00 0.00 0.00 0.0%
From County Offices 6500 8792 0.00 0.00 0.00 0.00 0.0%
From JPAs 6500 8793 0.00 0.00 0.00 0.00 0.0%
ROC/P Transfers
From Districts or Charter Schools 6360 8791 0.00 0.00 0.00 0.00 0.0%
From County Offices 6360 8792 0.00 0.00 0.00 0.00 0.0%
From JPAs 6360 8793 0.00 0.00 0.00 0.00 0.0%
Other Transfers of Apportionments
From Districts or Charter Schools All Other 8791 0.00 0.00 0.00 0.00 0.00 0.00 0.0%
From County Offices All Other 8792 0.00 0.00 0.00 0.00 0.00 0.00 0.0%
From JPAs All Other 8793 0.00 0.00 0.00 0.00 0.00 0.00 0.0%
All Other Transfers In from All Others 8799 0.00 0.00 0.00 0.00 0.00 0.00 0.0%
TOTAL, OTHER LOCAL REVENUE 49,725,010.00 127,043,988.61 176,768,998.61 47,163,897.00 124,183,867.83 171,347,764.83 -3.1%
TOTAL, REVENUES 555,325,796.00 197,779,150.00 753,104,946.00 558,530,214.80 187,590,697.98 746,120,912.78 -0.9%
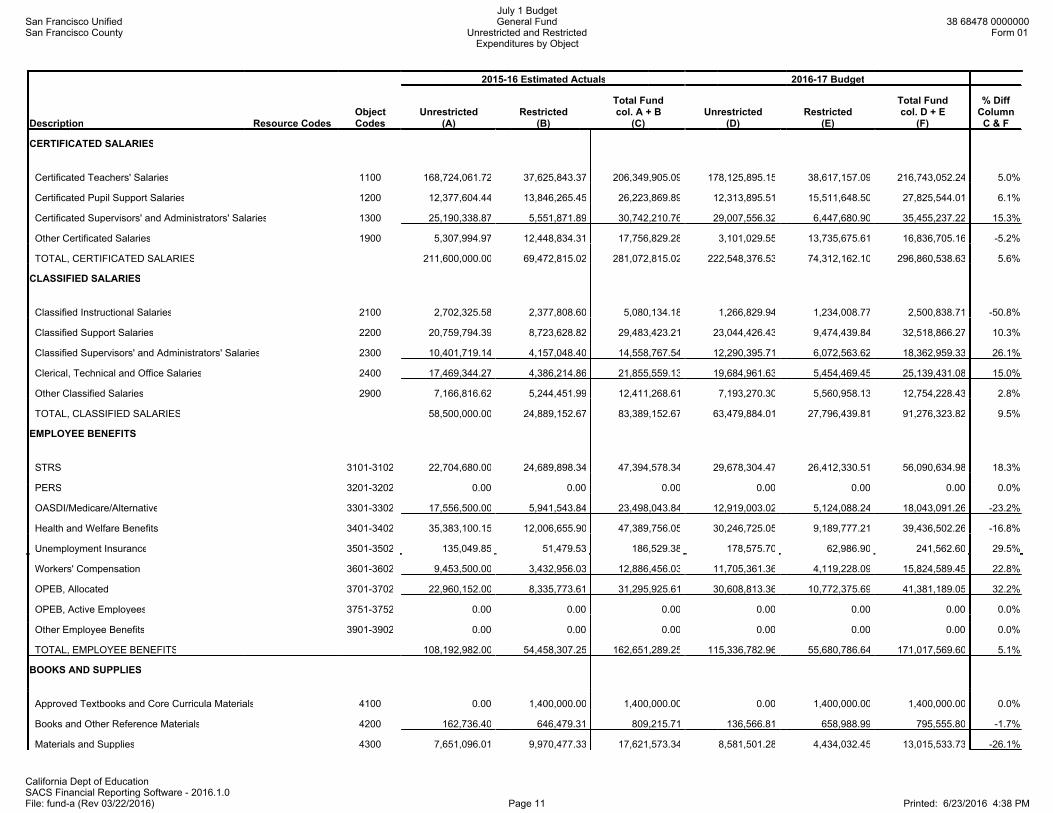
San Francisco UnifiedSan Francisco County
July 1 BudgetGeneral Fund
Unrestricted and RestrictedExpenditures by Object
38 68478 0000000Form 01
California Dept of EducationSACS Financial Reporting Software - 2016.1.0File: fund-a (Rev 03/22/2016) Page 11 Printed: 6/23/2016 4:38 PM
2015-16 Estimated Actuals 2016-17 Budget
Description Resource CodesObjectCodes
Unrestricted(A)
Restricted(B)
Total Fundcol. A + B
(C)Unrestricted
(D)Restricted
(E)
Total Fundcol. D + E
(F)
% DiffColumnC & F
CERTIFICATED SALARIES
Certificated Teachers' Salaries 1100 168,724,061.72 37,625,843.37 206,349,905.09 178,125,895.15 38,617,157.09 216,743,052.24 5.0%
Certificated Pupil Support Salaries 1200 12,377,604.44 13,846,265.45 26,223,869.89 12,313,895.51 15,511,648.50 27,825,544.01 6.1%
Certificated Supervisors' and Administrators' Salaries 1300 25,190,338.87 5,551,871.89 30,742,210.76 29,007,556.32 6,447,680.90 35,455,237.22 15.3%
Other Certificated Salaries 1900 5,307,994.97 12,448,834.31 17,756,829.28 3,101,029.55 13,735,675.61 16,836,705.16 -5.2%
TOTAL, CERTIFICATED SALARIES 211,600,000.00 69,472,815.02 281,072,815.02 222,548,376.53 74,312,162.10 296,860,538.63 5.6%
CLASSIFIED SALARIES
Classified Instructional Salaries 2100 2,702,325.58 2,377,808.60 5,080,134.18 1,266,829.94 1,234,008.77 2,500,838.71 -50.8%
Classified Support Salaries 2200 20,759,794.39 8,723,628.82 29,483,423.21 23,044,426.43 9,474,439.84 32,518,866.27 10.3%
Classified Supervisors' and Administrators' Salaries 2300 10,401,719.14 4,157,048.40 14,558,767.54 12,290,395.71 6,072,563.62 18,362,959.33 26.1%
Clerical, Technical and Office Salaries 2400 17,469,344.27 4,386,214.86 21,855,559.13 19,684,961.63 5,454,469.45 25,139,431.08 15.0%
Other Classified Salaries 2900 7,166,816.62 5,244,451.99 12,411,268.61 7,193,270.30 5,560,958.13 12,754,228.43 2.8%
TOTAL, CLASSIFIED SALARIES 58,500,000.00 24,889,152.67 83,389,152.67 63,479,884.01 27,796,439.81 91,276,323.82 9.5%
EMPLOYEE BENEFITS
STRS 3101-3102 22,704,680.00 24,689,898.34 47,394,578.34 29,678,304.47 26,412,330.51 56,090,634.98 18.3%
PERS 3201-3202 0.00 0.00 0.00 0.00 0.00 0.00 0.0%
OASDI/Medicare/Alternative 3301-3302 17,556,500.00 5,941,543.84 23,498,043.84 12,919,003.02 5,124,088.24 18,043,091.26 -23.2%
Health and Welfare Benefits 3401-3402 35,383,100.15 12,006,655.90 47,389,756.05 30,246,725.05 9,189,777.21 39,436,502.26 -16.8%
Unemployment Insurance 3501-3502 135,049.85 51,479.53 186,529.38 178,575.70 62,986.90 241,562.60 29.5%
Workers' Compensation 3601-3602 9,453,500.00 3,432,956.03 12,886,456.03 11,705,361.36 4,119,228.09 15,824,589.45 22.8%
OPEB, Allocated 3701-3702 22,960,152.00 8,335,773.61 31,295,925.61 30,608,813.36 10,772,375.69 41,381,189.05 32.2%
OPEB, Active Employees 3751-3752 0.00 0.00 0.00 0.00 0.00 0.00 0.0%
Other Employee Benefits 3901-3902 0.00 0.00 0.00 0.00 0.00 0.00 0.0%
TOTAL, EMPLOYEE BENEFITS 108,192,982.00 54,458,307.25 162,651,289.25 115,336,782.96 55,680,786.64 171,017,569.60 5.1%
BOOKS AND SUPPLIES
Approved Textbooks and Core Curricula Materials 4100 0.00 1,400,000.00 1,400,000.00 0.00 1,400,000.00 1,400,000.00 0.0%
Books and Other Reference Materials 4200 162,736.40 646,479.31 809,215.71 136,566.81 658,988.99 795,555.80 -1.7%
Materials and Supplies 4300 7,651,096.01 9,970,477.33 17,621,573.34 8,581,501.28 4,434,032.45 13,015,533.73 -26.1%

San Francisco UnifiedSan Francisco County
July 1 BudgetGeneral Fund
Unrestricted and RestrictedExpenditures by Object
38 68478 0000000Form 01
California Dept of EducationSACS Financial Reporting Software - 2016.1.0File: fund-a (Rev 03/22/2016) Page 12 Printed: 6/23/2016 4:38 PM
2015-16 Estimated Actuals 2016-17 Budget
Description Resource CodesObjectCodes
Unrestricted(A)
Restricted(B)
Total Fundcol. A + B
(C)Unrestricted
(D)Restricted
(E)
Total Fundcol. D + E
(F)
% DiffColumnC & F
Noncapitalized Equipment 4400 4,554,167.59 4,260,297.32 8,814,464.91 4,232,552.03 1,296,265.66 5,528,817.69 -37.3%
Food 4700 0.00 0.00 0.00 0.00 0.00 0.00 0.0%
TOTAL, BOOKS AND SUPPLIES 12,368,000.00 16,277,253.96 28,645,253.96 12,950,620.12 7,789,287.10 20,739,907.22 -27.6%
SERVICES AND OTHER OPERATING EXPENDITURES
Subagreements for Services 5100 155,000.00 18,386,692.37 18,541,692.37 1,656,500.00 16,937,359.07 18,593,859.07 0.3%
Travel and Conferences 5200 716,450.10 1,295,845.01 2,012,295.11 913,332.71 665,351.60 1,578,684.31 -21.5%
Dues and Memberships 5300 302,042.00 96,815.17 398,857.17 283,845.00 71,538.00 355,383.00 -10.9%
Insurance 5400 - 5450 0.00 0.00 0.00 0.00 0.00 0.00 0.0%
Operations and Housekeeping
Services 5500 5,305,346.00 937,662.45 6,243,008.45 5,968,900.00 1,231,000.00 7,199,900.00 15.3%
Rentals, Leases, Repairs, and
Noncapitalized Improvements 5600 1,968,512.90 1,453,968.18 3,422,481.08 2,036,949.43 908,756.68 2,945,706.11 -13.9%
Transfers of Direct Costs 5710 0.00 0.00 0.00 0.00 0.00 0.00 0.0%
Transfers of Direct Costs - Interfund 5750 0.00 0.00 0.00 0.00 0.00 0.00 0.0%
Professional/Consulting Services and
Operating Expenditures 5800 14,302,649.00 19,042,170.20 33,344,819.20 18,293,153.53 15,135,730.05 33,428,883.58 0.3%
Communications 5900 950,000.00 526,339.67 1,476,339.67 1,432,740.63 587,571.20 2,020,311.83 36.8%
TOTAL, SERVICES AND OTHER
OPERATING EXPENDITURES 23,700,000.00 41,739,493.05 65,439,493.05 30,585,421.30 35,537,306.60 66,122,727.90 1.0%

San Francisco UnifiedSan Francisco County
July 1 BudgetGeneral Fund
Unrestricted and RestrictedExpenditures by Object
38 68478 0000000Form 01
California Dept of EducationSACS Financial Reporting Software - 2016.1.0File: fund-a (Rev 03/22/2016) Page 13 Printed: 6/23/2016 4:38 PM
2015-16 Estimated Actuals 2016-17 Budget
Description Resource CodesObjectCodes
Unrestricted(A)
Restricted(B)
Total Fundcol. A + B
(C)Unrestricted
(D)Restricted
(E)
Total Fundcol. D + E
(F)
% DiffColumnC & F
CAPITAL OUTLAY
Land 6100 0.00 23,824.66 23,824.66 0.00 752,756.00 752,756.00 3059.6%
Land Improvements 6170 0.00 0.00 0.00 0.00 0.00 0.00 0.0%
Buildings and Improvements of Buildings 6200 15,000.00 886,946.76 901,946.76 25,500.00 209,739.00 235,239.00 -73.9%
Books and Media for New School Libraries
or Major Expansion of School Libraries 6300 0.00 0.00 0.00 0.00 0.00 0.00 0.0%
Equipment 6400 0.00 93,555.58 93,555.58 90,000.00 196,155.48 286,155.48 205.9%
Equipment Replacement 6500 0.00 0.00 0.00 0.00 0.00 0.00 0.0%
TOTAL, CAPITAL OUTLAY 15,000.00 1,004,327.00 1,019,327.00 115,500.00 1,158,650.48 1,274,150.48 25.0%
OTHER OUTGO (excluding Transfers of Indirect Costs)
Tuition
Tuition for Instruction Under Interdistrict
Attendance Agreements 7110 0.00 0.00 0.00 0.00 0.00 0.00 0.0%
State Special Schools 7130 0.00 0.00 0.00 0.00 0.00 0.00 0.0%
Tuition, Excess Costs, and/or Deficit Payments
Payments to Districts or Charter Schools 7141 0.00 0.00 0.00 0.00 0.00 0.00 0.0%
Payments to County Offices 7142 10,500,000.00 0.00 10,500,000.00 9,500,000.00 0.00 9,500,000.00 -9.5%
Payments to JPAs 7143 0.00 0.00 0.00 0.00 0.00 0.00 0.0%
Transfers of Pass-Through Revenues
To Districts or Charter Schools 7211 0.00 1,079,199.70 1,079,199.70 0.00 1,152,272.00 1,152,272.00 6.8%
To County Offices 7212 0.00 0.00 0.00 0.00 0.00 0.00 0.0%
To JPAs 7213 0.00 0.00 0.00 0.00 0.00 0.00 0.0%
Special Education SELPA Transfers of Apportionments
To Districts or Charter Schools 6500 7221 0.00 0.00 0.00 0.00 0.0%
To County Offices 6500 7222 0.00 0.00 0.00 0.00 0.0%
To JPAs 6500 7223 0.00 0.00 0.00 0.00 0.0%
ROC/P Transfers of Apportionments
To Districts or Charter Schools 6360 7221 0.00 0.00 0.00 0.00 0.0%
To County Offices 6360 7222 0.00 0.00 0.00 0.00 0.0%
To JPAs 6360 7223 0.00 0.00 0.00 0.00 0.0%
Other Transfers of Apportionments All Other 7221-7223 0.00 0.00 0.00 0.00 0.00 0.00 0.0%
All Other Transfers 7281-7283 88,147,367.00 0.00 88,147,367.00 92,036,932.00 0.00 92,036,932.00 4.4%

San Francisco UnifiedSan Francisco County
July 1 BudgetGeneral Fund
Unrestricted and RestrictedExpenditures by Object
38 68478 0000000Form 01
California Dept of EducationSACS Financial Reporting Software - 2016.1.0File: fund-a (Rev 03/22/2016) Page 14 Printed: 6/23/2016 4:38 PM
2015-16 Estimated Actuals 2016-17 Budget
Description Resource CodesObjectCodes
Unrestricted(A)
Restricted(B)
Total Fundcol. A + B
(C)Unrestricted
(D)Restricted
(E)
Total Fundcol. D + E
(F)
% DiffColumnC & F
All Other Transfers Out to All Others 7299 0.00 0.00 0.00 0.00 0.00 0.00 0.0%
Debt Service
Debt Service - Interest 7438 0.00 0.00 0.00 0.00 0.00 0.00 0.0%
Other Debt Service - Principal 7439 0.00 0.00 0.00 0.00 0.00 0.00 0.0%
TOTAL, OTHER OUTGO (excluding Transfers of Indirect Costs) 98,647,367.00 1,079,199.70 99,726,566.70 101,536,932.00 1,152,272.00 102,689,204.00 3.0%
OTHER OUTGO - TRANSFERS OF INDIRECT COSTS
Transfers of Indirect Costs 7310 (3,756,096.00) 3,756,096.44 0.44 (4,465,140.00) 4,465,140.00 0.00 -100.0%
Transfers of Indirect Costs - Interfund 7350 (2,364,607.41) 0.00 (2,364,607.41) (2,370,806.00) 0.00 (2,370,806.00) 0.3%
TOTAL, OTHER OUTGO - TRANSFERS OF INDIRECT COSTS (6,120,703.41) 3,756,096.44 (2,364,606.97) (6,835,946.00) 4,465,140.00 (2,370,806.00) 0.3%
TOTAL, EXPENDITURES 506,902,645.59 212,676,645.09 719,579,290.68 539,717,570.92 207,892,044.73 747,609,615.65 3.9%

San Francisco UnifiedSan Francisco County
July 1 BudgetGeneral Fund
Unrestricted and RestrictedExpenditures by Object
38 68478 0000000Form 01
California Dept of EducationSACS Financial Reporting Software - 2016.1.0File: fund-a (Rev 03/22/2016) Page 15 Printed: 6/23/2016 4:38 PM
2015-16 Estimated Actuals 2016-17 Budget
Description Resource CodesObjectCodes
Unrestricted(A)
Restricted(B)
Total Fundcol. A + B
(C)Unrestricted
(D)Restricted
(E)
Total Fundcol. D + E
(F)
% DiffColumnC & F
INTERFUND TRANSFERS
INTERFUND TRANSFERS IN
From: Special Reserve Fund 8912 0.00 0.00 0.00 0.00 0.00 0.00 0.0%
From: Bond Interest and
Redemption Fund 8914 0.00 0.00 0.00 0.00 0.00 0.00 0.0%
Other Authorized Interfund Transfers In 8919 0.00 0.00 0.00 0.00 0.00 0.00 0.0%
(a) TOTAL, INTERFUND TRANSFERS IN 0.00 0.00 0.00 0.00 0.00 0.00 0.0%
INTERFUND TRANSFERS OUT
To: Child Development Fund 7611 5,566,898.00 0.00 5,566,898.00 5,484,689.00 0.00 5,484,689.00 -1.5%
To: Special Reserve Fund 7612 0.00 0.00 0.00 0.00 0.00 0.00 0.0%
To: State School Building Fund/
County School Facilities Fund 7613 0.00 0.00 0.00 0.00 0.00 0.00 0.0%
To: Cafeteria Fund 7616 3,139,893.00 0.00 3,139,893.00 3,296,888.00 0.00 3,296,888.00 5.0%
Other Authorized Interfund Transfers Out 7619 2,567,788.00 1,564,000.00 4,131,788.00 2,644,822.00 1,564,000.00 4,208,822.00 1.9%
(b) TOTAL, INTERFUND TRANSFERS OUT 11,274,579.00 1,564,000.00 12,838,579.00 11,426,399.00 1,564,000.00 12,990,399.00 1.2%
OTHER SOURCES/USES
SOURCES
State Apportionments
Emergency Apportionments 8931 0.00 0.00 0.00 0.00 0.00 0.00 0.0%
Proceeds
Proceeds from Sale/Lease-
Purchase of Land/Buildings 8953 0.00 0.00 0.00 0.00 0.00 0.00 0.0%
Other Sources
Transfers from Funds of
Lapsed/Reorganized LEAs 8965 0.00 0.00 0.00 0.00 0.00 0.00 0.0%
Long-Term Debt Proceeds
Proceeds from Certificates
of Participation 8971 0.00 0.00 0.00 0.00 0.00 0.00 0.0%
Proceeds from Capital Leases 8972 0.00 0.00 0.00 0.00 0.00 0.00 0.0%
Proceeds from Lease Revenue Bonds 8973 0.00 0.00 0.00 0.00 0.00 0.00 0.0%
All Other Financing Sources 8979 0.00 0.00 0.00 0.00 0.00 0.00 0.0%

San Francisco UnifiedSan Francisco County
July 1 BudgetGeneral Fund
Unrestricted and RestrictedExpenditures by Object
38 68478 0000000Form 01
California Dept of EducationSACS Financial Reporting Software - 2016.1.0File: fund-a (Rev 03/22/2016) Page 16 Printed: 6/23/2016 4:38 PM
2015-16 Estimated Actuals 2016-17 Budget
Description Resource CodesObjectCodes
Unrestricted(A)
Restricted(B)
Total Fundcol. A + B
(C)Unrestricted
(D)Restricted
(E)
Total Fundcol. D + E
(F)
% DiffColumnC & F
(c) TOTAL, SOURCES 0.00 0.00 0.00 0.00 0.00 0.00 0.0%
USES
Transfers of Funds from
Lapsed/Reorganized LEAs 7651 0.00 0.00 0.00 0.00 0.00 0.00 0.0%
All Other Financing Uses 7699 0.00 0.00 0.00 0.00 0.00 0.00 0.0%
(d) TOTAL, USES 0.00 0.00 0.00 0.00 0.00 0.00 0.0%
CONTRIBUTIONS
Contributions from Unrestricted Revenues 8980 (14,146,348.00) 14,146,348.00 0.00 (14,921,192.04) 14,921,192.00 (0.04) New
Contributions from Restricted Revenues 8990 0.00 (0.78) (0.78) 0.00 0.00 0.00 -100.0%
(e) TOTAL, CONTRIBUTIONS (14,146,348.00) 14,146,347.22 (0.78) (14,921,192.04) 14,921,192.00 (0.04) -94.9%
TOTAL, OTHER FINANCING SOURCES/USES
(a - b + c - d + e) (25,420,927.00) 12,582,347.22 (12,838,579.78) (26,347,591.04) 13,357,192.00 (12,990,399.04) 1.2%

San Francisco UnifiedSan Francisco County
July 1 BudgetGeneral Fund
Unrestricted and RestrictedExpenditures by Function
38 68478 0000000Form 01
California Dept of EducationSACS Financial Reporting Software - 2016.1.0File: fund-a (Rev 04/02/2015) Page 1 Printed: 6/23/2016 4:38 PM
2015-16 Estimated Actuals 2016-17 Budget
Description Function CodesObjectCodes
Unrestricted(A)
Restricted(B)
Total Fundcol. A + B
(C)Unrestricted
(D)Restricted
(E)
Total Fundcol. D + E
(F)
% DiffColumnC & F
A. REVENUES
1) LCFF Sources 8010-8099 469,218,343.00 0.00 469,218,343.00 490,009,209.80 0.00 490,009,209.80 4.4%
2) Federal Revenue 8100-8299 621,696.00 32,091,406.09 32,713,102.09 500,000.00 29,313,391.54 29,813,391.54 -8.9%
3) Other State Revenue 8300-8599 35,760,747.00 38,643,755.30 74,404,502.30 20,857,108.00 34,093,438.61 54,950,546.61 -26.1%
4) Other Local Revenue 8600-8799 49,725,010.00 127,043,988.61 176,768,998.61 47,163,897.00 124,183,867.83 171,347,764.83 -3.1%
5) TOTAL, REVENUES 555,325,796.00 197,779,150.00 753,104,946.00 558,530,214.80 187,590,697.98 746,120,912.78 -0.9%
B. EXPENDITURES (Objects 1000-7999)
1) Instruction 1000-1999 235,026,049.29 68,195,340.54 303,221,389.83 246,644,692.51 59,900,326.87 306,545,019.38 1.1%
2) Instruction - Related Services 2000-2999 71,320,178.15 89,410,321.66 160,730,499.81 75,634,883.61 91,239,815.53 166,874,699.14 3.8%
3) Pupil Services 3000-3999 28,232,487.56 22,118,127.10 50,350,614.66 32,863,268.16 22,510,475.73 55,373,743.89 10.0%
4) Ancillary Services 4000-4999 359,804.37 4,253,020.18 4,612,824.55 415,902.07 4,608,906.11 5,024,808.18 8.9%
5) Community Services 5000-5999 0.00 0.00 0.00 0.00 0.00 0.00 0.0%
6) Enterprise 6000-6999 0.00 4,819.46 4,819.46 0.00 4,931.42 4,931.42 2.3%
7) General Administration 7000-7999 34,482,072.52 5,353,160.49 39,835,233.01 38,150,990.66 4,359,194.26 42,510,184.92 6.7%
8) Plant Services 8000-8999 38,834,686.69 22,262,655.96 61,097,342.65 44,470,901.91 24,116,122.81 68,587,024.72 12.3%
9) Other Outgo 9000-9999Except
7600-7699 98,647,367.01 1,079,199.70 99,726,566.71 101,536,932.00 1,152,272.00 102,689,204.00 3.0%
10) TOTAL, EXPENDITURES 506,902,645.59 212,676,645.09 719,579,290.68 539,717,570.92 207,892,044.73 747,609,615.65 3.9%
C. EXCESS (DEFICIENCY) OF REVENUES
OVER EXPENDITURES BEFORE OTHER
FINANCING SOURCES AND USES (A5 - B10) 48,423,150.41 (14,897,495.09) 33,525,655.32 18,812,643.88 (20,301,346.75) (1,488,702.87) -104.4%
D. OTHER FINANCING SOURCES/USES
1) Interfund Transfers
a) Transfers In 8900-8929 0.00 0.00 0.00 0.00 0.00 0.00 0.0%
b) Transfers Out 7600-7629 11,274,579.00 1,564,000.00 12,838,579.00 11,426,399.00 1,564,000.00 12,990,399.00 1.2%
2) Other Sources/Uses
a) Sources 8930-8979 0.00 0.00 0.00 0.00 0.00 0.00 0.0%
b) Uses 7630-7699 0.00 0.00 0.00 0.00 0.00 0.00 0.0%
3) Contributions 8980-8999 (14,146,348.00) 14,146,347.22 (0.78) (14,921,192.04) 14,921,192.00 (0.04) -94.9%
4) TOTAL, OTHER FINANCING SOURCES/USES (25,420,927.00) 12,582,347.22 (12,838,579.78) (26,347,591.04) 13,357,192.00 (12,990,399.04) 1.2%

San Francisco UnifiedSan Francisco County
July 1 BudgetGeneral Fund
Unrestricted and RestrictedExpenditures by Function
38 68478 0000000Form 01
California Dept of EducationSACS Financial Reporting Software - 2016.1.0File: fund-a (Rev 04/02/2015) Page 2 Printed: 6/23/2016 4:38 PM
2015-16 Estimated Actuals 2016-17 Budget
Description Function CodesObjectCodes
Unrestricted(A)
Restricted(B)
Total Fundcol. A + B
(C)Unrestricted
(D)Restricted
(E)
Total Fundcol. D + E
(F)
% DiffColumnC & F
E. NET INCREASE (DECREASE) IN FUND
BALANCE (C + D4) 23,002,223.41 (2,315,147.87) 20,687,075.54 (7,534,947.16) (6,944,154.75) (14,479,101.91) -170.0%
F. FUND BALANCE, RESERVES
1) Beginning Fund Balance
a) As of July 1 - Unaudited 9791 38,918,973.13 32,898,938.56 71,817,911.69 59,419,787.54 30,583,790.69 90,003,578.23 25.3%
b) Audit Adjustments 9793 (2,501,409.00) 0.00 (2,501,409.00) 0.00 0.00 0.00 -100.0%
c) As of July 1 - Audited (F1a + F1b) 36,417,564.13 32,898,938.56 69,316,502.69 59,419,787.54 30,583,790.69 90,003,578.23 29.8%
d) Other Restatements 9795 0.00 0.00 0.00 0.00 0.00 0.00 0.0%
e) Adjusted Beginning Balance (F1c + F1d) 36,417,564.13 32,898,938.56 69,316,502.69 59,419,787.54 30,583,790.69 90,003,578.23 29.8%
2) Ending Balance, June 30 (E + F1e) 59,419,787.54 30,583,790.69 90,003,578.23 51,884,840.38 23,639,635.94 75,524,476.32 -16.1%
Components of Ending Fund Balance
a) Nonspendable
Revolving Cash 9711 0.00 0.00 0.00 0.00 0.00 0.00 0.0%
Stores 9712 0.00 0.00 0.00 0.00 0.00 0.00 0.0%
Prepaid Expenditures 9713 0.00 0.00 0.00 0.00 0.00 0.00 0.0%
All Others 9719 0.00 0.00 0.00 0.00 0.00 0.00 0.0%
b) Restricted 9740 0.00 30,583,790.69 30,583,790.69 0.00 23,639,636.19 23,639,636.19 -22.7%
c) Committed
Stabilization Arrangements 9750 0.00 0.00 0.00 0.00 0.00 0.00 0.0%
Other Commitments (by Resource/Object) 9760 0.00 0.00 0.00 0.00 0.00 0.00 0.0%
d) Assigned
Other Assignments (by Resource/Object) 9780 0.00 0.00 0.00 0.00 0.00 0.00 0.0%
e) Unassigned/unappropriated
Reserve for Economic Uncertainties 9789 0.00 0.00 0.00 0.00 0.00 0.00 0.0%
Unassigned/Unappropriated Amount 9790 59,419,787.54 0.00 59,419,787.54 51,884,840.38 (0.25) 51,884,840.13 -12.7%

San Francisco UnifiedSan Francisco County
July 1 BudgetGeneral Fund
Exhibit: Restricted Balance Detail38 68478 0000000
Form 01
California Dept of EducationSACS Financial Reporting Software - 2016.1.0File: fund-a (Rev 04/06/2011) Page 1 Printed: 6/23/2016 4:38 PM
2015-16 2016-17
Resource Description Estimated Actuals Budget
3060 NCLB: Title I, Part C, Migrant Ed (Regular and Summer Program) 0.00 0.02
4201 NCLB: Title III, Immigrant Education Program 0.00 0.02
4510 Indian Education 0.00 0.71
5640 Medi-Cal Billing Option 999,347.42 999,347.47
5810 Other Restricted Federal 0.00 86,872.59
6230 California Clean Energy Jobs Act 105,880.14 105,195.18
6264 Educator Effectiveness 4,726,898.15 2,892,180.09
6300 Lottery: Instructional Materials 434,472.83 453,472.83
6387 Career Technical Education Incentive Grant Program 0.00 0.02
7400 Quality Education Investment Act 62,532.68 62,532.68
7405 Common Core State Standards Implementation 609,757.81 609,757.81
7810 Other Restricted State 2,146.26 2,146.25
8150 Ongoing & Major Maintenance Account (RMA: Education Code Section 17070.75)1,134,700.00 1,134,700.69
9010 Other Restricted Local 22,508,055.40 17,293,429.83
Total, Restricted Balance 30,583,790.69 23,639,636.19

This Page Is Intentionally Left Blank

Section Break
Insert Tab Here


San Francisco UnifiedSan Francisco County
2016-17 July 1 BudgetAVERAGE DAILY ATTENDANCE 38 68478 0000000
Form A
California Dept of EducationSACS Financial Reporting Software - 2016.1.0File: ada (Rev 02/03/2016) Page 1 of 1 Printed: 6/23/2016 4:45 PM
2015-16 Estimated Actuals 2016-17 Budget2016-17 Budget
Description P-2 ADA Annual ADA Funded ADAEstimated P-2
ADAEstimatedAnnual ADA
EstimatedFunded ADA
A. DISTRICT
1. Total District Regular ADA
Includes Opportunity Classes, Home &
Hospital, Special Day Class, Continuation
Education, Special Education NPS/LCI
and Extended Year, and Community Day
School (includes Necessary Small School
ADA) 50,594.77 50,594.77 50,594.77 50,594.77 50,594.77 50,594.77
2. Total Basic Aid Choice/Court Ordered
Voluntary Pupil Transfer Regular ADA
Includes Opportunity Classes, Home &
Hospital, Special Day Class, Continuation
Education, Special Education NPS/LCI
and Extended Year, and Community Day
School (ADA not included in Line A1 above) 0.00 0.00 0.00 0.00 0.00 0.00
3. Total Basic Aid Open Enrollment Regular ADA
Includes Opportunity Classes, Home &
Hospital, Special Day Class, Continuation
Education, Special Education NPS/LCI
and Extended Year, and Community Day
School (ADA not included in Line A1 above) 0.00 0.00 0.00 0.00 0.00 0.00
4. Total, District Regular ADA
(Sum of Lines A1 through A3) 50,594.77 50,594.77 50,594.77 50,594.77 50,594.77 50,594.77
5. District Funded County Program ADA
a. County Community Schools 28.44 28.44 28.44 28.44 28.44 28.44
b. Special Education-Special Day Class 0.00 0.00 0.00 0.00 0.00 0.00
c. Special Education-NPS/LCI 22.54 22.54 22.54 22.54 22.54 22.54
d. Special Education Extended Year 3.84 3.84 3.84 3.84 3.84 3.84
e. Other County Operated Programs:
Opportunity Schools and Full Day
Opportunity Classes, Specialized Secondary
Schools, Technical, Agricultural, and Natural
Resource Conservation Schools 0.00 0.00 0.00 0.00 0.00 0.00
f. County School Tuition Fund
(Out of State Tuition) [EC 2000 and 46380] 0.00 0.00 0.00 0.00 0.00 0.00
g. Total, District Funded County Program ADA
(Sum of Lines A5a through A5f) 54.82 54.82 54.82 54.82 54.82 54.82
6. TOTAL DISTRICT ADA
(Sum of Line A4 and Line A5g) 50,649.59 50,649.59 50,649.59 50,649.59 50,649.59 50,649.59
7. Adults in Correctional Facilities 0.00 0.00 0.00 0.00 0.00 0.00
8. Charter School ADA
(Enter Charter School ADA using
Tab C. Charter School ADA)
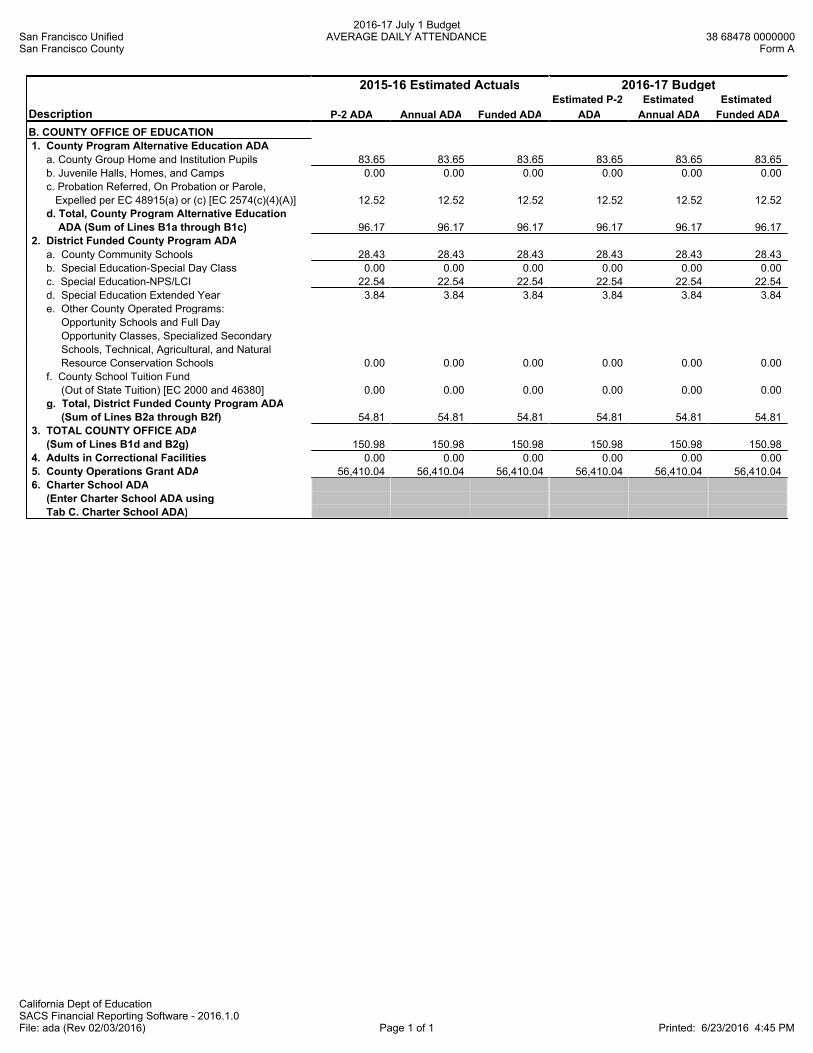
San Francisco UnifiedSan Francisco County
2016-17 July 1 BudgetAVERAGE DAILY ATTENDANCE 38 68478 0000000
Form A
California Dept of EducationSACS Financial Reporting Software - 2016.1.0File: ada (Rev 02/03/2016) Page 1 of 1 Printed: 6/23/2016 4:45 PM
2015-16 Estimated Actuals 2016-17 Budget2016-17 BudgetEstimated P-2 Estimated Estimated
Description P-2 ADA Annual ADA Funded ADA ADA Annual ADA Funded ADA
B. COUNTY OFFICE OF EDUCATION
1. County Program Alternative Education ADA
a. County Group Home and Institution Pupils 83.65 83.65 83.65 83.65 83.65 83.65
b. Juvenile Halls, Homes, and Camps 0.00 0.00 0.00 0.00 0.00 0.00
c. Probation Referred, On Probation or Parole,
Expelled per EC 48915(a) or (c) [EC 2574(c)(4)(A)] 12.52 12.52 12.52 12.52 12.52 12.52
d. Total, County Program Alternative Education
ADA (Sum of Lines B1a through B1c) 96.17 96.17 96.17 96.17 96.17 96.17
2. District Funded County Program ADA
a. County Community Schools 28.43 28.43 28.43 28.43 28.43 28.43
b. Special Education-Special Day Class 0.00 0.00 0.00 0.00 0.00 0.00
c. Special Education-NPS/LCI 22.54 22.54 22.54 22.54 22.54 22.54
d. Special Education Extended Year 3.84 3.84 3.84 3.84 3.84 3.84
e. Other County Operated Programs:
Opportunity Schools and Full Day
Opportunity Classes, Specialized Secondary
Schools, Technical, Agricultural, and Natural
Resource Conservation Schools 0.00 0.00 0.00 0.00 0.00 0.00
f. County School Tuition Fund
(Out of State Tuition) [EC 2000 and 46380] 0.00 0.00 0.00 0.00 0.00 0.00
g. Total, District Funded County Program ADA
(Sum of Lines B2a through B2f) 54.81 54.81 54.81 54.81 54.81 54.81
3. TOTAL COUNTY OFFICE ADA
(Sum of Lines B1d and B2g) 150.98 150.98 150.98 150.98 150.98 150.98
4. Adults in Correctional Facilities 0.00 0.00 0.00 0.00 0.00 0.00
5. County Operations Grant ADA 56,410.04 56,410.04 56,410.04 56,410.04 56,410.04 56,410.04
6. Charter School ADA
(Enter Charter School ADA using
Tab C. Charter School ADA)

San Francisco UnifiedSan Francisco County
2016-17 July 1 BudgetAVERAGE DAILY ATTENDANCE 38 68478 0000000
Form A
California Dept of EducationSACS Financial Reporting Software - 2016.1.0File: ada (Rev 02/03/2016) Page 1 of 1 Printed: 6/23/2016 4:45 PM
2015-16 Estimated Actuals 2016-17 Budget2016-17 Budget
Description P-2 ADA Annual ADA Funded ADAEstimated P-2
ADAEstimatedAnnual ADA
EstimatedFunded ADA
C. CHARTER SCHOOL ADA
Authorizing LEAs reporting charter school SACS financial data in their Fund 01, 09, or 62 use this worksheet to report ADA for those charter schools. Authorizing LEAs reporting charter school SACS financial data in their Fund 01, 09, or 62 use this worksheet to report ADA for those charter schools.
Charter schools reporting SACS financial data separately from their authorizing LEAs in Fund 01 or Fund 62 use this worksheet to report their ADA. Charter schools reporting SACS financial data separately from their authorizing LEAs in Fund 01 or Fund 62 use this worksheet to report their ADA.
FUND 01: Charter School ADA corresponding to SACS financial data reported in Fund 01. FUND 01: Charter School ADA corresponding to SACS financial data reported in Fund 01.
1. Total Charter School Regular ADA 5,751.08 5,751.08 5,751.08 5,751.08 5,751.08 5,751.08
2. Charter School County Program Alternative
Education ADA
a. County Group Home and Institution Pupils
b. Juvenile Halls, Homes, and Camps
c. Probation Referred, On Probation or Parole,
Expelled per EC 48915(a) or (c) [EC 2574(c)(4)(A)]
d. Total, Charter School County Program
Alternative Education ADA
(Sum of Lines C2a through C2c) 0.00 0.00 0.00 0.00 0.00 0.00
3. Charter School Funded County Program ADA
a. County Community Schools
b. Special Education-Special Day Class
c. Special Education-NPS/LCI
d. Special Education Extended Year
e. Other County Operated Programs:
Opportunity Schools and Full Day
Opportunity Classes, Specialized Secondary
Schools, Technical, Agricultural, and Natural
Resource Conservation Schools
f. Total, Charter School Funded County
Program ADA
(Sum of Lines C3a through C3e) 0.00 0.00 0.00 0.00 0.00 0.00
4. TOTAL CHARTER SCHOOL ADA
(Sum of Lines C1, C2d, and C3f) 5,751.08 5,751.08 5,751.08 5,751.08 5,751.08 5,751.08
FUND 09 or 62: Charter School ADA corresponding to SACS financial data reported in Fund 09 or Fund 62.
5. Total Charter School Regular ADA
6. Charter School County Program Alternative
Education ADA
a. County Group Home and Institution Pupils
b. Juvenile Halls, Homes, and Camps
c. Probation Referred, On Probation or Parole,
Expelled per EC 48915(a) or (c) [EC 2574(c)(4)(A)]
d. Total, Charter School County Program
Alternative Education ADA
(Sum of Lines C6a through C6c) 0.00 0.00 0.00 0.00 0.00 0.00
7. Charter School Funded County Program ADA
a. County Community Schools
b. Special Education-Special Day Class
c. Special Education-NPS/LCI
d. Special Education Extended Year
e. Other County Operated Programs:
Opportunity Schools and Full Day
Opportunity Classes, Specialized Secondary
Schools, Technical, Agricultural, and Natural
Resource Conservation Schools
f. Total, Charter School Funded County
Program ADA
(Sum of Lines C7a through C7e) 0.00 0.00 0.00 0.00 0.00 0.00
8. TOTAL CHARTER SCHOOL ADA
(Sum of Lines C5, C6d, and C7f) 0.00 0.00 0.00 0.00 0.00 0.00
9. TOTAL CHARTER SCHOOL ADA
Reported in Fund 01, 09, or 62
(Sum of Lines C4 and C8) 5,751.08 5,751.08 5,751.08 5,751.08 5,751.08 5,751.08

This Page Is Intentionally Left Blank

Section Break
Insert Tab Here


San Francisco UnifiedSan Francisco County
July 1 Budget2016-17 Budget
Cashflow Worksheet - Budget Year (1)38 68478 0000000
Form CASH
California Dept of EducationSACS Financial Reporting Software - 2016.1.0File: cashi (Rev 06/17/2014) Page 1 of 2 Printed: 6/23/2016 4:46 PM
Beginning
Object
Balances(Ref. Only)
July August September October November December January February
ESTIMATES THROUGH THE MONTHOF JUNE
A. BEGINNING CASH 78,181,851.00 74,114,187.00 52,520,408.00 108,846,192.00 78,595,753.00 63,790,443.00 193,197,687.00 155,229,931.00
B. RECEIPTS
LCFF/Revenue Limit Sources
Principal Apportionment 8010-8019 6,713,419.00 6,713,419.00 14,659,154.00 12,084,154.00 12,084,154.00 14,659,154.00 12,084,154.00 12,084,154.00
Property Taxes 8020-8079 0.00 0.00 5,000,000.00 0.00 0.00 160,000,000.00 1,000,000.00 100,000.00
Miscellaneous Funds 8080-8099 (1,320,000.00) (1,320,000.00) (1,320,000.00) (1,320,000.00) (2,500,000.00) (7,500,000.00) 0.00 0.00
Federal Revenue 8100-8299 35,000.00 2,600,000.00 2,700,000.00 2,800,000.00 2,800,000.00 5,400,000.00 2,500,000.00 1,500,000.00
Other State Revenue 8300-8599 100,000.00 6,500,000.00 50,000.00 30,000.00 3,500,000.00 6,500,000.00 15,000,000.00 3,000,000.00
Other Local Revenue 8600-8799 2,500,000.00 700,000.00 16,000,000.00 6,500,000.00 18,000,000.00 16,000,000.00 30,000,000.00 16,000,000.00
Interfund Transfers In 8910-8929 0.00 0.00 0.00 0.00 0.00 0.00 0.00 0.00
All Other Financing Sources 8930-8979 0.00 0.00 0.00 0.00 0.00 0.00 0.00 0.00
TOTAL RECEIPTS 8,028,419.00 15,193,419.00 37,089,154.00 20,094,154.00 33,884,154.00 195,059,154.00 60,584,154.00 32,684,154.00
C. DISBURSEMENTS
Certificated Salaries 1000-1999 6,000,000.00 15,000,000.00 20,000,000.00 20,000,000.00 21,000,000.00 25,000,000.00 25,000,000.00 25,000,000.00
Classified Salaries 2000-2999 3,000,000.00 4,000,000.00 6,000,000.00 8,000,000.00 9,000,000.00 9,000,000.00 9,000,000.00 9,000,000.00
Employee Benefits 3000-3999 3,965,504.00 8,371,619.00 11,455,899.00 12,337,122.00 13,218,345.00 14,980,791.00 14,980,791.00 14,980,791.00
Books and Supplies 4000-4999 500,000.00 2,870,000.00 1,500,000.00 1,600,000.00 1,100,000.00 1,500,000.00 1,500,000.00 2,400,000.00
Services 5000-5999 200,000.00 2,100,000.00 2,800,000.00 4,900,000.00 3,500,000.00 5,500,000.00 6,000,000.00 6,000,000.00
Capital Outlay 6000-6599 0.00 15,000.00 50,000.00 50,000.00 75,000.00 75,000.00 75,000.00 100,000.00
Other Outgo 7000-7499 4,930,579.00 4,930,579.00 5,957,471.00 5,957,471.00 5,996,119.00 9,796,119.00 9,796,119.00 9,796,119.00
Interfund Transfers Out 7600-7629 500,000.00 500,000.00 1,000,000.00 1,000,000.00 1,000,000.00 1,000,000.00 1,000,000.00 1,000,000.00
All Other Financing Uses 7630-7699 0.00 0.00 0.00 0.00 0.00 0.00 0.00 0.00
TOTAL DISBURSEMENTS 19,096,083.00 37,787,198.00 48,763,370.00 53,844,593.00 54,889,464.00 66,851,910.00 67,351,910.00 68,276,910.00
D. BALANCE SHEET ITEMS
Assets and Deferred Outflows
Cash Not In Treasury 9111-9199
Accounts Receivable 9200-9299 22,000,000.00 5,000,000.00 6,000,000.00 6,000,000.00 6,000,000.00 200,000.00 (400,000.00) 1,200,000.00
Due From Other Funds 9310
Stores 9320
Prepaid Expenditures 9330
Other Current Assets 9340 60,000,000.00
Deferred Outflows of Resources 9490
SUBTOTAL 0.00 22,000,000.00 5,000,000.00 66,000,000.00 6,000,000.00 6,000,000.00 200,000.00 (400,000.00) 1,200,000.00
Liabilities and Deferred Inflows
Accounts Payable 9500-9599 15,000,000.00 4,000,000.00 (2,000,000.00) 2,500,000.00 (200,000.00) (1,000,000.00) 800,000.00 (1,200,000.00)
Due To Other Funds 9610
Current Loans 9640 30,000,000.00
Unearned Revenues 9650
Deferred Inflows of Resources 9690
SUBTOTAL 0.00 15,000,000.00 4,000,000.00 (2,000,000.00) 2,500,000.00 (200,000.00) (1,000,000.00) 30,800,000.00 (1,200,000.00)
Nonoperating
Suspense Clearing 9910 0.00
TOTAL BALANCE SHEET ITEMS 0.00 7,000,000.00 1,000,000.00 68,000,000.00 3,500,000.00 6,200,000.00 1,200,000.00 (31,200,000.00) 2,400,000.00
E. NET INCREASE/DECREASE (B - C + D) (4,067,664.00) (21,593,779.00) 56,325,784.00 (30,250,439.00) (14,805,310.00) 129,407,244.00 (37,967,756.00) (33,192,756.00)
F. ENDING CASH (A + E) 74,114,187.00 52,520,408.00 108,846,192.00 78,595,753.00 63,790,443.00 193,197,687.00 155,229,931.00 122,037,175.00
G. ENDING CASH, PLUS CASHACCRUALS AND ADJUSTMENTS

San Francisco UnifiedSan Francisco County
July 1 Budget2016-17 Budget
Cashflow Worksheet - Budget Year (1)38 68478 0000000
Form CASH
California Dept of EducationSACS Financial Reporting Software - 2016.1.0File: cashi (Rev 06/17/2014) Page 2 of 2 Printed: 6/23/2016 4:46 PM
Object
ESTIMATES THROUGH THE MONTHOF JUNE
A. BEGINNING CASH
B. RECEIPTS
LCFF/Revenue Limit Sources
Principal Apportionment 8010-8019
Property Taxes 8020-8079
Miscellaneous Funds 8080-8099
Federal Revenue 8100-8299
Other State Revenue 8300-8599
Other Local Revenue 8600-8799
Interfund Transfers In 8910-8929
All Other Financing Sources 8930-8979
TOTAL RECEIPTS
C. DISBURSEMENTS
Certificated Salaries 1000-1999
Classified Salaries 2000-2999
Employee Benefits 3000-3999
Books and Supplies 4000-4999
Services 5000-5999
Capital Outlay 6000-6599
Other Outgo 7000-7499
Interfund Transfers Out 7600-7629
All Other Financing Uses 7630-7699
TOTAL DISBURSEMENTS
D. BALANCE SHEET ITEMS
Assets and Deferred Outflows
Cash Not In Treasury 9111-9199
Accounts Receivable 9200-9299
Due From Other Funds 9310
Stores 9320
Prepaid Expenditures 9330
Other Current Assets 9340
Deferred Outflows of Resources 9490
SUBTOTAL
Liabilities and Deferred Inflows
Accounts Payable 9500-9599
Due To Other Funds 9610
Current Loans 9640
Unearned Revenues 9650
Deferred Inflows of Resources 9690
SUBTOTAL
Nonoperating
Suspense Clearing 9910
TOTAL BALANCE SHEET ITEMS
E. NET INCREASE/DECREASE (B - C + D)
F. ENDING CASH (A + E)
G. ENDING CASH, PLUS CASHACCRUALS AND ADJUSTMENTS
March April May June Accruals Adjustments TOTAL BUDGET
122,037,175.00 81,147,584.00 162,162,993.00 131,389,014.00
14,659,154.00 12,084,154.00 12,084,154.00 14,659,154.00 144,568,378.00 144,568,372.80
100,000.00 150,000,000.00 25,000,000.00 28,630,434.00 369,830,434.00 369,830,434.00
0.00 (7,000,000.00) 0.00 (2,109,597.00) (24,389,597.00) (24,389,597.00)
100,000.00 2,500,000.00 3,000,000.00 3,878,391.54 29,813,391.54 29,813,391.54
1,500,000.00 6,000,000.00 3,000,000.00 9,770,546.61 54,950,546.61 54,950,546.61
18,000,000.00 30,000,000.00 4,000,000.00 13,647,764.83 171,347,764.83 171,347,764.83
0.00 0.00 0.00 0.00 0.00 0.00
0.00 0.00 0.00 0.00 0.00 0.00
34,359,154.00 193,584,154.00 47,084,154.00 68,476,693.98 0.00 0.00 746,120,917.98 746,120,912.78
28,000,000.00 28,000,000.00 28,000,000.00 55,860,538.63 296,860,538.63 296,860,538.63
9,000,000.00 9,000,000.00 8,000,000.00 8,276,323.82 91,276,323.82 91,276,323.82
16,302,626.00 16,302,626.00 15,862,014.00 28,259,441.60 171,017,569.60 171,017,569.60
2,350,000.00 1,000,000.00 2,500,000.00 1,919,907.22 20,739,907.22 20,739,907.22
7,000,000.00 7,000,000.00 12,000,000.00 9,122,727.90 66,122,727.90 66,122,727.90
100,000.00 100,000.00 100,000.00 534,150.48 1,274,150.48 1,274,150.48
14,796,119.00 14,796,119.00 9,796,119.00 3,769,465.00 100,318,398.00 100,318,398.00
2,000,000.00 2,000,000.00 1,000,000.00 990,399.00 12,990,399.00 12,990,399.00
0.00 0.00 0.00 0.00 0.00 0.00
79,548,745.00 78,198,745.00 77,258,133.00 108,732,953.65 0.00 0.00 760,600,014.65 760,600,014.65
0.00
5,000,000.00 500,000.00 (100,000.00) 20,000,000.00 71,400,000.00
0.00
0.00
0.00
60,000,000.00
0.00 0.00
5,000,000.00 500,000.00 (100,000.00) 20,000,000.00 0.00 0.00 131,400,000.00
700,000.00 2,000,000.00 500,000.00 25,000,000.00 46,100,000.00
0.00
32,870,000.00 62,870,000.00
0.00
0.00
700,000.00 34,870,000.00 500,000.00 25,000,000.00 0.00 0.00 108,970,000.00
0.00
4,300,000.00 (34,370,000.00) (600,000.00) (5,000,000.00) 0.00 0.00 22,430,000.00
(40,889,591.00) 81,015,409.00 (30,773,979.00) (45,256,259.67) 0.00 0.00 7,950,903.33 (14,479,101.87)
81,147,584.00 162,162,993.00 131,389,014.00 86,132,754.33
86,132,754.33

Section Break
Insert Tab Here


San Francisco UnifiedSan Francisco County
July 1 Budget2015-16 Estimated Actuals
LOTTERY REPORTRevenues, Expenditures andEnding Balances - All Funds
38 68478 0000000Form L
California Dept of EducationSACS Financial Reporting Software - 2016.1.0File: lot (Rev 02/24/2016) Page 1 of 1 Printed: 6/23/2016 4:47 PM
Description Object Codes
Lottery:
Unrestricted
(Resource 1100)
Transferred to
Other
Resources for
Expenditure
Lottery:
Instructional
Materials
(Resource 6300)* Totals
A. AMOUNT AVAILABLE FOR THIS FISCAL YEAR
1. Adjusted Beginning Fund Balance 9791-9795 0.00 597,265.72 597,265.72
2. State Lottery Revenue 8560 6,700,000.00 1,900,000.00 8,600,000.00
3. Other Local Revenue 8600-8799 0.00 0.00 0.00
4. Transfers from Funds of Lapsed/Reorganized Districts 8965 0.00 0.00 0.00
5. Contributions from Unrestricted
Resources (Total must be zero) 8980 0.00 0.00
6. Total Available
(Sum Lines A1 through A5) 6,700,000.00 0.00 2,497,265.72 9,197,265.72
B. EXPENDITURES AND OTHER FINANCING USES
1. Certificated Salaries 1000-1999 0.00 0.00
2. Classified Salaries 2000-2999 0.00 0.00
3. Employee Benefits 3000-3999 0.00 0.00
4. Books and Supplies 4000-4999 0.00 2,062,792.89 2,062,792.89
5. a. Services and Other Operating Expenditures (Resource 1100) 5000-5999 0.00 0.00
b. Services and Other Operating Expenditures (Resource 6300)
5000-5999, except5100, 5710, 5800
c. Duplicating Costs for Instructional Materials (Resource 6300) 5100, 5710, 5800
6. Capital Outlay 6000-6999 0.00 0.00
7. Tuition 7100-7199 0.00 0.00 8. Interagency Transfers Out a. To Other Districts, County Offices, and Charter Schools
7211,7212,7221,7222,7281,7282 0.00 0.00
b. To JPAs and All Others 7213,7223,7283,7299 0.00 0.00
9. Transfers of Indirect Costs 7300-7399
10. Debt Service 7400-7499 0.00 0.00
11. All Other Financing Uses 7630-7699 0.00 0.00
12. Total Expenditures and Other Financing Uses
(Sum Lines B1 through B11 ) 0.00 0.00 2,062,792.89 2,062,792.89
C. ENDING BALANCE
(Must equal Line A6 minus Line B12) 979Z 6,700,000.00 0.00 434,472.83 7,134,472.83
D. COMMENTS:
Data from this report will be used to prepare a report to the Legislature as required by Control Section 24.60 of the Budget Act.
*Pursuant to Government Code Section 8880.4(a)(2)(B) and the definition in Education Code Section 60010(h), Resource 6300 funds are to be used for the
purchase of instructional materials only. Any amounts in the shaded cells of this column should be reviewed for appropriateness.

This Page Is Intentionally Left Blank

Section Break
Insert Tab Here


San Francisco UnifiedSan Francisco County
July 1 BudgetGeneral Fund
Multiyear ProjectionsUnrestricted
38 68478 0000000Form MYP
California Dept of EducationSACS Financial Reporting Software - 2016.1.0File: myp (Rev 03/30/2015) Page 1 Printed: 6/23/2016 4:48 PM
Description
Object
Codes
2016-17
Budget
(Form 01)
(A)
%
Change
(Cols. C-A/A)
(B)
2017-18
Projection
(C)
%
Change
(Cols. E-C/C)
(D)
2018-19
Projection
(E)
(Enter projections for subsequent years 1 and 2 in Columns C and E;
current year - Column A - is extracted)
A. REVENUES AND OTHER FINANCING SOURCES
1. LCFF/Revenue Limit Sources 8010-8099 490,009,209.80 3.53% 507,296,217.00 0.45% 509,588,831.00
2. Federal Revenues 8100-8299 500,000.00 10.00% 550,000.00 10.00% 605,000.00
3. Other State Revenues 8300-8599 20,857,108.00 -57.24% 8,919,496.00 0.98% 9,006,691.00
4. Other Local Revenues 8600-8799 47,163,897.00 2.15% 48,179,591.00 2.16% 49,219,776.00
5. Other Financing Sources
a. Transfers In 8900-8929 0.00 0.00% 0.00 0.00% 0.00
b. Other Sources 8930-8979 0.00 0.00% 0.00 0.00% 0.00
c. Contributions 8980-8999 (14,921,192.04) 4.36% (15,571,677.00) 5.10% (16,366,605.00)
6. Total (Sum lines A1 thru A5c) 543,609,022.76 1.06% 549,373,627.00 0.49% 552,053,693.00
B. EXPENDITURES AND OTHER FINANCING USES
1. Certificated Salaries
a. Base Salaries 222,548,376.53 224,773,860.30
b. Step & Column Adjustment 2,225,483.77 2,247,738.60
c. Cost-of-Living Adjustment 0.00 0.00
d. Other Adjustments 0.00 0.00
e. Total Certificated Salaries (Sum lines B1a thru B1d) 1000-1999 222,548,376.53 1.00% 224,773,860.30 1.00% 227,021,598.90
2. Classified Salaries
a. Base Salaries 63,479,884.01 64,114,682.85
b. Step & Column Adjustment 634,798.84 641,146.83
c. Cost-of-Living Adjustment 0.00 0.00
d. Other Adjustments 0.00 0.00
e. Total Classified Salaries (Sum lines B2a thru B2d) 2000-2999 63,479,884.01 1.00% 64,114,682.85 1.00% 64,755,829.68
3. Employee Benefits 3000-3999 115,336,782.96 2.91% 118,690,318.00 2.87% 122,097,121.00
4. Books and Supplies 4000-4999 12,950,620.12 0.00% 12,950,620.12 0.00% 12,950,620.12
5. Services and Other Operating Expenditures 5000-5999 30,585,421.30 5.53% 32,276,879.00 -6.90% 30,049,191.00
6. Capital Outlay 6000-6999 115,500.00 0.00% 115,500.00 0.00% 115,500.00
7. Other Outgo (excluding Transfers of Indirect Costs) 7100-7299, 7400-7499 101,536,932.00 2.51% 104,080,918.00 2.51% 106,698,081.00
8. Other Outgo - Transfers of Indirect Costs 7300-7399 (6,835,946.00) 0.00% (6,835,946.00) 0.00% (6,835,946.00)
9. Other Financing Uses
a. Transfers Out 7600-7629 11,426,399.00 2.71% 11,736,222.00 2.23% 11,998,188.00
b. Other Uses 7630-7699 0.00 0.00% 0.00 0.00% 0.00
10. Other Adjustments (Explain in Section F below)
11. Total (Sum lines B1 thru B10) 551,143,969.92 1.95% 561,903,054.27 1.24% 568,850,183.70
C. NET INCREASE (DECREASE) IN FUND BALANCE
(Line A6 minus line B11) (7,534,947.16) (12,529,427.27) (16,796,490.70)
D. FUND BALANCE
1. Net Beginning Fund Balance (Form 01, line F1e) 59,419,787.54 51,884,840.38 39,355,413.11
2. Ending Fund Balance (Sum lines C and D1) 51,884,840.38 39,355,413.11 22,558,922.41
3. Components of Ending Fund Balance
a. Nonspendable 9710-9719 0.00 600,500.00 600,500.00
b. Restricted 9740
c. Committed
1. Stabilization Arrangements 9750 0.00
2. Other Commitments 9760 0.00
d. Assigned 9780 0.00 1,000,000.00 0.00
e. Unassigned/Unappropriated
1. Reserve for Economic Uncertainties 9789 0.00 15,509,578.00 15,697,205.00
2. Unassigned/Unappropriated 9790 51,884,840.38 22,245,335.11 6,261,217.41
f. Total Components of Ending Fund Balance
(Line D3f must agree with line D2) 51,884,840.38 39,355,413.11 22,558,922.41

San Francisco UnifiedSan Francisco County
July 1 BudgetGeneral Fund
Multiyear ProjectionsUnrestricted
38 68478 0000000Form MYP
California Dept of EducationSACS Financial Reporting Software - 2016.1.0File: myp (Rev 03/30/2015) Page 2 Printed: 6/23/2016 4:48 PM
Description
Object
Codes
2016-17
Budget
(Form 01)
(A)
%
Change
(Cols. C-A/A)
(B)
2017-18
Projection
(C)
%
Change
(Cols. E-C/C)
(D)
2018-19
Projection
(E)
E. AVAILABLE RESERVES
1. General Fund
a. Stabilization Arrangements 9750 0.00 0.00 0.00
b. Reserve for Economic Uncertainties 9789 0.00 15,509,578.00 15,697,205.00
c. Unassigned/Unappropriated 9790 51,884,840.38 22,245,335.11 6,261,217.41
(Enter reserve projections for subsequent years 1 and 2
in Columns C and E; current year - Column A - is extracted.)
2. Special Reserve Fund - Noncapital Outlay (Fund 17)
a. Stabilization Arrangements 9750
b. Reserve for Economic Uncertainties 9789
c. Unassigned/Unappropriated 9790
3. Total Available Reserves (Sum lines E1a thru E2c) 51,884,840.38 37,754,913.11 21,958,422.41
F. ASSUMPTIONS
Please provide below or on a separate attachment, the assumptions used to determine the projections for the first and
second subsequent fiscal years. Further, please include an explanation for any significant expenditure adjustments
projected in lines B1d, B2d, and B10. For additional information, please refer to the Budget Assumptions section of the
SACS Financial Reporting Software User Guide.
See separate attachment "BUDGET ASSUMPTIONS WORKSHEET" for assumptions used to determine the budget and multiyear projections as well as explanations for significant expenditure
adjustments.
See separate attachment "BUDGET ASSUMPTIONS WORKSHEET" for assumptions used to determine the budget and multiyear projections as well as explanations for significant expenditure
adjustments.

San Francisco UnifiedSan Francisco County
July 1 BudgetGeneral Fund
Multiyear ProjectionsRestricted
38 68478 0000000Form MYP
California Dept of EducationSACS Financial Reporting Software - 2016.1.0File: myp (Rev 03/30/2015) Page 1 Printed: 6/23/2016 4:48 PM
Description
Object
Codes
2016-17
Budget
(Form 01)
(A)
%
Change
(Cols. C-A/A)
(B)
2017-18
Projection
(C)
%
Change
(Cols. E-C/C)
(D)
2018-19
Projection
(E)
(Enter projections for subsequent years 1 and 2 in Columns C and E;
current year - Column A - is extracted)
A. REVENUES AND OTHER FINANCING SOURCES
1. LCFF/Revenue Limit Sources 8010-8099 0.00 0.00% 0.00 0.00% 0.00
2. Federal Revenues 8100-8299 29,313,391.54 -0.36% 29,207,990.00 -0.85% 28,958,611.00
3. Other State Revenues 8300-8599 34,093,438.61 -0.73% 33,843,619.00 -0.66% 33,618,737.00
4. Other Local Revenues 8600-8799 124,183,867.83 1.18% 125,644,422.00 1.14% 127,079,012.00
5. Other Financing Sources
a. Transfers In 8900-8929 0.00 0.00% 0.00 0.00% 0.00
b. Other Sources 8930-8979 0.00 0.00% 0.00 0.00% 0.00
c. Contributions 8980-8999 14,921,192.00 4.36% 15,571,677.00 5.10% 16,366,605.00
6. Total (Sum lines A1 thru A5c) 202,511,889.98 0.87% 204,267,708.00 0.86% 206,022,965.00
B. EXPENDITURES AND OTHER FINANCING USES
1. Certificated Salaries
a. Base Salaries 74,312,162.10 75,055,283.72
b. Step & Column Adjustment 743,121.62 750,552.84
c. Cost-of-Living Adjustment
d. Other Adjustments
e. Total Certificated Salaries (Sum lines B1a thru B1d) 1000-1999 74,312,162.10 1.00% 75,055,283.72 1.00% 75,805,836.56
2. Classified Salaries
a. Base Salaries 27,796,439.81 28,074,404.21
b. Step & Column Adjustment 277,964.40 280,744.04
c. Cost-of-Living Adjustment
d. Other Adjustments
e. Total Classified Salaries (Sum lines B2a thru B2d) 2000-2999 27,796,439.81 1.00% 28,074,404.21 1.00% 28,355,148.25
3. Employee Benefits 3000-3999 55,680,786.64 3.57% 57,670,022.00 3.08% 59,444,666.00
4. Books and Supplies 4000-4999 7,789,287.10 0.00% 7,789,287.00 1.00% 7,867,180.00
5. Services and Other Operating Expenditures 5000-5999 35,537,306.60 0.00% 35,537,307.00 0.00% 35,537,307.00
6. Capital Outlay 6000-6999 1,158,650.48 0.00% 1,158,650.00 0.00% 1,158,650.00
7. Other Outgo (excluding Transfers of Indirect Costs) 7100-7299, 7400-7499 1,152,272.00 -6.34% 1,079,200.00 0.00% 1,079,200.00
8. Other Outgo - Transfers of Indirect Costs 7300-7399 4,465,140.00 0.00% 4,465,140.00 0.00% 4,465,140.00
9. Other Financing Uses
a. Transfers Out 7600-7629 1,564,000.00 0.00% 1,564,000.00 0.00% 1,564,000.00
b. Other Uses 7630-7699 0.00 0.00% 0.00%
10. Other Adjustments (Explain in Section F below)
11. Total (Sum lines B1 thru B10) 209,456,044.73 1.40% 212,393,293.93 1.36% 215,277,127.81
C. NET INCREASE (DECREASE) IN FUND BALANCE
(Line A6 minus line B11) (6,944,154.75) (8,125,585.93) (9,254,162.81)
D. FUND BALANCE
1. Net Beginning Fund Balance (Form 01, line F1e) 30,583,790.69 23,639,635.94 15,514,050.01
2. Ending Fund Balance (Sum lines C and D1) 23,639,635.94 15,514,050.01 6,259,887.20
3. Components of Ending Fund Balance
a. Nonspendable 9710-9719 0.00
b. Restricted 9740 23,639,636.19 15,514,050.01 6,259,887.20
c. Committed
1. Stabilization Arrangements 9750
2. Other Commitments 9760
d. Assigned 9780
e. Unassigned/Unappropriated
1. Reserve for Economic Uncertainties 9789
2. Unassigned/Unappropriated 9790 (0.25) 0.00 0.00
f. Total Components of Ending Fund Balance
(Line D3f must agree with line D2) 23,639,635.94 15,514,050.01 6,259,887.20

San Francisco UnifiedSan Francisco County
July 1 BudgetGeneral Fund
Multiyear ProjectionsRestricted
38 68478 0000000Form MYP
California Dept of EducationSACS Financial Reporting Software - 2016.1.0File: myp (Rev 03/30/2015) Page 2 Printed: 6/23/2016 4:49 PM
Description
Object
Codes
2016-17
Budget
(Form 01)
(A)
%
Change
(Cols. C-A/A)
(B)
2017-18
Projection
(C)
%
Change
(Cols. E-C/C)
(D)
2018-19
Projection
(E)
E. AVAILABLE RESERVES
1. General Fund
a. Stabilization Arrangements 9750
b. Reserve for Economic Uncertainties 9789
c. Unassigned/Unappropriated 9790
(Enter reserve projections for subsequent years 1 and 2
in Columns C and E; current year - Column A - is extracted.)
2. Special Reserve Fund - Noncapital Outlay (Fund 17)
a. Stabilization Arrangements 9750
b. Reserve for Economic Uncertainties 9789
c. Unassigned/Unappropriated 9790
3. Total Available Reserves (Sum lines E1a thru E2c)
F. ASSUMPTIONS
Please provide below or on a separate attachment, the assumptions used to determine the projections for the first and
second subsequent fiscal years. Further, please include an explanation for any significant expenditure adjustments
projected in lines B1d, B2d, and B10. For additional information, please refer to the Budget Assumptions section of the
SACS Financial Reporting Software User Guide.
See separate attachment "BUDGET ASSUMPTIONS WORKSHEET" for assumptions used to determine the budget and multiyear projections as well as explanations for significant expenditure
adjustments
See separate attachment "BUDGET ASSUMPTIONS WORKSHEET" for assumptions used to determine the budget and multiyear projections as well as explanations for significant expenditure
adjustments

San Francisco UnifiedSan Francisco County
July 1 BudgetGeneral Fund
Multiyear ProjectionsUnrestricted/Restricted
38 68478 0000000Form MYP
California Dept of EducationSACS Financial Reporting Software - 2016.1.0File: myp (Rev 03/09/2016) Page 1 Printed: 6/23/2016 4:49 PM
DescriptionObjectCodes
2016-17Budget
(Form 01)(A)
%Change
(Cols. C-A/A)(B)
2017-18Projection
(C)
%Change
(Cols. E-C/C)(D)
2018-19Projection
(E)
(Enter projections for subsequent years 1 and 2 in Columns C and E;
current year - Column A - is extracted)
A. REVENUES AND OTHER FINANCING SOURCES
1. LCFF/Revenue Limit Sources 8010-8099 490,009,209.80 3.53% 507,296,217.00 0.45% 509,588,831.00
2. Federal Revenues 8100-8299 29,813,391.54 -0.19% 29,757,990.00 -0.65% 29,563,611.00
3. Other State Revenues 8300-8599 54,950,546.61 -22.18% 42,763,115.00 -0.32% 42,625,428.00
4. Other Local Revenues 8600-8799 171,347,764.83 1.45% 173,824,013.00 1.42% 176,298,788.00
5. Other Financing Sources
a. Transfers In 8900-8929 0.00 0.00% 0.00 0.00% 0.00
b. Other Sources 8930-8979 0.00 0.00% 0.00 0.00% 0.00
c. Contributions 8980-8999 (0.04) -100.00% 0.00 0.00% 0.00
6. Total (Sum lines A1 thru A5c) 746,120,912.74 1.01% 753,641,335.00 0.59% 758,076,658.00
B. EXPENDITURES AND OTHER FINANCING USES
1. Certificated Salaries
a. Base Salaries 296,860,538.63 299,829,144.02
b. Step & Column Adjustment 2,968,605.39 2,998,291.44
c. Cost-of-Living Adjustment 0.00 0.00
d. Other Adjustments 0.00 0.00
e. Total Certificated Salaries (Sum lines B1a thru B1d) 1000-1999 296,860,538.63 1.00% 299,829,144.02 1.00% 302,827,435.46
2. Classified Salaries
a. Base Salaries 91,276,323.82 92,189,087.06
b. Step & Column Adjustment 912,763.24 921,890.87
c. Cost-of-Living Adjustment 0.00 0.00
d. Other Adjustments 0.00 0.00
e. Total Classified Salaries (Sum lines B2a thru B2d) 2000-2999 91,276,323.82 1.00% 92,189,087.06 1.00% 93,110,977.93
3. Employee Benefits 3000-3999 171,017,569.60 3.12% 176,360,340.00 2.94% 181,541,787.00
4. Books and Supplies 4000-4999 20,739,907.22 0.00% 20,739,907.12 0.38% 20,817,800.12
5. Services and Other Operating Expenditures 5000-5999 66,122,727.90 2.56% 67,814,186.00 -3.28% 65,586,498.00
6. Capital Outlay 6000-6999 1,274,150.48 0.00% 1,274,150.00 0.00% 1,274,150.00
7. Other Outgo (excluding Transfers of Indirect Costs) 7100-7299, 7400-7499 102,689,204.00 2.41% 105,160,118.00 2.49% 107,777,281.00
8. Other Outgo - Transfers of Indirect Costs 7300-7399 (2,370,806.00) 0.00% (2,370,806.00) 0.00% (2,370,806.00)
9. Other Financing Uses
a. Transfers Out 7600-7629 12,990,399.00 2.39% 13,300,222.00 1.97% 13,562,188.00
b. Other Uses 7630-7699 0.00 0.00% 0.00 0.00% 0.00
10. Other Adjustments 0.00 0.00
11. Total (Sum lines B1 thru B10) 760,600,014.65 1.80% 774,296,348.20 1.27% 784,127,311.51
C. NET INCREASE (DECREASE) IN FUND BALANCE
(Line A6 minus line B11) (14,479,101.91) (20,655,013.20) (26,050,653.51)
D. FUND BALANCE
1. Net Beginning Fund Balance (Form 01, line F1e) 90,003,578.23 75,524,476.32 54,869,463.12
2. Ending Fund Balance (Sum lines C and D1) 75,524,476.32 54,869,463.12 28,818,809.61
3. Components of Ending Fund Balance
a. Nonspendable 9710-9719 0.00 600,500.00 600,500.00
b. Restricted 9740 23,639,636.19 15,514,050.01 6,259,887.20
c. Committed
1. Stabilization Arrangements 9750 0.00 0.00 0.00
2. Other Commitments 9760 0.00 0.00 0.00
d. Assigned 9780 0.00 1,000,000.00 0.00
e. Unassigned/Unappropriated
1. Reserve for Economic Uncertainties 9789 0.00 15,509,578.00 15,697,205.00
2. Unassigned/Unappropriated 9790 51,884,840.13 22,245,335.11 6,261,217.41
f. Total Components of Ending Fund Balance
(Line D3f must agree with line D2) 75,524,476.32 54,869,463.12 28,818,809.61

San Francisco UnifiedSan Francisco County
July 1 BudgetGeneral Fund
Multiyear ProjectionsUnrestricted/Restricted
38 68478 0000000Form MYP
California Dept of EducationSACS Financial Reporting Software - 2016.1.0File: myp (Rev 03/09/2016) Page 2 Printed: 6/23/2016 4:49 PM
DescriptionObjectCodes
2016-17Budget
(Form 01)(A)
%Change
(Cols. C-A/A)(B)
2017-18Projection
(C)
%Change
(Cols. E-C/C)(D)
2018-19Projection
(E)
E. AVAILABLE RESERVES
1. General Fund
a. Stabilization Arrangements 9750 0.00 0.00 0.00
b. Reserve for Economic Uncertainties 9789 0.00 15,509,578.00 15,697,205.00
c. Unassigned/Unappropriated 9790 51,884,840.38 22,245,335.11 6,261,217.41
d. Negative Restricted Ending Balances
(Negative resources 2000-9999) 979Z (0.25) 0.00 0.00
2. Special Reserve Fund - Noncapital Outlay (Fund 17)
a. Stabilization Arrangements 9750 0.00 0.00 0.00
b. Reserve for Economic Uncertainties 9789 0.00 0.00 0.00
c. Unassigned/Unappropriated 9790 0.00 0.00 0.00
3. Total Available Reserves - by Amount (Sum lines E1a thru E2c) 51,884,840.13 37,754,913.11 21,958,422.41
4. Total Available Reserves - by Percent (Line E3 divided by Line F3c) 6.82% 4.88% 2.80%
F. RECOMMENDED RESERVES
1. Special Education Pass-through Exclusions
For districts that serve as the administrative unit (AU) of a
special education local plan area (SELPA):
a. Do you choose to exclude from the reserve calculation
the pass-through funds distributed to SELPA members? Yes
b. If you are the SELPA AU and are excluding special
education pass-through funds:
1. Enter the name(s) of the SELPA(s):
2. Special education pass-through funds
(Column A: Fund 10, resources 3300-3499 and 6500-6540,
objects 7211-7213 and 7221-7223; enter projections
for subsequent years 1 and 2 in Columns C and E) 0.00
2. District ADA
Used to determine the reserve standard percentage level on line F3d
(Col. A: Form A, Estimated P-2 ADA column, Line A4; enter projections) 50,594.77 50,679.13 50,679.13
3. Calculating the Reserves
a. Expenditures and Other Financing Uses (Line B11) 760,600,014.65 774,296,348.20 784,127,311.51
b. Plus: Special Education Pass-through Funds (Line F1b2, if Line F1a is No) 0.00 0.00 0.00
c. Total Expenditures and Other Financing Uses (Line F3a plus line F3b) 760,600,014.65 774,296,348.20 784,127,311.51
d. Reserve Standard Percentage Level
(Refer to Form 01CS, Criterion 10 for calculation details) 2% 2% 2%
e. Reserve Standard - By Percent (Line F3c times F3d) 15,212,000.29 15,485,926.96 15,682,546.23
f. Reserve Standard - By Amount
(Refer to Form 01CS, Criterion 10 for calculation details) 0.00 0.00 0.00
g. Reserve Standard (Greater of Line F3e or F3f) 15,212,000.29 15,485,926.96 15,682,546.23
h. Available Reserves (Line E3) Meet Reserve Standard (Line F3g) YES YES YES

Section Break
Insert Tab Here


San Francisco UnifiedSan Francisco County
July 1 BudgetChild Development FundExpenditures by Object
38 68478 0000000Form 12
California Dept of EducationSACS Financial Reporting Software - 2016.1.0File: fund-b (Rev 03/08/2016) Page 1 Printed: 6/23/2016 4:50 PM
Description Resource Codes Object Codes2015-16
Estimated Actuals2016-17Budget
PercentDifference
A. REVENUES
1) LCFF Sources 8010-8099 0.00 0.00 0.0%
2) Federal Revenue 8100-8299 14,149,818.00 12,481,206.00 -11.8%
3) Other State Revenue 8300-8599 14,765,563.48 12,496,333.00 -15.4%
4) Other Local Revenue 8600-8799 8,433,463.80 10,296,074.03 22.1%
5) TOTAL, REVENUES 37,348,845.28 35,273,613.03 -5.6%
B. EXPENDITURES
1) Certificated Salaries 1000-1999 13,838,729.22 13,875,635.79 0.3%
2) Classified Salaries 2000-2999 13,313,691.59 12,812,367.73 -3.8%
3) Employee Benefits 3000-3999 11,947,844.73 12,197,933.07 2.1%
4) Books and Supplies 4000-4999 1,461,990.76 1,112,446.49 -23.9%
5) Services and Other Operating Expenditures 5000-5999 1,449,008.50 1,393,290.00 -3.8%
6) Capital Outlay 6000-6999 0.00 0.00 0.0%
7) Other Outgo (excluding Transfers of Indirect 7100-7299,
Costs) 7400-7499 2,590,894.00 0.00 -100.0%
8) Other Outgo - Transfers of Indirect Costs 7300-7399 1,519,609.15 1,527,799.91 0.5%
9) TOTAL, EXPENDITURES 46,121,767.95 42,919,472.99 -6.9%
C. EXCESS (DEFICIENCY) OF REVENUES
OVER EXPENDITURES BEFORE OTHER
FINANCING SOURCES AND USES (A5 - B9) (8,772,922.67) (7,645,859.96) -12.8%
D. OTHER FINANCING SOURCES/USES
1) Interfund Transfers
a) Transfers In 8900-8929 7,130,898.00 7,048,689.00 -1.2%
b) Transfers Out 7600-7629 0.00 0.00 0.0%
2) Other Sources/Uses
a) Sources 8930-8979 0.00 0.00 0.0%
b) Uses 7630-7699 0.00 0.00 0.0%
3) Contributions 8980-8999 0.00 0.00 0.0%
4) TOTAL, OTHER FINANCING SOURCES/USES 7,130,898.00 7,048,689.00 -1.2%
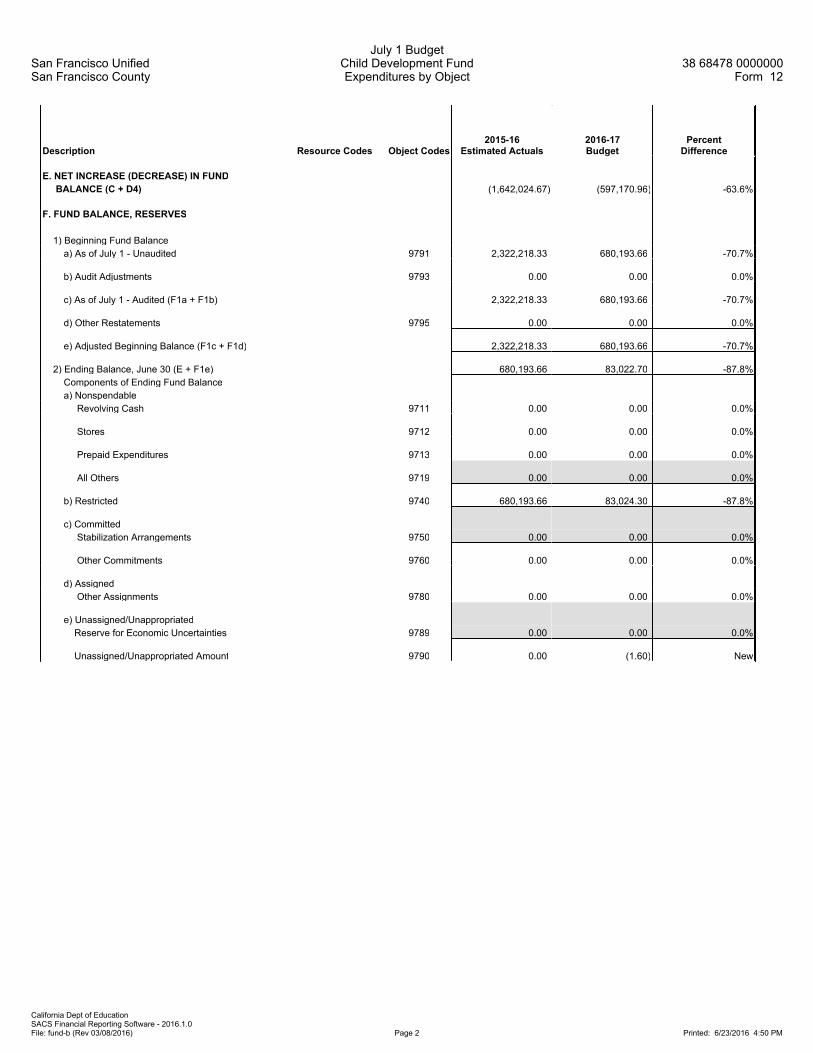
San Francisco UnifiedSan Francisco County
July 1 BudgetChild Development FundExpenditures by Object
38 68478 0000000Form 12
California Dept of EducationSACS Financial Reporting Software - 2016.1.0File: fund-b (Rev 03/08/2016) Page 2 Printed: 6/23/2016 4:50 PM
Description Resource Codes Object Codes2015-16
Estimated Actuals2016-17Budget
PercentDifference
E. NET INCREASE (DECREASE) IN FUND
BALANCE (C + D4) (1,642,024.67) (597,170.96) -63.6%
F. FUND BALANCE, RESERVES
1) Beginning Fund Balance
a) As of July 1 - Unaudited 9791 2,322,218.33 680,193.66 -70.7%
b) Audit Adjustments 9793 0.00 0.00 0.0%
c) As of July 1 - Audited (F1a + F1b) 2,322,218.33 680,193.66 -70.7%
d) Other Restatements 9795 0.00 0.00 0.0%
e) Adjusted Beginning Balance (F1c + F1d) 2,322,218.33 680,193.66 -70.7%
2) Ending Balance, June 30 (E + F1e) 680,193.66 83,022.70 -87.8%
Components of Ending Fund Balance
a) Nonspendable
Revolving Cash 9711 0.00 0.00 0.0%
Stores 9712 0.00 0.00 0.0%
Prepaid Expenditures 9713 0.00 0.00 0.0%
All Others 9719 0.00 0.00 0.0%
b) Restricted 9740 680,193.66 83,024.30 -87.8%
c) Committed
Stabilization Arrangements 9750 0.00 0.00 0.0%
Other Commitments 9760 0.00 0.00 0.0%
d) Assigned
Other Assignments 9780 0.00 0.00 0.0%
e) Unassigned/Unappropriated
Reserve for Economic Uncertainties 9789 0.00 0.00 0.0%
Unassigned/Unappropriated Amount 9790 0.00 (1.60) New

San Francisco UnifiedSan Francisco County
July 1 BudgetChild Development FundExpenditures by Object
38 68478 0000000Form 12
California Dept of EducationSACS Financial Reporting Software - 2016.1.0File: fund-b (Rev 03/08/2016) Page 3 Printed: 6/23/2016 4:50 PM
Description Resource Codes Object Codes2015-16
Estimated Actuals2016-17Budget
PercentDifference
G. ASSETS
1) Cash
a) in County Treasury 9110 0.00
1) Fair Value Adjustment to Cash in County Treasury 9111 0.00
b) in Banks 9120 0.00
c) in Revolving Fund 9130 0.00
d) with Fiscal Agent 9135 0.00
e) collections awaiting deposit 9140 0.00
2) Investments 9150 0.00
3) Accounts Receivable 9200 0.00
4) Due from Grantor Government 9290 0.00
5) Due from Other Funds 9310 0.00
6) Stores 9320 0.00
7) Prepaid Expenditures 9330 0.00
8) Other Current Assets 9340 0.00
9) TOTAL, ASSETS 0.00
H. DEFERRED OUTFLOWS OF RESOURCES
1) Deferred Outflows of Resources 9490 0.00
2) TOTAL, DEFERRED OUTFLOWS 0.00
I. LIABILITIES
1) Accounts Payable 9500 0.00
2) Due to Grantor Governments 9590 0.00
3) Due to Other Funds 9610 0.00
4) Current Loans 9640
5) Unearned Revenue 9650 0.00
6) TOTAL, LIABILITIES 0.00
J. DEFERRED INFLOWS OF RESOURCES
1) Deferred Inflows of Resources 9690 0.00
2) TOTAL, DEFERRED INFLOWS 0.00
K. FUND EQUITY
Ending Fund Balance, June 30
(G9 + H2) - (I6 + J2) 0.00

San Francisco UnifiedSan Francisco County
July 1 BudgetChild Development FundExpenditures by Object
38 68478 0000000Form 12
California Dept of EducationSACS Financial Reporting Software - 2016.1.0File: fund-b (Rev 03/08/2016) Page 4 Printed: 6/23/2016 4:50 PM
Description Resource Codes Object Codes2015-16
Estimated Actuals2016-17Budget
PercentDifference
FEDERAL REVENUE
Child Nutrition Programs 8220 1,435,000.00 1,208,711.00 -15.8%
Interagency Contracts Between LEAs 8285 0.00 0.00 0.0%
NCLB: Title I, Part A, Basic Grants Low-
Income and Neglected 3010 8290 0.00 0.00 0.0%
All Other Federal Revenue All Other 8290 12,714,818.00 11,272,495.00 -11.3%
TOTAL, FEDERAL REVENUE 14,149,818.00 12,481,206.00 -11.8%
OTHER STATE REVENUE
Child Nutrition Programs 8520 0.00 0.00 0.0%
Child Development Apportionments 8530 0.00 0.00 0.0%
Pass-Through Revenues from
State Sources 8587 0.00 0.00 0.0%
State Preschool 6105 8590 11,225,530.48 11,656,555.00 3.8%
All Other State Revenue All Other 8590 3,540,033.00 839,778.00 -76.3%
TOTAL, OTHER STATE REVENUE 14,765,563.48 12,496,333.00 -15.4%
OTHER LOCAL REVENUE
Other Local Revenue
Sales
Sale of Equipment/Supplies 8631 0.00 0.00 0.0%
Food Service Sales 8634 0.00 0.00 0.0%
Interest 8660 0.00 0.00 0.0%
Net Increase (Decrease) in the Fair Value of Investments 8662 0.00 0.00 0.0%
Fees and Contracts
Child Development Parent Fees 8673 1,200,000.00 1,218,000.00 1.5%
Interagency Services 8677 0.00 0.00 0.0%
All Other Fees and Contracts 8689 3,031,168.00 4,146,189.00 36.8%
Other Local Revenue
All Other Local Revenue 8699 4,202,295.80 4,931,885.03 17.4%
All Other Transfers In from All Others 8799 0.00 0.00 0.0%
TOTAL, OTHER LOCAL REVENUE 8,433,463.80 10,296,074.03 22.1%
TOTAL, REVENUES 37,348,845.28 35,273,613.03 -5.6%

San Francisco UnifiedSan Francisco County
July 1 BudgetChild Development FundExpenditures by Object
38 68478 0000000Form 12
California Dept of EducationSACS Financial Reporting Software - 2016.1.0File: fund-b (Rev 03/08/2016) Page 5 Printed: 6/23/2016 4:50 PM
Description Resource Codes Object Codes2015-16
Estimated Actuals2016-17Budget
PercentDifference
CERTIFICATED SALARIES
Certificated Teachers' Salaries 1100 10,683,099.19 10,490,717.62 -1.8%
Certificated Pupil Support Salaries 1200 150,771.87 235,313.15 56.1%
Certificated Supervisors' and Administrators' Salaries 1300 2,175,550.52 2,252,567.07 3.5%
Other Certificated Salaries 1900 829,307.64 897,037.95 8.2%
TOTAL, CERTIFICATED SALARIES 13,838,729.22 13,875,635.79 0.3%
CLASSIFIED SALARIES
Classified Instructional Salaries 2100 7,968,162.76 7,124,906.27 -10.6%
Classified Support Salaries 2200 1,832,992.61 1,941,487.71 5.9%
Classified Supervisors' and Administrators' Salaries 2300 617,296.83 688,257.76 11.5%
Clerical, Technical and Office Salaries 2400 2,346,177.81 2,504,172.84 6.7%
Other Classified Salaries 2900 549,061.58 553,543.15 0.8%
TOTAL, CLASSIFIED SALARIES 13,313,691.59 12,812,367.73 -3.8%
EMPLOYEE BENEFITS
STRS 3101-3102 2,333,709.77 2,585,223.78 10.8%
PERS 3201-3202 0.00 0.00 0.0%
OASDI/Medicare/Alternative 3301-3302 2,213,921.39 1,616,767.75 -27.0%
Health and Welfare Benefits 3401-3402 4,204,075.29 4,175,447.60 -0.7%
Unemployment Insurance 3501-3502 13,339.46 16,166.17 21.2%
Workers' Compensation 3601-3602 880,099.83 1,052,206.61 19.6%
OPEB, Allocated 3701-3702 2,302,698.99 2,752,121.16 19.5%
OPEB, Active Employees 3751-3752 0.00 0.00 0.0%
Other Employee Benefits 3901-3902 0.00 0.00 0.0%
TOTAL, EMPLOYEE BENEFITS 11,947,844.73 12,197,933.07 2.1%
BOOKS AND SUPPLIES
Approved Textbooks and Core Curricula Materials 4100 0.00 0.00 0.0%
Books and Other Reference Materials 4200 0.00 0.00 0.0%
Materials and Supplies 4300 727,678.75 395,552.71 -45.6%
Noncapitalized Equipment 4400 128,139.26 53,535.85 -58.2%
Food 4700 606,172.75 663,357.93 9.4%
TOTAL, BOOKS AND SUPPLIES 1,461,990.76 1,112,446.49 -23.9%

San Francisco UnifiedSan Francisco County
July 1 BudgetChild Development FundExpenditures by Object
38 68478 0000000Form 12
California Dept of EducationSACS Financial Reporting Software - 2016.1.0File: fund-b (Rev 03/08/2016) Page 6 Printed: 6/23/2016 4:50 PM
Description Resource Codes Object Codes2015-16
Estimated Actuals2016-17Budget
PercentDifference
SERVICES AND OTHER OPERATING EXPENDITURES
Subagreements for Services 5100 0.00 0.00 0.0%
Travel and Conferences 5200 33,656.67 20,000.00 -40.6%
Dues and Memberships 5300 0.00 0.00 0.0%
Insurance 5400-5450 0.00 0.00 0.0%
Operations and Housekeeping Services 5500 199,375.03 201,000.00 0.8%
Rentals, Leases, Repairs, and Noncapitalized Improvements 5600 221,783.77 212,000.00 -4.4%
Transfers of Direct Costs 5710 0.00 0.00 0.0%
Transfers of Direct Costs - Interfund 5750 0.00 0.00 0.0%
Professional/Consulting Services and
Operating Expenditures 5800 964,636.71 916,190.00 -5.0%
Communications 5900 29,556.32 44,100.00 49.2%
TOTAL, SERVICES AND OTHER OPERATING EXPENDITURES 1,449,008.50 1,393,290.00 -3.8%
CAPITAL OUTLAY
Land 6100 0.00 0.00 0.0%
Land Improvements 6170 0.00 0.00 0.0%
Buildings and Improvements of Buildings 6200 0.00 0.00 0.0%
Equipment 6400 0.00 0.00 0.0%
Equipment Replacement 6500 0.00 0.00 0.0%
TOTAL, CAPITAL OUTLAY 0.00 0.00 0.0%
OTHER OUTGO (excluding Transfers of Indirect Costs)
Other Transfers Out
All Other Transfers Out to All Others 7299 2,590,894.00 0.00 -100.0%
Debt Service
Debt Service - Interest 7438 0.00 0.00 0.0%
Other Debt Service - Principal 7439 0.00 0.00 0.0%
TOTAL, OTHER OUTGO (excluding Transfers of Indirect Costs) 2,590,894.00 0.00 -100.0%
OTHER OUTGO - TRANSFERS OF INDIRECT COSTS
Transfers of Indirect Costs - Interfund 7350 1,519,609.15 1,527,799.91 0.5%
TOTAL, OTHER OUTGO - TRANSFERS OF INDIRECT COSTS 1,519,609.15 1,527,799.91 0.5%
TOTAL, EXPENDITURES 46,121,767.95 42,919,472.99 -6.9%

San Francisco UnifiedSan Francisco County
July 1 BudgetChild Development FundExpenditures by Object
38 68478 0000000Form 12
California Dept of EducationSACS Financial Reporting Software - 2016.1.0File: fund-b (Rev 03/08/2016) Page 7 Printed: 6/23/2016 4:50 PM
Description Resource Codes Object Codes2015-16
Estimated Actuals2016-17Budget
PercentDifference
INTERFUND TRANSFERS
INTERFUND TRANSFERS IN
From: General Fund 8911 5,566,898.00 5,484,689.00 -1.5%
Other Authorized Interfund Transfers In 8919 1,564,000.00 1,564,000.00 0.0%
(a) TOTAL, INTERFUND TRANSFERS IN 7,130,898.00 7,048,689.00 -1.2%
INTERFUND TRANSFERS OUT
Other Authorized Interfund Transfers Out 7619 0.00 0.00 0.0%
(b) TOTAL, INTERFUND TRANSFERS OUT 0.00 0.00 0.0%
OTHER SOURCES/USES
SOURCES
Other Sources
Transfers from Funds of
Lapsed/Reorganized LEAs 8965 0.00 0.00 0.0%
Long-Term Debt Proceeds
Proceeds from Certificates
of Participation 8971 0.00 0.00 0.0%
Proceeds from Capital Leases 8972 0.00 0.00 0.0%
All Other Financing Sources 8979 0.00 0.00 0.0%
(c) TOTAL, SOURCES 0.00 0.00 0.0%
USES
Transfers of Funds from
Lapsed/Reorganized LEAs 7651 0.00 0.00 0.0%
All Other Financing Uses 7699 0.00 0.00 0.0%
(d) TOTAL, USES 0.00 0.00 0.0%
CONTRIBUTIONS
Contributions from Unrestricted Revenues 8980 0.00 0.00 0.0%
Contributions from Restricted Revenues 8990 0.00 0.00 0.0%
(e) TOTAL, CONTRIBUTIONS 0.00 0.00 0.0%
TOTAL, OTHER FINANCING SOURCES/USES
(a - b + c - d + e) 7,130,898.00 7,048,689.00 -1.2%

San Francisco UnifiedSan Francisco County
July 1 BudgetChild Development FundExpenditures by Function
38 68478 0000000Form 12
California Dept of EducationSACS Financial Reporting Software - 2016.1.0File: fund-b (Rev 03/08/2016) Page 1 Printed: 6/23/2016 4:50 PM
Description Function Codes Object Codes2015-16
Estimated Actuals2016-17Budget
PercentDifference
A. REVENUES
1) LCFF Sources 8010-8099 0.00 0.00 0.0%
2) Federal Revenue 8100-8299 14,149,818.00 12,481,206.00 -11.8%
3) Other State Revenue 8300-8599 14,765,563.48 12,496,333.00 -15.4%
4) Other Local Revenue 8600-8799 8,433,463.80 10,296,074.03 22.1%
5) TOTAL, REVENUES 37,348,845.28 35,273,613.03 -5.6%
B. EXPENDITURES (Objects 1000-7999)
1) Instruction 1000-1999 26,883,555.50 26,061,992.00 -3.1%
2) Instruction - Related Services 2000-2999 10,851,142.20 10,838,294.54 -0.1%
3) Pupil Services 3000-3999 3,465,639.12 3,669,899.99 5.9%
4) Ancillary Services 4000-4999 0.00 0.00 0.0%
5) Community Services 5000-5999 0.00 0.00 0.0%
6) Enterprise 6000-6999 0.00 0.00 0.0%
7) General Administration 7000-7999 1,519,609.15 1,527,799.91 0.5%
8) Plant Services 8000-8999 810,927.98 821,486.55 1.3%
9) Other Outgo 9000-9999Except
7600-7699 2,590,894.00 0.00 -100.0%
10) TOTAL, EXPENDITURES 46,121,767.95 42,919,472.99 -6.9%
C. EXCESS (DEFICIENCY) OF REVENUES
OVER EXPENDITURES BEFORE OTHER
FINANCING SOURCES AND USES (A5 - B10) (8,772,922.67) (7,645,859.96) -12.8%
D. OTHER FINANCING SOURCES/USES
1) Interfund Transfers
a) Transfers In 8900-8929 7,130,898.00 7,048,689.00 -1.2%
b) Transfers Out 7600-7629 0.00 0.00 0.0%
2) Other Sources/Uses
a) Sources 8930-8979 0.00 0.00 0.0%
b) Uses 7630-7699 0.00 0.00 0.0%
3) Contributions 8980-8999 0.00 0.00 0.0%
4) TOTAL, OTHER FINANCING SOURCES/USES 7,130,898.00 7,048,689.00 -1.2%

San Francisco UnifiedSan Francisco County
July 1 BudgetChild Development FundExpenditures by Function
38 68478 0000000Form 12
California Dept of EducationSACS Financial Reporting Software - 2016.1.0File: fund-b (Rev 03/08/2016) Page 2 Printed: 6/23/2016 4:50 PM
Description Function Codes Object Codes2015-16
Estimated Actuals2016-17Budget
PercentDifference
E. NET INCREASE (DECREASE) IN FUND
BALANCE (C + D4) (1,642,024.67) (597,170.96) -63.6%
F. FUND BALANCE, RESERVES
1) Beginning Fund Balance
a) As of July 1 - Unaudited 9791 2,322,218.33 680,193.66 -70.7%
b) Audit Adjustments 9793 0.00 0.00 0.0%
c) As of July 1 - Audited (F1a + F1b) 2,322,218.33 680,193.66 -70.7%
d) Other Restatements 9795 0.00 0.00 0.0%
e) Adjusted Beginning Balance (F1c + F1d) 2,322,218.33 680,193.66 -70.7%
2) Ending Balance, June 30 (E + F1e) 680,193.66 83,022.70 -87.8%
Components of Ending Fund Balance
a) Nonspendable
Revolving Cash 9711 0.00 0.00 0.0%
Stores 9712 0.00 0.00 0.0%
Prepaid Expenditures 9713 0.00 0.00 0.0%
All Others 9719 0.00 0.00 0.0%
b) Restricted 9740 680,193.66 83,024.30 -87.8%
c) Committed
Stabilization Arrangements 9750 0.00 0.00 0.0%
Other Commitments (by Resource/Object) 9760 0.00 0.00 0.0%
d) Assigned
Other Assignments (by Resource/Object) 9780 0.00 0.00 0.0%
e) Unassigned/Unappropriated
Reserve for Economic Uncertainties 9789 0.00 0.00 0.0%
Unassigned/Unappropriated Amount 9790 0.00 (1.60) New

San Francisco UnifiedSan Francisco County
July 1 BudgetChild Development Fund
Exhibit: Restricted Balance Detail38 68478 0000000
Form 12
California Dept of EducationSACS Financial Reporting Software - 2016.1.0File: fund-b (Rev 11/14/2012) Page 1 Printed: 6/23/2016 4:50 PM
2015-16 2016-17
Resource Description Estimated Actuals Budget
5320 Child Nutrition: Child Care Food Program (CCFP) Claims-Centers and Family Day Ca27,986.96 27,986.97
7810 Other Restricted State 3,569.87 3,569.87
9010 Other Restricted Local 648,636.83 51,467.46
Total, Restricted Balance 680,193.66 83,024.30

Section Break
Insert Tab Here


San Francisco UnifiedSan Francisco County
July 1 BudgetCafeteria Special Revenue Fund
Expenditures by Object38 68478 0000000
Form 13
California Dept of EducationSACS Financial Reporting Software - 2016.1.0File: fund-b (Rev 03/08/2016) Page 1 Printed: 6/23/2016 4:51 PM
Description Resource Codes Object Codes2015-16
Estimated Actuals2016-17Budget
PercentDifference
A. REVENUES
1) LCFF Sources 8010-8099 0.00 0.00 0.0%
2) Federal Revenue 8100-8299 16,024,445.85 16,731,143.00 4.4%
3) Other State Revenue 8300-8599 1,030,836.00 1,004,988.00 -2.5%
4) Other Local Revenue 8600-8799 2,025,501.58 2,116,248.00 4.5%
5) TOTAL, REVENUES 19,080,783.43 19,852,379.00 4.0%
B. EXPENDITURES
1) Certificated Salaries 1000-1999 0.00 0.00 0.0%
2) Classified Salaries 2000-2999 5,261,149.84 5,333,344.19 1.4%
3) Employee Benefits 3000-3999 2,988,720.33 2,667,149.28 -10.8%
4) Books and Supplies 4000-4999 11,792,574.56 11,993,771.00 1.7%
5) Services and Other Operating Expenditures 5000-5999 1,339,740.57 1,744,306.00 30.2%
6) Capital Outlay 6000-6999 0.00 0.00 0.0%
7) Other Outgo (excluding Transfers of Indirect 7100-7299,
Costs) 7400-7499 0.00 0.00 0.0%
8) Other Outgo - Transfers of Indirect Costs 7300-7399 844,998.59 843,006.28 -0.2%
9) TOTAL, EXPENDITURES 22,227,183.89 22,581,576.75 1.6%
C. EXCESS (DEFICIENCY) OF REVENUES
OVER EXPENDITURES BEFORE OTHER
FINANCING SOURCES AND USES (A5 - B9) (3,146,400.46) (2,729,197.75) -13.3%
D. OTHER FINANCING SOURCES/USES
1) Interfund Transfers
a) Transfers In 8900-8929 3,139,893.00 3,296,888.00 5.0%
b) Transfers Out 7600-7629 0.00 0.00 0.0%
2) Other Sources/Uses
a) Sources 8930-8979 0.00 0.00 0.0%
b) Uses 7630-7699 0.00 0.00 0.0%
3) Contributions 8980-8999 0.00 0.00 0.0%
4) TOTAL, OTHER FINANCING SOURCES/USES 3,139,893.00 3,296,888.00 5.0%

San Francisco UnifiedSan Francisco County
July 1 BudgetCafeteria Special Revenue Fund
Expenditures by Object38 68478 0000000
Form 13
California Dept of EducationSACS Financial Reporting Software - 2016.1.0File: fund-b (Rev 03/08/2016) Page 2 Printed: 6/23/2016 4:51 PM
Description Resource Codes Object Codes2015-16
Estimated Actuals2016-17Budget
PercentDifference
E. NET INCREASE (DECREASE) IN FUND
BALANCE (C + D4) (6,507.46) 567,690.25 -8823.7%
F. FUND BALANCE, RESERVES
1) Beginning Fund Balance
a) As of July 1 - Unaudited 9791 135,989.88 129,482.42 -4.8%
b) Audit Adjustments 9793 0.00 0.00 0.0%
c) As of July 1 - Audited (F1a + F1b) 135,989.88 129,482.42 -4.8%
d) Other Restatements 9795 0.00 0.00 0.0%
e) Adjusted Beginning Balance (F1c + F1d) 135,989.88 129,482.42 -4.8%
2) Ending Balance, June 30 (E + F1e) 129,482.42 697,172.67 438.4%
Components of Ending Fund Balance
a) Nonspendable
Revolving Cash 9711 0.00 0.00 0.0%
Stores 9712 0.00 0.00 0.0%
Prepaid Expenditures 9713 0.00 0.00 0.0%
All Others 9719 0.00 0.00 0.0%
b) Restricted 9740 129,482.42 697,172.67 438.4%
c) Committed
Stabilization Arrangements 9750 0.00 0.00 0.0%
Other Commitments 9760 0.00 0.00 0.0%
d) Assigned
Other Assignments 9780 0.00 0.00 0.0%
e) Unassigned/Unappropriated
Reserve for Economic Uncertainties 9789 0.00 0.00 0.0%
Unassigned/Unappropriated Amount 9790 0.00 0.00 0.0%
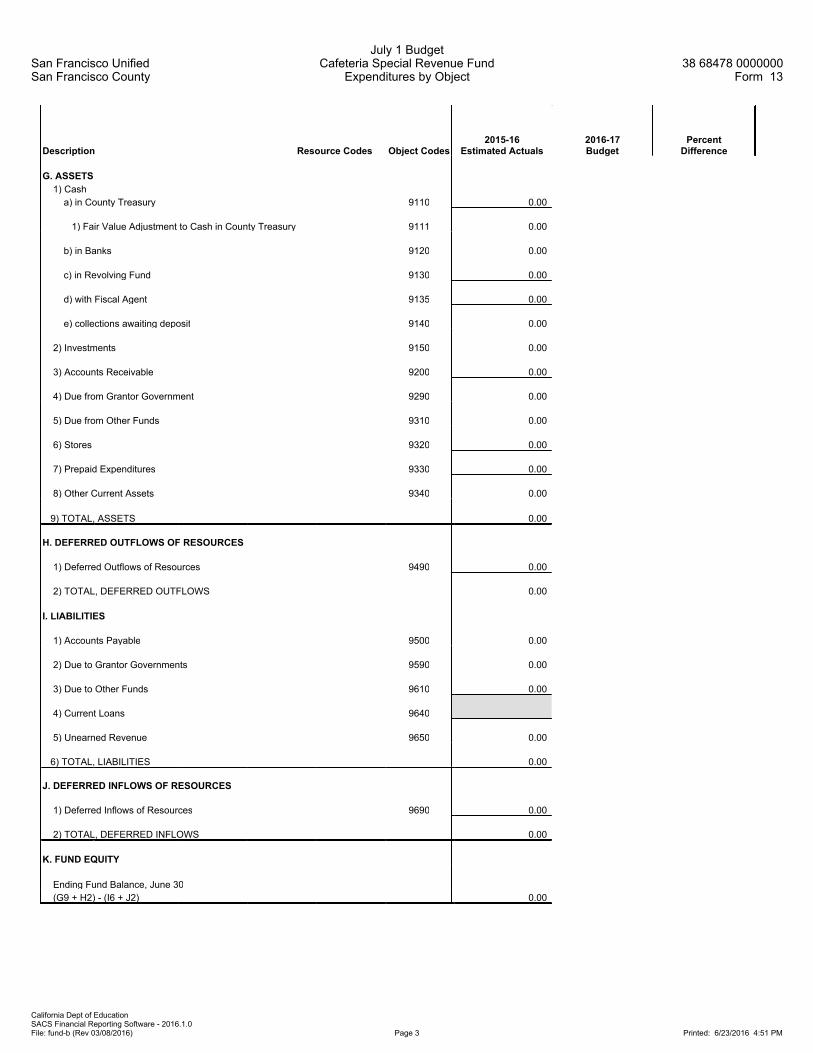
San Francisco UnifiedSan Francisco County
July 1 BudgetCafeteria Special Revenue Fund
Expenditures by Object38 68478 0000000
Form 13
California Dept of EducationSACS Financial Reporting Software - 2016.1.0File: fund-b (Rev 03/08/2016) Page 3 Printed: 6/23/2016 4:51 PM
Description Resource Codes Object Codes2015-16
Estimated Actuals2016-17Budget
PercentDifference
G. ASSETS
1) Cash
a) in County Treasury 9110 0.00
1) Fair Value Adjustment to Cash in County Treasury 9111 0.00
b) in Banks 9120 0.00
c) in Revolving Fund 9130 0.00
d) with Fiscal Agent 9135 0.00
e) collections awaiting deposit 9140 0.00
2) Investments 9150 0.00
3) Accounts Receivable 9200 0.00
4) Due from Grantor Government 9290 0.00
5) Due from Other Funds 9310 0.00
6) Stores 9320 0.00
7) Prepaid Expenditures 9330 0.00
8) Other Current Assets 9340 0.00
9) TOTAL, ASSETS 0.00
H. DEFERRED OUTFLOWS OF RESOURCES
1) Deferred Outflows of Resources 9490 0.00
2) TOTAL, DEFERRED OUTFLOWS 0.00
I. LIABILITIES
1) Accounts Payable 9500 0.00
2) Due to Grantor Governments 9590 0.00
3) Due to Other Funds 9610 0.00
4) Current Loans 9640
5) Unearned Revenue 9650 0.00
6) TOTAL, LIABILITIES 0.00
J. DEFERRED INFLOWS OF RESOURCES
1) Deferred Inflows of Resources 9690 0.00
2) TOTAL, DEFERRED INFLOWS 0.00
K. FUND EQUITY
Ending Fund Balance, June 30
(G9 + H2) - (I6 + J2) 0.00

San Francisco UnifiedSan Francisco County
July 1 BudgetCafeteria Special Revenue Fund
Expenditures by Object38 68478 0000000
Form 13
California Dept of EducationSACS Financial Reporting Software - 2016.1.0File: fund-b (Rev 03/08/2016) Page 4 Printed: 6/23/2016 4:52 PM
Description Resource Codes Object Codes2015-16
Estimated Actuals2016-17Budget
PercentDifference
FEDERAL REVENUE
Child Nutrition Programs 8220 16,007,369.00 16,731,143.00 4.5%
Donated Food Commodities 8221 0.00 0.00 0.0%
All Other Federal Revenue 8290 17,076.85 0.00 -100.0%
TOTAL, FEDERAL REVENUE 16,024,445.85 16,731,143.00 4.4%
OTHER STATE REVENUE
Child Nutrition Programs 8520 1,030,836.00 1,004,988.00 -2.5%
All Other State Revenue 8590 0.00 0.00 0.0%
TOTAL, OTHER STATE REVENUE 1,030,836.00 1,004,988.00 -2.5%
OTHER LOCAL REVENUE
Other Local Revenue
Sales
Sale of Equipment/Supplies 8631 0.00 0.00 0.0%
Food Service Sales 8634 1,480,878.00 1,511,101.00 2.0%
Leases and Rentals 8650 0.00 0.00 0.0%
Interest 8660 0.00 0.00 0.0%
Net Increase (Decrease) in the Fair Value of Investments 8662 0.00 0.00 0.0%
Fees and Contracts
Interagency Services 8677 0.00 0.00 0.0%
Other Local Revenue
All Other Local Revenue 8699 544,623.58 605,147.00 11.1%
TOTAL, OTHER LOCAL REVENUE 2,025,501.58 2,116,248.00 4.5%
TOTAL, REVENUES 19,080,783.43 19,852,379.00 4.0%

San Francisco UnifiedSan Francisco County
July 1 BudgetCafeteria Special Revenue Fund
Expenditures by Object38 68478 0000000
Form 13
California Dept of EducationSACS Financial Reporting Software - 2016.1.0File: fund-b (Rev 03/08/2016) Page 5 Printed: 6/23/2016 4:52 PM
Description Resource Codes Object Codes2015-16
Estimated Actuals2016-17Budget
PercentDifference
CERTIFICATED SALARIES
Certificated Supervisors' and Administrators' Salaries 1300 0.00 0.00 0.0%
Other Certificated Salaries 1900 0.00 0.00 0.0%
TOTAL, CERTIFICATED SALARIES 0.00 0.00 0.0%
CLASSIFIED SALARIES
Classified Support Salaries 2200 4,193,011.87 4,216,410.12 0.6%
Classified Supervisors' and Administrators' Salaries 2300 499,796.72 403,022.40 -19.4%
Clerical, Technical and Office Salaries 2400 568,341.25 713,911.67 25.6%
Other Classified Salaries 2900 0.00 0.00 0.0%
TOTAL, CLASSIFIED SALARIES 5,261,149.84 5,333,344.19 1.4%
EMPLOYEE BENEFITS
STRS 3101-3102 0.00 0.00 0.0%
PERS 3201-3202 0.00 0.00 0.0%
OASDI/Medicare/Alternative 3301-3302 1,735,305.29 848,697.75 -51.1%
Health and Welfare Benefits 3401-3402 499,291.70 509,808.80 2.1%
Unemployment Insurance 3501-3502 3,236.58 5,609.08 73.3%
Workers' Compensation 3601-3602 207,639.11 360,275.86 73.5%
OPEB, Allocated 3701-3702 543,247.65 942,757.79 73.5%
OPEB, Active Employees 3751-3752 0.00 0.00 0.0%
Other Employee Benefits 3901-3902 0.00 0.00 0.0%
TOTAL, EMPLOYEE BENEFITS 2,988,720.33 2,667,149.28 -10.8%
BOOKS AND SUPPLIES
Books and Other Reference Materials 4200 0.00 0.00 0.0%
Materials and Supplies 4300 57,028.18 46,508.00 -18.4%
Noncapitalized Equipment 4400 152,493.38 124,457.00 -18.4%
Food 4700 11,583,053.00 11,822,806.00 2.1%
TOTAL, BOOKS AND SUPPLIES 11,792,574.56 11,993,771.00 1.7%

San Francisco UnifiedSan Francisco County
July 1 BudgetCafeteria Special Revenue Fund
Expenditures by Object38 68478 0000000
Form 13
California Dept of EducationSACS Financial Reporting Software - 2016.1.0File: fund-b (Rev 03/08/2016) Page 6 Printed: 6/23/2016 4:52 PM
Description Resource Codes Object Codes2015-16
Estimated Actuals2016-17Budget
PercentDifference
SERVICES AND OTHER OPERATING EXPENDITURES
Subagreements for Services 5100 0.00 0.00 0.0%
Travel and Conferences 5200 17,000.00 17,000.00 0.0%
Dues and Memberships 5300 0.00 0.00 0.0%
Insurance 5400-5450 0.00 0.00 0.0%
Operations and Housekeeping Services 5500 0.00 0.00 0.0%
Rentals, Leases, Repairs, and Noncapitalized Improvements 5600 83,000.00 93,563.00 12.7%
Transfers of Direct Costs 5710 0.00 0.00 0.0%
Transfers of Direct Costs - Interfund 5750 0.00 0.00 0.0%
Professional/Consulting Services and
Operating Expenditures 5800 1,237,740.57 1,631,743.00 31.8%
Communications 5900 2,000.00 2,000.00 0.0%
TOTAL, SERVICES AND OTHER OPERATING EXPENDITURES 1,339,740.57 1,744,306.00 30.2%
CAPITAL OUTLAY
Buildings and Improvements of Buildings 6200 0.00 0.00 0.0%
Equipment 6400 0.00 0.00 0.0%
Equipment Replacement 6500 0.00 0.00 0.0%
TOTAL, CAPITAL OUTLAY 0.00 0.00 0.0%
OTHER OUTGO (excluding Transfers of Indirect Costs)
Debt Service
Debt Service - Interest 7438 0.00 0.00 0.0%
Other Debt Service - Principal 7439 0.00 0.00 0.0%
TOTAL, OTHER OUTGO (excluding Transfers of Indirect Costs) 0.00 0.00 0.0%
OTHER OUTGO - TRANSFERS OF INDIRECT COSTS
Transfers of Indirect Costs - Interfund 7350 844,998.59 843,006.28 -0.2%
TOTAL, OTHER OUTGO - TRANSFERS OF INDIRECT COSTS 844,998.59 843,006.28 -0.2%
TOTAL, EXPENDITURES 22,227,183.89 22,581,576.75 1.6%

San Francisco UnifiedSan Francisco County
July 1 BudgetCafeteria Special Revenue Fund
Expenditures by Object38 68478 0000000
Form 13
California Dept of EducationSACS Financial Reporting Software - 2016.1.0File: fund-b (Rev 03/08/2016) Page 7 Printed: 6/23/2016 4:52 PM
Description Resource Codes Object Codes2015-16
Estimated Actuals2016-17Budget
PercentDifference
INTERFUND TRANSFERS
INTERFUND TRANSFERS IN
From: General Fund 8916 3,139,893.00 3,296,888.00 5.0%
Other Authorized Interfund Transfers In 8919 0.00 0.00 0.0%
(a) TOTAL, INTERFUND TRANSFERS IN 3,139,893.00 3,296,888.00 5.0%
INTERFUND TRANSFERS OUT
Other Authorized Interfund Transfers Out 7619 0.00 0.00 0.0%
(b) TOTAL, INTERFUND TRANSFERS OUT 0.00 0.00 0.0%
OTHER SOURCES/USES
SOURCES
Other Sources
Transfers from Funds of
Lapsed/Reorganized LEAs 8965 0.00 0.00 0.0%
Long-Term Debt Proceeds
Proceeds from Capital Leases 8972 0.00 0.00 0.0%
All Other Financing Sources 8979 0.00 0.00 0.0%
(c) TOTAL, SOURCES 0.00 0.00 0.0%
USES
Transfers of Funds from
Lapsed/Reorganized LEAs 7651 0.00 0.00 0.0%
All Other Financing Uses 7699 0.00 0.00 0.0%
(d) TOTAL, USES 0.00 0.00 0.0%
CONTRIBUTIONS
Contributions from Unrestricted Revenues 8980 0.00 0.00 0.0%
Contributions from Restricted Revenues 8990 0.00 0.00 0.0%
(e) TOTAL, CONTRIBUTIONS 0.00 0.00 0.0%
TOTAL, OTHER FINANCING SOURCES/USES
(a - b + c - d + e) 3,139,893.00 3,296,888.00 5.0%

San Francisco UnifiedSan Francisco County
July 1 BudgetCafeteria Special Revenue Fund
Expenditures by Function38 68478 0000000
Form 13
California Dept of EducationSACS Financial Reporting Software - 2016.1.0File: fund-b (Rev 03/08/2016) Page 1 Printed: 6/23/2016 4:52 PM
Description Function Codes Object Codes2015-16
Estimated Actuals2016-17Budget
PercentDifference
A. REVENUES
1) LCFF Sources 8010-8099 0.00 0.00 0.0%
2) Federal Revenue 8100-8299 16,024,445.85 16,731,143.00 4.4%
3) Other State Revenue 8300-8599 1,030,836.00 1,004,988.00 -2.5%
4) Other Local Revenue 8600-8799 2,025,501.58 2,116,248.00 4.5%
5) TOTAL, REVENUES 19,080,783.43 19,852,379.00 4.0%
B. EXPENDITURES (Objects 1000-7999)
1) Instruction 1000-1999 0.00 0.00 0.0%
2) Instruction - Related Services 2000-2999 0.00 0.00 0.0%
3) Pupil Services 3000-3999 21,382,185.30 21,738,570.47 1.7%
4) Ancillary Services 4000-4999 0.00 0.00 0.0%
5) Community Services 5000-5999 0.00 0.00 0.0%
6) Enterprise 6000-6999 0.00 0.00 0.0%
7) General Administration 7000-7999 844,998.59 843,006.28 -0.2%
8) Plant Services 8000-8999 0.00 0.00 0.0%
9) Other Outgo 9000-9999Except
7600-7699 0.00 0.00 0.0%
10) TOTAL, EXPENDITURES 22,227,183.89 22,581,576.75 1.6%
C. EXCESS (DEFICIENCY) OF REVENUES
OVER EXPENDITURES BEFORE OTHER
FINANCING SOURCES AND USES (A5 - B10) (3,146,400.46) (2,729,197.75) -13.3%
D. OTHER FINANCING SOURCES/USES
1) Interfund Transfers
a) Transfers In 8900-8929 3,139,893.00 3,296,888.00 5.0%
b) Transfers Out 7600-7629 0.00 0.00 0.0%
2) Other Sources/Uses
a) Sources 8930-8979 0.00 0.00 0.0%
b) Uses 7630-7699 0.00 0.00 0.0%
3) Contributions 8980-8999 0.00 0.00 0.0%
4) TOTAL, OTHER FINANCING SOURCES/USES 3,139,893.00 3,296,888.00 5.0%

San Francisco UnifiedSan Francisco County
July 1 BudgetCafeteria Special Revenue Fund
Expenditures by Function38 68478 0000000
Form 13
California Dept of EducationSACS Financial Reporting Software - 2016.1.0File: fund-b (Rev 03/08/2016) Page 2 Printed: 6/23/2016 4:52 PM
Description Function Codes Object Codes2015-16
Estimated Actuals2016-17Budget
PercentDifference
E. NET INCREASE (DECREASE) IN FUND
BALANCE (C + D4) (6,507.46) 567,690.25 -8823.7%
F. FUND BALANCE, RESERVES
1) Beginning Fund Balance
a) As of July 1 - Unaudited 9791 135,989.88 129,482.42 -4.8%
b) Audit Adjustments 9793 0.00 0.00 0.0%
c) As of July 1 - Audited (F1a + F1b) 135,989.88 129,482.42 -4.8%
d) Other Restatements 9795 0.00 0.00 0.0%
e) Adjusted Beginning Balance (F1c + F1d) 135,989.88 129,482.42 -4.8%
2) Ending Balance, June 30 (E + F1e) 129,482.42 697,172.67 438.4%
Components of Ending Fund Balance
a) Nonspendable
Revolving Cash 9711 0.00 0.00 0.0%
Stores 9712 0.00 0.00 0.0%
Prepaid Expenditures 9713 0.00 0.00 0.0%
All Others 9719 0.00 0.00 0.0%
b) Restricted 9740 129,482.42 697,172.67 438.4%
c) Committed
Stabilization Arrangements 9750 0.00 0.00 0.0%
Other Commitments (by Resource/Object) 9760 0.00 0.00 0.0%
d) Assigned
Other Assignments (by Resource/Object) 9780 0.00 0.00 0.0%
e) Unassigned/Unappropriated
Reserve for Economic Uncertainties 9789 0.00 0.00 0.0%
Unassigned/Unappropriated Amount 9790 0.00 0.00 0.0%

San Francisco UnifiedSan Francisco County
July 1 BudgetCafeteria Special Revenue FundExhibit: Restricted Balance Detail
38 68478 0000000Form 13
California Dept of EducationSACS Financial Reporting Software - 2016.1.0File: fund-b (Rev 11/14/2012) Page 1 Printed: 6/23/2016 4:52 PM
2015-16 2016-17
Resource Description Estimated Actuals Budget
5310 Child Nutrition: School Programs (e.g., School Lunch, School Breakfast, Milk, Pr129,482.42 395,486.67
9010 Other Restricted Local 0.00 301,686.00
Total, Restricted Balance 129,482.42 697,172.67

Section Break
Insert Tab Here


San Francisco UnifiedSan Francisco County
July 1 BudgetBuilding Fund
Expenditures by Object38 68478 0000000
Form 21
California Dept of EducationSACS Financial Reporting Software - 2016.1.0File: fund-d (Rev 02/02/2016) Page 1 Printed: 6/23/2016 4:53 PM
Description Resource Codes Object Codes2015-16
Estimated Actuals2016-17Budget
PercentDifference
A. REVENUES
1) LCFF Sources 8010-8099 0.00 0.00 0.0%
2) Federal Revenue 8100-8299 0.00 0.00 0.0%
3) Other State Revenue 8300-8599 0.00 0.00 0.0%
4) Other Local Revenue 8600-8799 8,712,637.82 10,821,389.00 24.2%
5) TOTAL, REVENUES 8,712,637.82 10,821,389.00 24.2%
B. EXPENDITURES
1) Certificated Salaries 1000-1999 0.00 0.00 0.0%
2) Classified Salaries 2000-2999 4,616,827.91 4,376,001.83 -5.2%
3) Employee Benefits 3000-3999 2,215,818.20 2,159,519.54 -2.5%
4) Books and Supplies 4000-4999 238,904.96 90,250.00 -62.2%
5) Services and Other Operating Expenditures 5000-5999 2,876,508.02 2,445,750.71 -15.0%
6) Capital Outlay 6000-6999 260,329,926.48 4,397,741.00 -98.3%
7) Other Outgo (excluding Transfers of Indirect 7100-7299,
Costs) 7400-7499 0.00 0.00 0.0%
8) Other Outgo - Transfers of Indirect Costs 7300-7399 0.00 0.00 0.0%
9) TOTAL, EXPENDITURES 270,277,985.57 13,469,263.08 -95.0%
C. EXCESS (DEFICIENCY) OF REVENUES
OVER EXPENDITURES BEFORE OTHER
FINANCING SOURCES AND USES (A5 - B9) (261,565,347.75) (2,647,874.08) -99.0%
D. OTHER FINANCING SOURCES/USES
1) Interfund Transfers
a) Transfers In 8900-8929 0.00 0.00 0.0%
b) Transfers Out 7600-7629 0.00 0.00 0.0%
2) Other Sources/Uses
a) Sources 8930-8979 226,000,000.00 0.00 -100.0%
b) Uses 7630-7699 0.00 0.00 0.0%
3) Contributions 8980-8999 0.00 0.00 0.0%
4) TOTAL, OTHER FINANCING SOURCES/USES 226,000,000.00 0.00 -100.0%

San Francisco UnifiedSan Francisco County
July 1 BudgetBuilding Fund
Expenditures by Object38 68478 0000000
Form 21
California Dept of EducationSACS Financial Reporting Software - 2016.1.0File: fund-d (Rev 02/02/2016) Page 2 Printed: 6/23/2016 4:53 PM
Description Resource Codes Object Codes2015-16
Estimated Actuals2016-17Budget
PercentDifference
E. NET INCREASE (DECREASE) IN FUND
BALANCE (C + D4) (35,565,347.75) (2,647,874.08) -92.6%
F. FUND BALANCE, RESERVES
1) Beginning Fund Balance
a) As of July 1 - Unaudited 9791 105,192,658.23 69,627,310.48 -33.8%
b) Audit Adjustments 9793 0.00 0.00 0.0%
c) As of July 1 - Audited (F1a + F1b) 105,192,658.23 69,627,310.48 -33.8%
d) Other Restatements 9795 0.00 0.00 0.0%
e) Adjusted Beginning Balance (F1c + F1d) 105,192,658.23 69,627,310.48 -33.8%
2) Ending Balance, June 30 (E + F1e) 69,627,310.48 66,979,436.40 -3.8%
Components of Ending Fund Balance
a) Nonspendable
Revolving Cash 9711 0.00 0.00 0.0%
Stores 9712 0.00 0.00 0.0%
Prepaid Expenditures 9713 0.00 0.00 0.0%
All Others 9719 0.00 0.00 0.0%
b) Restricted 9740 69,627,310.48 66,979,436.40 -3.8%
c) Committed
Stabilization Arrangements 9750 0.00 0.00 0.0%
Other Commitments 9760 0.00 0.00 0.0%
d) Assigned
Other Assignments 9780 0.00 0.00 0.0%
e) Unassigned/Unappropriated
Reserve for Economic Uncertainties 9789 0.00 0.00 0.0%
Unassigned/Unappropriated Amount 9790 0.00 0.00 0.0%

San Francisco UnifiedSan Francisco County
July 1 BudgetBuilding Fund
Expenditures by Object38 68478 0000000
Form 21
California Dept of EducationSACS Financial Reporting Software - 2016.1.0File: fund-d (Rev 02/02/2016) Page 3 Printed: 6/23/2016 4:53 PM
Description Resource Codes Object Codes2015-16
Estimated Actuals2016-17Budget
PercentDifference
G. ASSETS
1) Cash
a) in County Treasury 9110 0.00
1) Fair Value Adjustment to Cash in County Treasury 9111 0.00
b) in Banks 9120 0.00
c) in Revolving Fund 9130 0.00
d) with Fiscal Agent 9135 0.00
e) collections awaiting deposit 9140 0.00
2) Investments 9150 0.00
3) Accounts Receivable 9200 0.00
4) Due from Grantor Government 9290 0.00
5) Due from Other Funds 9310 0.00
6) Stores 9320 0.00
7) Prepaid Expenditures 9330 0.00
8) Other Current Assets 9340 0.00
9) TOTAL, ASSETS 0.00
H. DEFERRED OUTFLOWS OF RESOURCES
1) Deferred Outflows of Resources 9490 0.00
2) TOTAL, DEFERRED OUTFLOWS 0.00
I. LIABILITIES
1) Accounts Payable 9500 0.00
2) Due to Grantor Governments 9590 0.00
3) Due to Other Funds 9610 0.00
4) Current Loans 9640 0.00
5) Unearned Revenue 9650 0.00
6) TOTAL, LIABILITIES 0.00
J. DEFERRED INFLOWS OF RESOURCES
1) Deferred Inflows of Resources 9690 0.00
2) TOTAL, DEFERRED INFLOWS 0.00
K. FUND EQUITY
Ending Fund Balance, June 30
(G9 + H2) - (I6 + J2) 0.00

San Francisco UnifiedSan Francisco County
July 1 BudgetBuilding Fund
Expenditures by Object38 68478 0000000
Form 21
California Dept of EducationSACS Financial Reporting Software - 2016.1.0File: fund-d (Rev 02/02/2016) Page 4 Printed: 6/23/2016 4:53 PM
Description Resource Codes Object Codes2015-16
Estimated Actuals2016-17Budget
PercentDifference
FEDERAL REVENUE
FEMA 8281 0.00 0.00 0.0%
All Other Federal Revenue 8290 0.00 0.00 0.0%
TOTAL, FEDERAL REVENUE 0.00 0.00 0.0%
OTHER STATE REVENUE
Tax Relief Subventions
Restricted Levies - Other
Homeowners' Exemptions 8575 0.00 0.00 0.0%
Other Subventions/In-Lieu
Taxes 8576 0.00 0.00 0.0%
All Other State Revenue 8590 0.00 0.00 0.0%
TOTAL, OTHER STATE REVENUE 0.00 0.00 0.0%
OTHER LOCAL REVENUE
Other Local Revenue
County and District Taxes
Other Restricted Levies
Secured Roll 8615 0.00 0.00 0.0%
Unsecured Roll 8616 0.00 0.00 0.0%
Prior Years' Taxes 8617 0.00 0.00 0.0%
Supplemental Taxes 8618 0.00 0.00 0.0%
Non-Ad Valorem Taxes
Parcel Taxes 8621 7,250,000.00 8,500,000.00 17.2%
Other 8622 0.00 0.00 0.0%
Community Redevelopment Funds
Not Subject to LCFF Deduction 8625 0.00 0.00 0.0%
Penalties and Interest from
Delinquent Non-LCFF
Taxes 8629 0.00 0.00 0.0%
Sales
Sale of Equipment/Supplies 8631 0.00 0.00 0.0%
Leases and Rentals 8650 0.00 0.00 0.0%
Interest 8660 1,462,637.82 2,321,389.00 58.7%
Net Increase (Decrease) in the Fair Value of Investments 8662 0.00 0.00 0.0%
Other Local Revenue
All Other Local Revenue 8699 0.00 0.00 0.0%
All Other Transfers In from All Others 8799 0.00 0.00 0.0%
TOTAL, OTHER LOCAL REVENUE 8,712,637.82 10,821,389.00 24.2%
TOTAL, REVENUES 8,712,637.82 10,821,389.00 24.2%

San Francisco UnifiedSan Francisco County
July 1 BudgetBuilding Fund
Expenditures by Object38 68478 0000000
Form 21
California Dept of EducationSACS Financial Reporting Software - 2016.1.0File: fund-d (Rev 02/02/2016) Page 5 Printed: 6/23/2016 4:53 PM
Description Resource Codes Object Codes2015-16
Estimated Actuals2016-17Budget
PercentDifference
CLASSIFIED SALARIES
Classified Support Salaries 2200 1,503,904.81 1,578,658.70 5.0%
Classified Supervisors' and Administrators' Salaries 2300 858,128.48 692,965.11 -19.2%
Clerical, Technical and Office Salaries 2400 225,919.41 292,950.81 29.7%
Other Classified Salaries 2900 2,028,875.21 1,811,427.21 -10.7%
TOTAL, CLASSIFIED SALARIES 4,616,827.91 4,376,001.83 -5.2%
EMPLOYEE BENEFITS
STRS 3101-3102 0.00 0.00 0.0%
PERS 3201-3202 0.00 0.00 0.0%
OASDI/Medicare/Alternative 3301-3302 1,253,383.37 696,354.49 -44.4%
Health and Welfare Benefits 3401-3402 417,743.55 389,426.80 -6.8%
Unemployment Insurance 3501-3502 2,337.73 4,602.24 96.9%
Workers' Compensation 3601-3602 149,974.42 295,605.49 97.1%
OPEB, Allocated 3701-3702 392,379.13 773,530.52 97.1%
OPEB, Active Employees 3751-3752 0.00 0.00 0.0%
Other Employee Benefits 3901-3902 0.00 0.00 0.0%
TOTAL, EMPLOYEE BENEFITS 2,215,818.20 2,159,519.54 -2.5%
BOOKS AND SUPPLIES
Books and Other Reference Materials 4200 0.00 0.00 0.0%
Materials and Supplies 4300 54,000.00 54,500.00 0.9%
Noncapitalized Equipment 4400 184,904.96 35,750.00 -80.7%
TOTAL, BOOKS AND SUPPLIES 238,904.96 90,250.00 -62.2%
SERVICES AND OTHER OPERATING EXPENDITURES
Subagreements for Services 5100 0.00 0.00 0.0%
Travel and Conferences 5200 22,000.00 22,000.00 0.0%
Insurance 5400-5450 0.00 0.00 0.0%
Operations and Housekeeping Services 5500 0.00 0.00 0.0%
Rentals, Leases, Repairs, and Noncapitalized Improvements 5600 1,341,500.00 1,511,500.00 12.7%
Transfers of Direct Costs 5710 0.00 0.00 0.0%
Transfers of Direct Costs - Interfund 5750 0.00 0.00 0.0%

San Francisco UnifiedSan Francisco County
July 1 BudgetBuilding Fund
Expenditures by Object38 68478 0000000
Form 21
California Dept of EducationSACS Financial Reporting Software - 2016.1.0File: fund-d (Rev 02/02/2016) Page 6 Printed: 6/23/2016 4:53 PM
Description Resource Codes Object Codes2015-16
Estimated Actuals2016-17Budget
PercentDifference
Professional/Consulting Services and
Operating Expenditures 5800 1,491,814.22 889,036.00 -40.4%
Communications 5900 21,193.80 23,214.71 9.5%
TOTAL, SERVICES AND OTHER OPERATING EXPENDITURES 2,876,508.02 2,445,750.71 -15.0%
CAPITAL OUTLAY
Land 6100 637,677.44 5,000.00 -99.2%
Land Improvements 6170 0.00 0.00 0.0%
Buildings and Improvements of Buildings 6200 259,692,249.04 4,392,741.00 -98.3%
Books and Media for New School Libraries
or Major Expansion of School Libraries 6300 0.00 0.00 0.0%
Equipment 6400 0.00 0.00 0.0%
Equipment Replacement 6500 0.00 0.00 0.0%
TOTAL, CAPITAL OUTLAY 260,329,926.48 4,397,741.00 -98.3%
OTHER OUTGO (excluding Transfers of Indirect Costs)
Other Transfers Out
All Other Transfers Out to All Others 7299 0.00 0.00 0.0%
Debt Service
Repayment of State School Building Fund
Aid - Proceeds from Bonds 7435 0.00 0.00 0.0%
Debt Service - Interest 7438 0.00 0.00 0.0%
Other Debt Service - Principal 7439 0.00 0.00 0.0%
TOTAL, OTHER OUTGO (excluding Transfers of Indirect Costs) 0.00 0.00 0.0%
TOTAL, EXPENDITURES 270,277,985.57 13,469,263.08 -95.0%

San Francisco UnifiedSan Francisco County
July 1 BudgetBuilding Fund
Expenditures by Object38 68478 0000000
Form 21
California Dept of EducationSACS Financial Reporting Software - 2016.1.0File: fund-d (Rev 02/02/2016) Page 7 Printed: 6/23/2016 4:53 PM
Description Resource Codes Object Codes2015-16
Estimated Actuals2016-17Budget
PercentDifference
INTERFUND TRANSFERS
INTERFUND TRANSFERS IN
Other Authorized Interfund Transfers In 8919 0.00 0.00 0.0%
(a) TOTAL, INTERFUND TRANSFERS IN 0.00 0.00 0.0%
INTERFUND TRANSFERS OUT
To: State School Building Fund/
County School Facilities Fund 7613 0.00 0.00 0.0%
Other Authorized Interfund Transfers Out 7619 0.00 0.00 0.0%
(b) TOTAL, INTERFUND TRANSFERS OUT 0.00 0.00 0.0%

San Francisco UnifiedSan Francisco County
July 1 BudgetBuilding Fund
Expenditures by Object38 68478 0000000
Form 21
California Dept of EducationSACS Financial Reporting Software - 2016.1.0File: fund-d (Rev 02/02/2016) Page 8 Printed: 6/23/2016 4:53 PM
Description Resource Codes Object Codes2015-16
Estimated Actuals2016-17Budget
PercentDifference
OTHER SOURCES/USES
SOURCES
Proceeds
Proceeds from Sale of Bonds 8951 226,000,000.00 0.00 -100.0%
Proceeds from Sale/Lease-
Purchase of Land/Buildings 8953 0.00 0.00 0.0%
Other Sources
County School Bldg Aid 8961 0.00 0.00 0.0%
Transfers from Funds of
Lapsed/Reorganized LEAs 8965 0.00 0.00 0.0%
Long-Term Debt Proceeds
Proceeds from Certificates
of Participation 8971 0.00 0.00 0.0%
Proceeds from Capital Leases 8972 0.00 0.00 0.0%
Proceeds from Lease Revenue Bonds 8973 0.00 0.00 0.0%
All Other Financing Sources 8979 0.00 0.00 0.0%
(c) TOTAL, SOURCES 226,000,000.00 0.00 -100.0%
USES
Transfers of Funds from
Lapsed/Reorganized LEAs 7651 0.00 0.00 0.0%
All Other Financing Uses 7699 0.00 0.00 0.0%
(d) TOTAL, USES 0.00 0.00 0.0%
CONTRIBUTIONS
Contributions from Unrestricted Revenues 8980 0.00 0.00 0.0%
Contributions from Restricted Revenues 8990 0.00 0.00 0.0%
(e) TOTAL, CONTRIBUTIONS 0.00 0.00 0.0%
TOTAL, OTHER FINANCING SOURCES/USES
(a - b + c - d + e) 226,000,000.00 0.00 -100.0%

San Francisco UnifiedSan Francisco County
July 1 BudgetBuilding Fund
Expenditures by Function38 68478 0000000
Form 21
California Dept of EducationSACS Financial Reporting Software - 2016.1.0File: fund-d (Rev 02/02/2016) Page 1 Printed: 6/23/2016 4:53 PM
Description Function Codes Object Codes2015-16
Estimated Actuals2016-17Budget
PercentDifference
A. REVENUES
1) LCFF Sources 8010-8099 0.00 0.00 0.0%
2) Federal Revenue 8100-8299 0.00 0.00 0.0%
3) Other State Revenue 8300-8599 0.00 0.00 0.0%
4) Other Local Revenue 8600-8799 8,712,637.82 10,821,389.00 24.2%
5) TOTAL, REVENUES 8,712,637.82 10,821,389.00 24.2%
B. EXPENDITURES (Objects 1000-7999)
1) Instruction 1000-1999 0.00 0.00 0.0%
2) Instruction - Related Services 2000-2999 0.00 0.00 0.0%
3) Pupil Services 3000-3999 0.00 0.00 0.0%
4) Ancillary Services 4000-4999 0.00 0.00 0.0%
5) Community Services 5000-5999 0.00 0.00 0.0%
6) Enterprise 6000-6999 0.00 0.00 0.0%
7) General Administration 7000-7999 0.00 0.00 0.0%
8) Plant Services 8000-8999 270,277,985.57 13,469,263.08 -95.0%
9) Other Outgo 9000-9999Except
7600-7699 0.00 0.00 0.0%
10) TOTAL, EXPENDITURES 270,277,985.57 13,469,263.08 -95.0%
C. EXCESS (DEFICIENCY) OF REVENUES
OVER EXPENDITURES BEFORE OTHER
FINANCING SOURCES AND USES (A5 - B10) (261,565,347.75) (2,647,874.08) -99.0%
D. OTHER FINANCING SOURCES/USES
1) Interfund Transfers
a) Transfers In 8900-8929 0.00 0.00 0.0%
b) Transfers Out 7600-7629 0.00 0.00 0.0%
2) Other Sources/Uses
a) Sources 8930-8979 226,000,000.00 0.00 -100.0%
b) Uses 7630-7699 0.00 0.00 0.0%
3) Contributions 8980-8999 0.00 0.00 0.0%
4) TOTAL, OTHER FINANCING SOURCES/USES 226,000,000.00 0.00 -100.0%

San Francisco UnifiedSan Francisco County
July 1 BudgetBuilding Fund
Expenditures by Function38 68478 0000000
Form 21
California Dept of EducationSACS Financial Reporting Software - 2016.1.0File: fund-d (Rev 02/02/2016) Page 2 Printed: 6/23/2016 4:53 PM
Description Function Codes Object Codes2015-16
Estimated Actuals2016-17Budget
PercentDifference
E. NET INCREASE (DECREASE) IN FUND
BALANCE (C + D4) (35,565,347.75) (2,647,874.08) -92.6%
F. FUND BALANCE, RESERVES
1) Beginning Fund Balance
a) As of July 1 - Unaudited 9791 105,192,658.23 69,627,310.48 -33.8%
b) Audit Adjustments 9793 0.00 0.00 0.0%
c) As of July 1 - Audited (F1a + F1b) 105,192,658.23 69,627,310.48 -33.8%
d) Other Restatements 9795 0.00 0.00 0.0%
e) Adjusted Beginning Balance (F1c + F1d) 105,192,658.23 69,627,310.48 -33.8%
2) Ending Balance, June 30 (E + F1e) 69,627,310.48 66,979,436.40 -3.8%
Components of Ending Fund Balance
a) Nonspendable
Revolving Cash 9711 0.00 0.00 0.0%
Stores 9712 0.00 0.00 0.0%
Prepaid Expenditures 9713 0.00 0.00 0.0%
All Others 9719 0.00 0.00 0.0%
b) Restricted 9740 69,627,310.48 66,979,436.40 -3.8%
c) Committed
Stabilization Arrangements 9750 0.00 0.00 0.0%
Other Commitments (by Resource/Object) 9760 0.00 0.00 0.0%
d) Assigned
Other Assignments (by Resource/Object) 9780 0.00 0.00 0.0%
e) Unassigned/Unappropriated
Reserve for Economic Uncertainties 9789 0.00 0.00 0.0%
Unassigned/Unappropriated Amount 9790 0.00 0.00 0.0%

San Francisco UnifiedSan Francisco County
July 1 BudgetBuilding Fund
Exhibit: Restricted Balance Detail38 68478 0000000
Form 21
California Dept of EducationSACS Financial Reporting Software - 2016.1.0File: fund-d (Rev 04/06/2011) Page 1 Printed: 6/23/2016 4:53 PM
2015-16 2016-17
Resource Description Estimated Actuals Budget
9010 Other Restricted Local 69,627,310.48 66,979,436.40
Total, Restricted Balance 69,627,310.48 66,979,436.40

This Page Is Intentionally Left Blank

Section Break
Insert Tab Here


San Francisco UnifiedSan Francisco County
July 1 BudgetCapital Facilities FundExpenditures by Object
38 68478 0000000Form 25
California Dept of EducationSACS Financial Reporting Software - 2016.1.0File: fund-d (Rev 02/02/2016) Page 1 Printed: 6/23/2016 4:55 PM
Description Resource Codes Object Codes2015-16
Estimated Actuals2016-17Budget
PercentDifference
A. REVENUES
1) LCFF Sources 8010-8099 0.00 0.00 0.0%
2) Federal Revenue 8100-8299 0.00 0.00 0.0%
3) Other State Revenue 8300-8599 0.00 0.00 0.0%
4) Other Local Revenue 8600-8799 7,916,948.00 7,716,585.00 -2.5%
5) TOTAL, REVENUES 7,916,948.00 7,716,585.00 -2.5%
B. EXPENDITURES
1) Certificated Salaries 1000-1999 0.00 0.00 0.0%
2) Classified Salaries 2000-2999 0.00 0.00 0.0%
3) Employee Benefits 3000-3999 0.00 0.00 0.0%
4) Books and Supplies 4000-4999 0.00 0.00 0.0%
5) Services and Other Operating Expenditures 5000-5999 167,242.22 0.00 -100.0%
6) Capital Outlay 6000-6999 34,881,017.96 7,716,585.00 -77.9%
7) Other Outgo (excluding Transfers of Indirect 7100-7299,
Costs) 7400-7499 0.00 0.00 0.0%
8) Other Outgo - Transfers of Indirect Costs 7300-7399 0.00 0.00 0.0%
9) TOTAL, EXPENDITURES 35,048,260.18 7,716,585.00 -78.0%
C. EXCESS (DEFICIENCY) OF REVENUES
OVER EXPENDITURES BEFORE OTHER
FINANCING SOURCES AND USES (A5 - B9) (27,131,312.18) 0.00 -100.0%
D. OTHER FINANCING SOURCES/USES
1) Interfund Transfers
a) Transfers In 8900-8929 0.00 0.00 0.0%
b) Transfers Out 7600-7629 0.00 0.00 0.0%
2) Other Sources/Uses
a) Sources 8930-8979 0.00 0.00 0.0%
b) Uses 7630-7699 0.00 0.00 0.0%
3) Contributions 8980-8999 0.00 0.00 0.0%
4) TOTAL, OTHER FINANCING SOURCES/USES 0.00 0.00 0.0%

San Francisco UnifiedSan Francisco County
July 1 BudgetCapital Facilities FundExpenditures by Object
38 68478 0000000Form 25
California Dept of EducationSACS Financial Reporting Software - 2016.1.0File: fund-d (Rev 02/02/2016) Page 2 Printed: 6/23/2016 4:55 PM
Description Resource Codes Object Codes2015-16
Estimated Actuals2016-17Budget
PercentDifference
E. NET INCREASE (DECREASE) IN FUND
BALANCE (C + D4) (27,131,312.18) 0.00 -100.0%
F. FUND BALANCE, RESERVES
1) Beginning Fund Balance
a) As of July 1 - Unaudited 9791 35,912,703.54 8,781,391.36 -75.5%
b) Audit Adjustments 9793 0.00 0.00 0.0%
c) As of July 1 - Audited (F1a + F1b) 35,912,703.54 8,781,391.36 -75.5%
d) Other Restatements 9795 0.00 0.00 0.0%
e) Adjusted Beginning Balance (F1c + F1d) 35,912,703.54 8,781,391.36 -75.5%
2) Ending Balance, June 30 (E + F1e) 8,781,391.36 8,781,391.36 0.0%
Components of Ending Fund Balance
a) Nonspendable
Revolving Cash 9711 0.00 0.00 0.0%
Stores 9712 0.00 0.00 0.0%
Prepaid Expenditures 9713 0.00 0.00 0.0%
All Others 9719 0.00 0.00 0.0%
b) Restricted 9740 8,781,391.36 8,781,391.36 0.0%
c) Committed
Stabilization Arrangements 9750 0.00 0.00 0.0%
Other Commitments 9760 0.00 0.00 0.0%
d) Assigned
Other Assignments 9780 0.00 0.00 0.0%
e) Unassigned/Unappropriated
Reserve for Economic Uncertainties 9789 0.00 0.00 0.0%
Unassigned/Unappropriated Amount 9790 0.00 0.00 0.0%

San Francisco UnifiedSan Francisco County
July 1 BudgetCapital Facilities FundExpenditures by Object
38 68478 0000000Form 25
California Dept of EducationSACS Financial Reporting Software - 2016.1.0File: fund-d (Rev 02/02/2016) Page 3 Printed: 6/23/2016 4:55 PM
Description Resource Codes Object Codes2015-16
Estimated Actuals2016-17Budget
PercentDifference
G. ASSETS
1) Cash
a) in County Treasury 9110 0.00
1) Fair Value Adjustment to Cash in County Treasury 9111 0.00
b) in Banks 9120 0.00
c) in Revolving Fund 9130 0.00
d) with Fiscal Agent 9135 0.00
e) collections awaiting deposit 9140 0.00
2) Investments 9150 0.00
3) Accounts Receivable 9200 0.00
4) Due from Grantor Government 9290 0.00
5) Due from Other Funds 9310 0.00
6) Stores 9320 0.00
7) Prepaid Expenditures 9330 0.00
8) Other Current Assets 9340 0.00
9) TOTAL, ASSETS 0.00
H. DEFERRED OUTFLOWS OF RESOURCES
1) Deferred Outflows of Resources 9490 0.00
2) TOTAL, DEFERRED OUTFLOWS 0.00
I. LIABILITIES
1) Accounts Payable 9500 0.00
2) Due to Grantor Governments 9590 0.00
3) Due to Other Funds 9610 0.00
4) Current Loans 9640 0.00
5) Unearned Revenue 9650 0.00
6) TOTAL, LIABILITIES 0.00
J. DEFERRED INFLOWS OF RESOURCES
1) Deferred Inflows of Resources 9690 0.00
2) TOTAL, DEFERRED INFLOWS 0.00
K. FUND EQUITY
Ending Fund Balance, June 30
(G9 + H2) - (I6 + J2) 0.00

San Francisco UnifiedSan Francisco County
July 1 BudgetCapital Facilities FundExpenditures by Object
38 68478 0000000Form 25
California Dept of EducationSACS Financial Reporting Software - 2016.1.0File: fund-d (Rev 02/02/2016) Page 4 Printed: 6/23/2016 4:55 PM
Description Resource Codes Object Codes2015-16
Estimated Actuals2016-17Budget
PercentDifference
OTHER STATE REVENUE
Tax Relief Subventions
Restricted Levies - Other
Homeowners' Exemptions 8575 0.00 0.00 0.0%
Other Subventions/In-Lieu
Taxes 8576 0.00 0.00 0.0%
All Other State Revenue 8590 0.00 0.00 0.0%
TOTAL, OTHER STATE REVENUE 0.00 0.00 0.0%
OTHER LOCAL REVENUE
Other Local Revenue
County and District Taxes
Other Restricted Levies
Secured Roll 8615 0.00 0.00 0.0%
Unsecured Roll 8616 0.00 0.00 0.0%
Prior Years' Taxes 8617 0.00 0.00 0.0%
Supplemental Taxes 8618 0.00 0.00 0.0%
Non-Ad Valorem Taxes
Parcel Taxes 8621 0.00 0.00 0.0%
Other 8622 0.00 0.00 0.0%
Community Redevelopment Funds
Not Subject to LCFF Deduction 8625 0.00 0.00 0.0%
Penalties and Interest from
Delinquent Non-LCFF
Taxes 8629 0.00 0.00 0.0%
Sales
Sale of Equipment/Supplies 8631 0.00 0.00 0.0%
Interest 8660 216,948.00 216,585.00 -0.2%
Net Increase (Decrease) in the Fair Value of Investments 8662 0.00 0.00 0.0%
Fees and Contracts
Mitigation/Developer Fees 8681 7,700,000.00 7,500,000.00 -2.6%
Other Local Revenue
All Other Local Revenue 8699 0.00 0.00 0.0%
All Other Transfers In from All Others 8799 0.00 0.00 0.0%
TOTAL, OTHER LOCAL REVENUE 7,916,948.00 7,716,585.00 -2.5%
TOTAL, REVENUES 7,916,948.00 7,716,585.00 -2.5%

San Francisco UnifiedSan Francisco County
July 1 BudgetCapital Facilities FundExpenditures by Object
38 68478 0000000Form 25
California Dept of EducationSACS Financial Reporting Software - 2016.1.0File: fund-d (Rev 02/02/2016) Page 5 Printed: 6/23/2016 4:55 PM
Description Resource Codes Object Codes2015-16
Estimated Actuals2016-17Budget
PercentDifference
CERTIFICATED SALARIES
Other Certificated Salaries 1900 0.00 0.00 0.0%
TOTAL, CERTIFICATED SALARIES 0.00 0.00 0.0%
CLASSIFIED SALARIES
Classified Support Salaries 2200 0.00 0.00 0.0%
Classified Supervisors' and Administrators' Salaries 2300 0.00 0.00 0.0%
Clerical, Technical and Office Salaries 2400 0.00 0.00 0.0%
Other Classified Salaries 2900 0.00 0.00 0.0%
TOTAL, CLASSIFIED SALARIES 0.00 0.00 0.0%
EMPLOYEE BENEFITS
STRS 3101-3102 0.00 0.00 0.0%
PERS 3201-3202 0.00 0.00 0.0%
OASDI/Medicare/Alternative 3301-3302 0.00 0.00 0.0%
Health and Welfare Benefits 3401-3402 0.00 0.00 0.0%
Unemployment Insurance 3501-3502 0.00 0.00 0.0%
Workers' Compensation 3601-3602 0.00 0.00 0.0%
OPEB, Allocated 3701-3702 0.00 0.00 0.0%
OPEB, Active Employees 3751-3752 0.00 0.00 0.0%
Other Employee Benefits 3901-3902 0.00 0.00 0.0%
TOTAL, EMPLOYEE BENEFITS 0.00 0.00 0.0%
BOOKS AND SUPPLIES
Approved Textbooks and Core Curricula Materials 4100 0.00 0.00 0.0%
Books and Other Reference Materials 4200 0.00 0.00 0.0%
Materials and Supplies 4300 0.00 0.00 0.0%
Noncapitalized Equipment 4400 0.00 0.00 0.0%
TOTAL, BOOKS AND SUPPLIES 0.00 0.00 0.0%

San Francisco UnifiedSan Francisco County
July 1 BudgetCapital Facilities FundExpenditures by Object
38 68478 0000000Form 25
California Dept of EducationSACS Financial Reporting Software - 2016.1.0File: fund-d (Rev 02/02/2016) Page 6 Printed: 6/23/2016 4:55 PM
Description Resource Codes Object Codes2015-16
Estimated Actuals2016-17Budget
PercentDifference
SERVICES AND OTHER OPERATING EXPENDITURES
Subagreements for Services 5100 0.00 0.00 0.0%
Travel and Conferences 5200 0.00 0.00 0.0%
Insurance 5400-5450 0.00 0.00 0.0%
Operations and Housekeeping Services 5500 0.00 0.00 0.0%
Rentals, Leases, Repairs, and Noncapitalized Improvements 5600 0.00 0.00 0.0%
Transfers of Direct Costs 5710 0.00 0.00 0.0%
Transfers of Direct Costs - Interfund 5750 0.00 0.00 0.0%
Professional/Consulting Services and
Operating Expenditures 5800 167,242.22 0.00 -100.0%
Communications 5900 0.00 0.00 0.0%
TOTAL, SERVICES AND OTHER OPERATING EXPENDITURES 167,242.22 0.00 -100.0%
CAPITAL OUTLAY
Land 6100 91,470.76 0.00 -100.0%
Land Improvements 6170 0.00 0.00 0.0%
Buildings and Improvements of Buildings 6200 34,789,547.20 7,716,585.00 -77.8%
Books and Media for New School Libraries
or Major Expansion of School Libraries 6300 0.00 0.00 0.0%
Equipment 6400 0.00 0.00 0.0%
Equipment Replacement 6500 0.00 0.00 0.0%
TOTAL, CAPITAL OUTLAY 34,881,017.96 7,716,585.00 -77.9%
OTHER OUTGO (excluding Transfers of Indirect Costs)
Other Transfers Out
All Other Transfers Out to All Others 7299 0.00 0.00 0.0%
Debt Service
Debt Service - Interest 7438 0.00 0.00 0.0%
Other Debt Service - Principal 7439 0.00 0.00 0.0%
TOTAL, OTHER OUTGO (excluding Transfers of Indirect Costs) 0.00 0.00 0.0%
TOTAL, EXPENDITURES 35,048,260.18 7,716,585.00 -78.0%

San Francisco UnifiedSan Francisco County
July 1 BudgetCapital Facilities FundExpenditures by Object
38 68478 0000000Form 25
California Dept of EducationSACS Financial Reporting Software - 2016.1.0File: fund-d (Rev 02/02/2016) Page 7 Printed: 6/23/2016 4:55 PM
Description Resource Codes Object Codes2015-16
Estimated Actuals2016-17Budget
PercentDifference
INTERFUND TRANSFERS
INTERFUND TRANSFERS IN
Other Authorized Interfund Transfers In 8919 0.00 0.00 0.0%
(a) TOTAL, INTERFUND TRANSFERS IN 0.00 0.00 0.0%
INTERFUND TRANSFERS OUT
To: State School Building Fund/
County School Facilities Fund 7613 0.00 0.00 0.0%
Other Authorized Interfund Transfers Out 7619 0.00 0.00 0.0%
(b) TOTAL, INTERFUND TRANSFERS OUT 0.00 0.00 0.0%
OTHER SOURCES/USES
SOURCES
Proceeds
Proceeds from Sale/Lease-
Purchase of Land/Buildings 8953 0.00 0.00 0.0%
Other Sources
Transfers from Funds of
Lapsed/Reorganized LEAs 8965 0.00 0.00 0.0%
Long-Term Debt Proceeds
Proceeds from Certificates
of Participation 8971 0.00 0.00 0.0%
Proceeds from Capital Leases 8972 0.00 0.00 0.0%
Proceeds from Lease Revenue Bonds 8973 0.00 0.00 0.0%
All Other Financing Sources 8979 0.00 0.00 0.0%
(c) TOTAL, SOURCES 0.00 0.00 0.0%
USES
Transfers of Funds from
Lapsed/Reorganized LEAs 7651 0.00 0.00 0.0%
All Other Financing Uses 7699 0.00 0.00 0.0%
(d) TOTAL, USES 0.00 0.00 0.0%
CONTRIBUTIONS
Contributions from Unrestricted Revenues 8980 0.00 0.00 0.0%
Contributions from Restricted Revenues 8990 0.00 0.00 0.0%
(e) TOTAL, CONTRIBUTIONS 0.00 0.00 0.0%
TOTAL, OTHER FINANCING SOURCES/USES
(a - b + c - d + e) 0.00 0.00 0.0%

San Francisco UnifiedSan Francisco County
July 1 BudgetCapital Facilities Fund
Expenditures by Function38 68478 0000000
Form 25
California Dept of EducationSACS Financial Reporting Software - 2016.1.0File: fund-d (Rev 02/02/2016) Page 1 Printed: 6/23/2016 4:55 PM
Description Function Codes Object Codes2015-16
Estimated Actuals2016-17Budget
PercentDifference
A. REVENUES
1) LCFF Sources 8010-8099 0.00 0.00 0.0%
2) Federal Revenue 8100-8299 0.00 0.00 0.0%
3) Other State Revenue 8300-8599 0.00 0.00 0.0%
4) Other Local Revenue 8600-8799 7,916,948.00 7,716,585.00 -2.5%
5) TOTAL, REVENUES 7,916,948.00 7,716,585.00 -2.5%
B. EXPENDITURES (Objects 1000-7999)
1) Instruction 1000-1999 0.00 0.00 0.0%
2) Instruction - Related Services 2000-2999 0.00 0.00 0.0%
3) Pupil Services 3000-3999 0.00 0.00 0.0%
4) Ancillary Services 4000-4999 0.00 0.00 0.0%
5) Community Services 5000-5999 0.00 0.00 0.0%
6) Enterprise 6000-6999 0.00 0.00 0.0%
7) General Administration 7000-7999 0.00 0.00 0.0%
8) Plant Services 8000-8999 35,048,260.18 7,716,585.00 -78.0%
9) Other Outgo 9000-9999Except
7600-7699 0.00 0.00 0.0%
10) TOTAL, EXPENDITURES 35,048,260.18 7,716,585.00 -78.0%
C. EXCESS (DEFICIENCY) OF REVENUES
OVER EXPENDITURES BEFORE OTHER
FINANCING SOURCES AND USES (A5 - B10) (27,131,312.18) 0.00 -100.0%
D. OTHER FINANCING SOURCES/USES
1) Interfund Transfers
a) Transfers In 8900-8929 0.00 0.00 0.0%
b) Transfers Out 7600-7629 0.00 0.00 0.0%
2) Other Sources/Uses
a) Sources 8930-8979 0.00 0.00 0.0%
b) Uses 7630-7699 0.00 0.00 0.0%
3) Contributions 8980-8999 0.00 0.00 0.0%
4) TOTAL, OTHER FINANCING SOURCES/USES 0.00 0.00 0.0%
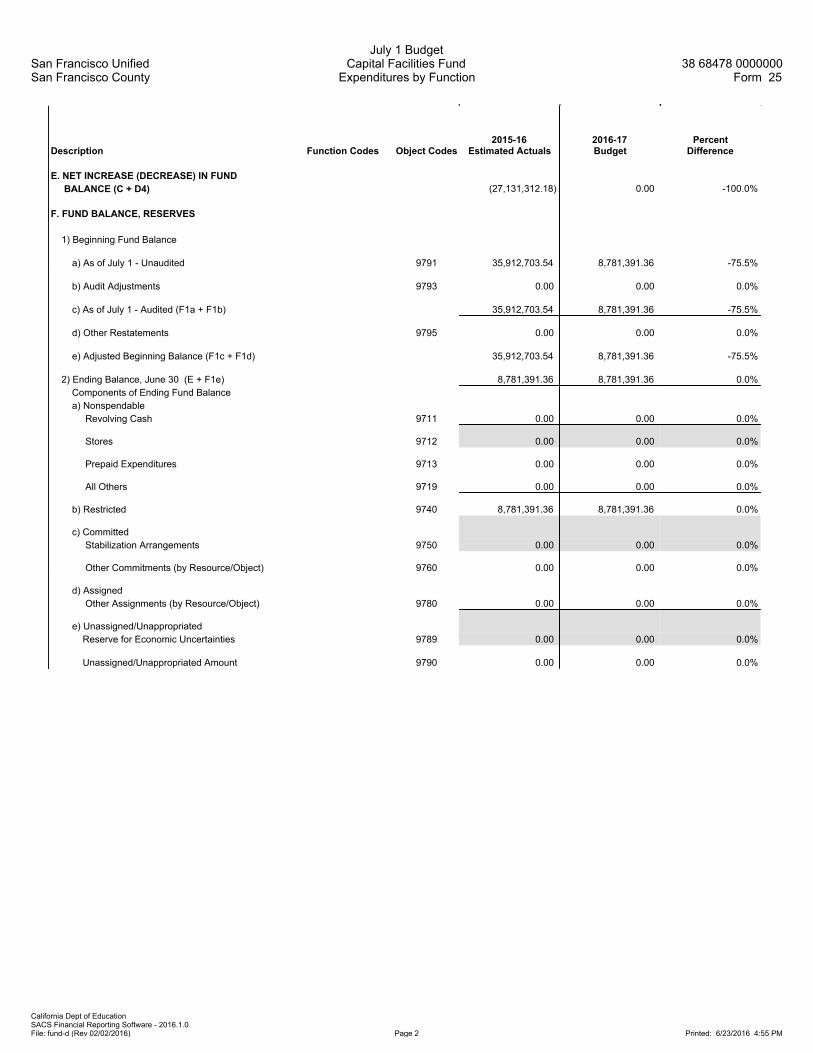
San Francisco UnifiedSan Francisco County
July 1 BudgetCapital Facilities Fund
Expenditures by Function38 68478 0000000
Form 25
California Dept of EducationSACS Financial Reporting Software - 2016.1.0File: fund-d (Rev 02/02/2016) Page 2 Printed: 6/23/2016 4:55 PM
Description Function Codes Object Codes2015-16
Estimated Actuals2016-17Budget
PercentDifference
E. NET INCREASE (DECREASE) IN FUND
BALANCE (C + D4) (27,131,312.18) 0.00 -100.0%
F. FUND BALANCE, RESERVES
1) Beginning Fund Balance
a) As of July 1 - Unaudited 9791 35,912,703.54 8,781,391.36 -75.5%
b) Audit Adjustments 9793 0.00 0.00 0.0%
c) As of July 1 - Audited (F1a + F1b) 35,912,703.54 8,781,391.36 -75.5%
d) Other Restatements 9795 0.00 0.00 0.0%
e) Adjusted Beginning Balance (F1c + F1d) 35,912,703.54 8,781,391.36 -75.5%
2) Ending Balance, June 30 (E + F1e) 8,781,391.36 8,781,391.36 0.0%
Components of Ending Fund Balance
a) Nonspendable
Revolving Cash 9711 0.00 0.00 0.0%
Stores 9712 0.00 0.00 0.0%
Prepaid Expenditures 9713 0.00 0.00 0.0%
All Others 9719 0.00 0.00 0.0%
b) Restricted 9740 8,781,391.36 8,781,391.36 0.0%
c) Committed
Stabilization Arrangements 9750 0.00 0.00 0.0%
Other Commitments (by Resource/Object) 9760 0.00 0.00 0.0%
d) Assigned
Other Assignments (by Resource/Object) 9780 0.00 0.00 0.0%
e) Unassigned/Unappropriated
Reserve for Economic Uncertainties 9789 0.00 0.00 0.0%
Unassigned/Unappropriated Amount 9790 0.00 0.00 0.0%

San Francisco UnifiedSan Francisco County
July 1 BudgetCapital Facilities Fund
Exhibit: Restricted Balance Detail38 68478 0000000
Form 25
California Dept of EducationSACS Financial Reporting Software - 2016.1.0File: fund-d (Rev 04/06/2011) Page 1 Printed: 6/23/2016 4:55 PM
2015-16 2016-17
Resource Description Estimated Actuals Budget
9010 Other Restricted Local 8,781,391.36 8,781,391.36
Total, Restricted Balance 8,781,391.36 8,781,391.36

Section Break
Insert Tab Here


San Francisco UnifiedSan Francisco County
July 1 BudgetSpecial Reserve Fund for Capital Outlay Projects
Expenditures by Object38 68478 0000000
Form 40
California Dept of EducationSACS Financial Reporting Software - 2016.1.0File: fund-d (Rev 02/02/2016) Page 1 Printed: 6/23/2016 4:56 PM
Description Resource Codes Object Codes2015-16
Estimated Actuals2016-17Budget
PercentDifference
A. REVENUES
1) LCFF Sources 8010-8099 0.00 0.00 0.0%
2) Federal Revenue 8100-8299 0.00 0.00 0.0%
3) Other State Revenue 8300-8599 0.00 0.00 0.0%
4) Other Local Revenue 8600-8799 0.00 500,000.00 New
5) TOTAL, REVENUES 0.00 500,000.00 New
B. EXPENDITURES
1) Certificated Salaries 1000-1999 0.00 0.00 0.0%
2) Classified Salaries 2000-2999 0.00 0.00 0.0%
3) Employee Benefits 3000-3999 0.00 0.00 0.0%
4) Books and Supplies 4000-4999 0.00 0.00 0.0%
5) Services and Other Operating Expenditures 5000-5999 65,278.36 0.00 -100.0%
6) Capital Outlay 6000-6999 4,148,804.41 500,000.00 -87.9%
7) Other Outgo (excluding Transfers of Indirect 7100-7299,
Costs) 7400-7499 2,567,788.00 2,644,822.00 3.0%
8) Other Outgo - Transfers of Indirect Costs 7300-7399 0.00 0.00 0.0%
9) TOTAL, EXPENDITURES 6,781,870.77 3,144,822.00 -53.6%
C. EXCESS (DEFICIENCY) OF REVENUES
OVER EXPENDITURES BEFORE OTHER
FINANCING SOURCES AND USES (A5 - B9) (6,781,870.77) (2,644,822.00) -61.0%
D. OTHER FINANCING SOURCES/USES
1) Interfund Transfers
a) Transfers In 8900-8929 2,567,788.00 2,644,822.00 3.0%
b) Transfers Out 7600-7629 0.00 0.00 0.0%
2) Other Sources/Uses
a) Sources 8930-8979 0.00 0.00 0.0%
b) Uses 7630-7699 0.00 0.00 0.0%
3) Contributions 8980-8999 0.00 0.00 0.0%
4) TOTAL, OTHER FINANCING SOURCES/USES 2,567,788.00 2,644,822.00 3.0%

San Francisco UnifiedSan Francisco County
July 1 BudgetSpecial Reserve Fund for Capital Outlay Projects
Expenditures by Object38 68478 0000000
Form 40
California Dept of EducationSACS Financial Reporting Software - 2016.1.0File: fund-d (Rev 02/02/2016) Page 2 Printed: 6/23/2016 4:56 PM
Description Resource Codes Object Codes2015-16
Estimated Actuals2016-17Budget
PercentDifference
E. NET INCREASE (DECREASE) IN FUND
BALANCE (C + D4) (4,214,082.77) 0.00 -100.0%
F. FUND BALANCE, RESERVES
1) Beginning Fund Balance
a) As of July 1 - Unaudited 9791 8,330,689.41 4,116,606.64 -50.6%
b) Audit Adjustments 9793 0.00 0.00 0.0%
c) As of July 1 - Audited (F1a + F1b) 8,330,689.41 4,116,606.64 -50.6%
d) Other Restatements 9795 0.00 0.00 0.0%
e) Adjusted Beginning Balance (F1c + F1d) 8,330,689.41 4,116,606.64 -50.6%
2) Ending Balance, June 30 (E + F1e) 4,116,606.64 4,116,606.64 0.0%
Components of Ending Fund Balance
a) Nonspendable
Revolving Cash 9711 0.00 0.00 0.0%
Stores 9712 0.00 0.00 0.0%
Prepaid Expenditures 9713 0.00 0.00 0.0%
All Others 9719 0.00 0.00 0.0%
b) Restricted 9740 4,116,606.64 4,116,606.64 0.0%
c) Committed
Stabilization Arrangements 9750 0.00 0.00 0.0%
Other Commitments 9760 0.00 0.00 0.0%
d) Assigned
Other Assignments 9780 0.00 0.00 0.0%
e) Unassigned/Unappropriated
Reserve for Economic Uncertainties 9789 0.00 0.00 0.0%
Unassigned/Unappropriated Amount 9790 0.00 0.00 0.0%

San Francisco UnifiedSan Francisco County
July 1 BudgetSpecial Reserve Fund for Capital Outlay Projects
Expenditures by Object38 68478 0000000
Form 40
California Dept of EducationSACS Financial Reporting Software - 2016.1.0File: fund-d (Rev 02/02/2016) Page 3 Printed: 6/23/2016 4:56 PM
Description Resource Codes Object Codes2015-16
Estimated Actuals2016-17Budget
PercentDifference
G. ASSETS
1) Cash
a) in County Treasury 9110 0.00
1) Fair Value Adjustment to Cash in County Treasury 9111 0.00
b) in Banks 9120 0.00
c) in Revolving Fund 9130 0.00
d) with Fiscal Agent 9135 0.00
e) collections awaiting deposit 9140 0.00
2) Investments 9150 0.00
3) Accounts Receivable 9200 0.00
4) Due from Grantor Government 9290 0.00
5) Due from Other Funds 9310 0.00
6) Stores 9320 0.00
7) Prepaid Expenditures 9330 0.00
8) Other Current Assets 9340 0.00
9) TOTAL, ASSETS 0.00
H. DEFERRED OUTFLOWS OF RESOURCES
1) Deferred Outflows of Resources 9490 0.00
2) TOTAL, DEFERRED OUTFLOWS 0.00
I. LIABILITIES
1) Accounts Payable 9500 0.00
2) Due to Grantor Governments 9590 0.00
3) Due to Other Funds 9610 0.00
4) Current Loans 9640 0.00
5) Unearned Revenue 9650 0.00
6) TOTAL, LIABILITIES 0.00
J. DEFERRED INFLOWS OF RESOURCES
1) Deferred Inflows of Resources 9690 0.00
2) TOTAL, DEFERRED INFLOWS 0.00
K. FUND EQUITY
Ending Fund Balance, June 30
(G9 + H2) - (I6 + J2) 0.00

San Francisco UnifiedSan Francisco County
July 1 BudgetSpecial Reserve Fund for Capital Outlay Projects
Expenditures by Object38 68478 0000000
Form 40
California Dept of EducationSACS Financial Reporting Software - 2016.1.0File: fund-d (Rev 02/02/2016) Page 4 Printed: 6/23/2016 4:56 PM
Description Resource Codes Object Codes2015-16
Estimated Actuals2016-17Budget
PercentDifference
FEDERAL REVENUE
FEMA 8281 0.00 0.00 0.0%
All Other Federal Revenue 8290 0.00 0.00 0.0%
TOTAL, FEDERAL REVENUE 0.00 0.00 0.0%
OTHER STATE REVENUE
Pass-Through Revenues from
State Sources 8587 0.00 0.00 0.0%
California Clean Energy Jobs Act 6230 8590 0.00 0.00 0.0%
All Other State Revenue All Other 8590 0.00 0.00 0.0%
TOTAL, OTHER STATE REVENUE 0.00 0.00 0.0%
OTHER LOCAL REVENUE
Other Local Revenue
Community Redevelopment Funds
Not Subject to LCFF Deduction 8625 0.00 500,000.00 New
Sales
Sale of Equipment/Supplies 8631 0.00 0.00 0.0%
Leases and Rentals 8650 0.00 0.00 0.0%
Interest 8660 0.00 0.00 0.0%
Net Increase (Decrease) in the Fair Value of Investments 8662 0.00 0.00 0.0%
Other Local Revenue
All Other Local Revenue 8699 0.00 0.00 0.0%
All Other Transfers In from All Others 8799 0.00 0.00 0.0%
TOTAL, OTHER LOCAL REVENUE 0.00 500,000.00 New
TOTAL, REVENUES 0.00 500,000.00 New

San Francisco UnifiedSan Francisco County
July 1 BudgetSpecial Reserve Fund for Capital Outlay Projects
Expenditures by Object38 68478 0000000
Form 40
California Dept of EducationSACS Financial Reporting Software - 2016.1.0File: fund-d (Rev 02/02/2016) Page 5 Printed: 6/23/2016 4:56 PM
Description Resource Codes Object Codes2015-16
Estimated Actuals2016-17Budget
PercentDifference
CLASSIFIED SALARIES
Classified Support Salaries 2200 0.00 0.00 0.0%
Classified Supervisors' and Administrators' Salaries 2300 0.00 0.00 0.0%
Clerical, Technical and Office Salaries 2400 0.00 0.00 0.0%
Other Classified Salaries 2900 0.00 0.00 0.0%
TOTAL, CLASSIFIED SALARIES 0.00 0.00 0.0%
EMPLOYEE BENEFITS
STRS 3101-3102 0.00 0.00 0.0%
PERS 3201-3202 0.00 0.00 0.0%
OASDI/Medicare/Alternative 3301-3302 0.00 0.00 0.0%
Health and Welfare Benefits 3401-3402 0.00 0.00 0.0%
Unemployment Insurance 3501-3502 0.00 0.00 0.0%
Workers' Compensation 3601-3602 0.00 0.00 0.0%
OPEB, Allocated 3701-3702 0.00 0.00 0.0%
OPEB, Active Employees 3751-3752 0.00 0.00 0.0%
Other Employee Benefits 3901-3902 0.00 0.00 0.0%
TOTAL, EMPLOYEE BENEFITS 0.00 0.00 0.0%
BOOKS AND SUPPLIES
Books and Other Reference Materials 4200 0.00 0.00 0.0%
Materials and Supplies 4300 0.00 0.00 0.0%
Noncapitalized Equipment 4400 0.00 0.00 0.0%
TOTAL, BOOKS AND SUPPLIES 0.00 0.00 0.0%

San Francisco UnifiedSan Francisco County
July 1 BudgetSpecial Reserve Fund for Capital Outlay Projects
Expenditures by Object38 68478 0000000
Form 40
California Dept of EducationSACS Financial Reporting Software - 2016.1.0File: fund-d (Rev 02/02/2016) Page 6 Printed: 6/23/2016 4:56 PM
Description Resource Codes Object Codes2015-16
Estimated Actuals2016-17Budget
PercentDifference
SERVICES AND OTHER OPERATING EXPENDITURES
Subagreements for Services 5100 0.00 0.00 0.0%
Travel and Conferences 5200 0.00 0.00 0.0%
Insurance 5400-5450 0.00 0.00 0.0%
Operations and Housekeeping Services 5500 0.00 0.00 0.0%
Rentals, Leases, Repairs, and Noncapitalized Improvements 5600 0.00 0.00 0.0%
Transfers of Direct Costs 5710 0.00 0.00 0.0%
Transfers of Direct Costs - Interfund 5750 0.00 0.00 0.0%
Professional/Consulting Services and
Operating Expenditures 5800 65,278.36 0.00 -100.0%
Communications 5900 0.00 0.00 0.0%
TOTAL, SERVICES AND OTHER OPERATING EXPENDITURES 65,278.36 0.00 -100.0%
CAPITAL OUTLAY
Land 6100 0.00 0.00 0.0%
Land Improvements 6170 0.00 0.00 0.0%
Buildings and Improvements of Buildings 6200 4,148,804.41 500,000.00 -87.9%
Books and Media for New School Libraries
or Major Expansion of School Libraries 6300 0.00 0.00 0.0%
Equipment 6400 0.00 0.00 0.0%
Equipment Replacement 6500 0.00 0.00 0.0%
TOTAL, CAPITAL OUTLAY 4,148,804.41 500,000.00 -87.9%
OTHER OUTGO (excluding Transfers of Indirect Costs)
Other Transfers Out
Transfers of Pass-Through Revenues
To Districts or Charter Schools 7211 0.00 0.00 0.0%
To County Offices 7212 0.00 0.00 0.0%
To JPAs 7213 0.00 0.00 0.0%
All Other Transfers Out to All Others 7299 0.00 0.00 0.0%
Debt Service
Debt Service - Interest 7438 0.00 0.00 0.0%
Other Debt Service - Principal 7439 2,567,788.00 2,644,822.00 3.0%
TOTAL, OTHER OUTGO (excluding Transfers of Indirect Costs) 2,567,788.00 2,644,822.00 3.0%
TOTAL, EXPENDITURES 6,781,870.77 3,144,822.00 -53.6%

San Francisco UnifiedSan Francisco County
July 1 BudgetSpecial Reserve Fund for Capital Outlay Projects
Expenditures by Object38 68478 0000000
Form 40
California Dept of EducationSACS Financial Reporting Software - 2016.1.0File: fund-d (Rev 02/02/2016) Page 7 Printed: 6/23/2016 4:56 PM
Description Resource Codes Object Codes2015-16
Estimated Actuals2016-17Budget
PercentDifference
INTERFUND TRANSFERS
INTERFUND TRANSFERS IN
From: General Fund/CSSF 8912 0.00 0.00 0.0%
Other Authorized Interfund Transfers In 8919 2,567,788.00 2,644,822.00 3.0%
(a) TOTAL, INTERFUND TRANSFERS IN 2,567,788.00 2,644,822.00 3.0%
INTERFUND TRANSFERS OUT
To: General Fund/CSSF 7612 0.00 0.00 0.0%
To: State School Building Fund/
County School Facilities Fund 7613 0.00 0.00 0.0%
Other Authorized Interfund Transfers Out 7619 0.00 0.00 0.0%
(b) TOTAL, INTERFUND TRANSFERS OUT 0.00 0.00 0.0%

San Francisco UnifiedSan Francisco County
July 1 BudgetSpecial Reserve Fund for Capital Outlay Projects
Expenditures by Object38 68478 0000000
Form 40
California Dept of EducationSACS Financial Reporting Software - 2016.1.0File: fund-d (Rev 02/02/2016) Page 8 Printed: 6/23/2016 4:56 PM
Description Resource Codes Object Codes2015-16
Estimated Actuals2016-17Budget
PercentDifference
OTHER SOURCES/USES
SOURCES
Proceeds
Proceeds from Sale/Lease-
Purchase of Land/Buildings 8953 0.00 0.00 0.0%
Other Sources
Transfers from Funds of
Lapsed/Reorganized LEAs 8965 0.00 0.00 0.0%
Long-Term Debt Proceeds
Proceeds from Certificates
of Participation 8971 0.00 0.00 0.0%
Proceeds from Capital Leases 8972 0.00 0.00 0.0%
Proceeds from Lease Revenue Bonds 8973 0.00 0.00 0.0%
All Other Financing Sources 8979 0.00 0.00 0.0%
(c) TOTAL, SOURCES 0.00 0.00 0.0%
USES
Transfers of Funds from
Lapsed/Reorganized LEAs 7651 0.00 0.00 0.0%
All Other Financing Uses 7699 0.00 0.00 0.0%
(d) TOTAL, USES 0.00 0.00 0.0%
CONTRIBUTIONS
Contributions from Unrestricted Revenues 8980 0.00 0.00 0.0%
Contributions from Restricted Revenues 8990 0.00 0.00 0.0%
(e) TOTAL, CONTRIBUTIONS 0.00 0.00 0.0%
TOTAL, OTHER FINANCING SOURCES/USES
(a - b + c - d + e) 2,567,788.00 2,644,822.00 3.0%

San Francisco UnifiedSan Francisco County
July 1 BudgetSpecial Reserve Fund for Capital Outlay Projects
Expenditures by Function38 68478 0000000
Form 40
California Dept of EducationSACS Financial Reporting Software - 2016.1.0File: fund-d (Rev 02/02/2016) Page 1 Printed: 6/23/2016 4:56 PM
Description Function Codes Object Codes2015-16
Estimated Actuals2016-17Budget
PercentDifference
A. REVENUES
1) LCFF Sources 8010-8099 0.00 0.00 0.0%
2) Federal Revenue 8100-8299 0.00 0.00 0.0%
3) Other State Revenue 8300-8599 0.00 0.00 0.0%
4) Other Local Revenue 8600-8799 0.00 500,000.00 New
5) TOTAL, REVENUES 0.00 500,000.00 New
B. EXPENDITURES (Objects 1000-7999)
1) Instruction 1000-1999 0.00 0.00 0.0%
2) Instruction - Related Services 2000-2999 0.00 0.00 0.0%
3) Pupil Services 3000-3999 0.00 0.00 0.0%
4) Ancillary Services 4000-4999 0.00 0.00 0.0%
5) Community Services 5000-5999 0.00 0.00 0.0%
6) Enterprise 6000-6999 0.00 0.00 0.0%
7) General Administration 7000-7999 0.00 0.00 0.0%
8) Plant Services 8000-8999 4,210,860.27 500,000.00 -88.1%
9) Other Outgo 9000-9999Except
7600-7699 2,571,010.50 2,644,822.00 2.9%
10) TOTAL, EXPENDITURES 6,781,870.77 3,144,822.00 -53.6%
C. EXCESS (DEFICIENCY) OF REVENUES
OVER EXPENDITURES BEFORE OTHER
FINANCING SOURCES AND USES (A5 - B10) (6,781,870.77) (2,644,822.00) -61.0%
D. OTHER FINANCING SOURCES/USES
1) Interfund Transfers
a) Transfers In 8900-8929 2,567,788.00 2,644,822.00 3.0%
b) Transfers Out 7600-7629 0.00 0.00 0.0%
2) Other Sources/Uses
a) Sources 8930-8979 0.00 0.00 0.0%
b) Uses 7630-7699 0.00 0.00 0.0%
3) Contributions 8980-8999 0.00 0.00 0.0%
4) TOTAL, OTHER FINANCING SOURCES/USES 2,567,788.00 2,644,822.00 3.0%

San Francisco UnifiedSan Francisco County
July 1 BudgetSpecial Reserve Fund for Capital Outlay Projects
Expenditures by Function38 68478 0000000
Form 40
California Dept of EducationSACS Financial Reporting Software - 2016.1.0File: fund-d (Rev 02/02/2016) Page 2 Printed: 6/23/2016 4:56 PM
Description Function Codes Object Codes2015-16
Estimated Actuals2016-17Budget
PercentDifference
E. NET INCREASE (DECREASE) IN FUND
BALANCE (C + D4) (4,214,082.77) 0.00 -100.0%
F. FUND BALANCE, RESERVES
1) Beginning Fund Balance
a) As of July 1 - Unaudited 9791 8,330,689.41 4,116,606.64 -50.6%
b) Audit Adjustments 9793 0.00 0.00 0.0%
c) As of July 1 - Audited (F1a + F1b) 8,330,689.41 4,116,606.64 -50.6%
d) Other Restatements 9795 0.00 0.00 0.0%
e) Adjusted Beginning Balance (F1c + F1d) 8,330,689.41 4,116,606.64 -50.6%
2) Ending Balance, June 30 (E + F1e) 4,116,606.64 4,116,606.64 0.0%
Components of Ending Fund Balance
a) Nonspendable
Revolving Cash 9711 0.00 0.00 0.0%
Stores 9712 0.00 0.00 0.0%
Prepaid Expenditures 9713 0.00 0.00 0.0%
All Others 9719 0.00 0.00 0.0%
b) Restricted 9740 4,116,606.64 4,116,606.64 0.0%
c) Committed
Stabilization Arrangements 9750 0.00 0.00 0.0%
Other Commitments (by Resource/Object) 9760 0.00 0.00 0.0%
d) Assigned
Other Assignments (by Resource/Object) 9780 0.00 0.00 0.0%
e) Unassigned/Unappropriated
Reserve for Economic Uncertainties 9789 0.00 0.00 0.0%
Unassigned/Unappropriated Amount 9790 0.00 0.00 0.0%

San Francisco UnifiedSan Francisco County
July 1 BudgetSpecial Reserve Fund for Capital Outlay Projects
Exhibit: Restricted Balance Detail38 68478 0000000
Form 40
California Dept of EducationSACS Financial Reporting Software - 2016.1.0File: fund-d (Rev 04/06/2011) Page 1 Printed: 6/23/2016 4:57 PM
2015-16 2016-17
Resource Description Estimated Actuals Budget
9010 Other Restricted Local 4,116,606.64 4,116,606.64
Total, Restricted Balance 4,116,606.64 4,116,606.64

This Page Is Intentionally Left Blank

Section Break
Insert Tab Here

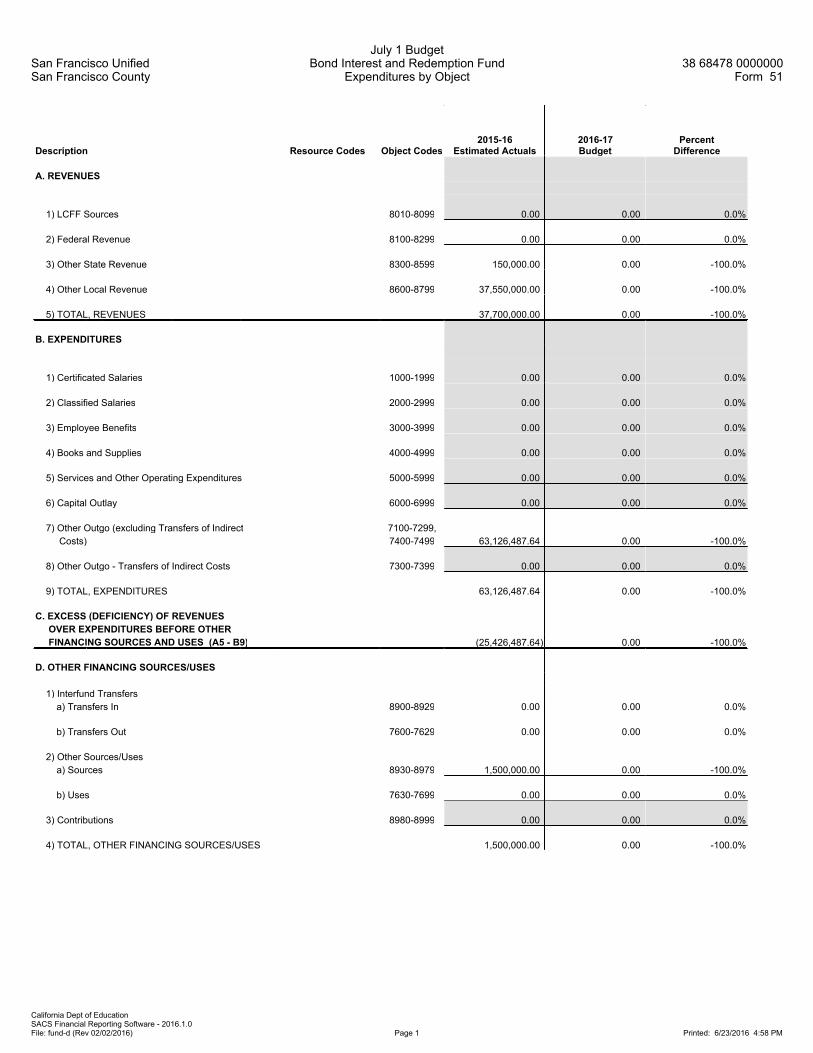
San Francisco UnifiedSan Francisco County
July 1 BudgetBond Interest and Redemption Fund
Expenditures by Object38 68478 0000000
Form 51
California Dept of EducationSACS Financial Reporting Software - 2016.1.0File: fund-d (Rev 02/02/2016) Page 1 Printed: 6/23/2016 4:58 PM
Description Resource Codes Object Codes2015-16
Estimated Actuals2016-17Budget
PercentDifference
A. REVENUES
1) LCFF Sources 8010-8099 0.00 0.00 0.0%
2) Federal Revenue 8100-8299 0.00 0.00 0.0%
3) Other State Revenue 8300-8599 150,000.00 0.00 -100.0%
4) Other Local Revenue 8600-8799 37,550,000.00 0.00 -100.0%
5) TOTAL, REVENUES 37,700,000.00 0.00 -100.0%
B. EXPENDITURES
1) Certificated Salaries 1000-1999 0.00 0.00 0.0%
2) Classified Salaries 2000-2999 0.00 0.00 0.0%
3) Employee Benefits 3000-3999 0.00 0.00 0.0%
4) Books and Supplies 4000-4999 0.00 0.00 0.0%
5) Services and Other Operating Expenditures 5000-5999 0.00 0.00 0.0%
6) Capital Outlay 6000-6999 0.00 0.00 0.0%
7) Other Outgo (excluding Transfers of Indirect 7100-7299,
Costs) 7400-7499 63,126,487.64 0.00 -100.0%
8) Other Outgo - Transfers of Indirect Costs 7300-7399 0.00 0.00 0.0%
9) TOTAL, EXPENDITURES 63,126,487.64 0.00 -100.0%
C. EXCESS (DEFICIENCY) OF REVENUES
OVER EXPENDITURES BEFORE OTHER
FINANCING SOURCES AND USES (A5 - B9) (25,426,487.64) 0.00 -100.0%
D. OTHER FINANCING SOURCES/USES
1) Interfund Transfers
a) Transfers In 8900-8929 0.00 0.00 0.0%
b) Transfers Out 7600-7629 0.00 0.00 0.0%
2) Other Sources/Uses
a) Sources 8930-8979 1,500,000.00 0.00 -100.0%
b) Uses 7630-7699 0.00 0.00 0.0%
3) Contributions 8980-8999 0.00 0.00 0.0%
4) TOTAL, OTHER FINANCING SOURCES/USES 1,500,000.00 0.00 -100.0%

San Francisco UnifiedSan Francisco County
July 1 BudgetBond Interest and Redemption Fund
Expenditures by Object38 68478 0000000
Form 51
California Dept of EducationSACS Financial Reporting Software - 2016.1.0File: fund-d (Rev 02/02/2016) Page 2 Printed: 6/23/2016 4:58 PM
Description Resource Codes Object Codes2015-16
Estimated Actuals2016-17Budget
PercentDifference
E. NET INCREASE (DECREASE) IN FUND
BALANCE (C + D4) (23,926,487.64) 0.00 -100.0%
F. FUND BALANCE, RESERVES
1) Beginning Fund Balance
a) As of July 1 - Unaudited 9791 23,926,487.64 0.00 -100.0%
b) Audit Adjustments 9793 0.00 0.00 0.0%
c) As of July 1 - Audited (F1a + F1b) 23,926,487.64 0.00 -100.0%
d) Other Restatements 9795 0.00 0.00 0.0%
e) Adjusted Beginning Balance (F1c + F1d) 23,926,487.64 0.00 -100.0%
2) Ending Balance, June 30 (E + F1e) 0.00 0.00 0.0%
Components of Ending Fund Balance
a) Nonspendable
Revolving Cash 9711 0.00 0.00 0.0%
Stores 9712 0.00 0.00 0.0%
Prepaid Expenditures 9713 0.00 0.00 0.0%
All Others 9719 0.00 0.00 0.0%
b) Restricted 9740 0.00 0.00 0.0%
c) Committed
Stabilization Arrangements 9750 0.00 0.00 0.0%
Other Commitments 9760 0.00 0.00 0.0%
d) Assigned
Other Assignments 9780 0.00 0.00 0.0%
e) Unassigned/Unappropriated
Reserve for Economic Uncertainties 9789 0.00 0.00 0.0%
Unassigned/Unappropriated Amount 9790 0.00 0.00 0.0%

San Francisco UnifiedSan Francisco County
July 1 BudgetBond Interest and Redemption Fund
Expenditures by Object38 68478 0000000
Form 51
California Dept of EducationSACS Financial Reporting Software - 2016.1.0File: fund-d (Rev 02/02/2016) Page 3 Printed: 6/23/2016 4:58 PM
Description Resource Codes Object Codes2015-16
Estimated Actuals2016-17Budget
PercentDifference
G. ASSETS
1) Cash
a) in County Treasury 9110 0.00
1) Fair Value Adjustment to Cash in County Treasury 9111 0.00
b) in Banks 9120 0.00
c) in Revolving Fund 9130 0.00
d) with Fiscal Agent 9135 0.00
e) collections awaiting deposit 9140 0.00
2) Investments 9150 0.00
3) Accounts Receivable 9200 0.00
4) Due from Grantor Government 9290 0.00
5) Due from Other Funds 9310 0.00
6) Stores 9320 0.00
7) Prepaid Expenditures 9330 0.00
8) Other Current Assets 9340 0.00
9) TOTAL, ASSETS 0.00
H. DEFERRED OUTFLOWS OF RESOURCES
1) Deferred Outflows of Resources 9490 0.00
2) TOTAL, DEFERRED OUTFLOWS 0.00
I. LIABILITIES
1) Accounts Payable 9500 0.00
2) Due to Grantor Governments 9590 0.00
3) Due to Other Funds 9610 0.00
4) Current Loans 9640 0.00
5) Unearned Revenue 9650 0.00
6) TOTAL, LIABILITIES 0.00
J. DEFERRED INFLOWS OF RESOURCES
1) Deferred Inflows of Resources 9690 0.00
2) TOTAL, DEFERRED INFLOWS 0.00
K. FUND EQUITY
Ending Fund Balance, June 30
(G9 + H2) - (I6 + J2) 0.00

San Francisco UnifiedSan Francisco County
July 1 BudgetBond Interest and Redemption Fund
Expenditures by Object38 68478 0000000
Form 51
California Dept of EducationSACS Financial Reporting Software - 2016.1.0File: fund-d (Rev 02/02/2016) Page 4 Printed: 6/23/2016 4:58 PM
Description Resource Codes Object Codes2015-16
Estimated Actuals2016-17Budget
PercentDifference
FEDERAL REVENUE
All Other Federal Revenue 8290 0.00 0.00 0.0%
TOTAL, FEDERAL REVENUE 0.00 0.00 0.0%
OTHER STATE REVENUE
Tax Relief Subventions
Voted Indebtedness Levies
Homeowners' Exemptions 8571 150,000.00 0.00 -100.0%
Other Subventions/In-Lieu
Taxes 8572 0.00 0.00 0.0%
TOTAL, OTHER STATE REVENUE 150,000.00 0.00 -100.0%
OTHER LOCAL REVENUE
Other Local Revenue
County and District Taxes
Voted Indebtedness Levies
Secured Roll 8611 34,250,000.00 0.00 -100.0%
Unsecured Roll 8612 3,500,000.00 0.00 -100.0%
Prior Years' Taxes 8613 (1,500,000.00) 0.00 -100.0%
Supplemental Taxes 8614 1,000,000.00 0.00 -100.0%
Penalties and Interest from
Delinquent Non-LCFF
Taxes 8629 0.00 0.00 0.0%
Interest 8660 300,000.00 0.00 -100.0%
Net Increase (Decrease) in the Fair Value of Investments 8662 0.00 0.00 0.0%
Other Local Revenue
All Other Local Revenue 8699 0.00 0.00 0.0%
All Other Transfers In from All Others 8799 0.00 0.00 0.0%
TOTAL, OTHER LOCAL REVENUE 37,550,000.00 0.00 -100.0%
TOTAL, REVENUES 37,700,000.00 0.00 -100.0%

San Francisco UnifiedSan Francisco County
July 1 BudgetBond Interest and Redemption Fund
Expenditures by Object38 68478 0000000
Form 51
California Dept of EducationSACS Financial Reporting Software - 2016.1.0File: fund-d (Rev 02/02/2016) Page 5 Printed: 6/23/2016 4:58 PM
Description Resource Codes Object Codes2015-16
Estimated Actuals2016-17Budget
PercentDifference
OTHER OUTGO (excluding Transfers of Indirect Costs)
Debt Service
Bond Redemptions 7433 0.00 0.00 0.0%
Bond Interest and Other Service
Charges 7434 0.00 0.00 0.0%
Debt Service - Interest 7438 33,126,487.64 0.00 -100.0%
Other Debt Service - Principal 7439 30,000,000.00 0.00 -100.0%
TOTAL, OTHER OUTGO (excluding Transfers of Indirect Costs) 63,126,487.64 0.00 -100.0%
TOTAL, EXPENDITURES 63,126,487.64 0.00 -100.0%

San Francisco UnifiedSan Francisco County
July 1 BudgetBond Interest and Redemption Fund
Expenditures by Object38 68478 0000000
Form 51
California Dept of EducationSACS Financial Reporting Software - 2016.1.0File: fund-d (Rev 02/02/2016) Page 6 Printed: 6/23/2016 4:59 PM
Description Resource Codes Object Codes2015-16
Estimated Actuals2016-17Budget
PercentDifference
INTERFUND TRANSFERS
INTERFUND TRANSFERS IN
Other Authorized Interfund Transfers In 8919 0.00 0.00 0.0%
(a) TOTAL, INTERFUND TRANSFERS IN 0.00 0.00 0.0%
INTERFUND TRANSFERS OUT
To: General Fund 7614 0.00 0.00 0.0%
Other Authorized Interfund Transfers Out 7619 0.00 0.00 0.0%
(b) TOTAL, INTERFUND TRANSFERS OUT 0.00 0.00 0.0%
OTHER SOURCES/USES
SOURCES
Other Sources
Transfers from Funds of
Lapsed/Reorganized LEAs 8965 0.00 0.00 0.0%
All Other Financing Sources 8979 1,500,000.00 0.00 -100.0%
(c) TOTAL, SOURCES 1,500,000.00 0.00 -100.0%
USES
Transfers of Funds from
Lapsed/Reorganized LEAs 7651 0.00 0.00 0.0%
All Other Financing Uses 7699 0.00 0.00 0.0%
(d) TOTAL, USES 0.00 0.00 0.0%
CONTRIBUTIONS
Contributions from Unrestricted Revenues 8980 0.00 0.00 0.0%
Contributions from Restricted Revenues 8990 0.00 0.00 0.0%
(e) TOTAL, CONTRIBUTIONS 0.00 0.00 0.0%
TOTAL, OTHER FINANCING SOURCES/USES
(a - b + c - d + e) 1,500,000.00 0.00 -100.0%

San Francisco UnifiedSan Francisco County
July 1 BudgetBond Interest and Redemption Fund
Expenditures by Function38 68478 0000000
Form 51
California Dept of EducationSACS Financial Reporting Software - 2016.1.0File: fund-d (Rev 02/02/2016) Page 1 Printed: 6/23/2016 4:59 PM
Description Function Codes Object Codes2015-16
Estimated Actuals2016-17Budget
PercentDifference
A. REVENUES
1) LCFF Sources 8010-8099 0.00 0.00 0.0%
2) Federal Revenue 8100-8299 0.00 0.00 0.0%
3) Other State Revenue 8300-8599 150,000.00 0.00 -100.0%
4) Other Local Revenue 8600-8799 37,550,000.00 0.00 -100.0%
5) TOTAL, REVENUES 37,700,000.00 0.00 -100.0%
B. EXPENDITURES (Objects 1000-7999)
1) Instruction 1000-1999 0.00 0.00 0.0%
2) Instruction - Related Services 2000-2999 0.00 0.00 0.0%
3) Pupil Services 3000-3999 0.00 0.00 0.0%
4) Ancillary Services 4000-4999 0.00 0.00 0.0%
5) Community Services 5000-5999 0.00 0.00 0.0%
6) Enterprise 6000-6999 0.00 0.00 0.0%
7) General Administration 7000-7999 0.00 0.00 0.0%
8) Plant Services 8000-8999 0.00 0.00 0.0%
9) Other Outgo 9000-9999Except
7600-7699 63,126,487.64 0.00 -100.0%
10) TOTAL, EXPENDITURES 63,126,487.64 0.00 -100.0%
C. EXCESS (DEFICIENCY) OF REVENUES
OVER EXPENDITURES BEFORE OTHER
FINANCING SOURCES AND USES (A5 - B10) (25,426,487.64) 0.00 -100.0%
D. OTHER FINANCING SOURCES/USES
1) Interfund Transfers
a) Transfers In 8900-8929 0.00 0.00 0.0%
b) Transfers Out 7600-7629 0.00 0.00 0.0%
2) Other Sources/Uses
a) Sources 8930-8979 1,500,000.00 0.00 -100.0%
b) Uses 7630-7699 0.00 0.00 0.0%
3) Contributions 8980-8999 0.00 0.00 0.0%
4) TOTAL, OTHER FINANCING SOURCES/USES 1,500,000.00 0.00 -100.0%

San Francisco UnifiedSan Francisco County
July 1 BudgetBond Interest and Redemption Fund
Expenditures by Function38 68478 0000000
Form 51
California Dept of EducationSACS Financial Reporting Software - 2016.1.0File: fund-d (Rev 02/02/2016) Page 2 Printed: 6/23/2016 4:59 PM
Description Function Codes Object Codes2015-16
Estimated Actuals2016-17Budget
PercentDifference
E. NET INCREASE (DECREASE) IN FUND
BALANCE (C + D4) (23,926,487.64) 0.00 -100.0%
F. FUND BALANCE, RESERVES
1) Beginning Fund Balance
a) As of July 1 - Unaudited 9791 23,926,487.64 0.00 -100.0%
b) Audit Adjustments 9793 0.00 0.00 0.0%
c) As of July 1 - Audited (F1a + F1b) 23,926,487.64 0.00 -100.0%
d) Other Restatements 9795 0.00 0.00 0.0%
e) Adjusted Beginning Balance (F1c + F1d) 23,926,487.64 0.00 -100.0%
2) Ending Balance, June 30 (E + F1e) 0.00 0.00 0.0%
Components of Ending Fund Balance
a) Nonspendable
Revolving Cash 9711 0.00 0.00 0.0%
Stores 9712 0.00 0.00 0.0%
Prepaid Expenditures 9713 0.00 0.00 0.0%
All Others 9719 0.00 0.00 0.0%
b) Restricted 9740 0.00 0.00 0.0%
c) Committed
Stabilization Arrangements 9750 0.00 0.00 0.0%
Other Commitments (by Resource/Object) 9760 0.00 0.00 0.0%
d) Assigned
Other Assignments (by Resource/Object) 9780 0.00 0.00 0.0%
e) Unassigned/Unappropriated
Reserve for Economic Uncertainties 9789 0.00 0.00 0.0%
Unassigned/Unappropriated Amount 9790 0.00 0.00 0.0%

San Francisco UnifiedSan Francisco County
July 1 BudgetBond Interest and Redemption Fund
Exhibit: Restricted Balance Detail38 68478 0000000
Form 51
California Dept of EducationSACS Financial Reporting Software - 2016.1.0File: fund-d (Rev 04/06/2011) Page 1 Printed: 6/23/2016 4:59 PM
2015-16 2016-17
Resource Description Estimated Actuals Budget
Total, Restricted Balance 0.00 0.00

This Page Is Intentionally Left Blank

Section Break
Insert Tab Here


San Francisco UnifiedSan Francisco County
July 1 BudgetOther Enterprise FundExpenses by Object
38 68478 0000000Form 63
California Dept of EducationSACS Financial Reporting Software - 2016.1.0File: fund-e (Rev 03/09/2016) Page 1 Printed: 6/23/2016 4:57 PM
Description Resource Codes Object Codes2015-16
Estimated Actuals2016-17Budget
PercentDifference
A. REVENUES
1) LCFF Sources 8010-8099 0.00 0.00 0.0%
2) Federal Revenue 8100-8299 0.00 0.00 0.0%
3) Other State Revenue 8300-8599 0.00 0.00 0.0%
4) Other Local Revenue 8600-8799 2,472,761.85 2,427,500.00 -1.8%
5) TOTAL, REVENUES 2,472,761.85 2,427,500.00 -1.8%
B. EXPENSES
1) Certificated Salaries 1000-1999 0.00 0.00 0.0%
2) Classified Salaries 2000-2999 426,996.67 422,979.62 -0.9%
3) Employee Benefits 3000-3999 218,117.07 223,995.26 2.7%
4) Books and Supplies 4000-4999 877,582.06 262,319.00 -70.1%
5) Services and Other Operating Expenses 5000-5999 1,788,884.82 1,563,491.00 -12.6%
6) Depreciation 6000-6999 26,845.00 26,845.00 0.0%
7) Other Outgo (excluding Transfers of Indirect 7100-7299,
Costs) 7400-7499 0.00 0.00 0.0%
8) Other Outgo - Transfers of Indirect Costs 7300-7399 0.00 0.00 0.0%
9) TOTAL, EXPENSES 3,338,425.62 2,499,629.88 -25.1%
C. EXCESS (DEFICIENCY) OF REVENUES
OVER EXPENSES BEFORE OTHER
FINANCING SOURCES AND USES (A5 - B9) (865,663.77) (72,129.88) -91.7%
D. OTHER FINANCING SOURCES/USES
1) Interfund Transfers
a) Transfers In 8900-8929 0.00 0.00 0.0%
b) Transfers Out 7600-7629 0.00 0.00 0.0%
2) Other Sources/Uses
a) Sources 8930-8979 0.00 0.00 0.0%
b) Uses 7630-7699 0.00 0.00 0.0%
3) Contributions 8980-8999 0.00 0.00 0.0%
4) TOTAL, OTHER FINANCING SOURCES/USES 0.00 0.00 0.0%

San Francisco UnifiedSan Francisco County
July 1 BudgetOther Enterprise FundExpenses by Object
38 68478 0000000Form 63
California Dept of EducationSACS Financial Reporting Software - 2016.1.0File: fund-e (Rev 03/09/2016) Page 2 Printed: 6/23/2016 4:57 PM
Description Resource Codes Object Codes2015-16
Estimated Actuals2016-17Budget
PercentDifference
E. NET INCREASE (DECREASE) IN
NET POSITION (C + D4) (865,663.77) (72,129.88) -91.7%
F. NET POSITION
1) Beginning Net Position
a) As of July 1 - Unaudited 9791 1,510,913.63 645,249.86 -57.3%
b) Audit Adjustments 9793 0.00 0.00 0.0%
c) As of July 1 - Audited (F1a + F1b) 1,510,913.63 645,249.86 -57.3%
d) Other Restatements 9795 0.00 0.00 0.0%
e) Adjusted Beginning Net Position (F1c + F1d) 1,510,913.63 645,249.86 -57.3%
2) Ending Net Position, June 30 (E + F1e) 645,249.86 573,119.98 -11.2%
Components of Ending Net Position
a) Net Investment in Capital Assets 9796 0.00 0.00 0.0%
b) Restricted Net Position 9797 0.00 0.00 0.0%
c) Unrestricted Net Position 9790 645,249.86 573,119.98 -11.2%

San Francisco UnifiedSan Francisco County
July 1 BudgetOther Enterprise FundExpenses by Object
38 68478 0000000Form 63
California Dept of EducationSACS Financial Reporting Software - 2016.1.0File: fund-e (Rev 03/09/2016) Page 3 Printed: 6/23/2016 4:57 PM
Description Resource Codes Object Codes2015-16
Estimated Actuals2016-17Budget
PercentDifference
G. ASSETS
1) Cash
a) in County Treasury 9110 0.00
1) Fair Value Adjustment to Cash in County Treasury 9111 0.00
b) in Banks 9120 0.00
c) in Revolving Fund 9130 0.00
d) with Fiscal Agent 9135 0.00
e) collections awaiting deposit 9140 0.00
2) Investments 9150 0.00
3) Accounts Receivable 9200 0.00
4) Due from Grantor Government 9290 0.00
5) Due from Other Funds 9310 0.00
6) Stores 9320 0.00
7) Prepaid Expenditures 9330 0.00
8) Other Current Assets 9340 0.00
9) Fixed Assets
a) Land 9410 0.00
b) Land Improvements 9420 0.00
c) Accumulated Depreciation - Land Improvements 9425 0.00
d) Buildings 9430 0.00
e) Accumulated Depreciation - Buildings 9435 0.00
f) Equipment 9440 0.00
g) Accumulated Depreciation - Equipment 9445 0.00
h) Work in Progress 9450 0.00
10) TOTAL, ASSETS 0.00
H. DEFERRED OUTFLOWS OF RESOURCES
1) Deferred Outflows of Resources 9490 0.00
2) TOTAL, DEFERRED OUTFLOWS 0.00
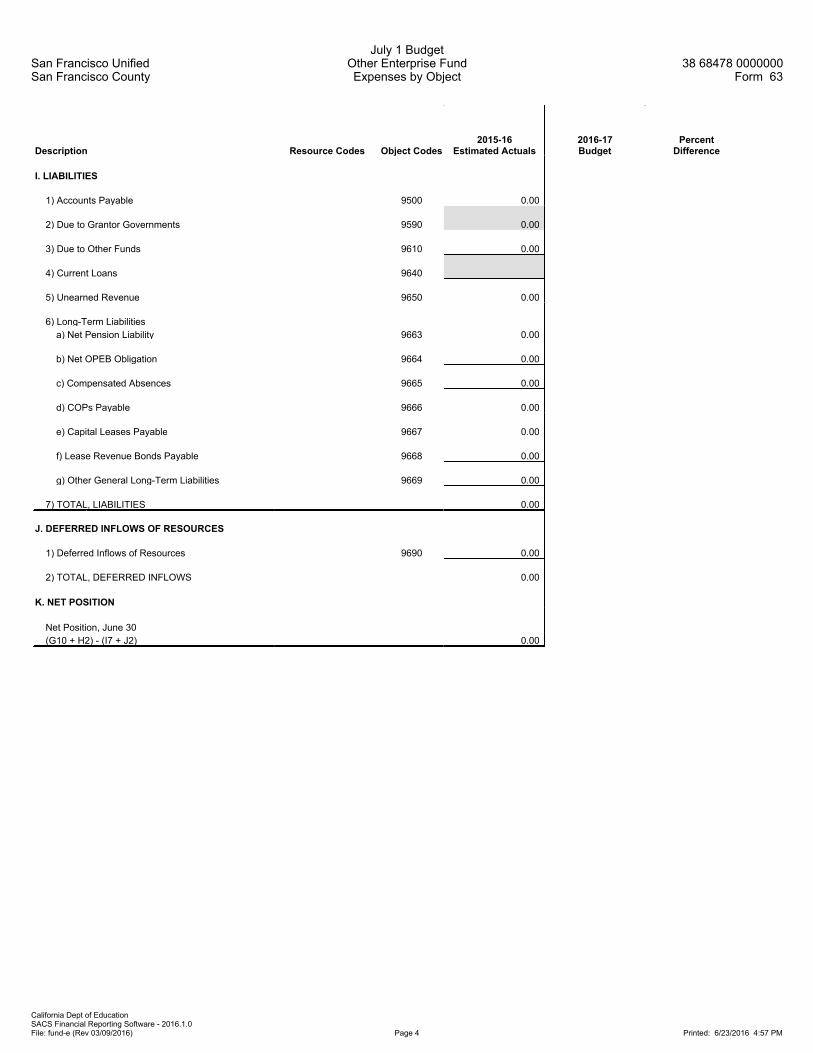
San Francisco UnifiedSan Francisco County
July 1 BudgetOther Enterprise FundExpenses by Object
38 68478 0000000Form 63
California Dept of EducationSACS Financial Reporting Software - 2016.1.0File: fund-e (Rev 03/09/2016) Page 4 Printed: 6/23/2016 4:57 PM
Description Resource Codes Object Codes2015-16
Estimated Actuals2016-17Budget
PercentDifference
I. LIABILITIES
1) Accounts Payable 9500 0.00
2) Due to Grantor Governments 9590 0.00
3) Due to Other Funds 9610 0.00
4) Current Loans 9640
5) Unearned Revenue 9650 0.00
6) Long-Term Liabilities
a) Net Pension Liability 9663 0.00
b) Net OPEB Obligation 9664 0.00
c) Compensated Absences 9665 0.00
d) COPs Payable 9666 0.00
e) Capital Leases Payable 9667 0.00
f) Lease Revenue Bonds Payable 9668 0.00
g) Other General Long-Term Liabilities 9669 0.00
7) TOTAL, LIABILITIES 0.00
J. DEFERRED INFLOWS OF RESOURCES
1) Deferred Inflows of Resources 9690 0.00
2) TOTAL, DEFERRED INFLOWS 0.00
K. NET POSITION
Net Position, June 30
(G10 + H2) - (I7 + J2) 0.00

San Francisco UnifiedSan Francisco County
July 1 BudgetOther Enterprise FundExpenses by Object
38 68478 0000000Form 63
California Dept of EducationSACS Financial Reporting Software - 2016.1.0File: fund-e (Rev 03/09/2016) Page 5 Printed: 6/23/2016 4:57 PM
Description Resource Codes Object Codes2015-16
Estimated Actuals2016-17Budget
PercentDifference
OTHER STATE REVENUE
STRS On-Behalf Pension Contributions 7690 8590 0.00 0.00 0.0%
All Other State Revenue All Other 8590 0.00 0.00 0.0%
TOTAL, OTHER STATE REVENUE 0.00 0.00 0.0%
OTHER LOCAL REVENUE
Other Local Revenue
Sales
All Other Sales 8639 0.00 0.00 0.0%
Leases and Rentals 8650 0.00 0.00 0.0%
Interest 8660 250.85 2,000.00 697.3%
Net Increase (Decrease) in the Fair Value of Investments 8662 0.00 0.00 0.0%
Fees and Contracts
All Other Fees and Contracts 8689 0.00 0.00 0.0%
Other Local Revenue
All Other Local Revenue 8699 2,472,511.00 2,425,500.00 -1.9%
TOTAL, OTHER LOCAL REVENUE 2,472,761.85 2,427,500.00 -1.8%
TOTAL, REVENUES 2,472,761.85 2,427,500.00 -1.8%

San Francisco UnifiedSan Francisco County
July 1 BudgetOther Enterprise FundExpenses by Object
38 68478 0000000Form 63
California Dept of EducationSACS Financial Reporting Software - 2016.1.0File: fund-e (Rev 03/09/2016) Page 6 Printed: 6/23/2016 4:57 PM
Description Resource Codes Object Codes2015-16
Estimated Actuals2016-17Budget
PercentDifference
CERTIFICATED SALARIES
Certificated Teachers' Salaries 1100 0.00 0.00 0.0%
Certificated Pupil Support Salaries 1200 0.00 0.00 0.0%
Certificated Supervisors' and Administrators' Salaries 1300 0.00 0.00 0.0%
Other Certificated Salaries 1900 0.00 0.00 0.0%
TOTAL, CERTIFICATED SALARIES 0.00 0.00 0.0%
CLASSIFIED SALARIES
Classified Instructional Salaries 2100 0.00 0.00 0.0%
Classified Support Salaries 2200 0.00 0.00 0.0%
Classified Supervisors' and Administrators' Salaries 2300 0.00 0.00 0.0%
Clerical, Technical and Office Salaries 2400 0.00 0.00 0.0%
Other Classified Salaries 2900 426,996.67 422,979.62 -0.9%
TOTAL, CLASSIFIED SALARIES 426,996.67 422,979.62 -0.9%
EMPLOYEE BENEFITS
STRS 3101-3102 0.00 0.00 0.0%
PERS 3201-3202 0.00 0.00 0.0%
OASDI/Medicare/Alternative 3301-3302 117,477.17 67,308.87 -42.7%
Health and Welfare Benefits 3401-3402 49,587.05 52,900.00 6.7%
Unemployment Insurance 3501-3502 219.11 444.85 103.0%
Workers' Compensation 3601-3602 14,056.81 28,572.91 103.3%
OPEB, Allocated 3701-3702 36,776.93 74,768.63 103.3%
OPEB, Active Employees 3751-3752 0.00 0.00 0.0%
Other Employee Benefits 3901-3902 0.00 0.00 0.0%
TOTAL, EMPLOYEE BENEFITS 218,117.07 223,995.26 2.7%
BOOKS AND SUPPLIES
Approved Textbooks and Core Curricula Materials 4100 0.00 0.00 0.0%
Books and Other Reference Materials 4200 0.00 0.00 0.0%
Materials and Supplies 4300 746,582.06 234,019.00 -68.7%
Noncapitalized Equipment 4400 131,000.00 28,300.00 -78.4%
Food 4700 0.00 0.00 0.0%
TOTAL, BOOKS AND SUPPLIES 877,582.06 262,319.00 -70.1%

San Francisco UnifiedSan Francisco County
July 1 BudgetOther Enterprise FundExpenses by Object
38 68478 0000000Form 63
California Dept of EducationSACS Financial Reporting Software - 2016.1.0File: fund-e (Rev 03/09/2016) Page 7 Printed: 6/23/2016 4:57 PM
Description Resource Codes Object Codes2015-16
Estimated Actuals2016-17Budget
PercentDifference
SERVICES AND OTHER OPERATING EXPENSES
Subagreements for Services 5100 0.00 0.00 0.0%
Travel and Conferences 5200 5,250.00 9,500.00 81.0%
Dues and Memberships 5300 311,582.00 292,981.00 -6.0%
Insurance 5400-5450 1,600.00 1,700.00 6.3%
Operations and Housekeeping Services 5500 0.00 0.00 0.0%
Rentals, Leases, Repairs, and Noncapitalized Improvements 5600 10,650.00 48,450.00 354.9%
Transfers of Direct Costs 5710 0.00 0.00 0.0%
Transfers of Direct Costs - Interfund 5750 0.00 0.00 0.0%
Professional/Consulting Services and
Operating Expenditures 5800 1,418,762.82 1,180,860.00 -16.8%
Communications 5900 41,040.00 30,000.00 -26.9%
TOTAL, SERVICES AND OTHER OPERATING EXPENSES 1,788,884.82 1,563,491.00 -12.6%
DEPRECIATION
Depreciation Expense 6900 26,845.00 26,845.00 0.0%
TOTAL, DEPRECIATION 26,845.00 26,845.00 0.0%
OTHER OUTGO (excluding Transfers of Indirect Costs)
Other Transfers Out
All Other Transfers Out to All Others 7299 0.00 0.00 0.0%
TOTAL, OTHER OUTGO (excluding Transfers of Indirect Costs) 0.00 0.00 0.0%
TOTAL, EXPENSES 3,338,425.62 2,499,629.88 -25.1%

San Francisco UnifiedSan Francisco County
July 1 BudgetOther Enterprise FundExpenses by Object
38 68478 0000000Form 63
California Dept of EducationSACS Financial Reporting Software - 2016.1.0File: fund-e (Rev 03/09/2016) Page 8 Printed: 6/23/2016 4:57 PM
Description Resource Codes Object Codes2015-16
Estimated Actuals2016-17Budget
PercentDifference
INTERFUND TRANSFERS
INTERFUND TRANSFERS IN
Other Authorized Interfund Transfers In 8919 0.00 0.00 0.0%
(a) TOTAL, INTERFUND TRANSFERS IN 0.00 0.00 0.0%
INTERFUND TRANSFERS OUT
Other Authorized Interfund Transfers Out 7619 0.00 0.00 0.0%
(b) TOTAL, INTERFUND TRANSFERS OUT 0.00 0.00 0.0%
OTHER SOURCES/USES
SOURCES
Other Sources
Transfers from Funds of
Lapsed/Reorganized LEAs 8965 0.00 0.00 0.0%
(c) TOTAL, SOURCES 0.00 0.00 0.0%
USES
Transfers of Funds from
Lapsed/Reorganized LEAs 7651 0.00 0.00 0.0%
(d) TOTAL, USES 0.00 0.00 0.0%
CONTRIBUTIONS
Contributions from Unrestricted Revenues 8980 0.00 0.00 0.0%
Contributions from Restricted Revenues 8990 0.00 0.00 0.0%
(e) TOTAL, CONTRIBUTIONS 0.00 0.00 0.0%
TOTAL, OTHER FINANCING SOURCES/USES
(a - b + c - d + e) 0.00 0.00 0.0%
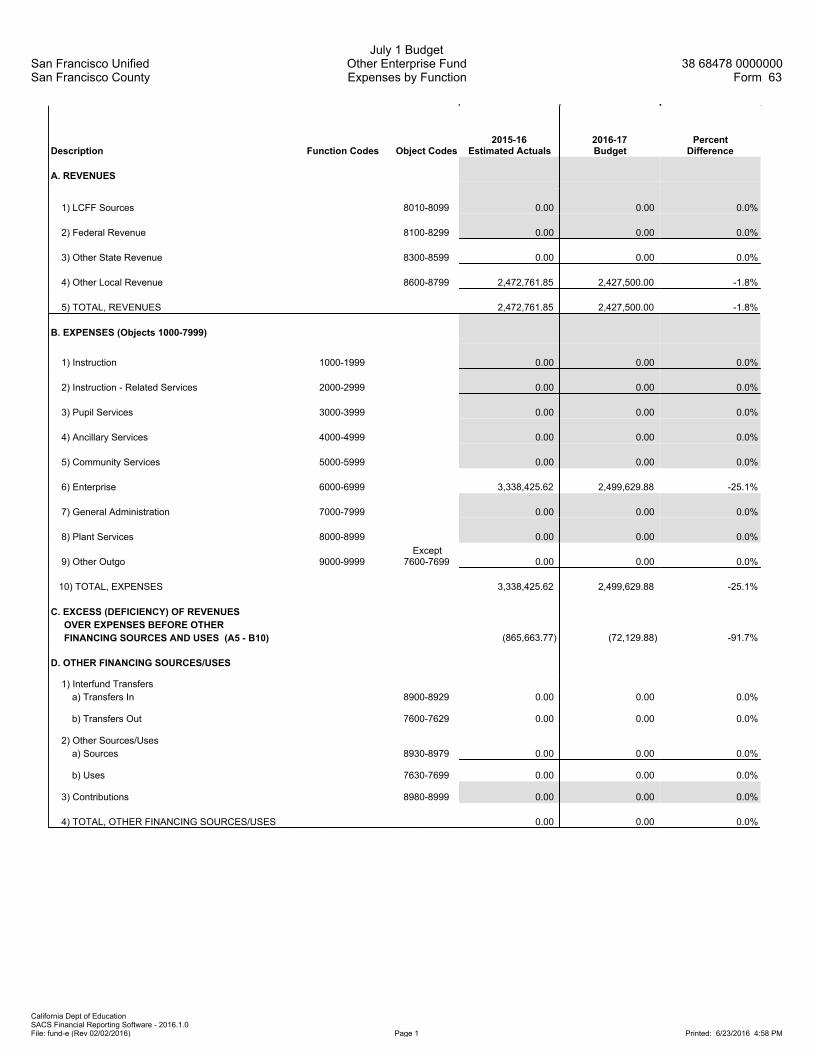
San Francisco UnifiedSan Francisco County
July 1 BudgetOther Enterprise FundExpenses by Function
38 68478 0000000Form 63
California Dept of EducationSACS Financial Reporting Software - 2016.1.0File: fund-e (Rev 02/02/2016) Page 1 Printed: 6/23/2016 4:58 PM
Description Function Codes Object Codes2015-16
Estimated Actuals2016-17Budget
PercentDifference
A. REVENUES
1) LCFF Sources 8010-8099 0.00 0.00 0.0%
2) Federal Revenue 8100-8299 0.00 0.00 0.0%
3) Other State Revenue 8300-8599 0.00 0.00 0.0%
4) Other Local Revenue 8600-8799 2,472,761.85 2,427,500.00 -1.8%
5) TOTAL, REVENUES 2,472,761.85 2,427,500.00 -1.8%
B. EXPENSES (Objects 1000-7999)
1) Instruction 1000-1999 0.00 0.00 0.0%
2) Instruction - Related Services 2000-2999 0.00 0.00 0.0%
3) Pupil Services 3000-3999 0.00 0.00 0.0%
4) Ancillary Services 4000-4999 0.00 0.00 0.0%
5) Community Services 5000-5999 0.00 0.00 0.0%
6) Enterprise 6000-6999 3,338,425.62 2,499,629.88 -25.1%
7) General Administration 7000-7999 0.00 0.00 0.0%
8) Plant Services 8000-8999 0.00 0.00 0.0%
9) Other Outgo 9000-9999Except
7600-7699 0.00 0.00 0.0%
10) TOTAL, EXPENSES 3,338,425.62 2,499,629.88 -25.1%
C. EXCESS (DEFICIENCY) OF REVENUES
OVER EXPENSES BEFORE OTHER
FINANCING SOURCES AND USES (A5 - B10) (865,663.77) (72,129.88) -91.7%
D. OTHER FINANCING SOURCES/USES
1) Interfund Transfers
a) Transfers In 8900-8929 0.00 0.00 0.0%
b) Transfers Out 7600-7629 0.00 0.00 0.0%
2) Other Sources/Uses
a) Sources 8930-8979 0.00 0.00 0.0%
b) Uses 7630-7699 0.00 0.00 0.0%
3) Contributions 8980-8999 0.00 0.00 0.0%
4) TOTAL, OTHER FINANCING SOURCES/USES 0.00 0.00 0.0%

San Francisco UnifiedSan Francisco County
July 1 BudgetOther Enterprise FundExpenses by Function
38 68478 0000000Form 63
California Dept of EducationSACS Financial Reporting Software - 2016.1.0File: fund-e (Rev 02/02/2016) Page 2 Printed: 6/23/2016 4:58 PM
Description Function Codes Object Codes2015-16
Estimated Actuals2016-17Budget
PercentDifference
E. NET INCREASE (DECREASE) IN
NET POSITION (C + D4) (865,663.77) (72,129.88) -91.7%
F. NET POSITION
1) Beginning Net Position
a) As of July 1 - Unaudited 9791 1,510,913.63 645,249.86 -57.3%
b) Audit Adjustments 9793 0.00 0.00 0.0%
c) As of July 1 - Audited (F1a + F1b) 1,510,913.63 645,249.86 -57.3%
d) Other Restatements 9795 0.00 0.00 0.0%
e) Adjusted Beginning Net Position (F1c + F1d) 1,510,913.63 645,249.86 -57.3%
2) Ending Net Position, June 30 (E + F1e) 645,249.86 573,119.98 -11.2%
Components of Ending Net Position
a) Net Investment in Capital Assets 9796 0.00 0.00 0.0%
b) Restricted Net Position 9797 0.00 0.00 0.0%
c) Unrestricted Net Position 9790 645,249.86 573,119.98 -11.2%

San Francisco UnifiedSan Francisco County
July 1 BudgetOther Enterprise Fund
Exhibit: Restricted Net Position Detail38 68478 0000000
Form 63
California Dept of EducationSACS Financial Reporting Software - 2016.1.0File: fund-e (Rev 11/30/2012) Page 1 Printed: 6/23/2016 4:58 PM
2015-16 2016-17
Resource Description Estimated Actuals Budget
Total, Restricted Net Position 0.00 0.00

This Page Is Intentionally Left Blank

Section Break
Insert Tab Here


San Francisco UnifiedSan Francisco County
July 1 BudgetSelf-Insurance FundExpenses by Object
38 68478 0000000Form 67
California Dept of EducationSACS Financial Reporting Software - 2016.1.0File: fund-e (Rev 03/09/2016) Page 1 Printed: 6/23/2016 4:59 PM
Description Resource Codes Object Codes2015-16
Estimated Actuals2016-17Budget
PercentDifference
A. REVENUES
1) LCFF Sources 8010-8099 0.00 0.00 0.0%
2) Federal Revenue 8100-8299 0.00 0.00 0.0%
3) Other State Revenue 8300-8599 0.00 0.00 0.0%
4) Other Local Revenue 8600-8799 21,505,067.63 23,023,807.00 7.1%
5) TOTAL, REVENUES 21,505,067.63 23,023,807.00 7.1%
B. EXPENSES
1) Certificated Salaries 1000-1999 0.00 0.00 0.0%
2) Classified Salaries 2000-2999 1,010,594.52 569,461.74 -43.7%
3) Employee Benefits 3000-3999 454,728.98 285,344.87 -37.2%
4) Books and Supplies 4000-4999 378,631.99 6,400.00 -98.3%
5) Services and Other Operating Expenses 5000-5999 20,193,483.58 19,937,600.00 -1.3%
6) Depreciation 6000-6999 0.00 0.00 0.0%
7) Other Outgo (excluding Transfers of Indirect 7100-7299,
Costs) 7400-7499 0.00 0.00 0.0%
8) Other Outgo - Transfers of Indirect Costs 7300-7399 0.00 0.00 0.0%
9) TOTAL, EXPENSES 22,037,439.07 20,798,806.61 -5.6%
C. EXCESS (DEFICIENCY) OF REVENUES
OVER EXPENSES BEFORE OTHER
FINANCING SOURCES AND USES (A5 - B9) (532,371.44) 2,225,000.39 -517.9%
D. OTHER FINANCING SOURCES/USES
1) Interfund Transfers
a) Transfers In 8900-8929 0.00 0.00 0.0%
b) Transfers Out 7600-7629 0.00 0.00 0.0%
2) Other Sources/Uses
a) Sources 8930-8979 0.00 0.00 0.0%
b) Uses 7630-7699 0.00 0.00 0.0%
3) Contributions 8980-8999 0.00 0.00 0.0%
4) TOTAL, OTHER FINANCING SOURCES/USES 0.00 0.00 0.0%

San Francisco UnifiedSan Francisco County
July 1 BudgetSelf-Insurance FundExpenses by Object
38 68478 0000000Form 67
California Dept of EducationSACS Financial Reporting Software - 2016.1.0File: fund-e (Rev 03/09/2016) Page 2 Printed: 6/23/2016 4:59 PM
Description Resource Codes Object Codes2015-16
Estimated Actuals2016-17Budget
PercentDifference
E. NET INCREASE (DECREASE) IN
NET POSITION (C + D4) (532,371.44) 2,225,000.39 -517.9%
F. NET POSITION
1) Beginning Net Position
a) As of July 1 - Unaudited 9791 20,380,760.35 19,848,388.91 -2.6%
b) Audit Adjustments 9793 0.00 0.00 0.0%
c) As of July 1 - Audited (F1a + F1b) 20,380,760.35 19,848,388.91 -2.6%
d) Other Restatements 9795 0.00 0.00 0.0%
e) Adjusted Beginning Net Position (F1c + F1d) 20,380,760.35 19,848,388.91 -2.6%
2) Ending Net Position, June 30 (E + F1e) 19,848,388.91 22,073,389.30 11.2%
Components of Ending Net Position
a) Net Investment in Capital Assets 9796 0.00 0.00 0.0%
b) Restricted Net Position 9797 0.00 0.00 0.0%
c) Unrestricted Net Position 9790 19,848,388.91 22,073,389.30 11.2%

San Francisco UnifiedSan Francisco County
July 1 BudgetSelf-Insurance FundExpenses by Object
38 68478 0000000Form 67
California Dept of EducationSACS Financial Reporting Software - 2016.1.0File: fund-e (Rev 03/09/2016) Page 3 Printed: 6/23/2016 4:59 PM
Description Resource Codes Object Codes2015-16
Estimated Actuals2016-17Budget
PercentDifference
G. ASSETS
1) Cash
a) in County Treasury 9110 0.00
1) Fair Value Adjustment to Cash in County Treasury 9111 0.00
b) in Banks 9120 0.00
c) in Revolving Fund 9130 0.00
d) with Fiscal Agent 9135 0.00
e) collections awaiting deposit 9140 0.00
2) Investments 9150 0.00
3) Accounts Receivable 9200 0.00
4) Due from Grantor Government 9290 0.00
5) Due from Other Funds 9310 0.00
6) Stores 9320 0.00
7) Prepaid Expenditures 9330 0.00
8) Other Current Assets 9340 0.00
9) Fixed Assets
a) Land 9410 0.00
b) Land Improvements 9420 0.00
c) Accumulated Depreciation - Land Improvements 9425 0.00
d) Buildings 9430 0.00
e) Accumulated Depreciation - Buildings 9435 0.00
f) Equipment 9440 0.00
g) Accumulated Depreciation - Equipment 9445 0.00
h) Work in Progress 9450 0.00
10) TOTAL, ASSETS 0.00
H. DEFERRED OUTFLOWS OF RESOURCES
1) Deferred Outflows of Resources 9490 0.00
2) TOTAL, DEFERRED OUTFLOWS 0.00

San Francisco UnifiedSan Francisco County
July 1 BudgetSelf-Insurance FundExpenses by Object
38 68478 0000000Form 67
California Dept of EducationSACS Financial Reporting Software - 2016.1.0File: fund-e (Rev 03/09/2016) Page 4 Printed: 6/23/2016 5:00 PM
Description Resource Codes Object Codes2015-16
Estimated Actuals2016-17Budget
PercentDifference
I. LIABILITIES
1) Accounts Payable 9500 0.00
2) Due to Grantor Governments 9590 0.00
3) Due to Other Funds 9610 0.00
4) Current Loans 9640
5) Unearned Revenue 9650 0.00
6) Long-Term Liabilities
a) Net Pension Liability 9663 0.00
b) Net OPEB Obligation 9664 0.00
c) Compensated Absences 9665 0.00
d) COPs Payable 9666 0.00
e) Capital Leases Payable 9667 0.00
f) Lease Revenue Bonds Payable 9668 0.00
g) Other General Long-Term Liabilities 9669 0.00
7) TOTAL, LIABILITIES 0.00
J. DEFERRED INFLOWS OF RESOURCES
1) Deferred Inflows of Resources 9690 0.00
2) TOTAL, DEFERRED INFLOWS 0.00
K. NET POSITION
Net Position, June 30
(G10 + H2) - (I7 + J2) 0.00
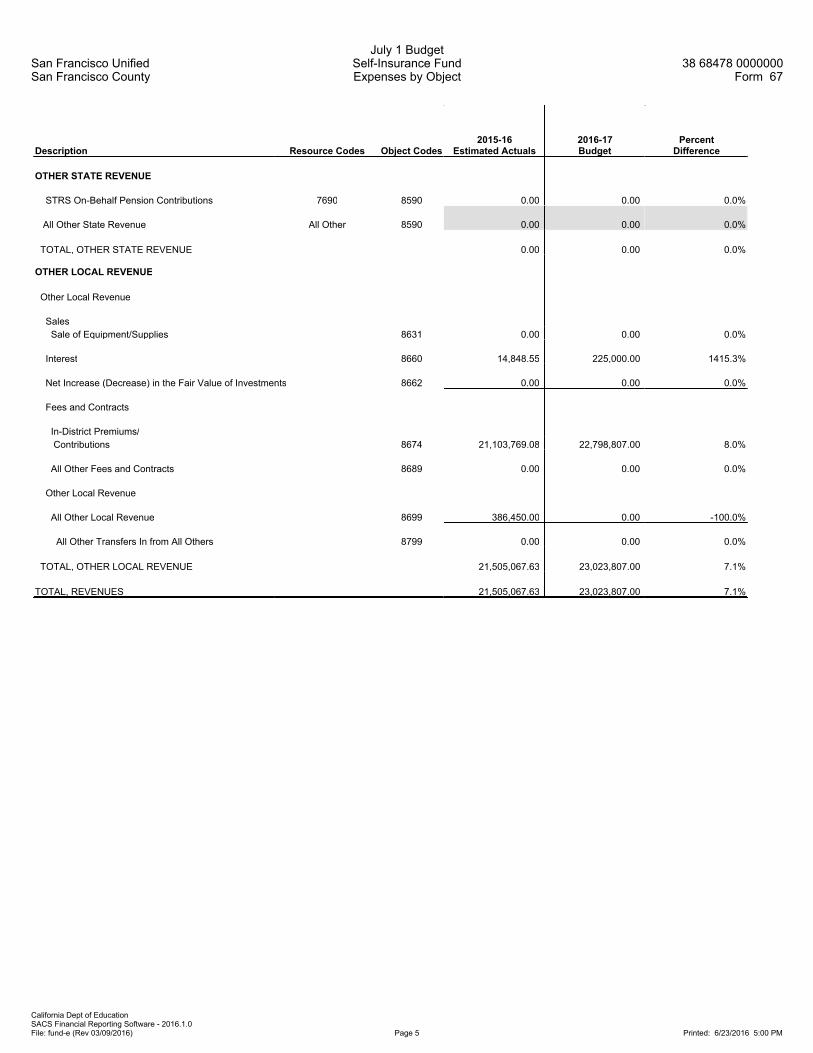
San Francisco UnifiedSan Francisco County
July 1 BudgetSelf-Insurance FundExpenses by Object
38 68478 0000000Form 67
California Dept of EducationSACS Financial Reporting Software - 2016.1.0File: fund-e (Rev 03/09/2016) Page 5 Printed: 6/23/2016 5:00 PM
Description Resource Codes Object Codes2015-16
Estimated Actuals2016-17Budget
PercentDifference
OTHER STATE REVENUE
STRS On-Behalf Pension Contributions 7690 8590 0.00 0.00 0.0%
All Other State Revenue All Other 8590 0.00 0.00 0.0%
TOTAL, OTHER STATE REVENUE 0.00 0.00 0.0%
OTHER LOCAL REVENUE
Other Local Revenue
Sales
Sale of Equipment/Supplies 8631 0.00 0.00 0.0%
Interest 8660 14,848.55 225,000.00 1415.3%
Net Increase (Decrease) in the Fair Value of Investments 8662 0.00 0.00 0.0%
Fees and Contracts
In-District Premiums/
Contributions 8674 21,103,769.08 22,798,807.00 8.0%
All Other Fees and Contracts 8689 0.00 0.00 0.0%
Other Local Revenue
All Other Local Revenue 8699 386,450.00 0.00 -100.0%
All Other Transfers In from All Others 8799 0.00 0.00 0.0%
TOTAL, OTHER LOCAL REVENUE 21,505,067.63 23,023,807.00 7.1%
TOTAL, REVENUES 21,505,067.63 23,023,807.00 7.1%

San Francisco UnifiedSan Francisco County
July 1 BudgetSelf-Insurance FundExpenses by Object
38 68478 0000000Form 67
California Dept of EducationSACS Financial Reporting Software - 2016.1.0File: fund-e (Rev 03/09/2016) Page 6 Printed: 6/23/2016 5:00 PM
Description Resource Codes Object Codes2015-16
Estimated Actuals2016-17Budget
PercentDifference
CERTIFICATED SALARIES
Certificated Pupil Support Salaries 1200 0.00 0.00 0.0%
Certificated Supervisors' and Administrators' Salaries 1300 0.00 0.00 0.0%
TOTAL, CERTIFICATED SALARIES 0.00 0.00 0.0%
CLASSIFIED SALARIES
Classified Support Salaries 2200 0.00 0.00 0.0%
Classified Supervisors' and Administrators' Salaries 2300 533,538.32 532,729.11 -0.2%
Clerical, Technical and Office Salaries 2400 72,056.20 36,732.63 -49.0%
Other Classified Salaries 2900 405,000.00 0.00 -100.0%
TOTAL, CLASSIFIED SALARIES 1,010,594.52 569,461.74 -43.7%
EMPLOYEE BENEFITS
STRS 3101-3102 0.00 0.00 0.0%
PERS 3201-3202 0.00 0.00 0.0%
OASDI/Medicare/Alternative 3301-3302 276,151.10 90,618.62 -67.2%
Health and Welfare Benefits 3401-3402 58,569.02 54,997.60 -6.1%
Unemployment Insurance 3501-3502 515.06 598.90 16.3%
Workers' Compensation 3601-3602 33,043.05 38,467.99 16.4%
OPEB, Allocated 3701-3702 86,450.75 100,661.76 16.4%
OPEB, Active Employees 3751-3752 0.00 0.00 0.0%
Other Employee Benefits 3901-3902 0.00 0.00 0.0%
TOTAL, EMPLOYEE BENEFITS 454,728.98 285,344.87 -37.2%
BOOKS AND SUPPLIES
Books and Other Reference Materials 4200 0.00 0.00 0.0%
Materials and Supplies 4300 2,000.00 2,000.00 0.0%
Noncapitalized Equipment 4400 376,631.99 4,400.00 -98.8%
TOTAL, BOOKS AND SUPPLIES 378,631.99 6,400.00 -98.3%

San Francisco UnifiedSan Francisco County
July 1 BudgetSelf-Insurance FundExpenses by Object
38 68478 0000000Form 67
California Dept of EducationSACS Financial Reporting Software - 2016.1.0File: fund-e (Rev 03/09/2016) Page 7 Printed: 6/23/2016 5:00 PM
Description Resource Codes Object Codes2015-16
Estimated Actuals2016-17Budget
PercentDifference
SERVICES AND OTHER OPERATING EXPENSES
Subagreements for Services 5100 0.00 0.00 0.0%
Travel and Conferences 5200 7,500.00 7,500.00 0.0%
Dues and Memberships 5300 200,000.00 200,000.00 0.0%
Insurance 5400-5450 10,850,000.00 10,975,000.00 1.2%
Operations and Housekeeping Services 5500 0.00 0.00 0.0%
Rentals, Leases, Repairs, and Noncapitalized Improvements 5600 5,000.00 5,000.00 0.0%
Transfers of Direct Costs - Interfund 5750 0.00 0.00 0.0%
Professional/Consulting Services and
Operating Expenditures 5800 9,130,883.58 8,750,000.00 -4.2%
Communications 5900 100.00 100.00 0.0%
TOTAL, SERVICES AND OTHER OPERATING EXPENSES 20,193,483.58 19,937,600.00 -1.3%
DEPRECIATION
Depreciation Expense 6900 0.00 0.00 0.0%
TOTAL, DEPRECIATION 0.00 0.00 0.0%
TOTAL, EXPENSES 22,037,439.07 20,798,806.61 -5.6%

San Francisco UnifiedSan Francisco County
July 1 BudgetSelf-Insurance FundExpenses by Object
38 68478 0000000Form 67
California Dept of EducationSACS Financial Reporting Software - 2016.1.0File: fund-e (Rev 03/09/2016) Page 8 Printed: 6/23/2016 5:00 PM
Description Resource Codes Object Codes2015-16
Estimated Actuals2016-17Budget
PercentDifference
INTERFUND TRANSFERS
INTERFUND TRANSFERS IN
Other Authorized Interfund Transfers In 8919 0.00 0.00 0.0%
(a) TOTAL, INTERFUND TRANSFERS IN 0.00 0.00 0.0%
INTERFUND TRANSFERS OUT
Other Authorized Interfund Transfers Out 7619 0.00 0.00 0.0%
(b) TOTAL, INTERFUND TRANSFERS OUT 0.00 0.00 0.0%
OTHER SOURCES/USES
SOURCES
Other Sources
Transfers from Funds of
Lapsed/Reorganized LEAs 8965 0.00 0.00 0.0%
(c) TOTAL, SOURCES 0.00 0.00 0.0%
USES
Transfers of Funds from
Lapsed/Reorganized LEAs 7651 0.00 0.00 0.0%
(d) TOTAL, USES 0.00 0.00 0.0%
CONTRIBUTIONS
Contributions from Unrestricted Revenues 8980 0.00 0.00 0.0%
Contributions from Restricted Revenues 8990 0.00 0.00 0.0%
(e) TOTAL, CONTRIBUTIONS 0.00 0.00 0.0%
TOTAL, OTHER FINANCING SOURCES/USES
(a - b + c - d + e) 0.00 0.00 0.0%

San Francisco UnifiedSan Francisco County
July 1 BudgetSelf-Insurance FundExpenses by Function
38 68478 0000000Form 67
California Dept of EducationSACS Financial Reporting Software - 2016.1.0File: fund-e (Rev 02/02/2016) Page 1 Printed: 6/23/2016 5:00 PM
Description Function Codes Object Codes2015-16
Estimated Actuals2016-17Budget
PercentDifference
A. REVENUES
1) LCFF Sources 8010-8099 0.00 0.00 0.0%
2) Federal Revenue 8100-8299 0.00 0.00 0.0%
3) Other State Revenue 8300-8599 0.00 0.00 0.0%
4) Other Local Revenue 8600-8799 21,505,067.63 23,023,807.00 7.1%
5) TOTAL, REVENUES 21,505,067.63 23,023,807.00 7.1%
B. EXPENSES (Objects 1000-7999)
1) Instruction 1000-1999 0.00 0.00 0.0%
2) Instruction - Related Services 2000-2999 0.00 0.00 0.0%
3) Pupil Services 3000-3999 0.00 0.00 0.0%
4) Ancillary Services 4000-4999 0.00 0.00 0.0%
5) Community Services 5000-5999 0.00 0.00 0.0%
6) Enterprise 6000-6999 22,037,439.07 20,798,806.61 -5.6%
7) General Administration 7000-7999 0.00 0.00 0.0%
8) Plant Services 8000-8999 0.00 0.00 0.0%
9) Other Outgo 9000-9999Except
7600-7699 0.00 0.00 0.0%
10) TOTAL, EXPENSES 22,037,439.07 20,798,806.61 -5.6%
C. EXCESS (DEFICIENCY) OF REVENUES
OVER EXPENSES BEFORE OTHER
FINANCING SOURCES AND USES (A5 - B10) (532,371.44) 2,225,000.39 -517.9%
D. OTHER FINANCING SOURCES/USES
1) Interfund Transfers
a) Transfers In 8900-8929 0.00 0.00 0.0%
b) Transfers Out 7600-7629 0.00 0.00 0.0%
2) Other Sources/Uses
a) Sources 8930-8979 0.00 0.00 0.0%
b) Uses 7630-7699 0.00 0.00 0.0%
3) Contributions 8980-8999 0.00 0.00 0.0%
4) TOTAL, OTHER FINANCING SOURCES/USES 0.00 0.00 0.0%

San Francisco UnifiedSan Francisco County
July 1 BudgetSelf-Insurance FundExpenses by Function
38 68478 0000000Form 67
California Dept of EducationSACS Financial Reporting Software - 2016.1.0File: fund-e (Rev 02/02/2016) Page 2 Printed: 6/23/2016 5:00 PM
Description Function Codes Object Codes2015-16
Estimated Actuals2016-17Budget
PercentDifference
E. NET INCREASE (DECREASE) IN
NET POSITION (C + D4) (532,371.44) 2,225,000.39 -517.9%
F. NET POSITION
1) Beginning Net Position
a) As of July 1 - Unaudited 9791 20,380,760.35 19,848,388.91 -2.6%
b) Audit Adjustments 9793 0.00 0.00 0.0%
c) As of July 1 - Audited (F1a + F1b) 20,380,760.35 19,848,388.91 -2.6%
d) Other Restatements 9795 0.00 0.00 0.0%
e) Adjusted Beginning Net Position (F1c + F1d) 20,380,760.35 19,848,388.91 -2.6%
2) Ending Net Position, June 30 (E + F1e) 19,848,388.91 22,073,389.30 11.2%
Components of Ending Net Position
a) Net Investment in Capital Assets 9796 0.00 0.00 0.0%
b) Restricted Net Position 9797 0.00 0.00 0.0%
c) Unrestricted Net Position 9790 19,848,388.91 22,073,389.30 11.2%

San Francisco UnifiedSan Francisco County
July 1 BudgetSelf-Insurance Fund
Exhibit: Restricted Net Position Detail38 68478 0000000
Form 67
California Dept of EducationSACS Financial Reporting Software - 2016.1.0File: fund-e (Rev 11/30/2012) Page 1 Printed: 6/23/2016 5:00 PM
2015-16 2016-17
Resource Description Estimated Actuals Budget
Total, Restricted Net Position 0.00 0.00

This Page Is Intentionally Left Blank

Section Break
Insert Tab Here