technical report for the fort knox mine - kinross...
TRANSCRIPT

Technical Report
for the
Fort Knox Mine
Prepared for Kinross Gold Corporation
and
Fairbanks Gold Mining Incorporated
Fairbanks North Star Borough, Alaska, USA
Prepared by:
David Quandt, Chief Mine Engineer Chris Ekstrom, Chief Mine Geologist Klaus Triebel, P. Geo., Senior Mine Geologist
This report has been prepared under the supervision of the qualified person:
R. D. Henderson, P. Eng., Vice-President Technical Services Kinross Gold Corporation. Effective Date: March 31, 2008

Fort Knox Mine Technical Report
2
Certificate of Author
I, Robert Duncan Henderson, P. Eng., residing at 3295 Spruce Avenue, Burlington, ON,
L7N 1J5 do hereby certify that:
• I am employed by Kinross Gold Corporation, 40 King Street West, Toronto, Ontario, Canada, M5H 3Y2, in the capacity of Vice President, Technical Services.
• I am a graduate of the University of Cape Town (1984) with a B.Sc. Chemical Engineering degree and have practiced my profession continuously since 1984.
• I am a member in good standing of the Association of Professional Engineers of Ontario, licence number 100107661.
• I have been involved with the mining industry continuously since my graduation from University and have operating and engineering experience in gold mines located in South Africa, Canada, United States of America, Russia, Brazil and Chile.
• I have read the definition of "qualified person" set out in National Instrument 43-101 ("NI 43-101") and certify that by reason of my education, affiliation with a professional association (as defined in NI 43-101) and past relevant work experience, I fulfill the requirements to be a "qualified person" for the purposes of NI 43 -101.
• I am responsible for the supervision of the preparation of the “Technical Report for the Fort Knox Mine”, dated March 31, 2008. I have read National Instrument 43-101 and Form 43-101F1, and the technical report has been prepared in accordance with this instrument.
• I have personally visited the mine site on several occasions from 2004 to 2007. The most recent visit was in November, 2007.
• As of the date of this certificate, to the best of my knowledge and belief, the technical report contains all the scientific and technical information that is required to be disclosed to make the technical report not misleading.
• I have not had prior involvement with the property that is the subject of the technical report.
• I am not independent of the issuer. Per section 5.3.2 of National Instrument 43-101 an independent qualified person was not required to write the technical report on the Fort Knox Mine.
Fort Knox Mine Technical Report
3
Dated this 31st day of March, 2008 at Toronto, Canada.
“Signed and Sealed”
Robert Henderson, P.Eng., Vice President, Technical Services, Kinross Gold Corporation

Fort Knox Mine Technical Report
4
TABLE OF CONTENTS
1.0 Summary....................................................................................................8 2.0 Introduction and Terms of Reference.......................................................12
2.1 Terms of Reference .....................................................................12 2.2 Sources of Data and Information Contained in Report.................13 2.3 Field Involvement of the Qualified Person ...................................13
3.0 Reliance on Other Experts .......................................................................14 3.1 Other Experts...............................................................................14 3.2 Independent Audit ........................................................................14
4.0 Property Description and Location ...........................................................15 4.1 Fort Knox Open Pit ......................................................................15 4.2 Gil Property ..................................................................................16 4.3 True North Open Pit .....................................................................16
5.0 Accessibility, Climate, Local Resources, Infrastructure and Physiography ......................................................................................................20 6.0 History......................................................................................................22 7.0 Geological Setting ....................................................................................25 8.0 Deposit Type ............................................................................................27 9.0 Mineralization ...........................................................................................28
9.1 Fort Knox Deposit ........................................................................28 10.0 Exploration ...............................................................................................32 11.0 Drilling ......................................................................................................34 12.0 Sampling Method and Approach ..............................................................37
12.1 Reverse Circulation......................................................................37 12.1.1 Reverse Circulation - Dry Samples ......................................37 12.1.2 Reverse Circulation - Wet Samples......................................38
12.2 Core Samples ..............................................................................38 12.3 Sample Composite Summary ......................................................38
13.0 Sample Preparation, Analyses and Security ............................................40 13.1 Quality Control, Quality Assurance ..............................................40 13.2 Check Assays ..............................................................................40 13.3 Blanks Program ...........................................................................41 13.4 Field Duplicates Program.............................................................42 13.5 Standards.....................................................................................42 13.6 Sample Security...........................................................................44
14.0 Data Verification.......................................................................................45

Fort Knox Mine Technical Report
5
14.1 Drill Hole Data Rejection..............................................................45 15.0 Adjacent Properties..................................................................................47 16.0 Mineral Processing and Metallurgical Testing ..........................................48
16.1 Fort Knox Mill Facility ...................................................................48 16.1.1 Milling Methods and Capacity ..............................................48 16.1.2 Mill Recovery – Fort Knox Deposit .......................................49 16.1.3 Mill Recovery – True North Deposit......................................49
16.2 Fort Knox Heap Leach Facility .....................................................50 16.2.1 Heap Leach Methods and Capacity .....................................50 16.2.2 Heap Leach Recovery – Fort Knox Deposit .........................51
16.3 Past Considerations.....................................................................51 16.3.1 True North ............................................................................51 16.3.2 Fort Knox..............................................................................51
17.0 Mineral Resource and Reserve Estimates ...............................................52 17.1 Mineral Resource and Reserve Statement ..................................52 17.2 Fort Knox Deposit - Modeling Methodology .................................53
17.2.1 Overview ..............................................................................53 17.2.2 Survey Data .........................................................................54 17.2.3 Assay Grade Capping ..........................................................54 17.2.4 Drill hole Compositing ..........................................................54 17.2.5 Block Model..........................................................................56 17.2.6 Lithology...............................................................................57 17.2.7 Domains ...............................................................................58 17.2.8 Variography..........................................................................58 17.2.9 Interpolation Methodology ....................................................59 17.2.10 Search Parameters ..............................................................59 17.2.11 Specific Gravity - Tonnage Factors ......................................60 17.2.12 Dilution .................................................................................60 17.2.13 Metallurgical Recovery .........................................................62 17.2.14 Model Checks ......................................................................62 17.2.15 Resource and Reserve Classification...................................62
17.3 Pit Optimization............................................................................63 17.4 Production Reconciliation.............................................................64
18.0 Other Relevant Data and Information.......................................................66 19.0 Interpretations and Conclusions...............................................................67 20.0 Recommendations ...................................................................................68 21.0 References...............................................................................................69

Fort Knox Mine Technical Report
6
22.0 Date and Signature Page.........................................................................72 23.0 Additional Requirements for Technical Reports on Production Properties ...........................................................................................................73
23.1 Fort Knox Mining Operations .......................................................73 23.1.1 Mine Equipment ...................................................................73 23.1.2 Mine Life Plan ......................................................................74 23.1.3 Other Considerations ...........................................................75
23.2 Recoverability ..............................................................................76 23.3 Markets ........................................................................................76 23.4 Contracts......................................................................................77 23.5 Environmental Considerations .....................................................77 23.6 Taxes ...........................................................................................77 23.7 Capital and Operating Cost Estimates .........................................78 23.8 Economic Analyses......................................................................78 23.9 Payback .......................................................................................79 23.10 Mine Life and Production Schedule .............................................79

Fort Knox Mine Technical Report
7
LIST OF TABLES
Table 1-1: Proven and Probable Mineral Reserve Summary..........................................10
Table 1-2: Measured and Indicated Mineral Resource Summary...................................10
Table 4-1: Mineral Title Summary ...................................................................................17
Table 12-1: Composite Summary Table .........................................................................39
Table 16-1: Grade Recovery Relationship - Fort Knox Mine ..........................................49
Table 17-1: Mineral Reserve Summary as of December 31, 2007 .................................53
Table 17-2: Mineral Resource Summary as of December 31, 2007 ...............................53
Table 17-3: Variogram Parameters.................................................................................61
Table 17-4: Classification Parameter Criteria .................................................................63
Table 17-5: Ore Reconciliation for 2007 .........................................................................65
Table 23-1: Estimated Operating Costs – Fort Knox ......................................................78
Table 23-2: Fort Knox Life of Mine Capital Spending .....................................................78
Table 23-3: Fort Knox Life of Mine Plan Production Schedule .......................................79
LIST OF FIGURES
Figure 4-1: Fort Knox Project - General Location and Land Position Plan .....................18
Figure 4-2: Fort Knox Project - General Site Compilation Plan.......................................19
Figure 7-3: Regional Geology .........................................................................................26
Figure 9-1: Fort Knox Deposit – General Geology..........................................................31
Figure 11-1: Drill Hole Location Plan – Fort Knox Deposit Area .....................................34
Figure 17-1: Histogram – 5ft Uncapped Exploration Data used in 2007 Modeling .........55
Figure 17-2: Histogram – 5ft Capped Exploration Data used in 2007 Modeling .............55
Figure 17-3: Fort Knox Mine – Composite Sample Statistics..........................................56
Fort Knox Mine Technical Report
8
1.0 SUMMARY
This report has been prepared for Kinross Gold Corporation and Fairbanks Gold Mining
Inc. to fulfill the requirements of National Instrument 43-101 as they relate to the
estimation and reporting of mineral reserves and mineral resources situated on
properties owned or controlled by Kinross Gold Corporation (Kinross) and its subsidiary
Fairbanks Gold Mining, Incorporated (FGMI) in the Fairbanks mining district, Fairbanks
North Star Borough, Alaska USA. The report covers the period from January 1, 2007
through December 31, 2007. Information disclosed prior to this date is covered in
previous Technical reports that are located on SEDAR (sedar.com).
Kinross is the owner of the Fort Knox mine located in Fairbanks North Star Borough,
Alaska. The Fort Knox mine includes the main Fort Knox open pit mine, mill, heap leach
and tailings storage facility, and an 80% ownership interest in the Gil property that is
subject to a joint venture agreement with Teryl Resources Corp (“Teryl”), and the True
North open pit mine (mining is currently suspended).
Fort Knox is located 40 kilometres (25 miles) by road, northeast of the city of Fairbanks,
Alaska. Kinross’ mining and exploration properties are located within the Fairbanks
mining district, a northeast trending belt of lode and placer gold deposits that comprise
one of the largest gold producing areas in the state of Alaska.
The Fairbanks district is situated in the north-western part of a geologic formation called
the Yukon – Tanana Terrane (“YTT”). The YTT consists of a thick sequence of poly-
metamorphic rocks that range from Precambrian to upper Palaeozoic. The dominant
rock types in the district are gray to brown, fine-grained micaceous schist and micaceous
quartzite known as the Fairbanks Schist. The Cleary Sequence, consisting of bimodal
metarhyolite and meta-basalt with actinolite schist, chlorite schist, graphite schist, and
impure marbles, is intercalated with the Fairbanks Schist. Higher grade metamorphic
rocks of the Chatanika Terrane are thought to be middle Palaeozoic to Ordovician and
they outcrop in the northern part of the district. Granodiorite to granite igneous bodies
intrude YTT rocks.
Fort Knox Mine Technical Report
9
The mineral deposits are generally situated in a northeast trending, structurally complex
zone characterized by a series of folds, shear zones, high angle faults, and occasional
low angle faults. Northeast striking high angle faults influence the location of gold
deposits.
The Fort Knox gold deposit is hosted by a granitic body that intruded the Fairbanks
Schist. The surface exposure of the intrusive body is approximately 1,100 meters in the
east-west direction and 600 meters north-south. Gold occurs in and along the margins
of pegmatite veins, quartz stockwork veins and veinlets, quartz-veined shear zones, and
fractures within the granite. The stockwork veins strike predominantly east and dip
randomly. Stockwork vein density decreases with depth. Shear zones generally strike
northwest and dip moderately to the southwest. Gold mineralization in the quartz-filled
shears is distributed relatively evenly, and individual gold grains are generally less than
100 microns in size. The gold occurrences have a markedly low (less than 0.10%)
sulphide content.
The True North gold deposit is located in the Chatanika Terrane. Gold is hosted in mafic
to felsic schists and is frequently accompanied by carbon and carbonate alteration in
sheared or otherwise structurally prepared zones. The gold is very fine grained, and is
closely associated with pyrite, arsenopyrite, and stibnite in the unoxidized zones. It
occurs in quartz veins, and in altered and brecciated rocks. There appears to be a direct
relationship between veining and gold content, as weakly veined rocks generally carry
lower gold values.
The Fort Knox deposit provides feed for the mill, a modern carbon-in-pulp gold extraction
plant with a 32,658 to 45,359 (36,000 to 50,000 short tons) tonne per day capacity. A
heap leach facility is currently under construction. The leach pad is designed to receive
32,658 to 45,359 tonnes per day (36,000 to 50,000 short tons) from the pit and
stockpiles starting in the 3rd quarter of 2009.

Fort Knox Mine Technical Report
10
FGMI controls an extensive property position, which covers the Fort Knox gold deposit
and extensions of the mineralized zones. The Company has exploration and
development drilling programs on the property. Kinross’ regional exploration within the
Fairbanks district totalled $1.4 million in 2006 and $4.4 million in 2007.
At the end of 2007, FGMI had identified mineral reserves and mineral resources for the
deposit as shown in Tables 1-1 and 1-2. Table 1-1 summarizes the Proven and
Probable Mineral Reserves for Fort Knox as of December 31, 2007 using an assumed
gold price of $550 US per ounce.
Table 1-1: Proven and Probable Mineral Reserve Summary
Proven Probable Proven and Probable Source Tonnes Grade Tonnes Grade Tonnes Grade (,000) (g/t) (,000) (g/t) (,000) (g/t) Mine 31,498 0.69 104,098 0.59 135,596 0.61 Stockpile 105,319 0.35 105,319 0.35 TOTAL 136,817 0.43 104,098 0.59 240,915 0.50
In addition to the above noted mineral reserves, Measured and Indicated Mineral
Resources as of December 31, 2007 at an assumed gold price of $625 US are
summarized in Table 1-2. The Gil and True North projects contain resources included in
this table, but contain no mineral reserves.
Table 1-2: Measured and Indicated Mineral Resource Summary
Measured Indicated Measured & Indicated Deposit Tonnes Grade Tonnes Grade Tonnes Grade
(,000) (g/t) (,000) (g/t) (,000) (g/t) Gil (80%) 2,838 1.03 2,838 1.03True North 3,646 1.49 3,646 1.49Fort Knox 2,664 0.67 26,643 0.59 29,307 0.60Fort Knox Area 2,664 0.67 33,127 0.73 35,791 0.72
The Fort Knox area also hosts an Inferred Mineral Resource of 2.128 million tonnes
averaging 0.55 g/tonne Au at the same $625 US per ounce gold price. The majority
(2.108 million tonnes) of this material is contained at the Fort Knox deposit.

Fort Knox Mine Technical Report
11
Fort Knox is mined as a conventional truck and shovel open pit mine. The deposit has
yielded slightly less than 163 million tonnes (179.6 M tons) of ore containing 4.61 million
ounces of gold since 1996.
Production experience indicates the current mineral resource and reserve models are
within a marginally acceptable tolerance of variance for both tonnage and grade of the
deposit when compared to surveyed mine production. The reconciliation showed that the
mineral model estimated total ore tones, grade and ounces to be less (2.4%, 9.4% and
12.1% respectively) than the ore control model revealed. Over the two-year period
consisting of 2006 and 2007 (not depicted), the mineral model underestimated total
ounces by 4.7%.
FGMI’s Life of Mine Plan (LMP) was based on the design pit and Proven and Probable
Mineral Reserves at a $550.00 per ounce US gold price assumption. The LMP indicates
the Fort Knox deposit host sufficient mineral reserves to support a seven year mine life.
Pit production will continue from 2008 through 2014 at the Fort Knox deposit. Thereafter,
re-handling of low-grade stockpiles to the leach pad will occur until early 2019. The LMP
specifies an annual production rate from the pit of 39.5 million tonnes, including 135.6
million tonnes of mill and leach ore averaging 0.61 g/tonne Au. Mill recoveries are
estimated at 85% during the life of mine, and long-term leach recoveries are estimated
to be 65%. FGMI estimated both operating and capital cost requirements in support of
the LMP. The financial analysis indicates a positive cash flow. The LMP, cost estimates,
budgets and financial analysis have been prepared using industry standard procedures
and assumptions. The authors of this report have reviewed these documents and found
them to be complete and free of gross errors or omissions. FGMI considers these
documents to be confidential in nature and therefore, are not incorporated into the body
of this report. Individuals requiring access to said documents are required to sign a
confidentiality agreement with Kinross Gold Corporation.
The qualified person is of the opinion that this document supports the December 2007
Fort Knox and Area Mineral Resource and Reserve Statement.

Fort Knox Mine Technical Report
12
2.0 INTRODUCTION AND TERMS OF REFERENCE
2.1 Terms of Reference
This report has been prepared for Kinross Gold Corporation and Fairbanks Gold Mining
Inc. to fulfill the requirements of National Instrument 43-101 as they relate to the
estimation and reporting of mineral reserves and mineral resources situated on
properties owned or controlled by Kinross Gold Corporation (Kinross) and its subsidiary
Fairbanks Gold Mining, Incorporated (FGMI) in the Fairbanks mining district, Fairbanks
North Star Borough, Alaska USA. The report covers the period from January 1, 2007
through December 31, 2007. Information disclosed prior to this date is covered in
previous Technical reports that are located on SEDAR (sedar.com).
The FGMI Technical Services staff involved in the preparation of the mineral reserve and
mineral resource estimates cited in the report are, David Quandt, Chief Mine Engineer,
Chris Ekstrom, Chief Mine Geologist, and Klaus Triebel, P. Geo., Senior Mine Geologist.
These individuals have been regularly involved in the day-to-day activities related to
exploration, development, mineral reserve and resource estimation and production of
FGMI’s properties in the Fairbanks mining district during 2007.
The mineral reserve and mineral resource estimates cited in this report were classified in
conformance within the meanings ascribed by the Canadian Institute of Mining,
Metallurgy, and Petroleum CIM Standards on Mineral Resources and Reserves
Definitions and Guidelines.
Conversion of mine data to metric equivalents used the following conversion factors:
Tons to tonnes multiply by 0.9072
Oz / ton to g/tonne multiply by 34.2857
Remaining units of measure (distance, area, etc,) unless otherwise noted are presented
in both metric and English units of measure.

Fort Knox Mine Technical Report
13
2.2 Sources of Data and Information Contained in Report
The mineral resource and mineral reserve estimates reported in this document were
prepared using technical information from the files of FGMI. Previous owners of the Fort
Knox property developed assay and geologic data, which FGMI has reviewed. The
majority of information used in the estimates was collected during exploration and
development drilling programs performed by FGMI and from data developed by
contractors who conducted studies under FGMI’s supervision. A number of other
sources of information have been used in the compilation of this report and a complete
list of references is provided in Section 21 of this report.
2.3 Field Involvement of the Qualified Person
This report has been prepared under the supervision of R. Henderson, P. Eng, Vice-
President Technical Services, Kinross Gold Corporation. R. Henderson has been
associated with the Fort Knox Mine since 2004 and has visited the site on several
occasions during that time frame, including most recently in November 2007.

Fort Knox Mine Technical Report
14
3.0 RELIANCE ON OTHER EXPERTS
3.1 Other Experts
Mineral Resource Development, Inc. (MRDI) of San Mateo, California assisted in the
resource modelling through 2001. Fairbanks Gold Mining Inc. and Kinross Technical
Services staff developed the 2007 model reserve and resource methodology.
Diligent care has been taken in the preparation of this report and the authors are
confident about the accuracy of supporting studies not prepared under their direct
supervision. While the authors did not supervise the preparation of reports relating to
reserve estimation techniques prior to 2004, geotechnical studies, or any drilling and
assaying prior to 2004, they have examined the reports and supporting data and have
concluded that the information, conclusions and recommendations are reasonable.
Accordingly, the authors are confident that report recommendations and conclusions are
suitable for use in the preparation of the appropriate sections of this report.
3.2 Independent Audit
Roscoe Postle Associates Inc. (RPA) was retained by Kinross Gold Corporation to
independently audit the December 31, 2004 Mineral Resource and Mineral Reserve
estimates of the Fort Knox operation. RPA did not identify any significant “fatal flaws” in
the Fort Knox resource and given the knowledge and understanding that FGMI has
accumulated with the operation, RPA expects that the Fort Knox Proven and Probable
Mineral Reserves will likely represent a reasonable global estimate of the total in-situ
gold reserves.

Fort Knox Mine Technical Report
15
4.0 PROPERTY DESCRIPTION AND LOCATION
The Fort Knox mine is situated in the Fairbanks North Star Borough in the State of
Alaska, United States of America. Fort Knox is located 40 kilometres (25 miles) by road
northeast of the city of Fairbanks, Alaska. Figure 4-1 is a general location map of the
Fort Knox property.
The Company controls a large and diverse group of properties that comprise its mineral
holdings in the Fairbanks mining district. These properties include patented and
unpatented Federal lode and placer mining claims and State of Alaska mining claims.
Some of the claims are owned outright, while others are controlled through leases and/or
joint venture agreements. Figure 4-1 presents FGMI’s land position within the Fairbanks
Gold Mining District. The blue shaded areas represent the company’s holdings. The
Fort Knox Uplands Mining Lease has been legally surveyed.
4.1 Fort Knox Open Pit
At the Fort Knox project, the Company controls 1,316 State of Alaska mining claims
covering an area of approximately 19,180 hectares (47,396 acres), an additional 502
hectares (1,239.5 acres) of mineral rights comprised of an Upland Mineral Lease issued
by the State of Alaska, a Millsite Lease (issued by the State of Alaska), and one
unpatented (federal) lode mine claim. Cumulatively, these properties cover an area of
approximately 19,682 hectares (48,636 acres). Mineral reserves at the Fort Knox mine
are situated on 505 hectares (1,248 acres) of land that are covered by a State of Alaska
Millsite Lease. Although this lease expires in 2014, it may be renewed for a period not to
exceed 55 years. The property package is located within the State of Alaska within UTM
NAD 27 zone 6 coordinates of 474,950mE, 7,195,700mN and 495,700mE, 7,215,300mN
as illustrated in Figure 4-1.
The State of Alaska Millsite Lease carries a 3% production royalty, based on net income
and recovery of the initial capital investment. Mineral production from State mining
claims is subject to a Mine License Tax, following a three-year grace period after

Fort Knox Mine Technical Report
16
production commences. The license tax ranges from 3% to 7% of taxable income.
There has been no production from State claims situated outside the boundaries of the
Millsite Lease at the Fort Knox mine.
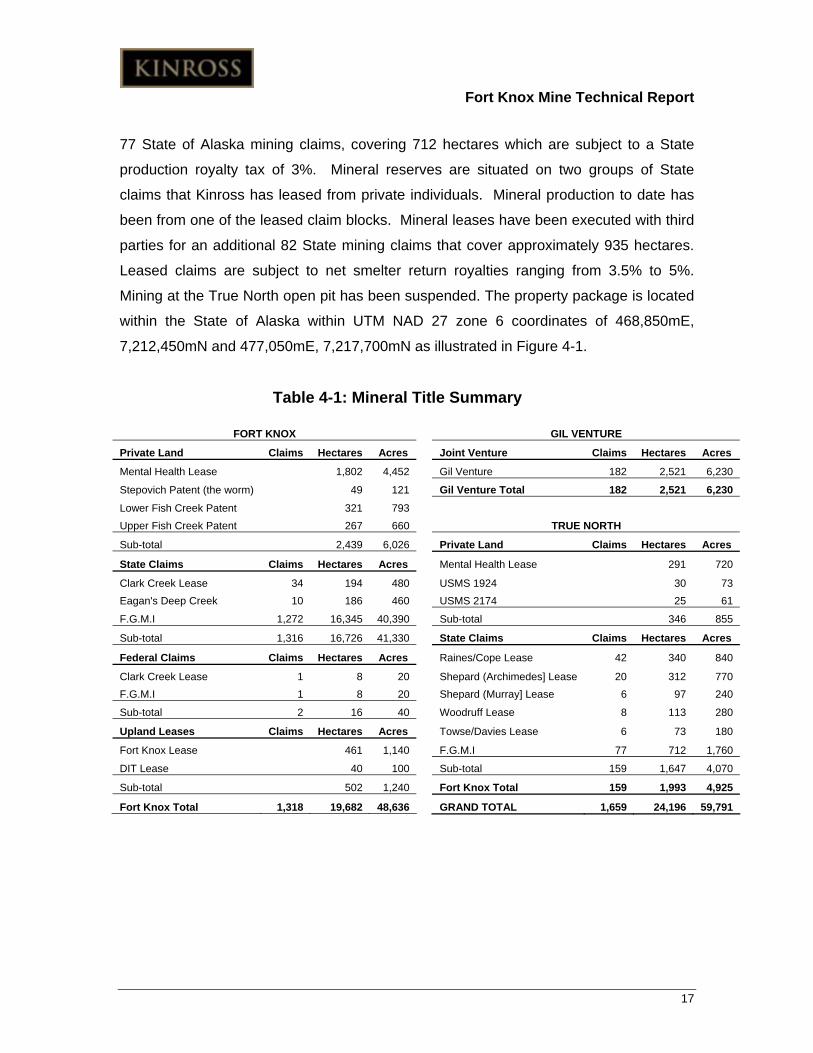
A brief summary of the mineral title is shown below in Table 4-1. Kinross maintains a
current detailed listing of all Fort Knox Title and Ownership documents [Refer to Hansen,
2008 “Mother of All Lists” 11th edition, 1/2008]. This document is available from Kinross
upon request. The unpatented federal lode claim is owned by Kinross and is not
currently subject to any royalty provisions. As a result of high metal prices, Kinross
royalties and production taxes are estimated at $3.3 million for 2007 compared to $2.2
million in 2006.
All requisite permits have been obtained for mining and continued development of the
existing Fort Knox open pit mine and are in good standing. All federal and state
permits were received for the Heap Leach on or before October 31, 2007 at that time
construction commenced on the project.
4.2 Gil Property
The Gil property mineral claims cover approximately 2,521 hectares located contiguous
to the Fort Knox claim block. The claim block consists of 182 State of Alaska mining
claims and is subject to a joint venture agreement between Kinross and Teryl. Kinross’
ownership interest in the Gil claim block is 80%. All production from the State of Alaska
mining claims is subject to the State of Alaska Mine License Tax following a three-year
tax grace period after production commences. The State of Alaska Mine License tax is
graduated from 3% to 7% of taxable income. Kinross continues to actively explore the
Gil claims. The property package is located within the State of Alaska within UTM NAD
27 zone 6 coordinates of 485,800mE, 7,204,800mN and 498,600mE, 7,212,400mN as
illustrated in Figure 4-1.
4.3 True North Open Pit
The True North open pit mine mineral claims and leases cover approximately 1,993
hectares, located 43 kilometres northeast of the City of Fairbanks, Alaska. Kinross owns
Fort Knox Mine Technical Report
17
77 State of Alaska mining claims, covering 712 hectares which are subject to a State
production royalty tax of 3%. Mineral reserves are situated on two groups of State
claims that Kinross has leased from private individuals. Mineral production to date has
been from one of the leased claim blocks. Mineral leases have been executed with third
parties for an additional 82 State mining claims that cover approximately 935 hectares.
Leased claims are subject to net smelter return royalties ranging from 3.5% to 5%.
Mining at the True North open pit has been suspended. The property package is located
within the State of Alaska within UTM NAD 27 zone 6 coordinates of 468,850mE,
7,212,450mN and 477,050mE, 7,217,700mN as illustrated in Figure 4-1.
Table 4-1: Mineral Title Summary
FORT KNOX GIL VENTURE
Private Land Claims Hectares Acres Joint Venture Claims Hectares Acres
Mental Health Lease 1,802 4,452 Gil Venture 182 2,521 6,230
Stepovich Patent (the worm) 49 121 Gil Venture Total 182 2,521 6,230 Lower Fish Creek Patent 321 793 Upper Fish Creek Patent 267 660 TRUE NORTH
Sub-total 2,439 6,026 Private Land Claims Hectares Acres
State Claims Claims Hectares Acres Mental Health Lease 291 720
Clark Creek Lease 34 194 480 USMS 1924 30 73 Eagan's Deep Creek 10 186 460 USMS 2174 25 61
F.G.M.I 1,272 16,345 40,390 Sub-total 346 855
Sub-total 1,316 16,726 41,330 State Claims Claims Hectares Acres
Federal Claims Claims Hectares Acres Raines/Cope Lease 42 340 840
Clark Creek Lease 1 8 20 Shepard (Archimedes] Lease 20 312 770 F.G.M.I 1 8 20 Shepard (Murray] Lease 6 97 240
Sub-total 2 16 40 Woodruff Lease 8 113 280
Upland Leases Claims Hectares Acres Towse/Davies Lease 6 73 180
Fort Knox Lease 461 1,140 F.G.M.I 77 712 1,760
DIT Lease 40 100 Sub-total 159 1,647 4,070
Sub-total 502 1,240 Fort Knox Total 159 1,993 4,925
Fort Knox Total 1,318 19,682 48,636 GRAND TOTAL 1,659 24,196 59,791

Fort Knox Mine Technical Report
18
Figure 4-1: Fort Knox Project - General Location and Land Position Plan
Fort Knox Mine Technical Report
19
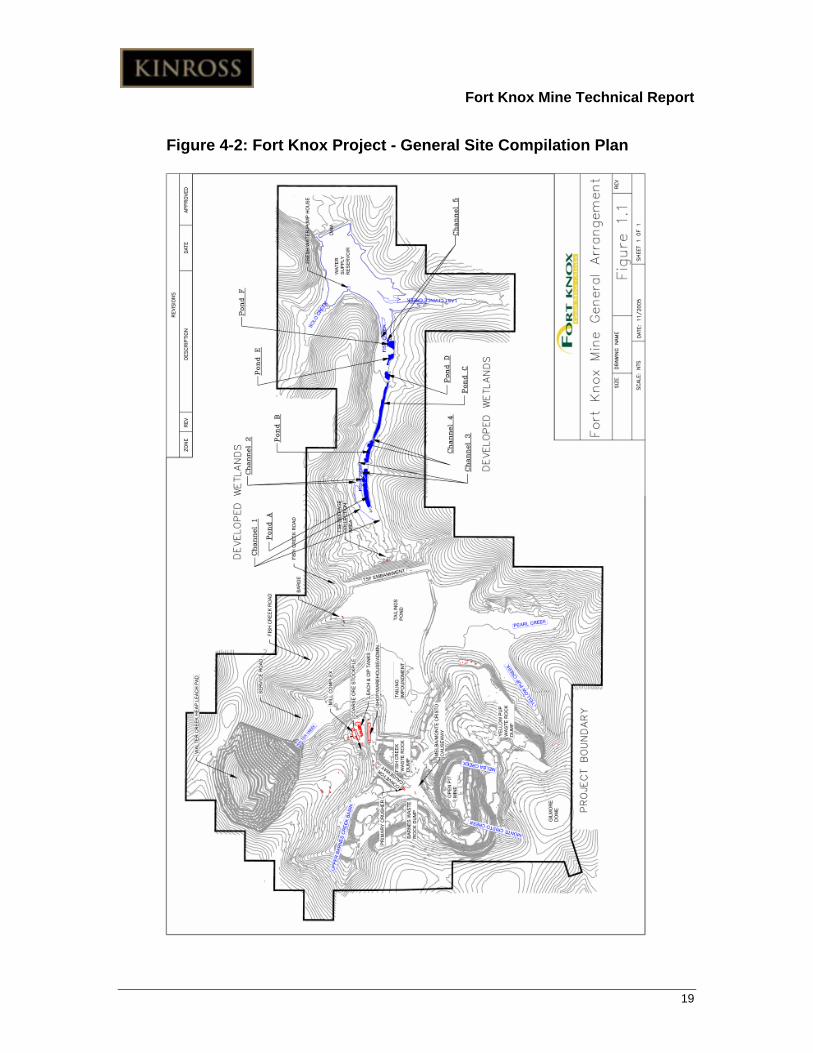
Figure 4-2: Fort Knox Project - General Site Compilation Plan

Fort Knox Mine Technical Report
20
5.0 ACCESSIBILITY, CLIMATE, LOCAL RESOURCES, INFRASTRUCTURE AND PHYSIOGRAPHY
The Company’s mineral prospects and mining operations are situated in close proximity
to the City of Fairbanks, which is a major center for the Interior region of Alaska.
Fairbanks is the second largest city in Alaska, and has an estimated population of more
than 35,000. The surrounding areas of the Fairbanks North Star Borough have a further
40,000 to 50,000 residents. Fairbanks is served by major airlines and the Alaska
Railroad, and is connected to Anchorage and Canada by a series of well-maintained
paved highways. Services, supplies, and energy (fuel and electricity) are available in
Fairbanks in ample quantities to support the local and regional needs, along with the
mining and processing operations of FGMI.
The Fairbanks mining district is an arcuate belt of placer and lode gold deposits that is
more than 64 kilometres (40 miles) long and about 13 kilometres (8 miles) wide. The
district is situated within the northern foothills of the Tanana Valley of central Alaska. The
south-western part of the mining district is located about 18 kilometres (11 miles) west of
the city of Fairbanks and the north-eastern extremity of the district is approximately 48
kilometres (30 miles) to the northeast. The area has generally good access, with
numerous all-weather paved highways and gravel roads maintained by the Fairbanks
North Star Borough and the State of Alaska.
The mining district is a region of low hills and broad valleys occupied by meandering
streams. The hills are generally rounded with gentle slopes and irregular ridge patterns.
The meandering ridgelines are the result of numerous gulches and streams that cut the
flanks of hills. The most prominent topographic features include Ester Dome, located in
the western part of the district at 720 meters (2,364 feet) above sea level, and Pedro
Dome, situated in the north-eastern part of the area at 609 meters (2,000 feet) above
sea level.
The Fairbanks area has a sub-arctic climate, with long cold winters and short summers.
Winter low temperatures drop to the range of –40 F to –55 F, while in the summer, highs

Fort Knox Mine Technical Report
21
may occasionally exceed +90 F. The annual precipitation in Fairbanks is approximately
30.5 centimetres (12 inches). Typically, inclement weather conditions, such as
temperature inversions or slippery road surfaces, will only negatively impact production
in the open pit for portions of a few shifts in any given year.
The Fort Knox milling operation obtains its process makeup water from a fresh water
reservoir located within the permitted property area. The tailings storage area on site
and is under review for storage capacity for the remaining mine life of the Fort Knox.
Power is provided to the mine by Golden Valley Electric Association’s power grid serving
the area over a distribution line paid for by Kinross.
Fort Knox Mine Technical Report
22
6.0 HISTORY
The Fort Knox area was actively explored for gold placer deposits since 1902 when Felix
Pedro discovered gold in Fish Creek located downstream of the Fort Knox deposit.
Since that initial discovery, the surrounding Fairbanks Mining district has produced in
excess of 8 million ounces of gold, predominantly from placer deposits. Placer mining
operations continue to this day.
Exploration for lode gold deposits was very limited during the early history of the region
and focused on tracing the source of the placer deposits up headwaters and tributaries
to Fish Creek. Alfred Brooks mapped the area while working for the United States
Geological Survey (USGS) in the early 1900’s. Brooks’ mapping described a large
granitic intrusive within the project area. In the 1968 Final Report for Mineral Resources
of Northern Alaska, L.A. Heiner and E.N. Wolff noted that the great amount of placer
gold in the Fairbanks District led many workers to conclude that only the roots of the
gold veins were left and that there was not enough economic incentive to test the theory
by exploration.
In 1913, H. A. Currier staked lode-mining claims covering auriferous quartz veins on the
Melba Creek-Monte Cristo Creek divide (covering part of what is now the Fort Knox gold
deposit). A three-stamp mill was constructed on the property, but there is little evidence
of any production from the claims. USGS geologists who examined the prospect noted
the association of bismuthinite and gold in quartz veins and suggested a relationship
between the observed mineralization and the large granitic intrusive located nearby.
The claims were dormant until 1980 when two local prospectors, Joe Taylor and George
Johnson staked 19 state mining claims to work placer deposits. Taylor and Johnson
worked the placers of Monte Cristo Creek from 1980 – 1982 and recovered bismuthinite
nuggets containing abundant gold. The demonstrated correlation between the gold and
bismuth led Taylor and Johnson to prospect the slopes and divide between Melba and
Monte Cristo Creeks. The prospecting operations involved panning and trenching, which

Fort Knox Mine Technical Report
23
suggested that gold mineralization was widespread and resulted in the prospectors
staking an additional 34 mining claims.
In 1984, Rob Blakestead, a consulting geologist, noted the presence of visible gold in
quartz veins hosted by granite in the Fort Knox area. This discovery led to increasing
levels of exploration to locate the source of the gold. In 1986, the claims were leased to
Nye Minerals who entered into a joint venture agreement with Electrum Resources in
1987. During 1987 to 1991 numerous small mining companies actively explored the
claims.
The Denver, Colorado based Amax Gold, Inc (AMAX) purchased the Fort Knox project
in 1992 and established Fairbanks Gold Mining (FGMI) as a wholly owned subsidiary to
operate the project. FGMI initiated extensive exploration programs on the property
including surface geochemical sampling, drilling and geophysics.
Soil sampling proved the most useful exploration tool in delineating the ore body during
the initial exploration of the deposit. Later surface trenching and mapping of the
anomalies developed by the soil geochemistry identified the favorable exploration
targets.
Ground magnetometer surveys performed in 1987, 1991 and 1992 were employed with
limited success. 427 drill holes totaling over 262,000 feet were completed on the
property by late 1992. This work was followed by the completion of environmental and
engineering studies examining the feasibility of beginning commercial production from
the deposit.
In 1991, Amax Gold Inc. (now Kinam Gold Inc. (“Kinam”), a subsidiary of Kinross)
entered into a joint venture agreement with Teryl to explore the Gil property. In 1992,
Kinam acquired ownership of the Fort Knox property. Kinross Gold Corporation
acquired the property in 1998 as part of the merger with Amax Gold Inc., which involved
stock exchange with Cyprus.

Fort Knox Mine Technical Report
24
Construction of the Fort Knox mine and mill operations began in 1995 and were
completed in 1997. Commercial production at Fort Knox was achieved in March 1997,
and the property has operated continuously since start up. Construction of the mine was
completed at a capital cost of approximately $373 million, which included approximately
$28 million of capitalized interest.
Fort Knox is mined as a conventional truck and shovel open pit mine. The deposit has
yielded slightly less than 163 million tonnes (179.6 M tons) of ore containing 4.61 million
ounces of gold since 1996.
After acquiring ownership of the True North property in 1999, Kinross completed pre-
production capital expenditures, primarily permitting and the building of a haulage road
to the Fort Knox mill. Commercial production at True North was achieved on April 1,
2001, but is currently suspended.
In 2006, Kinross Gold began negotiations with the National Oceanographic and
Atmospheric Administration (NOAA), the Bureau of Land Management (BLM), and the
State of Alaska’s Trust Land Office (TLO) to acquire a section of land bordering the
existing claim group on the western boundary of the existing Fort Knox pit. Acquisition
of the land package was completed on December 31, 2007, allowing for a Phase 7 pit
expansion.
Fort Knox Mine Technical Report
25
7.0 GEOLOGICAL SETTING
The Fort Knox property is located in the Fairbanks mining district, a southwest–northeast
trending belt of lode and placer gold deposits that comprise one of the largest gold
producing areas in the state of Alaska. The Fairbanks district is situated in the
northwestern part of the Yukon–Tanana - Uplands. The Yukon – Tanana terrane
consists of a thick sequence of poly-metamorphic rocks that range from Precambrian to
upper Paleozoic. The polymetamorphic protoliths were primarily sedimentary, volcanic,
and volcanoclastic units, with only minor plutonic rocks. The region has undergone at
least two periods of dynamo - thermal metamorphism, which included an early prograde
amphibolite event, followed by a retrograde, greenschist facies event (Bundtzen, 1981).
A more complex deformational history identifying four phases of penetrative tectonism
has been suggested by Hall, 1985.
The Fairbanks Schist, which is Proterozoic to lower Paleozoic, is the dominant lithology
in the district. It is composed of quartz-muscovite schist, muscovite-feldspar-quartz
schist, micaceous quartzites, metaconglomerate, garnet - hornblende amphibolite, and
marble, indicative of an emergent shelf environment. The Cleary Sequence consisting
of bimodal meta-rhyolite and meta-basalt with actinolite schist, chlorite schist, graphite
schist, and impure marbles is intercalated with the Fairbanks Schist, indicating immature
rift basins in the shelf environment. Geological work performed in 1996 has led to
reassigning the meta-rhyolite in the Cleary Sequence to the Devonian Muskox
Sequence and placing it in fault contact with the Fairbanks Schist. In the northern part of
the district, metamorphosed rocks of the Chatanika terrane have been identified. The
sequence includes type C eclogites, impure marbles, amphibolites, calc-muscovite
schist, garnet-muscovite schist, and muscovite schist, containing garnet, biotite, chlorite
and graphite. The Chatanika unit in fault contact with the Fairbanks Schist is thought to
be middle Paleozoic to Ordovician and may represent a telescoped, mature rift basin
within the shelf environment. Amphibole from the Chatanika unit yielded an Ordovician
K-Ar date (Robinson, 1990). Figure 7-1 illustrates the location of the Kinross projects
within this geologic setting.

Fort Knox Mine Technical Report
26
Figure 7-3: Regional Geology

Fort Knox Mine Technical Report
27
8.0 DEPOSIT TYPE
The Fort Knox gold deposit is hosted by a granitic body that intruded the Fairbanks
Schist. The surface exposure of the intrusive body is approximately 1,100 meters in the
east-west direction and 600 meters north-south. Several late Cretaceous to early
Tertiary intrusive bodies penetrate the Yukon–Tanana terrane (Blum, 1982). They range
from ultramafic to felsic composition and are distinguished from older intrusive rocks by
their lack of metamorphic textures. The Fort Knox deposit is hosted by one of the west-
northwest trending, late-Cretaceous granitic complexes. The pluton is offset by two
northeast structures, which display left-lateral strike slip movement. These structures,
the Monte-Cristo Fault and Melba Fault, are regional in extent and offset the Gilmore
Dome Pluton south of Fort Knox. The Fort Knox pluton is composed of a light gray, fine
grained granodiorite, medium grained biotite granite, and coarse grained, biotite granite
porphyry, which form blocky bedrock exposures. The diverse textural and chemical
granitic varieties and sharp to gradational intrusive contacts suggest the Fort Knox
pluton is a multi-phase intrusive. The local occurrences of orthoclase megacrysts,
resorbed quartz phenocrysts, and quartz glomero-phenocrysts support that observation.
Crenulated quartz layers (brain rock) and dendritic growths of quartz and potassium
feldspar present in the Fort Knox pluton contacts help to evaluate intrusive paragenesis
(Bakke, 1994).
The mineral deposits are generally situated in a northeast trending, structurally complex
zone characterized by a series of folds, shear zones, high angle faults, and occasional
low angle faults. Northeast striking high angle faults influence the location of gold
deposits. The dominant structural zones in the Yukon-Tanana terrane are the north
bounding Tintina Fault system and the south bounding Denali Fault system. Northeast
trending faults and shear zones within the Yukon-Tanana terrane are related to
movement along these major structures. The northeast structures, which display a
strike-slip displacement, were important to the localization of gold mineralization.

Fort Knox Mine Technical Report
28
9.0 MINERALIZATION
The Fairbanks mining district is a celebrated placer gold camp with production in excess
of 8.0 million ounces of gold since 1902. Although a significant mining district in terms of
total production, it had only limited lode production until the discovery and development
of the Fort Knox deposit in the late 1990’s. The discovery and development of the True
North deposit (Figure 4-1) produced ore for the Fort Knox mill from 2001 to 2004, and
further enhanced the lode production from the district.
Although the regional distribution of gold mineralization in the Fairbanks district is
beyond the scope of this report, the area hosts gold in a variety of geologic settings, as
follows:
• The Fort Knox deposit (the largest lode deposit in the district) is characterized by mineralization in quartz, quartz-sericite and quartz pegmatite veins, stock work zones, and mineralized shear zones;
• True North mineralization is hosted by complexly deformed, carbonaceous meta-sediments associated with quartz veins;
• The Ryan Lode deposit, gold occurs in and adjacent to large-scale shear zones;
• The Gil project, gold is hosted in skarns and quartz veins within the skarns;
• The Cleary Hill mine, gold occurs in quartz veins within the Fairbanks Schist.
9.1 Fort Knox Deposit
The Fort Knox deposit is hosted entirely within the Fort Knox Pluton. The pluton is
elongate and measures approximately 1100m east-west and 600m north-south. Drilling
has identified mineralization to the 400 level which marks the lowest extent of detailed
information. The contact with the Fairbanks schist is abrupt, and drilling indicates the
pluton contacts plunge steeply to the east and moderately to the north, south, and west.
The Fort Knox pluton has been subdivided into three mappable phases based on
textural differences. Intrusion of the biotite-rich fine-grained granite was followed by a
medium-grained porphyritic granite. The youngest intrusive phase is a coarse-grained,

Fort Knox Mine Technical Report
29
seriate porphyritic granite. A volumetrically minor, biotite-hornblende rich phase (mapped
as "mafic"), that commonly displays a medium-grained texture is locally present as
pendants near the schist-granite contact. Bakke (1995) provides whole-rock, trace
element and a classification profile for the three main phases of granite.
Gold-bismuth-tellurium mineralization is restricted to the Fort Knox pluton and is strongly
structurally controlled. Gold occurs within, and along margins of pegmatite veins, quartz
veins and veinlets, within shear zones, and along fractures within the granite. The overall
sulphide content is very low (< 0.1%) and the orebody is oxidized to the depths of the
drilling.
The following is a description of vein types and associated alteration styles found at Fort
Knox (Bakke and others, 1998).
1) Pegmatite veins and veinlets: Range in thickness from micro-scale to 8cm. Composed of clear to gray quartz, large K-spar megacrysts, and micaceous clots. Potassic alteration halos, rarely exceeding 1cm thick, consist of an assemblage of variable amounts of secondary biotite and K-spar overgrowths on primary K-spar within the granite matrix.
2) Pegmatite veins similar to (1) above with alteration envelopes consisting of a variably developed phyllic (sericite + pyrite) assemblage.
3) Quartz veins and veinlets (stockwork): Range in thickness from micro-scale to 15cm. These veins possess thin albitic alteration halos
4) Quartz veins and veinlets similar to (3) above with phyllic alteration envelopes that range in thickness from 0.5-3cm.
5) Low-temperature fracture coatings and chalcedonic veins and breccia: Low temperature assemblage of zeolite + calcite + clay + chalcedony. Pervasive throughout the deposit in the form of fracture coatings and breccia zones. Argillic alteration halos as much as 7m in width are developed adjacent to the larger chalcedonic breccia zones.
Bakke (1995) and McCoy and others (1997) note the strong geochemical correlation of
gold with bismuth and tellurium. Bismuth and tellurium mineral species that have been
identified include: native bismuth, Bi; maldonite, AuBi; bismuthinite, Bi2S3;
tellurobismutite, Bi2Te3; bismite, Bi2O3; tetradymite, Bi2Te2S; and eulytite, Bi4(SiO4)3.
Other ore minerals that are found include trace to minor amounts of molybdenite and
scheelite.

Fort Knox Mine Technical Report
30
The major structural trend controlling vein orientation and mineralization is defined by
southeast-northwest trending, moderately to shallowly southwest dipping shear zones.
The shear zones are typically filled with granulated white quartz, and range in thickness
from 0.3-1.5m. They possess mixed phyllic and argillic alteration assemblages and
contain abundant iron oxide clay gouge along the margins. In the vicinity of the shear
zones, vein density increases and vein orientations are predominantly parallel to the
shear direction. Abundant, Thin, subsidiary shears, are abundant between, and
especially adjacent to, major shears. Figure 9-1 displays the local geology of the Fort
Knox deposit. The plan shows the extent of the granite intrusive with distribution and
orientation of the major shear zones.

Fort Knox Mine Technical Report
31
Figure 9-1: Fort Knox Deposit – General Geology

Fort Knox Mine Technical Report
32
10.0 EXPLORATION
Although the Fairbanks district has produced over 8.0 million ounces since its discovery
in 1902, most of the production has come from auriferous gravels, rather than lode
deposits. Exploration for the lode sources of the placer deposits has been performed
periodically since the discovery of the district with little success from these efforts, until
the 1990’s.
Standard exploration procedures have been utilized at the Fort Knox project as follows:
• Reconnaissance and detailed geologic mapping on topographic maps or aerial photographs at scales that are suitable to display the details of observed geologic features. Geologic mapping on topographic base maps is normally done at a scale of 1 inch = 500 feet, and mapping that is done on aerial photographs is at a scale of 1 inch = 2,000 feet. This work is undertaken by employees of the Company or contract/consulting geologists;
• Soil and rock chip sampling to determine the presence of gold mineralization, or associated trace elements. These samples are regularly collected during the course of geologic mapping programs by either Company employees or contract geologists, under Company supervision;
• Soil anomalies were trenched to create exposures of bedrock. The trenches were cut with bulldozers owned and operated by contracting firms. The trenches were mapped and sampled in detail by either contract geologists or Company personnel;
• Drilling has been the principal exploration tool used by the Company. The two drilling methods used were diamond core and reverse circulation (RC). Company personnel directed the work performed by the independent drilling contractors. Sampling of the drill holes was completed by drill contractor employees, under close supervision of Company or contract geologists;
• Geochemical and assay determinations for gold and associated elements are undertaken by independent commercial laboratories. The Company has utilized the services of three firms – ALS Chemex Laboratories, Bondar-Clegg (now owned by the ALS Chemex group), and Alaska Assay Laboratories. Prior to 2002, the assays for Fort Knox and True North were completed by Bondar-Clegg at their Vancouver, B.C. laboratory. The samples were dried, weighed, crushed, and pulped at the Bondar-Clegg preparation facility in Fairbanks. The duplicate assay and quality control procedures were performed by Chemex in Vancouver. From 2002 to 2005, all assaying was done by ALS Chemex at their Vancouver laboratory, although sample preparation was done at their facility in Fairbanks. In

Fort Knox Mine Technical Report
33
2006 and 2007, primary assays were performed by Alaska Assay Laboratories. Check assay work was performed by American Assay lab of Reno, Nevada from 2003 to 2004; at Alaska Assay Laboratories from late 2004 to 2005; and at the Vancouver laboratory of ALS Chemex in 2006 and 2007.
• Certain aspects of the process of mineral exploration and evaluation have varying degrees of precision. The Company employs methods that will determine the precision of the most critical elements, which are assaying and drill sample reliability. The sample QA/QC (quality assurance/quality control) program is both rigorous and effective. The quality control program is more fully described in Section 11.0 of this report. The Company also utilizes visual, logging, and weight measurement methods to determine if reverse circulation samples are representative of rock penetrated by drill holes.
Kinross’ regional exploration within the Fairbanks district totalled $1.4 million in 2006 and
$4.4 million in 2007.
Fort Knox Mine Technical Report
34
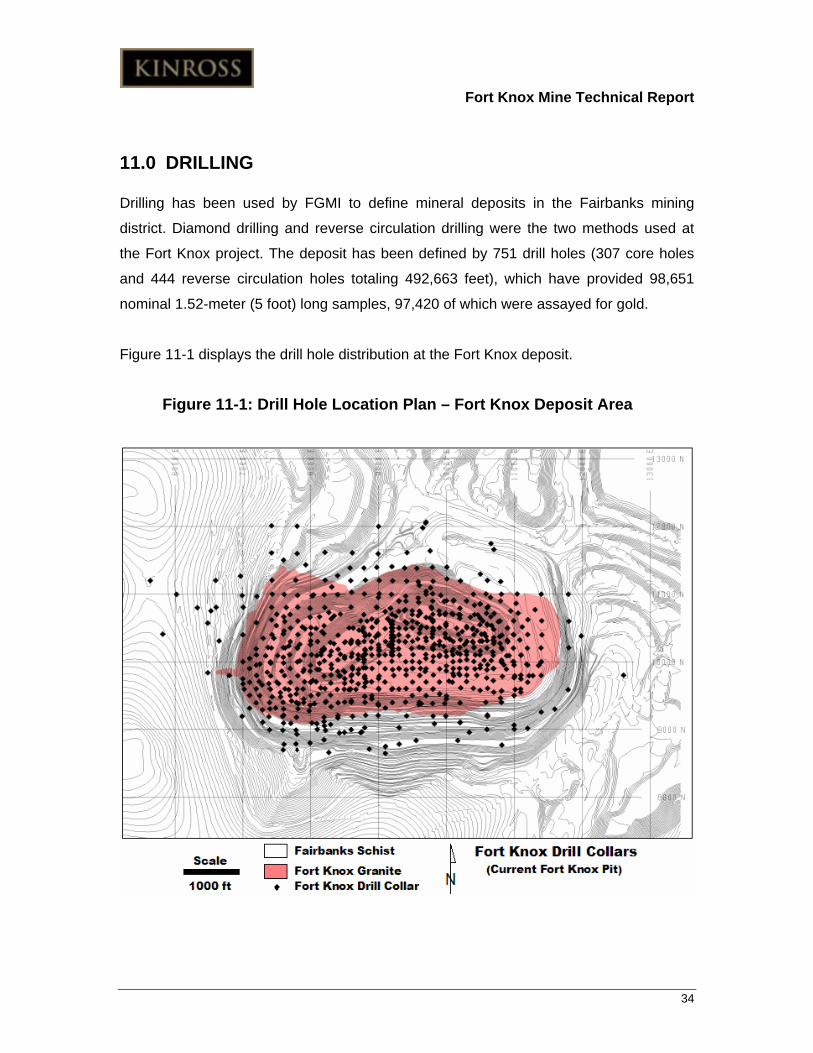
11.0 DRILLING
Drilling has been used by FGMI to define mineral deposits in the Fairbanks mining
district. Diamond drilling and reverse circulation drilling were the two methods used at
the Fort Knox project. The deposit has been defined by 751 drill holes (307 core holes
and 444 reverse circulation holes totaling 492,663 feet), which have provided 98,651
nominal 1.52-meter (5 foot) long samples, 97,420 of which were assayed for gold.
Figure 11-1 displays the drill hole distribution at the Fort Knox deposit.
Figure 11-1: Drill Hole Location Plan – Fort Knox Deposit Area

Fort Knox Mine Technical Report
35
Reverse circulation (RC) drilling is a specialized method of “rotary” drilling. Drilling
medium consisting of water, foam, drilling mud with additives, or air is circulated to the
drill bit face on the outside of the drill rods. The drill cuttings, which consist of pulverized
rock mechanically ground by the drill bit, are collected through the inside of the rods. The
reverse circulation method is an accepted technique commonly used in mineral
exploration and development drilling programs. The reverse circulation holes completed
by FGMI are normally 139.70 millimeters (5.50 inches) in diameter, but may range as
high as 146.05 millimeters (5.75 inches) in diameter.
Diamond drilling or core drilling is the process of obtaining continuous cylindrical
samples of rock from drill holes by means of annular shaped rock cutting bits rotated by
a borehole-drilling machine. Core drilling is commonly used to collect undisturbed and
continuous samples. It may also be used for pre-selected intervals of holes that are of
particular interest. Core hole intervals can provide detailed, comprehensive samples for
improved geologic description, geotechnical and rock strength tests, metallurgical tests,
and density determination.
The Company has commonly drilled PQ3 diameter core holes (83.1 mm, or 3.270
inches) at the Fort Knox deposit since 1998. Prior to 1998, core holes were PQ
diameter (85.0 mm, or 3.345 inches in diameter). Both PQ3 and PQ diameter core are
used for exploration and evaluation of mineral deposits where a larger sample is more
representative of coarse grained gold distribution. The two PQ core varieties are the
preferred sample diameter at Fort Knox because of the local, coarse-grained nature of
gold within the deposit.
Core and RC samples are collected from each drill hole and are geologically logged with
detailed descriptions of rock types, alteration, mineral identification, and examination of
structural features. Reverse circulation holes are sampled on regular 1.52-meter (5 foot)
intervals for the entire length of the hole. Each core interval and RC sample is submitted
to an independent assay laboratory for geochemical analysis. The resultant geochemical
data along with the lithologic data is entered into the project database. This drill data is
used to construct subsurface geologic maps, cross sections and solids, as well as

Fort Knox Mine Technical Report
36
depicting geologic contacts, interpretations of structural settings and the extent of
alteration zones and intervals of mineralization. The “raw” data, as well as the geologic
interpretations, are used to prepare estimates of mineral resources and mineral reserves
that may be present.
Historically, the core from each diamond drill hole is photographed and the photographs
are retained for future use. A representative “split” of all reverse circulation drill hole
samples, collected at 1.52 meter (5 foot) intervals, are preserved in plastic “chip trays”.
The trays are designed to hold 20 five-foot samples, and each sample has a weight of
approximately 200 grams. The total core, from diamond drill holes, completed in the Fort
Knox deposit was pulverized and submitted for assay.
Starting in 1997, angled core holes have been routinely surveyed down the hole with a
Reflex EZ-Shot instrument. Although early core drill holes were not surveyed down the
hole, readings from more recent drilling indicate that holes usually deviate 30 or less over
1,000 ft. of core length. The FLEXIT SmartTool survey system was used during the
2005 drill season. The system downloads multi-shot surveys from a down-hole tool to a
data pad on the drill deck. The data pad containing the digital down-hole survey
information is then loaded to a computer where the survey results are calculated. In
2006, drilling reverted to using the Reflex EZ-Shot for downhole surveys and continued
to utilize this system in 2007.
The Company employs a detailed program of weighing the RC and core samples to
determine if the specimen is under weight, which might indicate loss of material in the
sample interval. If individual 1.52-meter (5 foot) intervals have unusually high or low
weights they could indicate sample contamination in a drill hole. The formula used in the
Fort Knox deposit is as follows:
Percent sample recovery = (sample weight) (split fraction) (4.3633*(bit diameter) ^2)*100.
Mineralized intervals with a calculated recovery greater than 100 percent are evaluated.
The anomalous hole is flagged and examined in cross-section. The drill hole is
compared to adjacent holes, historical production and a decision is made to accept or
Fort Knox Mine Technical Report
37
reject the assay interval. Rejected samples are coded in the database and composite
values are assigned a “-1” (no sample) in estimating mineral resources.
The mineralization and host rock at the Fort Knox deposit require that attention be given
to RC samples, which penetrate the water table within the deposit. The method of drilling
this part of the deposit has been validated by the results of mining.
The sample widths are generally significantly less than the true width of the ore zones.
The orientations of the ore-bearing structures are discussed in Section 9.1. Although the
orientations of the ore zones and the drillholes are somewhat irregular, in the vast
majority of cases the drillholes pierce the ore zones at a significant angle.
12.0 SAMPLING METHOD AND APPROACH
12.1 Reverse Circulation
The reverse circulation drill samples are collected every 1.52-meter (5 foot) by a
geologist or helper at each drill site. The data for each sample is recorded on a log
sheet and entered into an Excel file. A small portion of each sample is collected and
preserved in plastic “chip” trays, (twenty 1.52 meter samples per tray) and retained for
future use. Once the sample has been collected, it is placed in a pre-numbered, 45.72
by 60.96 centimeter (18 by 24 inches) 8-mil polyethylene bag. A sample tag is placed in
each bag, which is then sealed with a wire tie. The samples are placed in bulk bags, with
approximately 50 samples per bag and are picked up by staff from a commercial
laboratory.
12.1.1 Reverse Circulation - Dry Samples
Drill cuttings are passed through a collection hose into a cyclone-type dust collector and
are then manually split through a hopper-feed Gilson splitter. The split fraction of each
sample is recorded on the log sheet. Dry RC samples are not considered to be prone to
contamination.

Fort Knox Mine Technical Report
38
12.1.2 Reverse Circulation - Wet Samples
Cuttings are fed into a cyclone that deposits a stream of sample and drilling fluid into a
splitter with a variable speed hydraulic motor that rotates a set of vanes controlling the
volume of split sample. Prior to 2006, this split sample was fed into four 5-gallon buckets
set in cascading series to collect and settle out the cuttings. A flocculent was added to
the first bucket to aid in the settling of the sample. The samples were then permitted to
settle. Beginning in 2006, the split sample was fed into one, perforated and lined, 5-
gallon bucket placed in a washtub to collect all of the overflow. A flocculent was added
to the bucket to aid in the settling of the sample. All of the overflow material was washed
back into the bucket to avoid any loss of material. The single bucket procedure was
utilized for the 2007 drill sample collection as well. Wet RC samples are reviewed
carefully for the possibility of down-hole contamination (see Section 14.1).
12.2 Core Samples
PQ (85.0 millimeter, or 3.345 inch) and PQ3 (83.1 millimeter, or 3.270 inch) diameter
core holes were drilled at the Fort Knox deposit. Detailed log sheets prepared for core
record lithology, mineral type, alteration, oxidation, color, vein percent, structure and vein
orientations. Geotechnical data including RQD, core recovery, and fracture logs are also
recorded. Hardness values ranging from R0 to R6 were documented beginning in 2005
and is ongoing. The core is then photographed, logged, and sampled at 1.52-meter (5
foot) intervals. MRDI (1991) indicated that diamond drill core has the potential to slightly
understate the grade at Fort Knox.
12.3 Sample Composite Summary
Sample composites reflect the weighted average grade per hole over the bench height.
Composite length can vary. Vertical holes show composite lengths of 9.1 m (30 feet =
bench thickness) while inclined holes display longer composites, depending on their dip.
Table 12-1 depicts the most important statistical parameters of the composite sample
population, segregated by domains.

Fort Knox Mine Technical Report
39
There are 15,721 composite samples of which 2,181 are in the schist and the remaining
13,540 in the combined domains of the intrusive (1677 in Domain 10, 5750 in Domain 20
and 6041 in Domain 30).
The reliability of the data is expressed by the coefficient of variance (CV = Standard
deviation divided by the mean). The closer CV is to 1 the more dependable is the
population of samples. CV is furthest away from 1 in the schist, indicating the highest
variability of samples in this unit. Within the intrusive, Domain 20 has the lowest value,
but the difference to the other intrusive domains (Domain 10 and 30) appears not to be
of significance.
Composites are used to assign grade values to the block model. Because of statistical
and field observations the grade of the schist is modeled as missing and is therefore not
included in reserve calculations.
Table 12-1: Composite Summary Table
Statistic Schist Domain 10 Domain 10 Domain 10 All Samples No. Samples 2,181 1,677 5,750 6,041 15,721No. Missing Samples 119 28 101 66 314Min. (opt) 0.000 0.000 0.000 0.000 0.000Max. (opt) 0.205 0.215 0.248 0.239 0.248Mean. (opt) 0.003 0.015 0.020 0.016 0.016Std. Deviation 0.010 0.020 0.025 0.022 0.022C.V. 3.278 1.288 1.249 1.313 1.415
Fort Knox Mine Technical Report
40
13.0 SAMPLE PREPARATION, ANALYSES AND SECURITY
Core and reverse circulation drill samples, which are the basis for all analytical
determinations, are collected from the drill hole under the direct supervision of Company
staff. The samples are labeled and placed in bags at the Company facility and prepared
for transport to commercial laboratories for preparation and assay. Employees of the
laboratory pick up drill samples at the Company facility. The RC cuttings are weighed,
dried and reweighed. The sample is then crushed to minus 25.4 millimeters (1 inch) and
a 1250-gram split is retained for air shipment to the analytical facility for assay. Once the
1250-gram split has been delivered to the laboratory it is pulverized to 80-mesh and
passed through a riffle splitter to produce a 200 to 300 gram sample. This sample is then
ring pulverized to minus 150-mesh, rolled, and a 50 gram sample is taken for gold
determination by fire assay with an atomic absorption “finish”. For the majority of the
drilling at Fort Knox, any assay exceeding 10.29 g/t Au would be re-assayed by fire
assay with a gravimetric finish. The detection limit of these analytical methods is 0.001
oz Au/short ton from 1987 to 2002. The detection limit is 0.0003 oz Au/short ton from
2002 to present.
13.1 Quality Control, Quality Assurance
The objective of FGMI’s QA/QC Program is to ensure the accuracy and integrity of the
data. FGMI submits samples to check assays as part of the company’s standard Quality
Control, Quality Assurance Program (QA/QC). The QA/QC Program includes the
submission of duplicates, blanks and standards at rates described in the following
section.
13.2 Check Assays
From 1991 to 2005, to monitor the precision of the analytical process, FGMI had
collected separate 1250-gram samples from every tenth sample collected. The even
numbered samples, 20th, 40th, and 60th, were air freighted along with the regular
samples to the primary lab. Every odd-numbered 10th, 30th, and 50th, sample was

Fort Knox Mine Technical Report
41
picked-up on a weekly basis by a secondary lab, pulverized, further split to 250 to 300
grams and assayed. In addition, every 40th sample was re-assayed by the primary lab.
In 2006, the even numbered samples, 20th, 40th, 60th, etc., were pulverized by Alaska
Assay Laboratories and then shipped to ALS Chemex for “secondary lab” check
assaying. Since a new primary lab was being used in the 2006 program, a more
rigorous program of primary lab duplicate checks was instituted to monitor their
performance. Primary duplicates were selected randomly by the primary lab, and
increased in frequency to an average of 1 duplicate per 7 samples. The current
verification practice for the primary lab is to re-assay the first and then every 20th sample
in each job.
Assay results are received electronically from Chemex, American, and Bondar-Clegg
(prior to 2002) and Alaska Assay labs. Final certified “hard” copies of the assay
certificates are delivered later and retained in the Company’s files.
FGMI’s technical staff monitors the results on a regular basis. Any skewed results are
investigated to determine the cause of the difference. The authors consider the results of
the past operating year to be within acceptable error levels.
13.3 Blanks Program
FGMI also inserts blank or unmineralized samples into each sample shipment as part of
the operation’s standard procedures. Returned sample rejects that assay below the
detection limit (<0.0003) are submitted with the regular RC samples. The frequency of
blank insertion has varied from a minimum of one per hole; to as many as one blank
every 100 feet or 20th sample, depending on the drill season. The old and the new
sample numbers are recorded on the log sheet for reference purposes. Inclusion of
blank samples in core drilling occurred from 1997 to present, and used either reject
material from RC holes, or material from Browns Hill Quarry in North Pole, Alaska.
FGMI’s technical staff carefully monitors the results of the submitted blanks to check for
possible contamination during the analytical process. Any skewed results are

Fort Knox Mine Technical Report
42
investigated to determine the cause and the set of samples will be re-run to clarify the
assays. The authors consider the results of the past operating year to be within
acceptable error levels.
13.4 Field Duplicates Program
Historically, FGMI has collected duplicate samples at random from the RC drill sample
population. These duplicates were collected from the reject portion of the sample splitter
and are used to monitor sample analysis precision. The samples were bagged and
tagged consistent with FGMI’s normal sample submission practices so that the
duplicates are indistinguishable from the normal sample population. The FGMI technical
staff carefully reviewed these duplicate samples. Any samples falling outside expected
tolerance levels are reviewed to determine the cause of the discrepancy. The authors
consider the results of the duplicate analyses for the previous operating years to be
within acceptable error levels.
13.5 Standards
FGMI also submits known standards with the unknown drill samples. Pulp samples of
known grade are submitted to the laboratory to monitor analytical precision.
From 2001 to 2005, standards were submitted at a rate of two standards per core hole,
and every 100 feet for reverse circulation holes. These standards, representing different
ranges of gold grades, were prepared from Bondar-Clegg samples that were collected
from True North material. The samples and their values are as follows:
TNA 0.000 opt Au
TNB 0.006 opt Au
TNC 0.019 opt Au
TND 0.058 opt Au
TNE 0.081 opt Au
TNG 0.190 opt Au

Fort Knox Mine Technical Report
43
In 2006, five commercial standards were purchased for use with the ongoing drill
program. These standards were created and certified by Rocklabs Ltd., of Auckland,
New Zealand.
The samples and their values are as follows:
RA 0.0302 opt Au
RB 0.0057 opt Au
RC 0.0538 opt Au
RD 0.0117 opt Au
RE 0.0699 opt Au
In 2007 additional Standards were purchased from GeoStats Pty Ltd, Australia with the
following grades:
GA 0.0061 opt Au
GB 0.0120 opt Au
GC 0.0303 opt Au
GD 0.0513 opt Au
GE 0.0691 opt Au
Reverse circulation drilling inserts a standard at the first sample number ending in 11
and then every 20th sample afterwards (11, 31,51,71).
Core drilling inserts standards at samples ending in 1 and then every 20th sample
afterwards (1, 21,41,61,81)
FGMI’s technical staff monitors the performance of the standard samples submitted for
analysis to ensure that the results lie within acceptable tolerance levels. Recent sample
performance indicates no significant areas of concern. The authors of this report have
reviewed the preparation of and results of the standards used since 2001 and have
found them to be within acceptable error levels.

Fort Knox Mine Technical Report
44
13.6 Sample Security
Core and reverse circulation drill samples, which are the basis for all analytical
determinations, are collected from the drill hole under the direct supervision of Company
staff. The samples are labeled and placed in bags at the Company facility and prepared
for transport to commercial laboratories for preparation and assay. Employees of the
laboratory pick up drill samples at the Company facility. The qualified person is satisfied
that the security of the samples is adequate.

Fort Knox Mine Technical Report
45
14.0 DATA VERIFICATION
All drill data, including collar locations, down-hole surveys, and data intervals are
collated in Excel spreadsheets. Survey and log data are hand-entered into the
spreadsheets, while assay data are downloaded in digital format from the assay lab then
subsequently merged into the spreadsheets. Collar locations are initially recorded in the
local grid by the GPS surveying system. Collar locations and downhole surveys are also
rigorously reviewed via manual verification methods for erroneous data by the technical
staff of FGMI. Following input of data into Excel spreadsheets, the data are output to a
MineSight-ready ASCII file and subsequently imported into the MineSight software
package. The resulting assay and survey files in the MineSight directory include:
Assay file is identified as knx011.07d and,
Survey file is named knx012.07d. Gold grade and lithology data are entered into the “au1” and “lith” fields within the assay
file. The majority of the drillhole data has had a minimum of 10% double-entry checks
performed for data validation purposes.
The processes of data verification as described above are acceptable due diligence
routines to assure the reliability of the Fort Knox data set. The authors feel comfortable
that the presented data reflect actual conditions of the in-situ situation.
14.1 Drill Hole Data Rejection
Twelve RC holes displayed down-hole contamination when compared to adjacent holes,
blast hole drilling, and their respective drill logs, and select intervals were rejected from
the assay data set. Gold values for the rejected data were converted to -1 (as if missing).
This process resulted in the rejection of 806 intervals. Prior to 2004, computer programs
recording down hole “cyclicity” and “decay”, as well as excessive sample weight, would
be used as guides for geologists to reject suspect intervals as aberrant gold values. As
mining production has progressed and production blastholes have allowed for
verification of the presence of gold, these rejected intervals have been reviewed and

Fort Knox Mine Technical Report
46
updated on an ongoing basis, resulting in some previously rejected intervals being
restored for use in modeling.

Fort Knox Mine Technical Report
47
15.0 ADJACENT PROPERTIES
This region of Alaska has seen significant gold production but almost exclusively this
production was derived from placer deposits. The Fort Knox mine is the first lode gold
deposit to be developed in this region. Therefore, adjacent properties are not deemed
relevant for the purposes of this Technical Report.
Fort Knox Mine Technical Report
48
16.0 MINERAL PROCESSING AND METALLURGICAL TESTING
16.1 Fort Knox Mill Facility
16.1.1 Milling Methods and Capacity
High grade ore from the Kinross Fort Knox deposit is processed at the Company’s CIP
(carbon-in-pulp) mill located at the Fort Knox mine. True North (Figure 4-1) ore was
processed at the mill from 2001 to 2004. The Fort Knox mill facility was constructed in
1995, the first doré produced in December 1996 and commercial production achieved in
March 1997.
The Fort Knox mill has a daily capacity of between 33,658 to 45,359 tonnes (36,000 to
50,000 short tons) per day. The mill schedule for 2008 will process an average of 38,010
tonnes (41,900 short tons) per day. Mill feed is first crushed to minus 20 centimetres (8
inches) in the primary gyratory crusher located near the Fort Knox pit and conveyed 800
metres (2,625 feet) to a coarse-ore stockpile located near the mill. The crushed material
is conveyed to a semi-autogenous (SAG) mill, which operates in closed circuit with two
ball mills and a bank of cyclones for sizing. A portion of the cyclone underflow is
screened and then directed to a gravity recovery circuit.
Correctly sized material flows into a high rate thickener and then into leach tanks where
cyanide is used to dissolve the gold. Activated carbon is used in the CIP (carbon-in-pulp)
circuit to adsorb the gold from the cyanide solution. Carbon particles loaded with gold
are removed from the slurry by screening and are transferred to the gold recovery circuit
where the gold is stripped from the carbon by a high temperature/pressure cyanide
solution. Gold ions in the solution are then plated onto a cathode by electrowinning. The
gold is then melted into doré bars for shipment to a refiner. Mill tailings are detoxified
and sent into the tailings impoundment below the mill.
Fort Knox Mine Technical Report
49
16.1.2 Mill Recovery – Fort Knox Deposit
Gold recoveries at the Fort Knox mill have historically ranged from 87 percent to more
than 90 percent since production began in 1996. During 2001 to 2004 it was necessary
to add lead nitrate and slightly increase the cyanide and lime concentrations to maintain
mill recovery rates with some of the feed coming from True North.
The historical production at Fort Knox allows a gold grade to recovery relationship to be
developed. Table 16-1 summarizes this relationship for the Fort Knox mine based on
several years of production experience. At the $550 per ounce A-ore, cutoff grade
(0.0150 oz Au/short ton) the predicted recovery is 88.25 percent, while for the average
grade for reserves scheduled to be milled (0.0225 oz Au/short ton) the predicted
recovery is 89.36 percent.
Table 16-1: Grade Recovery Relationship - Fort Knox Mine
Grade oz/ton 0.010 0.015 0.020 0.025 0.030 0.035Recovery 86.82% 88.25% 89.31% 90.16% 90.85% 91.5% Grade oz/ton 0.040 0.045 0.050 0.055 0.060 Recovery 91.97% 92.43% 92.85% 93.23% 93.57%
16.1.3 Mill Recovery – True North Deposit
The True North mineral model has both a fire assay grade for in situ reserves and
resources and a cyanide soluble (CN) grade for the estimation of recoverable gold. The
cutoff grade and daily grade control are based on the cyanide soluble grade. A monthly
comparison between the predicted CN grades in the mineralization model and the back-
calculated head grade from the mill indicated that a 96 percent recovery factor is
required to estimate the True North gold produced from 2001 to 2004. True North ore is
not currently being processed at Fort Knox.

Fort Knox Mine Technical Report
50
16.2 Fort Knox Heap Leach Facility
16.2.1 Heap Leach Methods and Capacity
The heap leach facility currently being constructed at Fort Knox includes a valley fill
leach pad, carbon adsorption plant, piping, haul road construction, relocation of access
roads, power lines, tailings, and water lines. Run of mine ore is scheduled to be hauled
from the pit and from existing stockpiles to the leach pad. The pad design anticipates
ore loading in 40-foot lifts, of which the top five feet will be minus 1 1/4 inch crushed ore,
intended to insulate the drip emitters from freezing in colder months. The loading rate is
expected to vary from around 30,000 tons per day of run of mine ore in the early years of
the project, to roughly 50,000 tpd later in the project. The heap leach pad is designed to
be built in five stages, covering approximately 310 acres with a total capacity of 161
million tons. The location of the heap leach pad is in the upper end of the Walter Creek
drainage immediately upstream of the tailings storage facility (TSF). The liner system
currently designed for the Fort Knox heap leach pad consists of a triple liner in the pond
area of the pad and a double liner for the remainder of the heap.
Leach solution is designed to flow through the run-of-mine ore into a 110 million-gallon
in-heap storage reservoir. The pregnant solution would be pumped at a rate of
8,000gal/minute (gpm) directly to a new carbon-in-column plant (CIC) located adjacent
to the existing mill. After the pregnant solution has been processed through the CIC
plant, barren solution would be returned to the heap via a bank of five barren solution
pumps.
Modifications to the existing crushing circuit have been carried out to produce the large
quantities of overliner material and crushed material needed to protect the leach solution
application system. This project required some modifications to the inside of the mill
building as well as the installation of two conveyors to transport crushed reject material
to a truck load-out facility located adjacent to the main leach pad haulage road.
Construction was completed in 2007.

Fort Knox Mine Technical Report
51
16.2.2 Heap Leach Recovery – Fort Knox Deposit
Projected heap leach recoveries were based on laboratory testing of eight bulk samples
which are representative of the material to be leached. Gold recoveries from the ROM
feeds ranged from 28% (samples 103A and 200A) to 93% (sample 205B). Average gold
recovery was 61.2% with an average of 224 days of leaching and rinsing. Gold
extraction was progressing from all eight feeds at a slow rate when leaching was
terminated, though a longer leaching cycle would increase gold recoveries somewhat.
From this testwork, the following recovery relation was derived and used in mine
planning:
Gold recovery at time t (days) = 0.65 - 1/ (0.03t + 1/0.65)
16.3 Past Considerations
16.3.1 True North
The True North deposit is hosted in altered metamorphic rocks, and generally crushes
and grinds at a more rapid rate than material from Fort Knox. Blending of True North and
Fort Knox mineralization increased the throughput of the mill over feeding Fort Knox
mineralization alone.
The True North mineralization locally contains concentrations of stibnite, which has the
potential to decrease the pH, lower the dissolved oxygen content, and increase the
consumption of cyanide. To offset the detrimental attributes of True North ore the feed
rates were limited and additional mill reagents were added.
16.3.2 Fort Knox
Based on the varying hardness of the ore, crushing and grinding rates can change
significantly within the deposit having a direct impact on mill throughput and ultimately
unit costs. The mill tonnage rates are adjusted to reflect crushing properties based on
where mining has been scheduled in the pit.

Fort Knox Mine Technical Report
52
17.0 MINERAL RESOURCE AND RESERVE ESTIMATES
The 2007 Mineral Resource and Reserve Estimates have been estimated using
MineSight, a mine modeling software program developed by Mintec Inc. Klaus Triebel,
P.Geo., David Quandt and Chris Ekstrom, who are employees of FGMI, completed the
estimates. Mineral reserve estimates were reviewed by Kevin Morris, P.Eng., Director of
Mining Services, Kinross Gold Corporation.
17.1 Mineral Resource and Reserve Statement
The mineral reserve and resource estimates prepared by FGMI personnel have been
completed with consideration given to title, taxation, marketing, political, mining,
permitting, environmental and socio-economic issues, as well as the amenability of the
mineralization to be processed by the mill at the Fort Knox mine. There are no adverse
environmental or social issues that would affect the Company’s ability to develop the
reserves on its properties, nor the resources above a mill cutoff grade. Conversion of
leach-grade resources into reserves was completed, as all the permits for heap leach
were received on or before October 31, 2007.
Table 17-1 summarizes the Proven and Probable Mineral Reserves for the Fort Knox
mine December 31, 2007. Mineral reserves are estimated using an assumed gold price
of $550 US per ounce and are classified in accordance with the CIM Standards on
Mineral Resources and Reserves Definitions and Guidelines.
Table 17-2 summarizes the Measured and Indicated Mineral Resources for the Fort
Knox mine and area as of December 31, 2007. Mineral resources are estimated using a
gold price of $625 US per ounce and are also classified according to the CIM Standards.
Mineral resources as stated are exclusive of mineral reserves.

Fort Knox Mine Technical Report
53
Table 17-1: Mineral Reserve Summary as of December 31, 2007
Proven Probable Proven and Probable Source Tonnes Grade Tonnes Grade Tonnes Grade
(,000) (g/t) (,000) (g/t) (,000) (g/t) Mine 31,498 0.69 104,098 0.59 135,596 0.61 Stockpile 105,319 0.35 105,319 0.35 TOTAL 136,817 0.43 104,098 0.59 240,915 0.50
Table 17-2: Mineral Resource Summary as of December 31, 2007
Measured Indicated Measured & Indicated Deposit Tonnes Grade Tonnes Grade Tonnes Grade
(,000) (g/t) (,000) (g/t) (,000) (g/t) Gil (80%) 2,838 1.03 2,838 1.03True North 3,646 1.49 3,646 1.49Fort Knox 2,664 0.67 26,643 0.59 29,307 0.60Fort Knox Area 2,664 0.67 33,127 0.73 35,791 0.72
The Fort Knox area also hosts an Inferred Mineral Resource of 2.128 million tonnes
averaging 0.55 g/tonne Au at the same $625 US per ounce gold price. The majority
(2.108 million tonnes) of this material is contained at the Fort Knox deposit.
17.2 Fort Knox Deposit - Modeling Methodology
17.2.1 Overview
A 2007 resource model for the Fort Knox project was built with Mintec’s MineSight
modeling and mine planning software. Grades are projected from composited drill hole
data (grade and other parameters are averaged over a certain set length from the
original drill hole assays) into a 3-dimensional matrix of blocks that are sized
appropriately for the mining methods in current use. Additional drilling from 2007
improved confidence levels in zones of formerly low drill density. Reconciliation
incorporating blast hole data from nine years of mining with the current exploration drill
program established the rejection of contaminated drill holes from the current model.
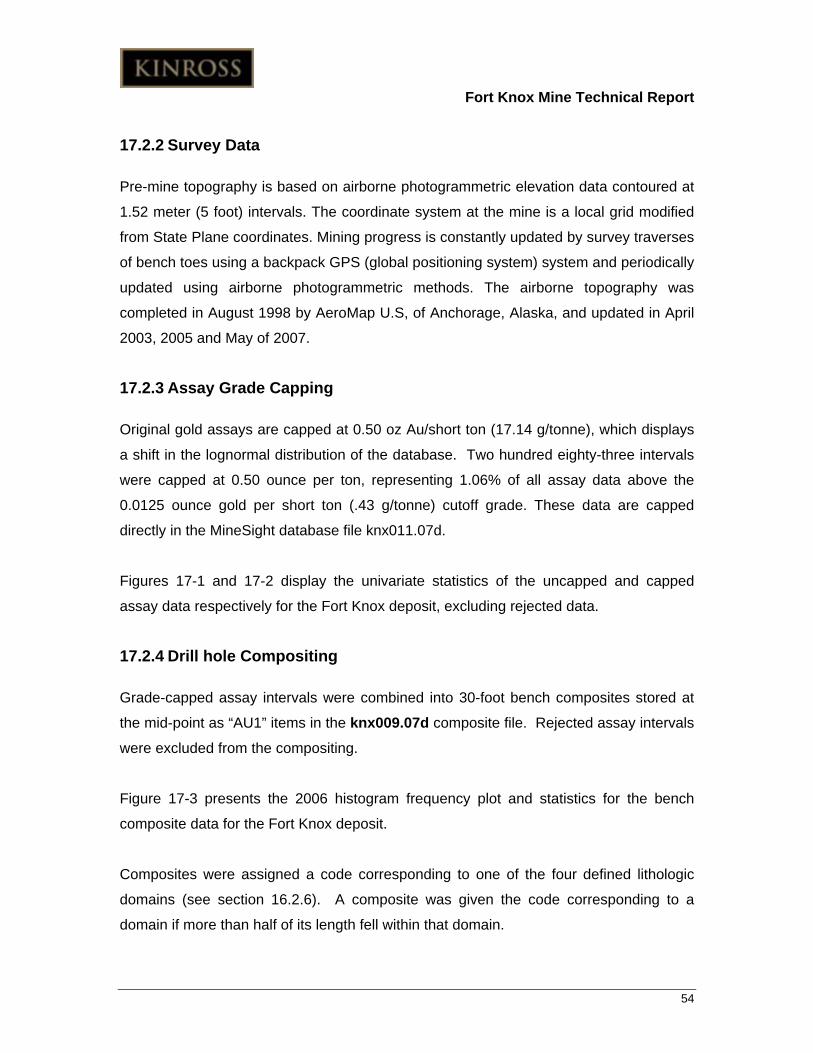
Fort Knox Mine Technical Report
54
17.2.2 Survey Data
Pre-mine topography is based on airborne photogrammetric elevation data contoured at
1.52 meter (5 foot) intervals. The coordinate system at the mine is a local grid modified
from State Plane coordinates. Mining progress is constantly updated by survey traverses
of bench toes using a backpack GPS (global positioning system) system and periodically
updated using airborne photogrammetric methods. The airborne topography was
completed in August 1998 by AeroMap U.S, of Anchorage, Alaska, and updated in April
2003, 2005 and May of 2007.
17.2.3 Assay Grade Capping
Original gold assays are capped at 0.50 oz Au/short ton (17.14 g/tonne), which displays
a shift in the lognormal distribution of the database. Two hundred eighty-three intervals
were capped at 0.50 ounce per ton, representing 1.06% of all assay data above the
0.0125 ounce gold per short ton (.43 g/tonne) cutoff grade. These data are capped
directly in the MineSight database file knx011.07d.
Figures 17-1 and 17-2 display the univariate statistics of the uncapped and capped
assay data respectively for the Fort Knox deposit, excluding rejected data.
17.2.4 Drill hole Compositing
Grade-capped assay intervals were combined into 30-foot bench composites stored at
the mid-point as “AU1” items in the knx009.07d composite file. Rejected assay intervals
were excluded from the compositing.
Figure 17-3 presents the 2006 histogram frequency plot and statistics for the bench
composite data for the Fort Knox deposit.
Composites were assigned a code corresponding to one of the four defined lithologic
domains (see section 16.2.6). A composite was given the code corresponding to a
domain if more than half of its length fell within that domain.
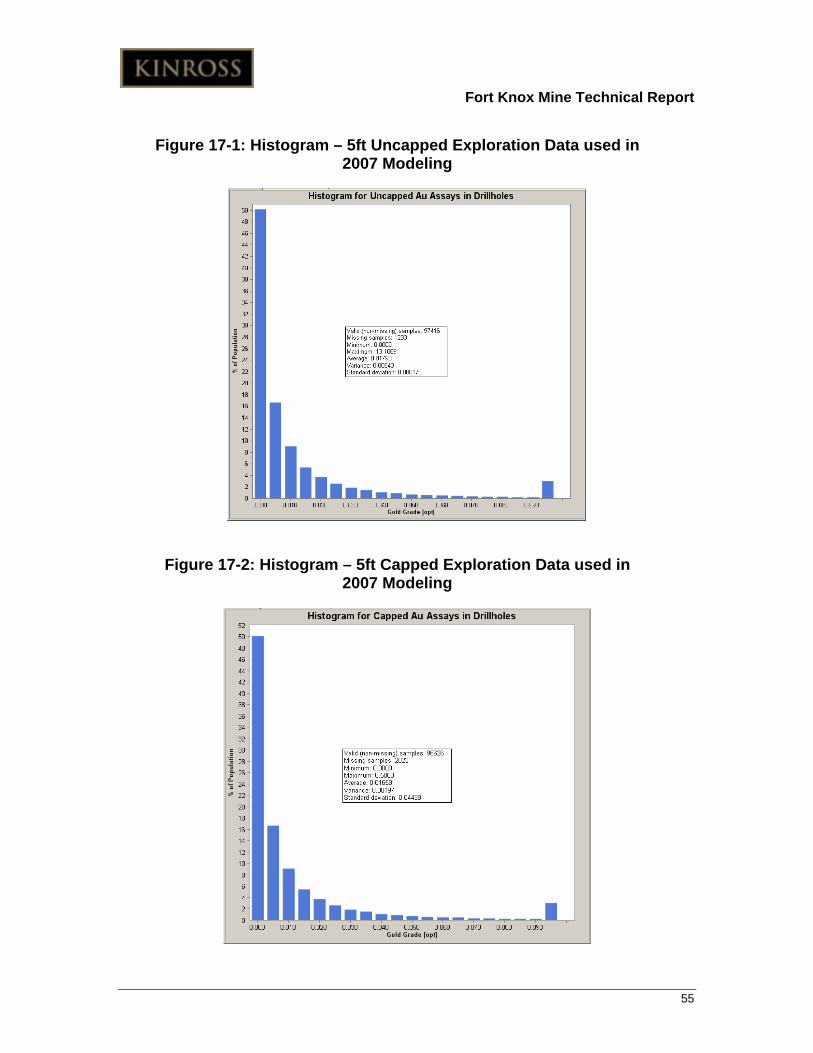
Fort Knox Mine Technical Report
55
Figure 17-1: Histogram – 5ft Uncapped Exploration Data used in 2007 Modeling
Figure 17-2: Histogram – 5ft Capped Exploration Data used in 2007 Modeling

Fort Knox Mine Technical Report
56
Figure 17-3: Fort Knox Mine – Composite Sample Statistics
17.2.5 Block Model
The 2007 Fort Knox mineral block model is based on a block size of 50 feet x 50 feet x
30 feet (x, y, z), which is appropriately sized for the mining equipment and methods
utilized at the Fort Knox mine. The dimensions of the block matrix are: 5,000 to 13,400
feet East (168 columns), 6,400 to 13,200 feet North (136 rows), and 400 to 2,470 feet in
elevation (69 levels).
The December 2007 pit topography is stored in the model as a “topo%” item. It is
assigned to the model from a MineSight file type-13 gridded surface model stored as a
“topog” item. The original pre-mine topography is stored as a “topo” item. The MineSight
gridded surface file 13 is created from a triangulated surface.
The following is a list of the important field items in the 2007 Reserve model file named
knx015.07d:
Fort Knox Mine Technical Report
57
• AUID ID2 interpolated gold grade using AU1 composite item
• AUPP AUID with inferred blocks assigned missing values
• DIST Distance to nearest composite
• DOMI Domain identifier (10=west pit, 20=mid pit, 30=east pit, 4=granite/schist contact)
• MCOST Mining cost of block in $/ton
• NCMPS Number of composites used to estimate block grade
• NHOLE Number of drill holes used to estimate block
• MII Classification (1=Measured, 2=Indicated, 3=Inferred)
• RECOV Mill metallurgical recovery as a percentage
• TOPO% Percentage of block below Dec 2006 mining topography
• VAL2 Net block value
17.2.6 Lithology
Lithology plays an important role in the distribution of mineralization at Fort Knox. Most
of the mineralization above the cutoff grade is confined to the granitic Fort Knox stock
that has been subdivided into fine-grained granodiorite, medium granite and coarse-
grained granite porphyry. The granodiorite, granite, granite porphyry subdivisions were
not used in the current, knx015.07d model.
The gold mineralization is hosted by quartz-sericite filled fractures and veins within
northwest striking and southwest dipping shear packages. The quartz-filled structures
form three gradational northwest striking zones in the Fort Knox deposit. The
mineralized structures have variable trends which average 131 degrees, -63 degree dip;
135 degrees, -32 degree dip; and 147 degrees, -62 degree dip, in the west pit, middle pit
and east pit, respectively. These three structural domains were digitized; triangulated
and subsequent solid geometry features were developed. The west, middle, and east
structural domains were assigned “material types” 10, 20, and 30, respectively. The solid
geometry features were then loaded to the knx009.07d composite file using the “spear”

Fort Knox Mine Technical Report
58
tab in the MineSight drill hole view properties. The solids were loaded to the “DOMI”
item in the composite file and coded as 10, 20, and 30.
In the schist, gold mineralization appears to consist of narrow extensions of mineralized
structures that transect the granite. In order to constrain grade interpolation between
granite and schist, a solid was constructed from pre-existing sectional interpretations of
the schist lithology. The subsequent schist solid was loaded to the knx009.07d
composite and coded as 4 in the “DOMI” item.
17.2.7 Domains
The west, middle, east, and schist domains described in the Lithology section above
were developed to reflect orientations of gold-bearing veins observed in exploration and
blast-hole data across the deposit. These domain solids were loaded to the composite
file as described above, then assigned to the “DOMI” item in the knx015.07d block
model as a block limiting item in the interpolation. The block search parameters,
ellipsoidal search distances and orientations are adjusted for each of the four domains.
The domain boundaries were “soft” between the various granite domains, meaning that
composites from one domain were allowed to interpolate blocks in other granite
domains. However, the domain boundaries between the schist and the various granite
domains were “hard” boundaries, so composites coded as schist were not used in
interpolating blocks coded as granite, and vice-versa.
17.2.8 Variography
Variograms were developed, using the variography program (SAGE2001), for the west,
middle and east domains to develop kriging and search parameters. The variography
consists of directional correlograms created using nested spherical models for each of
the domains, calculated from blast hole data. The variogram parameters, applied to the
krige models, were derived from structural orientations and helped determine the
ellipsoidal search parameters used in the final ID2 model that define the current mineral
reserve and resource estimates contained in this report. Tables 17-3 presents the
variogram parameters.

Fort Knox Mine Technical Report
59
17.2.9 Interpolation Methodology
The “07d” block model was interpolated from MineSight Compass Multi-Run “06b IDW”
developed in 2006. Gold grade is projected into model blocks from 30-foot bench
composites with a series of interpolation runs using an ID2 algorithm. In the first set of
interpolations, the granitic host is modeled in the west, middle and east domains. Gold is
interpolated with 250x150x75-foot search radii for the granitic host in the west, middle,
and east domains and 200x200x200 for the schist domain. In the second pass, which
overwrites the first pass, gold is interpolated with 150x100x75-foot search radii for the
granitic host in the west, middle, and east domains and 110x110x110-foot search radii
for the schist domain. The domains were assigned “soft boundaries” between the granite
domains, allowing interpolation across the domain borders. However, the schist-granite
domain boundaries were “hard”, and so composites in the granite were not used in
interpolation of schist blocks, and vice-versa. The number of composites for a block is a
minimum of 3 and maximum of 8. The maximum number of composites per hole is 4.
The maximum 3-D search distance for composites greater than or equal to 0.300 ounce
per ton gold was set at 25 feet.
Schist blocks had their gold grades assigned a zero value. Operational experience has
shown that the very small zones of mineralized schist are difficult to identify during ore
control. Therefore, it was considered appropriate to discard from the estimate any ore
contained in the schist, which represented approximately 1% of the total ore.
Drilling in 2007 added 41 holes to the 2007 “07d” model bringing the total number of
holes to 751 versus the 710 utilized in the 2006 “06b” model. The search parameters
and variography generated for the 06b were utilized for the 07d model. Figure 17-4
presents the 2006 histogram frequency plot and statistical summary of the interpolated
block model grades for item “AUID” in the “07d” model.
17.2.10 Search Parameters
FGMI geologists and resource modelers established the ellipsoidal search directions
based on blast hole and structural data in December 2004. The ellipsoidal search

Fort Knox Mine Technical Report
60
distances used in composite selection for the interpolation are based on blast hole
variography established in April 2004. The search parameter radii restrict the
extrapolation of mineralization in areas of wide spaced drilling. As described in the
Lithology, Domains, and Interpolation sections above, gold is interpolated with
250x150x75-foot search radii for the granitic host in west, middle, and east structural
domains. Gold is interpolated with 200x200x200-foot search radii for the schist lithology
domain. In the second pass, which overwrites the first pass interpolation, gold is
interpolated with 150x100x75-foot search radii for the granitic host in west, middle, and
east structural domains and with 110x110x110-foot search radii for the schist lithology
domain. Despite the differences in variography ranges in the three granitic-structural
domains, identical major, semi-major, and minor axis search distances are being used;
only their orientations differ from domain to domain. However, local comparisons of the
resource and reserve model with the blast hole model using variable search radii shows
that the current search radii display a good fit to the data.
17.2.11 Specific Gravity - Tonnage Factors
The dry tonnage factor used at Fort Knox is a global 12.5 ft3/ton and is based on
analyses of samples using 25 immersion tests (FGMI), 33 tests without immersion
(Golder Associates Inc. 1995), 99 pycnometer tests (Bondar-Clegg), and one volumetric
determination of a bulk sample supplied by FGMI.
17.2.12 Dilution
Although dilution was not added directly to the modeling as a percentage, it was
indirectly incorporated into the modeling by use of appropriate interpolation parameters.
These parameters were selected so that the modeled ore was a reasonable fit to the
actual A-ore and B-ore production to date (see Table 17-5).
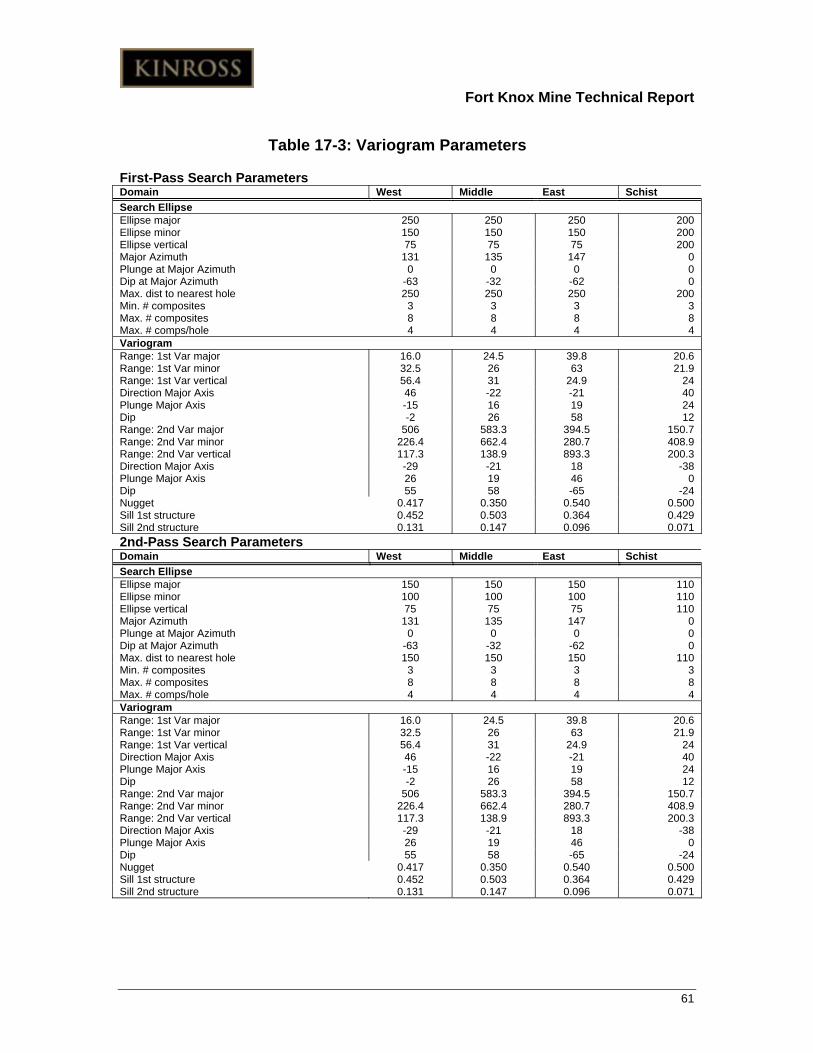
Fort Knox Mine Technical Report
61
Table 17-3: Variogram Parameters
First-Pass Search Parameters Domain West Middle East Schist Search Ellipse Ellipse major 250 250 250 200 Ellipse minor 150 150 150 200 Ellipse vertical 75 75 75 200 Major Azimuth 131 135 147 0 Plunge at Major Azimuth 0 0 0 0 Dip at Major Azimuth -63 -32 -62 0 Max. dist to nearest hole 250 250 250 200 Min. # composites 3 3 3 3 Max. # composites 8 8 8 8 Max. # comps/hole 4 4 4 4 Variogram Range: 1st Var major 16.0 24.5 39.8 20.6 Range: 1st Var minor 32.5 26 63 21.9 Range: 1st Var vertical 56.4 31 24.9 24 Direction Major Axis 46 -22 -21 40 Plunge Major Axis -15 16 19 24 Dip -2 26 58 12 Range: 2nd Var major 506 583.3 394.5 150.7 Range: 2nd Var minor 226.4 662.4 280.7 408.9 Range: 2nd Var vertical 117.3 138.9 893.3 200.3 Direction Major Axis -29 -21 18 -38 Plunge Major Axis 26 19 46 0 Dip 55 58 -65 -24 Nugget 0.417 0.350 0.540 0.500 Sill 1st structure 0.452 0.503 0.364 0.429 Sill 2nd structure 0.131 0.147 0.096 0.071 2nd-Pass Search Parameters Domain West Middle East Schist Search Ellipse Ellipse major 150 150 150 110 Ellipse minor 100 100 100 110 Ellipse vertical 75 75 75 110 Major Azimuth 131 135 147 0 Plunge at Major Azimuth 0 0 0 0 Dip at Major Azimuth -63 -32 -62 0 Max. dist to nearest hole 150 150 150 110 Min. # composites 3 3 3 3 Max. # composites 8 8 8 8 Max. # comps/hole 4 4 4 4 Variogram Range: 1st Var major 16.0 24.5 39.8 20.6 Range: 1st Var minor 32.5 26 63 21.9 Range: 1st Var vertical 56.4 31 24.9 24 Direction Major Axis 46 -22 -21 40 Plunge Major Axis -15 16 19 24 Dip -2 26 58 12 Range: 2nd Var major 506 583.3 394.5 150.7 Range: 2nd Var minor 226.4 662.4 280.7 408.9 Range: 2nd Var vertical 117.3 138.9 893.3 200.3 Direction Major Axis -29 -21 18 -38 Plunge Major Axis 26 19 46 0 Dip 55 58 -65 -24 Nugget 0.417 0.350 0.540 0.500 Sill 1st structure 0.452 0.503 0.364 0.429 Sill 2nd structure 0.131 0.147 0.096 0.071

Fort Knox Mine Technical Report
62
17.2.13 Metallurgical Recovery
Metallurgical recovery is calculated for each model block and is based on a grade-
recovery curve discussed in Section 16, Table 16-1. The following formula is applied to
determine the recovery for ore sent to the mill:
Recovery % = (0.0411 * LN (Grade + 0.002) + 1.046) * 100
The following formula is applied to determine the recovery for ore sent to the heap leach
pad:
Gold recovery at time t (days) = 0.65 - 1/ (0.03t + 1/0.65)
17.2.14 Model Checks
The interpolated gold grades in the block model are checked in detail against both
exploration and blasthole production drilling on both plan and sectional views using the
MineSight software visualization tools. This checking has led to refinements of
interpolation parameters to obtain a better fit with grade patterns in drilling data. The
model and production reconciliation is also discussed in Section 17.4.
17.2.15 Resource and Reserve Classification
Measured, Indicated, Inferred Resources
All model blocks with interpolated grade are assigned a confidence category identifier.
The “anisotropically adjusted” distance to the nearest hole, number of composites and
number of holes is stored during the interpolation using anisotropic ratios corresponding
to the search ellipsoids. Only one drill hole was required to interpolate a block, and
therefore, the variables used to distinguish potential “Measured” blocks from “Indicated”
block were the anisotropically adjusted distance to the nearest drill hole, and the number
of holes in the interpolation. The variable used to distinguish potential “Indicated” blocks
from “Inferred” blocks was the anisotropically adjusted distance to the nearest drill hole.
Resources are also limited by gold price and are exclusive of reserves. Distance
requirements to the nearest sample for each domain are listed in Table 17-4.

Fort Knox Mine Technical Report
63
Table 17-4: Classification Parameter Criteria
Category West Middle East # Holes Measured 100 ft. 100 ft. 100 ft. 3 Indicated 200 ft. 200 ft. 200 ft. 1 Inferred 250 ft. 250 ft. 250 ft. 1
Proven and Probable Reserves
All ”Measured” and ”Indicated” blocks, using an economic cutoff based on $550 Au, and
contained within the $ 525 ultimate pit design, are converted to “Proven” and “Probable”
reserves, respectively.
17.3 Pit Optimization
Because each block in the model has a unique recovery, pit optimizations are based
upon a net dollar value rather than simply block grade. The steps to calculate the net
value in the block model are as follows:
• Mining cost is variable by depth and is applied to each block in the field MCOST;
• Revenue is calculated for all “Measured” and “Indicated” blocks and is set in the block model item REVT. REVT = (gold grade * tons * (recov/100) * gold price) - (ore costs * tons);
• If REVT is positive, it is assumed the block will be processed and MCOST is subtracted from REVT. VAL2 = REVT – MCOST;
• If REVT is negative, the block is assumed to be waste and is assigned just the negative mining cost. VAL2 = MCOST * -1;
• All other blocks including “Inferred” and waste blocks are assigned the negative mining cost. VAL2 = MCOST * -1.
Mining costs (MCOST) are variable between $1.10 and $1.44 based on increased pit
depth and haul length from the pit rim. The “ore” costs include: milling - $4.118/ton, leach
operating costs - $0.98/ton, leach incremental capital - $0.20/ton, G&A taxes etc -
$57.31 /oz for mill ore and $20/oz for leach ore.

Fort Knox Mine Technical Report
64
Pit optimization slope angles are based on inter-ramp angles from studies by two firms
Golder Associates and Call & Nicholas, Inc. Due to the “flat bottom” and central
geometry of the Fort Knox orebody allowing for unique ramp access opportunities,
overall slopes in the pit optimization were not flattened beyond inter-ramp angles. A
complex slope model was developed utilizing the location of the granite-schist contact.
Slopes used in the schist were 370 on the south wall, 42º in the southwest corner, 40º on
the north and northwest walls, and 45º on the east wall. Slopes in the underlying granite
were set at 45º. The 37º and 45º angles on the south wall schist and granite,
respectively, are not an exact match to the design strategy suggested by Call &
Nicholas; however, this would not influence the pit optimization, since the south wall was
constrained by practical mining pushback limitations.
Previous years’ optimizations were limited by NOAA’s land holdings on the west side of
the pit. Negotiations with NOAA to obtain a westward extension of FGMI’s land holdings
were completed in 2007 allowing the inclusion of additional material as mineral reserve
and mineral resource.
Using the MineSight software package, a Lerchs-Grossmann pit optimization was run at
$550 gold price using no discount rate. A check was performed by Kinross Technical
Services using Whittle software and methodology, and the pit shell with the optimal NPV
was found to vary in total tonnage from the $550 MineSight pit by less than 1.7%. A
final pit was then designed using the optimized pit outline as a guide, and closely follows
the $525 per ounce pit optimization on the north and east sides. A very large variance
exists between the optimization and the pit design, due to size limitations of practical
pushbacks on the southeast and east sides, and land position restrictions on the west
side.
17.4 Production Reconciliation
The current mineral model for Fort Knox was reconciled to actual mining to provide an
indication as to how well the current resource and reserve model predicts the tonnage
and grade of the mineralization. Table 17-5 displays the reconciliation of the A-ore model
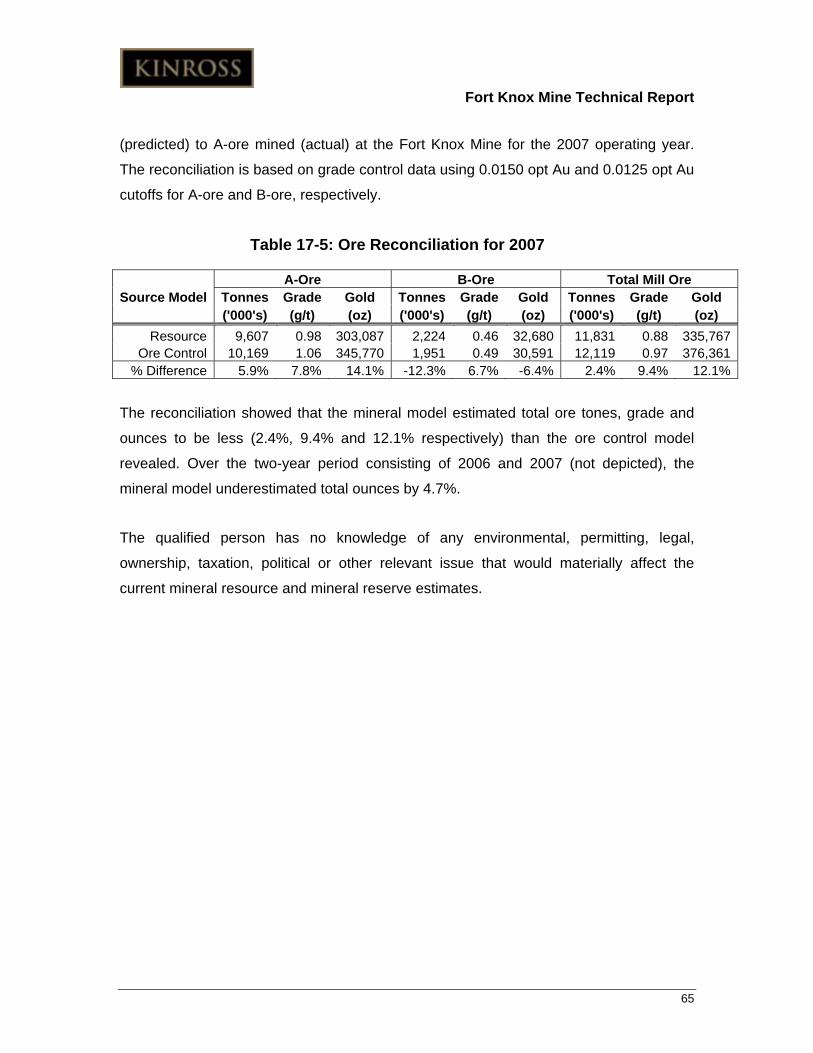
Fort Knox Mine Technical Report
65
(predicted) to A-ore mined (actual) at the Fort Knox Mine for the 2007 operating year.
The reconciliation is based on grade control data using 0.0150 opt Au and 0.0125 opt Au
cutoffs for A-ore and B-ore, respectively.
Table 17-5: Ore Reconciliation for 2007
A-Ore B-Ore Total Mill Ore Source Model Tonnes Grade Gold Tonnes Grade Gold Tonnes Grade Gold
('000's) (g/t) (oz) ('000's) (g/t) (oz) ('000's) (g/t) (oz) Resource 9,607 0.98 303,087 2,224 0.46 32,680 11,831 0.88 335,767
Ore Control 10,169 1.06 345,770 1,951 0.49 30,591 12,119 0.97 376,361% Difference 5.9% 7.8% 14.1% -12.3% 6.7% -6.4% 2.4% 9.4% 12.1%
The reconciliation showed that the mineral model estimated total ore tones, grade and
ounces to be less (2.4%, 9.4% and 12.1% respectively) than the ore control model
revealed. Over the two-year period consisting of 2006 and 2007 (not depicted), the
mineral model underestimated total ounces by 4.7%.
The qualified person has no knowledge of any environmental, permitting, legal,
ownership, taxation, political or other relevant issue that would materially affect the
current mineral resource and mineral reserve estimates.

Fort Knox Mine Technical Report
66
18.0 OTHER RELEVANT DATA AND INFORMATION
There is no other data or information relevant to the project that is not covered in other
sections of this report.

Fort Knox Mine Technical Report
67
19.0 INTERPRETATIONS AND CONCLUSIONS
The Mineral Resource and Reserve Estimates for the Fort Knox mine have been
prepared under the supervision of R. Henderson, Vice President of Technical Services.
The authors are satisfied the data used in the estimation of Mineral Resources and
Reserves is free of gross errors and omissions and is of suitable quality and sufficient
quantity to use in estimating resources and reserves for the Fort Knox deposits.
The economic analysis and cash flow forecast is positive, demonstrating that the mineral
reserves are economic. The authors are not aware of any issues that have not been
otherwise disclosed in this Report, which would materially affect the current estimate of
the mineral reserves for the Fort Knox mine.

Fort Knox Mine Technical Report
68
20.0 RECOMMENDATIONS
The Fort Knox mine is a producing gold mine for Kinross Gold Corporation. The
recommendation for successive work phases is not required.

Fort Knox Mine Technical Report
69
21.0 REFERENCES
Bakke, A., 1994, The Fort Knox ‘Porphyry Gold Deposit- Structurally controlled
stockwork and shear quartz vein, sulphide-poor mineralization hosted by a Late
Cretaceous Pluton, East Central Alaska, Canadian Institute of Mining Special Volume
46.
Bakke, A., Morrell, B., and Odden J. (1998), The Fort Knox porphyry gold deposit, east-
central Alaska: An overview and update. Porphyry and Hydrothermal Copper and Gold
Deposits. Australian Mineral Foundation Conference Proceedings November, 1998. p.
89-98.Blum, J.D., 1982: The Petrology, Geochemistry, and Isotope Geochronology of
the Gilmore Dome and San Pedro Dome Plutons, Fairbanks District, Alaska,
Unpublished M.S. Thesis, University of Alaska Fairbanks pp1-107.
Bundtzen, T.K., 1981: The Geology and Mineral Deposits of the Kantishna Hills, Mt.
McKinley Quadrangle, Alaska, Unpublished M.S. Thesis, University of Alaska Fairbanks,
pp1-237.
Call & Nicholas, Inc, 2005, Fort Knox and Gil Mines – Site Visit and Slope Stability
Review.
Ekstrom, C., Jan. 2007: 2006 Fort Knox Dump Evaluation Summary, Internal Memo,
pp1-3.
Fairbanks Gold Mining, Inc, and Kinross Gold USA, 2007, Fort Knox Mine Walter Creek
Heap Leach Project: Project Feasibility Evaluation, pp1-82.
Golder Associates, Inc., 1995 (c): Pit Slope Stability Investigation, Fort Knox Project;
Golder Associates, Inc., 2002 (a): Pit Slope Stability Study, Proposed 715 Pushback,
Fort Knox Project;
Fort Knox Mine Technical Report
70
Golder Associates, Inc., 2002 (b): Review of North Wall Failures, January, 2002 site visit
to Fort Knox Mine;
Golder Associates, Inc., 2002 (c): Slope Design and Controlled Blasting Criteria, Granite
Slopes in the Fort Knox Pit;
Golder Associates, Inc., 2000: True North Waste Dump Site Investigation and slope
Stability Evaluations.
Golder Associates, Inc., Scoping -Level Pit Slope Study, True North Project
Hall, M.H., 1985: Structural Geology of the Fairbanks Mining District, Central Alaska,
Unpublished M.S. Thesis, University of Alaska Fairbanks pp1-68.
Hansen, Erik, 2008: Mother of All Lists, 10th edition pp. 1-99.
Heiner, L.A. and Wolff, E.N., 1968, Final Report Mineral Resources of Northern Alaska:
Mineral Industry Research Laboratory No. 16, University of Alaska.
Henderson, Rob, 2006, Fort Knox Heap Leach Recovery, internal memo.
Metz, Paul A., 1991: Metallogeny of the Fairbanks Mining District, Alaska and Adjacent
Areas.
Mineral Industry Research Laboratory, School of Mineral Engineering, University of
Alaska Fairbanks, MIRL Report No. 90;
Mineral Resources Development, Inc., 1991 (a): Fort Knox Gold Project Fairbanks,
Alaska; Reserve Study, Volume 1;
Mineral Resources Development, Inc., 1991 (b): Fort Knox Gold Project Fairbanks,
Alaska; Reserve Update;

Fort Knox Mine Technical Report
71
Mineral Resources Development, Inc., 1992: Fort Knox Gold Project, Alaska 1992
Reserve Update;
Mineral Resources Development, Inc., 1998: Reserve Update, Fort Knox Project;
Mineral Resource Development, Inc., 2001: 2001 Resource Model Review, True North
Project.
Morrison, D. and Cicchini, P, 2005: Fort Knox and Gil Mines Site Visit and Slope Stability
Review, Call & Nicholas, Inc.
Murphy, John M. and Bakke, Arne, 1993, Low-temperature thermal history of the
Gilmore Dome area, Fairbanks Mining District, Alaska, Canadian Journal of Earth
Sciences, pp.764-768.
Robinson, M.S., Smith, T.E., and Metz, P.A. 1990: Bedrock Geology of the Fairbanks
Mining District, Alaska Division of Geological and Geophysical Surveys, Professional
Report 106.
Fort Knox Mine Technical Report
72
22.0 DATE AND SIGNATURE PAGE
The undersigned prepared this Technical report, titled NI-43-101 Technical Report for
the Fort Knox Mine, dated 31 March 2008. The format and content of the report are
intended to conform to Form 43-101F1 of the National Instrument (NI 43-101) of the
Canadian Securities Administrators.
Signed and Sealed
Robert D. Henderson 31 March 2008

Fort Knox Mine Technical Report
73
23.0 ADDITIONAL REQUIREMENTS FOR TECHNICAL REPORTS ON PRODUCTION PROPERTIES
23.1 Fort Knox Mining Operations
The Fort Knox mine includes the main Fort Knox open pit mine, mill, heap leach and
tailings storage facility. The mine production rate in 2007 varied between 110,000 and
146,000 tonnes (121,000 to 161,000 short tons) per day of total material, averaging
126,400 tonnes per day in 2007 (139,400 short tons). Open pit mining is carried out on
a year round basis, seven days a week. Standard drilling and blasting techniques are
used, and the blast holes are sampled and assayed for production grade control
purposes. Broken rock is loaded with a shovel or a wheel loader into haul trucks.
Depending on the grade control results, the mined material is delivered to either the
primary crusher, low-grade stockpiles, or to waste rock dumps.
23.1.1 Mine Equipment
The following major mining equipment is budgeted for use at Fort Knox in 2008:
• 6 Blast hole drills;
• 9 Caterpillar 785 haul trucks (150 short ton capacity)
• 8 Caterpillar 789 haul trucks (190 short ton capacity)
• 6 Caterpillar 793 haul truck (240 short ton capacity)
• 2 Hitachi EX 3600 shovels
• 1 Hitachi EX 5500 shovel
• 1 Caterpillar 994 loader
• 1 Caterpillar 992 loader
• 3 Caterpillar D10 dozers
• 2 Caterpillar 834B rubber-tired dozers

Fort Knox Mine Technical Report
74
• 3 Caterpillar graders (1 x 16G, 2 x 16H)
• 2 Water trucks
Other equipment includes: assorted support equipment and facilities, truck shop, wash
bay, fueling facilities and site office.
23.1.2 Mine Life Plan
FGMI’s Technical Department updates a detailed Life of Mine Plan (LMP) based on the
available reserves and utilizing the available mining fleet. Truck productivity predictions
(TPH and Cycle times) are adjusted to reflect production experience. The proposed
haulage profiles are determined for each bench and pit phase, plus the four possible
destinations (crusher, leach pad, low grade stockpile, and waste dumps). Using this
data, the truck hours required to move the scheduled tonnage are limited to the actual
producing truck hours from the mine fleet (after availability and utilization).
Production scheduling is driven by:
• Mill feed requirements and leach feed capacities;
• Stripping requirements for Phase-6 and Phase 7;
• Loading rates constraints, where only one shovel or loader can operate;
• Haulage limits determined by the size and number of trucks and their productivity.
The LMP uses the following pit design criteria:
• 30 foot benches;
• Single benching;
• Variable Slope angles based on studies by Golder Associates, and Call & Nicholas Inc.;
• 120-foot wide haul roads typically 8 percent grade, with some 10 percent segments near the bottom of the pit design;
Fort Knox Mine Technical Report
75
• All designs utilized toe and crest contours.
The ultimate pit was designed from a US $525 per ounce pit optimization, which was
limited by practical pushback size limitations on the south side.
On the south wall, the zone of alteration 2-3 benches above and below the schist-granite
contact has been identified as a zone that requires more conservative slopes. In these
areas, design includes slope angles as low as 32°, as well as 90 ft stepout berms up to
130 ft above the contact. General design guidelines were documented by geotechnical
consultants Call & Nicholas (“CNI”) in October 2006, and FGMI technical staff have
worked closely with CNI in areas that require local design exceptions.
23.1.3 Other Considerations
In 1996, a 1.3 million short ton slope failure developed in the central south wall above
the granite-schist contact. The slide was stabilized with mining set backs at the toe of the
failure. Golder Associates Inc. was not able to develop a predictive slope stability model,
because of the complex structure in the area, so a range of potential slopes was
recommended. At a design angle of 28o Golder predicted little chance of failure and, at a
design angle 35o, a high chance of failure was predicted. In 2005 Call and Nicholas Inc.
was retained to develop a recommendation for the slope failure area, with continuing
work resulting in design parameters described briefly in the section above. Ground water
was believed to be a contributing factor to the failure, and a dewatering program is in
place.
The dewatering department drilled two dewatering wells in 2007. The wells target water
in advancing areas of mining. There are a total of twenty-one groundwater dewatering
wells, with a potential pumping capacity of 1,470 gallons per minute (gpm). Eighteen of
the wells were active in and around the pit, as well as one well north of the pit, near the
causeway. The average annual pumping rate for wells in the pit area was 355 gpm, with
an additional 650 gpm from the well north of the pit, for a total average dewatering rate
of approximately 1005 gpm for 2007. The total pumping rate shows a 35% decrease in

Fort Knox Mine Technical Report
76
production when compared to 2006’s dewatering rate of 546 gpm. Mining activities in
2007 were concentrated in the Phase 6 portion of the pit resulting in a loss of access to
the bottom of the pit for extended periods of time. Low water levels in the Fish Creek
causeway wells north of the pit resulted in shutting down one of the wells and operating
the second at the static influx rate.
Haul road access to Phase-6 will be from the northern end. With the expansion of the
Phase 6 design to the north, the mine plan requires the subdivision of Phase 6 into north
and south mining areas to balance the strip ratio. The first significant mill-grade ore will
be reached on north Phase 6 on the 1360 bench in the second half of 2008. To reach
the 1360 bench on the north side, roughly 13.2Mt of waste and 1Mt of leach ore will be
stripped at an average rate of 44,000 tonnes per day. Fully sustainable mill feed from
the north side of Phase 6 is expected by the 1240 bench.
Due to the lowering of the economic cutoff grade by heap leach economics, certain
material that had been hauled to waste dumps in the past has been reclassified as
Stockpile reserves. Blasthole modeling indicates that the granite waste in the Barnes
Creek and Fish Creek waste dumps grades 0.309g/t. In 2006, 65 rotary drillholes were
completed on the Barnes Creek and 40 in Fish Creek waste dump, and confirmed the
blasthole grade estimates for this material. As a result, 30.085 ktonnes of material in
Fish Creek grading 0.309g/t have been added to the “Stockpile” category of the Proven
and Probable Reserves for year-end 2007.
23.2 Recoverability
Metallurgical recovery information is discussed in detail in Section 16 of this report.
23.3 Markets
Kinross will continue with current marketing arrangements at Fort Knox and does not
envision any concerns related to marketing doré.

Fort Knox Mine Technical Report
77
23.4 Contracts
Smelting, refining, handling and sales charges are within industry standards.
23.5 Environmental Considerations
Fort Knox has a letter of credit in place that includes all of the following:
Fort Knox Mine – Reclamation/Closure $ 34,314,418
Fort Knox Post Reclamation Obligations $ 734,537
True North – Reclamation Plan $ 1,155,774
True North Access Road Reclamation $ 80,000
True North Plan of Operations $ 1,301,100
Very little concurrent reclamation can be initiated at Fort Knox since most all areas of
disturbance are subject to continuing disturbance. Borrow areas for the construction of
the tailing dam have been reclaimed.
At True North, all acreage that would not be subject to further disturbance if mining
commences has been reclaimed.
23.6 Taxes
The State of Alaska Millsite Lease carries a 3% production royalty, based on net income
and recovery of the initial capital investment. Mineral production from State mining
claims is subject to a Mine License Tax, following a three-year grace period after
production commences. The license tax ranges from 3% to 7% of taxable income.
There has been no production from State claims situated outside the boundaries of the
Millsite Lease at the Fort Knox mine. The unpatented federal lode claim is owned by
Kinross and is not currently subject to any royalty provisions. Refer to Hansen, 2008
“Mother of All Lists” 11th edition, 1/2008 for a detailed listing of all Fort Knox Title and
Ownership documents, CD1. As a result of high metal prices, Kinross royalties and
production taxes are estimated at $3.3 million for 2007 compared to $2.2 million in 2006.

Fort Knox Mine Technical Report
78
23.7 Capital and Operating Cost Estimates
A detailed 2008 and LOM budget has been developed for the mine based on an actual
operating cost history and projected future performance. Mining costs are similar to
most mines of this size and equipment age and are presented in Table 23-1. The capital
spending is shown for the LOM in Table 23-2.
Table 23-1: Estimated Operating Costs – Fort Knox
Time Period 2008 Budget LOM Plan Ktons Mined 49,723 305,171Ktons Milled 15,291 103,632Ktons to Leach Pad 162,037Mining ($/ton) (incl. Maintenance) $1.41 $1.26Milling ($/ton) $4.13 $4.08Leaching ($/ton) $1.08General and Administrative ($ per recoverable oz.) $75.57 $69.05
Table 23-2: Fort Knox Life of Mine Capital Spending
Capital Total 2008 2009 2010 2011 2012 2013 2014 2015
Mine/MEM/Mill/Sustain $193,447 $65,424 $41,341 $28,109 $34,158 $24,181 $235 $0 $0 Heap Leach $101,116 $23,080 $42,979 $0 $11,477 $0 $10,476 $0 $13,104 Total $294,563 $88,504 $84,320 $28,109 $45,635 $24,181 $10,711 $0 $13,104
Budgeted costs for 2008 reflect mining rates = associated costs that assume no True
North material being used to supplement the Fort Knox mill feed. In 2014, pit mining will
have ceased but stockpile material is expected to continue to be hauled to the leach
pad.
23.8 Economic Analyses
A profitability estimate was calculated for each mining area that was included in the Fort
Knox reserves. Revenue was determined by using the mill grade-recovery relationship
and a gold price of US $550 per ounce. Operating costs are based on the expenses
discussed above plus added expenditures for capital items, such as tailings capacity,
reclamation and equipment needed to sustain operations. The discounted cash flow
analysis indicates that the mine generates a positive cash flow. The details of the

Fort Knox Mine Technical Report
79
economic and sensitivity analyses are considered by Kinross to be confidential
information. The economic models are considered as complete, reasonable, and
meeting generally accepted industry standards. Individuals seeking to review these
models must request and sign a confidentiality agreement with Kinross Gold
Corporation.
23.9 Payback
The payback on the LMP was evaluated using both the capital for heap leach and Phase
7 expansion capital and indicates 5.8 years to return profits on the project. The heap
leach project accomplishes a positive return in 4 years.
23.10 Mine Life and Production Schedule
FGMI, as part of the LMP, has completed a production schedule that depletes the
currently known reserves at Fort Knox. The current FGMI LMP production schedule
includes no material from True North. Production is derived entirely from the Fort Knox
deposit from 2007 until 2014, at which time continuing gold production is expected to
occur from the shipping of stockpile material to the leach pad. Table 23-3 presents the
estimated production schedule for the Fort Knox deposit.
Table 23-3: Fort Knox Life of Mine Plan Production Schedule
Source Total 2008 2009 2010 2011 2012 Leach Feed Tons ('000's) 162,037 0 3,970 14,600 14,600 18,250 Contained Grade (opt) 0.0095 0 0.0107 0.0109 0.0113 0.0092 Contained Ounces 1,544,738 0 42,365 159,390 165,358 168,345 Mill Feed Tons ('000's) 103,632 15,291 14,918 14,821 14,850 14,850 Contained Grade 0.0223 0.0238 0.0221 0.0221 0.0191 0.0178 Contained Ounces 2,310,707 364,031 329,983 328,260 283,716 264,968 Source 2013 2014 2015 2016 2017 2108 2019 Leach Feed Tons ('000's) 18,300 18,250 18,250 18,250 18,300 18,251 1,016 Contained Grade (opt) 0.0092 0.0092 0.0091 0.0091 0.0091 0.0091 0.0091 Contained Ounces 167,884 167,314 166,095 166,095 166,550 166,095 9,248 Mill Feed Tons ('000's) 14,850 14,052 0 0 0 0 0 Contained Grade 0.0245 0.0268 0 0 0 0 0 Contained Ounces 363,833 375,917 0 0 0 0 0