statistics/factoids about business in portland, oregon
TRANSCRIPT
8/14/2019 Statistics/factoids about business in Portland, Oregon
http://slidepdf.com/reader/full/statisticsfactoids-about-business-in-portland-oregon 1/2
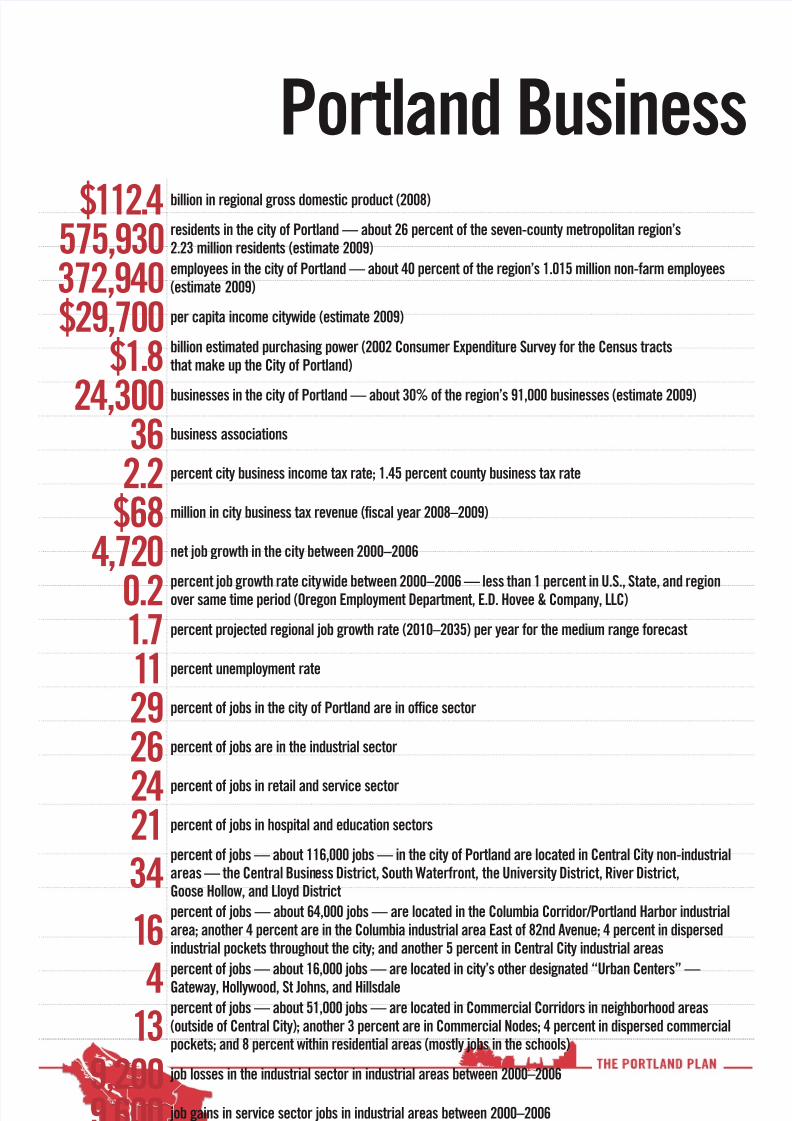
$112.4billion in regional gross domestic product (2008)
575,930residents in the city o Portland — about 26 percent o the seven-county metropolitan region’s2.23 million residents (estimate 2009)
372,940employees in the city o Portland — about 40 percent o the region’s 1.015 million non- arm employees(estimate 2009)
$29,700per capita income citywide (estimate 2009)
$1.8billion estimated purchasing power (2002 Consumer Expenditure Survey or the Census tractsthat make up the City o Portland)
24,300businesses in the city o Portland — about 30% o the region’s 91,000 businesses (estimate 2009)
36business associations
2.2percent city business income tax rate; 1.45 percent county business tax rate
$68million in city business tax revenue (fscal year 2008–2009)
4,720net job growth in the city between 2000–2006
0.2percent job growth rate citywide between 2000–2006 — less than 1 percent in U.S., State, and regionover same time period (Oregon Employment Department, E.D. Hovee & Company, LLC)
1.7percent projected regional job growth rate (2010–2035) per year or the medium range orecast
11percent unemployment rate
29percent o jobs in the city o Portland are in o fce sector
26percent o jobs are in the industrial sector
24percent o jobs in retail and service sector
21percent o jobs in hospital and education sectors
34percent o jobs — about 116,000 jobs — in the city o Portland are located in Central City non-industrialareas — the Central Business District, South Water ront, the University District, River District,Goose Hollow, and Lloyd District
16percent o jobs — about 64,000 jobs — are located in the Columbia Corridor/Portland Harbor industrialarea; another 4 percent are in the Columbia industrial area East o 82nd Avenue; 4 percent in dispersedindustrial pockets throughout the city; and another 5 percent in Central City industrial areas
4percent o jobs — about 16,000 jobs — are located in city’s other designated “Urban Centers” —Gateway, Hollywood, St Johns, and Hillsdale
13percent o jobs — about 51,000 jobs — are located in Commercial Corridors in neighborhood areas(outside o Central City); another 3 percent are in Commercial Nodes; 4 percent in dispersed commercialpockets; and 8 percent within residential areas (mostly jobs in the schools)
9,200job losses in the industrial sector in industrial areas between 2000–2006
9,600job gains in service sector jobs in industrial areas between 2000–2006
110,000jobs were in neighborhood sub-areas (2006), about 28 percent o the citywide total; 16,000 job losses inneighborhood sub-areas between 2000–2006
Portland Business
8/14/2019 Statistics/factoids about business in Portland, Oregon
http://slidepdf.com/reader/full/statisticsfactoids-about-business-in-portland-oregon 2/2
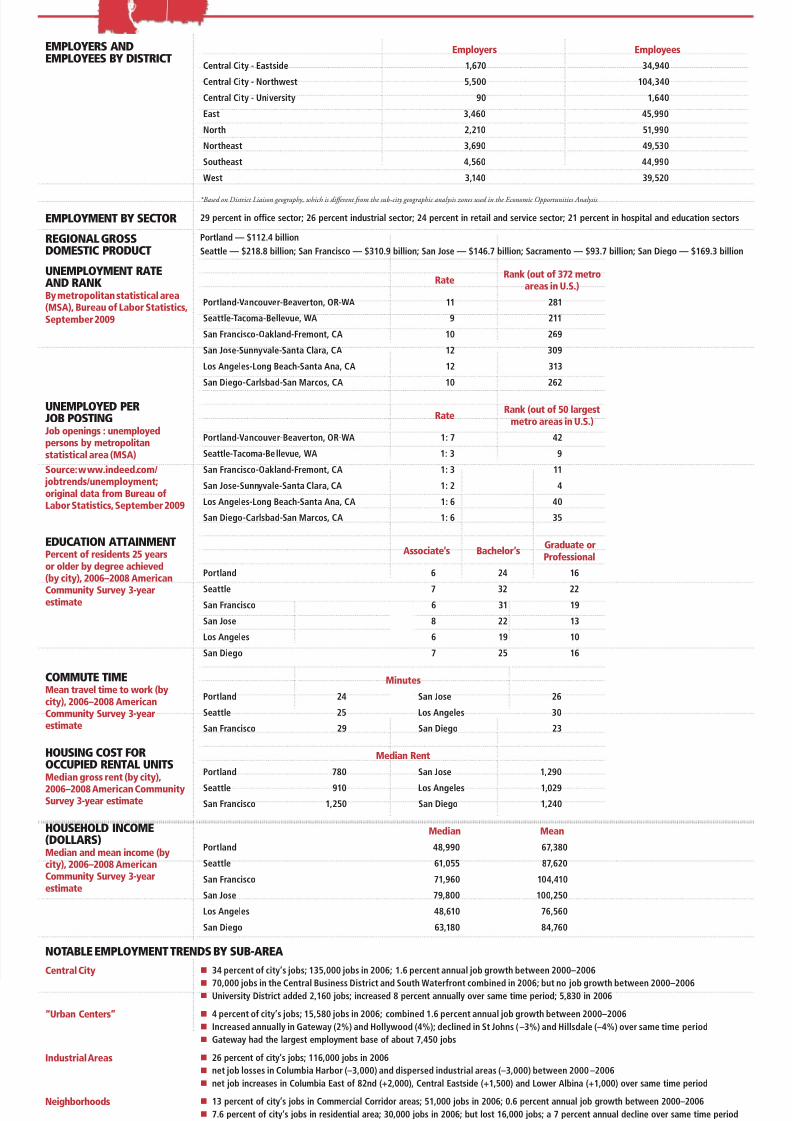
EMPLOYERS ANDEMPLOYEES BY DISTRICT
Employers EmployeesCentral City - Eastside 1,670 34,940
Central City - Northwest 5,500 104,340
Central City - University 90 1,640
East 3,460 45,990
North 2,210 51,990
Northeast 3,690 49,530
Southeast 4,560 44,990
West 3,140 39,520
*Based on District Liaison geography, which is di erent from the sub-city geographic analysis zones used in the Economic Opportunities Analysis.
EMPLOYMENT BY SECTOR 29 percent in of ce sector; 26 percent industrial sector; 24 percent in retail and service sector; 21 percent in hospital and education sectors
REGIONAL GROSSDOMESTIC PRODUCT
Portland — $112.4 billionSeattle — $218.8 billion; San Francisco — $310.9 billion; San Jose — $146.7 billion; Sacramento — $93.7 billion; San Diego — $169.3 billion
UNEMPLOYMENT RATEAND RANKBy metropolitan statistical area(MSA), Bureau of Labor Statistics,September 2009
Rate Rank (out of 372 metroareas in U.S.)
Portland-Vancouver-Beaverton, OR-WA 11 281
Seattle-Tacoma-Bellevue, WA 9 211
San Francisco-Oakland-Fremont, CA 10 269
San Jose-Sunnyvale-Santa Clara, CA 12 309
Los Angeles-Long Beach-Santa Ana, CA 12 313
San Diego-Carlsbad-San Marcos, CA 10 262
UNEMPLOYED PERJOB POSTINGJob openings : unemployedpersons by metropolitanstatistical area (MSA)Source: www.indeed.com/
jobtrends/unemployment;original data from Bureau ofLabor Statistics, September 2009
Rate Rank (out of 50 largestmetro areas in U.S.)
Portland-Vancouver-Beaverton, OR-WA 1: 7 42
Seattle-Tacoma-Bellevue, WA 1: 3 9
San Francisco-Oakland-Fremont, CA 1: 3 11
San Jose-Sunnyvale-Santa Clara, CA 1: 2 4
Los Angeles-Long Beach-Santa Ana, CA 1: 6 40
San Diego-Carlsbad-San Marcos, CA 1: 6 35
EDUCATION ATTAINMENTPercent of residents 25 yearsor older by degree achieved(by city), 2006–2008 AmericanCommunity Survey 3-yearestimate
Associate’s Bachelor’s Graduate orProfessional
Portland 6 24 16
Seattle 7 32 22San Francisco 6 31 19
San Jose 8 22 13
Los Angeles 6 19 10
San Diego 7 25 16
COMMUTE TIMEMean travel time to work (bycity), 2006–2008 AmericanCommunity Survey 3-yearestimate
MinutesPortland 24 San Jose 26
Seattle 25 Los Angeles 30
San Francisco 29 San Diego 23
HOUSING COST FOROCCUPIED RENTAL UNITSMedian gross rent (by city),2006–2008 American CommunitySurvey 3-year estimate
Median RentPortland 780 San Jose 1,290
Seattle 910 Los Angeles 1,029San Francisco 1,250 San Diego 1,240
HOUSEHOLD INCOME(DOLLARS)Median and mean income (bycity), 2006–2008 AmericanCommunity Survey 3-yearestimate
Median MeanPortland 48,990 67,380
Seattle 61,055 87,620
San Francisco 71,960 104,410
San Jose 79,800 100,250
Los Angeles 48,610 76,560
San Diego 63,180 84,760
NOTABLE EMPLOYMENT TRENDS BY SUB-AREA
Central City 34 percent of city’s jobs; 135,000 jobs in 2006; 1.6 percent annual job growth between 2000–2006
70,000 jobs in the Central Business District and South Waterfront combined in 2006; but no job growth between 2000–2006 University District added 2,160 jobs; increased 8 percent annually over same time period; 5,830 in 2006
“Urban Centers” 4 percent of city’s jobs; 15,580 jobs in 2006; combined 1.6 percent annual job growth between 2000–2006 Increased annually in Gateway (2%) and Hollywood (4%); declined in St Johns (–3%) and Hillsdale (–4%) over same time period Gateway had the largest employment base of about 7,450 jobs
Industrial Areas 26 percent of city’s jobs; 116,000 jobs in 2006 net job losses in Columbia Harbor (–3,000) and dispersed industrial areas (–3,000) between 2000 –2006 net job increases in Columbia East of 82nd (+2,000), Central Eastside (+1,500) and Lower Albina (+1,000) over same time period
Neighborhoods 13 percent of city’s jobs in Commercial Corridor areas; 51,000 jobs in 2006; 0.6 percent annual job growth between 2000–2006 7.6 percent of city’s jobs in residential area; 30,000 jobs in 2006; but lost 16,000 jobs; a 7 percent annual decline over same time period
Commerical nodes accounted for 11,000 jobs in 2006; dispersed commercial areas 17,000 jobs, but lost 1,900 jobs between 2000–2006
Institutions 29 key institutions (based on land ownership), located within all sub-area types noted above 9 percent of city’s jobs; 37,000 jobs in 2006; about 7 percent annual job growth between 2000–2006 When including University District jobs, total jobs in this category approaches 42,000