self-esteem, shame and personal motivation -...
TRANSCRIPT

Self-Esteem, Shame and Personal Motivation∗
Roberta Dessı† Xiaojian Zhao‡
2013 December
Abstract
The available evidence from numerous studies in psychology suggests thatoverconfidence is a more important phenomenon in North America than inJapan. Relatedly, North Americans appear to view high self-esteem more posi-tively than Japanese. The pattern is reversed when it comes to shame, a socialemotion which appears to play a more important role among Japanese thanNorth Americans. We develop an economic model that endogenizes these ob-served differences. A crucial tradeoff arises in the model between the benefits ofencouraging self-improvement and the benefits of promoting initiative and newinvestments. In this context, self-esteem maintenance (self-enhancement) andhigh sensitivity to shame emerge as substitute mechanisms to induce efficient ef-fort and investment decisions, generating a “North American” equilibrium withoverconfidence and low sensitivity to shame, and a “Japanese” equilibrium withhigh sensitivity to shame and no overconfidence. The analysis identifies the keyequilibrium costs as well as the benefits of reliance on each mechanism, and theimplications for welfare.
Keywords: Overconfidence, shame, cultural transmission.JEL Classification: Z1; D03; D83
∗For helpful comments and discussions, we would like to thank Olivier Armantier, Douglas Bern-heim, Alberto Bisin, Antonio Cabrales, Stephen Chiu, Armin Falk, Raquel Fernandez, Rupert Gatti,Sanjeev Goyal, Johannes Koenen, Gilat Levy, Andrew Postlewaite, Drazen Prelec, Gerard Roland,Paul Seabright, Jean Tirole, Elu von Thadden, Andrea Vindigni, Jidong Zhou, and participantsat the CEPR Conference on the Economics of Interactions and Culture (EIEF, Rome), the BEEWorkshop on Neuroeconomics and Psychology (TSE, Toulouse), the Maastricht Behavioral and Ex-perimental Economics Symposium, the Econometric Society World Congress (Shanghai), the firstconference of the Chinese Game Theory and Experimental Economics Association (Beijing), 6thBiennial Conference of Hong Kong Economic Association (Tianjin), 6th Pan Pacific Conference onGame Theory (Tokyo), North American Summer Meeting of the Econometric Society (St. Louis),Asian Meeting of the Econometric Society (Seoul & Singapore), 4th World Congress of the GameTheory Society (Istanbul), China Meeting of the Econometric Society (Beijing) and seminars inCambridge, Chengdu (SWUFE), Hangzhou (Zhejiang University), Hong Kong (HKUST & HKU),Madrid (Carlos III), Mannheim, Rome (Tor Vergata), Shenzhen (Peking University HSBC Schoolof Business).†Toulouse School of Economics (GREMAQ and IDEI) and CEPR. Correspondence address: IDEI,
Toulouse School of Economics, Manufacture des Tabacs, Aile Jean-Jacques Laffont, 21 Allee deBrienne, 31000 Toulouse, France ([email protected]).‡Department of Economics, Hong Kong University of Science and Technology, Hong Kong

“Pride hurts, modesty benefits.”
The Counsels of Great Yu in the Document of Shangshu, 6th century BC
“All you need in this life is ignorance and confidence; then success is sure.”
Mark Twain (1835 - 1910), Letter to Mrs Foote, Dec. 2, 1887
1 Introduction
A large literature in psychology documents people’s need for a positive view of them-selves. One aspect of this is individuals’ tendency to selectively focus attention,interpret and remember events so as to maintain or enhance confidence in their abil-ity, and thereby maintain self-esteem1. Relatedly, recent work in economics showsthat individuals tend to update their beliefs differently in response to good news orbad news about their ability.2
Interestingly, though, the importance of (over)confidence in one’s ability variessignificantly across cultures. Heine et al. (1999) find striking differences in theirreview of the evidence on North America and Japan (discussed in detail in section 2).In a nutshell, while the distributions of self-esteem scores for North Americans areheavily skewed towards high self-esteem, this is not the case for the Japanese, whoseself-evaluations are lower and approximately normally distributed. Relatedly, thefalse uniqueness bias (the tendency to see oneself as better than most others) has beenfound in a number of studies of North Americans, but is absent from similar studiesof Japanese. Moreover, the self-serving biases documented in the North Americanattribution literature, showing that individuals tend to attribute their successes totheir intrinsic characteristics (e.g. talent), while attributing their failures to bad luckor other external factors, do not appear in analogous studies of the Japanese, whotend to attribute failures as much as successes to their own (in)abilities.
It could be conjectured that these differences do not reflect genuine differencesin beliefs, but only in the appearance of beliefs: the Japanese may wish to appearmore modest, while North Americans may wish to appear more confident, than theyreally are. This, it could be argued, might be a rational response to different so-cial norms, with modest self-presentation gaining greater social approval in Japan,and more confident self-presentation securing greater social approval in North Amer-ica. However, there is evidence of greater self-enhancement by North Americans andgreater self-criticism by Japanese even with complete anonymity of responses, andwhen individuals are unaware that their behaviors are being observed (see Heine et
1We discuss this literature in section 2.2Eil and Rao (2011) find that updating following good news adheres quite closely to the Bayesian
benchmark, while updating following bad news produces posterior beliefs nearly uncorrelated withBayesian inference. Mobius, Niederle, Niehaus and Rosenblat (2013) find that subjects substantiallyover-weight good news relative to bad news.
1
al. (1999) for a review). Our paper takes a first step towards understanding these ob-servations, and their economic implications. In our model, differences in beliefs aboutthe self arise endogenously, generating a “North American” equilibrium in which over-confidence is more valuable than in another (“Japanese”) equilibrium. Our theorysuggests an interpretation of the empirical evidence on cultural differences as reflect-ing differences in actual beliefs and in the functional value of those beliefs. Traits suchas self-confidence or modesty can then be expected to be viewed as more desirablewhere their functional value is greater.
Beliefs about the self interact with the social and economic environment. Wefocus on one main characteristic of the environment that has attracted considerableattention in comparisons of Japan and the United States during the postwar pe-riod3: the degree of stability, or conversely the degree of mobility. What we havein mind are the following well-documented4 differences between the two countries:job mobility has been considerably lower in Japan, largely because of institutionssuch as “lifetime” employment and late promotions in larger firms, which also offermore attractive conditions than smaller firms; unemployment rates have been lowerin Japan; takeovers (with all the changes in management and strategy that they oftenentail) have been far less frequent in Japan; business start-up rates have been lower inJapan; investments in companies have tended to be more long-term in Japan (partlybecause of greater reliance on relationship banking); divorce rates have been muchlower in Japan... While these observations may have a variety of different causes, theimportant point for our purposes is that they tend to go in the same direction: i.e.from the point of view of a single individual who takes the environment as given, lifein Japan would be expected to entail greater stability (lower mobility) than in theUnited States. This was clearly the case up to the 1990s; since then the gap seems tohave narrowed but certainly not disappeared (see, for example, Moriguchi and Ono(2004), Ono (2010)).
In our model, we capture this characteristic of the environment through the prob-ability, π, that an individual will continue an existing “project” (activity, task, re-lationship) in the long term. If instead the project comes to an end earlier, theindividual has to decide whether to invest in a new project. We can also think ofπ as representing the expected fraction of projects that are continued in the longrun. Obviously there are many situations in which individuals can choose whetherto continue an existing project or invest in a new one; however, a salient differencebetween Japan and the United States seems to be the higher probability of contin-uing projects in the long term in Japan for institutional and other reasons that arelargely exogenous from an individual perspective. Thus, we treat π as a characteristicof the environment. Specifically, we begin by assuming that π is given in a society,reflecting existing institutions and other exogenous characteristics. We then considerthe implications of endogenizing π by allowing individuals to vote on the institutionsin their society.
The key idea we explore in the first part of the paper is the following. There is
3While the quotes presented at the beginning of the paper are intriguing, data on measures ofself-esteem and experimental evidence on self-confidence are only available for the postwar period.We therefore focus attention on this period.
4See, among others, Hashimoto and Raisian (1985), Imai and Kawagoe (2000), Moriguchi andOno (2004), Ono (2006, 2010).
2

a potential tradeoff between the benefits and the costs of overconfidence. In manycircumstances, an individual who is overconfident about his talent/skills will overes-timate his probability of success if he undertakes a new project (“I am talented, Iwill succeed”). He will also underestimate the benefits from exerting effort to identifyways of improving his performance on an existing, continuing project (“I am doingfine”). Overconfidence will then increase the likelihood of investing in new projects,while reducing effort to scrutinize performance on existing projects, pay attention tocriticism and negative feedback, and seek better ways of doing things. Evidence onthis is available for a variety of contexts5. The first,“initiative” effect can be beneficialwhen individuals have time-inconsistent preferences, by helping them to undertakenew worthwhile projects that would otherwise be forsaken because of a bias in fa-vor of immediate gratification. The second,“complacency” effect can inhibit valuablelearning and self-improvement.
We analyze the interplay of these two effects in an intrapersonal game6 betweenan individual’s current self and his future self, where the current self can influence thefuture self’s recall and interpretation of a (current) “bad” signal about his talent/skill.This allows us to capture parsimoniously the possibilities for memory management(e.g. through selective attention) and self-serving interpretations discussed more fullyin section 2. At the same time, for much of the analysis we maintain the standardassumption in economics that individuals are rational and “Bayesian”: in particular,the future self will update his beliefs taking into account the possibility that thecurrent self might have “suppressed” the bad signal. Thus individuals cannot simplychoose their future beliefs as they wish, but they can influence them to some extent.
Importantly, the current self takes into account the probability that the future
5Individuals’ confidence in their ability has been found to be positively related to their intentionsto start new businesses (Chen et al. (1998), De Noble et al. (1999)). Relatedly, patent inventorswho chose to start a new business have been found to possess higher levels of self-confidence thanpatent inventors who chose not to start a new business (Markman et al. (2002)). On the other hand,higher self-confidence has been found to be correlated with persistence in unproductive activities inspite of negative feedback (Whyte and Saks (2007)). Vancouver and Kendall (2006) measured self-confidence and subsequent exam performance for the same individuals taking five different exams.They found a negative relationship at the within-person level of analysis. Leung (2002) examineddata from the Third International Mathematics and Science Study (TIMSS), showing that HongKong, Japan, Korea and Singapore students outperformed their counterparts in other countries inmathematics achievement. He found that the most striking common factor in these four countries,different from the rest, was the relative low confidence in doing mathematics of the students. Woodand Lynch (2002) looked at the role of prior knowledge in learning about new products in situationswhere new information makes existing product knowledge obsolete. They found that, compared toconsumers with lower prior knowledge, those with higher prior knowledge learn less about a newproduct, and this is due to inattention at encoding (rather than reconstructive errors at retrieval).Berner and Graber (2008) review the evidence on the link between physician overconfidence anderrors in medical diagnosis. While a causal link in this context is particularly difficult to establish,there is some suggestive evidence. For example, in a study of radiologists given sets of “unknown”films to classify as normal or abnormal, the confidence level of the worst performers was higherthan that of the top performers. Finally, although the economics literature has not focused onthe implications of overconfidence for self-improvement, existing evidence concerning the impactof overconfidence on corporate investment decisions and acquisitions (Malmendier and Tate (2005,2008)) seems consistent with the “complacency” effect.
6The model, with only minor modifications, also admits an interesting alternative interpretationas an interpersonal game between parent and child. We discuss this in section 1.1.
3
self will have to decide whether to invest in a new project, versus the probabilitythat he will have to choose how much self-improvement effort to exert on an existing,continuing project. Our first main result is that overconfidence emerges in equilibriumwhen, and only when, the relative importance of undertaking new projects versusinvesting in improving one’s performance on existing projects is sufficiently high. Animmediate implication of this result is that we are less likely to observe overconfidencein “stable” societies, where the probability of continuing old projects is high, andmore likely to observe overconfidence in “dynamic” societies, where this probabilityis lower. This may help to explain the differences in self-esteem and self-enhancementdocumented for Japan and North America.
Our model also suggests that perfectionism (meant here as a disposition to be self-critical and to persistently seek improvement) will be considered more valuable in thefirst type of society, while dynamism (showing initiative, being enterprising) will beconsidered more valuable in the second. Interestingly, a key business concept thathas been very successful in Japan is the idea of kaizen (“continuous improvement”),which emphasizes the importance of gradual improvement at the corporate level.7
In order to investigate robustness and obtain additional empirical predictions, weextend our model in two ways in section 4. First, we consider a version of the modelwith a richer signal structure: an individual may receive not only a bad signal or nosignal as before, he may also receive a good signal. Our previous result, that overcon-fidence emerges in equilibrium when the probability of facing new project investmentdecisions is sufficiently high, continues to hold in this version of the model. Similarlywe find again the equilibrium with accurate beliefs for lower values of this probability.For lower values still, there is a new equilibrium, in which individuals suppress thegood signal, thereby reducing their ex-post confidence. The first equilibrium, in whichindividuals suppress the bad signal, yields a distribution of beliefs that is skewed to-wards higher self-confidence (relative to accurate beliefs), since those who receive thebad signal “pool” with those who receive no signal. This pattern resembles the onedocumented for North America. The second equilibrium, where individuals do notsuppress either signal, exhibits no such skewness, and is similar to the pattern ob-served for Japan. Finally the third equilibrium yields a distribution skewed towardslower self-confidence, different from North America and also from Japan.
We then extend the model in another direction, by considering the role of “naive”agents. These may be individuals who suppress bad signals without being aware of it.Alternatively, they may be individuals who are aware of their biases in processing andrecalling information, but lack the cognitive skills required for full Bayesian updatingof beliefs ex post. Unaware agents do not act strategically; cognitively-constrainedagents do, taking into account their cognitive constraints. We show that in very“dynamic” societies, all naive as well as sophisticated agents suppress the bad signalin equilibrium. Ex post, naive agents have higher self-confidence than sophisticatedagents. On the other hand, in very “stable” societies only unaware agents suppressthe bad signal; ex post, sophisticated and cognitively-constrained agents have the
7For a short description and commentary, see The Economist, 14 October 2009. Just as interestingis their explanation for why kaizen has “lost some of its shine” more recently: “Influential in thedecline of the idea was the new-found emphasis on the speed of change and on the need for firmsto “morph” in double-quick time to seize the opportunities presented by e-commerce and otherdevelopments in information technology”.
4

same beliefs. Thus if the population consists of a mixture of sophisticated and naiveagents, average self-confidence will be higher in the more “dynamic” societies. Thisis consistent with the evidence reviewed in section 2.
So far, our results have been obtained assuming that π, the degree of stabil-ity/dynamism, is given for a particular society. We then ask the question: whathappens if citizens can vote over institutions and thereby choose π? In the last partof section 4, we show that for some parameter values this leads to the interesting pos-sibility of multiple equilibria with endogenous π. In particular, we may observe twoex-ante identical societies in quite different equilibria: in one, individuals suppressbad signals and choose a low value of π, while in the other, individuals do not suppressbad signals, and they choose a high value of π. Thus overconfidence and dynamismreinforce each other in one equilibrium, realistic self-assessment and stability in theother.
Our analysis in section 4 focuses entirely on self-confidence as a motivationalmechanism. However, shame, and the desire to avoid it, can also be a powerful moti-vational mechanism. Recent research in social anthropology shows that the capacityto feel shame is pervasive across cultures, but cultures differ significantly in theirreliance on the emotion of shame as a motivational mechanism (see Fessler (2007)).This is particularly interesting for our purposes in light of the evidence, discussed insection 2, that shame plays a more important role in Japan than in North America,and that Japanese parenting practices tend to foster sensitivity to shame more thanAmerican ones. How do these motivational mechanisms interact?
We explore this question in section 5, where we modify the model by introducing acost of shame, S, associated with social disapproval. Since decisions to undertake newprojects (or not) are, at least imperfectly, observable by others (e.g. starting a newbusiness, taking up new activities, finding a new job, learning new skills, moving to adifferent location, starting new relationships), they can be subject to social approval(disapproval). In contrast, self-improvement effort is not observable by others. Wetherefore assume that an individual will experience the cost S if he is faced withthe choice to undertake a new project or not, and chooses not to go ahead8. Weinvestigate two questions. First, for a given cost of shame S, i.e. taking existingsocial and cultural norms as given, what is the set of equilibria of the intra-personalgame we studied in section 4 without allowing for shame? Second, what would bethe socially optimal value of S?
Intuitively, shame can provide incentives to undertake new projects, obviating theneed for overconfidence, and thereby improving incentives to invest in self-improvement.However, in the presence of unobservable individual heterogeneity, an equilibriumwith shame might imply that some individuals efficiently refrain from undertakingnew projects, and are inefficiently penalized for this, or that some individuals inef-ficiently undertake new projects. In fact, as we show, it is not efficient to have anintermediate cost of shame S, such that some individuals refrain from investment and
8We have also investigated a version of the model where the cost of shame is incurred whenthe original, continuing project fails. However, shame from failure is not efficient in our setting,essentially because failure occurs with some probability even when high effort is provided, so thatreliance on this as a motivational mechanism would be too costly. On the other hand, failurewill obviously lead to unfavorable updating of beliefs about the individual’s ability, which can beinterpreted as “stigma” from failure.
5

incur the cost of shame in equilibrium. The only efficient equilibria involving shameemerge for values of S which induce all individuals to invest rather than incur thecost of shame. Efficient equilibria with shame, therefore, entail a form of conformism.
We find that reliance on shame can be efficient in dynamic societies as well asin stable societies, depending on parameter values. For very “stable” societies, theefficient equilibrium never entails overconfidence, but may entail an important rolefor shame. For very “dynamic” societies, on the other hand, the efficient equilibriumwill entail either overconfidence and no role for shame, or no overconfidence andan important role for shame. Thus shame and overconfidence emerge as substitutemechanisms in dynamic societies, while overconfidence plays no role in very stablesocieties. This is consistent with the evidence discussed below.
The paper is organized as follows. The remainder of this section relates our work tothe existing literature in economics. Section 2 reviews the evidence from psychology,anthropology and economics that motivates our model. Section 3 introduces thebaseline model. The costs and benefits of overconfidence are examined in section 4,and a number of extensions of the basic analysis are discussed. Section 5 introducesshame. Section 6 concludes.
1.1 Relationship to the literature
A growing literature is demonstrating the importance of noncognitive skills and traitsfor a variety of life outcomes9. Several theoretical contributions have focused inparticular on the role of self-confidence: Benabou and Tirole (2002) have shownthat overconfidence can help to alleviate an under-investment problem arising whenpreferences are time-inconsistent10, while Benabou and Tirole (2011) also considerthe psychological benefits of overconfidence in the presence of anticipatory utility,and their implications for identity investments.11 We share with these papers theassumption that self-confidence can be influenced by biases in information processingand recall. Our focus, however, is on why such biases may be more common in someenvironments than others, and hence on cultural differences in self-confidence.
In this respect, our work is also related to Alesina and Angeletos (2005), andBenabou and Tirole (2006). These papers study the interaction between beliefs aboutthe relative importance of effort and luck in determining incomes, and choices ofredistributive policies. This leads to the possibility of multiple equilibria, with somesocieties exhibiting low levels of redistribution and beliefs in the importance of effort,while others exhibit high levels of redistribution and beliefs in the importance ofluck. In a similar vein, we show in section 4 how multiple equilibria can arise in our
9See Almlund, Duckworth, Heckman and Kautz (2011) for a review and discussion.10For a different approach to the problem of time-inconsistent preferences, see Becker and Mulligan
(1997), where individuals devote time and effort to make future pleasures less remote in their mind.11Related papers include Benabou (2013), which studies denial of bad news in groups when indi-
viduals have anticipatory preferences, Compte and Postlewaite (2004), who show that when confi-dence has a positive effect on performance, biases in information processing can enhance individualwelfare, Dessı (2008), where a demand for cultural over-confidence emerges as a solution to theunder-investment problem due to the presence of social externalities in cultural investment deci-sions, and Koszegi (2006), where individuals derive “ego utility” from positive views about theirability. Imperfect self-knowledge is also a key ingredient in the theory of endogenous peer effectsdeveloped by Battaglini et al. (2005)
6
model, with some societies exhibiting greater dynamism and overconfident beliefs,while others exhibit greater stability and no overconfidence.
A simple way to try to explain observed country differences in self-confidencemight be to suppose that they are due to country differences in time preference. Inour model, overconfidence only emerges in the presence of a bias towards immediategratification. The observed difference between the U.S. and Japan could then be dueto the Japanese being significantly more patient than North Americans. However,we are only aware of one systematic study of country differences in time discounting:Wang, Rieger and Hens (2009) present evidence on β for a sample of 45 countries.Their mean (median) for the U.S. is 0.69 (0.78), higher than the corresponding figuresfor Japan, 0.64 (0.70), implying if anything that the Japanese have a slightly greaterpresent bias. We therefore abstract from differences in time preferences in our model:our results are driven entirely by the trade-off between the costs and benefits ofoverconfidence, leading to different equilibria in “stable” and “dynamic” societies.
The possibility that observed differences in self-confidence might be due to geneticdifferences between Japanese and North Americans is sometimes suggested to us,but we are not aware of any evidence supporting this hypothesis. There is, on theother hand, evidence from longitudinal studies of Japanese individuals who movedto Canada and Canadian individuals who moved to Japan, showing a significanttendency for the Canadians’ self-confidence to decrease after moving to Japan, whilethe Japanese’ self-confidence increases after moving to Canada (Heine and Lehman(2004), see section 2 below). This suggests that genetic differences, if any, could onlybe part of the explanation for observed differences in self-confidence.
Another hypothesis that is sometimes put forward concerns the effects of selectionin migration patterns, combined with intergenerational transmission of traits. Histor-ically, the argument goes, migrations to North America are likely to have attractedindividuals with higher than average self-confidence, who then encouraged and nur-tured self-confidence in their children. While the importance of this form of selectionwould be very difficult to establish empirically12, the evidence reviewed in section 2.2does suggest an important role for differences in parenting practices between NorthAmerica and East Asia. The model we present in section 4, with minor modifications,admits an alternative interpretation in terms of intergenerational transmission, wherethe “future self” is the child, and the “current self” the parent, who internalizes thechild’s welfare. Although we do not focus on this interpretation in section 4, to dojustice to the evidence on memory and updating biases, we do give it more weightin section 5, where we study the role of shame. Our paper is therefore related tothe existing literature on cultural transmission. Bisin and Verdier (2000, 2001) studymore generally the intergenerational transmission of cultural traits. We focus insteadon specific traits (self-confidence, sensitivity to shame), and examine their role asmotivational mechanisms.
The functional role of emotions has attracted economists’ attention in recent work,notably in research on envy and regret by Coricelli and Rustichini (2010) and Rus-tichini (2008). We focus on the emotion of shame and explore the circumstances in
12Recent work by Abramitzky, Platt Boustan and Eriksson (2012) has established the importanceof selection effects in migrations to America for observable variables, such as occupation and wealth.No corresponding data is available for self-esteem.
7
which shame emerges as an equilibrium mechanism to induce efficient investment de-cisions. At the same time, we identify a social cost of reliance on this mechanism, dueto the impossibility of tailoring the personal cost of shame to “fit” other, privatelyknown individual characteristics. Thus shame can induce “too much” conformity.
Our approach here builds on the evidence from studies in social anthropology. Re-viewing these, Fessler (2007) notes that “shame is prototypically elicited by situationsin which i) the actor has failed to live up to some cultural standard for behavior, ii)others are aware of this failure, and iii) the actor is aware of others’ knowledge in thisregard”. It is not clear, in general, to what extent others’ disapproval and hostilityfollowing the violation of a cultural standard for behavior are a direct reaction tothe observed behavior, and to what extent they are derived from preferences overparticular individual traits that are inferred from the behavior13. Thus our modelingstrategy, in which shame attaches to actions, seems reasonable in our setting; weview it as complementary to models of conformity where damage to status attachesto inferred predispositions, as in Bernheim (1994).
2 Confidence and shame: evidence for North Amer-
ica and Japan
This section reviews the evidence in psychology, anthropology and economics thatmotivates our model.
2.1 Overconfidence?
A large literature in psychology has explored people’s need for a positive self-view,and, relatedly, the extent to which individuals hold overconfident beliefs about theirability. In this context, overconfidence can be defined in absolute or relative terms:individuals may believe that their ability is greater than it really is, or they maybelieve that their position in the overall distribution of ability in the relevant popu-lation is higher than it really is. We now review the main findings, highlighting theobserved differences between North America and Japan.
2.1.1 Self-esteem scores
One very popular approach is to estimate self-esteem scores by asking individuals toreport to what extent they agree or disagree14 with a number of statements intendedto capture self-esteem. The ten-item Rosenberg (1965) scale is the most widely usedfor this purpose, and has been applied in a very large number of studies. Items include“I am able to do things as well as most other people”; “All in all, I am inclined tofeel that I am a failure”; and “I take a positive attitude toward myself”. The first of
13The experimental evidence on how people respond to “unfair” behavior suggests that theirreactions are driven by both, outcomes and inferences about traits/intentions (see, for example, Falk,Fehr and Fischbacher (2003); Fehr and Schmidt (2005) provide an excellent review and discussion).
14Possible answers are “strongly disagree”, “disagree”, “agree” and “strongly agree”, with corre-sponding scores typically from one to four for positive items, and the order reversed for negativeitems.
8

these captures specifically beliefs about ability, and clearly does so in relative terms.The other two statements may also capture other influences on self-esteem, and couldreflect an absolute comparison (to some standard) or a relative one.
Self-esteem scores appear to differ substantially in North America and Japan,across numerous studies. The distribution of self-esteem scores for North Americansubjects is typically very skewed towards high self-esteem (see Baumeister et al. (1989)and Heine et al. (1999) for reviews and discussions); this is not the case for Japanesesubjects (Bond and Cheung (1983), Campbell et al. (1996), Heine et al. (1999),Mahler (1976), Schmitt and Allik (2005)). Moreover, North Americans tend to havesignificantly higher scores than Japanese for all items but one15 on the Rosenbergscale, including in particular the item that captures beliefs about (relative) ability(Heine et al. (1999)). Thus while differences in self-esteem may also capture otheraspects, they clearly reflect important differences in confidence about ability. Indeed,Schmitt and Allik (2005) decompose global self-esteem scores into subcomponents ofself-competence (feeling confident, capable and efficacious) and self-liking: the meanscore for self-competence is significantly higher for subjects in the United States thanin Japan.
An important question then is whether these findings reflect cultural differences.Evidence in favor of this interpretation is provided by Heine and Lehman (2004). Theyobtained self-esteem scores at different points in time for two samples of Japanesestudents visiting Canada. For one sample they found a significant increase in self-esteem with exposure to Canadian culture, while for the other sample the increase wasnot significant. Heine and Lehman similarly obtained self-esteem scores for a sampleof Canadian English teachers who went to live in Japan. They found a significantdecrease in self-esteem with exposure to Japanese culture.
2.1.2 Other measures of self-confidence and self-enhancement
The findings from studies using self-esteem scores have been confirmed by a largeempirical literature in psychology using a variety of related albeit different methods.These include:
(i) studies in which participants evaluate themselves and the average person onthe same scale. These studies have found a much greater degree of self-enhancement(the well-known “better-than-average” effect) among North American and Israeli par-ticipants than among East Asian (mainly Japanese and Singaporean) participants16.
(ii) studies in which participants estimate the percentage of people who are moretalented than themselves on a variety of dimensions. Here too North American sub-jects self-enhance much more than Japanese subjects17, exhibiting the so-called “falseuniqueness” effect (a good example of this is given by Svenson (1981): in his US sam-ple, 93% of participants believed themselves to be more skillful than the median in
15The exception is the item “I certainly feel useless at times”, for which there is no significantdifference.
16Brown and Kobayashi (2002), Crystal (1999), Endo, Heine and Lehman (2000), Heine andLehman (1999), Kobayashi and Brown (2003), Kurman (2001, 2003), Kurman and Sriram (2002),Sedikides, Gaertner and Toguchi (2003).
17Heine, Kitayama and Lehman (2001), Heine and Lehman (1997), Markus and Kitayama (1991),Norasakkunkit and Kalick (2002).
9

the group).(iii) studies in which participants indicate how much their successes and failures
are due to their own abilities. American students are much more likely than Chineseor Japanese students to attribute their successes to their ability and their failures toexternal factors18.
(iv) studies eliciting participants’ memories of their successes and failures. Endoand Meijer (2004) found evidence of self-enhancement among American subjects, butthe opposite among Japanese subjects.
All these and other studies have been reviewed in a meta-analysis by Heine andHamamura (2007): they conclude that North Americans show a clear self-serving biaswhile East Asians do not.
2.1.3 True or apparent overconfidence?
Benoıt and Dubra (2011) have argued that studies where overconfidence is measuredby asking individuals to rate themselves relative to the median cannot be used todemonstrate true overconfidence. In particular, the finding that a majority of peoplerate themselves above the median is consistent with Bayesian updating by individu-als with imperfect knowledge of their ability, starting with a common prior. Burks,Carpenter, Goette and Rustichini (2013) have studied the implications of Bayesianupdating from a common prior in this context and identified restrictions imposed onthe joint distribution of beliefs and true ability. They then tested the restrictions ex-perimentally and rejected them. This, combined with all the other evidence discussedin this section, suggests that overconfidence is an important phenomenon. Yet its im-portance is significantly greater in North America than in Japan: this observation isthe main focus of our paper.
2.1.4 Incentivized beliefs about ability
To economists, beliefs elicited in experiments where subjects are given no monetaryincentives to tell the truth may not seem sufficiently reliable. This still would notexplain the systematic difference between North American and Japanese responsesacross a variety of samples. More importantly though, the presence of a substantialbias towards overconfidence among North Americans has been confirmed by Burks etal. (2013), who do address the potential concern over the reliability of answers in theabsence of monetary incentives19. They administer two tests of cognitive ability to1016 US subjects, eliciting their beliefs about their ability before and after the test.Each time, subjects are asked to specify which quintile of the group’s performance theybelieve they will be (were) in. Monetary incentives are provided to motivate subjectsto give correct answers. The results show that well over 60% of subjects believethey are in the top two quintiles; moreover, overconfident judgements are pervasivewherever possible, i.e. across the first four quintiles of the distribution. Relatedly,Eil and Rao (2011) and Mobius et al. (2013) find, again eliciting incentivized beliefs,that North American subjects revise their beliefs differently in response to good newsand bad news (see footnote 2).
18Anderson (1999), Endo and Meijer (2004).19See also Hoezl and Rustichini (2005).
10

2.1.5 Self-esteem maintenance strategies
How are overconfident beliefs sustained? In psychology, a large North Americanliterature has documented the existence of self-serving biases, whereby individualsessentially suppress “bad” signals about their ability and other attributes. This isachieved in a number of ways, including the following:
(a) selective recall of information (e.g. Sanitioso, Kunda and Fong (1990));(b) subjecting “negative” information to greater scrutiny to find flaws in it or rea-
sons to dismiss its significance (see Baumeister and Newman (1994), Kunda (1990)),and possibly develop alternative explanations that effectively suppress the bad signal(Ditto and Lopez (1992), Ditto et al. (1998));
(c) dismissing the importance of skills one does not have and emphasizing thevalue of traits one does possess (Dunning and Cohen (1992), Dunning et al. (1989),Tesser and Paulhus (1983));
(d) perceiving own shortcomings as common, own strengths and abilities as un-common (Muellen and Goethals (1990)).
Yet where attempts have been made to find similar evidence of self-serving biasesamong Japanese subjects, they have generally failed to do so. For example, as notedearlier, North American subjects tend to attribute their successes to their ability andtheir failures to external factors such as bad luck (see Zuckerman (1979) for a review).However, studies of Japanese subjects tend to find instead that they attribute failuresas much as successes to own (in)abilities (Kitayama et al. (1995), Brown, Gray andFerrara (2005)).
Relatedly, Baumeister and Jones (1978) found that American participants com-pensated for negative self-relevant feedback in one domain by inflating their self-assessments in another domain. Heine, Kitayama and Lehman (2001) have investi-gated whether Canadian and Japanese participants exhibit a similar tendency. Allparticipants were given success or failure feedback following a creativity test; theywere then asked to evaluate themselves on dimensions unrelated to creativity. Cana-dian participants did not show any significant difference in self-evaluations on unre-lated dimensions following success or failure feedback on the creativity task. Japaneseparticipants provided less favorable self-evaluations on the other dimensions followingfailure on the creativity test.
Further evidence suggesting that self-esteem maintenance strategies play a moreimportant role for North Americans than for Japanese is provided by studies of self-affirmation and dissonance. In these studies, participants typically choose betweentwo desirable alternatives; they also evaluate the two alternatives before and aftermaking their choice. North American participants usually evaluate their chosen al-ternative more positively, and the rejected alternative less positively, after makingtheir choice (e.g. Steele, Spencer and Lynch (1993), Heine and Lehman (1997)). Thisbehavior is consistent with a desire to maintain self-esteem by rationalizing one’schoices ex post as “the right ones”. Japanese participants, in contrast, do not sys-tematically change their evaluations after making their choice (Heine and Lehman(1997)).
11

2.2 Shame
North Americans and Japanese appear to differ also in terms of the importance theyattach to shame. In an influential early work on this topic, Benedict (1946) charac-terized Japan as a shame culture. She was subsequently criticized by a number ofresearchers for defining this in terms of reliance on external sanctions (others’ disap-proval, losing face etc.) for good behavior - a notion sometimes referred to as “publicshame”. Some authors have emphasized instead the importance of “private shame”,whereby others’ critical gaze on the self is internalized. Nevertheless, as Heine et al.(1999) pointed out, “most are in agreement that shame occupies a privileged positionfor Japanese” - a claim that still applies to date (see for example Creighton (1990);Crystal et al. (2001); Doi (1973); Fessler (2007); Johnson (1993); Kuwayama (1992);Lebra (1983)).
In contrast, research by social anthropologists has found that Californians have a“relatively impoverished cognitive/lexical ‘landscape of shame’” (Fessler (2007)), andthat for Californians shame as an emotion “is overshadowed by guilt” (which, unlikeshame, “is prototypically associated with issues of harm to others”).
Recent research has investigated the mechanisms that generate cultural differencesin the importance of shame. For example, Miller, Fung and Mintz (1996) studiedparental practices in American families in Chicago and Chinese families in Taipei.They found that American parents put considerably more emphasis on protectingtheir children’s self-esteem than Chinese parents. In contrast, Chinese parents putmore emphasis on inducing shame and self-criticism following behavioral transgres-sions. Studies focusing on the comparison of Japanese and American mothers havefound that the former are more likely to use moral reasoning, to encourage children tothink about how others might perceive their behavior, and to induce empathy, guilt,anxiety and shame in response to discipline problems20.
To summarize, the evidence reviewed in this section points to a more impor-tant role for shame in Japan than in North America, and a more important rolefor (over)confidence and self-esteem in North America than in Japan. We explorepossible reasons for this in the remainder of the paper.
3 Baseline model
Our baseline model modifies the one introduced by Benabou and Tirole (2002). It hastwo periods and three dates, t = 0, 1, 2. At the beginning of the first period (t = 0),each individual starts a project (activity, task, relationship). At this stage, individualsare indistinguishable. For simplicity, there is no cost of starting the project. Oncethey have started, individuals (privately) receive a signal informative about theirability/skill, θ. They choose their interpretation and recall strategy. At t = 1 theindividual can continue the same project with probability π. In this case, he can, ata cost, invest in self-improvement, thereby increasing the expected returns from theproject. With probability 1 − π, on the other hand, the individual cannot continue
20See Hess, Kashiwagi, Azuma, Price and Dickson (1980); Kabayashi-Winata and Power (1989);Lewis (1996); Rothbaum, Pott, Azuma, Miyake and Weisz (2000); Weisz, Rothbaum and Balackburn(1984); Zahn-Waxler, Friedman, Cole, Mizuta and Hiruma (1996).
12
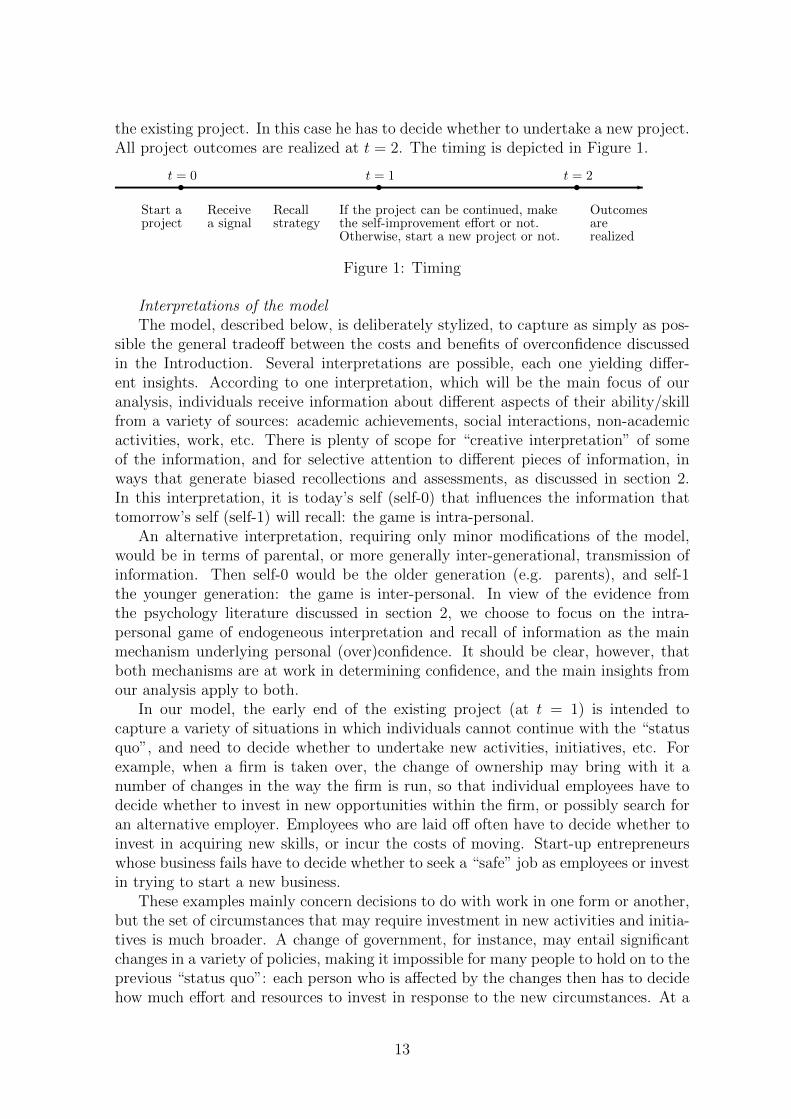
the existing project. In this case he has to decide whether to undertake a new project.All project outcomes are realized at t = 2. The timing is depicted in Figure 1.
-st = 0
Start aproject
st = 1
Receivea signal
Recallstrategy
If the project can be continued, makethe self-improvement effort or not.Otherwise, start a new project or not.
st = 2
Outcomesarerealized
Figure 1: Timing
Interpretations of the modelThe model, described below, is deliberately stylized, to capture as simply as pos-
sible the general tradeoff between the costs and benefits of overconfidence discussedin the Introduction. Several interpretations are possible, each one yielding differ-ent insights. According to one interpretation, which will be the main focus of ouranalysis, individuals receive information about different aspects of their ability/skillfrom a variety of sources: academic achievements, social interactions, non-academicactivities, work, etc. There is plenty of scope for “creative interpretation” of someof the information, and for selective attention to different pieces of information, inways that generate biased recollections and assessments, as discussed in section 2.In this interpretation, it is today’s self (self-0) that influences the information thattomorrow’s self (self-1) will recall: the game is intra-personal.
An alternative interpretation, requiring only minor modifications of the model,would be in terms of parental, or more generally inter-generational, transmission ofinformation. Then self-0 would be the older generation (e.g. parents), and self-1the younger generation: the game is inter-personal. In view of the evidence fromthe psychology literature discussed in section 2, we choose to focus on the intra-personal game of endogeneous interpretation and recall of information as the mainmechanism underlying personal (over)confidence. It should be clear, however, thatboth mechanisms are at work in determining confidence, and the main insights fromour analysis apply to both.
In our model, the early end of the existing project (at t = 1) is intended tocapture a variety of situations in which individuals cannot continue with the “statusquo”, and need to decide whether to undertake new activities, initiatives, etc. Forexample, when a firm is taken over, the change of ownership may bring with it anumber of changes in the way the firm is run, so that individual employees have todecide whether to invest in new opportunities within the firm, or possibly search foran alternative employer. Employees who are laid off often have to decide whether toinvest in acquiring new skills, or incur the costs of moving. Start-up entrepreneurswhose business fails have to decide whether to seek a “safe” job as employees or investin trying to start a new business.
These examples mainly concern decisions to do with work in one form or another,but the set of circumstances that may require investment in new activities and initia-tives is much broader. A change of government, for instance, may entail significantchanges in a variety of policies, making it impossible for many people to hold on to theprevious “status quo”: each person who is affected by the changes then has to decidehow much effort and resources to invest in response to the new circumstances. At a
13

more personal level, changes in family circumstances, such as divorce, also confrontindividuals with choices about new investments (relationships, home, work, etc.).
In section 4, we shall distinguish between more “stable” societies, in which theprobability of being able to hold on to the status quo is higher, and more “dynamic”societies, in which the probability of having to make decisions about investment innew activities is higher. To begin with, these differences will be captured by theexogenous parameter π, reflecting both exogenous factors and institutions. Our ap-proach here will be essentially positive, addressing the following question: for a givenset of external factors and society-wide institutions (indexed by π), what patternsof confidence will emerge when individual members of the society attempt to behave(and teach their children to behave) in ways that maximize their expected utility,subject to the constraints implied by those external factors and institutions? In thelast part of the section, we will also take a more normative approach and considerwelfare consequences. Finally, we will allow for π to be determined endogenouslythrough voting, which enables citizens to choose institutions.
3.1 Projects
The initial project brings a benefit W if it succeeds and zero otherwise. The proba-bility of success depends on the individual’s ability; for simplicity, it is equal to θ. Weassume that θ ∈ [0, θmax], where 0 < θmax < 1. Thus even the most talented/skilledindividual cannot be sure of success. If the project is continued at t = 1, the individ-ual decides whether to exert self-improvement effort: by incurring the cost k, he canincrease the probability of success by φ(θmax− θ), where 1 > φ > 0. This assumptioncaptures the idea that by focusing on his failings and weak points, paying attentionto criticism and other negative feedback, searching for new information and exploringalternative approaches and ideas, the individual can identify and seek out opportuni-ties for improvement, and thereby achieve a better performance. The scope for suchimprovement will be greater for individuals with lower initial skill. This specificationenables us to model as simply as possible the“complacency” effect of overconfidencediscussed in the Introduction21.
If the existing project cannot be continued at t = 1, the individual is faced witha different choice. He can incur a cost c to undertake a new project, which will yieldbenefit V if successful and zero otherwise. The probability of success in this case isθ. Alternatively, he can undertake another activity whose outcome is less sensitiveto ability. For simplicity, we assume that the return from this alternative activity isfixed, and normalize it to zero.
3.2 Preferences
We allow for time-inconsistent preferences by assuming that individuals at t = 1discount expected payoffs at t = 2 with a discount factor equal to βδ, where δ is
21For a colourful account of how overconfidence can inhibit valuable learning and improvement,see also Kroll et al. (2000). Their examples range from strategic decisions at General Motors toNapoleon!
14

the normal discount rate, while β < 1 corresponds to hyperbolic discounting. In thiscase, people give an “excessive” weight to the present.22
3.3 Information and beliefs
Self-0 receives a signal s concerning his ability θ. In the baseline model, for simplicity,we focus on the case where s can take just two values: s = B (“bad” signal) ands = ∅ (no signal). Prior beliefs concerning the signal are described by the probabilityq; that is, s = ∅ with probability q and s = B with probability 1− q. We can thinkof q as the proportion of higher-ability individuals in the population. The expectedvalue of θ conditional on each possible realization of the true signal s is given by:
θL = E[θ|s = B] < θH = E[θ|s = ∅].Let s be the signal transmitted by self-0 to self-1. We can think of this as (en-
dogeneous) memory. Given our assumptions, if the true signal is s = ∅, there is noopportunity for signal manipulation; thus s = ∅. On the other hand, if the true signalis s = B, self-0 may either communicate the signal truthfully to self-1 (s = B), orhe may decide to suppress the bad signal (s = ∅), as discussed in section 2. At date1, the state is realized: with probability π the project is continued, otherwise thefirst project ends and self-1 has to decide whether to undertake a second project. Atthis date, and before making his investment or effort decision, self-1 privately learnsrespectively his cost c or k. At date 0, the cost c is known to be uniformly distributedover the interval [cL, cH ]. Similarly the cost k is known to be uniformly distributedover the interval [kL, kH ].
To make the analysis interesting, we assume that:
δφ(θmax − θH)W > kL
self-improvement is always efficient if the cost is sufficiently low; and
δφ(θmax − θL)W < kH
self-improvement is always inefficient if the cost is sufficiently high. Similarly, weassume that:
δθLV − cL > 0
investment in the new project is always efficient if the cost is sufficiently low, and
δθHV − cH < 0
investment in the new project is always inefficient if the cost is sufficiently high.Self-0 has just one decision to make, the recall strategy; that is, the probability
that the bad signal will be recalled by self-1:
h = Pr[s = B|s = B].
We shall denote by h∗ the beliefs held by self-1 concerning self-0’s strategy.The recall strategy is depicted in Figure 2.
22See Strotz (1955) and Laibson (1997).
15

Figure 2: Recall strategy
4 The costs and benefits of overconfidence
4.1 Self-1 belief updating and behavior: sophisticated indi-viduals
Consider self-1’s decisions at date 1, in the light of the information available to him.Self-1 has to form expectations over his ability θ. In doing so, he will take intoaccount the possibility that self-0 may have suppressed the true signal s. Whens = B, clearly there has been no suppression; self-1 will therefore have revised beliefsθL. When s = ∅, self-1 estimates the following probability that the signal is accurate(the signal’s “reliability”):
r∗ = Pr[s = ∅|s = ∅;h∗] =q
q + (1− q)(1− h∗)implying that his revised belief is given by:
θ(r∗) = r∗θH + (1− r∗)θL.
Denoting his revised belief by θ∗, clearly self-1 will exert self-improvement effort if,and only if,
βδφ(θmax − θ∗)W > k.
If the first project has ended, self-1 will undertake the new project if, and only if,
βδθ∗V − c > 0.
16

4.2 Self-0 strategy
When s = B, self-0 has to choose the recall strategy, h. If he transmits the signalaccurately to self-1 (s = B), his expected utility (ignoring discounting between date0 and date 1 for simplicity) is given by:
UT (θL) = π
[δθLW +
∫ βδφ(θmax−θL)W
kL
{δφ(θmax − θL)W − k}gdk
]
+ (1− π)
∫ βδθLV
cL
{δθLV − c}fdc
where the subscript T stands for “truth”. If on the other hand self-0 suppresses thebad signal (s = ∅), his expected utility depends on self-1’s beliefs about the reliabilityof the signal, r∗, and is given by:
US(θL, θ(r∗)) = π
[δθLW +
∫ βδφ(θmax−θ∗)W
kL
{δφ(θmax − θL)W − k}gdk
]
+ (1− π)
∫ βδθ∗V
cL
{δθLV − c}fdc
where the subscript S stands for “suppression”. The net gain from suppressing thebad signal is therefore equal to:
US(θL, θ(r∗))− UT (θL) = −π
∫ βδφ(θmax−θL)W
βδφ(θmax−θ∗)W{δφ(θmax − θL)W − k}gdk
+ (1− π)
∫ βδθ∗V
βδθLV
{δθLV − c}fdc. (1)
The first term represents the loss due to overconfidence, which discourages self-improvement effort. The second term represents the impact of overconfidence onthe decision to invest in the new project. This yields a gain to the extent that itcorrects the under-investment problem due to hyperbolic discounting; if this prob-lem is small, though, there may be excessive confidence and over-investment. Forexpositional simplicity, we shall focus on the more interesting case where β < θL/θH ,which rules out the possibility of over-investment irrespective of the beliefs held byself-1. We then have a clear tradeoff between the benefits of overconfidence, whichalleviates the under-investment problem for new project decisions, and the costs ofoverconfidence, which exacerbates the problem of under-provision of self-improvementeffort.
4.3 Perfect Bayesian equilibria (PBE)
We now characterize the set of Perfect Bayesian equilibria.23
23While case (i) in Proposition 1 is similar to the case of “defensive pessimism” and case (ii)resembles the leading case in Benabou and Tirole (2002), even though we vary π rather than β in
17

Proposition 1 There exist two threshold values, πH and πL (with πH > πL), suchthat: (i) if π > πH , there is a unique PBE with h∗ = 1; (ii) if π < πL, there is aunique PBE with h∗ = 0; (iii) otherwise, there are three PBEs: the two pure-strategyequilibria with h∗ = 1 and h∗ = 0 , and a mixed-strategy equilibrium.
Intuitively, when the probability of continuation of the existing project is suffi-ciently large, the expected loss from suppressing the bad signal, which discouragesself-improvement effort, will be more important than the expected gain, arising fromthe positive impact of overconfidence on new project investment decisions. Thus theoptimal strategy for self-0 will be to transmit the signal truthfully. On the otherhand, when the probability of having to choose whether to undertake the new projectis high enough, the expected gain from suppression of the bad signal, which alleviatesthe under-investment problem, will be greater than the expected loss, so that the op-timal strategy for self-0 will be to suppress the bad signal. For intermediate values ofπ, the trade-off is such that there are multiple equilibria: a pure-strategy equilibriumwith truthful transmission, a pure-strategy equilibrium with suppression of the badsignal, and a mixed-strategy equilibrium.
The intuition for this result is as follows. Consider some value of π within theintermediate range (πH > π > πL). When self-1 is very sceptical about the reliabilityof self-0’s signal (h∗ = 0), θ∗ will be relatively low. Note that the benefit of suppressingthe bad signal is due to the fact that for some realizations of the cost c which arelower than the expected benefit from investing in the new project, overconfidence willlead to (efficient) investment, whereas in the absence of overconfidence there wouldbe no investment because of hyperbolic discounting. For low θ∗ the marginal benefitwill be high, since the cost realizations for which this switch to efficient investmentwill occur will be those for which the net expected benefit from investment is high.As θ∗ increases, however, the marginal benefit decreases. The cost of suppressing thebad signal, on the other hand, is due to the fact that for some realizations of the costk, overconfidence will deter self-1 from exerting self-improvement effort, even thoughthis effort would be efficient. For low θ∗, the marginal cost will be relatively low, sincethe cost realizations for which the switch away from self-improvement effort will occurwill be those for which the net expected benefit from exerting effort is relatively low.As θ∗ increases, self-improvement effort is discouraged also for lower cost realizations;i.e. the ones for which the net expected benefit from exerting effort is higher. Thusthe marginal cost increases as θ∗ increases.
In other words, given π, the gain from suppressing the bad signal increases ata decreasing rate with the level of trust by self-1, while the cost increases at anincreasing rate. For π within the intermediate range (πH > π > πL), therefore, therewill be a mixed-strategy equilibrium corresponding to the intermediate level of trustby self-1 which leaves self-0 exactly indifferent between truthful transmission andsuppression of the bad signal. In addition, since more trusting beliefs by self-1 willreduce the net gain from suppression, there will be a pure-strategy equilibrium withtruthful transmission. Similarly, since less trusting beliefs by self-1 will increase the
this Proposition, it may be worth noting that we cannot simply apply the proof of Proposition 2 intheir paper, and thus adopt a different proof method. The details of the difference in the proof arein the Appendix.
18

net gain from suppression, there will be a pure-strategy equilibrium with suppressionof the bad signal.
4.3.1 Overconfidence and underconfidence
The results summarized in Proposition 1 show that different equilibria are possibledepending on the value of π, including pure strategy equilibria with accurate recallor complete suppression of the bad signal, as well as mixed strategy equilibria. Wenow consider the implications for confidence.
In a sufficiently large population, our assumptions mean that a fraction 1− q willobserve the bad signal, while the remainder will observe no signal.
In a pure strategy equilibrium with accurate recall, updated beliefs at t = 1 willbe θL for those who observed the bad signal, and θH for those who did not: there willbe no overconfidence and no underconfidence.
In a pure strategy equilibrium with suppression of the bad signal, updated beliefsat t = 1 will be the same for all individuals, equal to θ ≡ qθH + (1 − q)θL. Clearly,therefore, there will be both overconfidence and underconfidence in absolute terms.This is because low-ability individuals essentially pool with high-ability individuals:as a consequence, low-ability individuals will have overconfident beliefs, while high-ability individuals will have under-confident beliefs. If we assume that low-abilityindividuals represent in fact the majority in the population (i.e. q < 0.5), the medianability is equal to θL, implying that most people will hold overconfident beliefs bothin absolute and in relative terms.
4.3.2 Implications and discussion
Our results suggest that overconfidence is more likely to prevail in very “dynamic”societies (low value of π) than in very “stable” societies (high value of π). The US canbe thought of as a very dynamic society in the sense of this paper: takeovers play animportant role in corporate governance; employee turnover is relatively high; layoffsare common during economic downturns; entrepreneurial activity is high. Politically,two main parties alternate in government. Divorce rates are relatively high.
Japan, during much of the post-war period (the period that shaped the confidenceattitudes examined in the psychology studies discussed in section 2), has been arelatively more stable society, with one main party in power during much of theperiod, an emphasis on lifetime employment with the same firm, a very minor role fortakeovers in corporate governance, combined with a tendency to invest for the longterm, and to form stable industrial/financial groups.
Our results are therefore consistent with the finding of significantly greater over-confidence in the U.S. than in Japan. They also suggest that confidence attitudesin Japan may change in the future, to the extent that Japan becomes a much more“dynamic” society in the sense of this paper (but see also section 5 on this).
Our main focus is on the US and Japan, two countries for which the distinctionbetween “high-π” and “low-π” societies appears to fit well. They are also the twocountries for which the most significant differences in self-esteem scores have beendocumented in a number of studies. It is nevertheless interesting to look at self-esteemscores for other countries too, presented by Schmitt and Allik (2005). Obviously many
19
countries appear to be “low-π” on some dimensions and “high-π” on others: thesecountries correspond to those in the intermediate range for π in our model, suggestingthat multiple equilibria are possible. We might conjecture, though, that a countrylike Switzerland will be closer to the “high-π” type, and a country like Israel to the“low-π”. Interestingly, Schmitt and Allik (2005) report a relatively low mean self-competence score24 for Switzerland (14.30) and a high one for Israel (17.50): thesecan be compared to the reported mean scores for Japan (13.33) and the US (17.21).While our model is too stylized to provide an adequate comprehensive explanation fordifferences in self-esteem scores across countries, these findings suggest that it maycapture part of the explanation, and may usefully inform future empirical work.25
4.4 Extensions
The analysis developed in this section can be extended in a number of interestingdirections: we review and discuss some of them below.
4.4.1 Richer signal structure
While the main insights of the model emerge clearly in the simplest version with justtwo signals (bad signal and no signal), it is worth considering what happens if wealso allow for a good signal. Formally, the model is modified as follows: s can takeone of three values, s = B (“bad” signal) with probability p, s = ∅ (no signal) withprobability q, and s = G (“good” signal) with probability 1 − q − p. Denote by θsthe expected value of θ conditional on each possible realization of the true signal s.Naturally, we assume that θB < θ∅ < θG.
26
If the true signal is s = ∅, again, there is no opportunity for signal manipulation;thus s = ∅. On the other hand, if the true signal is s = B (or G), self-0 may eithercommunicate the signal truthfully to self-1 (s = B (or G)), or he may decide tosuppress the signal (s = ∅). Let hj denote the recall strategy chosen by self-0 whenhe receives the signal j ∈ {B,G}; that is, hj = Pr[s = j|s = j].
For simplicity, we focus on pure strategy equilibria. The following result rules outthe possibility of an equilibrium in which the individual suppresses the bad signal andthe good signal:
24Self-competence scores best capture beliefs about ability, as discussed in section 2. The samerankings emerge if we look instead at global self-esteem scores.
25It is tempting to consider possible cross-sectional implications of our analysis: do individualswho expect, for exogenous reasons, to face more frequent new investment decisions tend to hold moreconfident beliefs, ceteris paribus? We are not aware of any empirical study specifically addressing thisquestion. The evidence on CEO overconfidence (Malmendier and Tate (2005, 2008)) is suggestive,but endogeneity is clearly an issue. Casual comparisons between different groups are fraught withdifficulties: for example, comparing confidence levels among children of married and divorced parentswould need to control for the degree of parental attention, caring and support, which can impact achild’s self-esteem directly, generating a potential confound with the effect of divorce on expectationsof future stability.
26Similarly, we assume that δφ(θmax − θG)W > kL, δφ(θmax − θB)W < kH , δθBV − cL > 0, andδθGV − cH < 0. Furthermore, we focus on the more interesting case where β < θB/θG, which rulesout the possibility of over-investment in new projects, and β < (θmax − θG) / (θmax − θB), whichrules out the possibility of over-investment in self-improvement, irrespective of the beliefs held byself-1.
20

Lemma 1 In any Perfect Bayesian equilibrium, it is impossible to have h∗B < 1 andh∗G < 1.
We therefore have three pure strategy equilibria to consider: one with accuratetransmission of both signals, one with suppression of the bad signal, and one withsuppression of the good signal. The conditions for each of these three equilibria aregiven below.
Proposition 2 There exist four threshold values, πOL < πOH < πUL < πUH :(i) if π < πOL , there is a unique PBE with h∗B = 0 and h∗G = 1;(ii) if πOL < π < πOH , there are two PBEs: (a) h∗B = 0 and h∗G = 1, (b) h∗B = 1 and
h∗G = 1;(iii) if πOH < π < πUL , there is a unique PBE with h∗B = 1 and h∗G = 1;(iv) if πUL < π < πUH , there are two PBEs: (a) h∗B = 0 and h∗G = 1, (b) h∗B = 0
and h∗G = 0;(v) otherwise, there is a unique PBE with h∗B = 1 and h∗G = 0.
Intuitively, when the expected loss from under-investment in new projects is suf-ficiently large, it is optimal to suppress the bad signal. On the other hand, when theexpected loss from under-provision of self-improvement effort is sufficiently large, itis optimal to suppress the good signal. When the trade-off between these two effectsis more balanced, we can have an equilibrium with accurate transmission of bothsignals.
Thus in very dynamic societies, the bad signal is suppressed in equilibrium, gen-erating a distribution of ex-post beliefs that is skewed towards higher self-confidence(relative to accurate beliefs): individuals who have received the good signal havethe highest (and accurate) level of self-confidence, but then those who received thebad signal pool with those who received no signal, achieving a higher level of self-confidence than if they had accurate beliefs. The skewness towards higher self-esteemis consistent with the pattern documented for North Americans, as discussed in sec-tion 2.
In relatively more stable societies, we can have the equilibrium with truthfultransmission of both signals. Ex post beliefs are then accurate, generating a moresymmetric distribution, consistent with the pattern documented for Japan. Finally forsocieties where the probability of facing new project investment decisions is very low,the equilibrium exhibits suppression of the good signal, generating a distribution ofex-post beliefs skewed towards lower self-confidence. We conjecture that this pattern,which does not resemble those observed for either Japan or the United States, mayrequire a degree of “stability” that is unlikely to be found in the presence of a highlyintegrated global economy.
4.4.2 Naive agents
Our analysis so far has assumed that individuals are rational and cognitively so-phisticated. They are therefore aware of their own incentives to engage in memory-management and self-esteem maintenance strategies, and able to update their beliefsaccordingly. In reality, there may also be some naive individuals who suppress bad
21

signals about their ability without being in any way aware that they are doing so,and hence without taking this possibility into account in updating their beliefs expost. These unaware agents always have ex-post beliefs equal to θH . Their presencecan therefore generate some overconfidence, on average, even in a population whereother agents do not engage in self-esteem maintenance strategies.
A different way in which individuals may depart from the assumption of rationalityand cognitive sophistication is that they may lack the cognitive skills for full Bayesianupdating of beliefs ex post, even though they are aware of the potential scope formemory management ex ante. These agents can behave strategically ex ante, takinginto account their cognitive constraints. To see the implications, consider again thebaseline version of our model, and suppose that self-1 lacks the cognitive skills forBayesian updating completely, so that his belief upon observing no signal (s = ∅) issimply θ∗ = θH . Knowing this, self-0 expects the net gain from suppressing the badsignal to be equal to:
US(θL, θ∗)− UT (θL) = −π
∫ βδφ(θmax−θL)W
βδφ(θmax−θH)W
{δφ(θmax − θL)W − k}gdk
+ (1− π)
∫ βδθH
βδθLV
{δθLV − c}fdc.
It is straightforward to check that there is then a threshold value πN such that0 < πN < 1 and the net gain from suppressing the bad signal is strictly positive(negative) for π < (>)πN .
An immediate implication of this (together with Proposition 1) is that for suf-ficiently low values of π all agents, sophisticated and naive, will suppress the badsignal. Ex post, naive agents will have higher self-confidence (θH) than sophisticatedagents (θ). This is true for naive agents of both types, i.e. those who are unawareand those who are cognitively constrained. In contrast, when π is sufficiently high,only unaware agents will suppress the bad signal. These individuals will always havebeliefs equal to θH ex post. Cognitively-constrained but aware agents, on the otherhand, will have the same ex-post beliefs as sophisticated agents (i.e. accurate beliefs).The average level of self-confidence in the population will therefore be higher, for agiven mixture of sophisticated, cognitively-constrained and unaware agents, in verydynamic societies than in more stable ones. This may help to explain the higheraverage level of self-esteem in the United States, relative to Japan.
4.4.3 Welfare implications
Consider again the baseline version of the model. We have seen that, conditionalon observing the “bad” signal concerning their ability, individuals may optimallysuppress the signal in some circumstances (depending on the value of π). This leadsthem to have higher beliefs about their ability than in an equilibrium with accuraterecall. On the other hand, in an equilibrium with signal suppression, sophisticatedindividuals who observe no bad signal will have underconfident beliefs ex post, sincethey rationally take into account the possibility that they may have suppressed a badsignal.
22

In assessing the welfare implications of memory-management and creative inter-pretation strategies, we take an ex ante perspective27: if an individual could choosewhether to engage in such strategies or refrain from doing so before learning his trueability (more precisely, before observing the true signal s), what would he do?
It turns out that ex ante it would be optimal to commit not to engage in memory-management and creative interpretation strategies: the expected cost of such strate-gies outweighs the expected gain. The intuition for this result is the following. As wehave seen, in an equilibrium with suppression of the bad signal, low-ability individualswill have overconfident beliefs and high-ability individuals will have underconfidentbeliefs (in absolute terms). This means that low-ability individuals will be discouragedfrom investing in self-improvement, while high-ability individuals will be encouragedto invest in self-improvement. Yet it is the low-ability individuals who would benefitmost from investment in self-improvement. Similarly, low-ability individuals will beencouraged to invest in the new project, while high-ability individuals will be dis-couraged: yet it is the high-ability individuals who will benefit most from investmentin the new project.
4.4.4 Endogenizing dynamism and stability
Our analysis so far has taken π as a given characteristic of the economic and socialenvironment, reflecting existing institutions as well as other exogenous factors influ-encing the degree of stability. We now extend the model to allow individuals in asociety to vote over institutions, and thereby choose π. This enables us to examinethe interaction between belief formation and institutional choices underlying the de-gree of dynamism or stability in the society. In practice, the degree of stability ina country at any given time will reflect both, institutional choices and a variety ofother exogenous influences (e.g. shocks to technology and the natural environment,wars, relevant changes in other countries, etc.). Thus we see the analysis presentedearlier and the one developed below as complementary perspectives.
To keep the model as simple as possible, the extension has four dates, t = 0, 1,2, 3. At t = 0, each individual starts a project, and receives a signal informativeabout his ability θ. He chooses his recall strategy. At t = 1 each individual updateshis beliefs. He then votes on institutions that determine π. For simplicity, π may behigh, πH , or low, πL. At t = 2, each individual learns whether the current project iscontinuing or ending. He then chooses his effort on the continuing project, or if theproject has ended, he decides whether to invest in a new project. All outcomes arerealized at t = 3.
The novel part occurs at t = 1, when individuals update their beliefs and decidehow to vote. We assume they vote sincerely for the policy (value of π) that maximizestheir expected payoff at t = 1, given their updated beliefs. Note that if individualschoose accurate recall at t = 0, a fraction q will have updated beliefs θH at t = 1,and a fraction 1− q will have updated beliefs θL. They may vote differently. On theother hand, if individuals choose to suppress bad signals at t = 0, they will all havethe same updated beliefs at t = 1, and vote in the same way.
27In taking the ex ante perspective we follow much of the literature on hyperbolic discounting.Note however that there is no universal agreement on how to analyze welfare implications when thedifferent selves have conflicting preferences (see Bernheim and Rangel (2009)).
23

Multiple equilibria with endogenous π Our main interest here is to investigatethe possibility of multiple equilibria with endogenous π. In particular, we exploreconditions for two pure strategy equilibria to arise: one in which individuals suppressthe bad signal at t = 0, and then vote for πL, and one in which they choose accuraterecall at t = 0, and then vote (at least, a majority of them) for πH .
At t = 1, each individual observes (recalls) either s = B or s = ∅. We know fromour earlier analysis that updated beliefs will be θL if s = B, and θ∗ if s = ∅, where
θ∗ = r∗θH + (1− r∗)θL.The individual’s expected payoff when s = B is W1(B) ≡ UT (θL), given by
UT (θL) = E(π)
(δθLW +
∫ βδφ(θmax−θL)W
kL
(δφ(θmax − θL)W − k) gdk
)
+ (1− E(π))
∫ βδθLV
cL
(δθLV − c) fdc
where E(π) denotes the expected value of π.The individual’s expected payoff when s = ∅ is W1(∅) ≡ r∗US(θH)+(1−r∗)US(θL),
where
US(θi) = E(π)
(δθiW +
∫ βδφ(θmax−θ∗)W
kL
(δφ(θmax − θi)W − k) gdk
)
+ (1− E(π))
∫ βδθ∗V
cL
(δθiV − c) fdc.
It follows that the individual’s expected payoff when s = B increases (decreases)with E(π) whenever A > (<)B, where:
A ≡ δθLW +
∫ βδφ(θmax−θL)W
kL
(δφ(θmax − θL)W − k) gdk
B ≡∫ βδθLV
cL
(δθLV − c) fdc
Similarly, the individual’s expected payoff when s = ∅ increases (decreases) withE(π) whenever X > (<)Y , where:
X ≡ δθ∗W +
∫ βδφ(θmax−θ∗)W
kL
(δφ(θmax − θ∗)W − k) gdk
Y ≡∫ βδθ∗V
cL
(δθ∗V − c) fdc
Clearly for W sufficiently large relative to V , everyone will vote for πH , irrespectiveof their updated beliefs on θ. Similarly for V sufficiently large relative to W , everyone
24

will vote for πL. The more interesting case for our purposes is where W and V aresuch that voting behavior does depend on updated beliefs. In particular, we see28 thatfor some parameter values we can have A > B, implying that a low-ability individualwho accurately recalls the bad signal prefers πH , while X < Y , implying that a low-ability individual who suppresses the bad signal will prefer πL. Thus if low-abilityindividuals are the majority, it is possible to have two equilibria, one where individualssuppress bad signals and then vote for πL (overconfidence and dynamism), and onewhere individuals choose accurate recall and then vote for πH (no overconfidence andstability). In particular, these two pure strategy equilibria can emerge when A > Band X ′ < Y ′, where X ′ and Y ′are the values of X and Y above evaluated at θ∗ = θ;i.e.,
X ′ ≡ δθW +
∫ βδφ(θmax−θ)W
kL
(δφ(θmax − θ)W − k
)gdk,
Y ′ ≡∫ βδθV
cL
(δθV − c
)fdc.
The intuition for this result is straightforward. A more confident individual ismore likely to invest in a new project if the old one comes to an end, and less likely tounder-invest because of hyperbolic discounting. His expected payoff is higher whenfaced with a new investment decision; ex ante, this increases the expected benefitfrom a more dynamic environment. Thus Y increases with θ∗. On the other hand,a more confident individual is less likely to exert self-improvement effort if the oldproject is continued, which exacerbates the under-provision of effort in the presenceof hyperbolic discounting. This effect tends to reduce X as θ∗ increases. At the sametime, in the absence of self-improvement effort, a more confident individual will havehigher expectations of success if the old project is continued: this effect tends toincrease X as θ∗ increases. When this last effect is relatively weak compared to thefirst two, X − Y will decrease with θ∗, yielding the possibility of multiple equilibriajust discussed.
5 Shame
Our analysis so far has focused on how cultural differences in (over)confidence mayemerge in equilibrium when individuals can engage in “creative” interpretation andselective attention strategies to manage their self-esteem. We now extend the analysisto study the role of “social” emotions, in particular shame, and how this interactswith confidence.
Our approach builds on two observations, motivated by the evidence discussed insection 2: (i) the vast majority of people (in all societies) are endowed with a capacity
28To see this, note that X − Y is strictly decreasing in θ∗ when the following condition holds:
βδ(2− β)[φ2gW 2 (θmax − θ∗) + V 2θ∗f ] > W (1 + φgkL) + V fcL.
25

to feel the emotion of shame29; however, (ii) individuals’ sensitivity to shame may beenhanced, or reduced, as a consequence of their upbringing and experience of socialinteractions.
In the model, we now suppose that society can impose a cost of shame S onindividuals who adopt certain behaviors. The magnitude of this cost depends onsociety for two reasons: first, as just noted, because individuals’ sensitivity to feelingsof shame can be fostered, or reduced, by the social environment in which they grow up(family, school, neighborhood, media, etc.). Second, because society determines notonly what constitutes “shameful” behavior, but also a variety of sanctions correlatedwith the degree of “shamefulness”, ranging from mild disapproval to social stigma,ostracism and different kinds of prohibitions and punishments.
We assume that the cost of shame can only be imposed for publicly observablebehaviors. This is obviously the case for “public shame”, where the cost is linked tolosing face and being the target of others’ disapproval. However, the psychology liter-ature on shame suggests that the assumption is also reasonable for “private shame”,since this essentially internalizes others’ critical gaze on the self30.
In our model, we assume that self-improvement effort is only privately known,while an individual’s investment in the new project is observable by others. For ex-ample, it may be fairly easy for others to observe whether their friend or acquaintancehas found a new job, moved to a different location, embarked on a new degree or train-ing course, started a new business, learned a new skill, started a new relationship, etc.It may be considerably harder for them to observe how much effort he is exerting tocome up with better ways of doing his existing job, or how hard he is trying to makean existing relationship work well. To capture this distinction as simply as possible,we assume that the cost S is incurred by individuals who, when the first project ends,do not invest in the new project31. Moreover, S cannot depend on the individual’srealization of c, since the personal cost of the investment (material and psychological)is only known to the individual.
The optimal social choice of S in our setting can be studied as a representativeindividual’s ex-ante choice, “behind the veil of ignorance” (i.e. before he observes hisprivate signal s). Since the magnitude of S will depend a great deal on upbringingand on childhood social interactions (see the evidence reviewed in section 2), one wayto think about this in practice is in terms of inter-generational cultural transmission.Thus the older generation (parents) chooses S for the younger generation (children),before learning the realizations of the individual children’s ability signals. This seemsa reasonable interpretation in light of the evidence that sensitivity to shame is influ-enced by parenting practices and socialization at an early age (e.g. Miller, Fung and
29Fessler (2007) provides an evolutionary account of the development of this emotion, arguingthat it evolved from an ancestral form functioning as a mechanism for appeasement in dominancerelationships, to a specifically human form functioning to enhance conformity to cultural standardsfor behavior.
30Thus even when an audience is not present, the self may react to the evaluation of an imaginedaudience (“what would they think if they could see this?”). This still requires the behavior to bepotentially observable by the imagined audience, and is therefore more applicable to observableactions than to internal states of mind like “effort”.
31We can think of these as individuals who persistently do not produce any visible signs of newinvestments, such as the ones just discussed.
26

Mintz (1996).Before studying the optimal choice of S, we need to characterize equilibrium
behavior in the presence of an exogenously given cost of shame. This is done below.
5.1 Self-1 behavior
Turning first to self-1’s behavior, it is immediate that, since self-improvement effortis not observable, self-1 will exert self-improvement effort if, and only if,
βδφ(θmax − θ∗)W > k
However, if the first project has ended, self-1 will undertake the new project if,and only if,
βδθ∗V − c > −S.
5.2 Self-0 strategy
How is self-0’s strategy affected by the existence of a cost of shame S, associated withnot undertaking the new project? Will this make it easier to alleviate the projectunder-investment problem ex post, and truthful transmission of the bad signal moreattractive ex ante?
Suppose that self-0 observes s = B. If he transmits the signal accurately to self-1(s = B), his expected utility is given by:
UST (θL) = π[δθLW +
∫ βδφ(θmax−θL)W
kL
{δφ(θmax − θL)]W − k}gdk]
+ (1− π)[
∫ min{βδθLV+S, cH}
cL
{δθLV − c}fdc−∫ cH
min{βδθLV+S, cH}Sfdc].
If on the other hand self-0 suppresses the bad signal (s = ∅), his expected utilitydepends on self-1’s beliefs about the reliability of the signal, r∗, and is given by:
USS (θL, θ(r
∗)) = π[δθLW +
∫ βδφ(θmax−θ∗)W
kL
{δφ(θmax − θL)]W − k}gdk]
+ (1− π)[
∫ min{βδθ∗V+S, cH}
cL
{δθLV − c}fdc−∫ cH
min{βδθ∗V+S, cH}Sfdc].
The net gain from suppressing the bad signal is therefore equal to:
USS (θL, θ(r
∗))− UST (θL)
= −π[
∫ βδφ(θmax−θL)W
βδφ(θmax−θ∗)W{δφ(θmax − θL)W − k}gdk]
+ (1− π)[
∫ min{βδθ∗V+S, cH}
min{βδθLV+S, cH}{δθLV − c}fdc+ fS
∫ min{βδθ∗V+S, cH}
min{βδθLV+S, cH}dc].
27

Consider first the case where S 6 cH − βδθ∗V . In this case it is straightforwardto verify that the value of the expression does not, in fact, depend on S, and is equalto the value of the corresponding expression without shame, US(θL, θ(r
∗))− UT (θL),given by equation (1). We therefore have the following result:
Proposition 3 Suppose society imposes a fixed cost of shame S 6 cH − βδθ∗V onindividuals who, when faced with the choice to invest or not invest in the new project,decide not to invest. Then irrespective of the magnitude of S, the set of PerfectBayesian equilibria of the signaling game between self-0 and self-1 will be the same asin the absence of shame, and is described by Proposition 1.
Now consider the case where S > cH − βδθ∗V . Clearly if S ≥ cH − βδθLV ,self-1 will always invest in the new project (and thereby avoid incurring any cost ofshame), irrespective of the realization of c and of the signal transmitted by self-0.Thus without loss of generality we can focus attention on S 6 cH − βδθLV . Whenthis condition holds as an equality (implying that self-1, as just noted, will alwaysinvest in the new project), the net gain from suppressing the bad signal is alwaysstrictly negative. There is therefore a unique equilibrium with truthful transmission.In the range cH − βδθ∗V < S < cH − βδθLV , on the other hand, the set of PerfectBayesian equilibria is characterized by the following result.
Proposition 4 Suppose society imposes a fixed cost of shame S on individuals who,when faced with the choice to invest or not invest in the new project, decide notto invest, and this cost satisfies the condition cH − βδθ∗V < S < cH − βδθLV .Then irrespective of the magnitude of S, the set of Perfect Bayesian equilibria of thesignaling game between self-0 and self-1 will be as follows. There exist two thresholdvalues, πSH and πSL (with πSH > πSL), such that: (i) if π > πSH , there is a unique PBEwith h∗ = 1; (ii) if π < πSL, there is a unique PBE with h∗ = 0; (iii) otherwise,there are three PBEs: the two pure-strategy equilibria with h∗ = 1 and h∗ = 0 , and amixed-strategy equilibrium.
5.3 How much shame?
Is it ever desirable to have a strictly positive cost of shame S? How much shame, ifany, is socially optimal? Our model can help to shed light on these questions. In thissection, we focus on the two most interesting cases, in terms of comparing very stable(in the sense of having a high value of π) and very dynamic (low value of π) societies.
5.3.1 Very stable societies
We first consider very stable societies, where π > max(πH , πSH). We know from the
results so far that in these societies there is a unique Perfect Bayesian equilibriumof the signaling game between self-0 and self-1, whereby self-0 always transmits hisobserved signal truthfully.
To study the socially optimal choice of S, we consider a representative individual’schoice at date 0 before learning the true value of his signal s. As discussed earlier,we can think of this in terms of intergenerational cultural transmission, with the
28

older generation choosing S for the younger generation before learning the individualrealizations of each personal signal s. The choice of S then corresponds to a choiceof child-rearing, education and socialization practices, as suggested by the evidencereviewed in section 2.
At date 0, the representative individual expects to observe the “bad” signal, s = B,with probability 1− q, and no signal, s = ∅, with probability q. His expected utilityis therefore equal to W S
T ≡ qUST (θH) + (1− q)US
T (θL), where
UST (θi) = π[δθiW +
∫ βδφ(θmax−θi)W
kL
{δφ(θmax − θi)W − k}gdk]
+ (1− π)[
∫ βδθiV+S
cL
{δθiV − c}fdc−∫ cH
βδθiV+S
Sfdc]
for i = H,L. Differentiating by S yields
∂UST (θi)
∂S= (1− π)f [δθiV − cH + S].
Remembering that θ = qθH + (1− q)θL, we have
∂W ST
∂S= (1− π)f [δθV − cH + S);
∂2(W ST )
∂S2= (1− π)f > 0
which implies that there is no interior solution for S. Thus without loss of generalitywe can focus attention on two possibilities: S = 0 and S = cH − βδθLV . It can beeasily verified that W S
T may be written as the sum of a term which depends on S anda term which does not depend on S, W S
T ≡ W0 +W (S), with
W (S) ≡ q(1− π)f(δθHV S − ScH +1
2S2) + (1− q)(1− π)f(δθLV S − ScH +
1
2S2)
= (1− π)f(δθV S − ScH +1
2S2).
We therefore need to compare W (0) and W (cH − βδθLV ). Clearly W (0) = 0.This yields the following result.
Proposition 5 In very stable societies, where π > max(πH , πSH), it will be socially
optimal to impose a strictly positive cost of shame S = cH − βδθLV if, and only if,the following condition holds: δV (2θ − βθL) > cH .
The result shows that if time-inconsistency is sufficiently important (β is suffi-ciently small), the cost of investing in the new project is not too high for any in-dividual (cH is not too high), and the proportion of high-ability individuals in thepopulation (q) is sufficiently high, the cost of shame is optimally chosen so that inequilibrium everyone undertakes the new project when the old one has ended. More-over, in equilibrium nobody incurs the cost of shame. However, individuals with ahigh personal cost c of undertaking the new project will bear a cost in excess of theexpected benefit: there will be over-investment.
29

Thus it can be optimal for shame to play an important role in very stable societies,where it can alleviate the problem of under-investment in new projects. However,since the cost of shame cannot be individually tailored to the (privately known)personal cost of investment, an over-investment problem will arise. When this isless costly than the potential under-investment in the absence of shame, there is anefficiency role for shame.
5.3.2 Very dynamic societies
We now turn to very dynamic societies, where π < min(πL, πSL). We know from
the results obtained earlier that in these societies there is a unique Perfect Bayesianequilibrium of the signaling game between self-0 and self-1, whereby self-0 alwayssuppresses the bad signal, unless the cost of shame is set so high that everyone investsin the new project when the old project has ended (S = cH − βδθLV ), irrespective ofthe signal received by self-0 and the realization of the personal investment cost c. Inthe latter case, the unique PBE entails truthful transmission of the signal by self-0.
Once again, we study a representative individual’s choice at date 0 before learningthe true value of his signal s. At this stage, the individual expects to observe the“bad” signal, s = B, with probability 1 − q, and no signal, s = ∅, with probabilityq. To begin with, consider the case where S = cH − βδθLV . Expected utility is thenequal to W S
T , evaluated at S = cH − βδθLV . Denote the value of expected utilityin this case by W S
T (cH − βδθLV ). Now consider the case where S < cH − βδθLV .Expected utility is equal to W S
S ≡ qUSS (θH) + (1− q)US
S (θL), where
USS (θi) = π[δθiW +
∫ βδφ(θmax−θ)W
kL
{δφ(θmax − θi)W − k}gdk]
+ (1− π)[
∫ βδθV+S
cL
{δθiV − c}fdc−∫ cH
βδθV+S
Sfdc]
for i = H,L. Differentiating by S yields
∂USS (θi)
∂S= (1− π)f [δθiV − cH + S]
and hence
∂W SS
∂S= (1− π)f [δθV − cH + S);
∂2(W SS )
∂S2= (1− π)f > 0
just as in the case of very stable societies examined earlier, implying that there isno interior solution for S. Thus here too, without loss of generality, we can focusattention on two possibilities: S = 0 and S = cH − βδθV . The second of these twocorresponds to the case where the desire to avoid incurring the cost of shame is strongenough to motivate everybody to invest in the new project if the old project ends.But we know that setting S = cH − βδθLV achieves the same outcome, and inducestruthful transmission in equilibrium, which is optimal from an ex ante perspective(see welfare analysis in the previous section).
We can therefore obtain the following result.
30

Proposition 6 In very dynamic societies, where π < min(πL, πSL), it will be socially
optimal to impose a strictly positive cost of shame S = cH − βδθLV if, and only if,the following condition holds: πA + 1
2(1 − π)f(cH − βδθV )[B − C] > 0 (C1),
where A ≡ gδφW 2(1 − 12β2δφ)q(1 − q)(θH − θL)2 > 0, B ≡ δθV − βδθV > 0, and
C ≡ cH − δθV > 0. Thus we have two possible equilibria:(i) An equilibrium with overconfidence (suppression of bad signal) and no cost of
shame (S = 0), when C1 does not hold(ii) An equilibrium without overconfidence (truthful transmission) and a high cost
of shame (S = cH − βδθLV ), when C1 does hold.
Condition C1 has an intuitive interpretation: A represents the expected gainfrom reliance on shame when the status quo project is continued in the long term.Since the equilibrium with shame entails no overconfidence, while the one withoutshame entails overconfidence, clearly reliance on shame provides better incentives toexert self-improvement effort: this is captured by A. However, this gain occurs withrelatively low probability in very dynamic societies. With relatively high probability,the individual will need instead to decide whether to invest in a new project. Theterm B −C captures the net gain from reliance on shame in this case. The presenceof a high cost of shame makes it possible to“correct” more efficiently the under-investment incentives associated with time-inconsistent preferences than would bepossible through memory management: this effect is captured by B. There is a pricefor this though: when the cost of shame is high, individuals whose investment cost ishigher than the expected benefit will nevertheless invest, to avoid shame. This lossis captured by C.
Clearly if B > C, condition C1 will be satisfied for all values of π in the relevantrange (π < min(πL, π
SL)), and irrespective of the magnitude of A. However, it is
straightforward to verify that B > C is a stronger condition than the necessaryand sufficient condition for shame to be optimal in very stable societies, given inProposition 5. If B < C, shame may not be efficient in very dynamic societies.In particular, shame is less likely to be efficient as π decreases, and as A decreasesrelative to C −B.
5.3.3 Implications and discussion
Our analysis in this section has shown that reliance on shame as a motivationaldevice can be efficient in stable and in dynamic societies, depending on parametervalues. In stable societies, two types of equilibria can emerge: neither of the twowill entail overconfidence, while one of them will entail an important role for shame.In dynamic societies there are also two types of equilibria: one with overconfidenceand no motivational role for shame, and the other with no overconfidence and animportant role for shame.
This is consistent with the evidence reviewed in section 2. Moreover, it suggeststhat even if “stable” societies become more “dynamic”, in the sense of this paper,this may not lead to cultural convergence in terms of the relative importance of socialemotions like shame, and self-esteem maintenance or self-enhancement. The exam-ple of the “Four Asian Tigers” (Hong Kong, Singapore, South Korea and Taiwan)is interesting in this respect: their mean self-competence scores are relatively low
31

(Schmitt and Allik (2005))32, and we saw in section 2 that shame plays an importantrole in Taiwan.
Our discussion has focused on the socially optimal choice of S, the cost of shame.However, as mentioned earlier, our results can be interpreted in terms of intergenera-tional cultural transmission: parents choosing S for their children before learning theindividual realizations of the children’s ability signals would make the same choice.This interpretation fits well with the evidence on how parenting practices and social-ization at an early age emphasize sensitivity to shame, or alternatively the importanceof self-confidence, as discussed in section 2.
6 Conclusion
Comparisons across cultures provide a very valuable opportunity for understandinghow economics and psychology interact. In this paper, we have focused on self-esteemand shame, both of which have received considerable attention in the psychologyliterature but far less attention in the economics literature. The available evidencefrom numerous studies by psychologists suggests that overconfidence is a much moreimportant phenomenon in North America than in Japan. Relatedly, North Americansappear to view high self-esteem much more positively than Japanese. The pattern isreversed when it comes to shame, which appears to play a much more important roleamong Japanese than North Americans.
We have developed an economic model that can rationalize these observed dif-ferences. The model studies a potential tradeoff between the benefits of encouragingself-improvement and the benefits of promoting initiative and new investments. In thiscontext, self-esteem maintenance (self-enhancement) and sensitivity to shame emergeas (substitute) mechanisms to induce efficient effort and investment decisions. Whileexploring their instrumental value, we also identify some important costs associatedwith the use of each mechanism in equilibrium: reliance on self-esteem maintenancestrategies means that in equilibrium the incentives to invest in self-improvement willbe reduced for the individuals who could benefit most from such investment, andsimilarly for investment in new projects. On the other hand, reliance on shame as anincentive mechanism means that in equilibrium there will be over-investment.
The analysis presented here suggests a number of promising directions for futureresearch: for example, the model can be readily extended to study the role of manage-ment practices such as kaizen (continuous improvement), and the potential tradeoffwith innovation. Perhaps most importantly to our minds, our work represents a firststep towards integrating the role of social emotions, time-inconsistent preferences andself-serving biases into economic models able to shed light on observed economic andpsychological differences across cultures.
32Schmitt and Allik present self-competence scores for three of the “Four Asian Tigers”; themissing one is Singapore.
32

References
[1] Abramitzky, R., L. Boustan, and K. Eriksson (2012). “Europe’s Tired, Poor,Huddled Masses: Self-Selection and Economic Outcomes in the Age of MassMigration,” American Economic Review, 102(5), 1832-56.
[2] Alesina, A., and G. Angeletos (2005). “Fairness and Redistribution,” AmericanEconomic Review, 95(4), 960-980.
[3] Almlund, M., A. Duckworth, J. Heckman, and T. Kautz (2011). “Personal-ity Psychology and Economics,” Handbook of the Economics of Education, E.Hanushek, S. Machin, and L. Woessman (eds.), Vol. 4, pp. 1-181.
[4] Anderson, C.A. (1999). “Attributional Style, Depression, and Loneliness: ACross-Cultural Comparison of American and Chinese Students,” Personality andSocial Psychology Bulletin, 25, 482-499.
[5] Battaglini, M., R. Benabou and J. Tirole (2005). “Self-Control in Peer Groups,”Journal of Economic Theory, 123(2), 105-134.
[6] Baumeister, R.F. and E.E. Jones (1978). “When Self-Presentation is Constrainedby the Target’s Knowledge: Consistency and Compensation,” Journal of Per-sonality and Social Psychology, 36, 608-618.
[7] Baumeister, R.F., D.M. Tice and D.G. Hutton (1989). “Self-Presentational Mo-tivations and Personality Differences in Self-Esteem,” Journal of Personality, 57,547-579.
[8] Baumeister, R.F. and L.S. Newman (1994). “Self-Regulation of Cognitive Infer-ence and Decision Processes,” Personality and Social Psychology Bulletin, 20,3-19.
[9] Becker, G. and C. Mulligan (1997). “The Endogenous Determination of TimePreference,” Quarterly Journal of Economics, 112(3), 729-58.
[10] Benabou, R. (2013). “Groupthink: Collective Delusions in Organizations andMarkets,” Review of Economic Studies, 80, 429-462.
[11] Benabou, R. and J. Tirole (2002). “Self-Confidence and Personal Motivation,”Quarterly Journal of Economics, 117(3), 871-915.
[12] Benabou, R. and J. Tirole (2006). “Belief in a Just World and RedistributivePolitics,” Quarterly Journal of Economics, 121(2), 699-746.
[13] Benabou, R. and J. Tirole (2011). “Identity, Morals and Taboos: Beliefs asAssets,” Quarterly Journal of Economics, 126(2), 805-855.
[14] Benedict, R. (1946). The Chrysanthemum and the Sword, Boston: HoughtonMifflin.
[15] Benoıt, J-P. and J. Dubra (2011). “Apparent Overconfidence,” Econometrica,79(5), 1591-1625.
33

[16] Berner, E.S. and M.L. Graber (2008). “Overconfidence as a Cause of DiagnosticError in Medicine,” American Journal of Medicine, 121(5), Supplement, S2-S23.
[17] Bernheim, B.D. (1994). “A Theory of Conformity,” Journal of Political Economy,102(5), 841-877.
[18] Bernheim, B.D., and A. Rangel (2009). “Beyond Revealed Preference: Choice-Theoretic Foundations for Behavioral Welfare Economics,” Quarterly Journal ofEconomics, 124(1), 51-104.
[19] Bisin, A. and T. Verdier (2000). ““Beyond the Melting Pot”: Cultural Trans-mission, Marriage, and the Evolution of Ethnic and Religious Traits,” QuarterlyJournal of Economics, 115(3), 955-88.
[20] Bisin, A. and T. Verdier (2001). “The Economics of Cultural Transmission andthe Dynamics of Preferences,” Journal of Economic Theory, 97(2), 298-319.
[21] Bond, M.H. and T. Cheung (1983). “College Students’ Spontaneous Self-Concept,” Journal of Cross-Cultural Psychology, 14, 153-171.
[22] Brown, J.D. and C. Kobayashi (2002). “Self-enhancement in Japan and Amer-ica,” Asian Journal of Social Psychology, 5, 145-168.
[23] Brown, R.A., R.R. Gray and M.S. Ferrara (2005). “Attributions for PersonalAchievement Outcomes among Japanese, Chinese, and Turkish University Stu-dents,” Information and Communication Studies, 33, 1-13.
[24] Burks, S.V., J.P. Carpenter, L. Goette, and A. Rustichini (2013). “Overconfi-dence and Social Signalling,” Review of Economic Studies, 80(3), 949-983.
[25] Campbell, J.D., P.D. Trapnell, S.J. Heine, I.M. Katz, L.F. Lavallee and D.R.Lehman (1996). “Self-Concept Clarity: Measurement, Personality Correlates,and Cultural Boundaries,” Journal of Personality and Social Psychology, 70,141-156.
[26] Chen ,C.C., P.G. Greene, and A. Crick (1998). “Does Entrepreneurial Self-efficacy Distinguish Entrepreneurs from Managers?” Journal of Business Ven-turing, 13, 295-316.
[27] Compte, O. and A. Postlewaite (2004). “Confidence-enhanced Performance,”American Economic Review, 94(5), 1536-57.
[28] Coricelli, G. and A. Rustichini (2010). “Counterfactual Thinking and Emotions:Regret and Envy Learning,” Philosophical Transactions of the Royal Society B,365, 241-247.
[29] Creighton, M.R. (1990). “Revisiting Shame and Guilt Cultures: A Forty-YearPilgrimage,” Ethos, 18, 279-307.
[30] Crystal, D.S. (1999). “Attributions of Deviance to Self and Peers by Japaneseand U.S. Students,” Journal of Social Psychology, 139, 596-610.
34

[31] De Noble, A.F., D. Jung, and S.B. Ehrlich (1999). “Entrpreneurial Self-efficacy:the Development of a Measure and its Relationship to Entrepreneurial Action,”Frontiers of Entrepreneurship Research, Reynolds P., Bygrave W., Manigart S.,Mason C., Meyer G., Sapienza H. & K. Shaver (eds.), Babson College: BabsonPark, MA.
[32] Dessı, R. (2008). “Collective Memory, Cultural Transmission and Investments,”American Economic Review, 98(1), 534-560.
[33] Ditto, P.H. and D.F. Lopez (1992). “Motivated Skepticism: Use of DifferentialDecision Criteria for Preferred and Nonpreferred Conclusions,” Journal of Per-sonality and Social Psychology, 63, 568-584.
[34] Ditto, P.H., J.A. Scepansky, G.D. Munro, A.M. Apanovitch, and L.K. Lockhart(1998). “Motivated Sensitivity to Preference-Inconsistent Information,” Journalof Personality and Social Psychology, 75, 53-69.
[35] Doi, T. (1973). The Anatomy of Dependence, Tokyo: Kodansha.
[36] Dunning, D. and G.L. Cohen (1992). “Egocentric Definitions of Traits and Abil-ities in Social Judgement,” Journal of Personality and Social Psychology, 63,341-355.
[37] Dunning, D., J.A. Meyerowitz, and A.D. Holzberg (1989). “Ambiguity and Self-Evaluation: The Role of Idiosyncratic Trait Definitions in Self-Serving Assess-ments of Ability,” Journal of Personality and Social Psychology, 57, 1082-1090.
[38] Eil, D. and J. Rao (2011). “The Good News-Bad News Effect: Asymmetric Pro-cessing of Objective Information about Yourself,” American Economic Journal:Microeconomics, 3(2), 114-38.
[39] Endo, Y., Heine, S.J. and D.R. Lehman (2000). “Culture and Positive Illusionsin Relationships: How my relationships are better than yours,” Personality andSocial Psychology Bulletin, 26, 1571-1586.
[40] Endo, Y. and Z. Meijer (2004). “Autobiographical Memory of Success andFailure Experiences,” Progress in Asian social psychology, Kashima, Y., Endo,Y., Kashima, E.S., Leung, C. and J. McClure (eds.), Seoul, Korea: Kyoyook-Kwahak-Sa.
[41] Falk, A., E. Fehr, and U. Fischbacher (2003). “On the Nature of Fair Behavior,”Economic Inquiry, 41, 20-26.
[42] Fehr, E. and K.M. Schmidt (2005). “The Economics of Fairness, Reciprocity andAltruism - experimental evidence and new theories,” chapter 8, Handbook of theEconomics of Giving, Altruism and Reciprocity, Volume 1.
[43] Fessler, D.M.T. (2007). “From Appeasement to Conformity: Evolutionary andCultural Perspectives on Shame, Competition, and Cooperation,” The Self-Conscious Emotions: Theory and Research, Jessica L. Tracy, Richard W. Robinsand June Price Tangney (eds.), The Guilford Press, New York.
35

[44] Fiske, S. and S. Taylor (2008). Social Cognition: from brains to culture, McGraw-Hill Press.
[45] Hashimoto, M. and J. Raisian (1985). “Employment Tenure and Earnings Pro-files in Japan and the United States,” American Economic Review, 75(4), 721-735.
[46] Heine, S.J. and T. Hamamura (2007). “In Search of East-Asian Self-enhancement,” Personality and Social Psychology Review, 11(1), 4-27.
[47] Heine, S.J., S. Kitayama. and D.R. Lehman (2001). “Cultural Differences inSelf-Evaluation,” Journal of Cross-Cultural Psychology, 32(4), 434-443.
[48] Heine, S. J., and D.R. Lehman (1997). “Culture, Dissonance, and Self-Affirmation,” Personality and Social Psychology Bulletin, 23, 389-400.
[49] Heine, S. J., and D.R. Lehman (1999). “Culture, Self-Discrepancies, and Self-Satisfaction,” Personality and Social Psychology Bulletin, 25, 915-925.
[50] Heine, S. J., and D. R. Lehman (2004). “Move the Body, Change the Self: Ac-culturative Effects on the Self-Concept,” Psychological Foundations of Culture,M. Schaller and C. Crandall (eds.), 305-331.
[51] Heine, S. J., D.R. Lehman, H. R. Markus, and S. Kitayama (1999). “Is There aUniversal Need for Positive Self-Regard?” Psychological Review, 106, 766-794.
[52] Hess, R., K. Kashiwagi, H. Azuma, G.G. Price, and W.P. Dickson (1980). “Ma-ternal Expectations for Mastery of Developmental Tasks in Japan and the UnitedStates,” International Journal of Psychology, 15, 259-271.
[53] Hoezl, E. and A. Rustichini (2005). “Overconfident: Do You Put Your Moneyon It?” Economic Journal, 115(503), 305-318.
[54] Imai, Y. and M. Kawagoe (2000). “Business Start-ups in Japan: Problems andPolicies,” Oxford Review of Economic Policy, 16(2), 114-123.
[55] Johnson, F.A. (1993). Dependency and Japanese Socialization, New York: NewYork University Press.
[56] Kabayashi-Winata, H., and T.G. Power (1989). “Child Rearing and Compli-ance: Japanese and American families in Houston,” Journal of Cross-CulturalPsychology, 20, 333-356.
[57] Kitayama, S., H. Takagi and H. Matsumoto (1995). “Causal Attribution of Suc-cess and Failure: Cultural Psychology of the Japanese Self,” Japanese Psycho-logical Review, 38, 247-280.
[58] Kobayashi, C. and J.D. Brown (2003). “Self-Esteem and Self-Enhancement inJapan and America,” Journal of Cross-Cultural Psychology, 34, 567-580.
[59] Koszegi, B. (2006). “Ego Utility, Overconfidence, and Task Choice,” Journal ofthe European Economic Association, 4(4), 673-707.
36
[60] Kroll, M.J., L.A. Toombs and P. Wright (2000). “Napoleon’s Tragic March Homefrom Moscow: lessons in hubris,” Academy of Management Executive, 14(1), 117-128.
[61] Kunda, Z. (1990). “The Case for Motivated Reasoning,” Psychological Bulletin,108, 480-498.
[62] Kurman, J. (2001). “Self-Enhancement: is it restricted to individualistic cul-tures?” Personality and Social Psychology Bulletin, 12, 1705-1716.
[63] Kurman, J. (2003). “Why is Self-Enhancement Low in Certain Collectivist Cul-tures? An investigation of two competing explanations,” Journal of Cross-Cultural Psychology, 34, 496-510.
[64] Kurman, J. and N. Sriram (2002). “Interrelationships among Vertical and Hori-zontal Collectivism, Modesty, and Self-Enhancement,” Journal of Cross-CulturalPsychology, 33, 71-86.
[65] Kuwayama, T. (1992). “The Reference Other Orientation,” Japanese Sense ofSelf, N.R. Rosenberger (eds.), (pp. 121-149) Cambridge, England: CambridgeUniversity Press.
[66] Laibson, D. (1997). “Golden Eggs and Hyperbolic Discounting,” Quarterly Jour-nal of Economics, 62, 443-477.
[67] Lebra, T.S. (1983). “Shame and Guilt: a psychological view of the Japaneseself,” Ethos, 11, 192-209.
[68] Leung, F.K.S. (2002). “Behind the High Achievement of East Asian Students,”Educational Research and Evaluation, 8(1), 87-108.
[69] Lewis, C. (1995). Educating Hearts and Minds, Cambridge, England: CambridgeUniversity Press.
[70] Lewis, C. (1996). “Fostering Social and Intellectual Development: The roots ofJapanese educational success,” Teaching and Learning in Japan, T.P. Rohlenand G.K. Le Tendre (Eds.), New York: Cambridge University Press.
[71] Mahler, I. (1976). “What is the Self-Concept in Japan?” Psychologia, 19, 127-132.
[72] Malmendier, U. and G. Tate (2005). “CEO Overconfidence and Corporate In-vestment,” Journal of Finance, 60(6), 2661-2700.
[73] Malmendier, U. and G. Tate (2008). “Who Makes Acquisitions? CEO Over-confidence and the Market’s Reaction,” Journal of Financial Economics, 89(1),20-43.
[74] Markman, G.D. , R.A. Baron, and D.B. Balkin (2002). “Inventors and NewVenture Formation: the effects of general self-efficacy and regretful thinking,”Entrepreneurship Theory and Practice, 27(2), 149-166.
37

[75] Miller, P.J., H. Fung, and J. Mintz (1996). “Self-Construction through NarrativePractices: A Chinese and American comparison of early socialization,” Ethos,24(2), 237-280.
[76] Mobius M., M. Niederle, P. Niehaus, and T. Rosenblat (2013). “Managing Self-Confidence: Theory and Experimental Evidence,” mimeo.
[77] Moriguchi, C. and H. Ono (2004). “Japanese Lifetime Employment: a century’sperspective”, EIJS Working Paper, The European Institute of Japanese Studies.
[78] Mullen, B. and G.R. Goethals (1990). “Social Projection, Actual Consensus andValence,” British Journal of Social Psychology, 29, 279-282.
[79] Norasakkunkit, V. and M.S. Kalick (2002). “Culture, Ethnicity, and EmotionalDistress Measures: The role of self-construal and self-enhancement,” Journal ofCross-Cultural Psychology, 33, 56-70.
[80] Ono, H. (2006). “Divorce in Japan: why it happens, why it doesn’t,” EIJSWorking Paper, The European Institute of Japanese Studies.
[81] Ono, H. (2010). “Lifetime Employment in Japan: concepts and measurements”,Journal of the Japanese and International Economies, 24(1), 1-27.
[82] Rosenberg, M. (1965). Society and Adolescent Self-Image, Princeton, NJ: Prince-ton University Press.
[83] Rothbaum, F., M. Pott, A. Azuma, K. Miyake, and J. Weisz (2000). “The De-velopment of Close Relationships in Japan and the United States: Paths ofsymbiotic harmony and generative tension,” Child Development, 71, 1121-1142.
[84] Rustichini, A. (2008). “Dominance and Competition,” Journal of the EuropeanEconomic Association, 6, 647-656.
[85] Sanitioso, R., Z. Kunda, and G.T. Fong (1990). “Motivated Recruitment of Au-tobiographical Memory,” Journal of Personality and Social Psychology, 59, 229-241.
[86] Schmitt, D. and J. Allik (2005). “Simultaneous Administration of the RosenbergSelf-Esteem Scale in 53 Nations: Exploring the Universal and Culture-SpecificFeatures of Global Self-Esteem,” Journal of Personality and Social Psychology,89(4), 623–642.
[87] Sedikides, C., L. Gaertner, and Y. Toguchi (2003). “Pancultural Self-enhancement,” Journal of Personality and Social Psychology, 84, 60-79.
[88] Steele, C.M., S.J. Spencer and M. Lynch (1993). “Self-Image Resilience andDissonance: The role of affirmational resources,” Journal of Personality andSocial Psychology, 64, 885–896.
[89] Strotz, R. (1955). “Myopia and Inconsistency in Dynamic Utility Maximization,”Review of Economic Studies, 23, 165-180.
38

[90] Svenson, O. (1981). “Are We All Less Risky and More Skillful Than Our FellowDrivers?” Acta Psychologica, 47, 143-148.
[91] Tesser, A. and D. Paulhus (1983). “The Definition of Self: Private and publicself-evaluation management strategies,” Journal of Personality and Social Psy-chology, 44, 672-682.
[92] Vancouver, J.B. and L.N. Kendall (2006). “When Self-efficacy Negatively Re-lates to Motivation and Performance in a Learning Context,” Journal of AppliedPsychology, 91, 1146-1153.
[93] Wang, M., M. O. Rieger and T. Hens (2009). “An International Survey on TimeDiscounting,” SSRN working paper.
[94] Weisz, J., F.M. Rothbaum, and T.C. Balackburn (1984). “Standing Out andStanding In: the psychology of control in America and Japan,” American Psy-chologist, 39, 995-969.
[95] Whyte, G. and A.M. Saks (2007). “The Effects of Self-efficacy on Behaviour inEscalation Situations,” Human Performance, 20, 23-42.
[96] Wood, S.L. and J.G. Lynch (2002). “Prior Knowledge and Complacency in NewProduct Learning,” Journal of Consumer Research, 29(3), 416-26.
[97] Zahn-Waxler, C., R.J. Friedman, P.M. Cole, I. Mizuta, and N. Hiruma (1996).“Japanese and United States Preschool Children’s Responses to Conflict andDistress,” Child Development, 67, 2462-2477.
[98] Zuckerman, M. (1979). “Attribution of Success and Failure Revisited, or: themotivational bias is alive and well in attribution theory,” Journal of Personality,47, 245–287.
39

7 Appendix
7.1 Proof of Proposition 1
Proof. Define
X (r∗, π)
≡ US(θL, θ(r∗))− UT (θL)
= −πX1 + (1− π)X2
where X1 ≡∫ βδφ(θmax−θL)Wβδφ(θmax−θ∗)W {δφ(θmax−θL)W −k}dG(k) > 0 and X2 ≡
∫ βδθ∗VβδθLV
{δθLV −c}dF (c) > 0.
It is clear that X (r∗, π) is continuous and decreasing in π for all r∗ ∈ [q, 1] as X1
and X2 are both positive. Further, we have that X (r∗, 1) < 0 and X (r∗, 0) > 0 forall r∗. Thus there is a unique π∗ (r∗) such that X (r∗, π∗ (r∗)) = 0, and X (r∗, π) > 0for all π < π∗ (r∗) , and X (r∗, π) < 0 for all π > π∗ (r∗) for all r∗.
By the implicit function theorem, we have that
dπ∗
dθ∗= −
dX(r∗,π)dθ∗
dX(r∗,π)dπ
=(1− π)βδV 2 (δθL − βδθ∗) f − πβδφW 2[δφ(θmax − θL)− βδφ(θmax − θ∗)]g∫ βδφ(θmax−θL)W
βδφ(θmax−θ∗)W {δφ(θmax − θL)W − k}dG(k) +∫ βδθ∗VβδθLV
{δθLV − c}dF (c)
where the denominator is always positive. Notice that the sign of the numerator isambiguous. Thus, our proof here is not a straightforward extension of the proof ofProposition 2 in Benabou and Tirole (2002).
There are three cases to consider.(I) For π sufficiently small, the numerator is positive. Since the numerator is
decreasing in θ∗, formally, we have dπ∗
dθ∗> 0 for
π < π1 ≡V 2 (θL − βθH) f
V 2 (θL − βθH) f + φ2W 2[(1− β)θmax − (θL − βθH)]g.
For values of π satisfying this condition, π∗ (r∗) is increasing in r∗, since θ∗ isincreasing in r∗.
Notice that it is straightforward to verify that π∗ (q) > π∗ (1) > π1.To show it, since
X (q, π∗ (q))
= −π∗ (q)
∫ βδφ(θmax−θL)W
βδφ(θmax−θ)W{δφ(θmax − θL)W − k}dG(k) + (1− π∗ (q))
∫ βδθV
βδθLV
{δθLV − c}dF (c)
= 0
where θ ≡ qθH + (1− q)θL, we have
π∗ (q) =
∫ βδθVβδθLV
{δθLV − c}dF (c)∫ βδφ(θmax−θL)Wβδφ(θmax−θ)W {δφ(θmax − θL)W − k}dG(k) +
∫ βδθVβδθLV
{δθLV − c}dF (c).
40
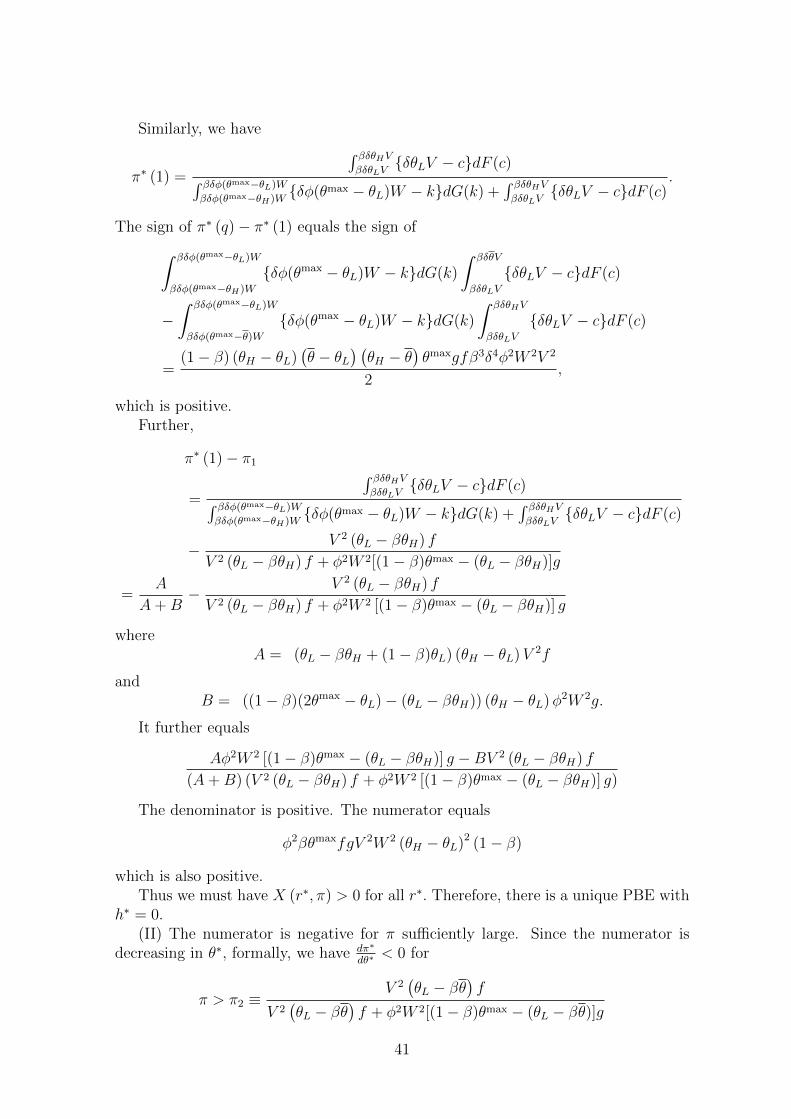
Similarly, we have
π∗ (1) =
∫ βδθHVβδθLV
{δθLV − c}dF (c)∫ βδφ(θmax−θL)Wβδφ(θmax−θH)W
{δφ(θmax − θL)W − k}dG(k) +∫ βδθHVβδθLV
{δθLV − c}dF (c).
The sign of π∗ (q)− π∗ (1) equals the sign of∫ βδφ(θmax−θL)W
βδφ(θmax−θH)W
{δφ(θmax − θL)W − k}dG(k)
∫ βδθV
βδθLV
{δθLV − c}dF (c)
−∫ βδφ(θmax−θL)W
βδφ(θmax−θ)W{δφ(θmax − θL)W − k}dG(k)
∫ βδθHV
βδθLV
{δθLV − c}dF (c)
=(1− β) (θH − θL)
(θ − θL
) (θH − θ
)θmaxgfβ3δ4φ2W 2V 2
2,
which is positive.Further,
π∗ (1)− π1
=
∫ βδθHVβδθLV
{δθLV − c}dF (c)∫ βδφ(θmax−θL)Wβδφ(θmax−θH)W
{δφ(θmax − θL)W − k}dG(k) +∫ βδθHVβδθLV
{δθLV − c}dF (c)
− V 2 (θL − βθH) f
V 2 (θL − βθH) f + φ2W 2[(1− β)θmax − (θL − βθH)]g
=A
A+B− V 2 (θL − βθH) f
V 2 (θL − βθH) f + φ2W 2 [(1− β)θmax − (θL − βθH)] g
whereA = (θL − βθH + (1− β)θL) (θH − θL)V 2f
andB = ((1− β)(2θmax − θL)− (θL − βθH)) (θH − θL)φ2W 2g.
It further equals
Aφ2W 2 [(1− β)θmax − (θL − βθH)] g −BV 2 (θL − βθH) f
(A+B) (V 2 (θL − βθH) f + φ2W 2 [(1− β)θmax − (θL − βθH)] g)
The denominator is positive. The numerator equals
φ2βθmaxfgV 2W 2 (θH − θL)2 (1− β)
which is also positive.Thus we must have X (r∗, π) > 0 for all r∗. Therefore, there is a unique PBE with
h∗ = 0.(II) The numerator is negative for π sufficiently large. Since the numerator is
decreasing in θ∗, formally, we have dπ∗
dθ∗< 0 for
π > π2 ≡V 2(θL − βθ
)f
V 2(θL − βθ
)f + φ2W 2[(1− β)θmax − (θL − βθ)]g
41

where π2 > π1.For values of π satisfying this condition, π∗ (r∗) is decreasing in r∗, since θ∗ is
increasing in r∗. Moreover, it is straightforward to verify that π∗ (q) > π2.To see it,
π∗ (q)− π2
=
∫ βδθVβδθLV
{δθLV − c}dF (c)∫ βδφ(θmax−θL)Wβδφ(θmax−θ)W {δφ(θmax − θL)W − k}dG(k) +
∫ βδθVβδθLV
{δθLV − c}dF (c)
−V 2(θL − βθ
)f
V 2(θL − βθ
)f + φ2W 2[(1− β)θmax − (θL − βθ)]g
=C
C +D−
V 2(θL − βθ
)f
V 2(θL − βθ
)f + φ2W 2[(1− β)θmax − (θL − βθ)]g
whereC =
(θL − βθ + (1− β)θL
) (θ − θL
)V 2f
andD =
((1− β)(2θmax − θL)− (θL − βθ)
) (θ − θL
)φ2W 2g.
It further equals
Cφ2W 2[(1− β)θmax − (θL − βθ)]g −DV 2(θL − βθ
)f
(C +D)(V 2(θL − βθ
)f + φ2W 2[(1− β)θmax − (θL − βθ)]g
)The denominator is positive. The numerator equals
φ2βθmaxfgV 2W 2(θ − θL
)2(1− β)
which is also positive.We therefore have the following results when π > π2.(i) If π > π∗ (q) , X (r∗, π) < 0 for all r∗. Therefore, there is a unique PBE with
h∗ = 1.(ii) If π < π∗ (1) , we have that X (r∗, π) > 0 for all r∗. Therefore, there is a unique
PBE with h∗ = 0.(iii) If π∗ (1) < π < π∗ (q) , since π∗ (r∗) is a decreasing function, the inverse
function r∗ (π) is also decreasing. Thus X (r∗, π) has the same sign of r∗ (π) − r∗,implying that there are three PBEs: (a) r∗ = 1 (h∗ = 1) with r∗ > r∗ (π) , (b) r∗ = q(h∗ = 0) with r∗ < r∗ (π) , and (c) a mixed one with h∗ such that X (r∗ (π) , π) = 0.
(III) For intermediate values of π ∈ [π1, π2] , there is a threshold value θ(π) suchthat when θ∗ < θ(π), dπ∗
dθ∗> 0,and when θ∗ > θ(π), dπ∗
dθ∗< 0. Thus π∗ (r∗) increases in
r∗ as long as r∗ is smaller than some cutoff value r and decreases thereafter.We therefore have the following results when π ∈ [π1, π2].(i) If π < π∗ (1) , we have that X (r∗, π) > 0 for all r∗. Therefore, there is a unique
PBE with h∗ = 0.(ii) If π∗ (1) < π < π∗ (q) , there are three PBEs: (a) r∗ = 1 (h∗ = 1) , (b) r∗ = q
(h∗ = 0) , and (c) a mixed one with h∗ such that X (r∗, π) = 0.To complete the proof, let πH ≡ π∗ (q), and πL ≡ π∗ (1).
42
7.2 Proof of Lemma 1
Proof. When s = B, or G, clearly there has been no suppression so that the revisedbelief is θ∗(B) = θB and θ∗(G) = θG. When s = ∅, self-1’s estimate of its reliability isgiven by:
r∗(∅) = Pr[s = ∅|s = ∅;h∗B;h∗G] =q
p(1− h∗B) + q + (1− q − p) (1− h∗G),
and self-1’s belief that this is actually a bad signal is given by:
b∗(∅) = Pr[s = B|s = ∅;h∗B;h∗G] =p(1− h∗B)
p(1− h∗B) + q + (1− q − p) (1− h∗G).
It implies that his revised belief of his ability conditional on no signal ∅ is given by:
θ∗(∅) = r∗(∅)θ∅ + b∗(∅)θB + (1− r∗(∅)− b∗(∅)) θG
which is strictly greater than θB and strictly less than θG.When s = B, self-0 has to choose the recall strategy, hB. If he transmits the
signal accurately to self-1 (s = B), his expected utility is given by:
UT (θB) = π
[δθBW +
∫ βδφ(θmax−θB)W
kL
{δφ(θmax − θB)W − k}gdk
]
+ (1− π)
∫ βδθBV
cL
{δθBV − c}fdc.
If on the other hand self-0 suppresses the bad signal (s = ∅), his expected utility isgiven by:
US(θB, θ∗) = π
[δθBW +
∫ βδφ(θmax−θ∗)W
kL
{δφ(θmax − θB)W − k}gdk
]
+ (1− π)
∫ βδθ∗V
cL
{δθBV − c}fdc.
The net gain from suppressing the bad signal is therefore equal to:
US(θB, θ∗)− UT (θB) = (1− π)
∫ βδθ∗V
βδθBV
{δθBV − c}fdc
− π∫ βδφ(θmax−θB)W
βδφ(θmax−θ∗)W{δφ(θmax − θB)W − k}gdk
=βδ2 (θ∗ − θB)
2
[(1− π)fV 2X2 − πφ2gW 2X1
]where
X2 = 2θB − βθB − βθ∗
andX1 = 2θmax − 2βθmax + βθ∗ + βθB − 2θB.
43

Similarly, when s = G, self-0 has to choose the recall strategy, hG. If he transmitsthe signal accurately to self-1 (s = G), his expected utility is given by:
UT (θG) = π
[δθGW +
∫ βδφ(θmax−θG)W
kL
{δφ(θmax − θG)W − k}gdk
]
+ (1− π)
∫ βδθGV
cL
{δθGV − c}fdc.
If self-0 suppresses the bad signal (s = ∅), his expected utility is given by:
US(θG, θ∗) = π
[δθGW +
∫ βδφ(θmax−θ∗)W
kL
{δφ(θmax − θG)W − k}gdk
]
+ (1− π)
∫ βδθ∗V
cL
{δθGV − c}fdc.
The net gain from suppressing the bad signal is therefore equal to:
US(θG, θ∗)− UT (θG) = π
∫ βδφ(θmax−θ∗)W
βδφ(θmax−θG)W
{δφ(θmax − θG)W − k}gdk
− (1− π)
∫ βδθGV
βδθ∗V
{δθGV − c}fdc
=βδ2 (θG − θ∗)
2
[πφ2gW 2Y1 − (1− π)fV 2Y2
]where
Y1 = 2θmax − 2βθmax + βθ∗ + βθG − 2θG
andY2 = 2θG − βθG − βθ∗.
Here, we can show that X1 > Y1, and X2 < Y2 as 2 > β and 0 < θB < θG.Suppose US(θB, θ
∗) − UT (θB) ≥ 0. Then (1 − π)fV 2X2 ≥ πφ2gW 2X1 becauseθ∗ > θB.
Given that X2 < Y2 and X1 > Y1, we have that (1− π)fV 2Y2 > πφ2gW 2Y1.Then US(θG, θ
∗)− UT (θG) < 0 because θG > θ∗.
7.3 Proof of Proposition 2
Proof. First, we check the existence condition for the PBE with h∗B = 0. By Lemma1, we know that in this PBE we must have h∗G = 1.
Thus this PBE exists if US(θB, θ∗)−UT (θB) ≥ 0 where θ∗ = (pθB + qθ∅) / (p+ q) ,
that is,(1− π)fV 2X2 (θB, θ
∗)− πφ2gW 2X1 (θB, θ∗) ≥ 0
where
X2(θB, θ∗)
= X2 (θB, (pθB + qθ∅) / (p+ q))
= 2θB − βθB − β (pθB + qθ∅) / (p+ q)
44

and
X1 (θB, θ∗)
= X1 (θB, (pθB + qθ∅) / (p+ q))
= 2θmax − 2βθmax + β (pθB + qθ∅) / (p+ q) + βθB − 2θB.
It is equivalent to
π ≤ πOH
=fV 2X2 (θB, (pθB + qθ∅) / (p+ q))
fV 2X2 (θB, (pθB + qθ∅) / (p+ q)) + φ2gW 2X1 (θB, (pθB + qθ∅) / (p+ q)).
Second, we check the existence condition for the PBE with h∗G = 0. By Lemma 1, weknow that in this PBE we must have h∗B = 1.
Thus this PBE exists if US(θG, θ∗)−UT (θG) ≥ 0 where θ∗ = ((1− p− q) θG + qθ∅) / (1− p) ,
that is,πφ2gW 2X1 (θG, θ
∗)− (1− π)fV 2X2 (θG, θ∗) ≥ 0
where
X1 (θG, θ∗)
= X1 (θG, ((1− p− q) θG + qθ∅) / (1− p))= 2θmax − 2βθmax + β ((1− p− q) θG + qθ∅) / (1− p) + βθG − 2θG.
and
X2 (θG, θ∗)
= X2 (θG, ((1− p− q) θG + qθ∅) / (1− p))= 2θG − βθG − β ((1− p− q) θG + qθ∅) / (1− p) .
It is equivalent to
π ≥ πUL
=fV 2X2 (θG, ((1− p− q) θG + qθ∅) / (1− p))
fV 2X2 (θG, ((1− p− q) θG + qθ∅) / (1− p)) + φ2gW 2X1 (θG, ((1− p− q) θG + qθ∅) / (1− p)).
Third, we check the existence condition for the PBE with h∗G = 1 and h∗B = 1.This PBE exists if US(θB, θ
∗) − UT (θB) ≤ 0 and US(θG, θ∗) − UT (θG) ≤ 0 where
θ∗ = θ∅.US(θB, θ
∗)− UT (θB) ≤ 0
is equivalent to
(1− π)fV 2X2 (θB, θ∗)− πφ2gW 2X1 (θB, θ
∗) ≤ 0
where
X2(θB, θ∗)
= X2 (θB, θ∅)
= 2θB − βθB − βθ∅
45

and
X1 (θB, θ∗)
= X1 (θB, θ∅)
= 2θmax − 2βθmax + βθ∅ + βθB − 2θB.
It is equivalent to
π ≥ πOL
=fV 2X2 (θB, θ∅)
fV 2X2 (θB, θ∅) + φ2gW 2X1 (θB, θ∅).
Since θ∅ > (pθB + qθ∅) / (p+ q) , X2 (θB, θ∗) is decreasing in θ∗, and X1 (θB, θ
∗) isincreasing in θ∗, it is clear that πOL < πOH .
Furthermore,US(θG, θ
∗)− UT (θG) ≤ 0
is equivalent to
πφ2gW 2X1 (θG, θ∗)− (1− π)fV 2X2 (θG, θ
∗) ≤ 0
where
X1 (θG, θ∗)
= X1 (θG, θ∅)
= 2θmax − 2βθmax + βθ∅ + βθG − 2θG.
and
X2 (θG, θ∗)
= X2 (θG, θ∅)
= 2θG − βθG − βθ∅.
It is equivalent to
π ≤ πUH
=fV 2X2 (θG, θ∅)
fV 2X2 (θG, θ∅) + φ2gW 2X1 (θG, θ∅).
Since θ∅ < ((1− p− q) θG + qθ∅) / (1− p) , X2 (θG, θ∗) is decreasing in θ∗, and
X1 (θG, θ∗) is increasing in θ∗, it is clear that πUH > πUL .
Since πOL < πOH and πUH > πUL , by Lemma 1, we have only two cases to consider:(1) πOH < πUL ; (2) πUH < πOL .
Notably, since X1 (θ, θ∗) is decreasing in θ, and X2 (θ, θ∗) is increasing in θ, wehave that πUH > πOL . Thus we rule out case (2).
Therefore, we have πOL < πOH < πUL < πUH , which proves the proposition.
46

7.4 Proof of Proposition 3
Proof. In the case where S 6 cH − βδθ∗V, we have that
USS (θL, θ(r
∗))− UST (θL) = −π[
∫ βδφ(θmax−θL)W
βδφ(θmax−θ∗)W{δφ(θmax − θL)W − k}gdk]
+ (1− π)[
∫ βδθ∗V+S
βδθLV+S
{δθLV − c}fdc+ fS
∫ βδθ∗V+S
βδθLV+S
dc]
where the first term is independent of S, and the second term equals
1
2(1− π) δ2βfV 2 (θL − θ∗) (βθ∗ − 2θL + βθL)
which is also independent of S.
7.5 Proof of Proposition 4
Proof. In the range cH − βδθ∗V < S < cH − βδθLV , define
Y (r∗, π, S)
≡ USS (θL, θ(r
∗))− UST (θL)
= −πX1 + (1− π)Y2
where X1 ≡∫ βδφ(θmax−θL)Wβδφ(θmax−θ∗)W {δφ(θmax− θL)W − k}gdk > 0 and Y2 ≡
∫ cHβδθLV+S
{δθLV −c}fdc+ fS
∫ cHβδθLV+S
dc > 0. We can therefore apply similar methods to those used in
the proof of Proposition 1. Once again, it is clear that Y (r∗, π, S) is continuous anddecreasing in π for all r∗ ∈ [q, 1] as X1 and Y2 are both positive. Further, we have thatY (r∗, 1, S) < 0 and Y (r∗, 0, S) > 0 for all r∗. Thus there is a unique π∗∗ (r∗) such thatY (r∗, π∗∗ (r∗) , S) = 0, and Y (r∗, π, S) > 0 for all π < π∗∗ (r∗) , and Y (r∗, π, S) < 0for all π > π∗∗ (r∗) for all r∗.
Note also that Y2 does not depend on θ∗. Thus we have, by the implicit functiontheorem,
dπ∗∗
dθ∗= −
dY (r∗,π,S)dθ∗
dY (r∗,π,S)dπ
=−πβδφW 2[δφ(θmax − θL)− βδφ(θmax − θ∗)]g
X1 + Y2< 0
implying that π∗∗ (r∗) is decreasing in r∗, since θ∗ is increasing in r∗.We therefore have the following results.(i) If π > π∗∗ (q) , Y (r∗, π, S) < 0 for all r∗. Therefore, there is a unique PBE with
h∗ = 1.(ii) If π < π∗∗ (1) , we have that Y (r∗, π, S) > 0 for all r∗. Therefore, there is a
unique PBE with h∗ = 0.(iii) If π∗∗ (1) < π < π∗∗ (q) , since π∗∗ (r∗) is a decreasing function, the inverse
function r∗ (π) is also decreasing. Thus Y (r∗, π, S) has the same sign of r∗ (π)− r∗,implying that there are three PBEs: (a) r∗ = 1 (h∗ = 1) with r∗ > r∗ (π) , (b) r∗ = q(h∗ = 0) with r∗ < r∗ (π) , and (c) a mixed one with h∗ such that Y (r∗ (π) , π, S) = 0.
To complete the proof, let πSH ≡ π∗∗ (q), and πSL ≡ π∗∗ (1).
47

7.6 Proof of Proposition 6
Proof. Note that W ST (cH − βδθLV ) = qUS
T (θH) + (1− q)UST (θL) where
UST (θi) = π[δθiW +
∫ βδφ(θmax−θi)W
kL
{δφ(θmax − θi)W − k}dG(k)]
+ (1− π)
∫ cH
cL
{δθiV − c}dF (c).
W SS (0) = qUS
S (θH) + (1− q)USS (θL) where
USS (θi) = π
(δθiW +
∫ βδφ(θmax−θ)W
kL
(δφ (θmax − θi)W − k) gdk
)
+ (1− π)
(∫ βδθV
cL
(δθiV − c) fdc
).
Thus, it is straightforward to get
W ST (cH − βδθLV )−W S
S (0)
= πgδφW 2
(1− 1
2β2δφ
)q(1− q)(θH − θL)2
+ (1− π) f(cH − βδθV
)(δθV − 1
2
(cH + βδθV
)).
48