reservoir characterization in leming lake, cold lake, … · reservoir characterization in leming...
TRANSCRIPT

Reservoir Characterization in Leming Lake, Cold Lake, Alberta John J. Zhang and Laurence R. Bentley
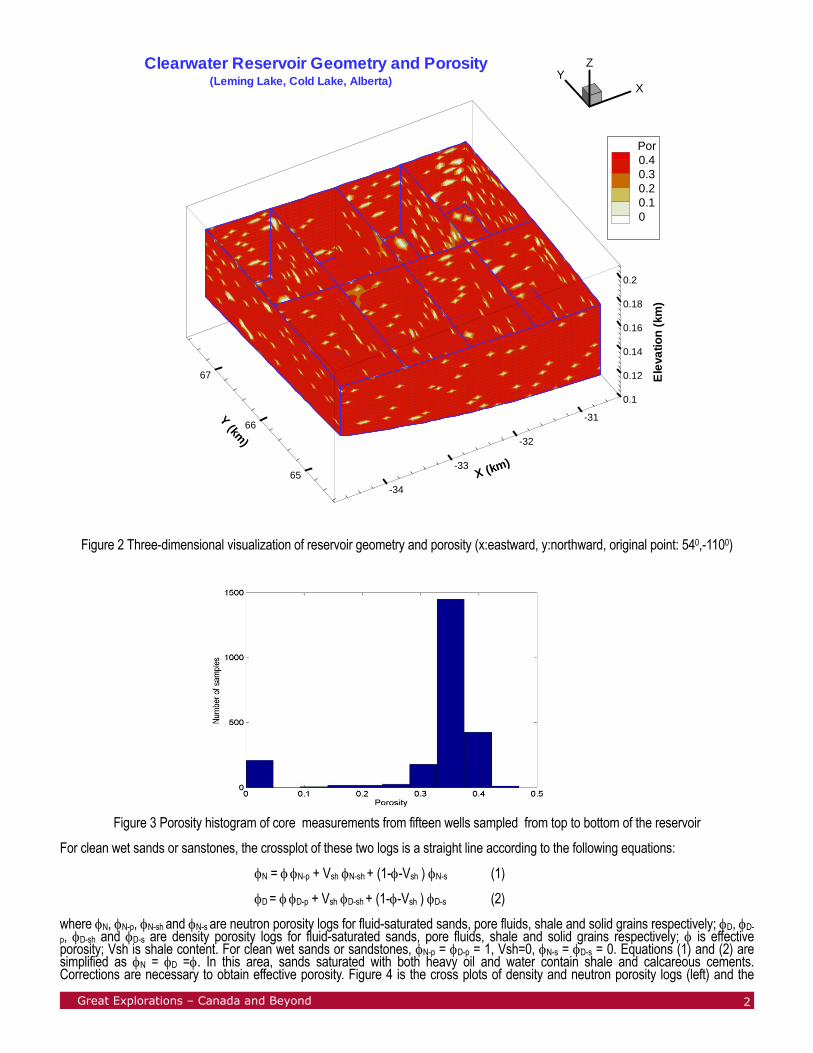
Introduction Heavy oil has been produced since 1986 from Clearwater formation in Leming Lake area. Recently Imperial Oil shot time-lapase three-D seismic surveys over a few production pads in an attempt to monitor fluid flow and reservoir conditions. Seimsic interpretaion for changes in saturation, pressure and temperature in reservoirs adds another constraint on reservoir characterization and simulation in addition to production history matching. Reservoir management based on the results optimized by both production performance and time-lapse seismic would enhance heavy oil recovery. In this paper the authors focus on integration of well logs and lab measurements for a three-D reservoir characterizaiton model, which will be modified to produce outputs consisitent with production history and time-lapse seismic. Reservoir geometry The Clearwater formation is bounded on bottom by the McMurray formation and on top by the Grand Rapids formation. It belongs to the upper Mannville. An overlying shale layer of a few meters serves as a caprock to hold hydrocarbon. The oil saturated sands are identified by low Gamma ray, low SP potential, and high electrical resistivity. Figure 1 shows a set of well log curves at well 00/08-03-065-04W4/0. From shale to oil sands, SP, Gamma and resistivity logs undergo an abrupt change, while sonic, neutron porosity and density logs remain nearly constant. We picked the tops and the bottoms of the reserovir on well logs and did trend analysis for both surfaces. The error between the actual value and the one computed from trend analysis avearges 4.7 meters. Figure 2 is a three-dimensional visualization of the reservoir geometry.
SP and Gamma Resistivity Sonic travel time Gamma Neutron porosity DensitySP and Gamma Resistivity Sonic travel time Gamma Neutron porosity Density
Strongly cemented sands or limestones
SP and Gamma Resistivity Sonic travel time Gamma Neutron porosity DensitySP and Gamma Resistivity Sonic travel time Gamma Neutron porosity Density
Strongly cemented sands or limestones
Oil
Zone
Oil
Zone
Oil
Zone
Oil
Zone
Figure 1 Well logs for Clearwater Formation at well 00/08-03-065-04W4/0.
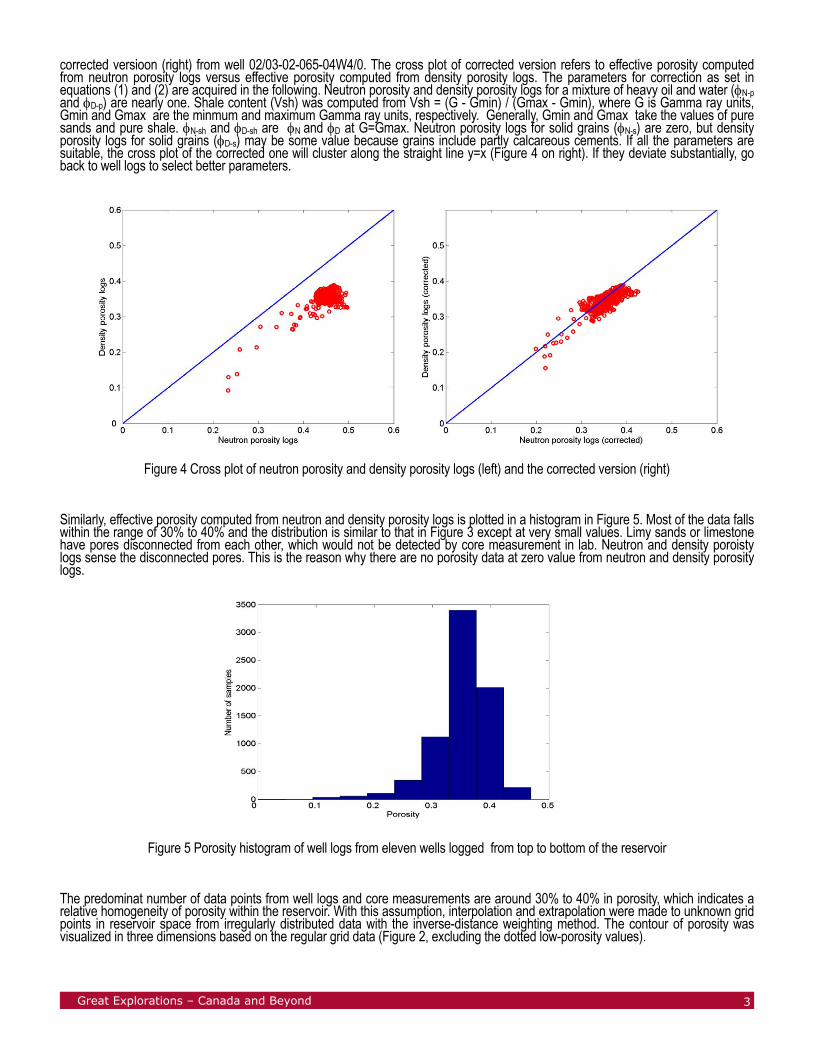
Porosity population The Clearwater reservoir is composed of unconsolidated sands with varying degree of limy cementations. Shale interbeds are less frequently encountered, as evidenced by flat Gamma logs within the zone in Figure 1, and they may not constitute an important impermeable barrier to fluid flow within the reservoir. Lab measurements of core samples from fifteen wells indicate that porosity clusters between 30% and 40% except within a few in strongly cemented sands or limestone. Figure 3 is the histogram for 2343 core samples from these wells. The range of 30% to 40% accounts for an overwhelming part of the data. The zero or near-zero values are detected in lab predominantly from limy sands or limestone. As a result, sands within the reservoir can be classified into two groups, a majority of homogeneous sands with 30%-40% porosity and the other a sparsely distributed tightly cemented limy sands.
Great Explorations – Canada and Beyond 1
Porosity well logs can be used to estimate porosity. There are eleven wells in this area digitized with porosity logs in addition to conventional logs. Of these logs, density logs can be used to make estimation and neutron porosity logs gauge porosity directly. However, sonic logs are much more complicated to derive porosity, and may not be useful in this area.
0.1
0.12
0.14
0.16
0.18
0.2
Ele
vatio
n(k
m)
-34
-33
-32
-31
X (km)65
66
67
Y(km
)
YX
Z
Por0.40.30.20.10
Clearwater Reservoir Geometry and Porosity(Leming Lake, Cold Lake, Alberta)
Figure 2 Three-dimensional visualization of reservoir geometry and porosity (x:eastward, y:northward, original point: 540,-1100)
Figure 3 Porosity histogram of core measurements from fifteen wells sampled from top to bottom of the reservoir For clean wet sands or sanstones, the crossplot of these two logs is a straight line according to the following equations: φN = φ φN-p + Vsh φN-sh + (1-φ-Vsh ) φN-s (1) φD = φ φD-p + Vsh φD-sh + (1-φ-Vsh ) φD-s (2) where φN, φN-p, φN-sh and φN-s are neutron porosity logs for fluid-saturated sands, pore fluids, shale and solid grains respectively; φD, φD-p, φD-sh and φD-s are density porosity logs for fluid-saturated sands, pore fluids, shale and solid grains respectively; φ is effective porosity; Vsh is shale content. For clean wet sands or sandstones, φN-p = φD-p = 1, Vsh=0, φN-s = φD-s = 0. Equations (1) and (2) are simplified as φN = φD =φ. In this area, sands saturated with both heavy oil and water contain shale and calcareous cements. Corrections are necessary to obtain effective porosity. Figure 4 is the cross plots of density and neutron porosity logs (left) and the
Great Explorations – Canada and Beyond 2
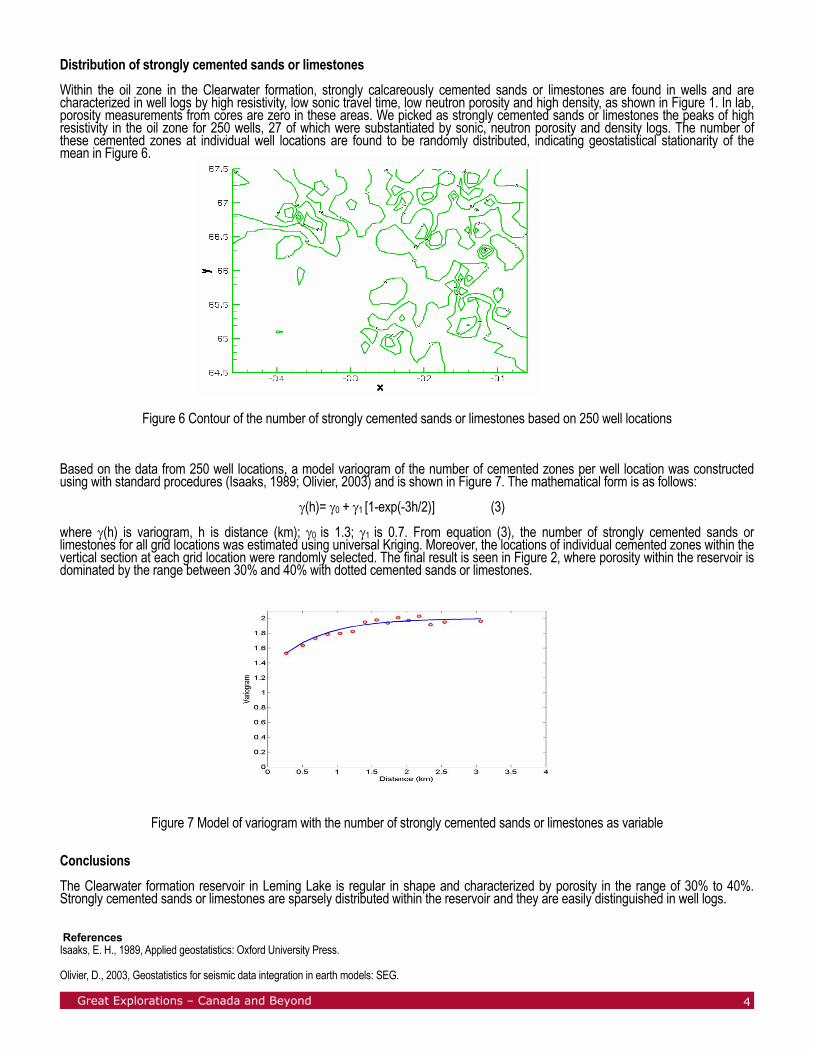
corrected versioon (right) from well 02/03-02-065-04W4/0. The cross plot of corrected version refers to effective porosity computed from neutron porosity logs versus effective porosity computed from density porosity logs. The parameters for correction as set in equations (1) and (2) are acquired in the following. Neutron porosity and density porosity logs for a mixture of heavy oil and water (φN-p and φD-p) are nearly one. Shale content (Vsh) was computed from Vsh = (G - Gmin) / (Gmax - Gmin), where G is Gamma ray units, Gmin and Gmax are the minmum and maximum Gamma ray units, respectively. Generally, Gmin and Gmax take the values of pure sands and pure shale. φN-sh and φD-sh are φN and φD at G=Gmax. Neutron porosity logs for solid grains (φN-s) are zero, but density porosity logs for solid grains (φD-s) may be some value because grains include partly calcareous cements. If all the parameters are suitable, the cross plot of the corrected one will cluster along the straight line y=x (Figure 4 on right). If they deviate substantially, go back to well logs to select better parameters.
Figure 4 Cross plot of neutron porosity and density porosity logs (left) and the corrected version (right) Similarly, effective porosity computed from neutron and density porosity logs is plotted in a histogram in Figure 5. Most of the data falls within the range of 30% to 40% and the distribution is similar to that in Figure 3 except at very small values. Limy sands or limestone have pores disconnected from each other, which would not be detected by core measurement in lab. Neutron and density poroisty logs sense the disconnected pores. This is the reason why there are no porosity data at zero value from neutron and density porosity logs.
Figure 5 Porosity histogram of well logs from eleven wells logged from top to bottom of the reservoir The predominat number of data points from well logs and core measurements are around 30% to 40% in porosity, which indicates a relative homogeneity of porosity within the reservoir. With this assumption, interpolation and extrapolation were made to unknown grid points in reservoir space from irregularly distributed data with the inverse-distance weighting method. The contour of porosity was visualized in three dimensions based on the regular grid data (Figure 2, excluding the dotted low-porosity values).
Great Explorations – Canada and Beyond 3
Distribution of strongly cemented sands or limestones Within the oil zone in the Clearwater formation, strongly calcareously cemented sands or limestones are found in wells and are characterized in well logs by high resistivity, low sonic travel time, low neutron porosity and high density, as shown in Figure 1. In lab, porosity measurements from cores are zero in these areas. We picked as strongly cemented sands or limestones the peaks of high resistivity in the oil zone for 250 wells, 27 of which were substantiated by sonic, neutron porosity and density logs. The number of these cemented zones at individual well locations are found to be randomly distributed, indicating geostatistical stationarity of the mean in Figure 6.
Figure 6 Contour of the number of strongly cemented sands or limestones based on 250 well locations Based on the data from 250 well locations, a model variogram of the number of cemented zones per well location was constructed using with standard procedures (Isaaks, 1989; Olivier, 2003) and is shown in Figure 7. The mathematical form is as follows: γ(h)= γ0 + γ1 [1-exp(-3h/2)] (3) where γ(h) is variogram, h is distance (km); γ0 is 1.3; γ1 is 0.7. From equation (3), the number of strongly cemented sands or limestones for all grid locations was estimated using universal Kriging. Moreover, the locations of individual cemented zones within the vertical section at each grid location were randomly selected. The final result is seen in Figure 2, where porosity within the reservoir is dominated by the range between 30% and 40% with dotted cemented sands or limestones.
Figure 7 Model of variogram with the number of strongly cemented sands or limestones as variable Conclusions The Clearwater formation reservoir in Leming Lake is regular in shape and characterized by porosity in the range of 30% to 40%. Strongly cemented sands or limestones are sparsely distributed within the reservoir and they are easily distinguished in well logs. References Isaaks, E. H., 1989, Applied geostatistics: Oxford University Press.
Olivier, D., 2003, Geostatistics for seismic data integration in earth models: SEG.
Great Explorations – Canada and Beyond 4