cambridge creek reservoir & violin lake dam
TRANSCRIPT

J.M.K. (Jim) Dumont, P.Eng. | 201 Scott Point Drive, Salt Spring Island, BC V8K 2R1, Canada | Tel 250 221 1470 | [email protected]
Cambridge Creek Reservoir & Violin Lake Dam Decommissioning
Hydrology Review
BC Wildlife Federation
November 27, 2020
Presented to: Neil Fletcher Manager of Conservation Stewardship BC Wildlife Federation 101 - 9706 188 Street Surrey, BC V4N 3M2

201 Scott Point Drive, Salt Spring Island, BC V8K 2R1 | (250) 221-1470
November 27, 2020
Neil Fletcher Manager of Conservation Stewardship BC Wildlife Federation 101 - 9706 188 Street Surrey, BC V4N 3M2
Dear Neil:
Re: Cambridge Creek Reservoir & Violin Lake Dam Decommissioning Hydrology Review
At the request of the BC Wildlife Federation and the City of Trail I have undertaken a review of the hydrology of the Cambridge Dam and Violin Lake in support of the decommissioning of both dams. This study assessed the potential increases in future flood discharges in the watercourses downstream of the dam following decommissioning.
I have found that the increases in flood discharge that result from dam decommissioning are very small and would result in a minimal increase in floodplain in all downstream areas where there is a risk to people. The normal next step in the evaluation process associated with dam decommissioning would be to establish the floodplain location and elevations below the dam though the areas at risk to establish the impact of the dam decommissioning.
Having found that there are minimal increased risks in downstream reaches I recommend that the floodplain delineation be waived and that the design of the physical decommissioning be completed.
Please contact me if you have any comments or questions.
Regards
J. M. K. (Jim), Dumont, P.Eng.

TABLE OF CONTENTS Page
LETTER OF TRANSMITTAL 1. INTRODUCTION 1
1.1 Scope of Analysis 1 1.2 Background Information 1 1.3 Study Area 2
2. HYDROLOGIC ANALYSIS 4 2.1 Flood Discharge Estimation 4 2.2 Flood Hydrograph Estimation 9
3. FLOOD ROUTING ANALYSIS 14 3.1 Cambridge Lake Reservoir 14 3.2 Violin Lake 17
4. RECOMMENDATIONS 23 5. CORPORATE AUTHORIZATION 24
LIST OF FIGURES Figure 1-1 Study Area 3 Figure 2-1 Study Area Watersheds 5 Figure 2-2 Regional Watersheds 6 Figure 2-3 Peak Flood Estimates 7 Figure 2-4 Cambridge Creek Reservoir Inflow Floods 8 Figure 2-5 Violin Lake Inflow Floods 9 Figure 2-6 Trail Creek Hydrographs 11 Figure 2-7 Trail Creek Annual Flood Hydrographs 12 Figure 2-8 Trail Creek Flood Hydrograph 13 Figure 3-1 Photo of Dam and Water Level 14 Figure 3-2 Cambridge Dam Flood Routing 16 Figure 3-3 Violin Lake Spillway 18 Figure 3-4 Violin Lake Flood Routing 20 Figure 3-5 Goodeve Creek 22
LIST OF TABLES Table 2.1 – Area Watersheds 4 Table 2.2 – Regional Watershed Analysis 7 Table 2.3 – Natural Flood Discharges along Cambridge Creek 8 Table 2.4 – Natural Flood Discharges along Goodeve Creek 9 Table 3.1 – Cambridge Reservoir Operating Curves 15 Table 3.2 – Cambridge and Trail Creek Flood Hydrograph Comparison 17 Table 3.3 – Violin Lake Operating Curves 19 Table 3.4 – Violin Lake Flood Hydrograph Comparison 21

- 1 -
1. INTRODUCTION Mr. Jim Dumont has been retained by the BC Wildlife Federation and the City of Trail to undertake a review of the hydrology of the Cambridge Dam and Violin Lake in support of the decommissioning of both dams. The Dam Decommissioning Guidelines, Version 1 - April 2019, Ministry of Forests, Lands, Natural Resource Operations and Rural Development provides direction during the planning, and design of the decommissioning process.
The BC Regulation and Guidelines considers potential impacts to the flood discharges that might arise as a result of removing the dam and associated reservoir. The potential impacts may include:
- Increased flood discharges resulting from the flow attenuation offered by the reservoir
- Increased floodplain depths and extents if the flood discharges are increased.
This study assesses the potential increases in future flood discharges in the watercourses downstream of the dam following decommissioning. This work will lead to a recommendation for any additional assessment that would refine any additional risks posed along stream reaches downstream of the Cambridge Creek Dam and Violin Lake dam.
1.1 Scope of Analysis The list of tasks to be completed as part of the Hydrology Review component of the Cambridge Creek Reservoir & Violin Lake Dam Decommissioning project includes:
1. Hydrological analysis for five-day low flow, two, 10, 100 and 200-year return inflow hydrographs
2. Analysis of the potential impact that the loss of peak flow attenuation from reservoir will have on downstream flooding of public and private properties, buildings, and residences located in re-activated flood plains
3. Determine the need to establish floodplain elevations for the appropriate return period inflows downstream of the dam and recommend additional analysis giving consideration to human safety.
1.2 Background Information Background information for the analysis was derived from a number of diverse sources that included:
1. Ministry of Environment Lands and Parks, Water Management Division record information files.
2. Cambridge Reservoir Dam Inflow Design Flood Modelling, July 2018, Austin Engineering Ltd.
- 2 -
3. Cambridge Reservoir Dam Inundation Mapping, December 2018, Ecora Engineering & Resource Group Ltd.
4. Violin Lake Dam: Re-determination of Consequences Classification, September 2019, Ecora Engineering & Resource Group Ltd.
5. Topographic Mapping, Natural Resources Canada, 6. Stream Discharge Archive, Environment Canada Water Survey of
Canada, 7. Cambridge Creek Dam Records, Ministry of Environment and Climate
Change. 8. Violin Lake and Dam Records, Ministry of Environment and Climate
Change. 9. USGS public records at https://streamstats.usgs.gov/ss/
1.3 Study Area The Cambridge Creek Dam and Reservoir and Violin Lake are located within the City of Trail approximately 4 and 7 kilometres south of the main urban area as shown on Figure 1-1. The Cambridge Dam and Storage Reservoir along with Violin Lake are within a mountainous valley that lies between Lookout Mountain to the east, and Lake Mountain to the west, and rises approximately 700 m above the valley bottom.
The Cambridge Creek Reservoir is oriented approximately north-south with the dam being located at the north end of the reservoir. Cambridge Creek dam discharges into Cambridge Creek. Violin Lake is the source of Goodeve Creek which flows southward and eventually discharges into the Columbia River.
Violin Lake Dam and Cambridge Reservoir Dam were constructed as the main water supply for the City of Trail with highest storage being held in Violin Lake. A siphon pipe at the north side of lake drew water from an elevation of 951.22 m and piped it past the drainage divide to the Cambridge Reservoir as needed.
The Cambridge Creek water supply system, which includes Violin Lake Dam, was abandoned in 1994 due to concerns with water quality.

Figure 1 - 1Study Area
SCALE0 1 2 km
Cambridge Creek Dam and Reservoir
Cambridge Creek Reservoir & Violin Lake Dam Decommissioning Hydrology Review
Violin Lake and Dam

- 4 -
2. HYDROLOGIC ANALYSIS Previous studies have not provided the hydrological analysis to develop or to route the five-day low flow, 2, 10, 100 and 200-year return inflow hydrographs through the Cambridge Creek Reservoir and the Violin Lake Dam. This review has created estimates of these specific hydrographs and provides an assessment of the effects of the ability of the dams to attenuate flood discharges in downstream reaches.
2.1 Flood Discharge Estimation The first step in the process was to establish the streams affected by the Cambridge Dam discharges and their watersheds. The watershed in the area are shown on Figure 2-1 and described in Table 2.1. The watersheds in Canada were derived using National Topographic Mapping at a scale of 1:50,000 and the watersheds in the United States used the USGS Streamstats tool.
Table 2.1 – Area Watersheds
Description Area (km2) 1. Cambridge Creek Dam 6.1 2. Cambridge Creek Lower Watershed 4.0 3. Trail Creek Upper Watershed 34.9 4. Trail Creek below Cambridge confluence (1+2+3) 45.0 5. Trail Creek Lower Watershed 9.7 6. Trail Creek at French Street, Trail (4+5) 54.7 7. Violin Lake watershed 2.9 8. Goodeve Creek at the US Boundary 16.6 9. Goodeve Creek at Mitchell Road 36.3 10. Goodeve Creek at Confluence of Columbia River 39.7
The hydrologic analysis includes derivation of the instantaneous discharges for the range of specified return periods and estimation of their respective flood hydrographs. The approach utilized a regional analysis of nearby watersheds with recorded stream discharges. A screening criterion used to determine which gauging records were appropriate included: 1. Recorded natural discharges, that is watersheds without dams of flow
diversions, 2. A period of record greater than 20 years, and 3. Within 50 km of the study area.
Two watersheds within the regions met the screening criterion and included Big Sheep Creek near Rossland immediately west of the study area and Salmo River near Salmo to the east of the study area as shown on Figure 2-2. There is a gauging station on Trail Creek at French Street but it did not have sufficient data to pass the screening process and the discharges may be affected by the Cambridge Creek Reservoir.

Figure 2 - 1
Cambridge CreekReservoir Watershed
26.1 km
Violin LakeWatershed
22.9 km
Cambridge Creek Reservoir & Violin Lake Dam Decommissioning Hydrology Review
Study Area Watersheds
SCALE
0 1 2 km
Canada
United States
British Columbia
Washington
Goodeve Creek To USA Border
Watershed2
13.7 km
Goodeve Creek USA Border to Mitchell Road
Watershed2
19.7 km
Goodeve Creek Mitchell Road to Columbia River
Watershed2
3.4 km
Trail CreekUpper Watershed
234.9 km
Cambridge CreekLower Watershed
24.0 km
Trail CreekLower Watershed
29.7 km

Figure 2 - 2Regional Watersheds
Cambridge Creek Watershed
Trail CreekLower Watershed
Trail CreekUpper Watershed
SALMO RIVER NEAR SALMO08NE074
BIG SHEEP CREEK NEAR ROSSLAND08NE039
SCALE
0 5 10 km
Cambridge Creek Reservoir & Violin Lake Dam Decommissioning Hydrology Review
Goodeve Creek Watershed
Canada
United States
British Columbia
Washington

- 7 -
The instantaneous peak flood discharges for each of the gauging stations was completed using the Log Pearson 3 statistical estimation method fitting technique which has been the adopted standard of the US Geological Survey and other regulatory agencies since the publication of Bulletin 17 in 1967. The results of the statistical analysis are shown in Table 2.2.
Table 2.2 – Regional Watershed Analysis Return Period
(years) Peak Flood Discharge (m3/s)
08NE039 08NE074 2 50.6 263 3 58.1 293 5 65.7 324
10 74.0 359 25 83.0 398 50 88.8 425 100 93.8 449 200 98.3 471
Years of Record 71 70 From 1930 1949
To 2018 2018 Area (km2) 347 1,240
The relationship between area and discharge for each return period was plotted and a linear extrapolation was established as shown on Figure 2-3.
Figure 2-3 Peak Flood Estimates
The area-discharge relationship derived in Figure 2-3 was used to establish the natural peak flood discharges for the Cambridge Creek, Trail Creek, and Goodeve Creek watersheds within the study area.
0
50
100
150
200
250
300
350
400
450
500
0 200 400 600 800 1000 1200 1400
Peak
Disc
harg
e (m
3 /s)
Watershed Area (km2)
200 Year100 Year50 Year25 Year10 Year5 Year3 Year2 Year

- 8 -
The natural peak discharges that would occur without the dam and reservoir on Cambridge Creek and lower reaches of Trail Creek are shown in Table 2-3.
Table 2.3 – Natural Flood Discharges along Cambridge Creek
Return Period (years)
Unit Area Discharge Peak Flood Discharge (m3/s)
(m3/s/km2) Cambridge Creek Reservoir
Trail Creek Below
Confluence
Trail Creek at French Street
2 0.2072 1.3 9.3 11.3 3 0.2315 1.4 10.4 12.7 5 0.2560 1.6 11.5 14.0
10 0.2839 1.7 12.8 15.5 25 0.3152 1.9 14.2 17.2 50 0.3361 2.1 15.1 18.4 100 0.3551 2.2 16.0 19.4 200 0.3725 2.3 16.8 20.4
Area (km2) 6.1 45 54.7
The flood frequency plot for the Cambridge Creek Reservoir inflow is shown on Figure 2.4.
Figure 2-4 Cambridge Creek Reservoir Inflow Floods
The area-discharge relationship derived in Figure 2-3 was used to establish the natural peak flood discharges along Goodeve Creek. The natural peak discharges that would occur without the dam and Violin Lake on Goodeve Creek are shown in Table 2-4.
0.0
0.5
1.0
1.5
2.0
2.5
1 10 100 1000
Peak
Dis
char
ge(m
3 /s)
Return Period (years)

- 9 -
Table 2.4 – Natural Flood Discharges along Goodeve Creek
Return Period (years)
Unit Area Discharge Peak Flood Discharge (m3/s)
(m3/s/km2) Violin Lake Goodeve
Creek at USA Border
Goodeve Creek at Mitchell Road
Goodeve Creek at Columbia
River 2 0.2072 0.60 3.4 7.5 8.2 3 0.2315 0.67 3.8 8.4 9.2 5 0.2560 0.74 4.2 9.3 10.2
10 0.2839 0.82 4.7 10.3 11.3 25 0.3152 0.91 5.2 11.4 12.5 50 0.3361 0.97 5.6 12.2 13.3
100 0.3551 1.03 5.9 12.9 14.1 200 0.3725 1.08 6.2 13.5 14.8
Area (km2) 2.9 16.6 36.3 39.7
The flood frequency plot for the inflows of Violin Lake is shown on Figure 2.5.
Figure 2-5 Violin Lake Inflow Floods
2.2 Flood Hydrograph Estimation
The estimate of peak discharge provides a snapshot of the flood discharge at a point in time. To describe the operation of the dam and reservoir a hydrograph describing the changing discharge over time is required.
While the gauging station on Trail Creek did not have a sufficiently long period for use in determining the peak discharge rate, it has several years of record and can be used in establishing the shape of the flood hydrograph that can be routed through both the Cambridge Creek Reservoir and Violin Lake.
0.00
0.20
0.40
0.60
0.80
1.00
1.20
1 10 100 1000
Peak
Disc
harg
e (m
3 /s)
Return Period (years)
Violin Lake

- 10 -
The hydrograph describes the discharge over time, through the duration of a flood event. Where the discharge will begin at a small rate, increase to a peak, and then recede to a small rate over a period. The flood hydrograph can last from a day to several days depending upon the climate inputs.
Daily discharge values over time have are shown on Figure 2-6. In the upper left the entire period of record is shown. Also shown are the annual discharges for years where the peak discharge exceeded 4 m3/s. As can be seen the flood hydrographs are extended over several days, often with several climate inputs, or rainfall events affecting the both the peak rate and total volume of the hydrograph.
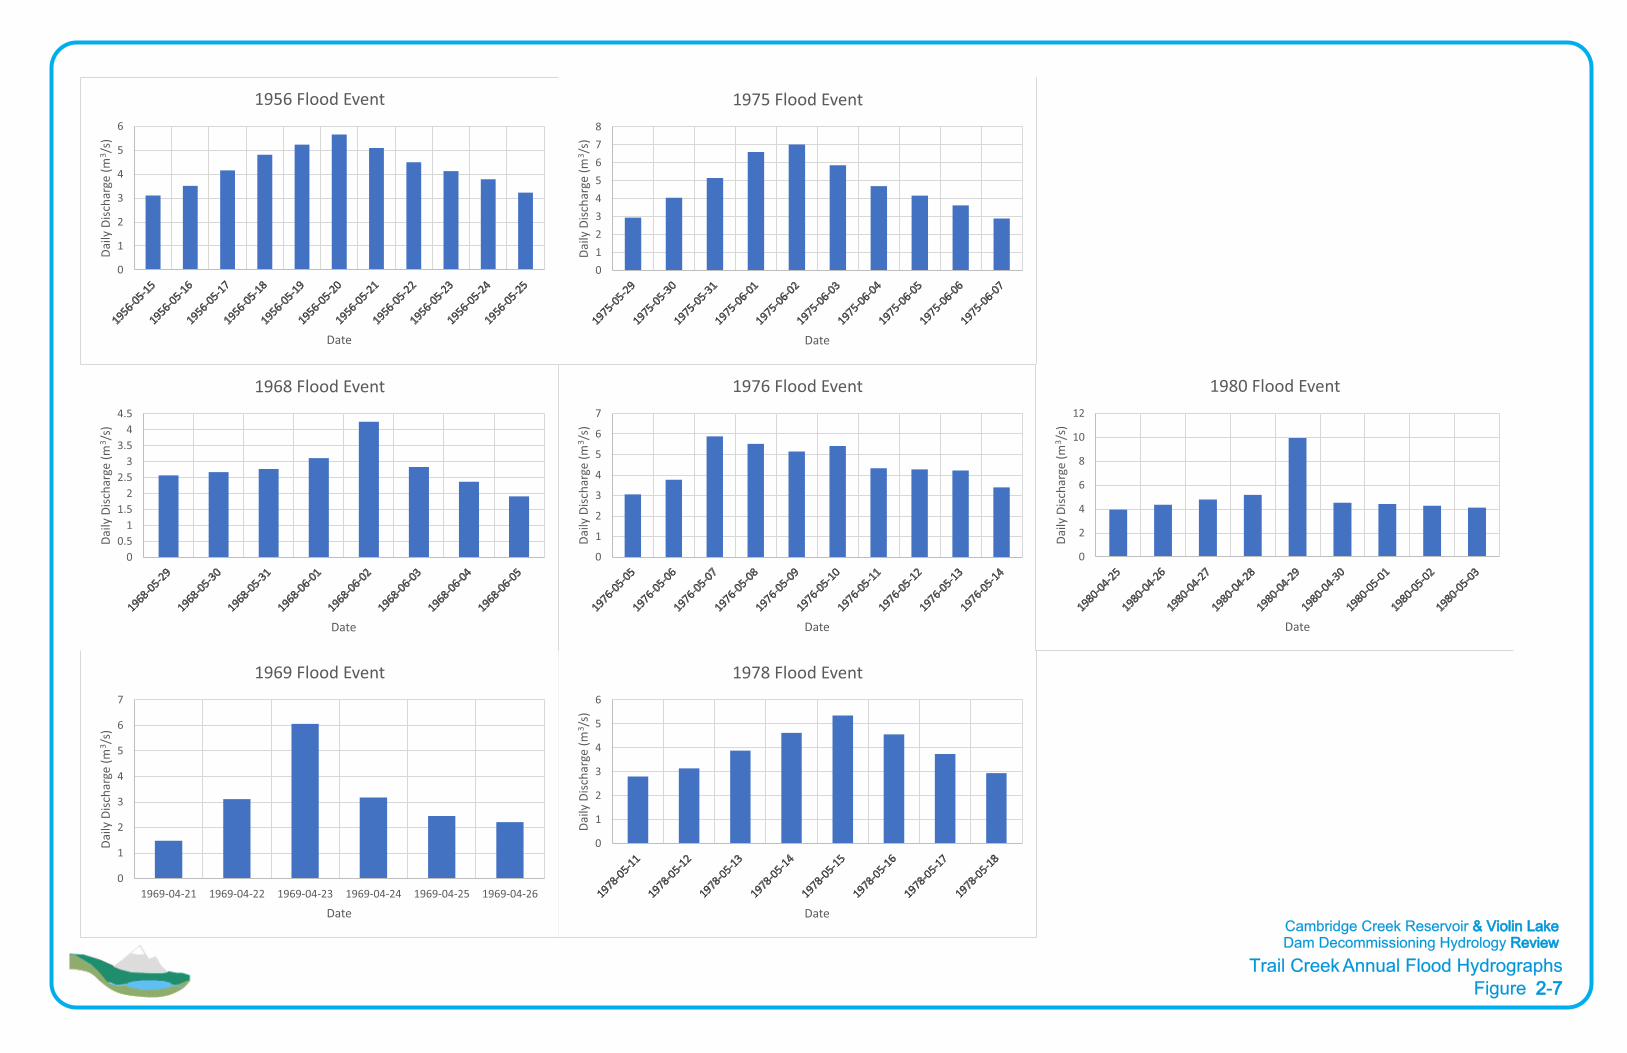
The individual flood hydrographs over a several day period were extracted for each of the selected years and are shown on Figure 2-7. Again the plots demonstrate that the flood hydrographs can extend for many days.
Selection of a suitable flood hydrograph shape has considered these factors: • A single hydrologic event rather than multiple such as the 1976 flood. • An event with a relatively large flood response from the initial
discharge; the 1969 flood rose to approximately 6 from an initial rate of about 1.5 for a ratio of 4 times.
o The 1980 flood was greater in magnitude but the ratio of initial discharge rate to flood was only 2.5. Other flood events had a smaller ratio between flood peak and initial discharge.
The 1976 flood hydrograph was selected as being representative of a flood event from a single climate event and can be used to derive the representative shape of the design flood hydrographs.
The seven (7) day flood hydrograph of average daily discharges must be divided into smaller time increments to accurately evaluate the operation of the reservoir and spillway. The regional analysis provided the instantaneous discharge and average daily discharges provided the volumes for each day of the selected flood event. The daily discharges were then discritized into hourly dates over the seven day period while maintining the daily volumes of discharge for each day. The daily and hourly hydrographs are shown on Figure 2-8.
The resulting hydrograph with hourly values can then be factored up and down to represent the floods for various return period. These derived hydrographs can then be used in evaluating the operation of the reservoir and spillway during the specified flood events.
The Guidelines also requires routing a five (5) day low flow period through the reservoir to establish the effect of removal. The minimum five day discharges recorded on Trail Creek occurred in the last few days of september in 1975. The discharge was a constant 0.042 m3/s. Using an area proportional method the discharges into the Cambridge Creek Reservoir would be a constant value of 0.005 m3/s.

Figure 2-6Trail Creek Hydrographs
0
0.5
1
1.5
2
2.5
3
3.5
4
4.5
1955-03-021955-04-211955-06-101955-07-301955-09-181955-11-071955-12-271956-02-151956-04-051956-05-25
Dai
ly D
isch
arge
(m
3 /s)
Date
1955
0
1
2
3
4
5
6
1956-02-15 1956-04-05 1956-05-25 1956-07-14 1956-09-02 1956-10-22
Dai
ly D
isch
arge
(m
3/s
)
Date
1956
0
1
2
3
4
5
6
7
8
1975-02-25 1975-04-16 1975-06-05 1975-07-25 1975-09-13 1975-11-02D
aily
Dis
char
ge (
m3/s
)Date
1975
0
1
2
3
4
5
6
7
1976-02-10 1976-03-31 1976-05-20 1976-07-09 1976-08-28 1976-10-17
Dai
ly D
isch
arge
(m
3/s
)
Date
1976
0
1
2
3
4
5
6
1978-03-01 1978-04-20 1978-06-09 1978-07-29 1978-09-17 1978-11-06
m ( e g r a h c s i D y l i a D3) s /
Date
1978
0
0.5
1
1.5
2
2.5
3
3.5
1979-02-14 1979-04-05 1979-05-25 1979-07-14 1979-09-02 1979-10-22
Dai
ly D
isch
arge
(m
3/s
)
Date
1979
0
2
4
6
8
10
12
1980-03-20 1980-05-09 1980-06-28 1980-08-17 1980-10-06 1980-11-25
Dai
ly D
isch
arge
(m
3/s
)
Date
1980
0
2
4
6
8
10
12
1949-04-12 1954-10-03 1960-03-25 1965-09-15 1971-03-08 1976-08-28 1982-02-18
Dai
ly D
isch
arge
(m
3/s
)
Date
Trail Creek, 08NE088
Cambridge Creek Reservoir & Violin LakeDam Decommissioning Hydrology Review
Trail Creek Annual Flood Hydrographs Figure 2-7
Cambridge Creek Reservoir & Violin LakeDam Decommissioning Hydrology Review
0
1
2
3
4
5
6
Dai
ly D
isch
arge
(m
3/s
)
Date
1956 Flood Event
0
0.5
1
1.5
2
2.5
3
3.5
4
4.5
Dai
ly D
isch
arge
(m
3/s
)
Date
1968 Flood Event
0
1
2
3
4
5
6
7
1969-04-21 1969-04-22 1969-04-23 1969-04-24 1969-04-25 1969-04-26
Dai
ly D
isch
arge
(m
3/s
)
Date
1969 Flood Event
0
1
2
3
4
5
6
7
8
Dai
ly D
isch
arge
(m
3/s
)
Date
1975 Flood Event
0
1
2
3
4
5
6
7
Dai
ly D
isch
arge
(m
3 /s)
Date
1976 Flood Event
0
1
2
3
4
5
6
Dai
ly D
isch
arge
(m
3/s
)
Date
1978 Flood Event
0
2
4
6
8
10
12
Dai
ly D
isch
arge
(m
3/s
)
Date
1980 Flood Event

Figure 2 - 8Flood Hydrograph
Cambridge Creek Reservoir & Violin Lake Dam Decommissioning Hydrology Review

- 14 -
3. FLOOD ROUTING ANALYSIS Hydraulic routing of the designated flood hydrographs for both Cambridge Creek Reservoir and Violin Lake were routed using a storage-indication method where the solution is based on the conservation of mass. The results for both systems are described below.
3.1 Cambridge Lake Reservoir
The operation of the Cambridge Creek Dam has a significant effect on the reservoir and its ability to attenuate flood discharges and to maintain low flows. Mr. John Howes of the City of Tail has indicated that the City has not actively operated the structure since 1994. This is further supported by the cover photo of the Cambridge Reservoir Dam and Inundation Mapping, December 2018 by ECORA as reproduced in Figure 3-1.
Figure 3-1 Photo of Dam and Water Level
As can be seen the water surface is at the level of the spillway sill. Thus, any inflows will pass directly through the dam with the only storage provided by the reservoir at elevations above the spillway crest.
The Cambridge Creek Dam Records, Ministry of Environment and Climate Change provides details of the dam, spillway, and reservoir for surface areas, volumes, and spillway details. This information was used to estimate the relationship of both storage volume and discharge that were used in routing the flood through the reservoir.
The spillway structure has a crest elevation of 896.35 and is comprised of three (3) bays, each are six fee ten inches (6’–10”) wide and approximately 0.9 m in height. The storage capacity of the reservoir is also listed in the record drawings. The
- 15 -
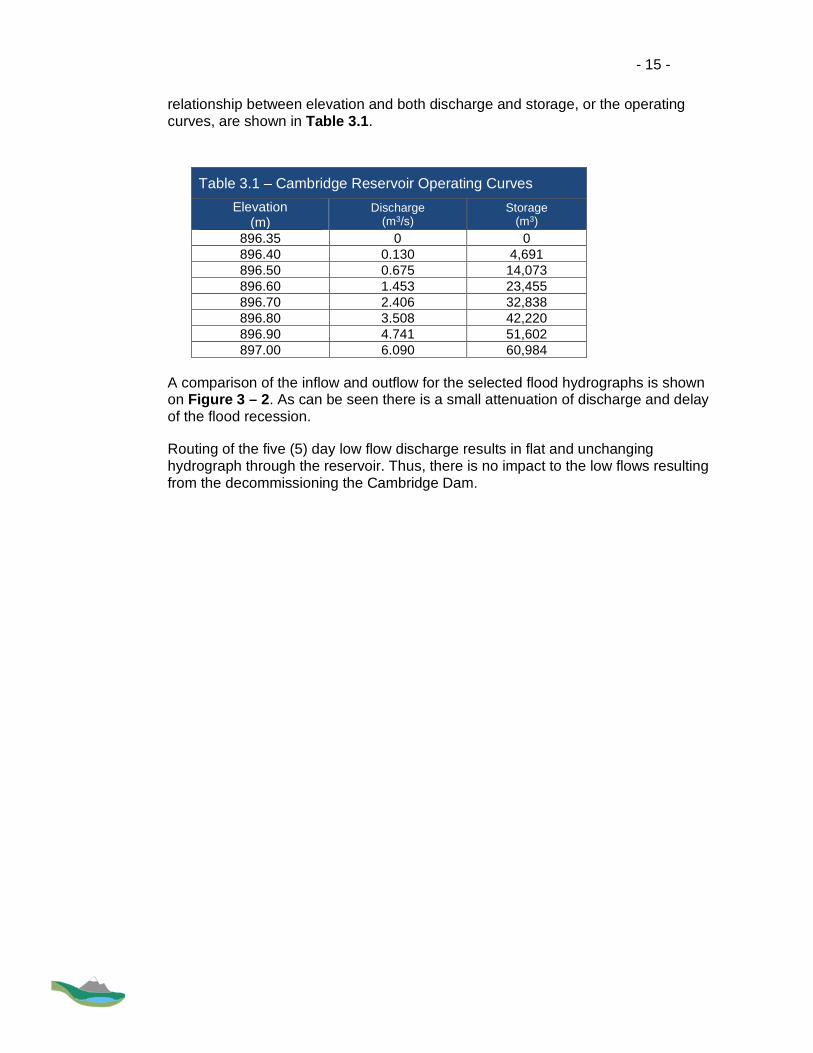
relationship between elevation and both discharge and storage, or the operating curves, are shown in Table 3.1.
Table 3.1 – Cambridge Reservoir Operating Curves Elevation
(m) Discharge
(m3/s) Storage
(m3) 896.35 0 0 896.40 0.130 4,691 896.50 0.675 14,073 896.60 1.453 23,455 896.70 2.406 32,838 896.80 3.508 42,220 896.90 4.741 51,602 897.00 6.090 60,984
A comparison of the inflow and outflow for the selected flood hydrographs is shown on Figure 3 – 2. As can be seen there is a small attenuation of discharge and delay of the flood recession.
Routing of the five (5) day low flow discharge results in flat and unchanging hydrograph through the reservoir. Thus, there is no impact to the low flows resulting from the decommissioning the Cambridge Dam.

Figure 3 - 2Cambridge Dam Flood Routing
0
0.5
1
1.5
2
2.5
0 24 48 72 96 120 144
Discharge
(m3/s)
Time (hours)
100 Year Hydrograph
"Ou�low"
"Inflow"
0
0.5
1
1.5
2
2.5
0 24 48 72 96 120 144
Discharge
(m3/s)
Time (hours)
2 Year Hydrograph
"Ou�low"
"Inflow"
Cambridge Creek Reservoir & Violin Lake Dam Decommissioning Hydrology Review
- 17 -
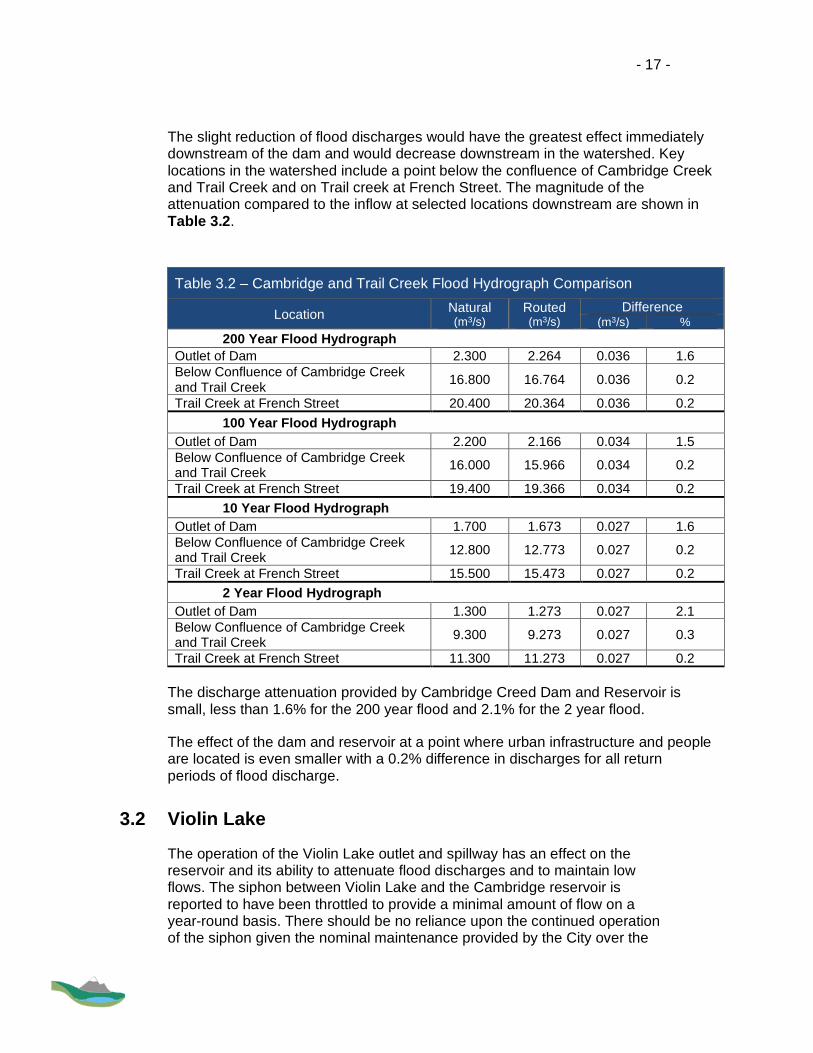
The slight reduction of flood discharges would have the greatest effect immediately downstream of the dam and would decrease downstream in the watershed. Key locations in the watershed include a point below the confluence of Cambridge Creek and Trail Creek and on Trail creek at French Street. The magnitude of the attenuation compared to the inflow at selected locations downstream are shown in Table 3.2.
Table 3.2 – Cambridge and Trail Creek Flood Hydrograph Comparison
Location Natural (m3/s)
Routed (m3/s)
Difference (m3/s) %
200 Year Flood Hydrograph Outlet of Dam 2.300 2.264 0.036 1.6 Below Confluence of Cambridge Creek and Trail Creek 16.800 16.764 0.036 0.2
Trail Creek at French Street 20.400 20.364 0.036 0.2 100 Year Flood Hydrograph Outlet of Dam 2.200 2.166 0.034 1.5 Below Confluence of Cambridge Creek and Trail Creek 16.000 15.966 0.034 0.2
Trail Creek at French Street 19.400 19.366 0.034 0.2 10 Year Flood Hydrograph Outlet of Dam 1.700 1.673 0.027 1.6 Below Confluence of Cambridge Creek and Trail Creek 12.800 12.773 0.027 0.2
Trail Creek at French Street 15.500 15.473 0.027 0.2 2 Year Flood Hydrograph Outlet of Dam 1.300 1.273 0.027 2.1 Below Confluence of Cambridge Creek and Trail Creek 9.300 9.273 0.027 0.3
Trail Creek at French Street 11.300 11.273 0.027 0.2
The discharge attenuation provided by Cambridge Creed Dam and Reservoir is small, less than 1.6% for the 200 year flood and 2.1% for the 2 year flood.
The effect of the dam and reservoir at a point where urban infrastructure and people are located is even smaller with a 0.2% difference in discharges for all return periods of flood discharge.
3.2 Violin Lake
The operation of the Violin Lake outlet and spillway has an effect on the reservoir and its ability to attenuate flood discharges and to maintain low flows. The siphon between Violin Lake and the Cambridge reservoir is reported to have been throttled to provide a minimal amount of flow on a year-round basis. There should be no reliance upon the continued operation of the siphon given the nominal maintenance provided by the City over the

- 18 -
past years. Therefore, it would be prudent to assume that the siphon inlet would become clogged over time and that the lake levels would be maintained by the spillway located on the south dam. This assumption is supported by photographs included in the ECORA report that show the water levels at the spillway crest as shown on Figure 3.3.
Figure 3-3 Violin Lake Spillway
The Violin Lake Records, Ministry of Environment and Climate Change provides details of the dam, spillway, and reservoir for surface areas, volumes, and spillway details. This information was used to estimate the relationship of both storage volume and discharge that were used in routing the flood through the reservoir.
The spillway structure has a crest elevation of 956.46 and is comprised of a single bay 2.43 wide and approximately 0.7 m in height.
The storage capacity of the Lake is also listed in the record drawings. The relationship between elevation and both discharge and storage, or the operating curves, are shown in Table 3.3.

- 19 -
Table 3.3 – Violin Lake Operating Curves Elevation
(m) Discharge
(m3/s) Storage
(m3) 956.46 0.0 0 956.50 0.036 10,329 956.60 0.234 36,233 956.70 0.526 62,252 956.80 0.886 88,387 956.90 1.305 114,637 957.00 1.774 141,002 957.10 2.289 167,483 957.16 2.619 183,427
A comparison of the Violin Lake inflow and outflow hydrographs for the selected flood hydrographs is shown on Figure 3 – 3. As can be seen there is an attenuation of discharge and delay of the flood recession. As can be seen the greatest attenuation of 28% occurs for the 1 in 2 year flood at the spillway of Violin Lake.
Routing of the five (5) day low flow discharge results in flat and unchanging hydrograph through the reservoir. Thus, there is no impact to the low flows as a result of decommissioning the Violin Lake Dam.

Figure 3 - 4Violin Lake Flood Routing
0
0.2
0.4
0.6
0.8
1
1.2
0 24 48 72 96 120 144
Dis
char
ge (
m3/s
)
Time (hours)
200 Year Hydrograph
Ou�low
Inflow
0
0.2
0.4
0.6
0.8
1
1.2
0 24 48 72 96 120 144D
isch
arge
(m
3/s
)
Time (hours)
100 Year Hydrograph
"Ou�low"
"Inflow"
0
0.5
1
1.5
2
2.5
0 24 48 72 96 120 144
Dis
char
ge (
m3/s
)
Time (hours)
10 Year Hydrograph
"Ou�low"
"Inflow"
0
0.5
1
1.5
2
2.5
0 24 48 72 96 120 144
Dis
char
ge (
m3/s
)
Time (hours)
2 Year Hydrograph
"Ou�low"
"Inflow"
Cambridge Creek Reservoir & Violin Lake Dam Decommissioning Hydrology Review

- 21 -
Attenuation, or reduction, of flood discharges would be greatest immediately downstream of the dam and would decrease downstream along Goodeve Creek.
The other key location in the watershed would be the crossing of the international border between British Columbia and Washington in the United States. The magnitude of the attenuation compared to the inflow and at the key locations along Goodeve Creek are shown in Table 3.2.
Table 3.4 – Violin Lake Flood Hydrograph Comparison
Location Natural (m3/s)
Routed (m3/s)
Difference (m3/s) %
200 Year Flood Hydrograph Outlet of Lake 1.08 0.85 0.25 21.3 At Canada – US Border 6.18 5.93 0.25 4.0 At Mitchell Road 13.52 13.27 0.25 1.8 At confluence with Columbia River 14.79 14.54 0.25 1.7 100 Year Flood Hydrograph Outlet of Lake 1.03 0.79 0.24 23.3 At Canada – US Border 5.89 5.65 0.24 4.1 At Mitchell Road 12.89 12.65 0.24 1.9 At confluence with Columbia River 14.10 13.86 0.24 1.7 10 Year Flood Hydrograph Outlet of Lake 0.82 0.62 0.20 24.4 At Canada – US Border 4.71 4.51 0.20 4.2 At Mitchell Road 10.31 10.11 0.20 1.9 At confluence with Columbia River 11.27 11.07 0.20 1.8 2 Year Flood Hydrograph Outlet of Lake 0.60 0.43 0.17 28.3 At Canada – US Border 3.44 3.27 0.17 4.9 At Mitchell Road 7.52 7.35 0.17 2.3 At confluence with Columbia River 8.23 8.06 0.17 2.1
At the Canada – US border the floods would only be reduced by from 4 to 5 percent. The relative reduction of the flood discharges further downstream at Mitchell Road and the at the confluence of the Columbia River are smaller; in the range of 2%.
Another consideration of increasing flood discharges in the downstream reaches would be the increase in the risk to people and property. Goodeve Creek flows south from Violin Lake for 3.5 km to the Canada – US Border and then an additional 5.0 km to Mitchell Road then a further 2.6 km to the Columbia River. In the downstream watershed there are only two home sites located near the Creek. The houses are located 90 m and 92 m away from the channel near Mitchell Road as shown on Figure 3-5.
Given the distances and anticipated reduction in the proportion of attenuation of the flood discharges we can expect that there would be no increase in the flood risks downstream of Violin Lake resulting from the decommissioning of the dam.

Figure 3 - 5Goodeve Creek
SCALE0 1 2 km
Cambridge Creek Reservoir & Violin Lake Dam Decommissioning Hydrology Review
Violin Lake
South Dam
Canada
United States
Goodeve
Cre
ek
Small Dam
Residence90 m from channel
Residence92 m from channel
Columbia River
British Columbia
Washington
Channel Length2.6 km
Channel Length 3.5 km
Mitchell Road
Channel Length 5.0 km

- 23 -
4. RECOMMENDATIONS The BC Regulation and Guidelines considers potential impacts to the flood discharges that might arise as a result of removing the dam and associated reservoir. The potential impacts may include:
- Increased flood discharges resulting from the flow attenuation offered by the reservoir
- Increased floodplain depths and extents if the flood discharges are increased.
The normal next step in the evaluation process would be to establish the floodplain location and elevations below the dam though the areas at risk to establish the impact of the dam decommissioning.
In this case the increases in flood discharge that result from dam decommissioning are very small and would result in a minimal increase in floodplain in all downstream areas where there is a risk to people.
I recommend that in this case the floodplain delineation be waived and that the design of the physical decommissioning be completed.
