lake lowell 1994 reservoir survey - bureau of reclamation lowel 1994... · lake lowell reservoir...
TRANSCRIPT

LAKE LOWELL1994 RESERVOIR SURVEY
rFORTHE/-
U.S. Department of the InteriorBureau of Reclamation
REPORT DOCUMENTATION PAGE QMBNoQ4-Qi85
Public reporting burden for this collection of information is estimated to average 1 hour per response, including the time for reviewing instrucitons, searching exisitng data sources, gathering andmaintaining the data needed, and completing and reviewing the collection of intormation, Send comments regarding this burden estimate or any other aspect of this collection of information,including suggestions for reducing this burden to Washington Headquarters Services, Directorate for Information Operations and Reports, 1215 Jefferson Davis Highway, Suit 1204, Arlington VA22202-4302 and to the Office of Management and Budget. Paperwork Reduction Report (0704-0188), Washington DC 20503.
1. AGENCY USE ONLY (Leave Blank) 2. REPORT DATE 3. REPORT TYPE AND DATES COVERED
September 1995 Final _____________________________4. TiTLE AND SUBTITLE 5. FUNDING NUMBERS
Lake Lowell Reservoir1994 Reservoir Survey PR6. AUTHOR(S)Ronald L. Ferrari
7. PERFORMING ORGANIZATION NAME(S) AND ADDRESS(ES) 8. PERFORMING ORGANIZATION
Bureau of Reclamation REPORT NUMBER
Technical Service CenterDenver CO 80225
9. SPONSORING/MONITORING AGENCY NAME(S) AND ADDRESS(ES) 10. SPONSORING/MONITORING
Bureau of Reclamation AGENCY REPORT NUMBER
Denver Federal Center DIBRP0 Box 25007Denver CO 80225-0007
11. SUPPLEMENTARY NOTESMicrofiche and hard copy available at the Technical Service Center, Denver, Colorado
12a. DISTRIBUTION/AVAILABILITY STATEMENT 12b. DISTRIBUTION CODE
Available from the National Technical Information Service,Operations Division, 5285 Port Royal Road, Springfield, Virginia 22161
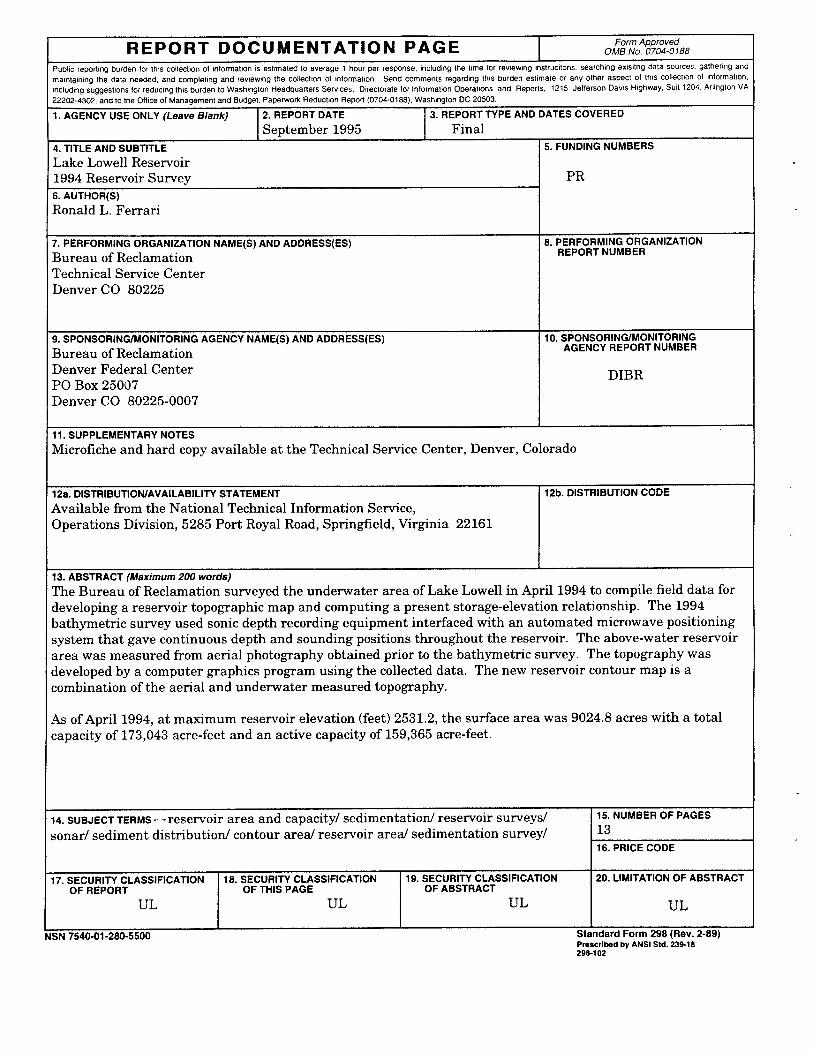
13. ABSTRACT (Maximum 200 words)The Bureau of Reclamation surveyed the underwater area of Lake Lowell in April 1994 to compile field data fordeveloping a reservoir topographic map and computing a present storage-elevation relationship. The 1994bathymetric survey used sonic depth recording equipment interfaced with an automated microwave positioningsystem that gave continuous depth and sounding positions throughout the reservoir. The above-water reservoirarea was measured from aerial photography obtained prior to the bathymetric survey. The topography wasdeveloped by a computer graphics program using the collected data. The new reservoir contour map is acombination of the aerial and underwater measured topography.
As of April 1994, at maximum reservoir elevation (feet) 2531.2, the surface area was 9024.8 acres with a totalcapacity of 173,043 acre-feet and an active capacity of 159,365 acre-feet.
14. SUBJECT TERMS- -reservoir area and capacity! sedimentationl reservoir surveys/ 15. NUMBER OF PAGES
sonar! sediment distributionl contour area! reservoir area! sedimentation survey! 1316. PRICE CODE
17. SECURITY CLASSIFICATION 18. SECURITY CLASSIFiCATION 19. SECURITY CLASSIFiCATION 20. LIMITATION OF ABSTRACTOF REPORT OF THIS PAGE OF ABSTRACT
UL UL UL UL
NSN 7540-01-280-5500 tanaara u-orm o pev. -o)Pr.scrib.d by ANSI SId. 239-18298-102

LAKE LOWELL RESERVOIR
1994 RESERVOIR SURVEY
by
Ronald L. Ferrari
Sedimentation and River Hydraulics GroupWater Resources ServicesTechnical Service Center
Denver, Colorado
September 1995
ACKNOWLEDGMENTS
The Bureau of Reclamation's Sedimentation and River HydraulicsGroup of the TSC (Technical Service Center) prepared andpublished this report. Ronald Ferrari of the TSC conducted thehydrographic survey. Personnel from the Columbia Basin ProjectOffice of the Pacific Northwest Region assisted during thehydrographic survey and performed the required land survey forthe hydrographic and aerial data collection. Special thanks toJack McFarlin and Doug Schmidt of the project office for theirfield assistance during the hydrographic survey. Ronald Ferraricompleted the data processing needed to generate the newtopographic map and area-capacity tables. Paul Weghorst of theTSC developed the procedures for generating the new topographicmaps and computing the surface areas. James Melena performedthe peer review of this documentation.
U.S. Department of the InteriorMission Statement
As the Nation's principal conservation agency, the Department of theInterior has responsibility for most of our nationally-owned public landsand natural resources. This includes fostering sound use of our landand water resources; protecting our fish, wildlife, and biologicaldiversity; preserving the environmental and cultural values of ournational parks and historical places; and providing for the enjoyment oflife through outdoor recreation. The Department assesses our energyand mineral resources and works to ensure that their development is inthe best interests of all our people by encouraging stewardship andcitizen participation in their care. The Department also has a majorresponsibility for American Indian reservation communities and forpeople who live in island territories under U.S. administration.
The information contained in this report regarding commercialproducts or firms may not be used for advertising or promotionalpurposes and is not to be construed as an endorsement of anyproduct or firm by the Bureau of Reclamation.
The information contained in this report was developed for theBureau of Reclamation; no warranty as to the accuracy,usefulness, or completeness is expressed or implied.
U

CONTENTS
....................................................................................................................................
.........................................................................................................................
.............................................................................................................................
..........................................................................................................
.......................................................................................................................................
.......................................
.......................................
........................................................................................................
...................................................................................
Page
Introduction 1Summary and conclusions 2Reservoir operations 2Survey method and equipment 3Reservoir area and capacity 3
Original capacity 31994 topography development 4Development of 1994 contour areas 51994 storage capacity 5
References 6
TableTABLES
71 Reservoir sediment data summary (page 1 of 2)81 Reservoir sediment data summary (page 2 of 2)
FIGURESFigure
91 Lake Lowell location map102 Lake Lowell Dams, plan and section113 Lake Lowell topographic map134 1994 area and capacity curves-Lake Lowell Reservoir
111

INTRODUCTION
Lake Lowell, formally Deer Flat Reservoir, is an off-stream storage facility formed by threeearth-fill dams and is one of five storage reservoirs of the Boise Project. Lake Lowell is locatedin Canyon County about 5 miles west of Nampa and 25 miles west of Boise, Idaho (fig. 1).
On March 27, 1905, the original Boise Project (now the Arrowrock Division) was authorizedunder provisions of the Reclamation Act of June 17, 1902 (32 Stat. 388). The dams of LakeLowell consist of three zoned, rolled earthfill embankments called the Upper, Middle, andLower Dams (fig. 2). A fourth embankment, called the East (Roadway) Dike, was completedin 1911. Little is known about the construction of the East Dike, the purpose of which is toprotect farmsteads on the eastern end of the reservoir during full conditions. Construction ofthe structures took place between 1906 and 1911; closure and first storage took place in 1908.At elevation 2531.2, the reservoir length is 9.2 miles and average width is 0.65 mile.
The Upper Embankment was constructed from 1906 through 1908 with modifications in 1911and 1938. The embankment has a crest length of 4,164 feet with a structural height of 74 feet,a hydraulic height of 72 feet, and a crest elevation of 2539.2 (±0.2 ft). Near the right abutment,the Deer Flat Nampa Canal has a diversion capacity of 100 cubic feet per second; near the leftabutment, the Deer Flat Caldwell Canal has a diversion capacity of 70 cubic feet per second.
The Lower Embankment was constructed from 1906 through 1908 with modifications in 1909,1913, and 1938. The embankment has a crest length of 7,270 feet with a structural height of46 feet, a hydraulic height of 44 feet, and a crest elevation of 2539.3 (±1.6 ft). The Low LineCanal at the left abutment has a diversion capacity of 1,200 cubic feet per second, and the DeerFlat North Canal at the right abutment has a capacity of 70 cubic feet per second.
The Middle Embankment, which has no diversion structures, was completed in 1911 and hasa structural height of 16 feet, a crest length of 1,262 feet, and a crest elevation of 2536.0(±0.1 ft). Lake Lowell is an off-stream reservoir with no spillway structure. The MiddleEmbankment, which was constructed with a lower crest elevation than the otherembankments, has been referred to as an emergency spillway; however, no slope protection isprovided for this purpose.
Lake Lowell receives the majority of its inflow from the Boise River, via the New York Canal,whose headworks is located about 5 miles east of Boise, Idaho, and about 40 channel milesfrom Lake Lowell. The contributing drainage area of Lake Lowell is 63.5 square miles, ofwhich 23.3 percent is reservoir area. The drainage area's elevations range from 2,501.2 feetat the reservoir to 3,010 feet at the southern boundary. Drainage runoff enters the reservoirfrom small natural streams or through the basin's extensive canal system. Water is divertedfrom the reservoir through the four separate canal outlets located at the Upper and LowerEmbankments. The total capacity of all the canal outlets is 1,440 cubic feet per second.
* The definition of terms such as "structural height," hydraulic height," etc., may be found in manuals such asReclamation's Design of Small Dams and Guide for Preparation of Standing Operating Procedures for Dams andReservoirs, or ASCE's Nomenclature for Hydraulics.

SUMMARY AND CONCLUSIONS
This report presents the 1994 results of the first extensive reservoir survey of Lake LowellReservoir by the Bureau of Reclamation since construction of the dams. The primary objectivesof the survey were to:
• gather data needed for developing new reservoir topography• compute area-capacity relationships• resolve the issue of the reservoir's elevation datum.
Standard land surveying methods were used to establish horizontal and vertical control pointsfor the aerial and hydrographic surveys. A horizontal grid system was established for bothsurveys using monumented control points located in the reservoir area. The bathymetricsurvey was run using sonic depth recording equipment interfaced with an automated surveysystem consisting of a line-of-sight microwave positioning unit capable of determining soundinglocations within the reservoir. The system continuously recorded reservoir depth andhorizontal coordinates as the survey boat was navigated along close spaced gridlines coveringthe reservoir area. The positioning system provided information to allow the boat operator tomaintain course along these gridlines. Water surface elevations measured by the landsurveyors at the time of data collection were used to convert the sonic depth measurements totrue lake bottom elevations.
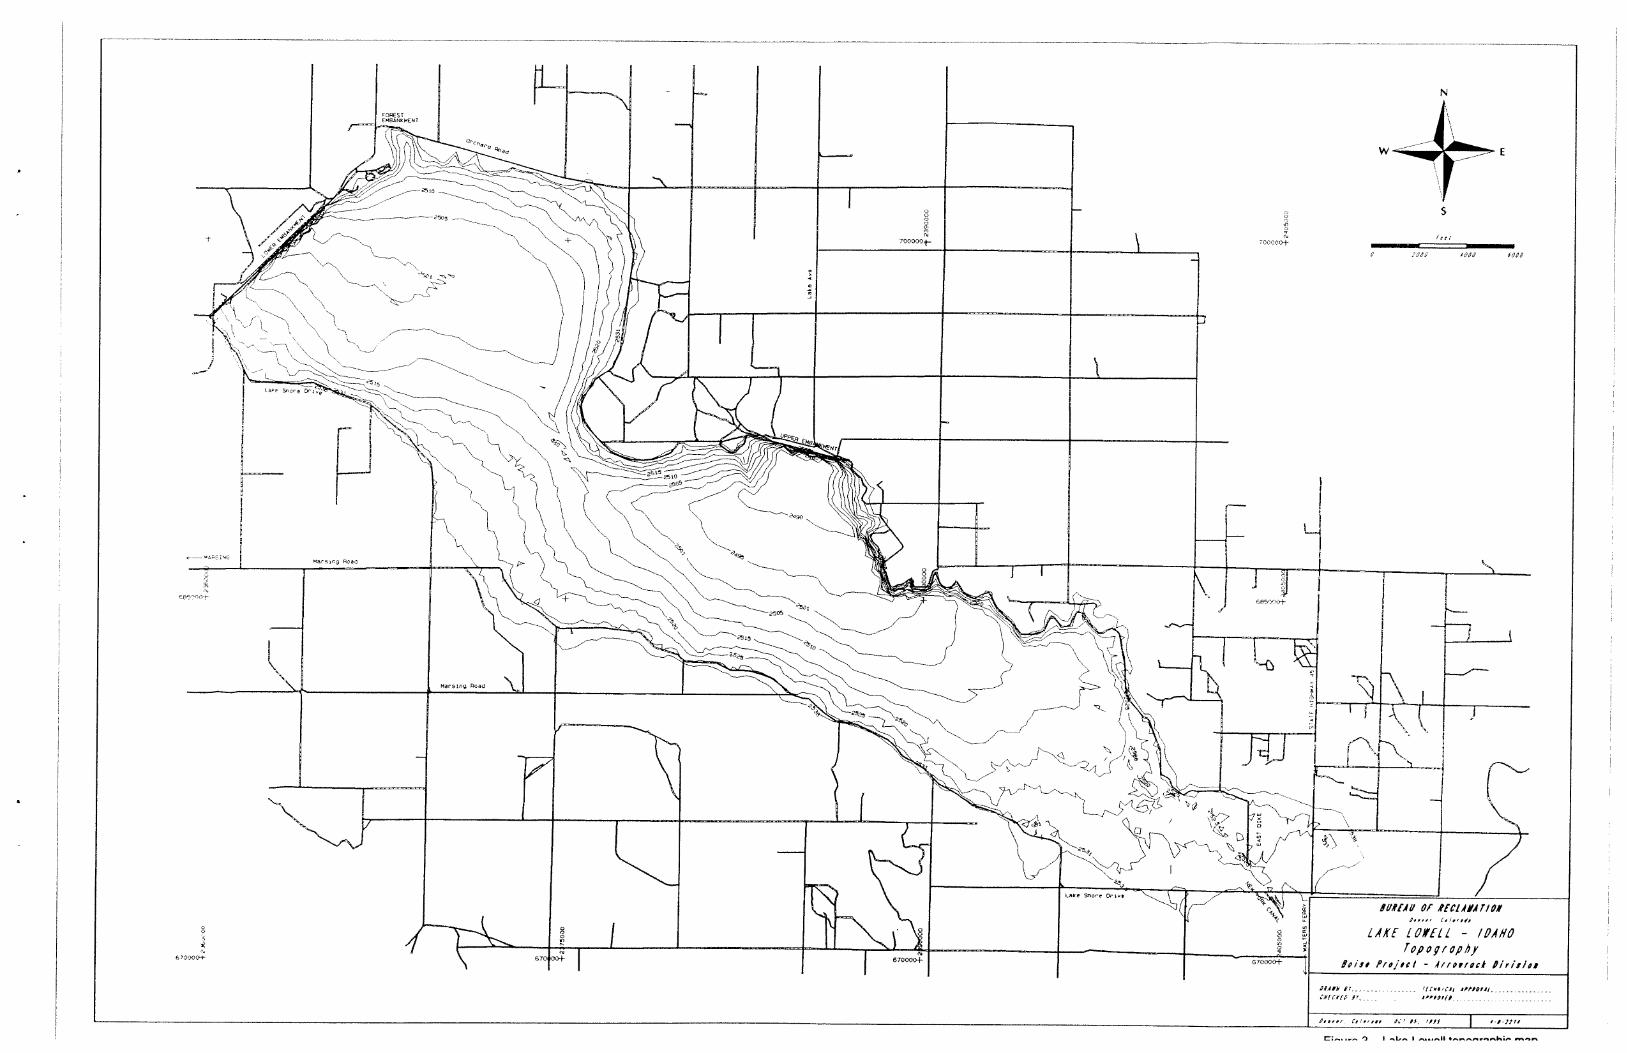
The 1994 underwater surface areas at predetermined 2-foot contour intervals were generatedby a computer graphics program using the collected data. The above-water reservoir area wasmeasured from aerial photography obtained on January 26, 1994, at approximate watersurface elevation 2515.0. The new reservoir contour map is a combination of the aerial andunderwater topography and is drawn at 5-foot contour intervals for clarity (fig. 3). The revisedarea and capacity tables were produced by a computer program that used the measuredcontour surface areas and a curve-fitting technique to compute area and capacity at prescribedelevation increments.
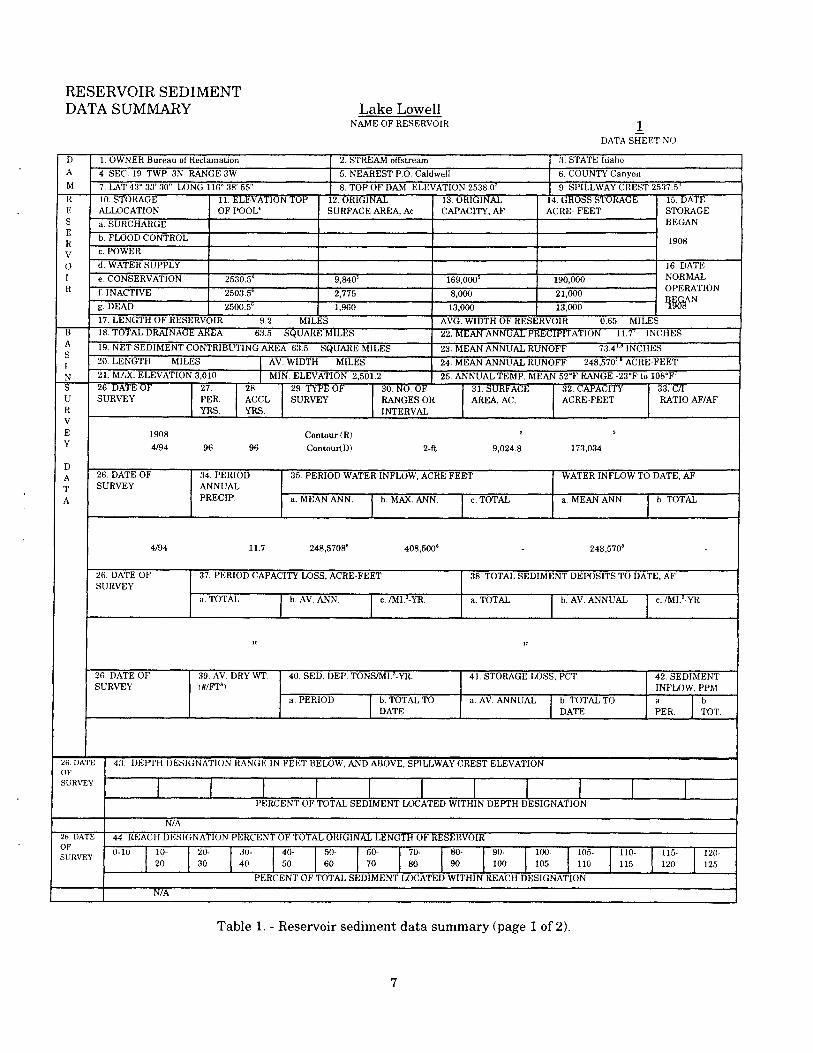
Table 1 contains a summary of results for the 1994 reservoir survey. The 1994 surveydetermined that the reservoir has a total storage capacity of 173,043 acre-feet and a surfacearea of 9024.8 acres at reservoir elevation 2531.2. No sediment calculations are given becauseof the unknown original capacity of Lake Lowell.
RESERVOIR OPERATIONS
The reservoir is primarily an irrigation facility having no flood control storage (the followingvalues are from April 1994 area-capacity tables):
• 159,365 acre-feet of active conservation storage between elevations 2504.2 and 2531.2.
• 5,823 acre-feet of inactive storage between elevations 2501.2 and 2504.2 (the inactivestorage is required for proper outlet works discharge).
• 7,855 acre-feet of dead storage below elevation 2501.2.
Lake Lowell is an off-stream reservoir that receives the majority of its inflow from Boise Riverdiversions. Available records for years 1949 through 1994 show that the average unregulated

inflow into the reservoir was 248,570 acre-feet per year. This value would compute to a meanannual runoff of 73.4 inches for the 63.5-square-mile basin. The inflow and end-of-month stagerecords in table 1 show the annual fluctuation of the reservoir. The end-of-month elevationrecords were measured from different datums, and it is assumed that they would have to beadjusted +0.7 feet to be tied to the mean sea level datum. The available records show LakeLowell operation ranging from elevation 2506.2 in 1992 to elevation 2531.2, which occurredfrom 1957 through 1959.
SURVEY METHOD AND EQUIPMENT
The Lake Lowell hydrographic survey was completed using the contour method as outlined byBlanton (1982). The procedure involved collecting adequate coordinate data for developing areliable contour map by photogrammetric and bathymetric survey methods. Standard landsurveying methods were used by Columbia Basin Project Office personnel to establishhorizontal and vertical control points for both survey methods. A horizontal grid system wasestablished for both surveys using monumented points, with state plane coordinates, locatedin the reservoir area. The vertical control for the study was based on Bureau of Reclamationvertical datum. The above water data were collected by aerial photography obtained onJanuary 26, 1994, at approximate reservoir elevation 2515.0. The field survey work for thebathymetric survey involved establishing a triangulation network around the reservoir toprovide horizontal and vertical control for all required gridlines and shore stations. No rangelines had been previously established on the lake, and it was decided not to establishpermanent range lines during this survey. Because of the size and shape of the reservoir, anyfuture survey would also employ the contour method; therefore, permanent range line endmarkers were not necessary.
The hydrographic survey was run from April 20 through 22, 1994, with the reservoir at watersurface elevation 2526.95,2526.80, and 2526.64 respectively. The bathymetric surveywas runusing sonic depth recording equipment interfaced with an automated survey system consistingof a line-of-sight microwave positioning unit capable of determining sounding locations withinthe reservoir. This positioning system transmitted line-of-sight microwave signals to fixedshore stations and converted the reply time to range distances, which were used by the systemdata logger to compute the coordinate position of the sounding boat. The survey systemcontinuously recorded reservoir depth and horizontal coordinates as the survey boat movedacross close-spaced gridlines covering the reservoir area. An average grid spacing of 400 feetwas selected to produce adequate data for developing contours of Lake Lowell. The systemgave directions to the boat operator to assist in maintaining course along the close-spacedgridlines. During each run, the depth and position data were recorded on a floppy disk forsubsequent processing by Technical Service Center personnel. A graph plotter was used in thefield to track the boat and ensure adequate coverage during the collection process. Watersurface elevations surveyed at the time of collection were used to convert the sonic depthmeasurements to true lake bottom elevations.
RESERVOIR AREA AND CAPACITY
Original Capacity
The original area-capacity curves for Lake Lowell reported the total capacity as 190,000 acre-feet with a surface area of 9,840 acres at a reservoir elevation of 2530.5. The original capacitycurves (drawing number 4-100-215) note that the dead storage was 13,000 acre-feet but give
no additional information. The drawing also notes that the capacity curve represents visualcapacity. These values do not compare very well with the 1994 measured surface areas andcomputed capacity values, which questions the accuracy of the original data. A plot of theoriginal area data versus the 1994 measured areas showed near mirror images of each other;the elevation datum difference varied between 2.2 and 2.8 feet. The difference between theoriginal and 1994 surface areas is caused by the datum difference. A comparison between theoriginal and 1994 capacity for computing sediment volumes is not possible because limitedinformation is available on the original dead portion of the reservoir.
1994 Topography Development
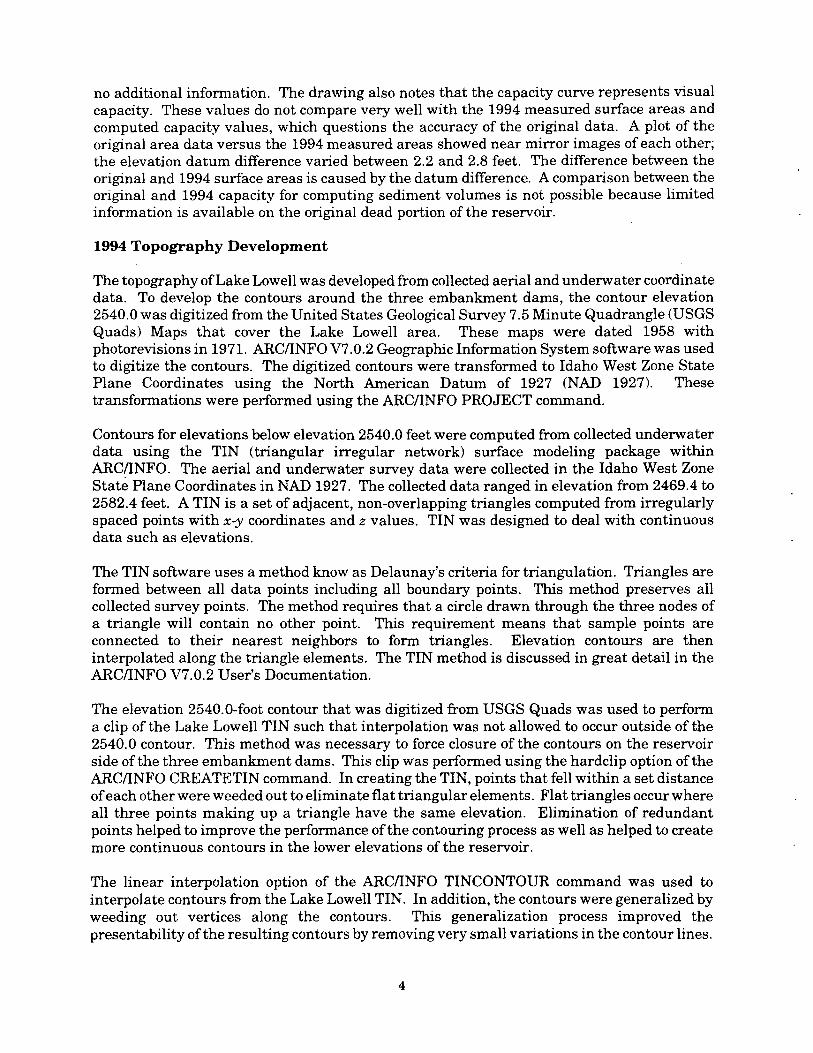
The topography of Lake Lowell was developed from collected aerial and underwater coordinatedata. To develop the contours around the three embankment dams, the contour elevation2540.0 was digitized from the United States Geological Survey 7.5 Minute Quadrangle (USGSQuads) Maps that cover the Lake Lowell area. These maps were dated 1958 withphotorevisions in 1971. ARC/INFO V7.0.2 Geographic Information System software was usedto digitize the contours. The digitized contours were transformed to Idaho West Zone StatePlane Coordinates using the North American Datum of 1927 (NAD 1927). Thesetransformations were performed using the ARC/INFO PROJECT command.
Contours for elevations below elevation 2540.0 feet were computed from collected underwaterdata using the TIN (triangular irregular network) surface modeling package withinARC/INFO. The aerial and underwater survey data were collected in the Idaho West ZoneState Plane Coordinates in NAD 1927. The collected data ranged in elevation from 2469.4 to2582.4 feet. A TIN is a set of adjacent, non-overlapping triangles computed from irregularlyspaced points with x-y coordinates and z values. TIN was designed to deal with continuousdata such as elevations.
The TIN software uses a method know as Delaunay's criteria for triangulation. Triangles areformed between all data points including all boundary points. This method preserves allcollected survey points. The method requires that a circle drawn through the three nodes ofa triangle will contain no other point. This requirement means that sample points areconnected to their nearest neighbors to form triangles. Elevation contours are theninterpolated along the triangle elements. The TIN method is discussed in great detail in theARC/INFO V7.0.2 User's Documentation.
The elevation 2540.0-foot contour that was digitized from USGS Quads was used to performa clip of the Lake Lowell TIN such that interpolation was not allowed to occur outside of the2540.0 contour. This method was necessary to force closure of the contours on the reservoirside of the three embankment dams. This clip was performed using the hardclip option of theARC/INFO CREATETIN command. In creating the TIN, points that fell within a set distanceof each other were weeded out to eliminate flat triangular elements. Flat triangles occur whereall three points making up a triangle have the same elevation. Elimination of redundantpoints helped to improve the performance of the contouring process as well as helped to createmore continuous contours in the lower elevations of the reservoir.
The linear interpolation option of the ARC/INFO TINCONTOUR command was used tointerpolate contours from the Lake Lowell TIN. In addition, the contours were generalized byweeding out vertices along the contours. This generalization process improved thepresentability of the resulting contours by removing very small variations in the contour lines.
4

This generalization had no bearing on the computation of areas and volumes for Lake Lowell.The contour topography at 5-foot intervals is presented on figure 3.
Development of 1994 Contour Areas
The 1994 contour surface areas for Lake Lowell were computed in 1-foot intervals fromelevation 2484.0 to 2540.0 using the Lake Lowell TIN discussed above. The 1994 surveymeasured the minimum reservoir as elevation 2483.6 feet. These calculations were performedusing the ARC/INFO VOLUME command. This command computes areas at user specifiedelevations directly from the TIN and takes into consideration all regions of equal elevation.
An additional clip was digitized to account for the area removed by the fourth embankmentdam, called the East (Roadway) Dike. The purpose of the East Dike is to protect farmsteadson the eastern end of the reservoir during full conditions. Using the methods described above,a second TIN was created of Lake Lowell for computing the surface areas of the reservoir only.Comparing the area computations of both TINs found that farmstead protection from the EastDike occurs when the reservoir water surface reaches elevation 2523.0 and above.
The contour surface areas of elevations 2518.0 and 2531.0 were measured from the USGSQuads of Lake Lowell to further verify the 1994 study datum adjustments and the measuredsurface areas. The measured surface areas of the two contours from the USGS Quads werewithin 0.5 percent of the computed 1994 surface areas for the same contour elevation.
1994 Storage Capacity
The storage-elevation relationships based on the measured surface areas were developed usingthe area-capacity computer program ACAP85 (Reclamation, 1985). Surface areas at 2-footcontour intervals from minimum reservoir elevation 2483.6 to maximum active conservationstorage elevation 2531.2 were used as the control parameters for computing the Lake Lowellcapacity. The program can compute an area and capacity at elevation increments of 0.01 to 1.0foot by linear interpolation between the given contour surface areas. The program begins bytesting the initial capacity equation over successive intervals to ensure that the equation fitswithin an allowable error limit, which was set at 0.000001 for Lake Lowell. This capacityequation is then used over the full range of intervals fitting within this allowable error limit.For the first interval at which the initial allowable error limit is exceeded, a new capacityequation (integrated from the basic area curve over that interval) tests the fit until it alsoexceeds the error limit. Thus, the capacity curve is defined by a series of curves, each fittinga certain region of data. Final area equations are derived by differentiating the capacityequations, which are of second order polynomial form:
y = a + ax + ax2
where:
y = capacityx = elevation above a reference basea = intercepta2 and a3 = coefficients
5

Results of the 1994 Lake Lowell area and capacity computations are listed in table 1. Aseparate set of 1994 area and capacity tables has been published for the 0.01-, 0.1-, and 1-footelevation increments (Reclamation, 1994). A description of the computations and coefficientsoutput from the ACAP85 program is included with these tables. The 1994 area-capacity curvesare plotted on figure 4. As of April 1994, at reservoir elevation 2531.2, the surface area was9,024.8 acres with a total capacity of 173,043 acre-feet and an active capacity of 159,365 acre-feet. The active capacity is considered from elevation 2504.4 to top of conservation storageelevation 2531.2. Top of dead storage elevation is 2501.2, but to obtain proper outlet worksdischarge there is inactive storage between elevations 2501.2 to 2504.4.
REFERENCES
American Society of Civil Engi neers,Nomenclature forHydraulics, ASCE Headquarters, NewYork, 1962.
Blanton, J.O. III, Procedures for Monitoring Reservoir Sedimentation: Technical Guidelinefor Bureau of Reclamation, Denver Office, Denver, CO, October 1982.
Bureau of Reclamation, Project Data, Denver Office, Denver, CO, 1981.
Bureau of Reclamation, Surface Water Branch, ACAP85 User's Manual, Denver Office,Denver, Colorado, 1985.
Bureau of Reclamation, Guide for Preparation of Standing Operating Procedures for Bureauof Reclamation Dams and Reservoirs, U.S. Government Printing Office, Denver, CO, 1987a.
Bureau of Reclamation, Design of Small Dams, U.S. Government Printing Office, Denver, CO,1987b.
Bureau of Reclamation, Technical Service Center, Lake Lowell Area and CapacityTables, Boise Project, Pacific Northwest Region, Denver, CO, May 1995.
Environmental Systems Research Institute, Inc., ARC Command References, 1992.
6
RESERVOIR SEDIMENT
Lake Lowell
1
DATA SUMMARYNAME OF RESERVOIR
DATA SHEET NO
D 1. OWNER Bureau of Reclamation 2. STREAM offatream' 3. STATE IdahoA 4. SEC. 19 TWP. 3N RANGE 3W 5. NEAREST P.O. CaIdwell 6. COUNTY CanyonM 7. LAT 43 3330 LONG 1I6 38 55' 8. TOP OF DAM ELEVATION 2538.02 9. SPILLWAY CREST 2537.5'
E10. STORAGEALLOCATION
11. ELEVATION TOPOF POOL4
12. ORIGINALSURFACE AREA, Ac
13. ORIGINALCAPACITY, AF
14. GROSS STORAGEACRE- FEET
15. DATESTORAGE
S a. SURCHARGE BEGAN
b. FLOOD CONTROL 1908c. POWER
o d.WATERSUPPLY 16. DATEI e. CONSERVATION 2530.5 9,840' 169,000 190,000 NORMAL
OPE TIONR , INACTIVE 2503.56 2,775 8,000 21,000 RA
g. DEAD 250056 1,960 13,000 13,000
17. LENGTH OF RESER'vuIR 9.2 MILES AVG. WIDTH OF RESLEVOIR 0.65 MILEa18. TOTAL DRAINAGE AREA 63.5 SQUARE MILES 22. MEAN ANNUAL PRECIPITATION 11.7' INCHES
A 19. NET SEDIMENT CONTRIBUTING AREA 63.5 SQUARE MILES 23. MEAN ANNUAL RUNOFF 73426 INCHES
20. LENGTH MILES AV. WIDTH MILES 24. MEAN ANNUAL RUNOFF 248,570' ACRE-FEET
N 21. MAX. ELEVATION 3,010 MIN. ELEVATION 2,501.2 25. ANNUAL TEMP. MEAN 524F RANGE -23F to 108F7
UR
26. DATE OFSURVEY
______________
27.PER.YRS.
28.ACCL.'IRS.
29. TYPE OFSURVEY
30. NO. OFRANGES ORINTERVAL
31. SURFACEAREA, AC.
32. CAPACITYACRE-FEET
33. C/IRATIO AF/AF
VE
D
1908 Contour (R)4/94 96 96 Contour(D) 2-ft 9,024.8 173,034
________________
AT
26. DATE OFSURVEY
34. PERIODANNUAL
35. PERIOD WATER INFLOW, ACRE FEET WATER INFLOW TO DATE, AF
A PRECIP. a. MEAN ANN. b. MAX. ANN. c. TOTAL a. MEAN ANN. b. TOTAL
4/94 11.7 248,57086 408,500 - 248,5706 -
26. DATE OFSURVEY
37. PERIOD CAPACITY LOSS, ACRE-FEET 38. TOTAL SEDIMENT DEPOSITS TO DATE, AF
a. TOTAL b. AV. ANN. c. /MI.2-YR. a. TOTAL b. AV. ANNUAL c. IMI.'-YR.
26. DATE OFSURVEY
39. AV. DRY WT.(#IFT'3)
40. SED. DEP. TONS/MI.2-YR.
____________________________
41. STORAGE LOSS, PCT. 42. SEDIMENTINFLOW, PPM
________________
a. PERIOD b. TOTAL TODATE
a. AV. ANNUAL b. TOTAL TODATE
a.PER
bTOT.
26DAiE 43. DEFTH DESIGNATION RANGE IN FEET BELOW, AND ABOVE, SPILLWAY CREST ELEVATION
SURVEY I I I I I I I I IPERCENT OF TOTAL SEDIMENT LOCATED WITHIN DEPTH DESIGNATION
N/A
21. DATE 44. REACH DESIGNATION PERCENT OF TOTAL ORIGINAL LENGTH OF RESERVOIR
SURVEY0-10 10-
2020-30
30-40
40-50
50-60
60-70
70-80
80-90
90-
100
100- 105-105 110
110-115
115-120
120-125
PERCENT OF TOTAL SE DIMENT LOCATED WITHIN REACH DESIGNATION
N/A
Table 1. - Reservoir sediment data summary (page 1 of 2).
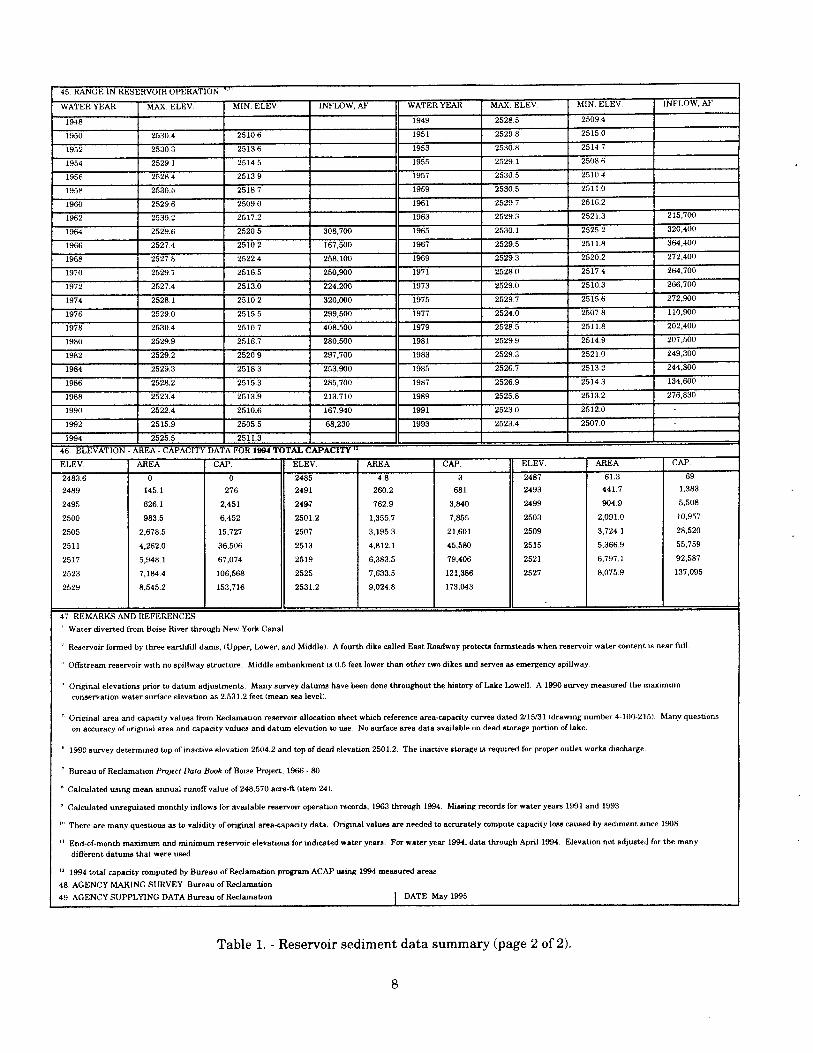
45 RANGE IN RESERVOIR OPERATION
WATER YEAR MAX ELEV. MIN. ELEV. INFLOW, AF WATER YEAR MAX. ELEV. MIN. ELEV INFLOW, AF
1948 1949 2528.5 2509.4
1950 2530.4 2510.6 1951 2529.8 25150
1952 25:30,3 2513.6 1953 2530.8 2514.7
1954 2529.1 2514.5 1955 2529.1 2508.6
1956 2528.4 2513.9 1957 2530.5 25104
1958 2530.5 2518.7 1959 2530.5 2511.0
1960 25296 2509.0 1961 2529.7 2516.2
1962 2530.2 2517.2 1963 2529.3 2521.3 215,700
1964 2529.6 2520.5 308,700 1965 2530.1 2525.2 320,400
1966 2527.4 2510.2 167,500 1967 2529.5 2511.8 364,400
1968 2527.8 2522,4 258,100 1969 2529.3 2520.2 272,400
1970 2529.7 2516.5 250,900 1971 2528.0 2517.4 264,700
1972 2527.4 2513.0 224200 1973 2529.0 2510.3 266,700
1974 2528.1 2510.2 320,000 1975 2529.7 2515.6 272.900
1976 2529.0 2515.5 299,500 1977 2524.0 2507.8 110,900
1978 2530.4 2510.7 408,500 1979 2528.5 2511.8 202,400
1980 2529.9 2516.7 280,500 1981 2529.9 2514.9 207,500
1982 2529.2 2520.9 297,700 1983 2529.3 2521.0 249,300
1984 2529.3 2518.3 253,900 1985 2526.7 2513.2 244,800
1966 2528.2 2515.3 285,700 1987 2526.9 2514.3 134,600
1988 2523.4 2513.9 213,710 1989 2525.8 2513.2 278,830
1990 2522.4 2510.6 167,940 1991 2523.0 2512.0 -
1992 2515.9 2505.5 68,230 1993 2523.4 2507.0 -
1994 2525.5 2511.3 _________________
46. ELEVATION - iulEA - CAPACITY DAs A FOR 1994 TOTAL uAPAC1TY °
ELEV. AREA CAP. ELEV. A1'tEA CAP. ELEV. AREA CAP
2483.6 0 0 2485 4.8 3 2487 61.3 69
2489 145.1 276 2491 260.2 681 2493 441.7 1,383
2495 626.1 2,451 249-7 762.9 3,840 2499 904.9 5,508
2500 983.5 6,452 2501.2 1,355.7 7,855 2503 2,091.0 10,957
2505 2,678.5 15,727 2507 3,195.3 21,601 2509 3,724.1 28,520
2511 4,262.0 36,506 2513 4,812.1 45,580 2515 5,366.9 55,759
2517 5,948.1 67,074 2519 6,383.5 79,406 2521 6,797.1 92,587
2523 7,184.4 106,568 2525 7,633.5 121,386 2527 8,075.9 137,095
2529 8,545.2 153,716 2531,2 9,024.8 173,043
47. REMARKS ANt) REFERENCES
Water diverted from Boise River through New York Canal.
Reservoir formed by three earthflll dams, (Upper, Lower, and Middle). A fourth dike called East Roadway protects farmsteads when reservoir water content is near full.
Offstream reservoir with no spillway structure. Middle embankment is 0.5 feet lower than other two dikes and serves as emergency spi llway.
Original elevations prior to datum adjustments. Many survey datums have been done throughout the history of Lake Lowell. A 1990 survey measured the maximum
conservation water surface elevation as 2,531.2 feet (mean sea level).
Original area and capacity values from Reclamation reservoir allocation sheet which reference area-capacity curves dated 7./15/31 (drawing number 4-100-215) . Many questions
on accuracy of onginal area and capacity values and datum elevation to use. No surface area date available on dead storage portion of lake.
1990 survey determined top of inactive elevation 2504.2 and top of dead elevation 2501.2. The inactive storage is required for proper outlet works discharge.
Bureau of Reclamation Project Data Book of Boise Project, 1966 - 80.
Calculated using mean annual runoff value of 248,570 acre-ft (item 24).
Calculated unregulated monthly inflows for available reservoir operation records, 1963 through 1994. Missing records for water years 1991 and 1993.
There are many questions as to validity of original area-capacity date. Original values are needed to accurately compute capacity loss caused by sediment since 1908.
End-of-month maximum and minimum reservoir elevations for indicated water years. For water year 1994, date through April 1994. Elevation not adjusted for the many
different datums that were used.
1994 total capacity computed by Bureau of Reclamation program ACAP using 1994 measured areas.
48. AGENCY MAKING SURVEY Bureau of Reclamation
49. AGENCY SUPPLYING DATA Bureau of Reclamationj
DATE May 1995
Table 1. - Reservoir sediment data summary (page 2 of 2).

McCill
/
Council t\" ( IRRIGA8LE AREA
/CASCADE
RESERVOIR
Cascde
CRANE CREE j f ( DEADWOODRESE VOIR Jy-' RESERVOIR
P7eier I/
WASH iNGTON I 7___
ç • CU/TER
P A YT E- / L ' H-- / Lownian
avette / /o1
/ GEM /
• E.ACE CAVYON DAM
:::::..4YD POWERPL
- . •€• GAGUIG SG1iOw
L.&CJC CA.NYO4T
• z;•Ern eti.L_1 :.::.--i--------.--- ( BOISE
I. .Li,c.::.:::::.:. ADA "-.
\
RIVER LUCKY PEAK* .-. RESERVOiR
::::.:.•.*..:..:..:C.:.*.::._ B()ISI*;\ (cE
LOWELL.::. .i ARROWROCK
7 RGS.. :::: RESERVOIR
IlI ç:- N1Ir' •.. ... •• : so1s RIVZR
C -)-. wo' -.-.-::•: -:-:-:•: :& - I VERSION DAM
I CANYON
-7
E LMORE
Murphy
SCALE OF MILES10 5 0 10
fo
1/
ANDERSON RANCHRESERVOIR
Home
Figure 1. - Lake Lowell location map.
9

Space intentionally left blank due to security concerns
N
/----\ /4 /---
<
- \
; \\\
E1
7OOOOO._
w E
S
7OOOO ___________________________________
:go ioao 6o'a
i±-jj- i:__
-_-__
SUlFA SEC/All T/l
LAKE LOIELL - IDAHOTopogrcpky
!,/s fire/ic! - Ai,e,,eck liris/eg
PIA#V jr 'fr.'c,i s,p,9,,/CHFCK[P 5Yfrlffr
, , '/H J
_) I I

100002535 TT
2530
2525 H-2520
2515
2510z0
I. 2505
2500
2495
2490
2485
24800 40000 80000 120000
CAPACITY (ACRE-FEET)
160000
0
200000
Figure 4. - 1994 area and capacity curves-Lake Lowell.
AREA (ACRES)
8000 6000 4000 2000

Mission
The mission of the Bureau of Reclamation is to manage, develop, andprotect water and related resources in an environmentally andeconomically sound manner in the interest of the American Public.