report name: oilseeds and products annual
TRANSCRIPT
THIS REPORT CONTAINS ASSESSMENTS OF COMMODITY AND TRADE ISSUES MADE BY USDA STAFF AND NOT NECESSARILY STATEMENTS OF OFFICIAL U.S. GOVERNMENT POLICY
Required Report: Required - Public Distribution Date: April 01,2020
Report Number: TH2020-0041
Report Name: Oilseeds and Products Annual
Country: Thailand
Post: Bangkok
Report Category: Oilseeds and Products
Prepared By: Sakchai Preechajarn, Agricultural Specialist
Approved By: Russell Nicely
Report Highlights:
The emergence of COVID-19 across the globe, including Thailand, is expected to negatively impact demand from both feed and food industries for most of 2020, leading to a reduction in consumption and importation of soybeans and soybean meal in MY2019/20 and a recovery in MY2020/21.
Executive Summary:
The emergence of COVID-19 across the globe, including Thailand, is expected to negatively impact demand from both feed and food industries for most of 2020. The consumption of animal feed and food should recover in 2021, assuming that the COVID-19 outbreak is under control by the end of 2020, which would increase the demand for soybeans and soybean meal in MY2020/21.
In line with animal feed demand, consumption and imports of soybeans in MY2020/21 are forecast to recover from the decline in MY2019/20. However, the outlook of U.S. market share in Thailand’s soybean imports in MY2020/21 might decline to 42 percent from 45 percent in MY2019/20 due to reduced competitiveness with Brazilian soybeans.
Consumption and imports of soybean meal are moving at the same pace with soybeans, namely shrinking in MY2019/20 and recovering in MY2020/21. U.S. market share in Thailand’s soybean meal imports is also eroding to only 2-3 percent in MY2019/20 and MY2020/21 from fierce competition from Brazil and Argentina.
Fish meal production is still on a downhill trend, while the domestic consumption stagnates. The amount of fish meal exports should be about 30 percent of production in 2021. Meanwhile, the imports of fish meal will be limited to 70,000 MT in 2021.
Soybean oil production is in line with soybean meal production to meet feed demand. It is estimated to drop in MY2019/20 and recover in MY2020/21. Thailand has become a regular supplier of soybean oil to other ASEAN and Asian economies. Soybean exports in MY2019/20 and MY2020/21 should be close to 90,000 MT annually.
There has been no significant change in the government’s policy on soybeans, soybean meal, fish meal, and soybean oil. While all three soybeans and its products (soybean meal and soybean oil) are subject to tariff-rate-quota (TRQ) under Thailand’s WTO commitments, Thailand has allowed unlimited imports for soybeans and soybean meal, aiming to support its large poultry and livestock sectors. Meanwhile, Thailand restricts the imports of soybean oil to protect local soybean oil processors.
Palm oil production in 2020 is estimated to decline due to a reduction in yields of fresh fruit bunches (FFB) at farms and lower oil extraction rates (OER) at palm oil crushing operations. Assuming normal weather conditions in 2020, palm oil production in 2021 is forecast to recover from the 2020 level.
The government’s policy to increase the mandatory blending rate of biodiesel in diesel fuel supplies is a key factor boosting domestic consumption of palm oil in 2020 and 2021.
SECTION I: SITUATION AND OUTLOOK
1.1. Soybeans Soybean production in Thailand has been on a downtrend over the past several years due to low yields and unattractive returns when compared to competing crops like corn and off-season rice. In addition,
cultivation of all transgenic or biotech plants, including soybeans, is prohibited in Thailand. Soybean production, however, should remain at 52,000 metric tons in MY2019/20 and MY2020/21. After a sharp increase in MY2018/19 due mainly to increased use of soybean meal and full fat soybeans in feed rations in the growing poultry and livestock sectors, the emergence of COVID-19 across the globe, including Thailand, is expected to negatively impact demand from both feed and food industries for most of 2020. As a result, total domestic consumption of soybeans in MY2019/20 is estimated to drop by 3 percent from MY2018/19’s level. Assuming that the COVID-19 outbreak is under control by the end of 2020 and the Thai economy recovers, total consumption is forecast to grow again in MY2020/21.
Due to low domestic production, Thailand depends almost entirely on imported soybeans to meet domestic demand for animal feed, vegetable oil, and food.1 Soybean imports are forecast to increase by 2 percent in MY2020/21 in line with anticipated total domestic consumption growth.
Soybeans for crushing constitute the largest portion of domestic use. Post revised soybean deliveries for crushing in MY2018/19 upward to 2.0 million metric tons (MMT) in line with actual crushing activities reported by soybean processors. Crushing activities are likely to decline by 5 percent in MY2019/20 but are forecast to grow 3 percent in MY2020/21. Currently, there are only four active soybean crushing companies in Thailand: Thai Vegetable Oil (TVO), Thanakorn Vegetable Oil Products (TVOP), Porn Amnuay Sub Vegetable Oil, and Industrial Enterprises Co., Ltd. TVOP began to operate its new plant in 2019, with a crushing capacity of 450,000 tons. Crushers at these four soybean oil companies are currently running at about half of total capacity of 4.2 MMT per annum. Industry estimates that production from TVO and TVOP altogether accounts about 90 percent of total soybean oil production. Thailand does not have any restrictions on the import of biotech soybeans for animal food or food processing. U.S. market share of Thailand’s soybean imports fluctuates depending on the availability of supply from Brazil and Argentina, and the difference in relative prices. Competitive prices are important for U.S. market opportunities in Thailand as Thai soybean oil processors believe that soybeans from Brazil and Argentina have relatively higher protein levels than those from the United States. The industry reports that importers are willing to place orders for U.S. soybeans if U.S. prices are at least U.S. $10.0 per metric ton lower than Brazilian soybeans. Industry believes that U.S. market share of Thailand’s soybean imports is estimated to drop to 45 percent in MY2019/20, from 49 percent in MY2018/19. They also predict U.S. market share will further level off to 42 percent in MY2020/21 following a sharp increase in Chinese demand for U.S. soybeans after the resolution of the U.S.-China trade war, which should cause overall U.S. prices to be less competitive than Brazilian soybeans in the next two years. In addition, several container shipments of U.S. soybeans mainly for feed use (full fat soybean making) were contaminated with insects in 2019 causing many small-to-medium feed mills to suspend their buying of U.S. soybeans in 2020.
1 Imported soybeans are typically crushed by soybean oil facilities for oil extraction and protein meal. In addition, imported soybeans can be processed as full fat soybeans by cooking or roasting the soybeans. This full fat soybean technique is increasingly being used by feed mills in Asia, especially when the costs of full fat soybeans are less expensive than the combined costs of soybean meal and oil ingredients.
Nearly all domestic soybean production is used to produce food products such as soybean milk, tofu, soybean sauces, and other soy food products. As a result, food-grade soybean imports are currently estimated at 220,000 MT. Canada and the United States are the only two foreign suppliers for this market segment. The food industry prefers domestic soybeans over imported soybeans due to their freshness and biotech-free status. However, due to growing demand and decreased domestic production, processors are increasingly relying on imported soybeans to meet their needs. Thailand’s World Trade Organization (WTO) commitments permit a soybean tariff rate quota (TRQ) of 10,922 MT, with an in-quota tariff of 20 percent and an out-of-quota tariff of 80 percent. On January 4, 2020, the Thai Cabinet approved a three-year soybean import policy to last from 2020 to 2022. In principle, the content of this policy remains unchanged from the previous Thai soybean import policy, which allowed unlimited imports at a zero percent tariff for WTO member countries. However, under the new policy, only eight trade associations2 and 16 food processing companies are eligible for these unlimited import quotas. In order to import through the trade associations’ quotas, importers must belong to one of the eight permitted trade associations. In addition, all importers are subject to purchasing domestic soybeans at prices not lower than 19.50 baht/kilogram (kg) (U.S. $590/MT) for oil-crushing, 19.75 baht/kg (U.S. $599/MT) for feed, and 21.75 baht/kg (U.S. $659/MT) for human food processing (i.e., soy sauce, tofu, soy milk, etc.). These guaranteed prices are higher than those determined for the past 3 years (2017-2019) by 2 baht/kg (U.S.$ 60/MT) across the board. In addition, the Ministry of Commerce also requires eligible associations and companies to sign a commitment to absorb all of domestic soybean production at determined prices.
The Thai Government has no clear direction for promoting soybean production in the country. On the one hand, it announces an objective to increase soybean acreage but does not have a solid plan or measures to accomplish its goal. On the other hand, the government recently reduced the annual budget for agricultural research centers, affecting researchers developing new high-yield varieties, including soybeans.
1.2. Oil Meal An Overview of Feed Demand in Thailand The outbreak of African Swine Fever (ASF) across Asia has not seriously affected swine production in Thailand thus far. Several small pig farms lacking good farm biosecurity practices decided to reduce or suspend their production in 2019 and 2020. Meanwhile, large pig farms with strong biosecurity practices have enjoyed higher demand for exporting live pigs and pork products to other Asian countries, including China, Hong Kong, Japan, Cambodia, Laos, and Myanmar. Overall, Thai swine farming is profitable for almost a year now from higher domestic hog prices. However, the emergence of COVID-19 is causing concerns about its impact on demand for meat and meat products in both Thailand and international markets for most of 2020. Thailand’s economy is struggling because of the lack of tourism, which has caused increased unemployment in the tourism and several service sectors. As for the poultry industry, there is some concern that export demand for Thai chicken meat and
2 The eight permitted trade associations are the Soybean Oil and Rice Bran Oil Association, the Thai Feed Mill Association, the Feedstuff Users Promotion Association, the Thai Livestock Association, the Association of Agricultural Trade with Neighboring Countries, the Association of Agricultural Trade and Processing Industries, Food Processors Association, and Thai Beverage Association.
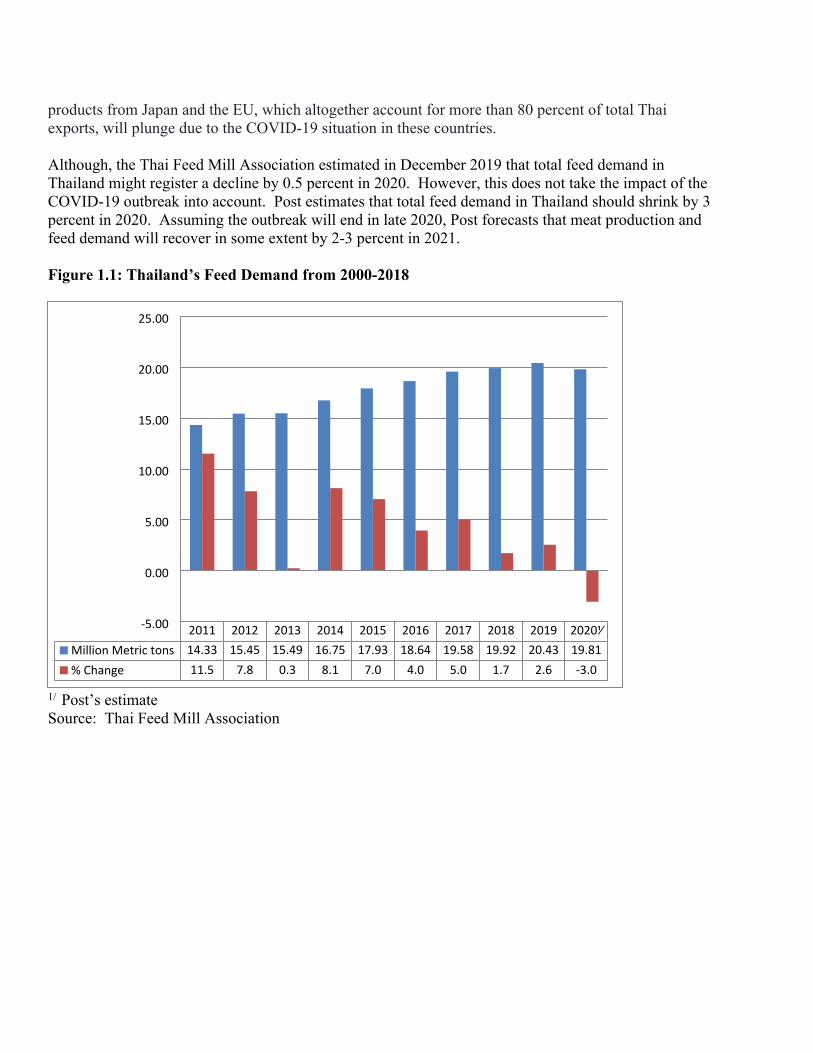
products from Japan and the EU, which altogether account for more than 80 percent of total Thai exports, will plunge due to the COVID-19 situation in these countries. Although, the Thai Feed Mill Association estimated in December 2019 that total feed demand in Thailand might register a decline by 0.5 percent in 2020. However, this does not take the impact of the COVID-19 outbreak into account. Post estimates that total feed demand in Thailand should shrink by 3 percent in 2020. Assuming the outbreak will end in late 2020, Post forecasts that meat production and feed demand will recover in some extent by 2-3 percent in 2021.
Figure 1.1: Thailand’s Feed Demand from 2000-2018
1/ Post’s estimateSource: Thai Feed Mill Association
2011 2012 2013 2014 2015 2016 2017 2018 2019 2020⅟Million Metric tons 14.33 15.45 15.49 16.75 17.93 18.64 19.58 19.92 20.43 19.81% Change 11.5 7.8 0.3 8.1 7.0 4.0 5.0 1.7 2.6 -3.0
-5.00
0.00
5.00
10.00
15.00
20.00
25.00
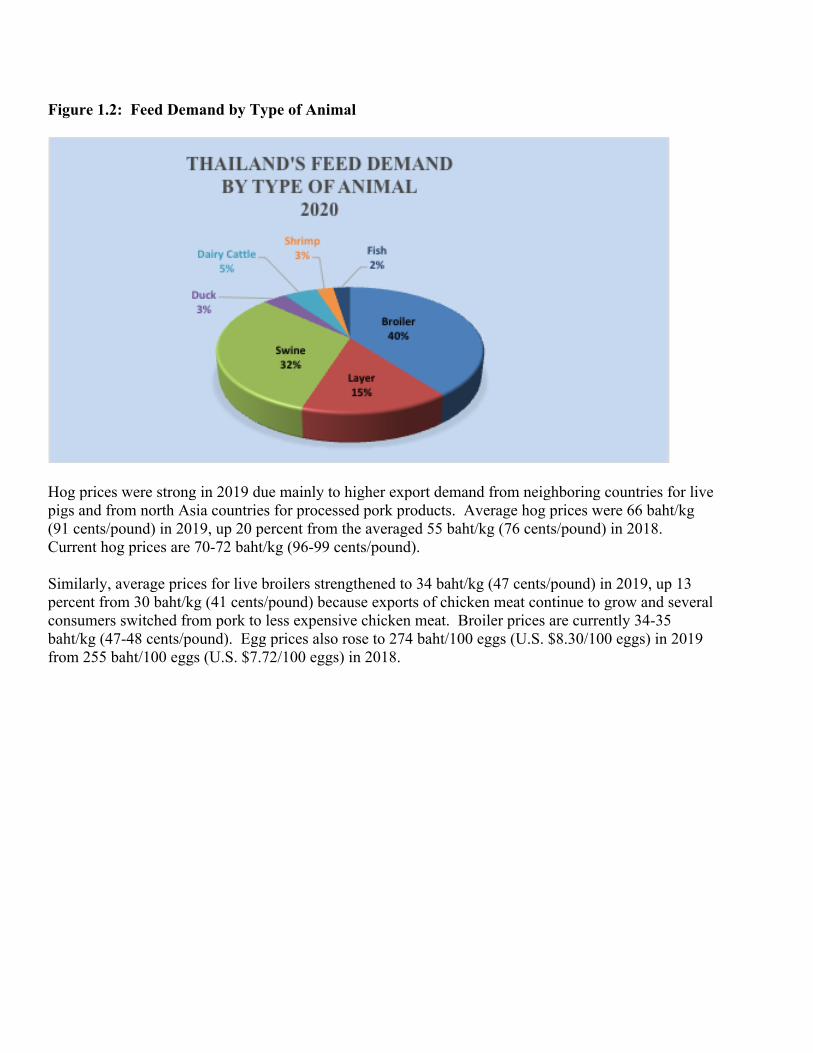
Figure 1.2: Feed Demand by Type of Animal
Hog prices were strong in 2019 due mainly to higher export demand from neighboring countries for live pigs and from north Asia countries for processed pork products. Average hog prices were 66 baht/kg (91 cents/pound) in 2019, up 20 percent from the averaged 55 baht/kg (76 cents/pound) in 2018. Current hog prices are 70-72 baht/kg (96-99 cents/pound).
Similarly, average prices for live broilers strengthened to 34 baht/kg (47 cents/pound) in 2019, up 13 percent from 30 baht/kg (41 cents/pound) because exports of chicken meat continue to grow and several consumers switched from pork to less expensive chicken meat. Broiler prices are currently 34-35 baht/kg (47-48 cents/pound). Egg prices also rose to 274 baht/100 eggs (U.S. $8.30/100 eggs) in 2019 from 255 baht/100 eggs (U.S. $7.72/100 eggs) in 2018.
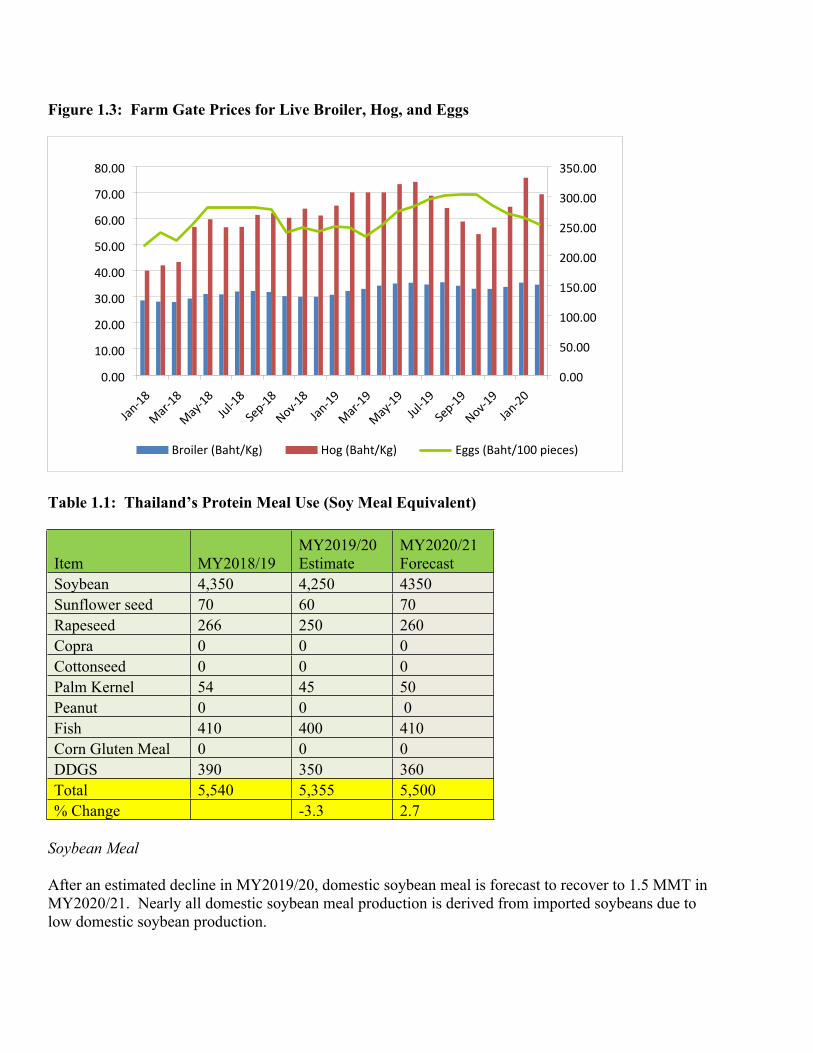
Figure 1.3: Farm Gate Prices for Live Broiler, Hog, and Eggs
Table 1.1: Thailand’s Protein Meal Use (Soy Meal Equivalent)
Item MY2018/19MY2019/20 Estimate
MY2020/21 Forecast
Soybean 4,350 4,250 4350Sunflower seed 70 60 70Rapeseed 266 250 260Copra 0 0 0Cottonseed 0 0 0Palm Kernel 54 45 50Peanut 0 0 0Fish 410 400 410Corn Gluten Meal 0 0 0DDGS 390 350 360Total 5,540 5,355 5,500% Change -3.3 2.7
Soybean Meal After an estimated decline in MY2019/20, domestic soybean meal is forecast to recover to 1.5 MMT in MY2020/21. Nearly all domestic soybean meal production is derived from imported soybeans due to low domestic soybean production.
0.00
10.00
20.00
30.00
40.00
50.00
60.00
70.00
80.00
0.00
50.00
100.00
150.00
200.00
250.00
300.00
350.00
Jan-18
Mar-18
May-18
Jul-18
Sep-18
Nov-18
Jan-19
Mar-19
May-19
Jul-19
Sep-19
Nov-19
Jan-20
Broiler (Baht/Kg) Hog (Baht/Kg) Eggs (Baht/100 pieces)
Soybean meal, whether domestically produced or imported, is mainly utilized for animal feed with a small portion being used for soybean sauce and curd production. Like soybean meal production, domestic consumption of soybean meal is estimated to drop in MY 2019/20 and is then forecast to recover to 4.35 MMT in MY2020/21, which is the same amount as MY2018/19’s level. In general, feed mills prefer locally produced soybean meal to imported soybean meal due to greater freshness and quality, and have historically been willing to pay a 1-2 percent premium for locally produced supplies. However, market dynamics, particularly the ability of small-to-medium sized feed mills to reduce their import costs through pooled purchases of soybean meal transported by Panamax vessels, has reduced the premium for domestic soybean meal.
Prices for soybean meal in MY2019/20 and MY2020/21, whether domestically produced or imported, are likely to be relatively competitive to other substitute feed ingredients (i.e., DDGS, rapeseed meal, sunflower seed meal, fish meal, and feed wheat). Prices for both imported soybean meal and domestically produced soybean meal declined in 2019 in line with weaker global prices for soybean meal. Average prices for imported soybean meal dropped to 12.63 baht/kg (US$ 383/M) in 2019 from 13.85 baht/kg (U.S.$ 420/MY) in 2018. Average prices for domestically produced soybean meal also softened to 13.70 baht/kg (U.S.$ 415/MT) in 2019 from 15.53 baht/kg (U.S.$ 471/MT) in 2018. The demand for soybean meal will experience the same up-and-down pattern for imports of soybeans in MY2019/20 and MY2020/21. After an estimated decline in MY2019/20, the imports are forecast to recover to 2.9 MMT, which is close to the MY2018/19’s level. Thailand’s major soybean meal suppliers are Brazil, Argentina, India, and the United States. Trade sources believe that U.S. market share in Thailand’s soybean meal imports will further drop to 2-3 percent in MY2019/20 and MY2020/21, as compared with 6 percent in MY2018/19 and 15 percent in MY2017/18. The reduction of market share is mainly due to a lack of price competitiveness with soybean meal from Brazil. In addition, most feed mills believe that soybean meal from Brazil and Argentina has higher protein levels than soybean meal from the United States.
Thailand began exporting soybean meal in MY2016/17. Exports of soybean meal increased tremendously from 2 TMT to 50 TMT in both MY2017/18 and MY2018/19. Exports are estimated to drop to 40 TMT in MY2019/20 and are forecast to recover to 50 TMT in MY2020/21. Major buyers for Thai soybean meal include Cambodia, Laos, and Myanmar. According to Thailand’s WTO commitments, Thailand’s soybean meal imports are subject to a 230,559 MT TRQ with a 20 percent in-quota tariff rate and a 119 percent out-of-quota tariff rate. In December 2017, the Cabinet approved unlimited in-quota imports of soybean meal for three years (2018-2020). The in-quota tariff remains unchanged at 2 percent. The Thai government limits soybean meal import permits to just 11 trade associations;3 including the livestock and poultry trade associations, the animal feed associations, and the food processing associations. Currently, the Ministry of Commerce requires eligible soybean importers to purchase locally produced soybean meal at prices not below 14.58
3 The 11 permitted trade associations are the Federation of Dairy Cooperatives of Thailand, the Thai Livestock Association, the Thai Broiler Processing Exporters Association, the Thai Feed Mill Association, the Association of Broiler Raisers for Export, the Association of Duck Raisers for Trade and Export, the National Swine Raisers Association, the Poultry Promotion Association of Thailand, the Feedstuff Users Promotion Association, the Agricultural Produce Traders Association, and the Association of Agricultural Trade and Processing Industries.
baht/kg (U.S. $416/MT) for 2020, the same level as that in 2018. The government should approve the same import regime by the end of 2020 for another three-year window from 2021-2023.
In March 2018, the Thai Cabinet agreed for the first time in history to allow importation of soybean meal for food processing under the quota allocation basis. This policy is intended to provide Thai processors of soybean sauce and curd with sufficient raw material supplies when domestic availability is low. In May 2018, the Ministry of Commerce determined the maximum quota of soybean meal for food processing to be 230,559 MT of soybean meal per annum from 2018-2020. The Department of Foreign Trade under the Ministry of Commerce allocated actual quota of 2,099 MT to four food processors in 2018, and another quota of 1,824 MT to three food processors in 2019 as requested by these processors. In April 2016, the Thai Cabinet decided to lift a long-standing export ban on soybean meal. Though the Cabinet did not explain this policy change, trade sources report that this move was a response to a request by soybean crushers who foresee increased export opportunities to ship soybean meal to neighboring Association of South East Asian Nations (ASEAN) countries that also have growing livestock sectors. On December 25, 2018, the Ministry of Commerce allocated an export quota of 288,526 MT of soybean meal to four soybean oil crushers in the following amounts: 1) Thai Vegetable Oil Co. 184,056 MT; 2) Thanakorn Vegetable Oil Co. 90,053 MT; 3) PAS Produce Export and Silo Co. 11,691 MT; and 4) Industrial Enterprise Co. 2,726 MT. The export quotas are valid until December 31, 2019. The export quota allocation in 2020 is still pending. Fish Meal The production of fish meal depends on Surimi and canned tuna production waste and bycatch. While production from Surimi and canned tuna production waste accounts for about two-thirds of total fish meal production, the other third comes from bycatch products. Fish meal production in Thailand continues to trend downward in line with a slowdown in those seafood business and depleted fish supplies in both the Gulf of Thailand and the Andaman Sea. Production in 2021 is forecast to drop to 300,000 MT, down 7 percent from 320,000 MT in 2020.
Due to increased supplies in Peru and a lack of growth in aquaculture production, domestic fish meal prices are likely to further decrease in 2020. The current prices for domestic fishmeal are 28-30 baht/kg (U.S.$ 848-909/MT). Average prices for domestic fish meal decreased by 28 percent to 31.55 baht/kg (U.S.$ 956/MT) in 2019, as compared to 43.90 baht/kg (U.S. $1,330/MT) in 2018.
Despite an anticipation of increased shrimp production, overall livestock and poultry production situation have caused domestic consumption of fish meal to decrease to 275,000 MT. Domestic consumption is forecast to recover to 285,000 MT in 2021. In general, Thailand exports low-protein fish meal and imports high-protein fish meal. Due to lower demand from shrimp producers, Thailand’s fish meal exports in 2019 was 107,680 MT, up 2 percent from 105,922 MT in 2018. Exports are forecast at 100,000 MT for 2020 and 90,000 MT in 2020, respectively. In 2019, China remained the largest market for Thai fish meal accounting for 52 percent of total exports followed by Japan (20 percent), Vietnam (14 percent), Bangladesh (9 percent), and Taiwan (2 percent).
Imports of fish meal in 2020 and 2021 should be in a range of 60,000-70,000 MT annually. Myanmar, Vietnam, and India are major suppliers for Thailand’s imports, altogether accounting for 80 percent of total imports. From 2018-2020, an importation of high-protein fish meal (more than 60 percent protein content) is not subject to import permit requirement and limited amount of imports. Meanwhile, imports of low-protein fish meal (below 60 percent) are subject to import permit requirement. In both cases, the applied import duties are 15 percent. On the other hand, fish meal imports under the ASEAN Free Trade Area (AFTA), Thai-Australia Free Trade Area (TAFTA), Thai-New Zealand Free Trade Area (TNZFTA), ASEAN-China FTA, and ASEAN-Australia-New Zealand FTA (AANFTA), and Japan-Thailand Economic Partnership Agreement (JTEPA) are all subject to zero tariffs. 1.3. Oil Soybean Oil Soybean oil production is estimated to decrease by 3 percent in MY2019/20 and to recover by the same degree in MY2020/21 in line with the amount of soybean deliveries for crushing.
Domestic consumption of soybean oil is estimated to stabilize in MY2019/20 after its decline in MY2018/19. Soybean oil consumption should grow by 5 percent in MY2020/21. Soybean oil processors needed to lower their prices sharply for bottled soybean cooking oil to 25-32 baht/liter (U.S.$ 0.76-0.97/liter) in 2019, as compared to 32-36 baht/liter (U.S.$ 0.97-1.09/liter) in 2018, due to fierce competition from cheaper palm cooking oil in the domestic retail sector. However, the price reduction is not strong enough to prevent sales of soybean cooking oil in MY2018/19 from losing its market share to palm cooking oil. Prices for soybean cooking oil should increase in 2020 due to a likelihood of reduced competition from palm cooking oil. Exports of soybean oil in MY2019/20 and MY2020/21 should be around 90,000 MT annually. Thailand is becoming a regular supplier of soybean oil to other ASEAN and Asian economies. The top importers for Thai soybean oil in MY2018/19 were the Philippines (36 percent), Vietnam (32 percent), Indonesia (12 percent), Cambodia (8 percent), and Myanmar (6 percent). Imports of soybean oil (crude and refined) are subject to a tariff-rate-quota (TRQ) system under Thailand’s WTO commitments. Additionally, non-transparent import permit administration discourages imports, with an amount not more than 1,000 MT annually. Currently, the TRQ for soybean oil is limited to 2,281 MT and is subject to a 20 percent in-quota tariff rate, and a 146 percent out-of-quota tariff rate.
Palm Oil
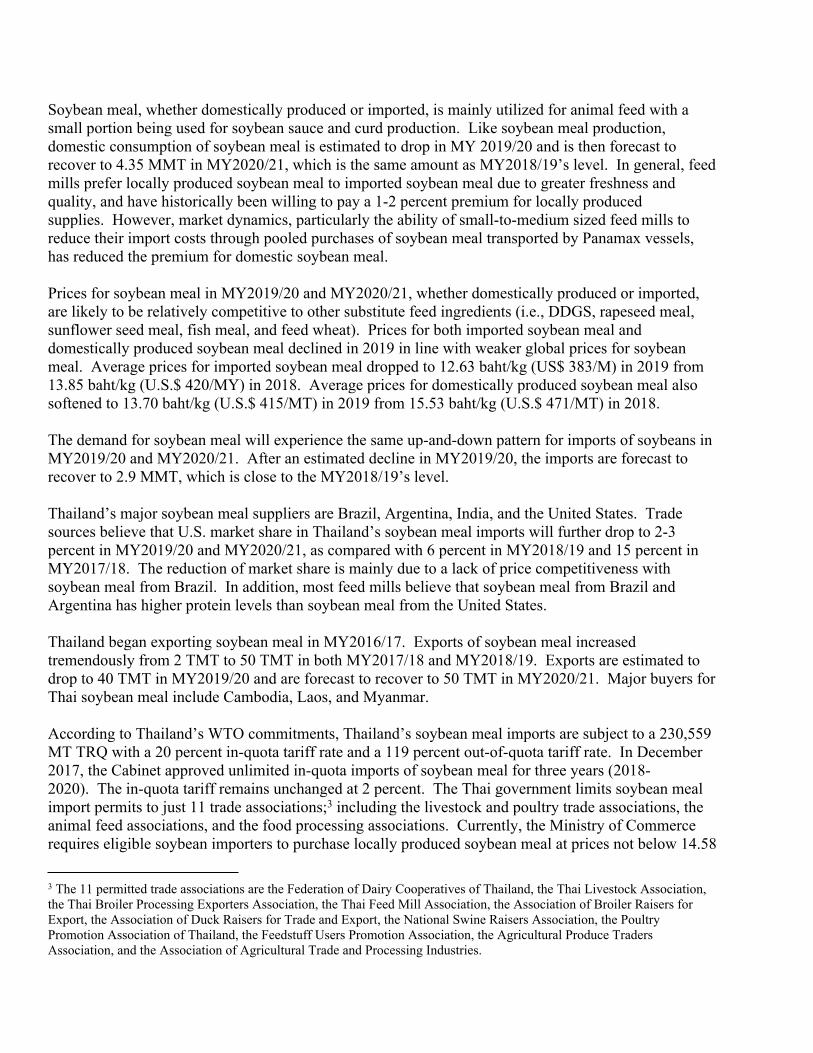
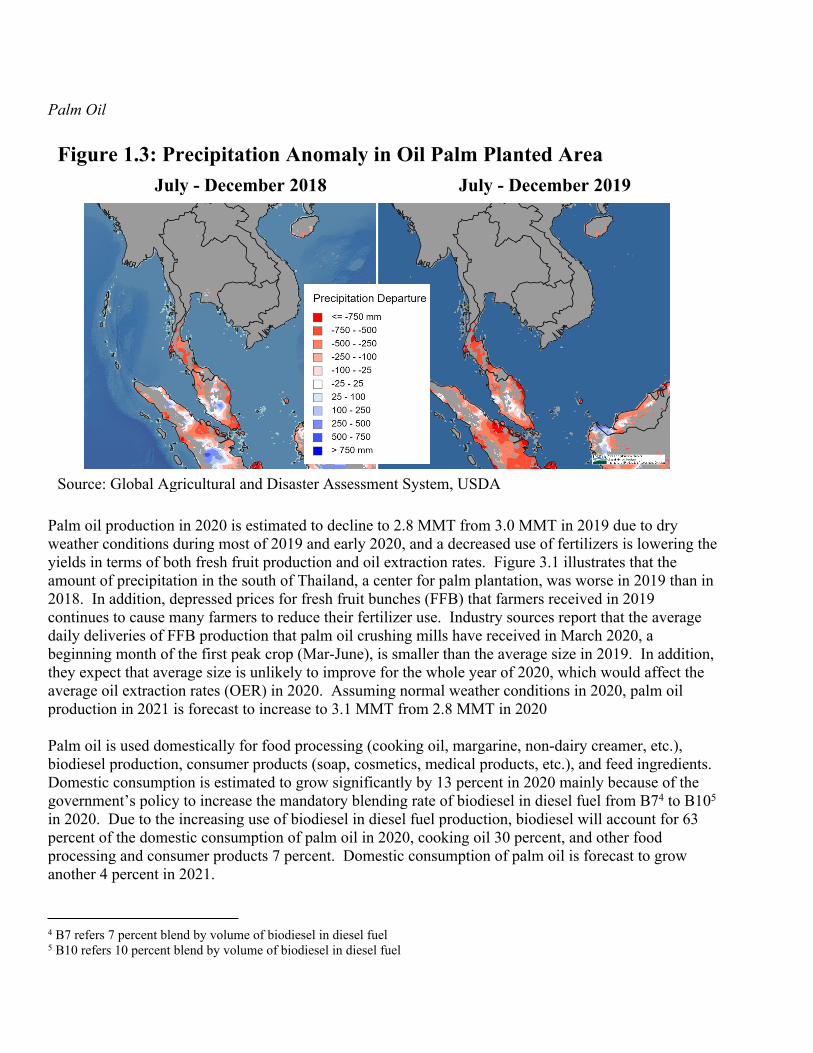
Palm oil production in 2020 is estimated to decline to 2.8 MMT from 3.0 MMT in 2019 due to dry weather conditions during most of 2019 and early 2020, and a decreased use of fertilizers is lowering the yields in terms of both fresh fruit production and oil extraction rates. Figure 3.1 illustrates that the amount of precipitation in the south of Thailand, a center for palm plantation, was worse in 2019 than in 2018. In addition, depressed prices for fresh fruit bunches (FFB) that farmers received in 2019 continues to cause many farmers to reduce their fertilizer use. Industry sources report that the average daily deliveries of FFB production that palm oil crushing mills have received in March 2020, a beginning month of the first peak crop (Mar-June), is smaller than the average size in 2019. In addition, they expect that average size is unlikely to improve for the whole year of 2020, which would affect the average oil extraction rates (OER) in 2020. Assuming normal weather conditions in 2020, palm oil production in 2021 is forecast to increase to 3.1 MMT from 2.8 MMT in 2020 Palm oil is used domestically for food processing (cooking oil, margarine, non-dairy creamer, etc.), biodiesel production, consumer products (soap, cosmetics, medical products, etc.), and feed ingredients. Domestic consumption is estimated to grow significantly by 13 percent in 2020 mainly because of the government’s policy to increase the mandatory blending rate of biodiesel in diesel fuel from B74 to B105 in 2020. Due to the increasing use of biodiesel in diesel fuel production, biodiesel will account for 63 percent of the domestic consumption of palm oil in 2020, cooking oil 30 percent, and other food processing and consumer products 7 percent. Domestic consumption of palm oil is forecast to grow another 4 percent in 2021.
4 B7 refers 7 percent blend by volume of biodiesel in diesel fuel5 B10 refers 10 percent blend by volume of biodiesel in diesel fuel
Source: Global Agricultural and Disaster Assessment System, USDA
July - December 2019July - December 2018Figure 1.3: Precipitation Anomaly in Oil Palm Planted Area
A glut of crude palm oil (CPO) supplies in Thailand and other supplying countries (mainly Indonesia and Malaysia) in the first three quarters of 2019 (Jan-Sep) caused prices for fresh fruit palm and palm oil to decline sharply. FFB prices during January-September 2019 were in a low-price range of 2.80-3.30 baht/kg (39-45 cents/pound), while CPO prices in the same period were also sluggish in a range of 16.20-18.20 baht/kg (U.S.$ 491-552/MT). Prices for both FFB and CPO began to head up in October 2019 in line with increasing global prices and continue to increase sharply in January and February 2020 when the government began to implement a mandatory B10 requirement. Due to heavy losses, the Department of Internal Trade, Ministry of Commerce, reported that 30 out of 134 palm oil crushing plants suspended their crushing operations while some are looking at selling their plants.
Despite a supply surplus in Thailand, its palm oil exports in 2019 dropped dramatically by 23 percent to 268,684 MT as compared with 347,312 MT in 2018. Since increasing palm oil consumption is mainly from the biodiesel policy, palm oil exports should level off to 70,000 MT in 2020 and 50,000 MT in 2021. The Thai government protects domestic palm oil producers by allowing only the government controlled Public Warehouse Organization (PWO) to bring in imports. As a result, imports of palm oil in 2019 were only 4,509 MT. Nearly all of the imports are refined, bleached, and deodorized (RBD) crude palm oil. Post expects that imports of palm oil will be approximately 2,000 MT annually in 2020 and 2021.
In order to address low productivity and price vulnerability in the palm oil industry, the Thai government has developed several measures on market intervention, promotion of palm oil use, and imposition of new regulation to improve productivity and FFB quality. These measures include the following:
1) In November 2018, the government agreed to subsidize the Electricity Generation Authority of Thailand (EGAT) to utilize 160,000 MT of CPO for electricity generation for up to 6 months in 2019 (30,000 MT per month) to absorb surplus palm oil supplies;
2) The government increased the retail price gap between B20 and B7 to 5 baht for 3 months from December 1, 2018 to February 28, 2019;
3) In December 2018, the Government agreed to grant a direct payment of 1,500 baht/rai (U.S. $119/acre) to individual farmers with a cap of 15 rai per farmer (6 acres). This direct payment program was targeted to 150,000 households;
4) The government will proceed its strategic plan for 2018-2037 in 6 areas; i.e., production, innovation, standards of FFB and palm oil, alternative energy from palm oil, marketing, and management. For example, the strategic plan on production is to implement plantation zoning, to control acreage for palm plantation, and to improve farm productivities and fruit quality; and
5) All diesel manufacturers must begin a mandatory B10 production on January 1, 2020. B10 production must be available for sale at all gasoline stations on March 1, 2020.
SECTION II: STATISTICAL TABLES
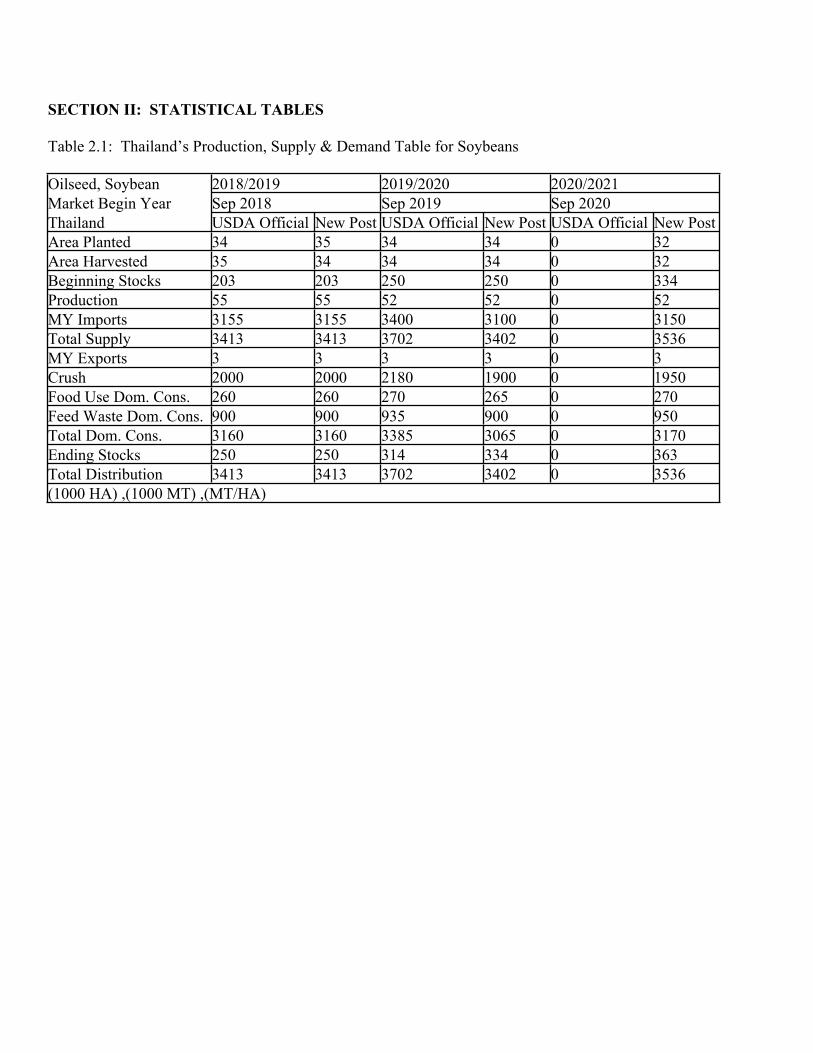
Table 2.1: Thailand’s Production, Supply & Demand Table for Soybeans
Oilseed, Soybean 2018/2019 2019/2020 2020/2021Market Begin Year Sep 2018 Sep 2019 Sep 2020Thailand USDA Official New Post USDA Official New Post USDA Official New PostArea Planted 34 35 34 34 0 32Area Harvested 35 34 34 34 0 32Beginning Stocks 203 203 250 250 0 334Production 55 55 52 52 0 52MY Imports 3155 3155 3400 3100 0 3150Total Supply 3413 3413 3702 3402 0 3536MY Exports 3 3 3 3 0 3Crush 2000 2000 2180 1900 0 1950Food Use Dom. Cons. 260 260 270 265 0 270Feed Waste Dom. Cons. 900 900 935 900 0 950Total Dom. Cons. 3160 3160 3385 3065 0 3170Ending Stocks 250 250 314 334 0 363Total Distribution 3413 3413 3702 3402 0 3536(1000 HA) ,(1000 MT) ,(MT/HA)

Table 2.2: Thailand’s Production, Supply & Demand Table for Soybean Meal
Meal, Soybean 2018/2019 2019/2020 2020/2021Market Begin Year Sep 2018 Sep 2019 Sep 2020Thailand USDA Official New Post USDA Official New Post USDA Official New PostCrush 2000 2000 2180 1900 0 1950Extr. Rate, 999.9999 0.7795 0.7795 0.7798 0.7789 0 0.7795Beginning Stocks 110 110 83 158 0 138Production 1559 1559 1700 1480 0 1520MY Imports 2889 2889 3225 2800 0 2900Total Supply 4558 4558 5008 4438 0 4558MY Exports 25 50 25 50 0 50Industrial Dom. Cons. 0 0 0 0 0 0Food Use Dom. Cons. 0 0 0 0 0 0Feed Waste Dom. Cons. 4450 4350 4700 4250 0 4350Total Dom. Cons. 4450 4350 4700 4250 0 4350Ending Stocks 83 158 283 138 0 158Total Distribution 4558 4558 5008 4438 0 4558 (1000 MT) ,(PERCENT)
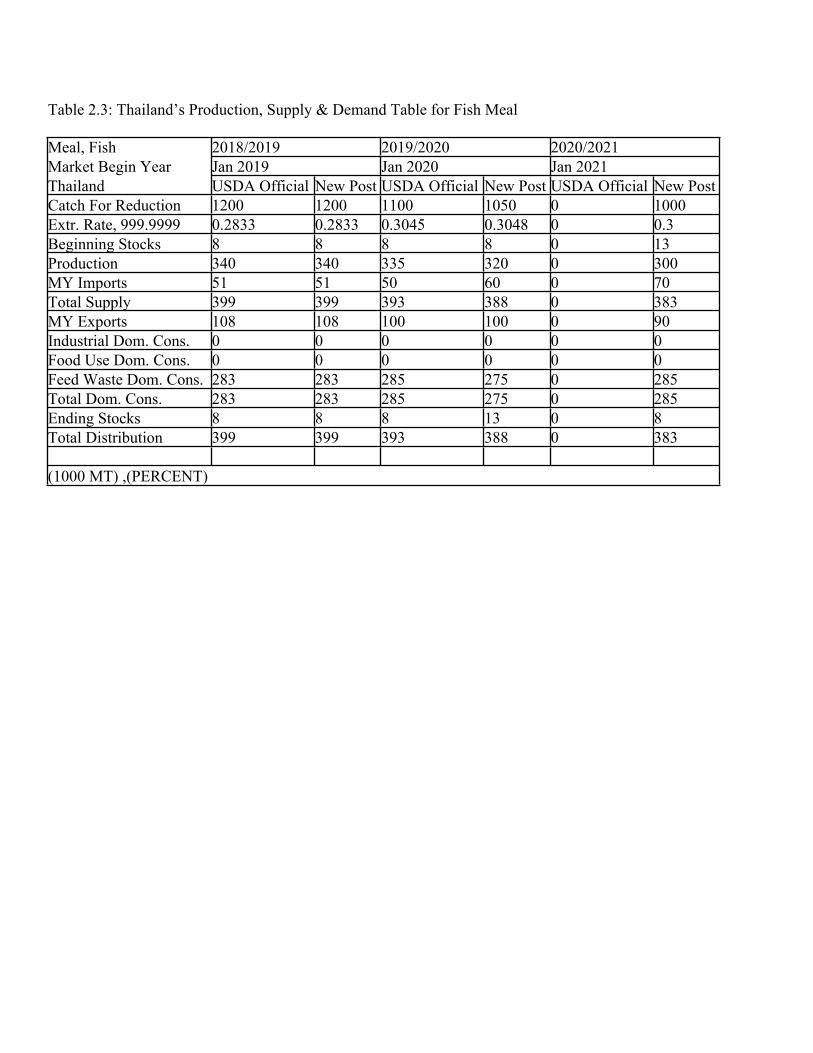
Table 2.3: Thailand’s Production, Supply & Demand Table for Fish Meal
Meal, Fish 2018/2019 2019/2020 2020/2021Market Begin Year Jan 2019 Jan 2020 Jan 2021Thailand USDA Official New Post USDA Official New Post USDA Official New PostCatch For Reduction 1200 1200 1100 1050 0 1000Extr. Rate, 999.9999 0.2833 0.2833 0.3045 0.3048 0 0.3Beginning Stocks 8 8 8 8 0 13Production 340 340 335 320 0 300MY Imports 51 51 50 60 0 70Total Supply 399 399 393 388 0 383MY Exports 108 108 100 100 0 90Industrial Dom. Cons. 0 0 0 0 0 0Food Use Dom. Cons. 0 0 0 0 0 0Feed Waste Dom. Cons. 283 283 285 275 0 285Total Dom. Cons. 283 283 285 275 0 285Ending Stocks 8 8 8 13 0 8Total Distribution 399 399 393 388 0 383 (1000 MT) ,(PERCENT)
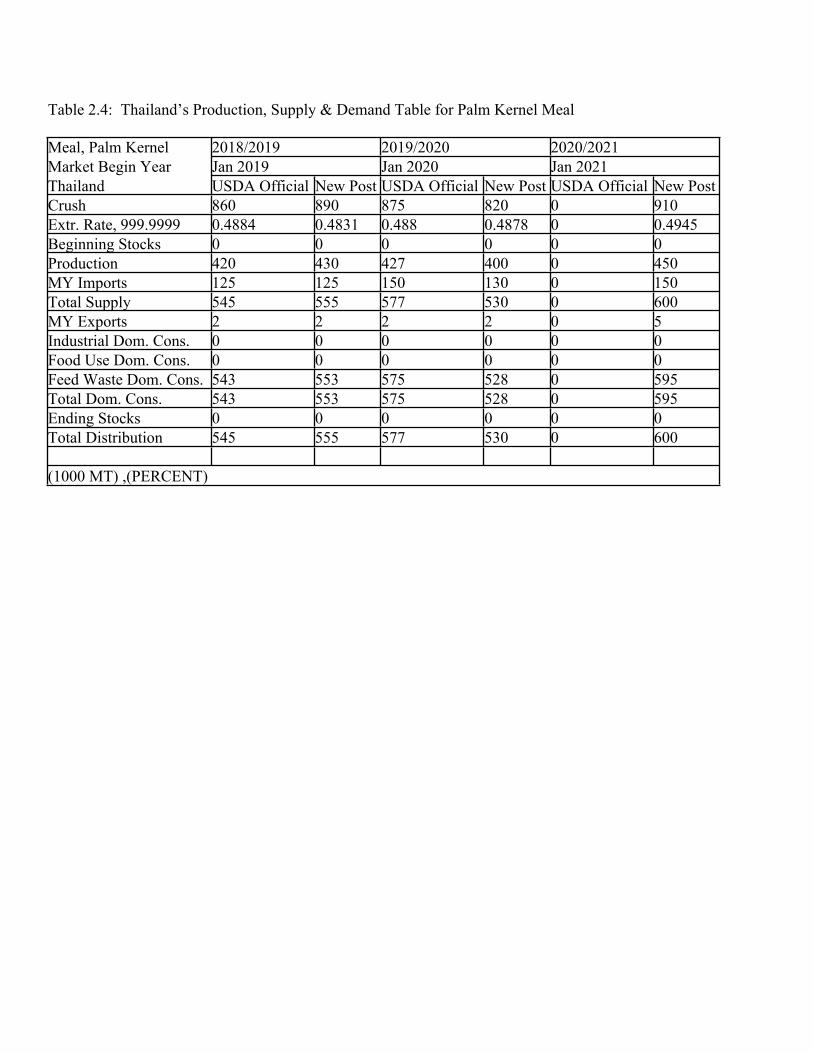
Table 2.4: Thailand’s Production, Supply & Demand Table for Palm Kernel Meal
Meal, Palm Kernel 2018/2019 2019/2020 2020/2021Market Begin Year Jan 2019 Jan 2020 Jan 2021Thailand USDA Official New Post USDA Official New Post USDA Official New PostCrush 860 890 875 820 0 910Extr. Rate, 999.9999 0.4884 0.4831 0.488 0.4878 0 0.4945Beginning Stocks 0 0 0 0 0 0Production 420 430 427 400 0 450MY Imports 125 125 150 130 0 150Total Supply 545 555 577 530 0 600MY Exports 2 2 2 2 0 5Industrial Dom. Cons. 0 0 0 0 0 0Food Use Dom. Cons. 0 0 0 0 0 0Feed Waste Dom. Cons. 543 553 575 528 0 595Total Dom. Cons. 543 553 575 528 0 595Ending Stocks 0 0 0 0 0 0Total Distribution 545 555 577 530 0 600 (1000 MT) ,(PERCENT)
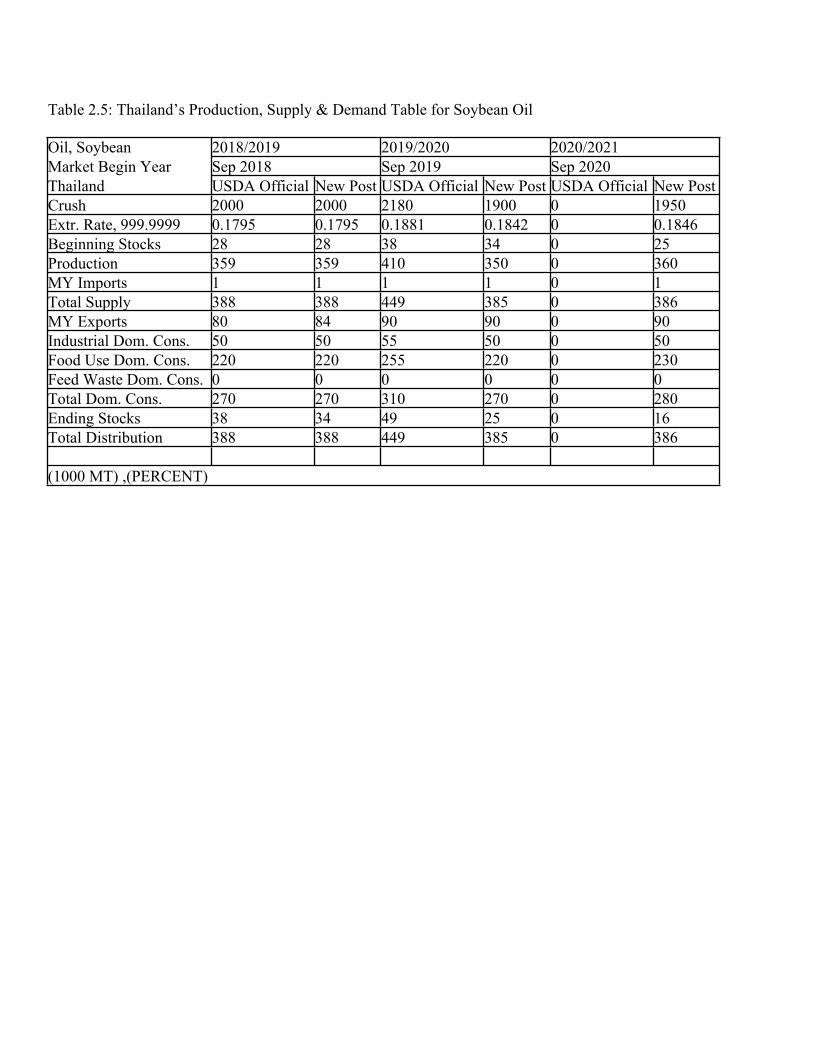
Table 2.5: Thailand’s Production, Supply & Demand Table for Soybean Oil
Oil, Soybean 2018/2019 2019/2020 2020/2021Market Begin Year Sep 2018 Sep 2019 Sep 2020Thailand USDA Official New Post USDA Official New Post USDA Official New PostCrush 2000 2000 2180 1900 0 1950Extr. Rate, 999.9999 0.1795 0.1795 0.1881 0.1842 0 0.1846Beginning Stocks 28 28 38 34 0 25Production 359 359 410 350 0 360MY Imports 1 1 1 1 0 1Total Supply 388 388 449 385 0 386MY Exports 80 84 90 90 0 90Industrial Dom. Cons. 50 50 55 50 0 50Food Use Dom. Cons. 220 220 255 220 0 230Feed Waste Dom. Cons. 0 0 0 0 0 0Total Dom. Cons. 270 270 310 270 0 280Ending Stocks 38 34 49 25 0 16Total Distribution 388 388 449 385 0 386 (1000 MT) ,(PERCENT)
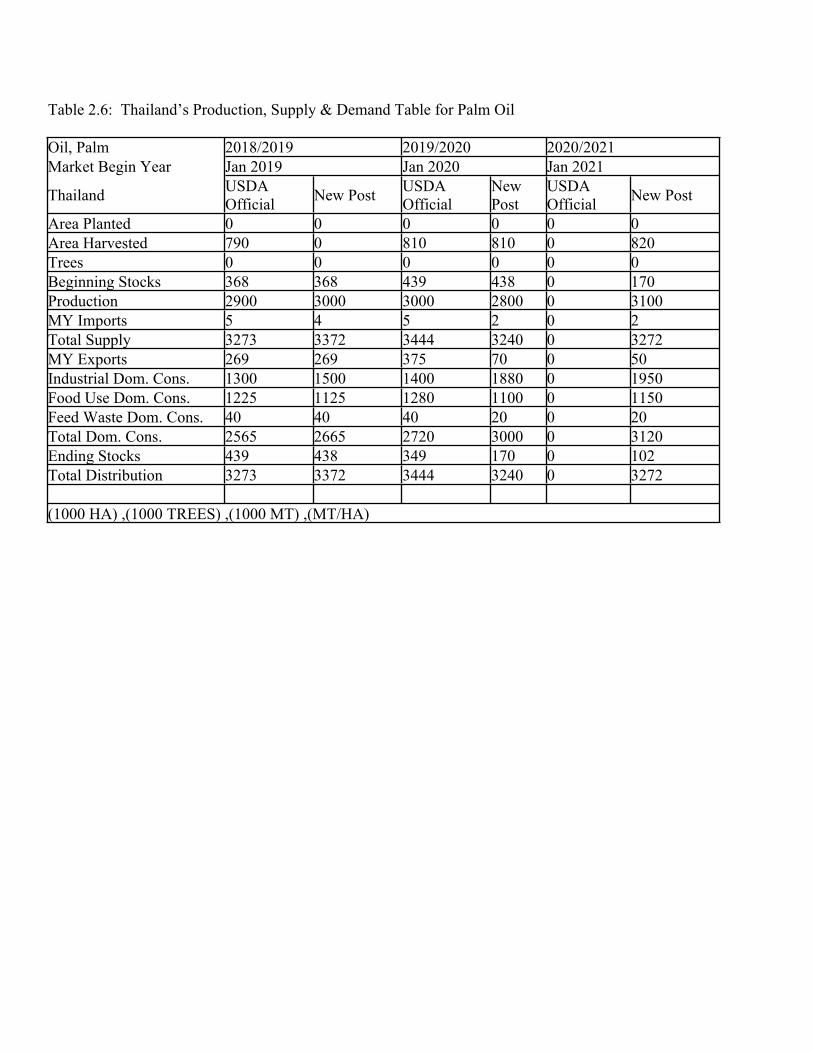
Table 2.6: Thailand’s Production, Supply & Demand Table for Palm Oil
Oil, Palm 2018/2019 2019/2020 2020/2021Market Begin Year Jan 2019 Jan 2020 Jan 2021
Thailand USDA Official New Post USDA
OfficialNew Post
USDA Official New Post
Area Planted 0 0 0 0 0 0Area Harvested 790 0 810 810 0 820Trees 0 0 0 0 0 0Beginning Stocks 368 368 439 438 0 170Production 2900 3000 3000 2800 0 3100MY Imports 5 4 5 2 0 2Total Supply 3273 3372 3444 3240 0 3272MY Exports 269 269 375 70 0 50Industrial Dom. Cons. 1300 1500 1400 1880 0 1950Food Use Dom. Cons. 1225 1125 1280 1100 0 1150Feed Waste Dom. Cons. 40 40 40 20 0 20Total Dom. Cons. 2565 2665 2720 3000 0 3120Ending Stocks 439 438 349 170 0 102Total Distribution 3273 3372 3444 3240 0 3272 (1000 HA) ,(1000 TREES) ,(1000 MT) ,(MT/HA)

Table 2.7: Thailand’s Production, Supply & Demand Table for Palm Kernel Oil
Oil, Palm Kernel 2018/2019 2019/2020 2020/2021Market Begin Year Jan 2019 Jan 2020 Jan 2021Thailand USDA Official New Post USDA Official New Post USDA Official New PostCrush 860 870 875 870 0 875Extr. Rate, 999.9999 0.4535 0.4598 0.4537 0.4368 0 0.4686Beginning Stocks 49 49 49 57 0 27Production 390 400 397 380 0 410MY Imports 10 15 15 10 0 10Total Supply 449 464 461 447 0 447MY Exports 105 102 110 100 0 90Industrial Dom. Cons. 220 220 230 230 0 235Food Use Dom. Cons. 75 85 80 90 0 95Feed Waste Dom. Cons. 0 0 0 0 0 0Total Dom. Cons. 295 305 310 320 0 330Ending Stocks 49 57 41 27 0 27Total Distribution 449 464 461 447 0 447 (1000 MT) ,(PERCENT)
End of Report.

Attachments:
No Attachments