eu-27 oilseeds and products annual despite winter kill, modest
TRANSCRIPT

THIS REPORT CONTAINS ASSESSMENTS OF COMMODITY AND TRADE ISSUES MADE BY
USDA STAFF AND NOT NECESSARILY STATEMENTS OF OFFICIAL U.S. GOVERNMENT
POLICY
Date:
GAIN Report Number:
Approved By:
Prepared By:
Report Highlights: Total EU-27 oilseeds production is expected to be stable, reaching about 29 million metric tons (MMT) in marketing year (MY) 2012/13. Despite a reduction in acreage, a modest rebound in rapeseed production is anticipated. Total EU-27 oilseeds area is forecast to decrease by 1.8 percent and is expected to total 11.4 million hectares (ha). Total use of vegetable oils is forecast to increase by 0.7 percent mainly due to increased food use and stable biofuels use. Oilseeds meals will see marginally less use in animal feed due to ample domestic supplies of wheat and corn.
Roswitha Krautgartner, Marie-Cecile Henard, Leif Erik Rehder,
Mila Boshnakova, Monica Dobrescu, Bob Flach, Jennifer
Wilson, Asa Wideback, Ornella Bettini, Marta Guerrero, Karin
Bendz, and the group of FAS oilseeds specialists in the EU
Paul Spencer
Despite Winter Kill, Modest Rebound in EU-27 Rapeseed
Production
Oilseeds and Products Annual
EU-27
E70016
4/12/2012
Required Report - public distribution

Executive Summary: Coordinator: Roswitha Krautgartner, FAS/Vienna
Consumption
The EU -27 is dependent on imported oilseeds, oilseed (protein) meals and vegetable oils. This is especially true for palm oil (no domestic production) and soybeans (very limited domestic production). In addition about 70 percent of soybean meal and more than 40 percent of sunflower meal is imported. An exception is rapeseed, which is largely produced and consumed domestically. In MY 2012/13, total oilseed meal consumption is projected to decline somewhat (down 0.3 percent). Due to ample domestic supplies of wheat and corn, fewer oilseeds meals are expected to be used in animal feed. However, increased domestic supplies of sunflower seed and good sunflower seed crush margins will lead to increased use of sunflower meal in feed rations. Due to higher availability the use of rapeseed meal is also expected to rebound. The increased feed use of sunflower meal and rapeseed meal will come at the expense of soybean meal. Total use of vegetable oils is forecast to increase by 0.7 percent due to higher demand in the food industry. Biodiesel production is the major use of rapeseed oil and is expected to remain stable in MY 2012/13. Use of sunflower oil, palm oil, animal fats and recycled oils for biofuels production is anticipated to increase whereas soybean oils will decline. The use of palm oil for biofuel is forecast to increase particularly in The Netherlands, which has a new biofuel plant in Rotterdam.
Production
Expectations for total EU-27 oilseeds production in MY 2012/13 are for fairly stable production reaching about 29 MMT. Total oilseeds crush is forecast to fall by 0.6 percent to 40.8 MMT, which is in line with flat oilseed production and an expected decrease in imports of soybeans due to lower demand for soybean meal in animal feed. A smaller crush also lowers oilseed meal and oil production, which are estimated at 25.5 MMT and 16.5 MMT respectively. Total EU-27 oilseeds area in MY 2012/13 is forecast to total 11.4 million ha, a 1.8 percent decline over last year. The decrease is mainly due to a 4 percent decrease rapeseed acreage caused by unfavorably wet planting conditions (Denmark), winterkill (mainly in Bulgaria and Hungary), and drought (Romania). Although on reduced acreage, a modest overall rebound in rapeseed production is anticipated. A marginal increase in sunflower area is projected. Following last year‟s high sunflower seed yields, more conservative expectations in MY 2012/13 point to a decrease of 4 percent in production.
Policy
Various popular social movements in the EU are finding their way into the political arena in ways that impact oilseeds policy and trade. For example, popular concern about „sustainability‟ and „food versus fuel‟ contributed to EU‟s Renewable Energy Directive (RED), which lays out specific sustainability requirements for biofuels to be eligible for financial support. These include minimum greenhouse gas (GHG) emissions reductions and economic and social criteria. The RED entered into force on June 25, 2009 and was to be transposed into national legislation by December 5, 2010. In practice it is being implemented piecemeal by EU Member States (MS).
Introduction
This report presents the outlook for oilseeds in the EU-27. The data in this report is based on the views of Foreign Agricultural Service (FAS) analysts in the EU and is not official USDA data.
This report was a group effort of the following FAS analysts:
Stefano Baldi FAS/Rome covering Italy Karin Bendz USEU/FAS Brussels covering EU policy Ornella Bettini FAS/Rome covering Greece Mila Boshnakova FAS/Sofia covering Bulgaria Bob Flach FAS/The Hague covering the Benelux Countries Marta Guerrero FAS/Madrid covering Spain and Portugal Marie-Cecile Henard FAS/Paris covering France Monica Dobrescu FAS/Bucharest covering Romania

Roswitha Krautgartner FAS/Vienna covering Austria and Slovenia Jana Mikulasova FAS/Prague covering the Czech Republic and Slovakia, Ferenc Nemes FAS/Budapest covering Hungary Leif Erik Rehder FAS/Berlin covering Germany Piotr Rucinski FAS/Warsaw covering Poland, Estonia, Latvia, and Lithuania Asa Wideback FAS/Stockholm covering Sweden, Finland, and Denmark Jennifer Wilson FAS/London covering the U.K. and Ireland
The FAS EU-27 oilseeds reporting team would like to thank Yoonhee Macke from FAS/OGA for her valuable input and support.
Abbreviations used in this report
Benelux = Belgium, the Netherlands, and Luxembourg CAP = EU common agricultural policy CY = Calendar year e = Estimate (of a value/number for the current, not yet completed, marketing year) EU-27 = European Union of 27 member states (Austria, Belgium, Bulgaria, Cyprus, Czech Republic,
Denmark, Estonia, France, Finland, Germany, Greece, Hungary, Ireland, Italy, Latvia, Lithuania, Luxembourg, Malta, Netherlands, Poland, Portugal, Romania, Slovakia, Slovenia, Spain, Sweden, United Kingdom)
f = Forecast (of a value/number for the next, not yet started, marketing year) FSW Feed, Seed, Waste Ha = Hectares GE = Genetically engineered / Genetically engineered organisms GHG = Greenhouse gas MT = Metric ton (1000 kg) MMT = Million metric tons MS = EU Member State(s) MY = Marketing year NUTS2 = Nomenclature of Units for Territorial Statistics level 2 = code for regions within a country SME = Soybean meal equivalent U.K. = United Kingdom U.A.E. = United Arabic Emirates U.S. = The United States of America
In this report "biofuel" includes only biofuels used in the transport sector. Biomass/biofuel used for electricity production or other technical uses such as lubricants or in detergents are included in "industrial use".
The marketing years used in this report are:
January - December
Copra complex
Palm Kernel complex
Palm Oil
Fish Meal
July-June
Rapeseed complex
October -September
Soybean complex
Sunflower complex
Cottonseed complex
Peanut complex

November - October
Olive Oil
Table of Contents
1. Total Oilseeds
2. Soybean Complex
3. Rapeseed Complex
4. Sunflower Complex
5. Palm Kernel Complex
6. Palm Oil
7. Peanut Complex
8. Fish Meal
9. Copra Complex
10. Cottons Seed Complex
11. Olive Oil
12. Policy
1. Total Oilseeds
Coordinator: Roswitha Krautgartner, FAS/Vienna
Total Oilseeds – Seeds
Commodity: Total Oilseeds (1000 HA / 1000 MT) Marketing Year MY 2009/10 MY 2009/10 MY 2010/11 MY 2010/11 MY 2011/12
USDA official Post New USDA official Post New Post New
Area 11,414 11,378 11,700 11,609 11,403 Beginning Stocks 2,793 2,788 2,620 2,418 2,286 Production 29,049 29,099 28,879 28,998 29,006 Extra EU27 imports 16,264 16,254 15,995 16,124 15,723 TOTAL SUPPLY 48,103 48,141 47,494 47,540 47,015 Extra EU27 exports 871 862 644 823 861 Crush 41,002 41,451 40,405 40,996 40,765 Food Use 1,064 1,051 1,094 1,077 1,082 Feed, Seed, Waste 2,546 2,359 2,605 2,358 2,356 TOTAL DOMESTIC USE 44,612 44,861 44,104 44,431 44,203 Ending Stocks 2,620 2,418 2,746 2,286 1,951 TOTAL DISTRIBUTION 48,103 48,141 47,494 47,540 47,015
Source: FAS EU-27
EU-27 Total Oilseeds Area
Total EU-27 oilseeds area in MY 2012/13 is forecast to decrease by 1.8 percent and is expected to total 11.4 million ha. The 4 percent decline rapeseed acreage is caused by unfavorably wet planting conditions (Denmark), winterkill (mainly in Bulgaria and Hungary), and drought (Romania). A marginal increase of sunflower area is projected due to re-sowing of rapeseed winterkill areas. Soybeans, which are not widely planted in the EU, are also expected to decline by 5 percent.

Note: The years refer to the calendar year in which the harvest occurs (e.g. 2010 = harvested in CY 2010, marketed in MY 2010/11) Source: FAS EU-27
EU-27 Total Oilseeds Production
Expectations for total EU-27 oilseeds production in MY 2012/13 are for stable production reaching about 29 MMT. Although on reduced acreage, a modest rebound in rapeseed production is anticipated. Last year‟s high yields for sunflower seeds are not expected again this year and a 4 percent decline is forecast.
Note: The years refer to the calendar year in which the harvest occurs (e.g. 2010 = harvested in CY 2010, marketed in MY 2010/11) Source: FAS EU-27
EU-27 Total Oilseeds Crush
Total oilseeds crush in MY 2012/13 is forecast to fall by 0.6 percent to 40.8 MMT. The lower crush is in line with slightly smaller total oilseed production and an expected decrease in imports of soybeans due to lower demand for soybean meal in animal feed.

Note: Crush for olive oil production is not included
Source: FAS EU-27
Total oilseed meals PSD
Commodity: Total Meals (1000 MT) Marketing Year MY 2009/10 MY 2009/10 MY 2010/11 MY 2010/11 MY 2011/12
USDA official Post New USDA official Post New Post New
Crush 41,002 41,451 40,405 40,996 40,765
Extraction Rate Beginning Stocks 661 886 798 1,253 1,256 Production 26,503 26,043 25,986 25,770 25,545 Extra EU27 imports 26,872 26,711 28,051 26,705 26,745 TOTAL SUPPLY 54,036 53,640 54,835 53,728 53,546 Extra EU27 exports 1,195 1,206 1,100 1,070 1,080 Industrial 701 266 796 265 266 Food Use 32 32 32 32 30 Feed, Seed, Waste 51,224 50,883 52,010 51,105 50,940 TOTAL DOMESTIC USE 52,043 51,181 52,833 51,402 51,236 Ending Stocks 798 1,253 902 1,256 1,230 TOTAL DISTRIBUTION 54,036 53,640 54,835 53,728 53,546
Source: FAS EU-27
The marginally lower crush in MY 2012/13 will cause total oilseeds meal production to go down by about 0.9 percent to 25.5 MMT. The 0.3 percent decreased supply of 53.5 MMT is the result of lower production and almost flat total imports, which are driven by declining demand in the animal feed sector. The reason for reduced feed use of oilseeds meals is ample domestic supply and increased use of wheat and corn in feed rations.
In MY 2011/12, oilseeds meal production is estimated to decline by 1 percent, a result of lower crushing due to lower oilseeds production and lower oilseeds imports compared to the previous marketing year.

Source: FAS EU-27
Source: FAS EU-27
Total Oils PSD
Commodity: Total Oils (1000 MT) Marketing Year MY 2010/11 MY 2010/11 MY 2011/12 MY 2011/12 MY 2012/13
USDA official Post New USDA official Post New Post New
Crush 40,977 41,426 40,380 40,971 40,740
Extraction Rate Beginning Stocks 2,109 2,198 1,075 1,324 1,443 Production 16,424 16,538 16,376 16,650 16,484 Extra EU27 imports 8,404 8,109 9,718 9,221 9,211 TOTAL SUPPLY 26,937 26,848 27,170 27,195 27,138 Extra EU27 exports 1,560 1,562 1,285 1,424 1,419 Industrial 11,170 2,893 11,476 3,176 3,230 Biofuels 0 8,288 0 8,230 8,240 Food Use 12,727 12,351 12,851 12,492 12,589 Feed, Seed, Waste 404 430 389 430 430 TOTAL DOMESTIC USE 24,301 23,962 24,716 24,328 24,489 Ending Stocks 1,076 1,324 1,169 1,443 1,230 TOTAL DISTRIBUTION 26,937 26,848 27,170 27,195 27,138
Source: FAS EU-27
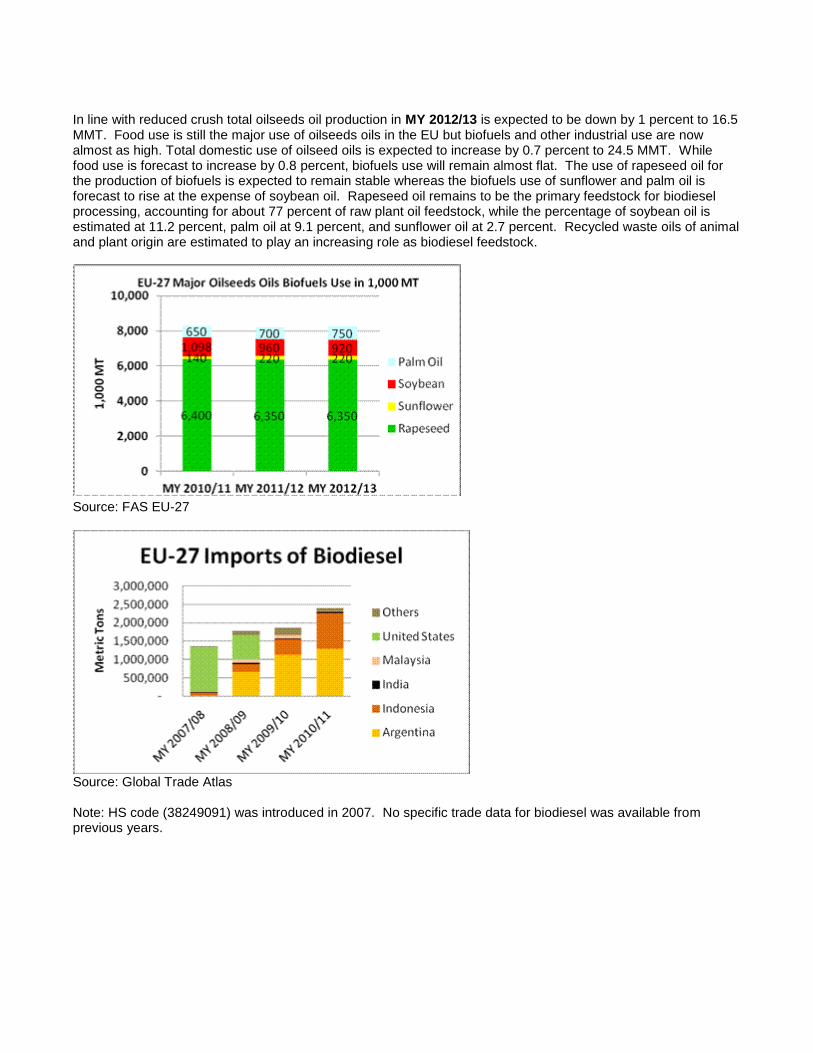
In line with reduced crush total oilseeds oil production in MY 2012/13 is expected to be down by 1 percent to 16.5 MMT. Food use is still the major use of oilseeds oils in the EU but biofuels and other industrial use are now almost as high. Total domestic use of oilseed oils is expected to increase by 0.7 percent to 24.5 MMT. While food use is forecast to increase by 0.8 percent, biofuels use will remain almost flat. The use of rapeseed oil for the production of biofuels is expected to remain stable whereas the biofuels use of sunflower and palm oil is forecast to rise at the expense of soybean oil. Rapeseed oil remains to be the primary feedstock for biodiesel processing, accounting for about 77 percent of raw plant oil feedstock, while the percentage of soybean oil is estimated at 11.2 percent, palm oil at 9.1 percent, and sunflower oil at 2.7 percent. Recycled waste oils of animal and plant origin are estimated to play an increasing role as biodiesel feedstock.
Source: FAS EU-27
Source: Global Trade Atlas
Note: HS code (38249091) was introduced in 2007. No specific trade data for biodiesel was available from previous years.

Source: FAS EU-27
2. Soybean Complex
Coordinator: Marie-Cecile Henard/FAS Paris
The European Union is a marginal producer of soybeans, while soybean meal is the dominant source of proteins in livestock, dairy, and poultry feed rations. As the EU is a leading producer of meat and dairy products in the world, imports of soybeans and soybean meal are both massive and crucial for the European feed and food industry.
Oilseed, Soybean EU-27
2010/2011 2011/2012 2012/2013
Market Year Begin: Oct 2010
Market Year Begin: Oct 2011
Market Year Begin: Oct 2012
USDA Official
New Post
USDA Official
New Post
USDA Official
New Post
Area Planted 375 371 425 420 400
Area Harvested 375 371 420 420 400
Beginning Stocks 546 546 539 302 222
Production 1,048 1,044 1,220 1,120 1,110
MY Imports 12,465 12,483 11,000 12,000 11,700
MY Imp. from U.S. 3,174 3,174 700 3,000 3,000
MY Imp. from EU 0 0 0 0 0
Total Supply 14,059 14,073 12,759 13,422 13,032
MY Exports 55 56 30 60 60
MY Exp. to EU 0 0 0 0 0
Crush 12,265 12,343 11,300 11,800 11,300
Food Use Dom. Cons.
120 145 120 140 140
Feed Waste Dom. Cons.
1,080 1,227 980 1,200 1,200
Total Dom. Cons. 13,465 13,715 12,400 13,140 12,640
Ending Stocks 539 302 329 222 332
Total Distribution 14,059 14,073 12,759 13,422 13,032
1000 HA, 1000 MT

Source: FAS EU-27
Soybeans
The EU‟s domestic soybean production stagnates at 8.5 percent of total use, and is mainly located in Italy (55 percent) and Romania (13 percent). Interestingly, Romania‟s soybean production was significantly higher prior to its accession to the EU (137,000 ha in 2006, down to 75,000 ha projected in 2012). Previously, most of Romania‟s production consisted of biotech herbicide tolerant varieties, which are allowed to be imported into the EU but not grown in the EU. As a result, Romania‟s cultivation of the more profitable biotech varieties stopped and Romania‟s planted soy acreage has not recovered.
Source: FAS EU-27
Imports account for more than 90 percent of EU-27 soybeans use and 70 percent of the EU soybean meal use. There is little year on year fluctuation. Most of the supply originates from South America. Brazil is the EU‟s leading supplier of soybeans (40-70 percent) and second largest supplier of soybean meal (40-45 percent). Argentina is the EU‟s leading supplier of soybean meal (50-55 percent). The United States is the EU‟s third leading supplier of soybeans, with 17-25 percent market share.
Source: Global Trade Atlas

MY 2012/13
Competition from South American soybean meal, and reduced demand for soybean meal in animal feed, will contribute to reductions in the EU-27 soybean imports and crush.
MY 2011/12:
Lower supplies and higher prices, partly a result of ongoing drought in South America, are forecast to reduce EU imports of soybeans almost 500,000 MT to 12 MMT. Imports of soybean meal are also forecast down by almost 500,000 MT to 21.2 MMT.
During the first three months of MY 2011/12 (October-December 2011), EU imports of soybeans declined by 10 percent from the same period of the previous year, mainly due to reduced shipments from the United States.
The largest soybean crushers in the EU are Germany (25 percent), Spain (25 percent), the Benelux (15 percent), and Italy (13 percent), with relatively stable shares.
Source: FAS EU-27
The EU soybean crush will reach 11.8 million MT in MY 2011/12. Also, the share of soybeans in the total EU crush is expected to go down from 30 percent in MY 2010/11 to 29 percent in MY 2011/12, with the loss being made up in the sunflower seed crush.
Soybean Meal
Meal, Soybean EU-27
2010/2011 2011/2012 2012/2013
Market Year Begin: Oct 2010
Market Year Begin: Oct 2011
Market Year Begin: Oct 2012
USDA Official
New Post
USDA Official
New Post
USDA Official
New Post
Crush 12,265 12,343 11,300 11,700 11,300
Extr. Rate, 999.9999 1 1 1 1 1
Beginning Stocks 496 496 557 560 518
Production 9,675 9,654 8,903 9,250 8,900
MY Imports 21,714 21,675 22,400 21,200 21,200

MY Imp. from U.S. 450 452 100 500 500
MY Imp. from EU 0 0 0 0 0
Total Supply 31,885 31,825 31,860 31,010 30,618
MY Exports 606 596 500 450 450
MY Exp. to EU 0 0 0 0 0
Industrial Dom. Cons.
10 10 10 10 10
Food Use Dom. Cons.
32 32 32 32 32
Feed Waste Dom. Cons.
30,680 30,627 30,912 30,000 29,800
Total Dom. Cons. 30,722 30,669 30,954 30,042 29,842
Ending Stocks 557 560 406 518 326
Total Distribution 31,885 31,825 31,860 31,010 30,618
1000 MT, PERCENT
The largest users of soybean meal in animal feed are also leading producers of livestock, poultry and dairy. They principally include Spain (16 percent), Germany (15 percent), France (13 percent), Italy (11 percent), and the Benelux (10 percent). Again, these shares are relatively stable.
Source: FAS EU-27
MY 2012/13:
In MY 2012/13, despite a recovery in world soybeans availability, the forecast for the EU demand for soybean meal in animal feed is for a further decline to 29.8 million MT, offset by the higher feed use of both rapeseed meal and sunflower seed meal.
MY 2011/12:
Reduced imports of soybeans and soybean meal are anticipated to result in a 2 percent decline in soybean meal use in animal feed, to 30 million MT in MY 2011/12. The lack of soybean meal to feed animals relative to the previous year is expected to be mainly filled by higher utilization of wheat, corn and sunflower meal. The incorporation of all three into animal feed rations is favored by their ample domestic supply and associated low

prices.
During the three first months of the MY, EU-27 imports of soybean meal are significantly lower than in the previous seasons.
Source: Global Trade Atlas
Soybean Oil
Oil, Soybean EU-27 2010/2011 2011/2012 2012/2013
Market Year Begin: Oct 2010
Market Year Begin: Oct 2011
Market Year Begin: Oct 2012
USDA Official
New Post
USDA Official
New Post
USDA Official
New Post
Crush 12,265 12,343 11,300 11,800 11,300
Extr. Rate, 999.9999 0 0 0 0 0
Beginning Stocks 262 262 153 371 371
Production 2,236 2,303 2,065 2,200 2,100
MY Imports 905 905 750 700 600
MY Imp. from U.S. 1 1 1 1 1
MY Imp. from EU 0 0 0 0 0
Total Supply 3,403 3,470 2,968 3,271 3,071
MY Exports 456 456 350 400 390
MY Exp. to EU 0 0 0 0 0
Industrial Dom. Cons.
1,447 1,306 1,279 1,160 1,120
Food Use Dom. Cons.
1,227 1,287 1,100 1,290 1,270
Feed Waste Dom. Cons.
120 50 90 50 50
Total Dom. Cons. 2,794 2,643 2,469 2,500 2,440
Ending Stocks 153 371 149 371 241
Total Distribution 3,403 3,470 2,968 3,271 3,071

1000 MT, PERCENT
Source: FAS EU-27
Breakout of Industrial Uses for Soybean Oil in MT
MY 2010/11 MY 2011/12 MY 2012/13
Biofuels Use 1,098 960 920
Other Industrial Uses 208 200 200
Total Industrial Use 1,306 1,160 1,120
Source: FAS EU-27
The primary use of soybean oil is in the EU is for food (approximately 50 percent), followed by biofuels (40 percent), and industrial use (8 percent). The components of the EU‟s soybean oil supply from both domestic crush and imports. The largest suppliers are Argentina (30-50 percent), Brazil (15-36 percent) and Russia (10-20 percent). Interestingly, EU-27 imports of biodiesel have steadily increased in the past few years, mainly from Argentina and Indonesia. An increasing percentage of soybean oil imports is therefore estimated to be for food use.
Source: Global Trade Atlas
MY 2012/13
The same trends are expected in MY 2012/13 as in MY 2011/12, with reduced imports, stable food use, and reduced use in biodiesel, as the alternative oils indicated above continue to increase their market share at the expense of soybean oil.
MY 2011/12
In MY 2011/12, the food use soybean oil is estimated to remain dominant and stable, while biofuels use is anticipated to decline, displaced by sunflower oil, palm oil, animal fats and recycled oils, which are increasingly used to process biodiesel in the European Union.
Also, Argentina is anticipated to continue to increase its exports of biodiesel to the European Union, at the expense of soybean oil exports.
Trade data in the first three months of the MY clearly indicate a significant decline in total soybean oil imports for the previous years.

3. Rapeseed Complex
Coordinator: Leif Erik Rehder/FAS Berlin
Less rapeseed was planted in MY 2012/13 but a slight recovery in European production is expected due to higher yields.
Oilseed, Rapeseed EU-27
2010/2011 2011/2012 2012/2013
Market Year Begin: Jul 2010
Market Year Begin: Jul 2011
Market Year Begin: Jul 2012
USDA Official
New Post
USDA Official
New Post
USDA Official
New Post
Area Planted 6,900 6,900 7,000 7,000 6,700
Area Harvested 6,985 6,986 6,750 6,637 6,400
Beginning Stocks 1,809 1,809 1,740 1,744 1,362
Production 20,706 20,760 19,100 19,128 19,500
MY Imports 2,572 2,572 3,000 2,800 2,800
MY Imp. from U.S. 0 0 0 0 0
MY Imp. from EU 0 0 0 0 0
Total Supply 25,087 25,141 23,840 23,672 23,662
MY Exports 197 197 100 110 100
MY Exp. to EU 0 0 0 0 0
Crush 22,280 22,700 21,420 21,700 22,100
Food Use Dom. Cons.
0 0 0 0 0
Feed Waste Dom. Cons.
870 500 826 500 500
Total Dom. Cons. 23,150 23,200 22,246 22,200 22,600
Ending Stocks 1,740 1,744 1,494 1,362 962
Total Distribution 25,087 25,141 23,840 23,672 23,662
1000 HA, 1000 MT
MY 2012/13
The forecast for EU-27 rapeseed area is reduced by five percent or 350,000 ha, compared to 2011 USDA official number. This is a result of reductions in Romania, Bulgaria, Hungary and Denmark. These were mostly due to heavy rains during planting (Denmark), winterkill (Bulgaria, Hungary) and dryness (Romania). In France, Germany, Sweden, the United Kingdom and the Czech Republic farmers increased their rapeseed area but the increase is too small to fully compensate for the reductions that occurred elsewhere. Total EU-27 rapeseed production is forecast at 19.5 MMT, which is a two percent increase over 2011. Winterkill has also been reported for other countries like France, Germany and Poland but it is not expected that the impact will be as significant as in Hungary and Bulgaria. Only a limited acreage will be replanted with corn and sunflower seed in spring. In general, rapeseed plantings seem to be in good condition. Over all, yields are expected to return to average levels and be better than the very low levels of 2011.
Rapeseed crush volumes are forecast to rebound slightly, driven by larger availability of domestic rapeseed production, the steady demand from the biodiesel sector, and improved crops in Canada, which will lead to significant EU imports. As the domestic rapeseed supply stays tight, it is expected that ending stocks will be reduced further.

MY 2011/12
Preliminary final data shows EU-27 rapeseed production substantially lower than in MY 2010/11. Imports are estimated to increase compared to 2010/11 because of low domestic EU-27 production. Canada and Australia exported more, while Ukraine, the major regional source, had lower exportable supplies. Rapeseed crush is expected to be 1.4 MMT below the level of MY 2010/11. Higher imports of rapeseed could not compensate lower domestic availability. In crushing plants, rapeseed products were partly substituted by sunflower seeds. As a result, less rapeseed meal, more sunflower meal and also more wheat are expected to be used in animal feed rations.
EU-27 Rapeseed Meal
Meal, Rapeseed EU-27
2010/2011 2011/2012 2012/2013
Market Year Begin: Jul 2010
Market Year Begin: Jul 2011
Market Year Begin: Jul 2012
USDA Official
New Post
USDA Official
New Post
USDA Official
New Post

Crush 22,280 22,700 21,420 21,700 22,100
Extr. Rate, 999.9999 1 1 1 1 1
Beginning Stocks 75 300 118 417 282
Production 12,827 12,550 12,331 12,100 12,300
MY Imports 223 224 150 220 210
MY Imp. from U.S. 0 0 0 0 0
MY Imp. from EU 0 0 0 0 0
Total Supply 13,125 13,074 12,599 12,737 12,792
MY Exports 252 251 250 250 260
MY Exp. to EU 0 0 0 0 0
Industrial Dom. Cons.
0 6 0 5 6
Food Use Dom. Cons.
0 0 0 0 0
Feed Waste Dom. Cons.
12,755 12,400 12,248 12,200 12,200
Total Dom. Cons. 12,755 12,406 12,248 12,205 12,206
Ending Stocks 118 417 101 282 326
Total Distribution 13,125 13,074 12,599 12,737 12,792
1000 MT, PERCENT
MY 2012/13
Rapeseed meal production is projected to increase again in MY 2012/13 after a three percent decline in MY 2011/12. The popularity of rapeseed meal for animal feed varies among EU countries. Its use is most pronounced in countries that have a long rapeseed crushing history and high dairy production like Germany, France, the Benelux and the UK.
EU-27 rapeseed oil
Oil, Rapeseed EU-27
2010/2011 2011/2012 2012/2013
Market Year Begin: Jul Market Year Begin: Jul Market Year Begin: Jul

2010 2011 2012
USDA Official
New Post
USDA Official
New Post
USDA Official
New Post
Crush 22,280 22,700 21,420 21,700 22,100
Extr. Rate, 999.9999 0 0 0 0 0
Beginning Stocks 249 365 191 259 129
Production 9,258 9,400 8,901 9,000 9,200
MY Imports 488 488 550 620 600
MY Imp. from U.S. 15 24 15 70 60
MY Imp. from EU 0 0 0 0 0
Total Supply 9,995 10,253 9,642 9,879 9,929
MY Exports 214 214 250 150 150
MY Exp. to EU 0 0 0 0 0
Industrial Dom. Cons.
6,905 7,110 7,150 7,000 7,000
Food Use Dom. Cons.
2,680 2,620 2,037 2,550 2,600
Feed Waste Dom. Cons.
5 50 5 50 50
Total Dom. Cons. 9,590 9,780 9,192 9,600 9,650
Ending Stocks 191 259 200 129 129
Total Distribution 9,995 10,253 9,642 9,879 9,929
1000 MT, PERCENT
Biofuels production is the major use of rapeseed oil in the EU-27 and an important market driver. After a small dip in MY 2011/12, the use of rapeseed oil for biodiesel is expected to remain stable in MY 2012/13. Food use of rapeseed oil is expected to rebound.
EU-27 rapeseed oil imports have shown a steady increase in recent years as the increasing demand had outpaced domestic rapeseed oil production. The United Arab Emirates, Canada and Russia were the main suppliers in MY 2010/11. The U.S. also become a major supplier and ranked fourth in 2010/11. However, data for the first half of MY 2011/12 indicate that U.S. exports to the EU-27 will decline.
Breakout of Industrial Uses for Rapeseed Oil in MT
MY 2010/11 MY 2011/12 MY 2012/13
Biofuels Use 6.400 6.350 6.350
Other Industrial Uses 710 650 650
Total Industrial Use 7.110 7.000 7.000
Source: FAS EU-27
4. Sunflower Complex
Coordinator: Mila Boshnakova/ FAS Sofia and Monica Dobrescu FAS/ Bucharest Sunflower seeds
Oilseed, Sunflowerseed EU-27
2010/2011 2011/2012 2012/2013
Market Year Begin: Oct 2010
Market Year Begin: Oct 2011
Market Year Begin: Oct 2012
USDA Official
New Post
USDA Official
New Post
USDA Official
New Post
Area Planted 3,900 3,900 3,900 3,920 4,250

Area Harvested 3,741 3,718 4,160 4,200 4,250
Beginning Stocks 403 403 311 342 672
Production 6,920 6,900 8,100 8,200 7,880
MY Imports 379 379 650 500 400
MY Imp. from U.S. 55 0 40 0 0
MY Imp. from EU 0 0 0 0 0
Total Supply 7,702 7,682 9,061 9,042 8,952
MY Exports 555 555 450 600 650
MY Exp. to EU 0 0 0 0 0
Crush 6,114 6,100 6,960 7,000 6,900
Food Use Dom. Cons. 270 235 300 270 275
Feed Waste Dom. Cons.
452 450 558 500 500
Total Dom. Cons. 6,836 6,785 7,818 7,770 7,675
Ending Stocks 311 342 793 672 627
Total Distribution 7,702 7,682 9,061 9,042 8,952
1000 HA, 1000 MT
MY 2012/13
The EU-27 expect to see stable or higher planted sunflower areas in MY2012/13 due to reseeding of winterkill areas in major producing countries or due to land availability (Romania, Bulgaria, France) which is likely to offset the expected decline in Spain because of the lack of soil and subsoil humidity caused by the current drought that is discouraging farmers from planting. At present, production is forecast conservatively to be 4 percent lower than in MY2011/12 due to bumper yields. Total supply is forecast to be about 1 percent less than in MY11/12, as a result of accumulated beginning stocks and projected slightly lower imports.
Exports are expected to grow by 8 percent over the current year due to likely favorable export demand (Turkey). Crush use, which sharply increased during MY 2011/12, will decline 1.5 percent due to expected more abundant supply (and crush) of rapeseeds. Despite this, the crush level will stay high due to projected attractive crush margins and sunflower seeds price competitiveness versus other oilseeds. Ending stocks are projected to be reduced by 7 percent compared to estimated MY2011/12 figure, but still remain doubletheir level in MY10/11.
MY 2011/12
Harvested area and production were estimated marginally and is the main reason for lower projected imports. Nonetheless, projected imports are still 32 percent higher than the previous season due to good global supplies. Exports are projected to be considerably higher than the previous estimates and above USDA official, mainly due to increased demand by Turkey. For example, exports in the first quarter of MY2011/12 more than doubled (222 percent) compared to the same period in the previous year, with Bulgaria and Romania being the main Member State exporters.
Increased crush use is expected to be a major trend for this season, with about 15 percent growth compared to MY2010/11. Favorable price discounts for sunflower seeds and sunflower oil compared to other oilseeds and oils, good crush margins, and better demand by the poultry and livestock industries stimulated a demand growth. Crush increase are expected in France, the Netherlands, Hungary, Romania, and Italy, while a slight drop in crush is expected in Germany. Food and FSW uses were adjusted marginally lower based on Member States inputs. Ending stocks were revised lower due to higher estimates for exports and crush.
MY 2010/11
Marginal adjustments were made based on the final data contributed by EU Member States.

Sunflower Meal
Meal, Sunflowerseed EU-27
2010/2011 2011/2012 2012/2013
Market Year Begin: Oct 2010
Market Year Begin: Oct 2011
Market Year Begin: Oct 2012
USDA Official
New Post
USDA Official
New Post
USDA Official
New Post
Crush 6,114 6,100 6,960 7,000 6,900
Extr. Rate, 999.9999 1 1 1 1 1
Beginning Stocks 83 83 116 269 449
Production 3,335 3,220 3,779 3,680 3,620
MY Imports 2,254 2,253 2,700 2,500 2,550
MY Imp. from U.S. 0 0 0 0 0
MY Imp. from EU 0 0 0 0 0
Total Supply 5,672 5,556 6,595 6,449 6,619
MY Exports 137 137 150 150 150
MY Exp. to EU 0 0 0 0 0
Industrial Dom. Cons. 240 0 330 0 0
Food Use Dom. Cons. 0 0 0 0 0

Feed Waste Dom. Cons.
5,179 5,150 5,907 5,850 5,900
Total Dom. Cons. 5,419 5,150 6,237 5,850 5,900
Ending Stocks 116 269 208 449 569
Total Distribution 5,672 5,556 6,595 6,449 6,619
1000 MT, PERCENT
MY 2012/13
Production of sunflower meal is likely to drop slightly as a result of a projected marginally lower crush. Due to expected stable demand for sunflower meal by the poultry and livestock industries, and likely favorable regional supply, imports are forecast to increase to compensate for the reduction in output. Price competitiveness may boost further feed use, but also leads to a more comfortable level of ending stocks.
MY 2011/12
Production of sunflower meal in MY2011/12 is higher than in the previous year due to increased crush, but the estimate is 2.6 percent below USDA official due to reported lower conversion index by Member States. Despite revised higher beginning stocks, there is a trend towards increasing imports due to demand for feed use and abundant supply in the region. Imports are estimated higher compared to the previous season; for the first quarter of the marketing year they were 33 percent higher than a year before. At present, however, contributions from the Member States do not support imports as high as USDA official data. Feed use has increased substantially compared to the previous season as sunflower meal has been available and price competitive compared to other alternative meals (soybean and rapeseed meals) and its higher inclusion in feed formulas. Ending stocks will rise as a result of a major revision to prior MY ending stock estimates.
MY 2010/11
Adjustments were made based on final data contribution by Member States. Due to reported lower conversion index, sunflower meal production is reported 3 percent lower than USDA official. Industrial use was revised down to zero due to newly available data from Poland. This change leads to a revision in ending stocks, which increase considerably.
Sunflower Oil
Oil, Sunflowerseed EU-27
2010/2011 2011/2012 2012/2013
Market Year Begin: Oct Market Year Begin: Oct Market Year Begin: Oct

2010 2011 2012
USDA Official
New Post
USDA Official
New Post
USDA Official
New Post
Crush 6,114 6,100 6,960 7,000 6,900
Extr. Rate, 999.9999 0 0 0 0 0
Beginning Stocks 452 452 205 169 294
Production 2,563 2,560 2,918 2,950 2,900
MY Imports 768 768 1,630 1,000 1,100
MY Imp. from U.S. 0 0 0 0 0
MY Imp. from EU 0 0 0 0 0
Total Supply 3,783 3,780 4,753 4,119 4,294
MY Exports 166 166 130 150 150
MY Exp. to EU 0 0 0 0 0
Industrial Dom. Cons.
220 220 271 300 302
Food Use Dom. Cons.
3,189 3,200 4,111 3,350 3,425
Feed Waste Dom. Cons.
3 25 3 25 25
Total Dom. Cons. 3,412 3,445 4,385 3,675 3,752
Ending Stocks 205 169 238 294 392
Total Distribution 3,783 3,780 4,753 4,119 4,294
1000 MT, PERCENT
Breakout of Industrial Uses for Sunflower Oil in MT
MY 2010/11 MY 2011/12 MY 2012/13
Biofuels Use 140,000 220,000 220,000
Other Industrial Uses 80,000 80,000 82,000
Total Industrial Use 220,000 300,000 302,000
Source: FAS EU-27
MY 2012/13
Production of sunflower oil is projected to decline slightly as a result of a marginally lower crush but will still remain at a high level. Growing food demand and good regional supplies will help meet growing import demand and offset the reduction in output. Food use is likely to increase by 2.2 percent, more modest than the 4.7 percent growth in the current year. Stocks should rebuild to a more comfortable level.
MY 2011/12
The major trend in the current year has been the growth (4.7 percent) in food use of sunflower oil. Demand was stimulated by price competitiveness and better availability. Member States report overall higher food use with a most substantial growth in the food and HRI industries, as well as substitutions of other oils with sunflower oil. Output of sunflower oil is revised slightly above USDA official data due to the bigger crush. Imports are also projected to be significantly above the previous year (30 percent). However, current contributions from Member States do not support the sharp increase in imports found in USDA official data. Imports in the first quarter of the marketing year were 18 percent below that a year ago but are likely to grow during the remainder of the year.
MY 2010/11
Marginal adjustments were done based on final data contributed by the Member States with an increase in food

and FSW use. This leads to lower ending stocks.
5. Palm Kernel Complex
Coordinator: Bob Flach/FAS The Hague
Meal, Palm Kernel EU-27
2010/2011 2011/2012 2012/2013
Market Year Begin: Jan 2011
Market Year Begin: Jan 2012
Market Year Begin: Jan 2013
USDA Official
New Post
USDA Official
New Post
USDA Official
New Post
Crush 25 25 25 25 25
Extr. Rate, 999.9999 1 1 1 1 1
Beginning Stocks 0 0 0 0 0
Production 14 14 14 14 14
MY Imports 2,127 2,127 2,250 2,300 2,300
MY Imp. from U.S. 0 0 0 0 0
MY Imp. from EU 0 0 0 0 0
Total Supply 2,141 2,141 2,264 2,314 2,314
MY Exports 0 0 0 0 0
MY Exp. to EU 0 0 0 0 0
Industrial Dom. Cons.
451 250 451 250 250
Food Use Dom. Cons.
0 0 0 0 0
Feed Waste Dom. Cons.
1,690 1,891 1,813 2,064 2,064
Total Dom. Cons. 2,141 2,141 2,264 2,314 2,314
Ending Stocks 0 0 0 0 0
Total Distribution 2,141 2,141 2,264 2,314 2,314
1000 MT, PERCENT
Oil, Palm Kernel EU-27
2010/2011 2011/2012 2012/2013
Market Year Begin: Jan Market Year Begin: Jan Market Year Begin: Jan

2011 2012 2013
USDA Official
New Post
USDA Official
New Post
USDA Official
New Post
Crush 25 25 25
Extr. Rate, 999.9999 0 0 0 0 0
Beginning Stocks 54 54 27 53 37
Production 11 11 11 11 11
MY Imports 540 540 610 545 550
MY Imp. from U.S. 0 0 0 0 0
MY Imp. from EU 0 0 0 0 0
Total Supply 605 605 648 609 598
MY Exports 20 20 10 20 20
MY Exp. to EU 0 0 0 0 0
Industrial Dom. Cons.
203 320 201 320 320
Food Use Dom. Cons.
339 200 399 220 220
Feed Waste Dom. Cons.
16 12 11 12 12
Total Dom. Cons. 558 532 611 552 552
Ending Stocks 27 53 27 37 26
Total Distribution 605 605 648 609 598
1000 MT, PERCENT
In 2012 and 2013, EU palm kernel meal use is expected to increase to about 2.1 MMT, from 1.9 MMT in 2011. This is a result of the increasing supply from Asia in combination with the lower supply of mainly soybean meal. About half of the palm kernel meal is used in the Benelux countries, predominantly as an ingredient in cattle feed. During the past five years, the use in cattle feed has been about twenty-five percent. Germany, the UK and Ireland also use palm kernel meal in livestock feed. The import and use of palm kernel oil stabilized in 2011, and is expected to increase slightly following the increasing supply from Asia.
6. Palm Oil Coordinator: Bob Flach/ FAS The Hague
Palm Oil
Oil, Palm EU-27 2010/2011 2011/2012 2012/2013
Market Year Begin: Jan 2011
Market Year Begin: Jan 2012
Market Year Begin: Jan 2013
USDA Official
New Post
USDA Official
New Post
USDA Official
New Post
Area Planted 0 0 0 0
Area Harvested 0 0 0 0
Trees 0 0 0 0
Beginning Stocks 542 542 162 113 163
Production 0 0 0 0
MY Imports 4,800 4,628 5,300 5,500 5,500
MY Imp. from U.S. 0 0 0 0 0
MY Imp. from EU 0 0 0 0 0

Total Supply 5,342 5,170 5,462 5,613 5,663
MY Exports 202 207 120 200 200
MY Exp. to EU 0 0 0 0 0
Industrial Dom. Cons.
2,090 1,850 2,280 2,250 2,350
Food Use Dom. Cons.
2,660 2,700 2,600 2,700 2,700
Feed Waste Dom. Cons.
228 300 270 300 300
Total Dom. Cons. 4,978 4,850 5,150 5,250 5,350
Ending Stocks 162 113 192 163 113
Total Distribution 5,342 5,170 5,462 5,613 5,663
1000 HA, 1000 TREES, 1000 MT
During the past ten years, EU imports of palm oil increased from about 2 MMT to over 5 MMT per year. This growth is mainly attributable to the increased imports of crude palm oil through the port of Rotterdam. Currently, the refining capacity in this port is estimated at about 1.5 MMT per year. While EU imports of crude palm oil increased from 1.1 MMT to 4.0 MMT annually, refined palm oil imports fluctuated between 1.0 and 1.5 MMT since 2000. Although the price of palm oil has more than doubled since the beginning of 2009, the price relationship to soybean, rapeseed, and sunflower oil has generally remained intact. Currently, the FOB Rotterdam palm oil price is about fifteen to twenty-five percent lower than that of these other main vegetable oils. This margin makes palm oil an economical alternative in the EU oils and fats market.
Official trade statistics reveal a reduction of palm oil imports in 2011, from 5.4 MMT in 2010 to about 4.6 MMT. However, not all trade data has been collected yet. Official customs data are expected to be low by 300,000 to 400,000 MT, of which about 200,00 MT is from a single company. EU exports of refined palm oil are expected to stagnate or decline slightly as more refined oil is be sourced directly from refineries in Asia.
Palm oil use for industrial purposes, including combustion for combined heat and power (CHP) and production of biofuels, is currently estimated at about 1.9 MMT in 2011 but will likely be adjusted at a higher when new official trade data becomes available. As a result, imports of palm oil may also be adjusted up. Biofuel production is forecast to remain a growth market for palm oil. In 2011, the biodiesel sector increasingly sourced recycled vegetable oils instead of palm oil for the production of biodiesel. For 2011, the use of palm oil for biofuel production is estimated at 650,000 MT, but is expected to grow to about 750,000 MT in 2013. The use of palm oil for biofuel production is forecast to increase particularly in the Netherlands. In Rotterdam a new biofuel plant with an annual capacity of 800,000 MT of biofuel has been operational since December 2011. The plant applies the Biomass to Liquid (BtL) process and the company‟s goal is to use fifty percent palm oil and forty percent waste oils and fats as feedstock. In the Dutch Renewable Energy Action Plan, the Dutch government is planning to use an ambitious 3 MMT of palm oil for renewable energy production by 2020.
During the past ten years, palm oil use by the food processing and feed compound industry steadily increased, based mainly on price. The food industry also claims the low content of trans-fatty acids as an important factor. The use of palm oil for food and feed is expected to stagnate at 2.7 MMT. An important factor for further penetration of palm oil in the EU market is the sustainability certification. For palm oil to used as a qualified biofuels it must be certified as sustainable under the EU‟s Renewable Energy Directive (RED) but there are some program complications. For example, the Dutch government acknowledged the program Round Table for Sustainable Palm Oil (RSPO) as being in compliance with the RED starting in July 2012. However, the European Commission does not acknowledge the RSPO but is evaluating the program. The Dutch Sustainable Palm Oil Task Force is also working to ensure that by the end of 2015, all palm oil

destined for the Dutch market (food, feed and energy use) needs to be sustainably produced. The Dutch Government has pled for a zero import tariff (now 3.8 percent) for sustainable unrefined palm oil for the production of food.
7. Peanut Complex
Coordinator Jennifer Wilson/ FAS London
Peanuts
Oilseed, Peanut EU-27 2010/2011 2011/2012 2012/2013
Market Year Begin: Oct 2010 Market Year Begin: Oct 2011 Market Year Begin: Oct 2012 USDA Official New Post USDA Official New Post USDA Official New Post
Area Planted 0 0 0 0 0
Area Harvested 0 0 0 0 0
Beginning Stocks 10 10 8 8 8
Production 0 0 0 0 0
MY Imports 747 744 750 730 730
MY Imp. from U.S. 70 70 65 60 60
MY Imp. from EU 0 0 0 0 0
Total Supply 757 754 758 738 738
MY Exports 29 29 30 25 25
MY Exp. to EU 0 0 0 0 0
Crush 45 45 45 45 45
Food Use Dom. Cons. 672 669 672 657 657
Feed Waste Dom. Cons. 3 3 3 3 3
Total Dom. Cons. 720 717 720 705 705
Ending Stocks 8 8 8 8 8
Total Distribution 757 754 758 738 738
1000 HA, 1000 MT
Peanut meal
Meal, Peanut EU-27 2010/2011 2011/2012 2012/2013
Market Year Begin: Oct 2010 Market Year Begin: Oct 2011 Market Year Begin: Oct 2012 USDA Official New Post USDA Official New Post USDA Official New Post
Crush 45 45 45 45 45
Extr. Rate, 999.9999 0 0 0 0 0
Beginning Stocks 0 0 0 0 0
Production 20 20 20 20 20
MY Imports 66 60 20 60 60
MY Imp. from U.S. 0 7 0 0 0
MY Imp. from EU 0 0 0 0 0
Total Supply 86 80 40 80 80
MY Exports 0 0 0 0 0
MY Exp. to EU 0 0 0 0 0
Industrial Dom. Cons. 0 0 0 0 0
Food Use Dom. Cons. 0 0 0 0 0
Feed Waste Dom. Cons. 86 80 40 80 80
Total Dom. Cons. 86 80 40 80 80

Ending Stocks 0 0 0 0 0
Total Distribution 86 80 40 80 80
1000 MT, PERCENT
Peanut oil
Oil, Peanut EU-27 2010/2011 2011/2012 2012/2013
Market Year Begin: Oct 2010 Market Year Begin: Oct 2011 Market Year Begin: Oct 2012 USDA Official New Post USDA Official New Post USDA Official New Post
Crush 45 45 Extr. Rate, 999.9999 0 0 0 0 0
Beginning Stocks 5 5 5 5 5
Production 16 16 16 16 16
MY Imports 80 80 75 78 78
MY Imp. from U.S. 0 0 0 0 0
MY Imp. from EU 0 0 0 0 0
Total Supply 101 101 96 99 99
MY Exports 2 3 3 2 2
MY Exp. to EU 0 0 0 0 0
Industrial Dom. Cons. 0 0 0 0 0
Food Use Dom. Cons. 94 93 89 92 92
Feed Waste Dom. Cons. 0 0 0 0 0
Total Dom. Cons. 94 93 89 92 92
Ending Stocks 5 5 4 5 5
Total Distribution 101 101 96 99 99
1000 MT, PERCENT
The European Union is the largest importer of peanut and peanut products in the world. Imports have historically
been very stable, although current high prices may affect usage in the near future. Whole and shelled peanuts
are forecast to be down nearly 2 percent over previous marketing years, due to harvest shortfalls in several key
supplier nations, including the United States and India. EU requirements for very low aflatoxin levels are a major
factor in sourcing peanuts. The U.S. is expected to have fewer peanuts available for export to the EU, and price
is always a limiting factor to increasing sales of U.S. peanuts to this market.
The main supplier of peanut meal to the EU, Senegal, has reportedly experienced a fall in production in the
current marketing year due adverse weather conditions. The forecast for EU imports of peanut meal is held
stable as it is unclear yet how trade may be affected.
In recent years, Senegal has been the key supplier of peanut oil to the EU, along with Argentina and Brazil.
Again, following trade reports of a reduced peanut harvest in Senegal, our forecast for EU imports of peanut oil is
held stable until trade patterns become clearer.
8. Fish Meal Coordinator: Asa Wideback/ FAS Stockholm
Meal, Fish EU-27 2010/2011 2011/2012 2012/2013

Market Year Begin: Jan 2011
Market Year Begin: Jan 2012
Market Year Begin: Jan 2013
USDA Official
New Post
USDA Official
New Post
USDA Official
New Post
Catch For Reduction
1,620 0 1,620 1,620 1,620
Extr. Rate, 999.9999 0 0 0 0 0
Beginning Stocks 7 7 7 7 7
Production 500 470 500 500 500
MY Imports 400 354 450 400 400
MY Imp. from U.S. 2 1 2 1 1
MY Imp. from EU 0 0 0 0 0
Total Supply 907 831 957 907 907
MY Exports 200 222 200 220 220
MY Exp. to EU 0 0 0 0 0
Industrial Dom. Cons.
0 0 0 0 0
Food Use Dom. Cons.
0 0 0 0 0
Feed Waste Dom. Cons.
700 602 750 680 680
Total Dom. Cons. 700 602 750 680 680
Ending Stocks 7 7 7 7 7
Total Distribution 907 831 957 907 907
1000 MT
The EU is dependent on fishmeal imports to fulfill domestic demand. Imports in 2011 were lower than previously expected, resulting in lower feed use. Although imports from Peru have been decreasing for two years, more than half of EU imports still originate in Peru. Germany and the UK are the biggest markets for fishmeal in the EU. Together these countries account for about 75 percent of total EU imports.
The major cause of the drop is the use of other feed proteins to replace fishmeal. The price of fishmeal is expected to remain high in 2012. Fishmeal usage is also moving from animal feed to aquaculture.
EU exports are expected to remain stable. A major part of EU fishmeal exports go to Norway and its aquaculture industry.
9. Copra Complex
Coordinator: Leif Eric Rehder/ FAS Berlin
Copra is not produced and no longer processed in the EU-27. The EU-27 satisfies all its copra meal and coconut oil demand with imports.
Meal, Copra EU-27 2010/2011 2011/2012 2012/2013
Market Year Begin: Jan 2011
Market Year Begin: Jan 2012
Market Year Begin: Jan 2013
USDA Official
New Post
USDA Official
New Post
USDA Official
New Post
Crush 0 0 0 0
Extr. Rate, 999.9999 0 0 0 0 0
Beginning Stocks 0 0 0 0 0

Production 0 0 0 0
MY Imports 18 18 35 25 25
MY Imp. from U.S. 0 0 0 0
MY Imp. from EU 0 0 0 0
Total Supply 18 18 35 25 25
MY Exports 0 0 0 0
MY Exp. to EU 0 0 0 0
Industrial Dom. Cons.
0 0 0 0
Food Use Dom. Cons.
0 0 0 0
Feed Waste Dom. Cons.
18 18 35 25 25
Total Dom. Cons. 18 18 35 25 25
Ending Stocks 0 0 0 0
Total Distribution 18 18 35 25 25
1000 MT, PERCENT
Source: FAS EU-27
In CY 2011 EU imports of coconut oil dropped because of tight world supplies. In response to high prices consumers shifted towards palmkernel oil. It is expected that imports of coconut oil will recover slightly in CY 2012.
Oil, Coconut EU-27 2010/2011 2011/2012 2012/2013
Market Year Begin: Jan 2011
Market Year Begin: Jan 2012
Market Year Begin: Jan 2012
USDA Official
New Post
USDA Official
New Post
USDA Official
New Post
Crush 0 0 0 0 0
Extr. Rate, 999.9999 0 0 0 0 0
Beginning Stocks 153 153 61 53 36
Production 0 0 0 0 0
MY Imports 620 617 725 700 700
MY Imp. from U.S. 0 0 0 0 0
MY Imp. from EU 0 0 0 0 0
Total Supply 773 770 786 753 736
MY Exports 12 12 12 12 12
MY Exp. to EU 0 0 0 0 0
Industrial Dom. Cons.
240 320 240 320 320
Food Use Dom. Cons.
450 380 460 380 380
Feed Waste Dom. Cons.
10 5 10 5 5
Total Dom. Cons. 700 705 710 705 705
Ending Stocks 61 53 64 36 19
Total Distribution 773 770 786 753 736
1000 MT, PERCENT
Source: FAS EU-27

10. Cottonseed Complex
Coordinator: Ornella Bettini/ FAS Rome
EU-27 Cottonseed
Cottonseed EU-27 2010/2011 2011/2012 2012/2013
Market Year Begin: Oct 2010
Market Year Begin: Oct 2011
Market Year Begin: Oct 2012
USDA Official
New Post
USDA Official
New Post
USDA Official
New Post
Area 313 303 370 352 353
Beginning Stocks 22 22 22 22 22
Production 375 395 459 550 516
MY Imports 76 49 70 59 58
MY Imp. from U.S. 5 7 5 7 7
MY Imp. from EU 0 12 0 12 12
Total Supply 473 466 551 631 596
MY Exports 35 25 34 26 24
MY Exp. to EU 114 118 114 118 118
Crush 273 238 255 426 395
Food Use Dom. Cons.
2 2 2 2 2
Feed Waste Dom. Cons.
141 179 238 155 153
Total Dom. Cons. 416 419 495 583 550
Ending Stocks 22 22 22 22 22
Total Distribution 473 466 551 631 596
1000 HA, 1000 MT
Source: FAS EU-27
EU-27 Cottonseed Meal
Cottonseed Meal EU-27
2010/2011 2011/2012 2012/2013
Market Year Begin: Oct 2010
Market Year Begin: Oct 2011
Market Year Begin: Oct 2012
USDA Official
New Post
USDA Official
New Post
USDA Official
New Post
Crush 273 238 255 426 395
Extraction Rate 0.483 0.483 0.486 0.483 0.483
Beginning Stocks 5 5 5 5 5
Production 132 115 124 206 191
MY Imports 4 4 4 4 4
MY Imp. from U.S. 1 1 1 1 1
Total Supply 141 124 133 215 200
MY Exports 0 2 0 2 2
MY Exp. to U.S. 0 0 0 0 0
Industrial Dom. Cons. 0 0 0 0 0

Food Use Dom. Cons. 0 0 0 0 0
Feed, Seed Waste Dom. Cons.
136 117 128 208 193
Total Dom. Cons. 136 117 128 208 193
Ending Stocks 5 5 5 5 5
Total Distribution 141 124 133 215 200
1000 MT
Source: FAS EU-27
EU-27 Cottonseed Oil
Cottonseed Oil EU-27 2010/2011 2011/2012 2012/2013
Market Year Begin: Oct 2010
Market Year Begin: Oct 2011
Market Year Begin: Oct 2012
USDA Official
New Post
USDA Official
New Post
USDA Official
New Post
Crush 273 238 255 426 395
Extraction Rate 0.183 0.181 0.184 0.184 0.182
Beginning Stocks 5 5 5 5 5
Production 50 43 47 78 72
MY Imports 1 3 1 3 3
MY Imp. from U.S. 0 0 0 0 0
Total Supply 56 51 53 86 80
MY Exports 0 0 0 0 0
MY Exp. to U.S. 0 0 0 0 0
Industrial Dom. Cons. 0 0 0 0 0
Biofuels 5 5 5 6 8
Food Use Dom. Cons. 46 41 43 75 67
Feed, Seed Waste Dom. Cons.
0 0 0 0 0
Total Dom. Cons. 51 46 48 81 75
Ending Stocks 5 5 5 5 5
Total Distribution 56 51 53 86 80
1000 MT
Source: FAS EU-27
Production
The EU-27 is a minor producer of cotton. EU-27 cotton production has declined by more than 50 percent following Common Agricultural Policy (CAP) reforms effective in 2006 that decoupled payments and reduced support and market barriers for a number of crops, including cotton. Production may stabilize through 2013 when additional reforms are expected to be implemented that could further reduce incentives to produce cotton.
The EU-27 does not permit farmers to cultivate modern biotech cotton varieties, further hurting competitiveness. Only two EU-27 Members States, Greece (80 percent) and Spain (20 percent), grow significant amounts of cotton commercially.
Cotton is a major agricultural crop in Greece, accounting for more than 8 percent of total agricultural output. More than 75,000 farmers grow cotton, producing about 90 percent of the EU crop. Cotton is planted from March 1 to April 15; the harvest occurs from October 1 to November 30. Most cotton is irrigated and machine harvested. Thessaly, Macedonia, and Mainland Greece are the major cotton-producing areas.

Spain‟s cotton area is concentrated in the region of Andalusia, and it is progressively concentrating in the provinces of Seville and Cadiz. Cotton is grown on some of the best agricultural land, competing with other irrigated crops.
Following the cotton reforms in MY 2009/10, the EU-27 planted area has progressively increased and is forecast to remain stable during MY 2012/13. MY 2012/2013 Greek cotton area and production are forecast to remain steady if weather remains stable. In Spain, the modification of the payment system in MY 2009/10, along with favorable prices paid to producers has enabled a progressive recovery of the area planted to cotton over the last three MY. Greek seed cotton prices have increased from €0.52/kg at the beginning of the season to nearly $1.20/lb. in mid-November. In Spain seed cotton prices increased from €0.48/kg at the beginning of the season to nearly €0.59/kg in November.
Crush
In Greece, about 58 percent of cottonseed production is crushed for oil (and oilseed cake) or retained for seed. In Spain, cottonseed production is not crushed, but used directly as animal feed (mostly dairy cows).
Trade
Greece is a major cotton exporter. Italy continues to be the main destination for Greek cottonseed exports, accounting for 75 percent of the total. In Greece, small amounts of cotton are imported for blending in the domestic spinning industry. Spanish cottonseed domestic demand is also satisfied by imports. Cote d‟Ivoire, Brazil, and Greece are the main suppliers to the Spanish cottonseed market.
11. Olive Oil Coordinator: Marta Guerrero/ FAS Madrid
OLIVE OIL
Oil, Olive EU-27 2010/2011 2011/2012 2012/2013
Market Year Begin: Nov 2010
Market Year Begin: Nov 2011
Market Year Begin: Nov 2012
USDA Official
New Post
USDA Official
New Post
USDA Official
New Post
Area Planted 0 0 0 0 0
Area Harvested 0 0 0 0 0
Trees 6,750 0 6,750 0 0
Beginning Stocks 419 419 229 343 438
Production 2,290 2,205 2,350 2,395 2,185
MY Imports 90 83 75 75 80
MY Imp. from U.S. 0 0 0 0 0
MY Imp. from EU 0 0 0 0 0
Total Supply 2,799 2,707 2,654 2,813 2,703
MY Exports 520 484 410 490 495
MY Exp. to EU 0 0 0 0 0
Industrial Dom. Cons.
50 50 50 50 50
Food Use Dom. Cons.
2,000 1,830 2,000 1,835 1,835
Feed Waste Dom. Cons.
0 0 0 0 0

Total Dom. Cons. 2,050 1,880 2,050 1,885 1,885
Ending Stocks 229 343 194 438 323
Total Distribution 2,799 2,707 2,654 2,813 2,703
1000 HA, 1000 TREES, 1000 MT
MY 2012/13
Slightly lower production levels are anticipated for MY2012/13 driven by Spain‟s lower production prospects due to the frosts and dry conditions that prevailed after harvest. Olive oil production is also expected to decline slightly since it has become less profitable in Italy due to rising input costs and decreasing prices that have forced many Italian oil olives growers to cut some cultivation practices or abandon production. Food use is expected to remain fairly stable in the EU-27 and exports to third countries are expected to continue their upward trend at the expenses of domestic stocks.
MY2011/12
Overall olive oil production in the EU-27 is expected to grow in MY2011/12. The situation is different in the EU leading producing countries. Production remained fairly stable in Greece and Italy, while olive oil production grew in Spain and Portugal.
Dry and mild weather in early fall and winter in Spain favored olive harvest, which was carried out earlier in the season than usual. Farmers and packers in Spain expect record production, which might have a negative impact in prices in the short term. Italian olive oil production declined about 6 percent due to the effects of the hot summer, resulting in the lowest harvest in the last decade. Hot temperatures and drought over the summer negatively affected the olive ripening, triggering a decline in yields especially in Central regions (Tuscany, Lazio, Umbria, Marche) where the olive oil production will likely decline by 30-40 percent. Nevertheless, the absence of rain did not allow for pathogens to spread (olive fruit fly) on the crop, thus quality is expected to be quite good. In Greece, olive oil production has been negatively affected by the freezing weather of March 2011. Qualitatively it has been a very good year for the whole country except for Crete where the presence of the fly and the freezing weather have had a negative impact not only on the quantity but also on the quality of the olive oil produced.
Despite of the economic difficulties in Mediterranean countries –leading producers and consumers- olive oil consumption remains steady and marginal growths in consumption are anticipated in the EU as a whole. High olive oil beginning stocks in MY 2011/12, located mainly in Spain along with an earlier than usual and abundant crop have pressured prices down triggering PSA twice this MY. Olive oil actors are currently calling for the opening of a third tender.
Private Storage Aid
In the past year the European Commission has opened Private Storage Aid (PSA) twice for virgin olive oil. The aim of the PSA scheme is to help stabilize the EU markets at times when prices are weak by removing surplus supplies. The removal can be either temporary, where the product is later released back onto the Community market after a predetermined storage period, or permanent, where the product is exported from the Community prior to the end of the storage period. PSA is only available for products produced within the EU. The decisions on PSA‟s follow the price situation in Spain where the price for virgin oil dropped below the reference level as laid out in Council Regulation 1234/2007. The EU can provide aid for PSA‟s if there are serious disturbances on the market in a certain region or the average price for one or more of the following products are recorded on the market during a period not less than two weeks: • €1,779/ton for extra virgin olive oil •€1,710/ton for virgin olive oil •€ 1,524/ton for lampante olive oil

The two tenders were for 100 000 tons each and the first one was eligible in all EU Member States and the second one only in olive oil producing Member States ( Greece, Spain, France, Italy Cyprus, Malta Portugal and Slovenia) during a period of 180 and 150 days respectively.
The EU farmers union, Copa-Cogeca, has been lobbying for the opening of PSA‟s for olive oil for a long time, and welcomes the decision. However according to Copa-Cogeca, lampante oil prices are following the same trend in several producing countries and are already below the reference level in Greece and Portugal. Copa-Cogeca is also calling for a third opening of the PSA‟s on Olive oil to handle the currently very low prices on olive oil. The union also says that with the severe drought in many olive producing regions that will most likely cut olive oil production this year and the stored quantities will enable a smoother transition into the new campaign to maintain the level of supply and ensure market balance. According to Eurostat data the olive oil sector is the only sector that have seen year on year decreases in producer income in 2010 (-5,7 percent) , and by 15.2 percent in 2009. Olive oil is an important crop in the Southern EU. In Spain, 21 percent of the farms specialize in olives, in Greece 29 percent and in Italy 21 percent.
12. Policy
Coordinator: Karin Bendz/ FAS USEU Brussels
The Common Agriculture Policy The EU is in the process of creating the latest version of the Common Agriculture Policy (CAP) due to be implemented starting January 1, 2014. On October 12, 2011, the Commission presented a set of legal proposals focusing on competition sustainability and improving economic activities in rural areas. The proposals are currently being discussed in the Parliament and by the Member States. The proposal will maintain the same with two pillars, one with direct payments and one for rural development. One important change in the proposal is the so called “greening component” in Pillar 1, where the Commission suggests there should be three elements of greening that all farmers would have to comply with to receive direct payments. These three components are:
Crop Diversification - Farmers must produce at least three different crops, each one accounting for a maximum of 70 percent and a minimum of five percent of each farm.
Ecological focus areas – Farmers must reserve at least seven percent of arable area for ecological use, i.e. field margins, hedges, trees, fallow land, landscape features, biotopes, buffer strips, afforested area.
Conservation of permanent grassland – Farmers must not convert permanent grassland into another crop. In the EU the definition of permanent grassland is when the grass has been there for five years.
The Commission‟s proposal of greening Pillar 1, especially the proposal regarding ecological focus areas, has been heavily criticized so it is still unclear what the final CAP will look like. For more information see GAIN E60057 or the European Commission‟s website.
Aid system for oilseed
With the Agenda 2000 CAP reform, support for EU oilseeds farmers became decoupled, meaning farmers get no specific payment for growing oilseeds. The impact of the elimination of production-linked subsidies on the EU oilseeds market is marginal compared to the market impact of the growing biofuels sector.
The high demand for rapeseed for the production of biofuels has lead to increased prices which were great enough incentives for farmers to increase rapeseed production over the last few years.
With the exception of the olive sector, there is no intervention buying, export subsidy or other market support available for oilseeds in the EU.

Protein Deficiency
The EU suffers from an important protein deficiency and sees this as a vulnerability to price volatility and trade distortions. A member of the European Parliament has drafted an own-initiative report called “EU Protein deficit: what solution for a long standing problem” on the protein deficiency and this draft report has started debates on how to increase production of vegetable proteins. See GAIN E60050
According to the report, EU protein crop production currently provides only 30 percent of the protein crops consumed as animal feed, and the portion is decreasing. The remaining 70 percent of the protein crops consumed in the EU today, especially soybeans, are imported mainly from Brazil, Argentina, and the United States. These imports are estimated to represent the equivalent of 20 million hectares cultivated outside the EU, or more than 10 percent of EU arable land. Currently around three percent of EU arable land is cultivated with protein crops.
There has been push recently from a number of stakeholders in several Member States to reduce the EU‟s plant protein deficit. In this regards, please see France‟s report FR9089 “Incentives and Plant Breeding Breakthroughs to Reduce Soy Imports” dated February 2012 and Germany‟s report GM12003 “Green Movement to End Soybean Imports – An Analysis” dated January 2012.
Blair House Agreement
The 1992 Blair House Memorandum of Understanding on Oilseeds (or Blair House Agreement) between the United States and the EU was included in the EU WTO schedule of commitments and resolved a GATT dispute over EU domestic support programs that impaired U.S. access to the EU oilseeds market.
The Blair House Agreement limited the EU oilseed planting area of mainly rapeseed, sunflower seed, and soybeans, for food and feed purposes to an adjusted maximum guaranteed area for those producers benefiting from crop specific oilseed payments. This resulted in a reduction of the EU oilseed production area and penalized production in excess of the maximum.
The Blair House Agreement also limited the production of oilseeds not intended for human or animal consumption planted on set-aside land. Output of these oilseeds was limited to 1 MMT of byproducts expressed in soybean meal equivalent annually.
However, the EU asserts that changes to the CAP in 2008, which stopped payments to farmers producing energy crops and the set-aside regime, means the Blair House Agreement is not relevant and that there are no longer any restrictions on EU oilseed area. (EU Commission Website 2012-02-26)
Sustainability Issues
There is a growing concern about sustainability in the EU. The discussions on sustainability for biofuels have prompted consideration of sustainability demands for food. It has also generated more awareness of agricultural production causing deforestation and other environmental and social problems. This has led to some EU Member States, notably the Netherlands and the UK, to take measures on sustainability, currently focusing on palm oil and soybeans, as they are the ones presented in the media as connected to deforestation issues.
The European Feed Manufacturers' Federation (FEFAC) recognized that sustainability demands for protein crops that the EU needs for feed, would potentially cause problems in the future. They are currently working, together with other international organizations such as the FAO, to come up with sustainability criteria that would be workable for industry.
EU Climate and Energy Package
On April 6, 2009, the EU Council adopted the EU Climate and Energy Package, the implementing legislation

aimed at achieving Europe‟s “20-20-20 in 2020” goals: 20 percent emissions reduction, energy consumption from renewable sources, and energy efficiency. EU Member States have individual targets depending on their specific situation. For example, Sweden will have a 49 percent renewable energy target whereas Belgium only 13 percent. As part of the 20 percent renewable energy goal, every Member State will have to meet a 10 percent renewable energy target for transport.
The EU Climate and Energy Package has the potential to impact the oilseeds market. In the absence of second generation biofuels, the 10 percent minimum goal for biofuels in transport has increased and will lead to a higher demand for vegetable oils to produce biodiesel.
For biofuels to be eligible for financial support, they must comply with the sustainability criteria outlined in the Renewables Energy Directive. These sustainability criteria have to be met by all biofuels whether produced within the EU or imported from another country.
In addition, biofuel must have a GHG emissions saving of at least 35 percent. From 2017, the GHG emission saving has to be 50 percent. For biofuels produced in installations for which production starts from 2017 and onwards, the GHG savings must be 60 percent. GHG emission savings are calculated using lifecycle analysis and methodologies described in RED annexes. The “default GHG emission saving” for biodiesel made from rapeseed oil was set at 38 percent. The respective value for biodiesel made from soy oil was set at 31 percent. These values represent the minimum savings that can be applied to rapeseed and soybean feedstock unless an actual value is provided by suppliers. The EU‟s Joint Research Center is working on updating the default values in the RED Annex, however updated numbers will reportedly be based on different technologies, such as no-till farming, and not on different regions.
Oilseeds Reports
Report Title Date Released
Incentives and Plant Breeding Breakthroughs To Reduce Soy Imports| Paris | France | 2/9/2012 Among European Union (EU) Member States, France ranks above average in being protein-independent. However, despite efforts to reduce dependence on imported North and South soybean meal as the number one source of proteins in animal feed, the amount of soybean meal used in France’s animal feed have remained relatively stable at 4 million metric tons (MT) for the past 25 years. At the same time, the use of rapeseed meal in animal feed has sharply increased from minor levels to more than 2 millio... Incentives and Plant Breeding Breakthroughs to Reduce Soy Imports_Paris_France_2-3-2012
2/3/2012
| Oilseeds and Products | Berlin | Germany | 1/13/2012 In recent years, the German Green Party has promoted policies designed to replace imported soybeans with domestically produced protein crops. Recognizing that an important political party is openly advocating an end to soybean imports - the largest U.S. agricultural export to Germany - we are providing updated analysis on the feasibility of this policy approach. We conclude that while it would be impracticable for Germany to produce enough plant protein to meet domestic demand, the campaign aga... Green Movement to End Soybean Imports – An Analysis_Berlin_Germany_1-6-2012
1/9/2012
| Oilseeds and Products, Grain and Feed, Bio-Fuels | Vienna | EU-27 | This report provides EU-27 production, supply, and demand forecasts for oilseeds, protein meals and related products. Record EU-27 Sunflower Production_Vienna_EU-27_11-15-2011
11/22/2011
Oilseeds and Products, Agriculture in the News | Prague | Slovakia | Slovakia oilseeds production increased in 2011 for all major crops with rapeseed up 10 percent, sunflower seed up 46 percent and soybeans up 75 percent. Oilseeds Update Slovakia _Prague_Slovakia_10-26-2011
10/31/2011
Oilseeds and Products, Agriculture in the News | Prague | Czech Republic | The 2011 official crop estimates show production of rapeseed at 1.1 million MT, the second largest crop on record; of sunflower seed, at 73 thousand MT representing a 26 percent increase; and, of soybean at 15 thousand MT representing a slight decline due to smaller planted area and drop in per hectare yield.
10/31/2011

Oilseeds Update Czech Republic – Second Best Harvest of Rapeseed_Prague_Czech Republic_10-26-2011 | Oilseeds and Products, Bio-Fuels, Grain and Feed | Vienna | EU-27 | This report provides EU-27 production, supply, and demand forecasts for oilseeds, protein meals and related products. Rapeseed Production Somewhat Better than Expected_Vienna_EU-27_8-5-2011
8/11/2011
| Oilseed, Soybean (Local), Meal, Soybean | Rebound of EU-27 Oilseeds Production | Oilseeds and Products | Berlin | EU-27 | The rebound to average yields and an almost flat area leads to expectations of an increased EU-27 oilseeds production of about 1.5 percent in MY 211/12 reaching some 29.4 MMT. Along with the growing production crush of oilseeds is anticipated to rise accordingly. Ample supplies of soybean meal in North and South America are forecast to increase soybean meal imports which will be
absorbed by the feed demand of the growing poultry sector. After a decline of total oilseeds oil use for biodiesel ... Oilseeds and Products Annual_Berlin_EU-27_4-4-2011
4/12/2011
Related Topics
Report Title Date Released Portugal's Biofuels Standing Report 3/7/2012 Still no Rain in Spain 3/7/2012 No Rain in Spain falling on the Plain 2/8/2012 Sustainability in the EU Commodity Markets_The Hague_Netherlands EU-27 2/3/2012 Green Movement to End Soybean Imports – An Analysis_Berlin_Germany 1/13/2012 Spain's Biodiesel Standing Report 11/22/2011 Poland’s Grain and Oilseeds Harvest Update 2011-12_Warsaw_Poland 10/18/2011 Estonia’s Harvest Update_Warsaw_Estonia 10/18/2011 Grain and Feed Annual_London_EU-27 4/27/2011 FAQs on Biofuel Sustainability Certification in Germany_Berlin_Germany 4/8/2011 Transposition of the RED into National Legislation_Brussels USEU_EU-27 2/18/2011