oilseeds and products annual beijing china
TRANSCRIPT

THIS REPORT CONTAINS ASSESSMENTS OF COMMODITY AND TRADE ISSUES MADE BY
USDA STAFF AND NOT NECESSARILY STATEMENTS OF OFFICIAL U.S. GOVERNMENT
POLICY
Date:
GAIN Report Number:
Approved By:
Prepared By:
Report Highlights:
In MY14/15 China continued dominating the global oilseeds market, retaining its status as the world's
largest importer of soybeans. Specifically, Chinese total soybean imports hit another record at 78.35
million tons (MMT), absorbing 60 percent of total world exports, and 58 percent of total U.S. soybean
exports. Following peak total oilseed imports of 83.1 MMT in MY14/15, Post estimates this rising
trend will continue with imports reaching 86.4 MMT in MY15/16, and 89.2 MMT in MY16/17. Rising
incomes, urbanization and the modernization of the domestic feed and livestock sectors will continue
fostering oilseed consumption, forecast at 142.9 MMT for MY16/17. China’s soybean imports are
estimated to set another record at 82 MMT in MY15/16 and forecast to reach 84.5 MMT in MY16/17.
Conversely, due to a combination of land constraints, policy challenges, and stagnating yields, China’s
oilseed production is forecast to decline to 52.7 MMT in MY16/17 from the estimated 53.9 MMT in
MY15/16.
Jennifer Clever, Wu Xinping
Bruce Zanin
Prospects for China’s Oilseed Market Remain Strong
Oilseeds and Products Annual
China - Peoples Republic of
CH16022
3/15/2016
Required Report - public distribution

2
Table of Contents
Page
Executive Summary…………………………………………………………………………… 4
Oilseeds Situation and Outlook………………………………………………………………..5
Soybeans.........................................................................................................................................6
Rapeseed........................................................................................................................................15
Peanuts...........................................................................................................................................16
Cottonseed.....................................................................................................................................17
Oilseed Meal Situation and Outlook………………………………………………………….18
Soybean Meal …………………………………………………………………………………..23
Fishmeal........................................................................................................................................24
Oil Situation and Outlook……………………………………………………………………..24
Soybean Oil..................................................................................................................................26
Palm Oil........................................................................................................................................27
Statistics Tables
Total Oilseeds, Total Meal, and Total Oil PSD
Tables............................................................................................................................................28
Table 1. Total Oilseeds
Table 2. Total Meals
Table 3. Total Oils
Oilseeds PSD Tables…………………………………………………………………………….31
Table 4. Soybeans
Table 5. Rapeseed
Table 6. Peanuts
Table 7. Sunflower Seed
Table 8. Cottonseed
Meal PSD Tables…………………………………………………………………………….....36
Table 9. Soybean Meal
Table 10. Rapeseed Meal
Table 11. Peanut Meal
Table 12. Sunflower Seed Meal
Table 13. Cotton Seed Meal
Table 14. Fish Meal
Oils PSD Tables………………………………………………………………………………..42
Table 15. Soybean Oil
Table 16. Rapeseed Oil

3
Table 17. Peanut Oil
Table 18. Cotton Seed Oil
Table 19. Sunflower Seed Oil
Table 20. Palm Oil
Table 21. Coconut Oil
Oilseed Product Wholesale Price Tables……………………………………………………..49
Table 22. Nation Average Soybean Wholesale Prices CY2014 to CY2015
Table 23. Heilongjiang/Harbin Soybean Wholesale Prices CY2014 to CY2015
Table 24. Wholesale Soybean Meal Prices in CY2014 to CY2015
Table 25. Wholesale Soybean Oil (Grade 1) Prices in CY2014 to CY2015
Table 26. Wholesale Palm Oil Price Prices in CY2014 to CY2015
Table 27. Comparison of Wholesale Prices for Grade 1-Soy Oil and Palm Oil in CY 2015
Taxes & Duties Tables (Jan 01-Dec 31, 2016)………………………………………………50
Table 28. Oilseeds
Table 29. Oils
Table 30. Meals

4
Executive Summary:
China’s domestic oilseed production growth continues to be hampered by limited arable land and recent
domestic policies favoring grain production. China’s total planted area for all oilseed crops is forecast
to drop 2 percent to 21.87 million hectares (MHa) and total oilseed production is forecast to decrease by
2.1 percent to 52.7 MMT in MY16/17. The lower forecast reflects an expected decline in rapeseed and
cottonseed production –a combined 1.5 MMT–as policy changes and lower market prices reduced
earnings in these commodities. The forecast for soybean production is up slightly, primarily affected by
changes in grain policies, while the forecast for peanut production remains stable, responding to high
comparative profits.
In MY16/17, the total Chinese oilseed consumption forecast rose to 142.9 MMT driven by increasing
domestic demand for meats, seafood, and vegetable oils. Additionally, the expansion of the oilseed
crushing sector, growth in the feed industry, and advancements in concentrated livestock and aquatic
farming are collectively spurring demand and the need for imports.
With limited domestic production, soybean and rapeseed imports remain robust with total oilseed
imports forecast at 89.2 MMT for MY16/17. Soybean imports could reach 84.5 MMT, up from the
estimated 82 MMT in MY15/16, in line with the USDA official March 2016 estimate. China’s imports
of U.S. soybeans reached 29.7 MMT in MY14/15, up 2.7 MMT over the previous year and accounted
for 38 percent of China’s total soybean imports. Imports from the United States are expected to stay
strong at about 30 MMT in MY16/17. However, U.S. soybeans still face fierce competition from South
American suppliers.
In addition, forecasting China’s meal and oil use and total oilseed demand continues to be a challenge
given the differing data on the domestic area and production for rapeseed and peanuts, soybean use as
food and direct use as feed, the production number of different feed and all animal products, and the
unknown volume of state reserve of soybeans and vegetable oils.

5
Oilseeds Situation and Outlook
Overall, China’s domestic oilseed production continues to decline while demand for oilseed products
surges ahead. Lower profits for rapeseed and cotton resulting from policy changes for these
commodities in MY14/15, and sluggish prices for both are expected to reduce the total oilseed planted
area by 2 percent to 21.87 MHa in MY16/17. Correspondingly, MY16/17 total oilseed production is
forecast down 2.1 percent from the previous year to 52.7 MMT. Future production prospects are further
dampened by the lackluster revenue of major oilseed crops as available acreage is increasingly planted
to more lucrative grain crops enjoying better government support. Furthermore, inadequate production
tools - from economies of scale, agronomic practices, technology resources and input quality - also limit
the potential for oilseed yield gains. Meanwhile, Chinese consumption of meats, seafood, and vegetable
oils and soybeans for food-processing continues its unrelenting growth, fueled by rising affluence,
urbanization, and expanding consumer preferences. In response to these dietary demands, China must
supplement its domestic oilseed resources with imports, primarily from Brazil, the United States,
Argentina and Canada.
Chart 1 – China’s Major Oilseed Production
(MY13/14 to MY16/17; in 10,000 tons)
1195 1215 1100 1120
1599 1650 1670 1680
1509 1477 1430 1350
1278 1176 936 870
0
2000
4000
6000
8000
MY13/14 MY14/15 MY15/16 MY16/17
Soybeans Peanuts Rapeseed Cottonseed Sunflowerseed
Estimates /forecast by FAS/Beijing
China’s cotton planted area is expected to fall by 9 percent in MY16/17 in response to a major change in
the government’s support policy implemented in MY14/15. This government policy cut most of the
support to farmers in the Yellow and Yangtze River regions while maintaining support to farmers in
Xinjiang. As a result, grain and cash crops are most likely to replace cotton in the Yellow and Yangtze
River regions. At the same time, MY16/17 Xinjiang cotton planting intentions appear to also be
declining as cotton earnings fell due to weak cotton prices in MY15/16. Similarly, MY16/17 rapeseed
planting area is also forecast to fall 4 percent in response to low returns as the government eliminated its
price support policy for rapeseed in MY15/16.
Soybean area is expected to increase moderately in MY16/17 in response to the government’s policy
change to limit grain crops. Lower corn earnings in major soybean producing-provinces are likely to
encourage some farmers to plant soybeans in MY16/17.
6
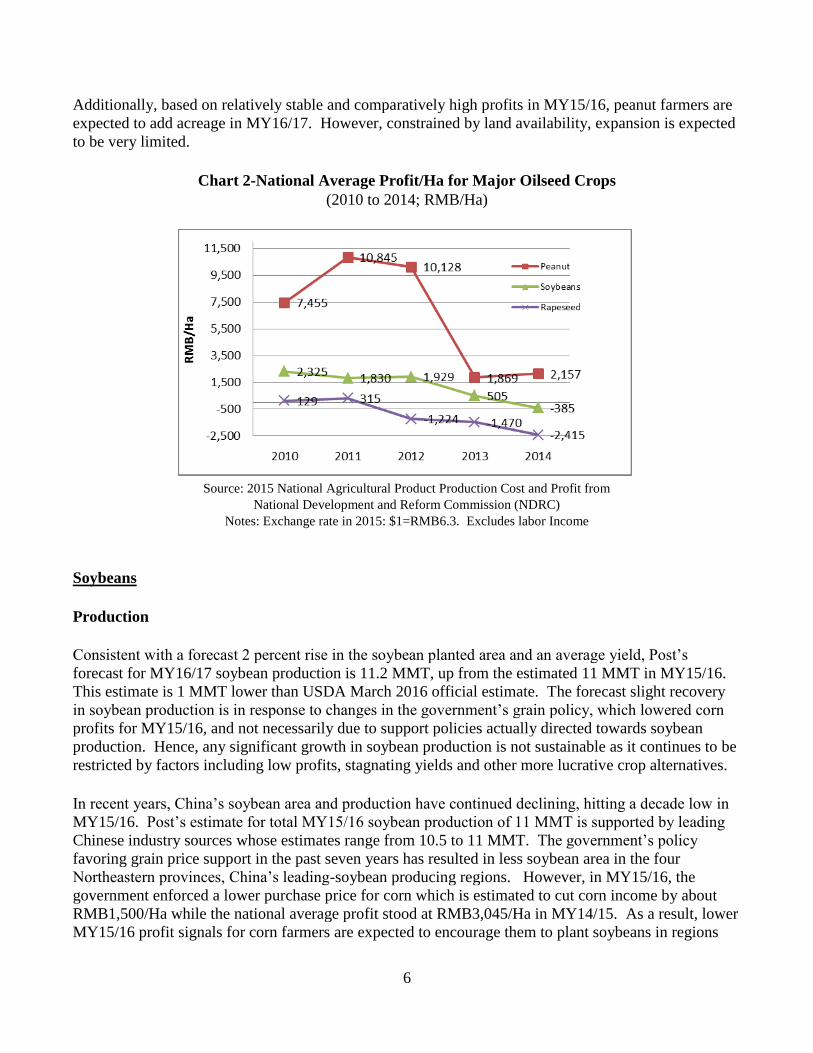
Additionally, based on relatively stable and comparatively high profits in MY15/16, peanut farmers are
expected to add acreage in MY16/17. However, constrained by land availability, expansion is expected
to be very limited.
Chart 2-National Average Profit/Ha for Major Oilseed Crops
(2010 to 2014; RMB/Ha)
Source: 2015 National Agricultural Product Production Cost and Profit from
National Development and Reform Commission (NDRC) Notes: Exchange rate in 2015: $1=RMB6.3. Excludes labor Income
Soybeans
Production
Consistent with a forecast 2 percent rise in the soybean planted area and an average yield, Post’s
forecast for MY16/17 soybean production is 11.2 MMT, up from the estimated 11 MMT in MY15/16.
This estimate is 1 MMT lower than USDA March 2016 official estimate. The forecast slight recovery
in soybean production is in response to changes in the government’s grain policy, which lowered corn
profits for MY15/16, and not necessarily due to support policies actually directed towards soybean
production. Hence, any significant growth in soybean production is not sustainable as it continues to be
restricted by factors including low profits, stagnating yields and other more lucrative crop alternatives.
In recent years, China’s soybean area and production have continued declining, hitting a decade low in
MY15/16. Post’s estimate for total MY15/16 soybean production of 11 MMT is supported by leading
Chinese industry sources whose estimates range from 10.5 to 11 MMT. The government’s policy
favoring grain price support in the past seven years has resulted in less soybean area in the four
Northeastern provinces, China’s leading-soybean producing regions. However, in MY15/16, the
government enforced a lower purchase price for corn which is estimated to cut corn income by about
RMB1,500/Ha while the national average profit stood at RMB3,045/Ha in MY14/15. As a result, lower
MY15/16 profit signals for corn farmers are expected to encourage them to plant soybeans in regions

7
where natural conditions traditionally favor soybeans. Given the huge corn stocks, the government is
also calling for more forage area including silage corn in Northeast and Northwest regions to ease the
pressure of the high government’s corn stocks.
Beginning in MY14/15, the government’s soybean subsidy program for the four Northeastern Provinces
changed from a “minimum/floor price procurement program” to a “target price-based direct subsidy.”
In the last two years, the target price remained at RMB4,800/ton and is unlikely to change in
MY16/17. Soybean farmers in the four Northeastern Provinces will continue to be compensated based
on the difference between the market price and the target price. However, the estimated subsidy to
farmers in MY15/16 (RMB900/Ha) indicates soybean profits continued to be at a disadvantage
compared to corn and rice.
Official data from the National Development Research Council (NDRC) estimated that in MY14/15,
farmer returns averaged negative $62/Ha for soybeans versus $198/Ha for corn. Specifically, in
Heilongjiang, the largest soybean-producing province, MY14/15 soybean profits (excluding labor) were
RMB465 ($75)/Ha, while corn profits stood at RMB3,045 ($491)/Ha and rice at RMB4,905
($791)/Ha. While the comparative profit ratio among these crops in Heilongjiang will not change
significantly in MY15/16, a decline in corn profits is inevitable. Crop alternatives to soybeans are
limited in some regions in Heilongjiang and Inner Mongolian provinces due to the shorter growing
days. Additionally, soybeans are more resilient to stand the cold weather than other more lucrative
crops.
Chart 3 - Heilongjiang Soybean Planted Area
And Net Profit for Soybeans and Alternative Crops (1,000 Ha; RMB/Ha)
Source: NDRC and MOA
Note: Excludes Labor Income
In general, the government support purchase price (corn, rice, cotton, soybeans) has been above the
world market price and cheaper soybean imports have placed downward pressure on domestic soybeans

8
prices. Agronomists caution that these artificial price distortions deter crop rotation and will eventually
lead to soil degradation and lower yields.
Chart 4 - State Purchase Floor Price for Soybeans and Rapeseed
VS Average Wholesale Soybean Price
(2009 to 2015; RMB/ton)
Source: State Grain Administration and China JCI (wholesale soy price); From 2014 soybean price is “target price”;
From 2015 state purchase of rapeseed at high floor price ended
Unlike the soybean farmers in the four Northeastern Provinces, farmers in other provinces are not
entitled to government target price support. However, in general, soybean profits in these provinces are
relatively higher than the four Northeastern Provinces as these products enjoy a premium for convenient
delivery and satisfy the local demand for soybean food use. From MY12/13 to MY14/15, soybean
production in these provinces remained stable ranging around 6 to 6.5 MMT per year. MY16/17
soybean planting intentions in the other provinces are projected not to change or go up slightly based on
estimated average profits in MY15/16.
Soybean farmers also continue to struggle to boost yields and productivity which have remained
constant for several years. Without access to the latest seed technology, Chinese soybean farmers face
major impediments to improve productivity, including small farm scale and inadequate agronomic
practices (such as the lack of proper crop rotation) which are unlikely to change significantly in the near
future. Over the last three years, soybean yield in China averaged 1.8 ton/Ha, compared to 2.9 ton/Ha in
the United States.
Stocks
Chinese official statistics for stocks are not publicly available. Although the government did not add
soybeans to its reserve stocks in MY15/16, a major industry source estimates that as of the end of 2015,
the soybean reserve is still high at about 8 MMT. Additionally, China’s record soybean imports of
78.35 MMT in MY14/15 also contributed to total carry-in stocks estimated at 17.3 MMT for MY15/16.
Depending on the domestic oilseed product market situation, the government may auction older stocks
as a means to stabilize any significant changes in domestic soybean supply and price. MY15/16 ending
stocks are expected to adjust down to 16 MMT. Given the government’s suspension of direct purchase

9
of domestic oilseeds while maintaining a moderate vegetable oil reserve as a market regulating tool,
MY16/17 soybean ending stocks are forecast at 14.2 MMT.
Trade
Imports
China continues to dominate the global soybean market and remains the largest importer of soybeans in
the world. China’s total imports of 78.35 MMT of soybeans in MY14/15 were equivalent to 60 percent
of total world exports, and 58 percent of total U.S. soybean exports. Soybean imports are expected to
continue on an upward trend driven by declining domestic production unable to meet growing
consumption.
Chart 5 – Chinese Imports of Soybeans over the Last Decade (MY04/05-MY14/15; 1,000 tons)
Source: Global Trade Atlas
The Chinese crushing industry’s demand for soybeans continues to be strong. In addition, economic
incentives are reportedly driving greater use of imported soybeans for food in the coastal provinces.
However, figures capturing this trend are not readily available. MY16/17 soybean imports are forecast
at 84.5 MMT, up 3 percent from an estimated 82 MMT in MY15/16. Adequate global soybean supplies
at lower prices stimulated MY14/15 imports to a record 78.35 MMT, up by 8 MMT over last year, and
contributed to relatively high ending stocks. It is worth noting that while crushing profits have
improved slightly since late 2015, following nine consecutive months of negative margins and total
losses in 2014, these remain unstable. This could lessen the crushing sector’s incentive to over import
in MY15/16.
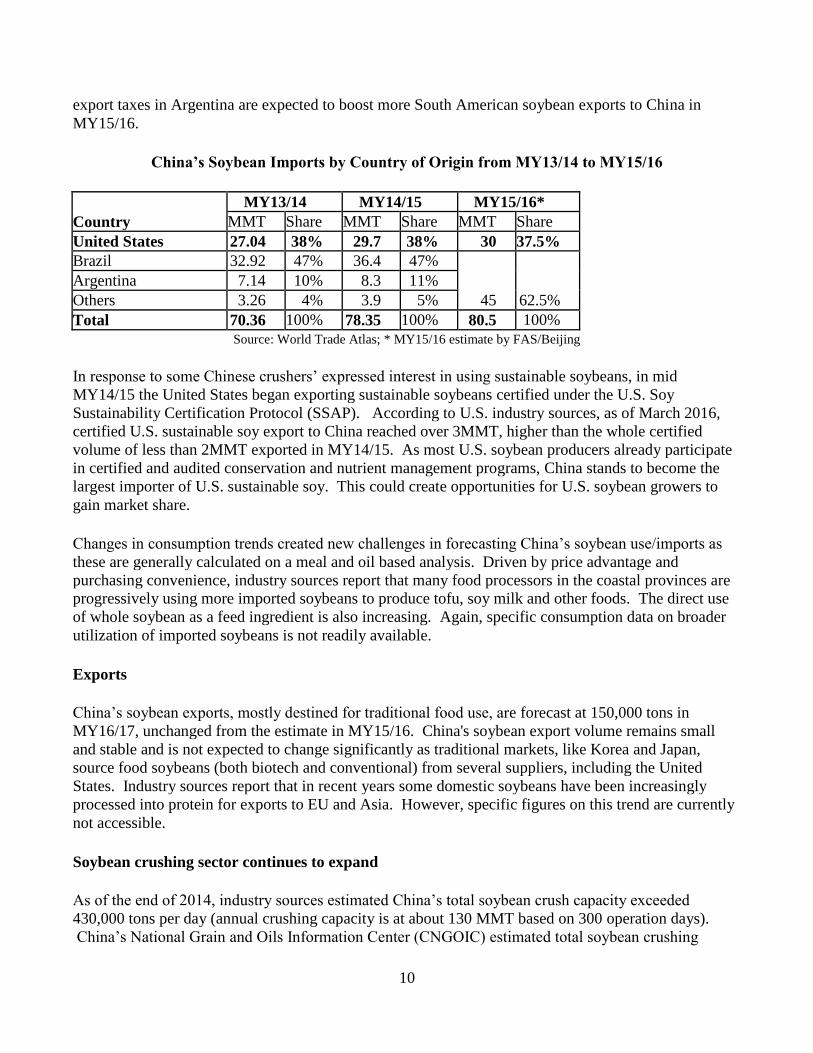
Brazil continued to be China’s largest soybean supplier in MY14/15 with total imports growing to 36.4
MMT and holding 46 percent share of the market. China’s imports of U.S. soybeans reached 29.7
MMT in MY14/15, up from 27.04 MMT in MY13/14. The weakening currency in Brazil and lower
10
export taxes in Argentina are expected to boost more South American soybean exports to China in
MY15/16.
China’s Soybean Imports by Country of Origin from MY13/14 to MY15/16
Country
MY13/14 MY14/15 MY15/16*
MMT Share MMT Share MMT Share
United States 27.04 38% 29.7 38% 30 37.5% Brazil 32.92 47% 36.4 47%
45 62.5%
Argentina 7.14 10% 8.3 11%
Others 3.26 4% 3.9 5%
Total 70.36 100% 78.35 100% 80.5 100% Source: World Trade Atlas; * MY15/16 estimate by FAS/Beijing
In response to some Chinese crushers’ expressed interest in using sustainable soybeans, in mid
MY14/15 the United States began exporting sustainable soybeans certified under the U.S. Soy
Sustainability Certification Protocol (SSAP). According to U.S. industry sources, as of March 2016,
certified U.S. sustainable soy export to China reached over 3MMT, higher than the whole certified
volume of less than 2MMT exported in MY14/15. As most U.S. soybean producers already participate
in certified and audited conservation and nutrient management programs, China stands to become the
largest importer of U.S. sustainable soy. This could create opportunities for U.S. soybean growers to
gain market share.
Changes in consumption trends created new challenges in forecasting China’s soybean use/imports as
these are generally calculated on a meal and oil based analysis. Driven by price advantage and
purchasing convenience, industry sources report that many food processors in the coastal provinces are
progressively using more imported soybeans to produce tofu, soy milk and other foods. The direct use
of whole soybean as a feed ingredient is also increasing. Again, specific consumption data on broader
utilization of imported soybeans is not readily available.
Exports
China’s soybean exports, mostly destined for traditional food use, are forecast at 150,000 tons in
MY16/17, unchanged from the estimate in MY15/16. China's soybean export volume remains small
and stable and is not expected to change significantly as traditional markets, like Korea and Japan,
source food soybeans (both biotech and conventional) from several suppliers, including the United
States. Industry sources report that in recent years some domestic soybeans have been increasingly
processed into protein for exports to EU and Asia. However, specific figures on this trend are currently
not accessible.
Soybean crushing sector continues to expand
As of the end of 2014, industry sources estimated China’s total soybean crush capacity exceeded
430,000 tons per day (annual crushing capacity is at about 130 MMT based on 300 operation days).
China’s National Grain and Oils Information Center (CNGOIC) estimated total soybean crushing

11
volume at 76 MMT in MY15/16, up from the 72 MMT in MY14/15. Both of these figures are far
below China’s total available crushing capacity. Despite the low utilization rate, the crushing sector
continues to undergo restructuring with new construction and expanded renovations to existing facilities
which is likely to raise daily crushing capacity in MY16/17.
Chart 6 – China’s Estimated Soybean Crushing Volume
Source: CNGOIC; Note: Includes crushing for oil and meal
An estimated 78 percent of crush plants are located along the coastal region to facilitate the receipt of
imported soybeans (see chart 7 below).
Chart 7 – MY13/14 and MY15/16 Soybean Crush Volume Estimate (MMT)
Source: CNGOIC
Policy

12
Recent Grain Policy Changes Likely to Impact Crop Mix
As noted above, soybean acreage is expected to recover slightly in MY16/17 due to the government’s
recent change in grain support policies.
In recent years, driven by the government’s policy encouraging grain production, China’s corn
production continued to grow and resulted in large, high-priced corn stocks. In an effort to ease the
stocks and financial pressure, the government lowered the purchase price to RMB2,000 ($317)/ton in
2015— RMB220 ($32) to RMB260 ($41)/ton lower than in the previous year. In November 2015, the
Ministry of Agriculture (MOA) released a guideline, instructing farmers to cut corn planting acreage by
50 million mu (or 3.67 MHa) in the “reaphook”- shaped regions by year 2020. This refers mostly to the
bordering regions between crop farming and ranchers in the Northeastern provinces and the dry and
windy regions in the Northwestern provinces. The program covers 13 provinces, with the major
adjustment areas located in the four Northeastern provinces. In a provincial rural work conference held
in late February, Heilongjiang claimed to reduce corn acreage by 10 million mu (or 667,000 Ha) in
2016.
Additionally, MOA called for less corn acreage through the rotation of cash crops, silage corn, potato
and soybeans. In 2015, MOA designated potato as a staple grain crop (in addition to rice, corn, and
wheat) and planned to expand potato area gradually. However, details on the specific plan are not yet
available. In addition, in January, NDRC announced a new round of subsidy programs to farmers for
returning terrace and slope farmland to forests and grass land.
Based on industry surveys, as a result of the fall in the government’s grain purchase price, corn profits
are still high but the profit gap between corn and soybeans is expected to be smaller than the previous
year and likely to encourage a modest increase in soybean acreage in the Northeastern provinces. It is
also possible that some farmers will switch from corn to crops like potato, silage corn, soybeans and
other cash crops in MY16/17.
Agriculture Subsidies
China’s agricultural and food security policies to stimulate grain production and yield include a wide
range of financial incentives. In 2012, China’s total comprehensive agricultural subsidies (including
direct payments to grain farmers based on acreage, and subsidies for agricultural inputs, agricultural
machinery, and seed) reached RMB165.1 billion ($26.2 billion), up from the $22 billion in 2011. Total
subsidies in 2013 through 2015 appear to be unchanged from the 2012 RMB value. However, the trial
implementation of the target price-based direct subsidy for soybeans and cotton may seemed to have
increased subsidies significantly but remains difficult to fully quantify.
Direct subsidies for soybeans will continue in MY16/17

13
Historically, soybean farmers in the Northeastern region have benefited financially from the
government’s “minimum price procurement” program. During MY14/15, in an effort to maximize the
effectiveness of its support policy, the central government enforced a trial program in the four northeast
provinces (Heilongjiang, Jilin, Liaoning and Inner Mongolia) giving direct subsidies to soybean farmers
based on a target price of RMB4,800 ($762)/ton. Under this system, farmers receive a subsidy
representing the difference between the market price at harvest and the set target price. The central
government provides funds to the four provinces on a production basis. The provincial government
then distributes the subsidy to each individual farmer based on the certified planted area before the end
of following April.
According to industry sources, the direct subsidy stood at about RMB900 ($143)/Ha in MY14/15 in
Heilongjiang Province and is estimated to be similar in MY15/16. The impact of this soybean subsidy
program on soybean planting seems to be very limited in MY16/17 as soybean profits continue to be at
a disadvantage and as soybean productivity remains unchanged. For these reasons, while recent
changes in grain policies may have encouraged soybean planting supporting slightly higher soybean
production estimates for MY15/16 and the forecast for MY16/17, significant increases in soybean
production are not sustainable in the long run. Notwithstanding, the direct subsidy policy for soybeans
is expected to continue in MY16/17.
Import policy on biotech approval system adds uncertainty to soybean trade
China’s non-biotech derived domestic soybean production policy remains unchanged. Domestic
soybeans (non-biotech soybeans or soybean protein) are targeted primarily for food use and some are
exported at a premium to European and Asian markets.
Regarding imported biotech products, MOA maintains an approval system for biotech varieties and
renews the list on a periodic basis. However, the approval system lags behind the pace of international
commercialization of new events and adds uncertainty to the soybean trade. The rejection of U.S. corn
and distiller grain shipments to China in 2014 due to China’s detection of unapproved biotech events
resulted in serious trade interruptions in corn trade. USDA continues to work closely with China's MOA
requesting the streamlining of China’s approval process as market access is key for trading partners and
critical for China's price stability and food security. In addition, China has not yet established a
tolerance level for the adventitious presence of unapproved biotech events in imports of bulk grain and
products. Although there were no reported disruptions to U.S. soybeans to China, please consult the
China’s Biotechnology Annual Report for additional information on China’s biotechnology policy and
for an updated list of China’s approved biotech events.
AQSIQ Administrative Measures for the Inspection and Quarantine for the Entry and Exit of
Grain and Oilseeds
In early 2016, AQSIQ announced its final Administrative Measures regarding the Inspection and
Quarantine for the Entry and Exit of Grain and Oilseeds also referred to as AQSIQ Decree 177 (see
GAIN translation report). These measures introduce onerous Decree 118-like registration requirements
on bulk commodities, including inspections. After submitting detailed comments through the World
Trade Organization in 2015, the United States and the U.S. industry have repeatedly expressed their
concerns to Chinese officials regarding the potential trade implications of this measure. As new-to-

14
market grain exporting countries are already being grandfathered into the new administrative measures,
it is unlikely that these measures will change before going into effect on July 1 2016. The United
States and other major grain and oilseed exporting countries continue to engage China on this issue.
USDA and AQSIQ Continue Cooperation
In 2012, USDA and China’s General Administration for Quality Supervision, Inspection and Quarantine
(AQSIQ) signed a Memorandum of Understanding (MOU) to increase bilateral cooperation in the
inspection and quarantine of U.S. Soybeans Exported to China. As a result, USDA and AQSIQ have
conducted joint soybean vessel inspection programs first in March 2013 and two more recently in
November 2014. Information exchange continued throughout 2015 and a fourth joint program is
envisioned for the fall of 2016. These programs continue to enhance understanding of inspection
systems, quarantine standards, procedures and testing methodologies in both countries. This bilateral
cooperation in the areas of inspection and quarantine has significantly facilitated U.S. soybean trade to
China.
The Impact of China-ASEAN Free Trade Zone on Oils Trade Remains Limited
The China-ASEAN Free Trade Agreement (CAFTA) was enacted on January 1, 2010. Under the
Agreement, import duties on more than 90 percent of goods imported to China from ASEAN countries
were eliminated. According to the 2016 Customs Import and Export Tariffs of China, the duties for
palm oil, palm kernel oil, and copra oil remain unchanged from the previous year at 9 percent. In
general, Chinese imports of palm oil from ASEAN countries are not expected to grow significantly
given the ample supplies of lower-priced domestic crushed soybean oil and rapeseed oil.
Marketing
Despite the government’s high target soybean price of RMB4,800 ($762)/ton in MY15/16, the actual
subsidy payment is not likely to reach farmers until the end of April 2016. This has delayed the
marketing of the MY15/16 crop. As the marketing price remained well below the target price currently
at RMB3,800 ($603) to 4,000 ($635) /ton, farmers are holding on to their soybeans waiting for a better
price. According to industry sources, as of mid-February 2016, the marketing rate of the MY15/16 crop
in the major soybean-producing province, Heilongjiang, was only about 50 percent compared to the
typical 80 percent. The majority of soybeans were sold for food processing. The purchase of domestic
soybeans for crushing remained low given the price and quality advantages of imported soybeans.
In many coastal provinces, the marketing of domestic soybeans for food use is also increasingly
challenged by the use of imported soybeans. Traders of domestic soybeans for food use are usually
small to medium size operations and face difficulty in consolidating soybeans from households and
villages. Improved highway systems and increased volume of trucked soybeans could facilitate
redistribution but would do little to address lower domestic supplies.
Rapeseed
15
Production
Due to low profits and the elimination of the government’s price support, MY16/17 rapeseed production
is forecast to fall by 4 percent to 13.5 MMT. This is based on planted area reduction of 6 percent to 7
MHa compared to the previous year. MY15/16 rapeseed production is estimated at 14.3 MMT, slightly
above the USDA March 2016 official data, but lower than the Chinese official production for MY14/15
of 14.77 MMT. MY15/16 rapeseed earnings declined nationwide as the government’s ended its state
purchase of rapeseeds at a higher floor price (see Chart 4). The Statistics Bureau in Hubei, the largest
rapeseed producing-province, estimates that MY15/16 rapeseed output value declined by 19 percent and
profit margins dropped by 38 percent over the previous year. Similarly, CNGOIC estimated MY16/17
rapeseed planted area down 10-20 percent from the preceding year. Meanwhile, MY16/17 spring
rapeseed area in the northwest provinces is projected to be generally stable. In addition, growth in the
MY16/17 winter crop is rated as slightly below average due to cold weather conditions in early 2016.
However, according to China’s National Statistics Bureau (NSB), the MY15/16 summer harvested
rapeseed production was 13.88 MMT, up 1.2 percent over the previous year. If the autumn harvested
crop production stands at an average 1MMT, the total MY15/16 rapeseed production is expected to be
14.9 MMT. Most industry insiders believe the actual rapeseed production is lower than the current
official data based on firsthand anecdotal information from farmers and the market.
China’s government has encouraged rapeseed farming as it uses winter idle land and lessens the
competition for land with other grain crops. Although the official production estimate shows a stable to
growing trend, many Chinese industry sources observe that the official data appears too high. That said,
industry source do not have the ability to survey millions of households in many provinces to support
more reliable statistical data.
Trade
Rapeseed imports in MY16/17 are forecast to recover to 4.5 MMT from the estimated 4.2 MMT in
MY15/16 mostly on a forecast low domestic supply. As the result of a weak demand and relatively
tight global supply, MY15/16 rapeseed imports are estimated low at 4.2 MMT compared to record
imports of 5.04 MMT in MY13/14. This record was mainly driven by the rapid expansion of China’s
crushing capacity particularly along the coastal provinces of Fujian, Guangdong and Guangxi, coupled
with a widespread recognition of lower-than-reported domestic production. Taking into consideration a
declining domestic production, China’s industry analysts believe rapeseed imports will continue to be
relatively stable to meet the demand for rapeseed products and satisfy the domestic crushing capacity.
Crushing Capacity
CNGOIC estimates China’s current rapeseed crushing capacity surpasses 40 MMT per year (some
plants crush both rapeseed and soybeans), with a utilization rate of less than 40 percent. Guangdong,
Guangxi and Fujian provinces have added new crushing plants which contributed to 6 MMT more of
crushing capacity in 2014. These facilities primarily utilize imported rapeseeds. Given the current low
prices for oil and meal resulting in negative crushing margins, investors will have less incentive to
expand the crushing capacity further in MY15/16 and MY16/17.

16
Policy
The government stopped its price support to rapeseed production in MY15/16 (although some provinces
provided some limited subsidy to farmers) and rapeseed prices decreased dramatically. Government
policies used to encourage rapeseed production through a “minimum price purchase program” and a
direct seed subsidy. In MY14/15, the government maintained the rapeseed purchase floor price at
RMB5,100/ton (or $822/ton, Chart 4), significantly higher (about RMB800 to 1,000/ton) than the price
for imported rapeseed. Currently, the government maintains a planting seed subsidy of RBM150
($24)/Ha to farmers.
Citing phytosanitary concerns, China’s rapeseed import policy restricting entry of imports to only non-
rapeseed producing regions remains unchanged. However, the recent establishment of rapeseed
crushing plants in non-rapeseed areas (namely Guangdong, Guangxi and Fujian provinces as stated
above), has minimized this policy’s impact on imports from China’s two major suppliers, Canada and
Australia. Additionally, AQSIQ has reached similar agreements with Russia and Mongolia on rapeseed
imports for crushing.
Peanuts
Production
MY16/17 peanut production is forecast at 16.8 MMT, recovering slightly from the estimated 16.7 MMT
in MY15/16. Prior to MY13/14, strong domestic demand and favorable prices made peanuts a favorite
crop among farmers. However, the rapid production growth, coupled with increased supply of other
more competitively-priced oilseed products contributed to a peanut price slump in late 2013.
Correspondingly, in response to profit fluctuations, total MY14/15 peanut production fell to 16.5 MMT
(see Chart 2). Tighter domestic supplies in MY14/15 pushed peanut prices up and led peanut farming
profits to exceed that from other cash crops in the large peanut-producing provinces (namely Henan,
Shandong and Hebei) in MY15/16. In general, steady increases in demand for peanut products both as
food (various snacks and milk etc) and for cooking (oil) encourage vigorous peanut production but
additional gains are constrained by limited land resources.
CNGOIC: Top Five Peanut Producing Provinces (Area: 1,000 Ha & Prod: 1,000 tons)
MY MY13/14 MY14/15 MY15/16
Area Production Area Production Area Production
Henan 1,037 4,714 1,058 4,713 1,090 4,750
Shandong 780 3,457 755 3,313 780 3,350
Hebei 356 1,301 353 1,292 360 1,300
Liaoning 342 1,113 306 620 300 900
Anhui 187 887 190 944 195 960
Nation 4,633 16,972 4,603 16,482 4,700 16,900
Nation Yield Kg/Ha
3,663 3,581 3,596

17
Note: Data based on CNGOIC
Trade
Imports
Imports of peanuts for food use are low due to sufficient domestic supplies. However, Chinese peanut
imports, used mostly for crushing, have gone up to 161,000 tons in MY14/15. Senegal is the main
peanut supplier as China has exempted duties on imports from the country. Additionally, Senegal
peanut prices remain very competitive over other suppliers such as Argentina, India and the United
States. Imports could potentially increase as China’s imports of peanut oil skyrocketed to 141,000 tons
in MY 14/15 from the average 70,000 tons in previous years. In addition China’s large crushing sector
favors imports of oilseed. That said, China imposes a 15 percent import duty and 13 percent value
added tax (VAT) on peanut imports which still hinders the competiveness of U.S. peanut imports in the
Chinese market.
Exports
Chinese peanut exports are expected to grow to 510,000 tons in MY 16/17, from the estimated 500,000
tons in MY15/16. A slight growth in production may strengthen exports in search for better profits.
Furthermore, strong domestic demand together with strict import conditions in some major export
markets will impede any significant growth in exports.
Policy
Beginning in MY 10/11, in an effort to stimulate production and improve the domestic self-sufficiency
rate for vegetable oil, the Chinese government implemented a planting seed purchase subsidy program
for peanuts of about RMB150 ($24)/Ha. As of this report, there have been no other major significant
policy changes.
Cottonseed
Production
Cottonseed production in MY16/17 is forecast to fall to 8.7 MMT, down from the estimated 9.36 MMT
in the previous year. The cotton planting area is expected to decline in MY16/17 in response to lower
profits resulting from changes in government policy since MY14/15. During this year, the four-year-old
“minimum price cotton purchase program” was replaced by a “target price-based direct subsidy”. The
new policy favors farmers in Xinjiang rather than farmers in the Yangtze River and Yellow River
regions. Hence, MY15/16 planted area declined sharply, particularly in the Yangtze River and Yellow
River regions.
According to reports on the policy implementation, MY15/16 cotton profits declined and were
reportedly negative in both Shandong and Jiangsu provinces due to increased labor costs and smaller

18
output value. A survey by the Xinjiang government indicated that MY15/16 cotton output value went
down 21 percent over the previous year while production cost increased only slightly. Based on similar
subsidy rate of RMB500 to 540/ Mu ($1153 to 1250/Ha), net profits will fall significantly from
MY14/15 or be negative after land rental is deducted. MY16/17 “target price” (not yet announced)
may remain unchanged from previous year at RMB19,100 ($2,938)/ton.
A survey conducted by the China Cotton Association indicated that overall MY16/17 cotton planting
intentions are down 11.6 percent. Specifically, planting intentions were down 9.1 percent in Xinjiang,
down 19 percent in Yellow River region, and 14. 3 percent lower in the Yangtze River region. Thus,
Post forecasts MY16/17 cotton seed production to fall to 8.7 MMT from the 9.36 MMT estimate in
MY15/16. This is based on a 9 percent reduction in acreage.
Trade
China’s domestic cotton seed production continues to fall but total volume remains comparatively high.
Nonetheless, increased uses for cottonseed, such as in mushroom farming, have supported cottonseed
imports before MY13/14. Given the adequate supply of other oilseed products at competitive prices,
sporadic imports of cottonseed may continue in MY15/16 and MY16/17. Imports of U.S. cottonseed
must complete a Pest Risk Assessment before gaining access to the Chinese market. Currently, USDA
continues to engage China’s import authority on this process.
Other oilseeds
The camellia planting in southern provinces is booming. In December 2014, China’s State Council
published a Notice on the Development of Woody Oilseed Plants. The Notice aims to boost oil from
woody plants to 1.5 MMT by 2020 from the estimated 450,000 tons in 2013. It also plans to develop
woody oilseed plants in 800 counties and increase planted area to 13.3 MHa from the current 8 MHa.
Woody oilseed plants include camellia, walnut, and oil peony. Grown mainly on hilly lands in southern
provinces of Hunan, Jiangxi and Guangxi, these woody plants pose no competition for arable land.
Oilseed Meal Situation and Outlook
Total Meals
MY16/17 protein meal (including fish meal) production is forecast at 85.1 MMT, up 2 percent over the
83.4 MMT during the previous year. This rise is attributable to the increased crushing of imported
soybeans. MY16/17 total protein meal supply is forecast to reach 86.3 MMT. This forecast includes 1.2
MMT of meal imports, primarily fish meal.
Total protein meal consumption in MY16/17 is forecast at 84.4 MMT, up 1.64 MMT or 2 percent over
MY15/16 due to steady demand from the livestock and aquaculture sectors for industrialized feed.
Soybean meal (SBM) continues to dominate the protein meal sector, accounting for 76 percent of total
meal consumption followed by rapeseed meal at 13 percent and cottonseed meal at 3.6 percent.
19
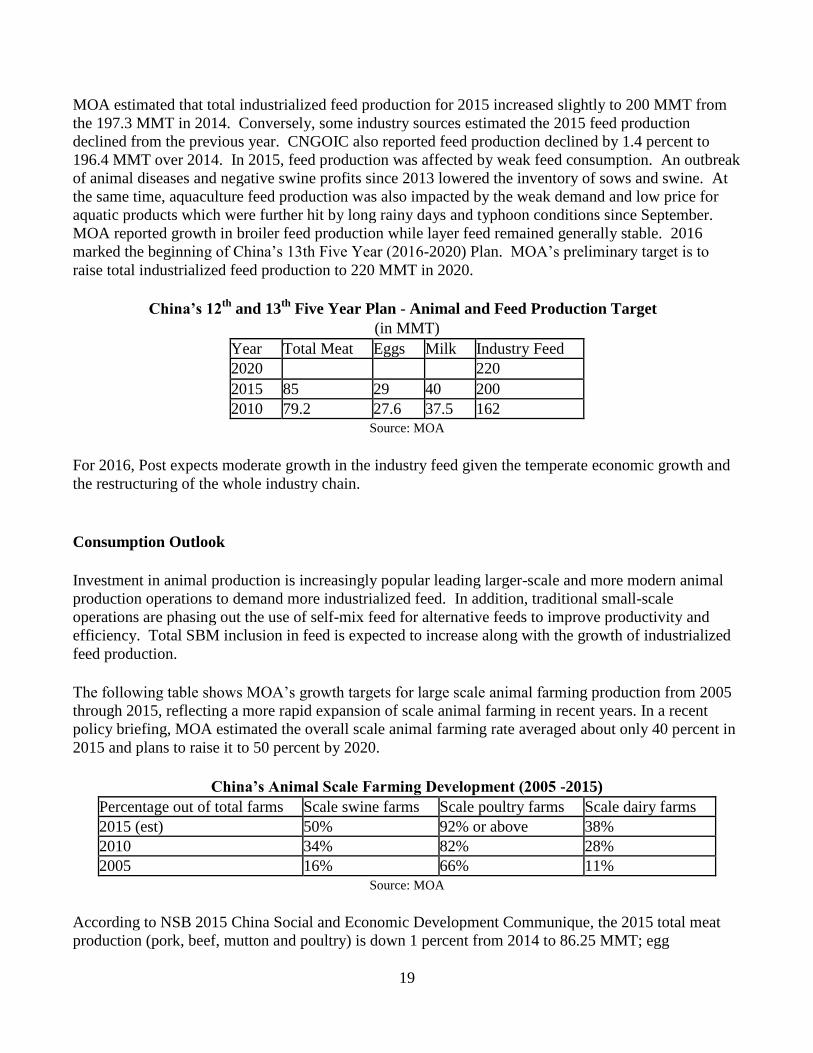
MOA estimated that total industrialized feed production for 2015 increased slightly to 200 MMT from
the 197.3 MMT in 2014. Conversely, some industry sources estimated the 2015 feed production
declined from the previous year. CNGOIC also reported feed production declined by 1.4 percent to
196.4 MMT over 2014. In 2015, feed production was affected by weak feed consumption. An outbreak
of animal diseases and negative swine profits since 2013 lowered the inventory of sows and swine. At
the same time, aquaculture feed production was also impacted by the weak demand and low price for
aquatic products which were further hit by long rainy days and typhoon conditions since September.
MOA reported growth in broiler feed production while layer feed remained generally stable. 2016
marked the beginning of China’s 13th Five Year (2016-2020) Plan. MOA’s preliminary target is to
raise total industrialized feed production to 220 MMT in 2020.
China’s 12th
and 13th
Five Year Plan - Animal and Feed Production Target
(in MMT)
Year Total Meat Eggs Milk Industry Feed
2020 220
2015 85 29 40 200
2010 79.2 27.6 37.5 162 Source: MOA
For 2016, Post expects moderate growth in the industry feed given the temperate economic growth and
the restructuring of the whole industry chain.
Consumption Outlook
Investment in animal production is increasingly popular leading larger-scale and more modern animal
production operations to demand more industrialized feed. In addition, traditional small-scale
operations are phasing out the use of self-mix feed for alternative feeds to improve productivity and
efficiency. Total SBM inclusion in feed is expected to increase along with the growth of industrialized
feed production.
The following table shows MOA’s growth targets for large scale animal farming production from 2005
through 2015, reflecting a more rapid expansion of scale animal farming in recent years. In a recent
policy briefing, MOA estimated the overall scale animal farming rate averaged about only 40 percent in
2015 and plans to raise it to 50 percent by 2020.
China’s Animal Scale Farming Development (2005 -2015)
Percentage out of total farms Scale swine farms Scale poultry farms Scale dairy farms
2015 (est) 50% 92% or above 38%
2010 34% 82% 28%
2005 16% 66% 11% Source: MOA
According to NSB 2015 China Social and Economic Development Communique, the 2015 total meat
production (pork, beef, mutton and poultry) is down 1 percent from 2014 to 86.25 MMT; egg

20
production is up 3.6 percent to 29.99 MMT; and milk (cow) production is up 0.8 percent to 37.55 MMT.
With the exception of milk, both total meat and egg production exceeded the 2015 targets set by the
“12th
- Five Year Plan”. Out of the total meat production, 2015 pork production is down 3.3 percent
from the previous year to 54.87 MMT. In addition, aquaculture continues to grow with total cultured
seafood products estimated at 49.42 MMT (out of a total seafood production of 66.9 MMT), up 4.1
percent over the previous year.
The following table shows an estimate of feed needed for pork, egg and poultry meat production based
on a normal feed conversion rate. The estimated feed needed to produce these three animal products are
on average 11 MMT higher than the MOA feed production even when including feed for aquaculture
and other feeds. China’s total feed consumption largely exceeds the MOA official feed production if all
major animal product production is included. This signals potential for higher feed demand, greater feed
production, and consequently greater demand for oilseed crushing.
Feed Demand Estimates Based on Major Animal Products Volume
(in MMT)
Pork Eggs Poultry Meat Feed Demand Estimate MOA feed production**
2015 54.87 29.99 18.26 272.5 262
2014 56.71 28.94 18.00* 274.9 261.8
2013 54.93 28.76 17.98 269.1 259.0
2012 53.43 28.61 17.78* 263.8 262.3 Note: Feed conversion rate for Pork - 3:1 and for Eggs -2.5:1; Poultry -1.8:1; *FAS/Beijing Estimates;
**Compound feed production and concentrate converted to compound equivalent production Source: Pork, egg and poultry data is based on NSB
The chart below reflects growth trends for China’s animal and aquaculture production and industrialized
feed from 2011 to 2015.
Chart 8 - Production of Industrialized Feed and Animal Products (2011-2015; MMT)

21
Source: NSB Statistics Yearbook Table 12-14/15; 2015-NSB Report and FAS/Beijing Estimate
The rise in protein meal demand is attributable to an increased use of industrialized feed for these
growing animal producing sectors. Although NSB reported a fall in meat production during 2015, total
feed production showed stable growth implying advancement in animal farming demanding more
nutritional balanced feed. Despite increasing environmental challenges and pressure from imports of
livestock products, Post forecasts a modest growth in production and consumption of animal products in
coming years. This is based on a normal GDP growth (slowed down but still forecast at above 6.5
percent in 2016) and an increase in population. It is also important to note that China’s aging
population seems to temper consumption growth of animal products and imports of these products may
further limit big expansions in the domestic animal farming industry.
MY16/17 protein meal consumption is forecast at 84.4 MMT, up 2 percent, or a net increase of 1.6
MMT (or SBM equivalent 1.83 MMT) over the previous year, with a net increase of SBM consumption
at 2.3 MMT. Cottonseed meal and rapeseed meal consumption is expected to decline as a result of lower
domestic supplies.
According to the NSB, China’s per capita consumption of meats stood at 33.6 Kg and the per capita
consumption of milk and dairy products remained low at 12.6 Kg in 2014. The meat consumption is far
less than nearby markets such as Taiwan, whose per capita consumption of combined pork and poultry
stood at 71.2 Kg in 2011 (Taiwan Grain and Feed Annual 2013). Additionally, annual per capita
consumption of meats, eggs and seafood continued to differ between urban and rural communities by an
average of 18.5 Kg in 2014. Potential increases in protein consumption among the 618.66 million
people living in rural areas (out of the 1,367.82 million according to the 2015 China Statistical
Yearbook) open opportunities for higher protein meal demands.
Chart 9 - Comparison of Urban and Rural per Capita
Animal Products Consumption (in Kg)
Source: 2015 China Statistics Yearbook
Overall increases in meat and seafood demand are also fueled by population growth and urbanization.
According to the NSB, China’s average annual net population growth was 6.5 million from 2008 to
2013 and net population growth was 7.1 million in 2014. The government’s amendment to the “one
22
child policy” in 2016 is expected to eventually increase population. Additionally, the rapid urbanization
continues with annual growth in urban populations averaging 21.42 million from 2008 to 2013, with 18
million new urban residents added in 2014. Greater demand for meats and seafood will continue to fuel
animal production and the need for feed. Potential growth along the value chain signals encouraging
prospects for oilseed meals in the coming years.
Protein meal use is also likely to receive a boost by fewer imports of distiller's dried grains (DDGS) in
MY15/16 and beyond. On December 15, 2015, China formally accepted a petition from Chinese
producers of DDGS seeking anti-dumping duties on imports of the feed ingredient from the United
States. MY14/15 total DDGs imports of 5.6 MMT were utilized as both energy and protein ingredients
in the feed industry.
Except fish meal, protein meal trade showed an unstable trend in recent years. Sporadic imports/exports
of some protein meals will continue in the foreseeable future. Both feed mills and crushing plants may
choose to trade between nearby countries rather than domestic provinces to regulate the regional
supply/demand. Market price difference, cost effectiveness and more importantly the transport
convenience are factors impacting trade decision. Except SBM exports, total trade volume of other
oilseed meals are expected to be insignificant in China’s huge protein meal matrix.
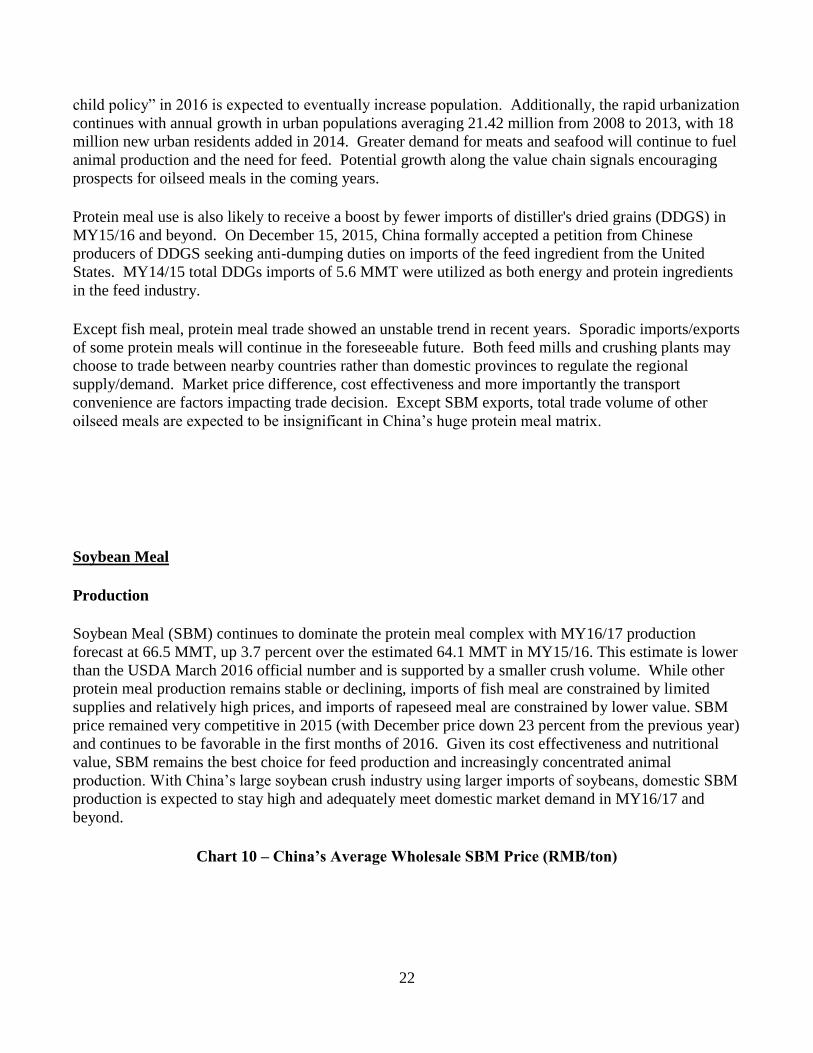
Soybean Meal
Production
Soybean Meal (SBM) continues to dominate the protein meal complex with MY16/17 production
forecast at 66.5 MMT, up 3.7 percent over the estimated 64.1 MMT in MY15/16. This estimate is lower
than the USDA March 2016 official number and is supported by a smaller crush volume. While other
protein meal production remains stable or declining, imports of fish meal are constrained by limited
supplies and relatively high prices, and imports of rapeseed meal are constrained by lower value. SBM
price remained very competitive in 2015 (with December price down 23 percent from the previous year)
and continues to be favorable in the first months of 2016. Given its cost effectiveness and nutritional
value, SBM remains the best choice for feed production and increasingly concentrated animal
production. With China’s large soybean crush industry using larger imports of soybeans, domestic SBM
production is expected to stay high and adequately meet domestic market demand in MY16/17 and
beyond.
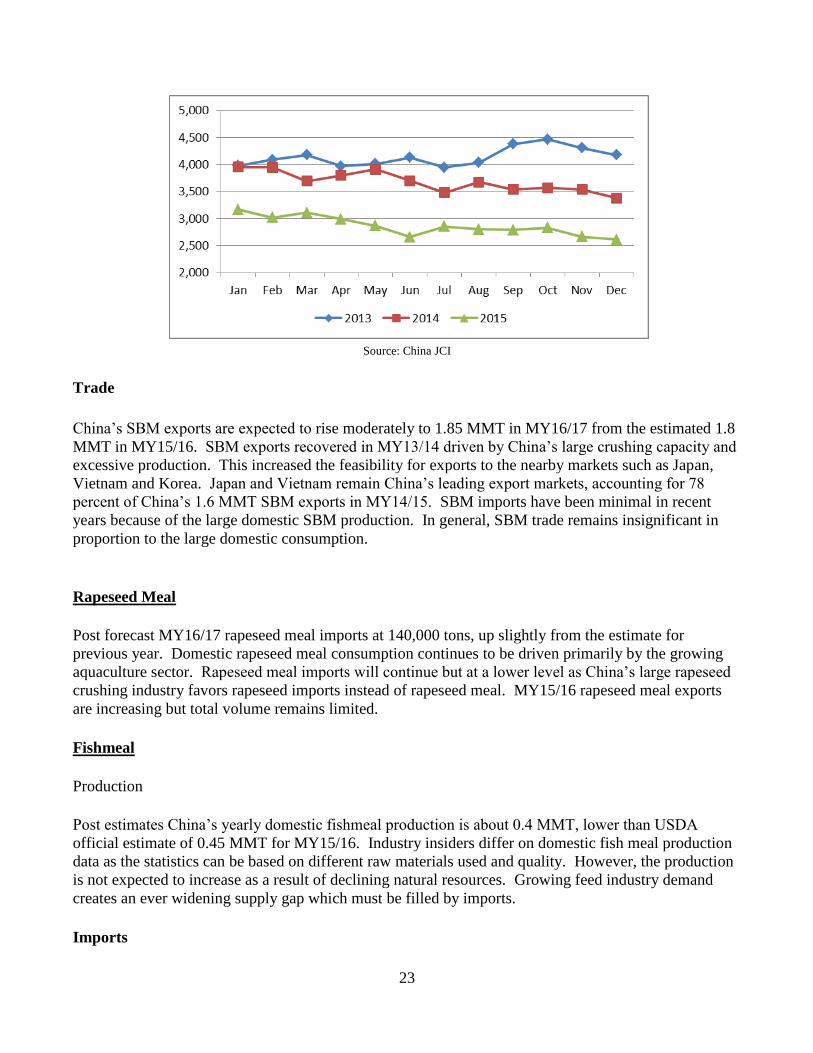
Chart 10 – China’s Average Wholesale SBM Price (RMB/ton)
23
Source: China JCI
Trade
China’s SBM exports are expected to rise moderately to 1.85 MMT in MY16/17 from the estimated 1.8
MMT in MY15/16. SBM exports recovered in MY13/14 driven by China’s large crushing capacity and
excessive production. This increased the feasibility for exports to the nearby markets such as Japan,
Vietnam and Korea. Japan and Vietnam remain China’s leading export markets, accounting for 78
percent of China’s 1.6 MMT SBM exports in MY14/15. SBM imports have been minimal in recent
years because of the large domestic SBM production. In general, SBM trade remains insignificant in
proportion to the large domestic consumption.
Rapeseed Meal
Post forecast MY16/17 rapeseed meal imports at 140,000 tons, up slightly from the estimate for
previous year. Domestic rapeseed meal consumption continues to be driven primarily by the growing
aquaculture sector. Rapeseed meal imports will continue but at a lower level as China’s large rapeseed
crushing industry favors rapeseed imports instead of rapeseed meal. MY15/16 rapeseed meal exports
are increasing but total volume remains limited.
Fishmeal
Production
Post estimates China’s yearly domestic fishmeal production is about 0.4 MMT, lower than USDA
official estimate of 0.45 MMT for MY15/16. Industry insiders differ on domestic fish meal production
data as the statistics can be based on different raw materials used and quality. However, the production
is not expected to increase as a result of declining natural resources. Growing feed industry demand
creates an ever widening supply gap which must be filled by imports.
Imports

24
Fishmeal imports are projected at 1.05 MMT in MY16/17, unchanged from the MY15/16. Reflecting
China’s average consumption level for fish meal by the large and expanding aquaculture sector and a
small domestic production, Post’s estimate for MY15/16 imports is higher compared to the USDA
official estimate of 0.95 MMT. Total fish meal imports are forecast to be stable at 1.05 MMT in
MY16/17 given the large size of China’s animal and aquaculture industry. China’s fish meal import
growth is increasingly constrained by a stagnant global fish meal supply and strengthening price. In
2015, Peru remained China’s largest fishmeal supplier at 538,000 tons and accounted for 52 percent of
China’s total fish meal imports. Imports from the United States in 2015 fell to 91,900 tons from
110,000 tons in 2013, most likely due to higher prices (higher-grade U.S. fish meal averaged $1,883/ton
compared to world average at $1,744/ton).
Oil Situation and Outlook
Post’s forecast of MY16/17 total vegetable oil consumption is up 1.7 percent (or net growth of 564,000
tons) to 33.7 MMT over the previous year. China’s high GDP growth at 6.9 percent in 2015 and
forecast at above 6.5 percent in 2016 continues to add disposable income to consumers. Fast
urbanization and population growth fuels demand for more vegetable oil. Despite the government’s
restrictions on spending public budget on banquets/meals, China’s catering industry revenue maintained
high growth in 2015, up 11.7 percent over the previous year.
MY16/17 total oil supply is forecast at 37.4 MMT, slightly above the estimate for MY15/16. Given the
increased use of imported soybeans and rapeseed for crushing, total vegetable oil production for
MY16/17 is forecast at 25.5 MMT, up 173,000 tons from the MY15/16 estimate. Soybean oil will
continue to be the primary vegetable oil, accounting for 59 percent of total oil production, followed by
rapeseed oil (24.4 percent), peanut oil (10.8 percent), and cottonseed oil (3.9 percent) in MY16/17. It is
worth noting that China’s combined production of specialty oils including camellia oil and sesame oil
and other small oil such as corn oil and rice oil is increasing along with diversified consumer demand
and also taking market share from other vegetable oils.
Chart 11 - MY16/17 Share of Vegetable Oil Consumption Forecast
Source: Forecast by FAS/Beijing

25
MY16/17 domestic consumption of oil for food-use is forecast to grow 1.7 percent from MY15/16 to
31.6 MMT. Similarly, domestic consumption of oil for industrial use is forecast to increase by 2.4
percent to 2.1 MMT in MY16/17.
MY16/17 total oil imports are forecast at 7.92 MMT, almost unchanged from the previous year. In
general, adequate domestic vegetable oil availability will hamper import growth of vegetable oil except
specialty oils such as palm oil (not produced domestically), sunflower seed oil (domestic supply limited)
and olive oil etc. Palm oil continues to dominate vegetable oil imports and is forecast to rebound
moderately to 5.65 MMT in MY16/17. Palm oil import growth is increasingly impacted by adequate
supply of other vegetable oils at more competitive prices and stagnant use by the instant noodle
industry.
Taking into account the strong forecast for imports of soybeans and rapeseed, in MY16/17 imports of
both soybean oil and rapeseed oil are forecast to hold steady at 700,000 tons and 730,000 tons,
respectively. Imports of soybean oil and rapeseed oil are not expected to lead imports but only to make
up supply differences when prices for imported oil are competitive.
The wholesale price for soybean oil and rapeseed oil remained generally stable in 2015 while that for
palm oil declined 10 percent from January to December 2015. The price difference between palm oil
and soy oil (Grade1) expanded to 25 percent in December from the 14 percent in January, signaling an
advantage for palm oil to gain market share.
Chart 12 – 2015 Wholesale Price for Major Vegetable Oils (RMB/ton)
Source: China JCI
It is should be mentioned that forecasting trends in China’s vegetable oil market remains challenging
given the differing data on domestic rapeseed and peanut production and unknown volume of vegetable
oil reserves. Based on currently available data, the forecast for China’s per capita vegetable oil
consumption in MY16/17 appears to have reached the level of more industrialized economies such as
Taiwan. This appears to be an overestimation and not necessarily an accurate representation of the
actual market situation. If the volume of domestic rapeseed and peanut for crushing continues to be
overestimated, forecasting China’s vegetable oils will present an even greater challenge in the coming
years. Additionally, monitoring the movement of vegetable oil reserves remains extremely difficult.
Currently, industry sources estimate that the state rapeseed oil and soybean oil reserves range from 6 to

26
8 MMT. The majority of these reserves have been in storage for over 2 years. From time to time, the
government rotates (purchases or sells) oil reserves to regulate the domestic vegetable oil supply and
price. Based on a recent CNGOIC report, since December 2015, the government resumed auctions of
rapeseed oil reserves. As of this report, in 13 auctions held, a total of 784,000 tons of rapeseed oil
reserves had been sold –most of which were from the 2010 and 2011 stocks. However, CNGOIC
reported that about 400,000 tons of the reserves purchased by refineries during January to February are
still sitting in state warehouses. This reflects a weak recovery of the rapeseed oil market. As the
reserves continue to age, there will be more pressure for the government to hold auctions more
frequently. This may create uncertainty in the Chinese vegetable oil market in 2016.
Soybean Oil
As a result of increased crushing of imported soybeans, MY16/17 soybean oil production is forecast at
15.1 MMT, up 3.7 percent from last year’s estimate. Soybean oil remains the dominant vegetable oil,
and will account for 45.3 percent of domestic vegetable oil consumption in MY16/17. However,
soybean oil consumption growth is somehow affected by consumer’s sensitivity regarding
biotechnology despite government assurances on the safety of all approved biotech products.
Soybean oil imports, which recovered to 1.4 MMT in MY12/13 after China lifted a ban on Argentine
oil, are expected to level off to 700,000 tons in MY16/17 as domestic production continues to grow.
Imports of U.S. soybean oil are expected to fall in favor of more competitive Argentine supplies.
Palm Oil
MY16/17 palm oil imports are forecast to increase to 5.65 MMT, slightly above the previous year level.
China’s palm oil imports peaked in MY12/13 at 6.59 MMT in response to lower prices. However,
excessive imports prompted a significant import decline of about 1 MMT in the following two years and
returned import levels to an annual average of 5.6 MMT. Given an increasing supply from major
supplying countries at lower prices, MY15/16 palm oil imports are estimated to be stable at 5.6 MMT
and a moderate growth is expected to continue in MY16/17.
Palm oil’s inexpensive price, relative to soybean and rapeseed oil, is a major factor affecting its demand
in China. Blending palm oil with other vegetable oils for cooking is a popular practice which will likely
increase given the current competitiveness of the palm oil price. As mentioned above, the food
processing industry in China uses large amounts of palm oil in processed foods, especially instant
noodles. China’s rapid growth of instant noodle production has leveled off since 2014 and is widely
believed to have fallen modestly in 2015. Taking into account the saturated instant noodle market,
further expansion of palm oil use by the instant noodle industry is unlikely in the near term.
Changes in Vegetable Oil Import Policy
On January 1, 2013, AQSIQ implemented additional import inspection requirements for edible and
crude vegetable oils. AQSIQ’s clarification on specific items to be certified and the laboratories
qualified for providing such test reports and certificates remains vague (see more in CH13005).
However, as of this report, there are no alerts of trade disruptions related to this issue.

27
AQSIQ Notice Soliciting Comments on the “Administrative Measures for Foreign Food
Importer’s Review and Inspection of Overseas Enterprises”
Under China’s 2015 Food Safety Law, there are new requirements instructing importers to review
relevant documents provided by their foreign suppliers (exporters and producers). Correspondingly, in
2015, AQSIQ issued a draft measure suggesting that the imported food products that fall in seven
designated categories must have on-site inspection. Hence importers are required to conduct on-site
inspection of the exporters as well as producers. The draft also recommends punishment in the case of
importers’ failure to comply with the outlined requirements. The “Catalogue of Products that Must
Have On-site Inspection” includes bulk vegetable oil among other products. Details on the draft remain
vague but Chinese authorities have indicated that this will likely affect all vegetable oils imports
including crude and consumer-ready oils. As of this report, AQSIQ has not finalized the draft and has
not notified the World Trade Organization of this measure. Post continues to monitor this
development.
Statistics Tables
Total Oilseeds, Total Meal, and Total Oil PSD Tables
Table 1. Total Oilseeds
PSD Table Country China, Peoples Republic of Commodity Total Oilseeds (1000 tons; 1000Ha)
2014/15 2015/16 2016/17
USDA
Official
Post
Estimate
New USDA
Official
Post
Estimate
New USDA
Official
Post
Estimate
New
Market Year Begin 10/2014 10/2015 10/2016 Area Planted 17,624 24,240 15,820 22,320 0 21,870
Area Harvested 24,341 24,240 22,870 22,320 0 21,870
Beginning Stocks 15,013 15,263 18,626 18,879 0 17,055
Production 57,653 57,653 54,430 53,860 0 52,710
MY Imports 83,113 83,155 86,355 86,420 0 89,232
MY Imp. from U.S. 29,697 29,719 28,500 30,021 0 30,025
MY Imp. from the EC 0 0 0 0 0 0
TOTAL SUPPLY 155,779 156,071 159,411 159,159 0 158,997
MY Exports 889 889 900 900 0 910
MY Exp. to the EC 230 60 228 76 0 76
Crush Dom. Cons. 112,350 112,094 117,405 116,779 0 118,492
Food Use Dom. Cons. 17,752 17,750 18,325 17,925 0 18,000
Feed,Seed,Waste Dom.Cons. 6,162 6,459 6,055 6,500 0 6,410
TOTAL Dom. Consumption 136,264 136,303 141,785 141,204 0 142,902
Ending Stocks 18,626 18,879 16,726 17,055 0 15,185
TOTAL DISTRIBUTION 155,779 156,071 159,411 159,159 0 158,997
Calendar Year Imports 79,725 80,722 83,650 83,419 0 86,475
Calendar Year Imp. U.S. 30,005 28,426 29,000 29,016 0 30,016

28
Calendar Year Exports 991 895 940 890 0 830
Calendar Year Exp. to U.S. 73 53 70 58 0 53

29
Table 2. Total Meals
PSD Table Country China, Peoples Republic of Commodity Total Meal (1000 tons)
2014/15 2015/16 2016/17
USDA
Official
Post
Estimate
New USDA
Official
Post
Estimate
New USDA
Official
Post
Estimate
New
Market Year Begin 10/2014 10/2015 10/2016
Crush 113,550 113,294 118,605 117,879 0 119,592 Extr. Rate, 999.9999 Beginning Stocks 0 0 0 0 0 0
Production 79,267 79,118 84,022 83,445 0 85,084
MY Imports 1,231 1,231 1,130 1,205 0 1,222
MY Imp. from U.S. 92 93 90 80 0 90
MY Imp. from the EC 5 0 5 0 0 0
TOTAL SUPPLY 80,498 80,349 85,152 84,650 0 86,306
MY Exports 1,620 1,602 1,896 1,858 0 1,873
MY Exp. to the EC 60 60 20 70 0 70
Industrial Dom. Cons. 1,632 1,634 1,642 1,652 0 1,700
Food Use Dom. Cons. 0 0 0 0 0 0
Feed Waste Dom. Cons. 77,246 77,112 81,614 81,141 0 82,733
TOTAL Dom. Consumption 78,878 78,746 83,256 82,793 0 84,433
Ending Stocks 0 0 0 0 0 0
TOTAL DISTRIBUTION 80,498 80,348 85,152 84,651 0 86,306
Calendar Year Imports 1,110 1,215 1,210 1,222 0 1,112
Calendar Year Imp. U.S. 70 92 90 80 0 90
Calendar Year Exports 1,761 1,729 1,871 1,816 0 1,945
Calendar Year Exp. to U.S. 20 62 20 50 0 30

30
Table 3. Total Oils
PSD Table Country China, Peoples Republic of Commodity Total Oils (1000 tons)
2014/15 2015/16 2016/17
USDA
Official
Post
Estimate
New USDA
Official
Post
Estimate
New USDA
Official
Post
Estimate
New
Market Year Begin 10/2014 10/2015 10/2016
Crush 112,350 112,094 117,405 116,779 0 118,492
Extr. Rate, 999.9999 0
Beginning Stocks 4,181 3,689 4,013 4,016 0 3,960
Production 24,416 24,346 25,342 25,336 0 25,510
MY Imports 8,012 8,012 7,875 7,880 0 7,920
MY Imp. from U.S. 150 0 125 10 0 15
MY Imp. from the EC 0 109 0 113 0 104
TOTAL SUPPLY 36,609 36,539 37,230 37,232 0 37,395
MY Exports 131 128 105 125 0 118
MY Exp. to the EC 0 0 0 0 0 0
Industrial Dom. Cons. 1,950 1,950 2,000 2,050 0 2,100
Food Use Dom. Cons. 30,515 30,448 31,611 31,097 0 31,611
Feed Waste Dom. Cons. 0 0 0 0 0 0
TOTAL Dom. Consumption 32,465 32,398 33,611 33,147 0 33,711
Ending Stocks 4,013 4,016 3,514 3,960 0 3,566
TOTAL DISTRIBUTION 36,609 36,542 37,230 37,232 0 37,395
Calendar Year Imports 8,298 8,467 8,245 7,910 0 8,040
Calendar Year Imp. U.S. 150 1 125 5 0 5
Calendar Year Exports 97 128 95 117 0 110
Calendar Year Exp. to U.S. 0 0 0 0 0 0

31
Oilseeds PSD Tables
Table 4. Soybeans
PSD Table Country China, Peoples Republic of Commodity Oilseed, Soybean (1000 tons; 1000 Ha)
2014/15 2015/16 2016/17
USDA
Official
Post
Estimate
New USDA
Official
Post
Estimate
New USDA
Official
Post
Estimate
New
Market Year Begin 10/2014 10/2015 10/2016
Area Planted 7,700 6,800 6,600 6,100 0 6,200
Area Harvested 6,800 6,800 6,550 6,100 0 6,200
Beginning Stocks 13,877 14,127 17,034 17,284 0 15,984
Production 12,150 12,150 12,000 11,000 0 11,200
MY Imports 78,350 78,350 82,000 82,000 0 84,500
MY Imp. from U.S. 29,697 29,697 28,500 30,000 0 30,000
MY Imp. from EU 0 0 0 0 0 0
Total Supply 104,377 104,627 111,034 110,284 0 111,684
MY Exports 143 143 200 150 0 150
MY Exp. to EU 10 10 10 10 0 10
Crush 74,500 74,500 81,800 81,000 0 84,000
Food Use Dom. Cons. 10,200 10,200 10,650 10,350 0 10,400
Feed Waste Dom. Cons. 2,500 2,500 2,800 2,800 0 2,900
Total Dom. Cons. 87,200 87,200 95,250 94,150 0 97,300
Ending Stocks 17,034 17,284 15,584 15,984 0 14,234
Total Distribution 104,377 104,627 111,034 110,284 0 111,684
CY Imports 75,500 76,000 79,500 79,000 0 82,000
CY Imp. from U.S. 30,000 28,413 29,000 29,000 0 30,000
CY Exports 250 134 250 160 0 140
CY Exp. to U.S. 70 42 70 50 0 45

32
Table 5. Rapeseed
PSD Table Country China, Peoples Republic of Commodity Oilseed, Rapeseed (1000 tons;1000 Ha)
2014/15 2015/16 2016/17
USDA
Official
Post
Estimate
New USDA
Official
Post
Estimate
New USDA
Official
Post
Estimate
New
Market Year Begin 10/2014 10/2015 10/2016
Area Planted 7,588 7,300 7,000
Area Harvested 7,588 7,588 7,400 7,300 7,000
Beginning Stocks 1,036 1,036 1,499 1,502 1,002
Production 14,772 14,772 14,100 14,300 13,500
MY Imports 4,591 4,594 4,150 4,200 4,500
MY Imp. from U.S. 0 0 0 0 0
MY Imp. from EU 0 0 0 0 0
Total Supply 20,399 20,402 19,749 20,002 19,002
MY Exports 0 0 0 0 0
MY Exp. to EU 0 0 0 0 0
Crush 18,300 18,300 18,100 18,400 17,500
Food Use Dom. Cons. 0 0 0 0 0
Feed Waste Dom. Cons. 600 600 600 600 600
Total Dom. Cons. 18,900 18,900 18,700 19,000 18,100
Ending Stocks 1,499 1,502 1,049 1,002 902
Total Distribution 20,399 20,402 19,749 20,002 19,002
CY Imports 4,100 4,470 4,000 4,200 4,250
CY Imp. from U.S. 0 0 0 0 0
CY Exports 0 0 0 0 0
CY Exp. to U.S. 0 0 0 0 0

33
Table 6. Peanuts
PSD Table Country China, Peoples Republic of Commodity Oilseed, Peanut (1000 tons; 1000 Ha)
2014/15 2015/16 2016/1
USDA
Official
Post
Estimate
New USDA
Official
Post
Estimate
New USDA
Official
Post
Estimate
New
Market Year Begin 10/2014 10/2015 10/2016
Area Planted 4,604 4,604 4,600 4,600 0 4,650
Area Harvested 4,604 4,604 4,600 4,600 0 4,650
Beginning Stocks 0 0 0 0 0 0
Production 16,482 16,482 16,700 16,700 0 16,800
MY Imports 122 161 150 160 0 170
MY Imp. from U.S. 0 21 0 21 0 25
MY Imp. from EU 0 0 0 0 0 0
Total Supply 16,604 16,643 16,850 16,860 0 16,970
MY Exports 502 502 525 500 0 510
MY Exp. to EU 200 37 200 50 0 50
Crush 8,650 8,394 8,700 8,690 0 8,760
Food Use Dom. Cons. 6,652 6,650 6,775 6670 0 6,690
Feed Waste Dom. Cons. 800 1,097 850 1000 0 1,010
Total Dom. Cons. 16,102 16,141 16,325 16,360 0 16,460
Ending Stocks 0 0 0 0 0 0
Total Distribution 16,604 16,643 16,850 16,860 0 16,970
CY Imports 50 175 50 160 0 165
CY Imp. from U.S. 0 12 0 15 0 15
CY Exports 511 509 530 500 0 510
CY Exp. to U.S. 0 7 0 5 0 5

34
Table 7. Sunflower Seed
PSD Table Country China, Peoples Republic of Commodity Oilseed, Sunflowerseed (1000 tons; 1000 Ha)
2014/15 2015/16 2016/17
USDA
Official
Post
Estimate
New USDA
Official
Post
Estimate
New USDA
Official
Post
Estimate
New
Market Year Begin 10/2014 10/2015 10/2016
Area Planted 920 923 920 920 0 920
Area Harvested 949 923 920 920 0 920
Beginning Stocks 100 100 93 93 0 69
Production 2,492 2,492 2,300 2,500 0 2,510
MY Imports 45 45 50 50 0 52
MY Imp. from U.S. 0 1 0 0 0 0
MY Imp. from EU 0 0 0 0 0 0
Total Supply 2,637 2,637 2,443 2,643 0 2,631
MY Exports 244 244 175 250 0 250
MY Exp. to EU 20 13 18 16 0 16
Crush 1,300 1,300 1,175 1,319 0 1,322
Food Use Dom. Cons. 900 900 900 905 0 910
Feed Waste Dom. Cons. 100 100 100 100 0 100
Total Dom. Cons. 2,300 2,300 2,175 2,324 0 2,332
Ending Stocks 93 93 93 69 0 49
Total Distribution 2,637 2,637 2,443 2,643 0 2,631
CY Imports 40 69 50 50 0 50
CY Imp. from U.S. 5 1 0 1 0 1
CY Exports 230 252 160 230 0 180
CY Exp. to U.S. 3 4 0 3 0 3

35
Table 8. Cottonseed
PSD Table Country China, Peoples Republic of Commodity Oilseed, Cottonseed (1000 tons; 1000 Ha)
2014/15 2015/16 2016/17
USDA
Official
Post
Estimate
New USDA
Official
Post
Estimate
New USDA
Official
Post
Estimate
New
Market Year Begin 10/2014 10/2015 10/2016
Area Planted (Cotton) 4,400 4,325 3,700 3,400 0 3,100
Area Harvested (Cotton) 4,400 4,325 3,400 3,400 0 3,100
Seed to Lint Ratio 0 0 0 0 0 0
Beginning Stocks 0 0 0 0 0 0
Production 11,757 11,757 9,330 9,360 0 8,700
MY Imports 5 5 5 10 0 10
MY Imp. from U.S. 0 0 0 0 0 0
MY Imp. from EU 0 0 0 0 0 0
Total Supply 11,762 11,762 9,335 9,370 0 8,710
MY Exports 0 0 0 0 0 0
MY Exp. to EU 0 0 0 0 0 0
Crush 9,600 9,600 7,630 7,370 0 6,910
Food Use Dom. Cons. 0 0 0 0 0 0
Feed Waste Dom. Cons. 2,162 2,162 1,705 2,000 0 1,800
Total Dom. Cons. 11,762 11,762 9,335 9,370 0 8,710
Ending Stocks 0 0 0 0 0 0
Total Distribution 11,762 11,762 9,335 9,370 0 8,710
CY Imports 35 8 50 9 0 10
CY Imp. from U.S. 0 0 0 0 0 0
CY Exports 0 0 0 0 0 0
CY Exp. to U.S. 0 0 0 0 0 0

36
Meal PSD Tables
Table 9. Soybean Meal
PSD Table Country China, Peoples Republic of Commodity Meal, Soybean (1000 tons)
2014/15 2015/16 2016/17
USDA
Official
Post
Estimate
New USDA
Official
Post
Estimate
New USDA
Official
Post
Estimate
New
Market Year Begin 10/2014 10/2015 10/2016
Crush 74,500 74,500 81,800 81,000 0 84,000
Extr. Rate, 999.9999 0.792 0.7916 0.7921 0.7916 0 0.7916
Beginning Stocks 0 0 0 0 0 0
Production 59,008 58,974 64,782 64,120 0 66,494
MY Imports 58 57 20 20 0 20
MY Imp. from U.S. 0 1 0 0 0 0
MY Imp. from EU 0 0 0 0 0 0
Total Supply 59,066 59,031 64,802 64,140 0 66,514
MY Exports 1,595 1,577 1,850 1,800 0 1,850
MY Exp. to EU 60 60 20 70 0 70
Industrial Dom. Cons. 980 980 1,000 1,000 0 1,050
Food Use Dom. Cons. 0 0 0 0 0 0
Feed Waste Dom. Cons. 56,491 56474 61,952 61,340 0 63,614
Total Dom. Cons. 57,471 57,454 62,952 62,340 0 64,664
Ending Stocks 0 0 0 0 0 0
Total Distribution 59,066 59,031 64,802 64,140 0 66,514
CY Imports 50 60 50 25 0 20
CY Imp. from U.S. 0 0 0 0 0 0
CY Exports 1,700 1,696 1,800 1,800 0 1,900
CY Exp. to U.S. 20 62 20 50 0 30

37
Table 10. Rapeseed Meal
PSD Table Country China, Peoples Republic of Commodity Meal, Rapeseed (1000 tons)
2014/15 2015/16 2016/17
USDA
Official Post
Estimate USDA
Official
Post
Estimate
New USDA
Official
Post
Estimate
New
Market Year Begin 10/2014 10/2015 10/2016
Crush 18,300 18,300 18,100 18,400 0 17,500
Extr. Rate, 999.9999 0.6287 0.6282 0.6287 0.6282 0 0.6282
Beginning Stocks 0 0 0 0 0 0
Production 11,505 11,496 11,379 11,559 0 10,994
MY Imports 142 142 125 135 0 140
MY Imp. from U.S. 0 0 0 0 0 0
MY Imp. from EU 0 0 0 0 0 0
Total Supply 11,647 11,638 11,504 11,694 0 11,134
MY Exports 0 0 30 40 0 10
MY Exp. to EU 0 0 0 0 0 0
Industrial Dom. Cons. 450 450 450 450 0 450
Food Use Dom. Cons. 0 0 0 0 0 0
Feed Waste Dom. Cons. 11,197 11,188 11,024 11,204 0 10,674
Total Dom. Cons. 11,647 11,638 11,474 11,654 0 11,124
Ending Stocks 0 0 0 0 0 0
Total Distribution 11,647 11,638 11,504 11,694 0 11,134
CY Imports 125 123 125 145 0 140
CY Imp. from U.S. 0 0 0 0 0 0
CY Exports 30 11 40 4 0 3
CY Exp. to U.S. 0 0 0 0 0 0

38
Table 11. Peanut Meal
PSD Table Country China, Peoples Republic of Commodity Meal, Peanut (1000 tons)
2014/15 2015/16 2016/17
USDA
Official
Post
Estimate
New USDA
Official
Post
Estimate
New USDA
Official
Post
Estimate
New
Market Year Begin 10/2014 10/2015 10/2016
Crush 8,650 8,394 8,700 8,690 0 8,760
Extr. Rate, 999.9999 0.3983 0.3983 0.3983 0.3984 0.3984
Beginning Stocks 0 0 0 0 0 0
Production 3,446 3,344 3,465 3,462 0 3,490
MY Imports 0 0 35 0 0 10
MY Imp. from U.S. 0 0 0 0 0 0
MY Imp. from EU 0 0 0 0 0 0
Total Supply 3,446 3,344 3,500 3,462 0 3,500
MY Exports 2 2 1 2 0 3
MY Exp. to EU 0 0 0 0 0 0
Industrial Dom. Cons. 0 0 0 0 0 0
Food Use Dom. Cons. 0 0 0 0 0 0
Feed Waste Dom. Cons. 3,444 3,342 3,499 3,460 0 3,497
Total Dom. Cons. 3,444 3,342 3,499 3,460 0 3,497
Ending Stocks 0 0 0 0 0 0
Total Distribution 3,446 3,344 3,500 3,462 0 3,500
CY Imports 35 0 35 0 0 0
CY Imp. from U.S. 0 0 0 0 0 0
CY Exports 1 2 1 2 0 3
CY Exp. to U.S. 0 0 0 0 0 0

39
Table 12. Sunflower Seed Meal
PSD Table Country China, Peoples Republic of Commodity Meal, Sunflowerseed (1000 tons)
2014/15 2015/16 2016/17
USDA
Official
Post
Estimate
New USDA
Official
Post
Estimate
New USDA
Official
Post
Estimate
New
Market Year Begin 10/2014 10/2015 10/2016
Crush 1,300 1,300 1,175 1,319 0 1,322
Extr. Rate, 999.9999 0.5454 0.5417 0.5447 0.5417 0 0.5417
Beginning Stocks 0 0 0 0 0 0
Production 709 704 640 714 0 716
MY Imports 0 2 0 0 0 0
MY Imp. from U.S. 0 0 0 0 0 0
MY Imp. from EU 0 0 0 0 0 0
Total Supply 709 706 640 714 0 716
MY Exports 10 10 10 5 0 5
MY Exp. to EU 0 0 0 0 0 0
Industrial Dom. Cons. 62 64 62 62 0 60
Food Use Dom. Cons. 0 0 0 0 0 0
Feed Waste Dom. Cons. 637 632 568 648 0 651
Total Dom. Cons. 699 696 630 710 0 711
Ending Stocks 0 0 0 0 0 0
Total Distribution 709 706 640 715 0 716
CY Imports 0 0 0 0 0 0
CY Imp. from U.S. 0 0 0 0 0 0
CY Exports 0 0 0 0 0 0
CY Exp. to U.S. 0 0 0 0 0 0
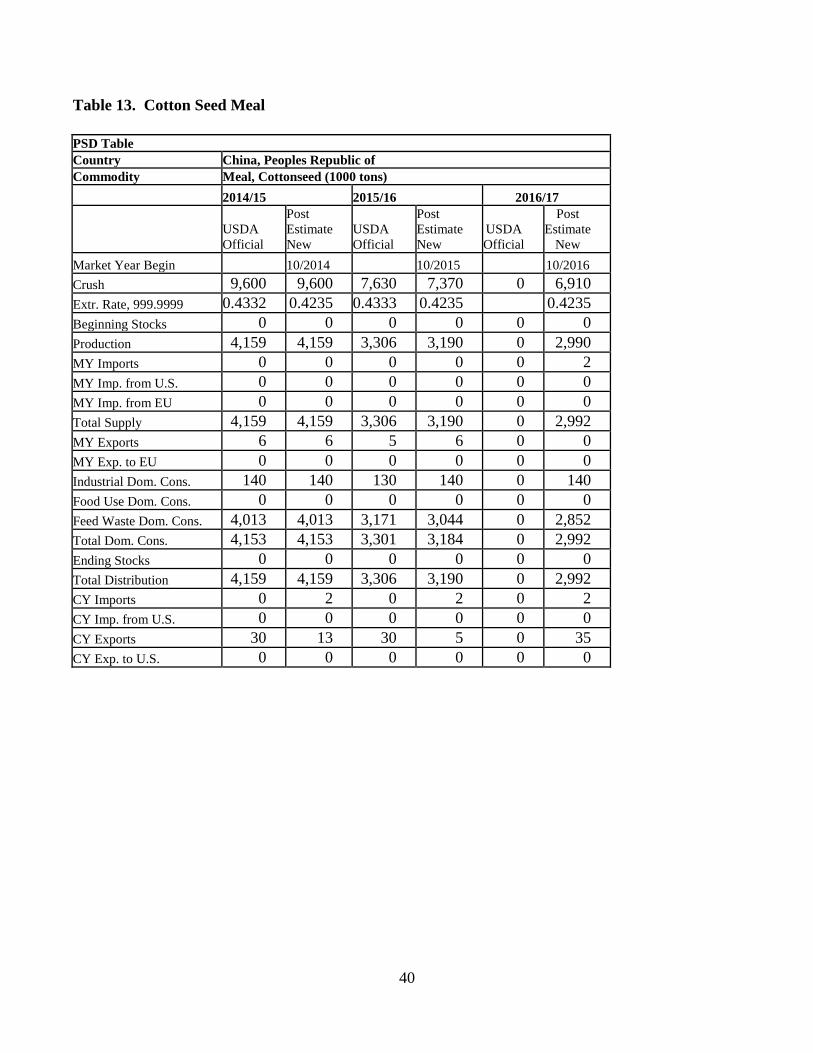
40
Table 13. Cotton Seed Meal
PSD Table Country China, Peoples Republic of Commodity Meal, Cottonseed (1000 tons)
2014/15 2015/16 2016/17
USDA
Official
Post
Estimate
New USDA
Official
Post
Estimate
New USDA
Official
Post
Estimate
New
Market Year Begin 10/2014 10/2015 10/2016
Crush 9,600 9,600 7,630 7,370 0 6,910
Extr. Rate, 999.9999 0.4332 0.4235 0.4333 0.4235 0.4235
Beginning Stocks 0 0 0 0 0 0
Production 4,159 4,159 3,306 3,190 0 2,990
MY Imports 0 0 0 0 0 2
MY Imp. from U.S. 0 0 0 0 0 0
MY Imp. from EU 0 0 0 0 0 0
Total Supply 4,159 4,159 3,306 3,190 0 2,992
MY Exports 6 6 5 6 0 0
MY Exp. to EU 0 0 0 0 0 0
Industrial Dom. Cons. 140 140 130 140 0 140
Food Use Dom. Cons. 0 0 0 0 0 0
Feed Waste Dom. Cons. 4,013 4,013 3,171 3,044 0 2,852
Total Dom. Cons. 4,153 4,153 3,301 3,184 0 2,992
Ending Stocks 0 0 0 0 0 0
Total Distribution 4,159 4,159 3,306 3,190 0 2,992
CY Imports 0 2 0 2 0 2
CY Imp. from U.S. 0 0 0 0 0 0
CY Exports 30 13 30 5 0 35
CY Exp. to U.S. 0 0 0 0 0 0

41
Table 14. Fish Meal
PSD Table Country China, Peoples Republic of Commodity Meal, Fish (1000 tons)
2014/15 2015/16 2016/17
USDA
Official
Post
Estimate
New USDA
Official
Post
Estimate
New USDA
Official
Post
Estimate
New
Market Year Begin 1/2015 1/2016 1/2017
Catch For Reduction 1,200 1,200 1,200 1,100 0 1,100
Extr. Rate, 999.9999 0.3667 0.366 0.375 0.363 0 0.363
Beginning Stocks 0 0 0 0 0 0
Production 440 440 450 400 0 400
MY Imports 1,031 1,030 950 1,050 0 1,050
MY Imp. from U.S. 92 92 90 80 0 90
MY Imp. from EU 5 0 5 0 0 0
Total Supply 1,471 1,470 1,400 1,450 0 1,450
MY Exports 7 7 0 5 0 5
MY Exp. to EU 0 0 0 0 0 0
Industrial Dom. Cons. 0 0 0 0 0 0
Food Use Dom. Cons. 0 0 0 0 0 0
Feed Waste Dom. Cons. 1,464 1,463 1,400 1,445 0 1,445
Total Dom. Cons. 1,464 1,463 1,400 1,445 0 1,445
Ending Stocks 0 0 0 0 0 0
Total Distribution 1,471 1,470 1,400 1,450 0 1,450
CY Imports 900 1,030 1,000 1,050 0 950
CY Imp. from U.S. 70 92 90 80 0 90
CY Exports 0 7 0 5 0 4
CY Exp. to U.S. 0 0 0 0 0 0

42
Oils PSD Tables
Table 15. Soybean Oil
PSD Table Country China, Peoples Republic of Commodity Oil, Soybean (1000 tons)
2014/15 2015/16 2016/17
USDA
Official
Post
Estimate
New USDA
Official
Post
Estimate
New USDA
Official
Post
Estimate
New
Market Year Begin 10/2014 10/2015 10/2016
Crush 74,500 74,500 81,800 81,000 0 84,000
Extr. Rate, 999.9999 0.1792 0.1792 0.1792 0.1792 0.1792
Beginning Stocks 958 466 845 848 0 1113
Production 13,347 13,350 14,655 14,515 0 15,053
MY Imports 773 773 850 700 0 700
MY Imp. from U.S. 150 0 125 10 0 15
MY Imp. from EU 0 0 0 0 0 0
Total Supply 15,078 15,081 16,350 16,063 0 16,866
MY Exports 107 107 80 100 0 100
MY Exp. to EU 0 0 0 0 0 0
Industrial Dom. Cons. 0 0 0 0 0 0
Food Use Dom. Cons. 14,126 14,126 15,450 14,850 0 15,250
Feed Waste Dom. Cons. 0 0 0 0 0 0
Total Dom. Cons. 14,126 14,126 15,450 14,850 0 15,250
Ending Stocks 845 848 820 1,113 0 1,516
Total Distribution 15,078 15,081 16,350 16,063 0 16,866
CY Imports 1,000 818 1,000 720 0 700
CY Imp. from U.S. 150 1 125 5 0 5
CY Exports 80 104 80 100 0 95
CY Exp. to U.S. 0 0 0 0 0 0

43
Table 16. Rapeseed Oil
PSD Table Country China, Peoples Republic of Commodity Oil, Rapeseed (1000 tons)
2014/15 2015/16 2016/17
USDA
Official
Post
Estimate
New USDA
Official
Post
Estimate
New USDA
Official
Post
Estimate
New
Market Year Begin 10/2014 10/2015 10/2016
Crush 18,300 18,300 18,100 18,400 17,500
Extr. Rate, 999.9999 0.3552 0.3552 0.3556 0.356 0.356
Beginning Stocks 2,882 2,882 2,858 2,858 2,588
Production 6,500 6,500 6,436 6,550 6,230
MY Imports 732 732 800 750 730
MY Imp. from U.S. 0 0 0 0 0
MY Imp. from EU 0 107 0 110 100
Total Supply 10,114 10,114 10,094 10,158 9,548
MY Exports 6 6 10 6 5
MY Exp. to EU 0 0 0 0 0
Industrial Dom. Cons. 0 0 0 0 0
Food Use Dom. Cons. 7,250 7,250 7,650 7,564 7,650
Feed Waste Dom. Cons. 0 0 0 0 0
Total Dom. Cons. 7,250 7,250 7,650 7,564 7,650
Ending Stocks 2,858 2,858 2,434 2,588 1,893
Total Distribution 10,114 10,114 10,094 10,158 9,548
CY Imports 900 815 900 800 800
CY Imp. from U.S. 0 0 0 0 0
CY Exports 0 5 0 5 6
CY Exp. to U.S. 0 0 0 0 0

44
Table 17. Peanut Oil
PSD Table Country China, Peoples Republic of Commodity Oil, Peanut (1000 tons)
2014/15 2015/16 2016/17
USDA
Official
Post
Estimate
New USDA
Official
Post
Estimate
New USDA
Official
Post
Estimate
New
Market Year Begin 10/2014 10/2015 10/2016
Crush 8,650 8,394 8,700 8,690 0 8,760
Extr. Rate, 999.9999 0.3129 0.3138 0.3128 0.3138 0 0.3138
Beginning Stocks 0 0 0 0 0 0
Production 2,707 2634 2,721 2,727 0 2,749
MY Imports 141 141 175 150 0 150
MY Imp. from U.S. 0 0 0 0 0 0
MY Imp. from EU 0 0 0 0 0 0
Total Supply 2,848 2,775 2,896 2,877 0 2,899
MY Exports 8 8 10 7 0 6
MY Exp. to EU 0 0 0 0 0 0
Industrial Dom. Cons. 0 0 0 0 0 0
Food Use Dom. Cons. 2,840 2,767 2,886 2,870 0 2,893
Feed Waste Dom. Cons. 0 0 0 0 0 0
Total Dom. Cons. 2,840 2,767 2,886 2,870 0 2,893
Ending Stocks 0 0 0 0 0 0
Total Distribution 2,848 2,775 2,896 2,877 0 2,899
CY Imports 98 128 95 150 0 150
CY Imp. from U.S. 0 0 0 0 0 0
CY Exports 10 9 10 7 0 6
CY Exp. to U.S. 0 0 0 0 0 0

45
Table 18. Cotton Seed Oil
PSD Table Country China, Peoples Republic of Commodity Oil, Cottonseed (1000 tons)
2014/15 2015/16 2016/17
USDA
Official
Post
Estimate
New USDA
Official
Post
Estimate
New USDA
Official
Post
Estimate
New
Market Year Begin 10/2014 10/2015 10/2016
Crush 9,600 9,600 7,630 7,370 0 6,910
Extr. Rate, 999.9999 0.1454 0.1454 0.1455 0.1454 0 0.1454
Beginning Stocks 0 0 0 0 0 0
Production 1,396 1,396 1,110 1,072 0 1,005
MY Imports 0 0 0 0 0 0
MY Imp. from U.S. 0 0 0 0 0 0
MY Imp. from EU 0 0 0 0 0 0
Total Supply 1,396 1,396 1,110 1,072 0 1,005
MY Exports 9 4 5 9 0 3
MY Exp. to EU 0 0 0 0 0 0
Industrial Dom. Cons. 0 0 0 0 0 0
Food Use Dom. Cons. 1,387 1,392 1,105 1,063 0 1,002
Feed Waste Dom. Cons. 0 0 0 0 0 0
Total Dom. Cons. 1,387 1,392 1,105 1,063 0 1,002
Ending Stocks 0 0 0 0 0 0
Total Distribution 1,396 1,396 1,110 1,072 0 1,005
CY Imports 0 0 0 0 0 0
CY Imp. from U.S. 0 0 0 0 0 0
CY Exports 7 7 5 4 0 3
CY Exp. to U.S. 0 0 0 0 0 0

46
Table 19. Sunflower Seed Oil
PSD Table Country China, Peoples Republic of Commodity Oil, Sunflower Seed (1000 tons)
2014/15 2015/16 2016/17
USDA
Official
Post
Estimate
New USDA
Official
Post
Estimate
New USDA
Official
Post
Estimate
New
Market Year Begin 10/2014 10/2015 10/2016
Crush 1,300 1,300 1,175 1,319 0 1,322
Extr. Rate, 999.9999 0.3585 0.358 0.3574 0.358 0 0.358
Beginning Stocks 0 0 0 0 0 0
Production 466 465 420 472 0 473
MY Imports 534 534 400 540 0 550
MY Imp. from U.S. 0 0 0 0 0 0
MY Imp. from EU 0 2 0 3 0 4
Total Supply 1,000 999 820 1,012 0 1,023
MY Exports 0 2 0 2 0 2
MY Exp. to EU 0 0 0 0 0 0
Industrial Dom. Cons. 0 0 0 0 0 0
Food Use Dom. Cons. 1,000 997 820 1,010 0 1,021
Feed Waste Dom. Cons. 0 0 0 0 0 0
Total Dom. Cons. 1,000 997 820 1,010 0 1,021
Ending Stocks 0 0 0 0 0 0
Total Distribution 1,000 999 820 1,012 0 1,023
CY Imports 450 651 400 500 0 550
CY Imp. from U.S. 0 0 0 0 0 0
CY Exports 0 1 0 1 0 0
CY Exp. to U.S. 0 0 0 0 0 0

47
Table 20. Palm Oil
PSD Table Country China, Peoples Republic of Commodity Oil, Palm (1000 tons)
2014/15 2014/16 2016/17
USDA
Official
Post
Estimate
New USDA
Official
Post
Estimate
New USDA
Official
Post
Estimate
New
Market Year Begin 10/2014 10/2015 10/2016
Area Planted 0 0 0 0 0 0
Area Harvested 0 0 0 0 0 0
Trees 0 0 0 0 0 0
Beginning Stocks 341 341 310 310 0 259
Production 0 0 0 0 0 0
MY Imports 5,696 5,696 5,500 5,600 0 5,650
MY Imp. from U.S. 0 0 0 0 0 0
MY Imp. from EU 0 0 0 0 0 0
Total Supply 6,037 6,037 5,810 5,910 0 5,909
MY Exports 1 1 0 1 0 2
MY Exp. to EU 0 0 0 0 0 0
Industrial Dom. Cons. 1,950 1,950 2,000 2,050 0 2,100
Food Use Dom. Cons. 3,776 3,776 3,550 3,600 0 3,650
Feed Waste Dom. Cons. 0 0 0 0 0 0
Total Dom. Cons. 5,726 5,726 5,550 5,650 0 5,750
Ending Stocks 310 310 260 259 0 157
Total Distribution 6,037 6,037 5,810 5,910 0 5,909
CY Imports 5,700 5,910 5,700 5,600 0 5,700
CY Imp. from U.S. 0 0 0 0 0 0
CY Exports 0 2 0 0 0 0
CY Exp. to U.S. 0 0 0 0 0 0

48
Table 21. Coconut Oil
PSD Table Country China, Peoples Republic of Commodity Oil, Coconut (1000 tons)
2014/15 2015/16 2016/17
USDA
Official
Post
Estimate
New USDA
Official
Post
Estimate
New USDA
Official
Post
Estimate
New
Market Year Begin 10/2014 10/2015 10/2016
Crush 0 0 0 0 0 0
Extr. Rate, 999.9999 0 0 0 0 0 0
Beginning Stocks 0 0 0 0 0 0
Production 0 0 0 0 0 0
MY Imports 136 136 150 140 0 145
MY Imp. from U.S. 0 0 0 0 0 0
MY Imp. from EU 0 0 0 0 0 0
Total Supply 136 136 150 140 0 145
MY Exports 0 0 0 0 0 0
MY Exp. to EU 0 0 0 0 0 0
Industrial Dom. Cons. 0 0 0 0 0 0
Food Use Dom. Cons. 136 140 150 140 0 145
Feed Waste Dom. Cons. 0 0 0 0 0 0
Total Dom. Cons. 136 140 150 140 0 145
Ending Stocks 0 0 0 0 0 0
Total Distribution 136 140 150 140 0 145
CY Imports 150 145 150 140 0 140
CY Imp. from U.S. 0 0 0 0 0 0
CY Exports 0 0 0 0 0 0
CY Exp. to U.S. 0 0 0 0 0 0

49
Soybean Product & Palm Oil Wholesale Price Tables
Table 22. Nation Average Soybean Wholesale Prices CY2014 to CY2015
Year/Month Jan Feb Mar Apr May Jun Jul Aug Sep Oct Nov Dec Dec/Jan
Change% 2014 4,362 4,346 4,354 4,311 4,307 4,267 4,038 4,232 4,175 4,064 3,997 3,870 -11% 2015 3,795 3,763 3,752 3,638 3,546 3,462 3,442 3,502 3,506 3,503 3,503 3,422 -10%
Table 23. Heilongjiang/Harbin Soybean Wholesale Prices CY2014 to CY2015
Year/ Jan Feb Mar Apr May Jun Jul Aug Sep Oct Nov Dec Dec/Jan Change% 2014 4,600 4,600 4,500 4,319 4,125 4,100 4,100 4,100 4,100 4,100 4,100 3,900 -15% 2015 3,900 3,900 3,900 3,827 3,800 3,630 3,560 3,740 3,750 3,750 3,750 3,614 -7%
Table 24. Wholesale Soybean Meal Prices in CY2014 and CY2015
Year/ Month
Jan Feb Mar Apr May Jun Jul Aug Sep Oct Nov Dec Dec/Jan Change%
2014 3,953 3,947 3,692 3,799 3,916 3,701 3,482 3,676 3,540 3,570 3,543 3,384 -14% 2015 3,171 3,022 3,112 2,990 2,867 2,664 2,856 2,804 2,793 2,832 2,669 2,614 -18%
Table 25. Wholesale Soybean Oil (Grade 1) Prices in CY2014 and CY2015
Year/ Month
Jan Feb Mar Apr May Jun Jul Aug Sep Oct Nov Dec Dec/Jan Change%
2014 6,870 6,882 7,118 7,098 6,750 6,407 8,241 6,055 5,902 5,969 5,981 5,739 -13% 2015 5,764 5,756 5,795 5,842 6,015 5,941 5,769 5,672 5,631 5,795 5,760 5,940 +3%
Table 26. Wholesale Palm Oil Prices CY 2014 and CY2015
Year/ Month
Jan Feb Mar Apr May Jun Jul Aug Sep Oct Nov Dec Dec/Jan Change%
2014 5,867 5,950 6,203 6,131 5,840 5,679 7,180 5,553 5,471 5,530 5,471 5,058 -14% 2015 4,986 4,986 5,087 5,028 5,130 5,120 4,931 4,575 4,323 4,493 4,363 4,467 -10%
Table 27. Comparison of Wholesale Prices for Grade 1-Soy Oil and Palm Oil in CY2015
Unit: RMB Yuan/MT: RMB6.2 =US$1.0
CY2015 Jan Feb Mar Apr May Jun Jul Aug Sep Oct Nov Dec Soybean Oil 5,764 5,756 5,795 5,842 6,015 5,941 5,769 5,672 5,631 5,795 5,760 5,940 Palm Oil 4,986 4,986 5,087 5,028 5,130 5,120 4,931 4,575 4,323 4,493 4,363 4,467 Diff % Palm vs Soy Oil -14% -13% -12% -14% -15% -14% -15% -19% -23% -22% -24% -25%
Average palm oil price is 17.5% lower than soy oil in CY2015 compared to the 11% lower in CY2014.
Source: All wholesale prices are based on China JCI Consulting Co.
Taxes & Duties Tables (Jan 01-Dec 31, 2016)

50
Table 28. Oilseeds
HS Code
Description M.F.N.(%)
Gen (%)
VAT Rate % ED Rate %
Seed
12011000 Soybeans, seed 0 180 13
12019010 Yellow soybean 3 180 13
12019020 Black soybean 3 180 13
12019030 Green soybean 3 180 13
12019090 Other soybean 3 180 13
12023000 In shell peanut, seed 0 0 13
12024100 In shell peanut, other 15 70 13
12024200 Shelled peanut 15 70 13 12030000 Copra 15 30 13 5 12040000 Linseed 15 70 13 5 20081110 Peanut kernels, in airtight containers 30 90 17 15 20081120 Roasted peanuts 30 80 17 15 20081130 Peanut butter 30 90 17 15 20081190 Other processed peanuts 30 80 17 5,15
12051010 Low erucic acid rape seed, seed 0 80 13 12051090 Low erucic acid rape seed, other 9 80 13 5
12059010 Other rapeseed, seed 0 80 13 12059090 Other rapeseed, other 9 80 13 5 12060010 Sunflower seeds, seed 0 0 13 5 12060090 Sunflower seeds, other 15 70 13 5 12072100 Cottonseeds for cultivation 0 0 13 5 12072900 Cottonseeds, other 15 70 13 5 12074010 Sesame seeds for cultivation 0 0 13 5 12074090 Sesame seeds, other 10 70 13 5
Note: VAT – Value Added Tax Rate; ED – Export Drawback Rate

51
Table 29. Oils
HS Code
Description M.F.N.(%)
Gen (%)
VAT Rate % ED Rate %
Oil
15071000 Crude soybean oil 9 190 13
15079000 Other soybean oil 9 190 13
15081000 Crude peanut oil 10 100 13
15089000 Other peanut oil 10 100 13
15091000 Olive Oil, virgin 10 30 13
15099000 Olive oil, other 10 30 17
15111000 Palm oil, crude 9 60 13
15119010 Palm oil, liquid 9 60 13
15119020 Stearin 8 60 13
15119090 Palm oil, other 9 60 17
15121100 Crude sunflower seed oil 9 160 13
15121900 Other sunflower seed oil 9 160 17
15122100 Crude cottonseed oil 10 70 13
15122900 Other cottonseed oil 10 70 17
15131100 Crude coconut oil 9 40 13
15131900 Other coconut oil 9 40 13
15132100 Crude palm kernel oil 9 40 13
15132900 Other palm kernel oil 9 40 17
15141100 Crude low erucic acid rape or colza oil 9 170 13
15141900 Other crude low erucic acid rape oil 9 170 13
15149110 Crude rape or colza oil 9 170 13
15149190 Crude mustard oil 9 170 13
15149900 Other rape oil 9 170 17 Note: VAT – Value Added Tax Rate; ED – Export Drawback Rate

52
Table 30. Meals
HS Code
Description M.F.N.(%)
Gen (%)
VAT Rate % ED Rate %
Meal
12081000 Soyflour 9 70 17 12089000 Other 15 80 17 15
23012010 Fish meal 2 11 13
23025000 Legume sweepings 5 30 13
23033000 Brewing or distilling dregs and waste 5 30 13 23040010 Soy meal, oil cake 5 30 13 13 23040090 Soy meal, other 5 30 13 13
23050000 Peanut meal 5 30 13 23061000 Cottonseed meal 5 30 13 13 23062000 Linseed meal 5 30 13 13 23063000 Sunflower seed meal 5 30 13 13 23064100 Low erucic acid rapeseed meal 5 30 13 13 23064900 Other rapeseed meal 5 30 13 13 Note: VAT – Value Added Tax Rate; ED – Export Drawback Rate