oilseeds and products annual tokyo japan 4-27-2012
TRANSCRIPT

7/30/2019 Oilseeds and Products Annual Tokyo Japan 4-27-2012
http://slidepdf.com/reader/full/oilseeds-and-products-annual-tokyo-japan-4-27-2012 1/15
THIS REPORT CONTAINS ASSESSMENTS OF COMMODITY AND TRADE ISSUES MADEBY USDA STAFF AND NOT NECESSARILY STATEMENTS OF OFFICIAL U.S.GOVERNMENT POLICY
Date:
GAIN Report Number:
Approved By:
Prepared By:
Report Highlights:
Japan, a mature soybean market, consumed approximately 3.2 million metric tons (mmt) of
soybeans and soybean products in CY2011. Since 2006, Japan’s soybean imports have decreased by 30 percent, and in CY2011, total soybean imports were approximately 2.8 mmt, down 18 percentfrom the 3.5 mmt imported in CY2010. Of total soybean imports, the United States supplied 1.9mmt, a 67 percent share. U.S. soybean imports dropped 25 percent from CY2010 because of crushing margins which favor canola, consumer preference for canola oil, and the rapid increase insoybean meal imports. Domestic production was 219,900 metric tons (mt), all of which was used insoy foods. Demand for temperate oil in CY2011 decreased by 3.5 percent from CY2010, whiledemand for tropical oil increased 2.4 percent over the same period.
Yuichi Hayashi
Benjamin Petlock
2012 Update (soybean, rapeseed, soybean meal, rapeseed meal,
fish meal, soybean oil, rapeseed oil and sunflower seed oil)
Oilseeds and Products Annual
Japan
JA2010
4/27/2012
Required Report - public distribution

7/30/2019 Oilseeds and Products Annual Tokyo Japan 4-27-2012
http://slidepdf.com/reader/full/oilseeds-and-products-annual-tokyo-japan-4-27-2012 2/15
Author Defined:
Oilseeds Situation and Outlook
Oilseed Production
Soybeans, like rice, have been a staple of Japanese food culture since ancient times. It is believed that
soybeans came from China though the Korean peninsula about 2000 years ago. Since their wide
cultivation in the Kamakura era (1185-1333), soybeans have been an important protein source for the
Japanese diet. Recent research providing evidence of the health benefits of soy has further reinforced
consumer demand for soy foods. The Japanese soy industry generally requires product of superior
quality with high protein and sucrose content. Japanese manufactures utilize a variety of different soy
species that are intended for a multiple end uses. Tofu (soybean curd), is the most common end use
for soy in Japan, accounting for 57 percent of total food soybean use.
Although there is a long history of soy production in Japan, in 2011 domestic production was merely
23 percent of the volume of soy food consumption. Prospects for increased production through
improved yields or other means remains limited by various factors including the lengthy rainy season,
and the failure of Japanese agriculture to adopt higher biotech seeds with higher yield
potential. Domestic soybean production has consistently contributed between 3-5 percent of total
soybean supplies (for all uses) for the past thirty years. During that time the lowest level reached was
two percent in 1995 and the highest was six percent in 2008 and 2009. Production in 2011 was
219,900 mt, down one percent from the previous year while the overall planted area decreased by one percent to 136,700 ha.
Soybean production in 2011 was 219,900 mt, approximately the same as the previous year, with yield
decreasing to 1.61 mt per hectare.
Table 1. Planted Area, Production and Yield of Soybeans in Japan
CY Planted Area(Hectares)
Production (mt) Yield (mt per hectare)
Yield – U.S.* (mt per hectare)
2003 151,900 232,200 1.53 2.28
2004 136,800 163,200 1.19 2.86
2005 134,000 225,000 1.68 2.90 2006 142,100 229,200 1.61 2.89
2007 138,300 226,700 1.64 2.78
2008 147,100 261,700 1.78 2.67
2009 145,400 229,900 1.58 2.96
2010 137,700 222,500 1.62 2.98
2111 136,700 219,900 1.61 2.8
Source: MAFF (approximate figures for CY2011) and *USDA-National Agricultural Statistics Service Crop Production
Report (October 12, 2011)
Commodities:
Oilseed, Rapeseed
Oilseed, Soybean

7/30/2019 Oilseeds and Products Annual Tokyo Japan 4-27-2012
http://slidepdf.com/reader/full/oilseeds-and-products-annual-tokyo-japan-4-27-2012 3/15
Farmland dedicated to growing soybeans has often been converted from rice paddies, which
comprised 86 percent of total land use in 2011. Japan’s rice production has exceeded demand for
many years and MAFF has encouraged farmers to switch from rice to soybeans and other crops. At
the same time, soybean dry field farming has been gradually decreased because of local municipalities’
farmland improvement policy and crop change from soybeans to high profit crops such as
vegetables. MAFF has established nonbinding targets for soybean production for 2015 of 140,000 ha
in total planted area, 270,000 mt in total production, and 1.97 mt in yield per hectare.
Soybean production reached 270,000 mt in 2001 and 2002, which is the targeted volume for the basic
plan through 2015. Soybean yields have grown at a sluggish pace and production varies quite widely
by region. A number of challenges make it difficult to achieve increases in the yield and quality of
soybean production in Japan. For example, soybean production is often hampered by heavy rain and
typhoons during the sowing and harvesting seasons. The ratio of lower quality soybeans, “3rd class”
plus “specific end-use class”, has been relatively high for the last eight years ranging from 35 percent
to 61 percent of total production. Improved and more efficient production techniques could contribute
to increased soybean production. Biotech soybeans are one example of new technology that could
increase yields but Japan has not produced GM soybeans commercially despite having approved ten
biotech soybean varieties.
According to a 2012 Japan Biotech report, this lack of acceptance is the result of a number of factors. One important hurdle is overly restrictive local regulation. Often, events that are approved for environmental release (i.e., commercial cultivation) by GOJ, may face additional approval processesrequired by local governments. For instance, in Hokkaido, farmers must first host public meetings, attheir own expense, with neighboring farmers, agricultural cooperative members, regional officials, and other stakeholders. At these meetings, they must announce their intention to plant biotech crops and explain how they will ensure that their crops do not mix with non-biotech crops. Secondly, farmers
must complete a detailed application for submission to the governor's office explaining their plans for growing biotech crops. This application requires precise information on the methods that will be used to monitor the crops, as well as measures for preventing cross-pollination, testing for biotechcontamination, and procedures for responding to emergencies. Finally, farmers must pay a processingfee of 314,760 yen (over $4,000) to the Hokkaido Governor's office in order to cover the costs of reviewing their application. Compounding these legal restrictions, farmers also require customers whowill buy their biotech harvest. Therefore, such restrictions may reduce the potential advantages that biotech traits may offer.
Rapeseed is a low yield crop and requires vast amounts of land to make commercial production
feasible. Total profit from rapeseed cultivation in Japan is just one tenth of rice. In 1957, the total
amount of land dedicated to rapeseed was 260,000 ha. During Japan’s rapid industrial growth in the1960-1980’s, there was a major shift in labor from the agricultural sector to commercial goods;
affecting rapeseed production significantly. The liberalization of soybean imports as an alternative
oilseed in 1961 further accelerated the decrease in production. Due to these factors, the amount of area
dedicated to rapeseed production hit a low of 300 ha by 1999 and, though slightly higher in 2011, still
amounts to just 1,700 ha. Total rapeseed production in 2011 was 1,950 mt, meeting only 0.08 percent
of Japan’s annual consumption demand.

7/30/2019 Oilseeds and Products Annual Tokyo Japan 4-27-2012
http://slidepdf.com/reader/full/oilseeds-and-products-annual-tokyo-japan-4-27-2012 4/15
MAFF has announced targets for domestic agricultural production through 2020, with the goal of
soybean production levels reaching 17 percent of total demand. The targeted volume for soybeans is
600,000 mt, almost three times as much as the 2010 production of 220,000 mt. To achieve this goal
MAFF called for the following measures:
Converting rice paddies to large scale dry fields (two hectares or more).
Breeding and cultivation of high yield varieties.
Improvement of cultivation techniques for soybeans.
Product development emphasizing the characteristics of domestic varieties to create new
demand.
It must be noted that Japan has never reached 600,000 mt in production before, and the last time
soybean production last exceeded 500,000 mt was in 1955. As the current planted area is one-third of
the 1955 area, coupled with a limited workforce, the proposed targets will be difficult to achieve.
MAFF’s target volume for rapeseed production in 2020 is 10,000 mt, ten times the current level, which
could be achieved through the use of high yield varieties and better integration between crushers and
farmers. This is an ambitious target that, even if realized, would result in a gain of just 0.5 percentabove current production levels.
Oilseed Consumption:
Soybeans and rapeseed are the primary oilseeds available in Japan. Soybeans are used as raw materialsin food oil production and as soy meal in feeds. Recently, consumption of soybean products has beendecreasing due to poor economic conditions. Higher prices for raw materials have, in turn, led tohigher prices for processed foods, negatively impacting overall sales. Japan’s oil production is 2.1mmt a year with all of demand currently met by imported soybeans. The demand for oil productionhas increased dramatically from the 1960’s as the Japanese diet shifted more toward Western stylecuisines that depend on heavier oil use. Since 2004 soybean oil demand has continued to decline as
prices have escalated internationally. Domestic soybeans have generally not been used for oil production due to much higher prices than imports and an insufficient amount of supplies having thecharacteristics desired. Soybeans for food use have been about 25 percent of total consumption for awhile. However, the volume used in foods reached a low of less than one mmt for the first time in2009, and the trend has continued since then. Food soybeans, which are not genetically modified, areused for tofu (soybean curd), boiled soybean, natto (fermented soybeans) and miso (fermented soybean
paste), and some whole bean soy sauce (marudaizu shoyu). Despite declining consumption of soybean
food products, soymilk alone increased 5.8 percent over previous year and it reached all-time high.
Table 2. Demand and supply of soybeans in Japan
Demand (1,000 mt) Supply (1,000 mt)
CY Total Oil Food Feed ImportTotal
U.S. Brazil Canada China Domestic
2007 4,226 3,044 1,045 125 4,161 3,325 367 309 137 229
2008 3,953 2,802 1,037 114 3,711 2,729 568 325 86 227
2009 3,593 2,485 993 115 3,390 2,412 570 353 51 262
2010 3,562 2,473 976 113 3,456 2,467 568 371 48 230
2011 3,121* 2,067 941* 113* 3,049 1,894 533 355 44 223
Source: MAFF ; *:MAFF estimate

7/30/2019 Oilseeds and Products Annual Tokyo Japan 4-27-2012
http://slidepdf.com/reader/full/oilseeds-and-products-annual-tokyo-japan-4-27-2012 5/15
All imported rapeseed is used for oil. Rapeseed meal production is a byproduct that is used in feed and
fertilizer production. In CY2011, 2.3 mmt of rapeseed was consumed in Japan, up by two percent
from CY2010. A healthy image for rapeseed oil continues to sustain stable demand.
Table 3. Demand and supply of rapeseeds in Japan (1,000 mt)
Demand (allfor oil)
Supply
CY Total Canada Australia Domestic 2007 2,175 2,134 1,983 150 1
2008 2,237 2,313 2,209 103 0
2009 2,164 2,072 1,957 115 1
2010 2,296 2,344 2,145 199 2
2011 2,349 2,319 2,260 58 2
Source: MAFF
Trade
Japan’s soybean imports in CY2011 were approximately 2.8 mmt, down 18 percent from 3.5 mmt in
CY2010. However, due to higher global prices, the value of imports, $1.8 billion in CY2011,
remained virtually the same.
Soybean prices reached a record high in July 2008 on the Chicago futures market. Although the price
of other grains experiencing price surges such as wheat and corn eventually returned to previous levels,
oilseed prices including that of soybeans and rapeseeds have remained at a relatively high level. The
crushing industry has not been able to adjust soybean oil prices to a more profitable level during the
current economic downturn. Rapeseed oil products have been in a similar situation. However,
earnings performance and demand for rapeseeds has been better than soybeans and the production of
rapeseed oil has been stable.
The United States supplied 1.9 mmt of soybeans to Japan in CY2011, down 23 percent from 2.5 mmtin CY2010, which is 67 percent of import market share. Other major suppliers include Brazil, Canada
and China. Canada and China supply non-biotech soybeans for food use. The CIF import price of
soybeans in CY2011 increased 22 percent to $640/mt from $526/mt in CY2010, setting a record high
year average.
Canada’s share of the Japanese rapeseed market was 97 percent in CY2011, and the average price
increased by 33 percent to $661/mt from $495/mt in CY2010.
Currently the Japanese vegetable oil crushing industry uses only imported materials. Canada and
Australia are the major rapeseed suppliers to Japan. No import duties are levied on soybeans or
rapeseeds.
7/30/2019 Oilseeds and Products Annual Tokyo Japan 4-27-2012
http://slidepdf.com/reader/full/oilseeds-and-products-annual-tokyo-japan-4-27-2012 6/15
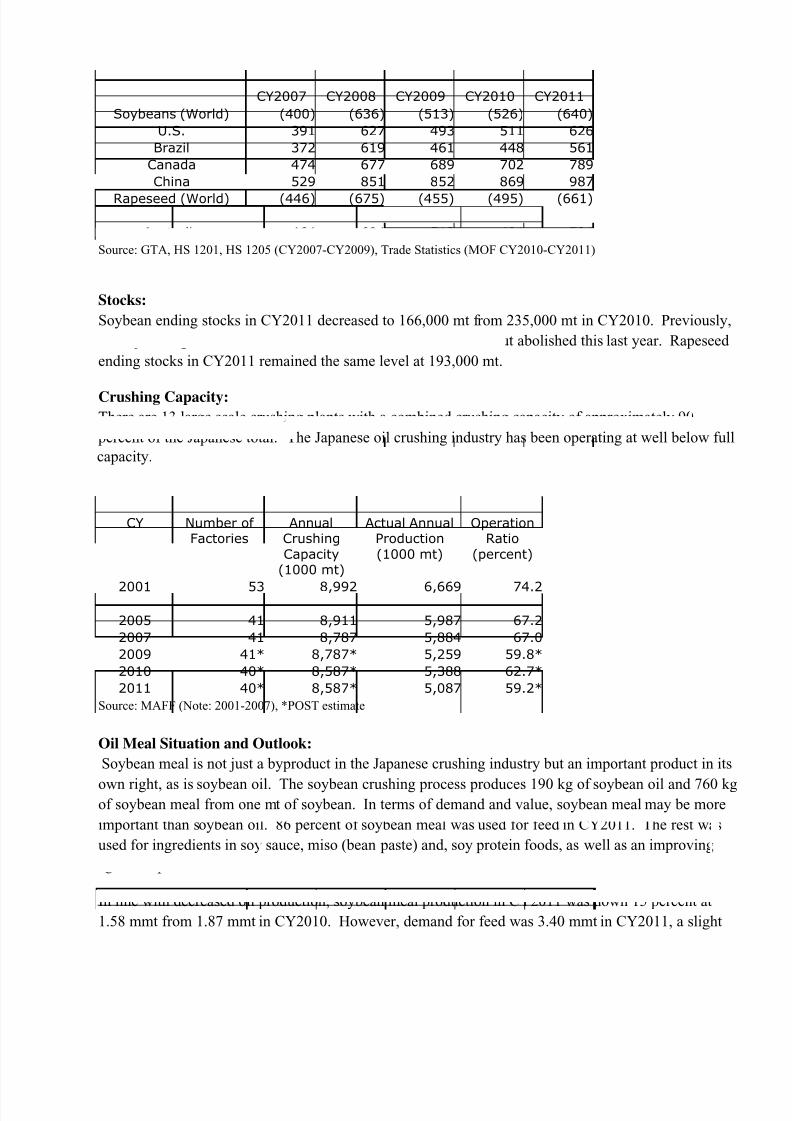
Table 4. CIF Import Price Comparison of Soybeans and Rapeseeds (Dollars per mt)
CY2007 CY2008 CY2009 CY2010 CY2011
Soybeans (World) (400) (636) (513) (526) (640)
U.S. 391 627 493 511 626
Brazil 372 619 461 448 561
Canada 474 677 689 702 789
China 529 851 852 869 987
Rapeseed (World) (446) (675) (455) (495) (661)Canada 445 674 448 491 656
Australia 464 694 513 491 724
Source: GTA, HS 1201, HS 1205 (CY2007-CY2009), Trade Statistics (MOF CY2010-CY2011)
Stocks:
Soybean ending stocks in CY2011 decreased to 166,000 mt from 235,000 mt in CY2010. Previously,
the Japanese government held an additional stock of 31,000 mt but abolished this last year. Rapeseed
ending stocks in CY2011 remained the same level at 193,000 mt.
Crushing Capacity:
There are 13 large scale crushing plants with a combined crushing capacity of approximately 90
percent of the Japanese total. The Japanese oil crushing industry has been operating at well below full
capacity.
Table.5 Japan’s Oil Crushing Capacity
CY Number of Factories
AnnualCrushing
Capacity(1000 mt)
Actual AnnualProduction
(1000 mt)
OperationRatio
(percent)
2001 53 8,992 6,669 74.22003 49 9,294 6,770 72.8
2005 41 8,911 5,987 67.2
2007 41 8,787 5,884 67.0
2009 41* 8,787* 5,259 59.8*
2010 40* 8,587* 5,388 62.7*
2011 40* 8,587* 5,087 59.2*
Source: MAFF (Note: 2001-2007), *POST estimate
Oil Meal Situation and Outlook:
Soybean meal is not just a byproduct in the Japanese crushing industry but an important product in its
own right, as is soybean oil. The soybean crushing process produces 190 kg of soybean oil and 760 kgof soybean meal from one mt of soybean. In terms of demand and value, soybean meal may be more
important than soybean oil. 86 percent of soybean meal was used for feed in CY2011. The rest was
used for ingredients in soy sauce, miso (bean paste) and, soy protein foods, as well as an improving
agent for processed foods.
In line with decreased oil production, soybean meal production in CY2011 was down 15 percent at
1.58 mmt from 1.87 mmt in CY2010. However, demand for feed was 3.40 mmt in CY2011, a slight

7/30/2019 Oilseeds and Products Annual Tokyo Japan 4-27-2012
http://slidepdf.com/reader/full/oilseeds-and-products-annual-tokyo-japan-4-27-2012 7/15
decrease from the previous year. Therefore, imports of soybean meal were 2.20 mmt in CY2011, an
increase of one percent from 2.19 mmt in CY2010: a record high volume. It was the second
consecutive year that Japan had imported more than two million mt of soybean meal.
Table 6. Demand and supply of soybean meals (1,000 mt)
CY Demand Supply
Total Feed Foodandothers
Total InitialStock Domestic Import
2004 3,804 3,308 495 3,928 119 2,627 1,182
2005 4,006 3,409 597 4,109 124 2,355 1,630
2006 3,879 3,401 478 4,008 103 2,258 1,647
2007 4,004 3,465 539 4,121 129 2,286 1,706
2008 3,805 3,306 499 3,936 117 2,137 1,682
2009 3,815 3,373 442 3,926 131 1,880 1,915
2010 3,917 3,467 450* 4,176 123** 1,866 2,186
2011 3,940* 3,400* 540* 3,905* 117* 1,584 2,204
Source: MAFF; *:MAFF estimate; **POST estimate
Table 7. Import Volume of Soybean Meal (1,000 mt)
Country/Year 2008 2009 2010 2011
Argentina 8.1 81.2 40.4 39.9
Brazil 0.2 42.7 71.8 195.9
China 289.4 687.3 780.2 245.8
India 902.7 647.9 817.4 1,298.5
USA 453.2 410.2 428.4 376.6
Other 28.4 45.5 47.9 47.7
Total 1,682.0 1,914.8 2,186.1 2,204.4
Source: Trade Statistics of Japan
Fig. 1 Import volume of soybean meal in Japan (1,000 mt)

7/30/2019 Oilseeds and Products Annual Tokyo Japan 4-27-2012
http://slidepdf.com/reader/full/oilseeds-and-products-annual-tokyo-japan-4-27-2012 8/15
Rapeseed meal and fish meal are used in feed and fertilizer production in Japan. The rapeseed
crushing process produces 410 kg of rapeseed oil and 570 kg of rapeseed meal for every mt of
rapeseed. Rapeseed meal production was down 2.6 percent in CY2011 to 1.23 mmt from 1.27 mmt in
CY2010. Demand has remained stable at around 1.3 mmt over the last five years and the import
volume of rapeseed meal has increased to fill demand. There is no tariff on soybean meal (HS 2304),
rapeseed meal (HS 2306.41), or fishmeal (HS 2301.20).
Table 8. Demand and supply of rapeseed meals (1,000 mt)
CY Demand Supply
Total Feed Fertilizer
and other Total Initial
Stock Domestic Import
2004 1,354 917 428 1,410 63 1,329 18
2005 1,303 909 394 1,386 56 1,394 36
2006 1,305 930 375 1,369 83 1,252 34
2007 1,270 894 375 1,358 64 1,216 78
2008 1,311 1,009 279 1,367 88 1,261 18
2009 1,327 1,033 293 1,381 57 1,198 126
2010 1,300 1,000 268 1,361 55 1,267 39
2011 1,270* 1,000* 270* 1,323 61* 1,234 28
Source: MAFF; *:MAFF estimate
Table 9. Japanese Livestock Population (1,000 heads)
CY Dairy
cows Beef
cattle Swine Layers Broilers
2004 1,690 2,788 9,724 174,550 104,950
2005 1,655 2,747 9,750* 136,000* 102,277
2006 1,636 2,755 9,620 176,955 103,687
2007 1,592 2,806 9,759 183,224 105,2872008 1,533 2,890 9,745 181,664 102,290
2009 1,500 2,923 9,899 178,208 107,141
2010 1,484 2,892 9,750* 139,200* 106,400*
2011 1,467 2,763 9,768 137,352 NA
Source: MAFF Monthly Statistics of Agriculture (as of February each year)*:POST estimate (ref. Grain and Feed Annual 2011)
Distiller’s Dried Grains with Solubles (DDGS):
The distiller’s Dried Grains with Solubles (DDGS) situation was detailed in the GAIN report, “Grain
and Feed Annual 2012” (JA1007). The paragraph and the chart below are an excerpt from the report.
DDGS Imports Leap to a Record High Level:
One of the positive side-effects of the ethanol boom in the United States is the increasing availability of a high value co-product, Distiller’s Dried Grains with Solubles (DDGS). Japan’s imports of DDGSfrom the United Sates have been increasing remarkably and surpassed the 100,000 MT mark in 2007,and 275,000 MT in 2009. Following a slight setback in 2010, the demand for DDGS surged further ascorn prices jumped. The majority of these DDGS are currently used in dairy cattle feed. Aggressivetrade education activities led by the U.S. Grains Council supported this notable growth.

7/30/2019 Oilseeds and Products Annual Tokyo Japan 4-27-2012
http://slidepdf.com/reader/full/oilseeds-and-products-annual-tokyo-japan-4-27-2012 9/15
Oil Situation and Outlook:
The total supply of vegetable oil in CY2011 was 2.42 mmt, including 1.63 mmt from domestic
production and 0.69 mmt from imports. Vegetable oil production in 2011 was 1.63 mmt, a decrease of
3.1 percent from the previous year (1.66 mmt). However, the situation is more involved than this fact
alone would seem to indicate. Compared with the average volume between 2006 and 2008, production
in 2011 was 128,000 mt smaller, a 6.0 percent decrease. Japanese vegetable oil production has been
on a downward trend since 2000 with peak production reaching 1.89 mmt. Production of soybean oil
has especially decreased considerably. After the first confirmed BSE detection in Japan occurred in
2001 and imports of meat bone meal ceased, soybean meal and oil production was increased to fill that
demand. Soybean crushing was at its highest level in 2003 at 760,000 mt, resulting in a supply
situation exceeding demand. Since then, soybean oil production has been decreasing every year. Incontrast to soybeans, rape seed oil production has been stable at around the 950,000 mt level and
reached a record high of 1.03 mmt, offsetting the shortage in soybean oil. While oils from temperate
products have been decreasing, oils from tropical products such as palm oil and palm kernel oil have
been increasing.
International prices for soybean oil and rapeseed oil have been soaring, while palm oil prices have
been relatively low. Around 70 percent of palm oil goes to use in margarine, shortening, instant
noodles, and snacks. The rest is used for various industrial production purposes such as soap,
detergent, industrial lube, resin paint, and cosmetics.

7/30/2019 Oilseeds and Products Annual Tokyo Japan 4-27-2012
http://slidepdf.com/reader/full/oilseeds-and-products-annual-tokyo-japan-4-27-2012 10/15
Table 10. Demand and Supply of Vegetable Oil (1000 mt)
CY 2006 2007 2008 2009 2010 2011*1
Demand
Temperate products** 1,892 1,871 1,797 1,728 1,749 1,688
Tropical products*** 498 528 548 562 581 595
Domestic consumption 2,390 2,399 2,345 2,290 2,330 2,283
Supply
Initial stock 122 125 107 154 119 109
Domestic
production
Soybean oil 576 576 542 477 468 401*5
Rapeseed oil 972 942 951 929 993 1,027*5
Other oil 215 212 211 193 196 200
Total 1,763 1,730 1,703 1,599 1,656 1,628
Import
Temperateproducts**
145 133 147 108 94 90
Tropicalproducts***
498 528 548 562 581 595
Total 643 661 695 670 675 685
Total 2,528 2,516 2,505 2,423 2,450 2,398
Year end stock 125 107 154 119 109 105
Source: MAFF
*1: MAFF estimate *2: Temperate products include oil from soybean, rapeseed, mustard, rice, cotton seed, safflower, sesame, corn, peanut and
sunflower.
*3: Tropical products for human consumption include oil from coconut, palm kernel, palm.
*4: POST estimate
*5: Actual
Trade:
Rapeseed oil comprises the largest share of vegetable oil supplies in the Japanese market and exceeded
one million mt (including both domestic production and imports) in 2011. The second largest category
is tropical oil (palm oil, palm kernel oil, and coconut oil), which has become the major vegetable oil in
Japan. Import volumes have exceeded domestic soybean oil production since 2007.
Palm oil is the major vegetable oil imported by Japan. Unlike other oilseeds such as soybean and
rapeseed, palm oil is produced from the flesh of fruit. This makes it difficult to import raw materials
meeting quality specifications that are in demand for production in Japan. Malaysia dominates the
palm oil market in Japan. Japan imports palm kernel oil, coconut oil, soybean oil, olive oil, and rice
oil to meet various demands. Imports of soybean oil and rapeseed oil have been very minimal. The
market is protected by high tariffs on soybean and rapeseed oils. The tariff for both oils is either 10.9
yen/kg or 13.2 yen/kg depending on the acid value.

7/30/2019 Oilseeds and Products Annual Tokyo Japan 4-27-2012
http://slidepdf.com/reader/full/oilseeds-and-products-annual-tokyo-japan-4-27-2012 11/15
Table 11. Japan's tariff on major oilseeds and oils
HS Code Commodity Duty JFY 2011
1201.00-010,090 Soybeans Free
1205.10-000 Rapeseed (low erucic acid) Free
1205.90-000 Rapeseed (others) Free
1507.10-100 Soybean oil, crude, of an acid valueexceeding 0.6
10.9 yen/kg
1507.10-200 Soybean oil, crude, other 13.2 yen/kg 1507.90-000 Soybean oil, other 13.2 yen/kg
1508.10-100 Peanut oil, crude, of an acid valueexceeding 0.6
8.5 yen/kg
1508.10-200 Peanut oil, crude, other 10.4 yen/kg
1508.90-000 Peanut oil, other 10.4 yen/kg
1509 & 1510 Olive oil Free
1511.10-000 Palm oil, crude 3.5 percent
1511.90-010 Palm stearin 2.5 percent
1511.90-090 Palm oil, other 3.5 percent
1512.11-110 Sunflower-seed oil, of an acid valueexceeding 0.6
8.5 yen/kg
1512.11-210 Safflower oil, of an acid value exceeding0.6
8.5 yen/kg
1512.11-120 Sunflower-seed oil, other 10.4 yen/kg
1512.11-220 Safflower-seed oil, other 10.4 yen/kg
1514.11-100 Low erucic acid rapeseed oil, crude, of anacid value exceeding 0.6
10.9 yen/kg
1514.11-200 Low erucic acid rapeseed oil, crude, other 13.2 yen/kg
1514.19-000 Low erucic acid rapeseed oil, other 13.2 yen/kg
1514.91-100 Rapeseed oil, other, crude, of an acid value
exceeding 0.6 10.9 yen/kg
1514.91-200 Rapeseed oil, other, crude, other 13.2 yen/kg
Source: Japan Tariff Association

7/30/2019 Oilseeds and Products Annual Tokyo Japan 4-27-2012
http://slidepdf.com/reader/full/oilseeds-and-products-annual-tokyo-japan-4-27-2012 12/15
Production, Supply and Demand Data Statistics:
Oilseed, Soybean Japan 2010/2011 2011/2012 2012/2013
Market Year Begin: Oct 2010 Market Year Begin: Oct 2011 Market Year Begin: Oct 2012
USDA Official New Post USDA Official New Post USDA Official New Post
Area Planted 145 137 145 135 135
Area Harvested 135 137 135 135 135
Beginning Stocks 220 220 102 195 115
Production 220 220 220 220 220
MY Imports 2,917 2,917 2,700 2,700 2,600
MY Imp. from U.S. 2,070 2,032 1,500 1,800 1,700
MY Imp. from EU 0 0 0 0 0
Total Supply 3,357 3,357 3,022 3,115 2,935
MY Exports 0 0 0 0 0
MY Exp. to EU 0 0 0 0 0
Crush 2,070 2,108 1,800 1,950 1,835
Food Use Dom. Cons. 995 941 985 940 900
Feed Waste Dom. Cons. 190 113 170 110 100
Total Dom. Cons. 3,255 3,162 2,955 3,000 2,835
Ending Stocks 102 195 67 115
100
Total Distribution 3,357 3,357 3,022 3,115 2,935
1000 HA, 1000 MT
Production, Supply and Demand Data Statistics:
Oilseed, Rapeseed Japan 2010/2011 2011/2012 2012/2013
Market Year Begin: Oct 2010 Market Year Begin: Oct 2011 Market Year Begin: Oct 2012
USDA Official New Post USDA Official New Post USDA Official New Post
Area Planted 0 2 0 1 1
Area Harvested 1 2 1 1 1
Beginning Stocks 80 80 56 61 63
Production 1 2 1 2 2
MY Imports 2,321 2,321 2,350 2,250 2,250
MY Imp. from U.S. 0 0 0 0 0
MY Imp. from EU 0 0 0 0 0
Total Supply 2,402 2,403 2,407 2,313 2,315
MY Exports 0 0 0 0 0
MY Exp. to EU 0 0 0 0 0
Crush 2,341 2,342 2,346 2,250 2,250
Food Use Dom. Cons. 0 0 0 0 0
Feed Waste Dom. Cons. 5 0 5 0 0
Total Dom. Cons. 2,346 2,342 2,351 2,250 2,250
Ending Stocks 56 61 56 63 65
Total Distribution 2,402 2,403 2,407 2,313 2,315
1000 HA, 1000 MT

7/30/2019 Oilseeds and Products Annual Tokyo Japan 4-27-2012
http://slidepdf.com/reader/full/oilseeds-and-products-annual-tokyo-japan-4-27-2012 13/15
Production, Supply and Demand Data Statistics:
Meal, Soybean Japan 2010/2011 2011/2012 2012/2013
Market Year Begin: Oct 2010 Market Year Begin: Oct 2011 Market Year Begin: Oct 2012
USDA Official New Post USDA Official New Post USDA Official New Post
Crush 2,070 2,108 1,800 1,950 1,835
Extr. Rate, 999.9999 1 1 1 1 1
Beginning Stocks 256 256 251 200 130
Production 1,591 1,602 1,384 1,480 1,390
MY Imports 2,208 2,183 2,250 2,300 2,460
MY Imp. from U.S. 404 403 400 400 400
MY Imp. from EU 0 1 0 0 0
Total Supply 4,055 4,041 3,885 3,980 3,980
MY Exports 0 0 0 0 0
MY Exp. to EU 0 0 0 0 0
Industrial Dom. Cons. 330 330 330 330 330
Food Use Dom. Cons. 120 111 120 120 120
Feed Waste Dom. Cons. 3,354 3,400 3,266 3,400 3,400
Total Dom. Cons. 3,804 3,841 3,716 3,850 3,850
Ending Stocks 251 200 169 130
130
Total Distribution 4,055 4,041 3,885 3,980 3,980
1000 MT, PERCENT
Production, Supply and Demand Data Statistics:
Meal, Rapeseed Japan 2010/2011 2011/2012 2012/2013
Market Year Begin: Oct 2010 Market Year Begin: Oct 2011 Market Year Begin: Oct 2012
USDA Official New Post USDA Official New Post USDA Official New Post
Crush 2,341 2,342 2,346 2,250 2,250
Extr. Rate, 999.9999 1 1 1 1 1
Beginning Stocks 15 15 10 4 4
Production 1,329 1,234 1,330 1,190 1,190
MY Imports 25 25 25 80 80
MY Imp. from U.S. 0 0 0 0 0
MY Imp. from EU 0 0 0 0 0
Total Supply 1,369 1,274 1,365 1,274 1,274
MY Exports 0 0 3 0 0
MY Exp. to EU 0 0 0 0 0
Industrial Dom. Cons. 330 270 330 270 270
Food Use Dom. Cons. 0 0 0 0 0
Feed Waste Dom. Cons. 1,029 1,000 1,022 1,000 1,000
Total Dom. Cons. 1,359 1,270 1,352 1,270
1,270
Ending Stocks 10 4 10 4 4
Total Distribution 1,369 1,274 1,365 1,274 1,274
1000 MT, PERCENT

7/30/2019 Oilseeds and Products Annual Tokyo Japan 4-27-2012
http://slidepdf.com/reader/full/oilseeds-and-products-annual-tokyo-japan-4-27-2012 14/15
Production, Supply and Demand Data Statistics:
Meal, Fish Japan 2010/2011 2011/2012 2012/2013
Market Year Begin: Jan 2011 Market Year Begin: Jan 2012 Market Year Begin: Jan 2012
USDA Official New Post USDA Official New Post USDA Official New Post
Catch For Reduction 1,450 1,450 1,450 1,450 1,450
Extr. Rate, 999.9999 0 0 0 0 0
Beginning Stocks 17 17 4 5 10
Production 305 185 305 200 200
MY Imports 237 237 280 300 300
MY Imp. from U.S. 7 7 5 5 5
MY Imp. from EU 1 0 1 0 0
Total Supply 559 439 589 505 510
MY Exports 5 1 5 10 10
MY Exp. to EU 0 0 0 0 0
Industrial Dom. Cons. 50 50 50 50 50
Food Use Dom. Cons. 0 0 0 0 0
Feed Waste Dom. Cons. 500 383 530 435 440
Total Dom. Cons. 550 433 580 485 490
Ending Stocks 4 5 4 10
10
Total Distribution 559 439 589 505 510
1000 MT, PERCENT
Production, Supply and Demand Data Statistics:
Oil, Soybean Japan 2010/2011 2011/2012 2012/2013
Market Year Begin: Oct 2010 Market Year Begin: Oct 2011 Market Year Begin: Oct 2012
USDA Official New Post USDA Official New Post USDA Official New Post
Crush 2,070 2,108 1,800 1,950 1,835
Extr. Rate, 999.9999 0 0 0 0 0
Beginning Stocks 9 9 3 28 20
Production 378 401 329 350 330
MY Imports 19 19 20 20 20
MY Imp. from U.S. 5 5 5 5 5
MY Imp. from EU 0 0 0 0 0
Total Supply 406 429 352 398 370
MY Exports 0 0 0 0 0
MY Exp. to EU 0 0 0 0 0
Industrial Dom. Cons. 25 25 25 25 25
Food Use Dom. Cons. 378 376 322 353 325
Feed Waste Dom. Cons. 0 0 0 0 0
Total Dom. Cons. 403 401 347 378 350
Ending Stocks 3 28 5 20 20
Total Distribution 406 429 352 398 370
1000 MT, PERCENT

7/30/2019 Oilseeds and Products Annual Tokyo Japan 4-27-2012
http://slidepdf.com/reader/full/oilseeds-and-products-annual-tokyo-japan-4-27-2012 15/15
Production, Supply and Demand Data Statistics:
Oil, Rapeseed Japan 2010/2011 2011/2012 2012/2013
Market Year Begin: Oct 2010 Market Year Begin: Oct 2011 Market Year Begin: Oct 2012
USDA Official New Post USDA Official New Post USDA Official New Post
Crush 2,341 2,342 2,346 2,250 2,250
Extr. Rate, 999.9999 0 0 0 0 0
Beginning Stocks 19 19 31 32 30
Production 937 1,027 939 990 990
MY Imports 26 26 20 25 25
MY Imp. from U.S. 0 1 0 0 0
MY Imp. from EU 0 2 0 0 0
Total Supply 982 1,072 990 1,047 1,045
MY Exports 1 0 1 0 0
MY Exp. to EU 0 0 0 0 0
Industrial Dom. Cons. 50 50 50 50 50
Food Use Dom. Cons. 900 990 905 967 965
Feed Waste Dom. Cons. 0 0 0 0 0
Total Dom. Cons. 950 1,040 955 1,017 1,015
Ending Stocks 31 32 34 30
30
Total Distribution 982 1,072 990 1,047 1,045
1000 MT, PERCENT
Production, Supply and Demand Data Statistics:
Oil, Sunflowerseed Japan 2010/2011 2011/2012 2012/2013
Market Year Begin: Oct 2010 Market Year Begin: Oct 2011 Market Year Begin: Oct 2012
USDA Official New Post USDA Official New Post USDA Official New Post
Crush 0 0 0 0 0
Extr. Rate, 999.9999 0 0 0 0 0
Beginning Stocks 5 5 5 5 5
Production 0 0 0 0 0
MY Imports 29 32 40 30 30
MY Imp. from U.S. 15 15 0 20 20
MY Imp. from EU 0 4 0 3 3
Total Supply 34 37 45 35 35
MY Exports 0 0 0 0 0
MY Exp. to EU 0 0 0 0 0
Industrial Dom. Cons. 0 0 0 0 0
Food Use Dom. Cons. 29 32 40 30 30
Feed Waste Dom. Cons. 0 0 0 0 0
Total Dom. Cons. 29 32 40 30 30
Ending Stocks 5 5 5 5 5
Total Distribution 34 37 45 35 35
1000 MT, PERCENT