vietnam oilseeds and products annual vietnam oilseeds and products annual … · kido corporation...
TRANSCRIPT

1
THIS REPORT CONTAINS ASSESSMENTS OF COMMODITY AND TRADE ISSUES MADE BY
USDA STAFF AND NOT NECESSARILY STATEMENTS OF OFFICIAL U.S. GOVERNMENT
POLICY
Required Report - public distribution
Vietnam
Oilseeds and Products Annual
Vietnam Oilseeds and Products Annual
Approved By:
Robert Hanson
Prepared By:
Huong Nguyen, Megan Francic
Report Highlights:
Driven by strong feed demand from the livestock and aquaculture sectors and falling local soybean
cultivation area, soybean imports are forecast to increase to 1.9 million metric tons (MMT) for
marketing year (MY) 2018/19 (calendar year [CY] 2019), a significant increase from the MY2017/18
estimated level of 1.65 MMT. In MY2017/18, the United States had the largest market share for
soybeans due to competitive prices. Post projects that soybean meal (SBM) imports will continue to
increase to 5.2 MMT and 5.3 MMT in MY2017/18 and MY2018/19, respectively, driven by the
continued expansion of the domestic feed and food industries.
Date: 4/11/2018
GAIN Report Number: VM8018

2
EXECUTIVE SUMMARY
Vietnam soybean production has been dropping in recent years due to low yields and the continuing
decline in growing area as farmers switch to more profitable crops, including other field crops and fruits
and vegetables. Soybean production continues to fall well below the demand from the food, and
livestock and aquaculture feed sectors.
Post estimates MY2017/18 soybean imports at 1.65 MMT, an increase of 5 percent over the previous
year. Post forecasts total MY2018/19 soybean imports to increase to 1.9 MMT due to rising demand
from the food and feed industries and the prediction that the already on-line crushing facility in the
South and the newly established crushing facility in the North will run at increased capacity. In MY
2017/18 and MY 2016/17, the United States remained the largest exporter of soybeans to Vietnam due
to competitive prices, with Brazil second.
Post projects that SBM imports will continue to increase to 5.2 MMT and 5.3 MMT in MY 2017/18 and
MY2018/19, respectively, due to continued strong demand from the food processing and livestock and
aquaculture feed sectors. Post projects that the domestic livestock and poultry sectors will become more
stable and developed in coming years due to increased foreign direct and local investment.
Peanut production is projected to drop in coming years due to a continued decrease in cultivation areas
as Vietnamese farmers switch to more profitable crops, such as fruits and vegetable for both the
domestic market and for export. At the same time, total domestic per capita peanut consumption will
increase.
Coconut production is projected to increase in both MY2017/18 and MY2018/19 due to expansion in
coconut plantation area over the past 5 years. Production of copra, copra meal, and copra oil are
negligible due to low domestic demand. There is higher demand for other coconut processed products,
such as desiccated coconuts, coconut milk, and coconut milk powder.
Post forecasts that vegetable oil production will continue to increase in MY2017/18 and MY2018/19 to
meet the increasing demand from both the domestic and export markets. However, Vietnam continues
to rely heavily on imported vegetable oils to meet consumption demand because domestic crude
soybean oil production from the crushing industry remains small. Palm oil imports accounted for about
90 percent of total vegetable oil imports in MY2016/17 due to competitive prices, as compared to other
vegetable oils.
OILSEEDS SITUATION AND OUTLOOK
SOYBEANS
PRODUCTION
Soybean production dropped in MY2016/17 as farmers switched to more-profitable crops
According to official data from the Vietnamese General Statistics Office (GSO), Vietnam’s MY2016/17
soybean production was 102.3 thousand metric tons (TMT) on 68,500 hectares (ha). This is a
production drop of 18 percent compared with the previous year. The continuing decline in soybean

3
growing areas in both the North and South is a result of Vietnamese farmers switching to more
profitable crops, such as various fruits and vegetables, and impacts from unfavorable weather in some
growing areas, especially in Hanoi, Ha Giang, and Thanh Hoa provinces as farmers took previously
cultivated land out of soybean production. However, Post notes a slight increase in yield due to the
planting of higher yielding varieties (See Table 1).
Soybean production is projected to drop further in MY2017/18 and MY2018/19 due to a continuing
decline in growing areas
Post estimates MY2017/18 and forecasts MY2018/19 soybean production at about 90 TMT on a
projected 60,000 harvested hectares, as MY2016/17 trends carry through and farmers continue
switching to more profitable crops. In general, the scale of soybean production remains small compared
with other crops and continues to fall far short of domestic demand due to generally low yields and the
aforementioned reduced growing area. Commercial biotech soybeans are not cultivated in Vietnam, and
there are no applications currently in review. For more information on biotech crop cultivation in
Vietnam, please refer to GAIN report VM7071.
Table 1: Soybean production
2014 2015 2016 2017 2018* 2019*
Crop area (thousand ha) 110.2 100.8 84.6 68.5 60 60
Crop yield (MT/ha) 1.43 1.45 1.47 1.49 1.50 1.50
Total production (TMT) 157.9 146.4 124.3 102.3 90 90
Source: General Statistics Office (GSO), Ministry of Agriculture and Rural Development (MARD),
*Post estimates
CONSUMPTION
Industrial crush
Soybean consumption is projected to increase in MY2017/18 and MY2018/19 due to strong demand
from industrial crushing plants
Post reduces crush volume to 1.1 MMT in MY2016/17 from the USDA official data of 1.2 MMT due to
the availability of new data provided by industry sources.
Post’s estimate of the MY2017/18 crush volume comes in lower than USDA official data at 1.2 MMT,
as the crushing facility in the South anticipates that crushing volume will remain unchanged from the
previous year. While in the Bac Ninh province in the North, a new cursing plant owned by Dabaco
Group with a capacity of 1,000 MT of soybeans per day is expected to come on-line by July. Post
anticipates that this crushing plant will not run at full capacity in the first year of operation, but could
increase demand for imported soybeans in the coming years.
Post forecasts MY2018/19 soybean crush to increase to 1.35 MMT due to expected operation of both
crushing facilities in Vietnam, as the need for SBM in the feed sector continues to drive overall demand
higher.
Feed production will continue to increase
Post estimates total feed production for MY2017/18 at 30 MMT, of which 23.8 MMT is animal feed and
6.2 MMT is aquaculture feed. SBM accounts for 20 percent of total feed production. Post forecasts
4
Vietnam’s total feed production for MY2018/19 to increase to 30.9 MMT, of which 24 MMT is animal
feed and 6.9 MMT is aquaculture feed, due to continued strong demand from livestock and aquaculture
sectors. For more information about the feed sector, please reference the upcoming Grain and Feed
Annual which will be published in early April 2018.
Post projects that the domestic livestock sector will become more stable and developed in the coming
years due to better management practices, improved animal disease control measures at livestock farms,
higher demand for domestic meat, milk, and egg consumption, and increased investments from local and
foreign direct investors in many sectors such as feed production, slaughtering, and meat processing.
Examples of new investment include:
The U.S.-invested Cargill Vietnam Company Limited, one of the three largest animal feed producers
in the country, has received approval to build an estimated $70 million animal feed operation in the
northern province of Bac Ninh. The plant will be the largest of Cargill’s 11 facilities in Vietnam.
Cargill currently supplies around 1.6 MMT of animal feed annually.
Vietnam Dairy Products Joint Stock Company (Vinamilk) recently launched a high-tech dairy
farming complex in the north-central province of Thanh Hoa. The farm currently has 16,000 dairy
cows imported from the United States and Australia, and the herd could rise to 24,000 dairy cows in
the second phase. The farm is expected to produce about 36 million litters of milk per year.
Recently, Dabaco Group launched a Great Grand-Parental (GGP) chicken breeding center in Bac
Giang province. This center has about 60,000 GGP breeding chickens to produce about 5 million
Grand-Parental breeding chickens annually.
The Massan Nutri-Science Group, a Vietnamese Company, started building a modern pig
slaughterhouse and meat processing plant in the northern province of Ha Nam. The plant is
expected to begin its operation by September 2018. It has a total capacity of 1.4 million pigs per
year to product fresh, chilled meat products for the domestic market.
The Koyu & Unitek Company, a joint venture between Australia and Japan based in the southern
province of Dong Nai, operates a chicken processing factory with the capacity for 350 MT of
processed chicken meat per month. It started exporting in 2017 to primarily the Japanese market.
This company is building a new $20 million factory in the province which is expected to produce
550 MT of processed chicken meat per month once operational in 2019.
VISSAN Joint Stock Company, the largest meat processor in Vietnam, continues to focus on food
safety and traceability of meat products and to invest more in processing technologies. It is currently
building a food-processing cluster in Long An Province.
Bien Dong Trade and Investment Joint Stock Company invested in a slaughtering plant in Nam Dinh
Province with capacity of 250-300 pigs per hour. The company aims to export meat to Japan,
Republic of Korea, and Hong Kong.
With its recent acquisition of Cau Tre Export Goods Processing Joint Stock Company, South
Korean’s CJ Company produces ready meals and frozen food, such as spring rolls, tea, raw meat and
sausages.
The Mavin Food Joint Venture Company established a new factory in Dong Van II Industrial Park.
Mavin plans to export meat products to Japan, Singapore, and South Korea.
Kido Corporation (KDC) has acquired a stake of 50 percent in Dabaco Foodstuffs Processing Co
Ltd. to enhance its presence in the food processing sector. This company operates in the field of
processing fresh, frozen, and canned foods, such as meat and sausage products.
5
These new investments in the livestock and meat processing sectors would help farmers avoid any
impacts or losses in the future if there are any significant price drops for live pigs due to changes in the
Chinese market.
In addition, Vietnam’s fisheries sector continues to grow. Vietnam’s exports of shrimp, tra fish, and
other seafood products to the United States and many countries in the EU and Asia have significantly
increased in the recent years, due to increasing demand. This will drive continued aquaculture
investment, especially for shrimp and fish, leading to higher demand from the aquaculture feed industry.
Food Use Consumption
Domestically-produced full-fat soybeans and small volumes of imported soybeans are used in food
processing (tofu and soymilk) and household-scale soybean oil production. Food use of soybean
products (such as soymilk, other drinks products, and tofu) also continues to grow at about 6.5-7 percent
per year. Post’s MY2017/18 and MY2018/19 food use consumption estimates are 460 TMT and 490
TMT, respectively. Currently, for soymilk production, there are three companies producing soymilk on
an industrial scale: Vinamilk; Vinasoy; and, Nutifood. Household consumers also produce soymilk
with small machines at home. Roasted soybeans are popular as a healthy snack in major cities.
Feed, Seed, Waste, and Fertilizer Consumption
Post projects increasing demand in the livestock and aquaculture feed industries for fresh full fat
soybean meal (FFSBM). Imported soybeans continue to feed small extruder machines to produce
FFSBM for livestock, primarily piglet, and aquaculture feed industry.
Recently, Vietnamese farmers are also using whole soybeans to make fertilizers for fruits, vegetables,
flowers and ornamental trees. Local farmers have reported that they prefer to use fermented soybean
fertilizer for pomelo fruits and other citrus trees as it leads to better soil, higher productivity, and fruits
have brighter color and sweeter taste.
Post estimates total feed, seed, waste, and fertilizer consumption at 180 TMT in MY2016/17 and
increase to 190 TMT and 200 TMT in MY2017/18 and MY2018/19. Expanded consumption in
MY2016/17 is primarily due to increases in FFSBM usage.
Total Domestic Consumption
Post reports total MY2016/17 and estimates MY2017/18 soybean domestic consumption at 1.71 MMT
and 1.85 MMT, respectively, which is lower than USDA official data (at 1.8 MMT and 2.1 MMT) due
to lower estimated crushing volume. Post forecasts total MY2018/19 soybean domestic consumption to
increase to 2.04 MMT.
TRADE
United States remained the largest soybean exporter to Vietnam in MY2016/17
In MY2016/17, the United States remained the leading soybean exporter to Vietnam, replacing Brazil
with more competitive prices. In terms of market share, U.S. soybean exports have 47 percent, Brazil
39 percent, and 13 percent is from other countries. According to Post’s adjusted data, Vietnam
imported 1.58 MMT of soybeans in MY2016/17, a slight drop of 0.5 percent from the previous year
(see Table 2), as well as USDA official data due to new industry data.
6
Table 2: Soybean imports by source
Country 2013 2014 2015
2016 2017
Total imports (TMT): 1,290.7 1,564.0 1,707.0 1,584.4 1,576.0
USA 555.5 697.8 660.0 845.7 750.1
Brazil 571.1 538.8 687.0 329.9 614.8
Canada 36.0 65.6 107.9 100.4 137.2
Benin n/a n/a n/a n/a 26.4
Cambodia n/a n/a 31.6 28.3 19.1
Argentina 66.0 151.6 175.8 89.6 2.4
Others 62.1 110.2 44.7 190.5 26.0
Source: GSO, GCO, BICO data, Global Trade Atlas (GTA); Local importers; Post adjusted data
Note: Soybean (HS code: 1201)
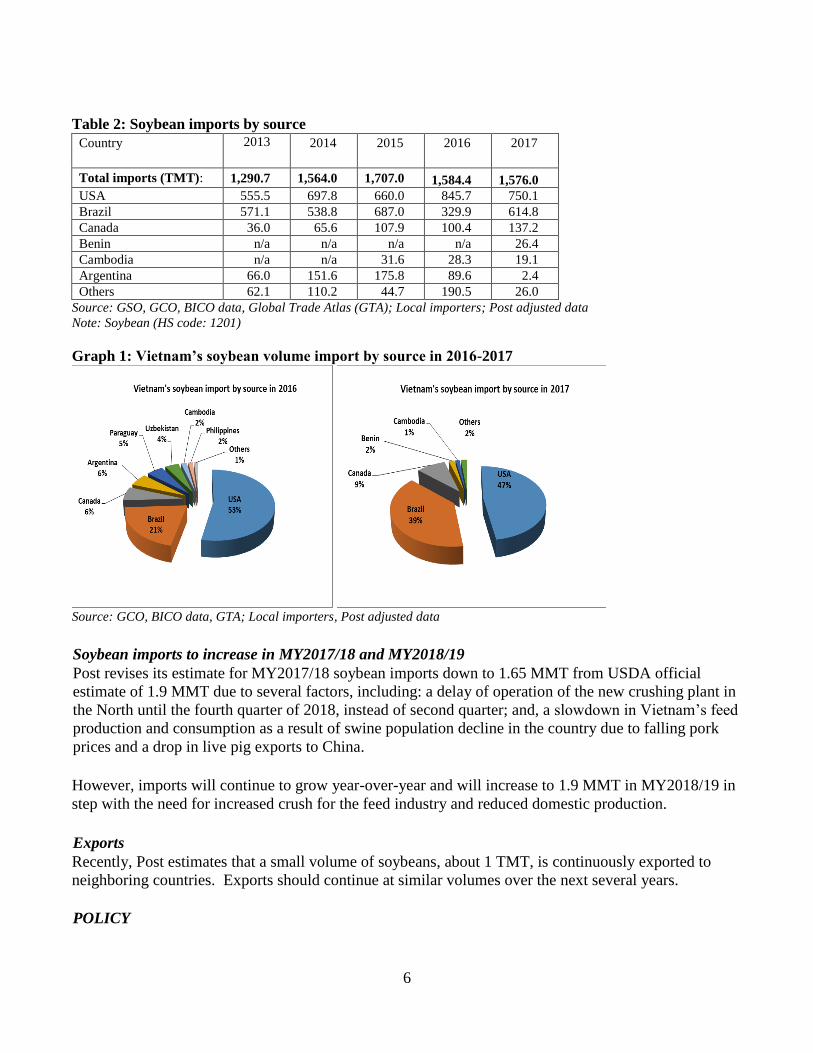
Graph 1: Vietnam’s soybean volume import by source in 2016-2017
Source: GCO, BICO data, GTA; Local importers, Post adjusted data
Soybean imports to increase in MY2017/18 and MY2018/19
Post revises its estimate for MY2017/18 soybean imports down to 1.65 MMT from USDA official
estimate of 1.9 MMT due to several factors, including: a delay of operation of the new crushing plant in
the North until the fourth quarter of 2018, instead of second quarter; and, a slowdown in Vietnam’s feed
production and consumption as a result of swine population decline in the country due to falling pork
prices and a drop in live pig exports to China.
However, imports will continue to grow year-over-year and will increase to 1.9 MMT in MY2018/19 in
step with the need for increased crush for the feed industry and reduced domestic production.
Exports
Recently, Post estimates that a small volume of soybeans, about 1 TMT, is continuously exported to
neighboring countries. Exports should continue at similar volumes over the next several years.
POLICY
7
Soybean tariffs for countries with trade agreements dropped
According to Decree 125/2017/ND-CP dated November 16, 2017, the tariff rate applied to soybeans
(HS Code: 1201) imported from countries having Most Favored Nation (MFN) status with Vietnam
remains at zero percent.
For countries having free trade agreements (FTA) with Vietnam, 2018 tariffs changed from 2017 as
follows (please refer to Table 4 for acronym definitions):
For ACFTA, dropped from 5 percent to zero percent under beginning Jan. 1, 2018, according to
Decree No. 153/2017/NĐ-CP dated December 27, 2017.
For VJEPA, remained at 1 percent for January 1, 2018- March 31, 2018, and will drop to 0.5 percent
for April 1, 2018- March 31, 2019, according to Degree No. 155/2017/NĐ-CP dated December 27,
2017.
For AIFTA, dropped from 2 percent in 2017 to 1 percent in 2018, according to the Decree
159/2017/ND-CP dated 27 December 2017.
For AJCEP, remained at 5 percent for Jan. 1, 2018- March 31, 2018, and will drop to zero percent
beginning on April 1, 2018, according Degree No. 160/2017/ND-CP dated December 27, 2017.
All other FTA tariffs remain at zero percent (see Table 3).
Table 3: Soybean import tariffs
HS code Descripti
on
Import tariffs (%)
MF
N
ATIG
A
ACFT
A AKFT
A
VKFT
A VJEP
A AJCE
P AIFT
A AANZFT
A VCFT
A
VN-
EAE
U
1201 Soybeans, whether or not broken
1201.10.
00
- Suitable
for
sowing 0 0 0 0 0 0 0 0 0 0 0
1201.90.
00 - Other 0 0 0 0
0
1 5 1 0 5 0
Source: Ministry of Finance
Notes:
MFN: Most Favored Nation
ATIGA: ASEAN Trade In Goods Agreement
ACFTA: ASEAN-China Free Trade Agreement
AKFTA: ASEAN-Korea Free Trade Agreement
VKFTA: Vietnam-Korea Free Trade Agreement VJEPA: Vietnam-Japan Economic Partnership Agreement
AJCEP: ASEAN Japan Comprehension Economic Partnership
AIFTA: ASEAN-India Free Trade Agreement
AANZFTA: ASEAN-Australia-New Zealand Free Trade Agreement
VCFTA: Vietnam-Chile Free Trade Agreement
VN-EAEU: Vietnam-Eurasia Economic Union Free Trade Agreement
PEANUTS
PRODUCTION
Peanut production to drop in MY2017/18 and MY2018/19 due to a decrease in cultivation area

8
According to MARD, peanut production in MY2016/17 was estimated at 462 TMT on 195 thousand ha
(tha) of cultivated area, a drop of 2.2 percent in area from the previous year. The drop took place mainly
in provinces of Hanoi, Thai Binh, Bac Giang, Binh Duong, Binh Phuoc, and Long An. Although the
peanut crop was cultivated in a smaller area compared to the previous year, peanut production in
MY2016/17 was almost at the same level due to an increase in yield and improvements in peanut
varieties.
Post forecasts that peanut production in MY2017/18 and MY2018/19 will drop to 450 TMT due to a
decrease in cultivation area. Currently, Vietnamese farmers grow many different peanut varieties
including V79, 4329, 1660, LVL, TB-25, L14. The decline in peanut growing area is a result of
Vietnamese farmers switching to more profitable crops such as fruit and vegetables for both the
domestic and export markets. Unfavorable or extreme weather occurred also reduced growing area for
peanut production in some areas in Vietnam.
Table 4: Vietnam’s Peanut Production 2012 2013 2014 2015 2016 2017 2018* 2019*
Crop area (tha) 219.3 216.3 209.0 199.9 199.4 195.3 190 190
Crop yield (MT/ha) 2.14 2.28 2.17 2.27 2.33 2.36 2.37 2.37
Total peanut production**(TMT) 468.4 492.6 454.5 454.1 463.6 461.5 450 450
Source: GSO, MARD
*Post estimate
**in-shell basis
CONSUMPTION
Most locally produced and imported peanuts are consumed in the retail sales channels (open markets,
wet markets, independent food stores, small grocery stores, convenient stores, supermarkets, and
hypermarkets) and in foodservice and food processing (especially in the snack industry) for both
domestic consumption and export. Post estimates that the volume of peanuts used for crushing to make
peanut oil and peanut meal at the household scale is flat due to low demand for peanut oils and high
production costs. Prices of locally produced peanut oils are more expensive than other oils. In addition,
due to strong marketing activities and advertising campaigns by local vegetable oil producers,
consumers’ preference for soybean oil and other refined vegetable oil products, such as sunflower oil,
canola oil, and olive oil, has been increasing.
In Vietnam, in-shell peanuts are mostly available from street vendors in boiled and roasted format, at
“bia hoi” (fresh draft beer) restaurants, and in wet markets during harvest season. Small retail stores
usually sell raw shelled peanuts in loose format, while modern channel retail, such as supermarkets and
hypermarkets, sell raw shelled peanuts in a packaged format, and foodservice providers and food
processors purchase peanuts in bulk. Packaged processed peanuts products are popular in Vietnam and
diverse; they include traditional roasted peanuts and peanuts coated with salt, wasabi, milk, spices,
coconut, and chocolate. The confectionary sector also uses peanuts to make local candy specialties.
Local food processing companies also use domestic peanuts to produce peanut butter, but production is
negligible.
Post observes organic peanuts remain negligible in Vietnam due to limited market demand and lack of
supply.

9
Post estimates total domestic peanut consumption at 660 TMT in MY2016/17. Post forecasts
MY2017/18 and MY2018/19 consumption to increase to 680 TMT and 700 TMT, respectively, as per
capita consumption increases due to the popularity of peanut-based snacks, new processed products, and
vegetarian diets.
TRADE
MY2016/17 peanut imports decreased sharply due to significantly lower demand for exports
In MY2016/17, total in-shell basis peanut imports were 214 TMT, a 37 percent decrease from the
previous year due to significantly lower demand for export. Local traders reported that peanut import
demand in China has significantly decreased due to sufficient domestic supplies from China’s rising
peanut production, and the low price gap between Chinese and global prices, which fails to offset the
transportation cost and the value added tax.
India remains the main supplier of peanuts to Vietnam due to competitive prices.
U.S. peanuts are less competitive due to high import tariff (10 percent) compared with other countries
that have FTAs with Vietnam (please see Table 7 for import tariffs).
MY2017/18 and MY2018/19 peanut imports are projected to increase due to anticipated rising
domestic consumption and a drop in local peanut production
Post forecasts MY2017/18 and MY2018/19 peanut imports into Vietnam at about 250 TMT and 270
TMT, respectively, due to rising domestic consumption and local production decreases due the
aforementioned drop in cultivation area.
Table 5: Vietnam’s peanut imports, by HS Code Year 2013 2014 2015 2016 2017
Total in-shell peanut imports (MT)
(HS code 120210 and 120241) 11,933 5,818 12,216 38,725
3,025
Total shelled peanut imports (MT) (in-shell basis) (HS code
120220; 120242 and 200811) 175,708 211,225 167,318 302,200 198,642
Total peanut seed import (MT in-shell Basis)
(HS code 120230) 0 0 0 384
12,505
Total peanut imports (in-shell basis) (MT) 187,641 217,043 179,534 339,441 214,172
Source: GTA
*Note: Peanuts are in in-shell basis, including in-shell peanut (HS code 120210; 120241) and shelled peanuts (HS code
120220; 120242 and 200811 – including peanut butter, but amount of peanut butter negligible), and peanut seeds with HS
code 120230. Conversion rate from shelled peanut into in-shell peanuts: 1.33.
Peanut exports decline due to reduced demand from importing countries Official data for peanut exports is not available in Vietnam. According to the data from the Global
Trade Atlas (GTA) and local traders, Post estimates Vietnam’s peanut exports in MY2016/17, including
in-shell, shelled peanuts, and processed peanut products at about 38 TMT. Vietnam’s main export
markets are Taiwan, Russia, Malaysia, the United States, and China.
Post forecasts total peanut exports in MY2017/18 and MY2018/19 down to 35 TMT due to lower
demand from importing countries.

10
Table 6: Vietnam’s peanut exports, by HS Code Year 2012 2013 2014 2015 2016 2017
In-shell peanut exports (MT)
(HS code 120210 and 120241) 990 1,427 1,100 1,027 230 478
Shelled Peanut exports (MT)
(HS code 120220; 120242 and 200811) 6,129 8,442 5,372 6,399 6,968 28,525
Peanut seed export (MT)
(HS code 120230) 0 2 1 20 0 0
Total converted into in-shell peanut exports (MT) (conversion
rate 1.33) 9,142 12,658 8,246 9,564 9,497 38,416
Source: GTA
Note: Peanuts are on in-shell basis, including in-shell peanut (HS code 120210; 120241) and shelled peanuts (HS code
120220; 120242 and 200811 including peanut butter, but volume of peanut butter negligible), and peanut seeds with HS
code 120230; Conversion rate from shelled peanut into in-shell peanuts: 1.33.
POLICY
Suspensions of peanut imports from Indonesia, Hong Kong, Sudan, and Senegal remain
Vietnam’s suspensions of peanut imports from a number of countries, including Indonesia (since
January 2017), Hong Kong (since October 2016), Sudan (since October 2016), and Senegal (since
September 2016) remain.
Import tariffs changed for FTA partners
In 2018, the tariff rate applied to both in-shell and shelled peanuts (HS Codes: 1202.41 and 1202.42)
imported from countries having a MFN status with Vietnam remained at 10 percent. For countries with
trade agreements with Vietnam, 2018 tariffs changed from 2017 as follows:
For AJCEP, from 2 percent to 1 percent
For VJEPA, from 3 percent to 2 percent
For AIFTA, from 4 percent to 3 percent
For VCFTA, from 6 percent to 5 percent
For ATIGA, ACFTA, AKFTA, VFFTA, VN-EAEU tariff-free status remains unchanged
In 2018, the tariff rate applied to roasted ground nuts (HS Code: 2008.11.10) imported from countries
having MFN status remains at 30 percent, while it changed from 2017 as follows for the countries
having trade agreements with Vietnam:
For AANZFTA from 5 percent to zero percent
For AIFTA, from 15 percent to 10 percent
For VCFTA, from 20 percent to 17 percent
For AJCEP, from 18 percent to 15 percent
For VJEPA, from 20 percent to 17.5 percent
For ATIGA, ACFTA, AKFTA, VFFTA tariff-free status remains unchanged
Table 7: Peanut import tariffs
HS code Descripti
on
Import tariffs (%)
MF
N
ATIG
A
ACFT
A AKFT
A
VKFT
A VJEP
A AJCE
P AIFT
A AANZFT
A VCFT
A
VN-EAE
U
1202 Peanuts, not roasted or otherwise cooked, whether or not shelled or broken

11
1202.30.
00
- Seed
suitable
for
sowing 0 0 0 0 0 0 0 0 0 0 0
- Other
1202.41.
00 --In-shell 10 0 0 0 0 2 1 3 0 5 0
1202.42.
00
--Shelled,
whether
or not
broken 10 0 0 0 0 2 1 3 0 5 0
2008 Fruits, nuts and other edible parts of plants, otherwise prepared or preserved, whether or not containing
added sugar or other sweetening matter or spirit, not elsewhere specified or included
2008.11 --Ground-
nuts
2008.11.
10
- - -
Roasted
ground
nuts 30 0 0 0 0 17.5 15 10 0 17 21.8
2008.11.
20
- - -
Peanut
butter 18 0 0 0 0 17.5 15 10 0 17 9
2008.11.
90 - - - Other 20 0 0 0 0 17.5 15 10 0 17 10
Source: Ministry of Finance
COPRA
PRODUCTION
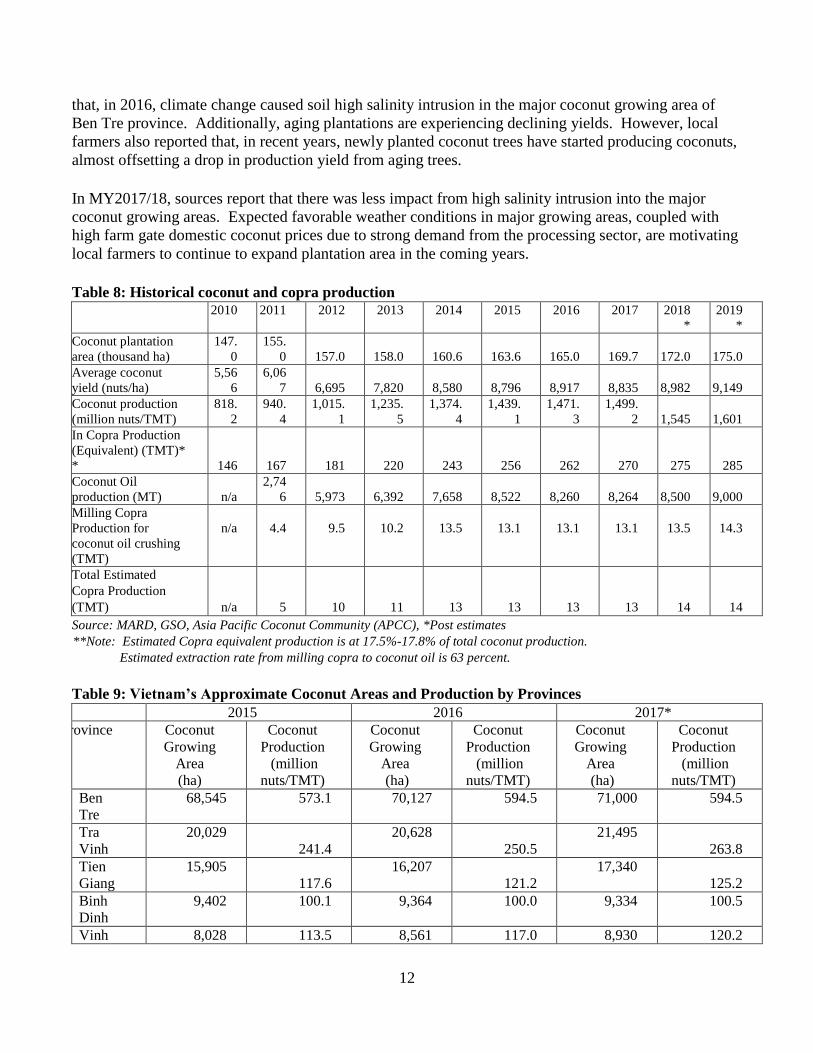
In MY2016/17, Vietnam produced about 1.5 MMT of coconuts on 169,700 ha, equivalent to about 270
TMT of copra, an about 2 percent increase in copra equivalent production over the previous year due to
cultivation expansion. Estimates for copra production are at 17.5-17.8 percent of total coconut
production, as there is no official data for copra available in Vietnam.
Post data differs from USDA official data due to calculation revisions for copra production and
consumption.
Post forecasts MY2017/18 and MY2018/19 coconut production at 1.5 MMT and 1.6 MMT or copra
production at 275 TMT and 285 TMT. Vietnam does not produce much copra for coconut oil crushing
due to low domestic demand and mold issues that occur in tropical climates. There are higher demands
for other coconut products, such as coconut milk and coconut milk powder and desiccated coconut
products with the use of fresh coconut flesh. Based on coconut oil production data provided from GSO,
Post estimates total copra production in the country at 14 TMT for MY2016/17. This level will remain
unchanged for MY2017/18 and MY2018/19.
MY2017/18 and MY2018/19 coconut production to increase due to anticipated expansion in coconut
plantation area
In MY2016/17, coconut yield decreased by 1 percent compared with the previous year due to impact
from unfavorable weather in growing areas leading to increased soil salinity. Industry contacts reported
12
that, in 2016, climate change caused soil high salinity intrusion in the major coconut growing area of
Ben Tre province. Additionally, aging plantations are experiencing declining yields. However, local
farmers also reported that, in recent years, newly planted coconut trees have started producing coconuts,
almost offsetting a drop in production yield from aging trees.
In MY2017/18, sources report that there was less impact from high salinity intrusion into the major
coconut growing areas. Expected favorable weather conditions in major growing areas, coupled with
high farm gate domestic coconut prices due to strong demand from the processing sector, are motivating
local farmers to continue to expand plantation area in the coming years.
Table 8: Historical coconut and copra production
2010 2011 2012 2013 2014 2015 2016 2017 2018
*
2019
*
Coconut plantation
area (thousand ha) 147.
0
155.
0 157.0 158.0 160.6 163.6 165.0 169.7 172.0 175.0
Average coconut
yield (nuts/ha)
5,56
6
6,06
7 6,695 7,820 8,580 8,796 8,917 8,835 8,982 9,149
Coconut production
(million nuts/TMT) 818.
2
940.
4
1,015.
1
1,235.
5
1,374.
4
1,439.
1
1,471.
3
1,499.
2 1,545 1,601
In Copra Production
(Equivalent) (TMT)*
* 146 167 181 220 243 256 262 270 275 285
Coconut Oil
production (MT) n/a
2,74
6 5,973 6,392 7,658 8,522 8,260 8,264 8,500 9,000
Milling Copra
Production for
coconut oil crushing
(TMT)
n/a
4.4
9.5
10.2
13.5
13.1
13.1
13.1
13.5
14.3
Total Estimated
Copra Production
(TMT) n/a 5 10 11 13 13 13 13 14 14
Source: MARD, GSO, Asia Pacific Coconut Community (APCC), *Post estimates
**Note: Estimated Copra equivalent production is at 17.5%-17.8% of total coconut production.
Estimated extraction rate from milling copra to coconut oil is 63 percent.
Table 9: Vietnam’s Approximate Coconut Areas and Production by Provinces
2015 2016 2017*
Province Coconut
Growing
Area
(ha)
Coconut
Production
(million
nuts/TMT)
Coconut
Growing
Area
(ha)
Coconut
Production
(million
nuts/TMT)
Coconut
Growing
Area
(ha)
Coconut
Production
(million
nuts/TMT)
Ben
Tre
68,545 573.1 70,127 594.5 71,000 594.5
Tra
Vinh
20,029
241.4
20,628
250.5
21,495
263.8
Tien
Giang
15,905
117.6
16,207
121.2
17,340
125.2
Binh
Dinh
9,402 100.1 9,364 100.0 9,334 100.5
Vinh 8,028 113.5 8,561 117.0 8,930 120.2

13
Long
Ca Mau 7,526 28.6 7,415 29.0 7,328 31.5
Kien
Giang n/a n/a n/a n/a 5,996 29.9
Bac
Lieu 4,580 19.9 4,618 20,3 4,618 20.8
Soc
Trang 3,757 17.5 3,757 17.5 4,086 19.7
Hau
Giang 3,624 18.1 2,562 16.5 2,639 17.2
Quang
Ngai 2,312 13.8 2,314 14.1 2,267 14.9
Tay
Ninh n/a n/a n/a n/a 1,945 47.6
Khanh
Hoa 1,823 7.9 1,839 7.8 1,906 7.6
Can
Tho 2,308 9.8 2,112 9.1 1,872 8.0
Phu
Yen 1,493 20.0 1,404 18.9 1,338 17.7
An
Giang 1,401 24.0 1,271 20.5 1,334 19.4
Others 12,857 133.8 14,121 160.4 6,272 60.7
Total 163,590 1,439.1 166,300 1,477.0 169,700 1,499.2 Sources: Asia Pacific Coconut Community (APCC), Provincial DARDs, MARD, Local industry, Ben Tre Coconut
Association, *GSO, MARD, and Ben Tre Coconut Association
CONSUMPTION
Vietnam continues to produce various coconut products for both food and industrial uses for the export
and domestic markets. Food use coconut products include fresh young coconut and fresh mature
coconuts for immediate consumption and cooking, desiccated coconut, coconut jelly, frozen coconut
meat, coconut candy, coconut jam, coconut milk, coconut milk powder, refined copra/coconut oil, and
fresh coconut juice. Industrially, crude coconut oil is used for cosmetics and soap, coconut fiber for
cushioning, building materials, woven rope, and coconut carpet, coco chips for flowerbed decorations,
and coco-peat for air filtration, animal (cattle) bedding, organic agricultural fertilizer, organic compound
for mushroom growing, and moisture-retentive substance for plants. Coconut shells are used for
handicraft decoration and charcoal.
There is no official production data for copra, desiccated coconut, and other coconut products and their
consumption in Vietnam. According to local industry, in MY2016/17, Vietnam produced large amounts
of coconut milk and milk powders due to high export demand.
About 20 percent of total coconut production was for immediate consumption and household cooking.
An estimated 80 percent of total coconut production is used for further processing to make different
coconut products, of which about 54 percent is used for producing coconut milk and milk powder, 40
percent for processing of desiccated coconuts, and 6 percent for producing coconut oil. Therefore, Post
revised its previous estimates. In MY2016/17, Post estimates, among 270 TMT of total copra

14
equivalent production, 54 TMT was used for immediate consumption and cooking, 88 TMT used for
producing desiccated coconuts, and 115 TMT used for crushing to produce 73 TMT of coconut milk and
milk powder. Only 13 TMT was used for producing about 8 TMT of coconut oil (at a 63 percent
extraction rate) and about 5 TMT of copra meal by-products.
TRADE
Coconut product imports to increase in MY2017/18 and MY2018/19 due to higher demand
In MY2016/17, Vietnam continued to import various coconut products such as desiccated coconuts (HS
code 0801.11), coconut in the inner shell (endocarp, HS code 0801.12), copra (HS code 1203.00), and
other coconut products (other than desiccated, HS code 080119). Total imported volume of various
coconut products was 15.4 TMT, a significant increase compared with the previous year due to higher
domestic demand (See Table 10).
Post forecasts total imported volume of various coconut products to increase in MY2017/18 and
MY2018/19 due to higher demand from the domestic coconut processing industry for both local
consumption and export.
In MY2016/17, copra imports (HS code 120300), mainly from India and Thailand, were at 587 MT, a
significant increase over the previous year. Vietnam also imported 415 MT of desiccated coconut
products (HS code 0801.11), of which 65 percent were from Thailand, with the United States having an
18 percent market share. Imported coconut in the inner shell products, mainly from Indonesia and
India, (HS code 080119) increased significantly in MY2017/18 from nearly zero to 4.6 TMT to meet
higher demands from the processing industry for export. Coconut products other than desiccated (HS
code 0801.19) followed a similar trajectory, increasing significantly from 2016 to 2017.
Table 10: Vietnam’s copra and other coconut product imports
Unit: MT
2013 2014 2015 2016 2017
Desiccated coconut (HS code 0801.11) 386 69 17 121 415
Coconut in the inner shell (Endocarp)
(HS code 0801.12) 320 17 46
52 4,642
Copra (HS code 1203.00) 2 1,574 138 159 587
Coconut, other than desiccated (HS code 0801.19) 179 33 41
596 8,143
Coconut Fiber (HS code 5305.00) 75 207 729 2,425 1,596
Total 962 1,900 969 3,261 15,383
Source: GTA
Coconut product exports are projected to increase in MY2017/18 and MY2018/19 to meet increased
demand
Vietnam continues to export various coconut products, such as fresh young coconuts, fresh mature
coconuts, desiccated coconuts, coconut milk, coconut milk powder, canned coconut drinking water,
coconut jams, coconut charcoal, coconut fibers, coconut candy, and coconut oil. However, there is no
official data for coconut product exports available in Vietnam.

15
According to GTA and data from Ben Tre Department of Trade and Industry, in MY2016/17, Vietnam
exported 178 TMT of major coconut products, including desiccated coconuts (HS code 080111),
coconuts in the inner shell (Endocarp, HS code 080112), other coconut products (HS code 080119), and
coconut fibers (HS code 530500). Local industry expects desiccated coconuts, coconut milk and coconut
milk powder, canned coconut water will become the major leading export products in coming years, and
general exports of coconut products will increase.
Table 11: Vietnam’s coconut product exports Unit: In MT
2013 2014 2015 2016 2017
Desiccated coconuts (HS code 080111) 15,617 22,737 13,890 *20,000 *22,000
Coconuts in the inner shell (Endocarp) (HS code 080112)
134,623 155,838
67,930
44,637 40,147
Coconuts, other than desiccated (HS code 080119) 4,281 3,932 6,838
26,703 22,656
Copra (HS code 120300) 0 52 0 0 0
Coconut Fibers (HS code 530500; 530511; 530519; 530810)
100,122 131,311 125,036
109,817 93,319
Total 254,643 313,870 213,694 201,157 178,122
Source: GTA, Ben Tre Department of Trade and Industry, Ben Tre Coconut Association
*Note: Post adjusted data
RAPESEED
PRODUCTION
There is no official data for rapeseed production in Vietnam. In CY2017, colza seed (rapeseed)
production remained limited due to the slow expansion of production area. Post found that several
tourism companies cultivated rapeseed in a few areas, such as the provinces of Ha Giang, Son La, and
Yen Bai (Mu Cang Chai District), mainly for tourism purposes.
In CY2018 and CY2019, rapeseed cultivation area will not expand much. Post expects that once the
Thinh Dat Tourism Company’s industrial crushing plant in Mu Cang Chai comes online, rapeseed
cultivation area will expand significantly. Reportedly, this is the first rapeseed crushing plant built in
Vietnam, and will have a capacity of 700 MT of rapeseed per year. The crushing plant is expected to
operate by end of 2018 for first trial.
TRADE
Vietnam continues to import a negligible volume of rapeseed. In MY2016/17 (October 2016 –
September 2017), Vietnam imported 23 TMT. Vietnam imports mainly from Ukraine, Canada,
Australia, and Russia, a significant increase compared with the previous year.
Vietnam exported a negligible quantity of rapeseed.
CONSUMPTION

16
Aside from the tourism industry, rapeseed is also used for oil extraction at the household scale.
However, Post foresees the potential for rapeseed oil extraction at a larger scale in the next few years
due to the start-up of the new crushing facility.
MEAL SECTION
SOYBEAN MEAL
PRODUCTION
MY2016/17 SBM production estimate increased
In MY2016/17, Post estimates Vietnam’s total domestic SBM production, including SBM and soybean
hulls from industrial crushing, at 855 TMT, reflecting only the output of the southern crushing facility
as the northern facility is not yet on-line.
SBM production to increase in MY2017/18 and MY2018/19 due to the operation of a new crushing
plant in the North
For MY2017/18, Post retains its estimate of SBM production at 940 TMT. For MY2018/19, Post
forecasts total domestic SBM production from industrial crushing plants, including soybean meal and
soybean hulls, at 1.05 MMT due to expected full operation of the crushing facility in the South and the
operation of a new crushing facility in the North. Post projects domestic SBM production to increase
over the next few years with new crushing facilities, increased capacity in existing crush facilities, and
increasing demand for SBM and oil.
Table 12: Vietnam’s soybean meal production
Year 2014 2015 2016 2017 2018* 2019*
SBM production (TMT) from industrial crushing plants 889 822 722 800 880 980
Soybean hull production (TMT) from industrial crushing plants 59 56 52 55 60 70
Total local SBM production (TMT) from industrial crushing
plants 948 878 774 855 940
1,050
Source: Local Producers, *Post estimates;
TRADE
Imports
MY2016/17 SBM imports are estimated at 4.95 MMT, a decrease of 3 percent from the previous year
due to more locally produced SBM
In MY2016/17, Vietnam imported about 4.95 MMT of SBM including residues from soybeans and soy
flour. Soybean meal and residues from soybeans were at 4.7 MMT, and soy flour was 209 TMT.
Argentina remained the largest supplier of total SBM to Vietnam during MY2016/17, accounting for 81
percent of the all-type SBM imports due to its low prices. Brazil and the United States were the other
main suppliers of SBM to Vietnam. Total U.S. SBM and soy flour exports to Vietnam were 440 TMT
(about 9 percent market share), of which 254 TMT was SBM and 186 TMT was soy flour.
SBM imports in MY2017/18 and MY2018/19 continue to increase due to higher demand from the
feed and food processing industries
17
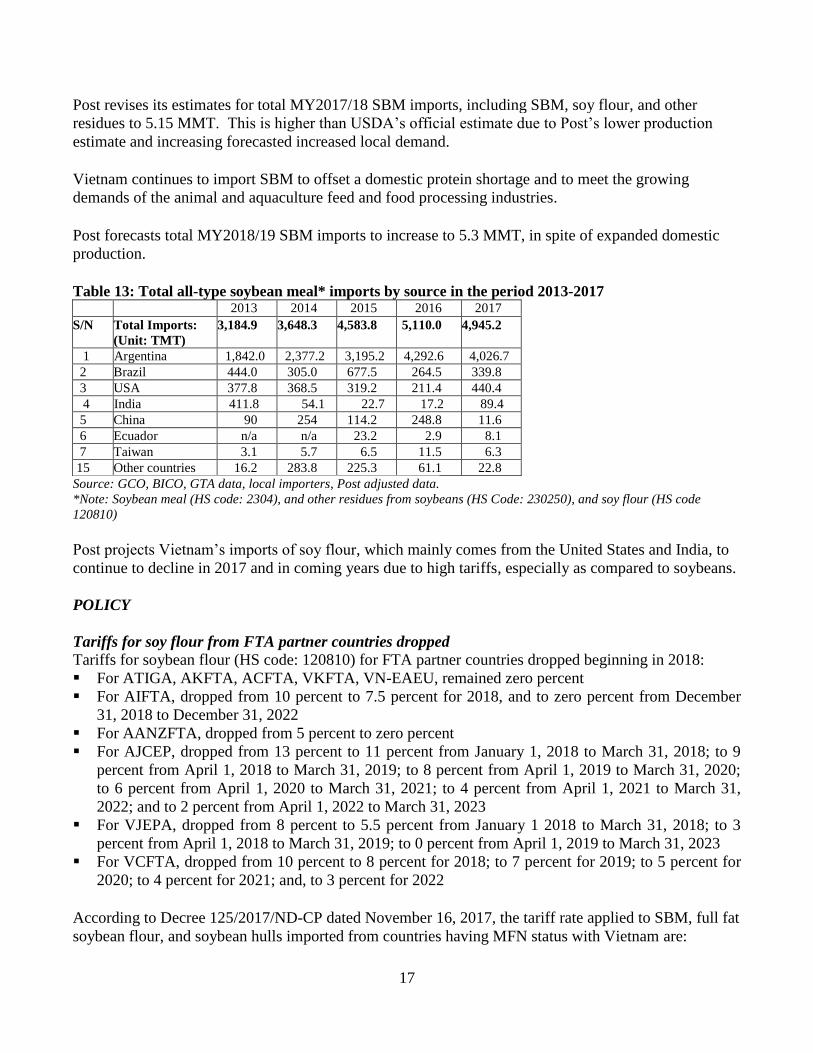
Post revises its estimates for total MY2017/18 SBM imports, including SBM, soy flour, and other
residues to 5.15 MMT. This is higher than USDA’s official estimate due to Post’s lower production
estimate and increasing forecasted increased local demand.
Vietnam continues to import SBM to offset a domestic protein shortage and to meet the growing
demands of the animal and aquaculture feed and food processing industries.
Post forecasts total MY2018/19 SBM imports to increase to 5.3 MMT, in spite of expanded domestic
production.
Table 13: Total all-type soybean meal* imports by source in the period 2013-2017
2013 2014 2015 2016 2017
S/N Total Imports:
(Unit: TMT) 3,184.9 3,648.3 4,583.8 5,110.0 4,945.2
1 Argentina 1,842.0 2,377.2 3,195.2 4,292.6 4,026.7
2 Brazil 444.0 305.0 677.5 264.5 339.8
3 USA 377.8 368.5 319.2 211.4 440.4
4 India 411.8 54.1 22.7 17.2 89.4
5 China 90 254 114.2 248.8 11.6
6 Ecuador n/a n/a 23.2 2.9 8.1
7 Taiwan 3.1 5.7 6.5 11.5 6.3
15 Other countries 16.2 283.8 225.3 61.1 22.8
Source: GCO, BICO, GTA data, local importers, Post adjusted data.
*Note: Soybean meal (HS code: 2304), and other residues from soybeans (HS Code: 230250), and soy flour (HS code
120810)
Post projects Vietnam’s imports of soy flour, which mainly comes from the United States and India, to
continue to decline in 2017 and in coming years due to high tariffs, especially as compared to soybeans.
POLICY
Tariffs for soy flour from FTA partner countries dropped
Tariffs for soybean flour (HS code: 120810) for FTA partner countries dropped beginning in 2018:
For ATIGA, AKFTA, ACFTA, VKFTA, VN-EAEU, remained zero percent
For AIFTA, dropped from 10 percent to 7.5 percent for 2018, and to zero percent from December
31, 2018 to December 31, 2022
For AANZFTA, dropped from 5 percent to zero percent
For AJCEP, dropped from 13 percent to 11 percent from January 1, 2018 to March 31, 2018; to 9
percent from April 1, 2018 to March 31, 2019; to 8 percent from April 1, 2019 to March 31, 2020;
to 6 percent from April 1, 2020 to March 31, 2021; to 4 percent from April 1, 2021 to March 31,
2022; and to 2 percent from April 1, 2022 to March 31, 2023
For VJEPA, dropped from 8 percent to 5.5 percent from January 1 2018 to March 31, 2018; to 3
percent from April 1, 2018 to March 31, 2019; to 0 percent from April 1, 2019 to March 31, 2023
For VCFTA, dropped from 10 percent to 8 percent for 2018; to 7 percent for 2019; to 5 percent for
2020; to 4 percent for 2021; and, to 3 percent for 2022
According to Decree 125/2017/ND-CP dated November 16, 2017, the tariff rate applied to SBM, full fat
soybean flour, and soybean hulls imported from countries having MFN status with Vietnam are:

18
Soybean flour (HS code: 120810): 8 percent
Soybean hulls (HS code: 230250): zero percent
Defatted soya bean flour, fit for human consumption (HS code: 2304.00.10): zero percent
Other soybean meal (HS code: 2304.00.10) fit for human consumption: zero percent
Other soybean meal (HS code: 2304.00.90): 2 percent
Exports
Vietnam exports a small amount of SBM to neighboring countries, including Cambodia, Japan,
Philippines, Singapore, Laos, South Korea, Myanmar, and Taiwan. Post retains its forecasts for
Vietnam’s SBM exports at about 120 TMT in MY2016/17, MY2017/18, and MY2018/19.
CONSUMPTION
The majority of domestic and imported SBM is used for feed and food processing industry. Post estimates
SBM used for feed at 5.8 MMT in MY2016/17, growing to 6 MMT in MY2018/19, and 6.2 MMT in
MY2018/19 due to increasing demand from the livestock and aquaculture sectors.
OTHER MEALS
PRODUCTION
Vietnam continues to produce a negligible volume of other oilseed meals, such as peanut meal, copra
meal, rapeseed meal, and sesame meal.
Post estimates copra meal production from coconut oil crushing at 5 TMT for MY2016/17, and projects
it at the same level for MY2017/18 and MY2018/19 due to flat demand.
Table 14: Vietnam’s historical copra cake and meal production
Unit: TMT 2011 2012 2013 2014 2015 2016 2017
est.
2018
est.
2019
est.
Total copra volume for crushing
coconut oil
4.4 9.5 10.2 13.5 13.1 13.1 13.1 13.5 14.3
Copra cake and meal production 1.5 3.3 3.6 4.7 4.6 4.6 4.6 4.7 5.0 Source: Post estimates.
Note: Estimated Conversion rate from copra to copra cake and meal at 35 percent
Post estimates that local fishmeal production, including saltwater fishmeal and freshwater fishmeal, will
increase in the coming years. Saltwater fishmeal production is decreasing due to a drop in by-products
from caught fishery processing and trash fish, but increases in freshwater fishmeal due to growth in
freshwater fishery production will more than offset the loss. Post estimates local fishmeal production at
450 TMT in MY2017/18, rising to 460 TMT in MY2018/19.
Table 15: Vietnam’s fishmeal production
Unit: in MT 2013 2014 2015 2016 2017
est.
2018*
est.
2019*
proj.
Total fishmeal production 382,549 397,511 422,887 429,072 433,412 450,000 460,000
Saltwater fishmeal production 324,942 319,170 319,501 308,260 306,275 305,000 300,000
19
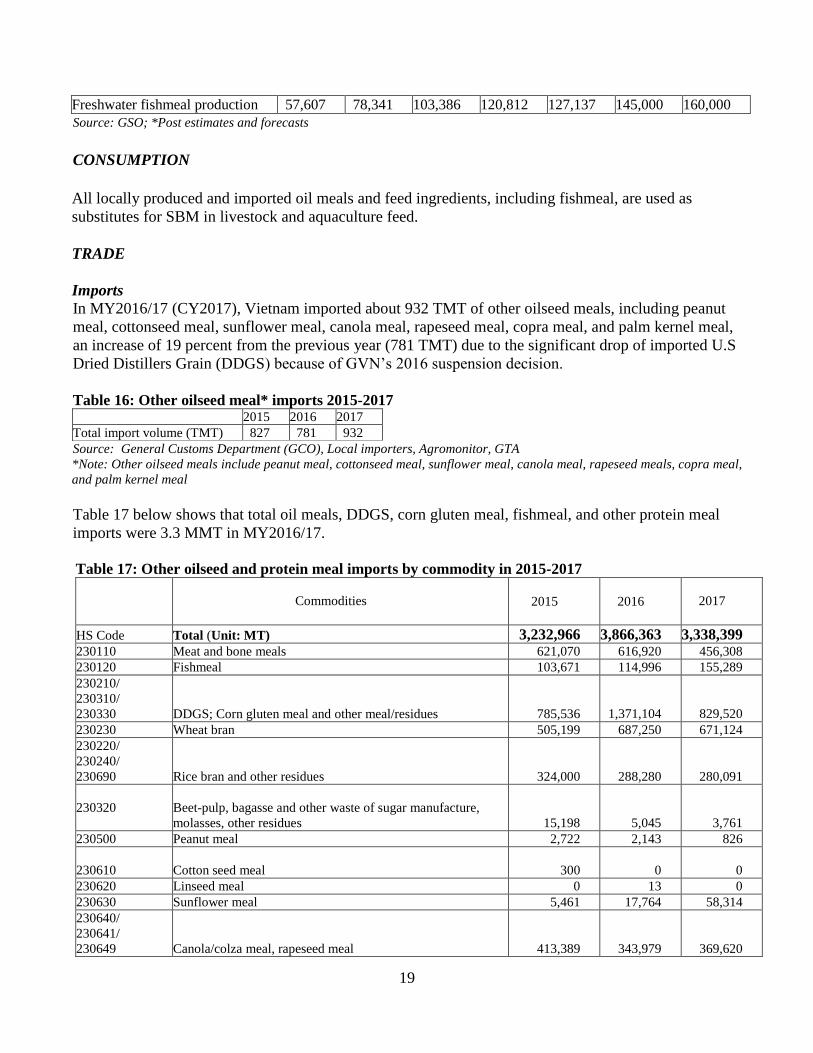
Freshwater fishmeal production 57,607 78,341 103,386 120,812 127,137 145,000 160,000
Source: GSO; *Post estimates and forecasts
CONSUMPTION
All locally produced and imported oil meals and feed ingredients, including fishmeal, are used as
substitutes for SBM in livestock and aquaculture feed.
TRADE
Imports
In MY2016/17 (CY2017), Vietnam imported about 932 TMT of other oilseed meals, including peanut
meal, cottonseed meal, sunflower meal, canola meal, rapeseed meal, copra meal, and palm kernel meal,
an increase of 19 percent from the previous year (781 TMT) due to the significant drop of imported U.S
Dried Distillers Grain (DDGS) because of GVN’s 2016 suspension decision.
Table 16: Other oilseed meal* imports 2015-2017 2015 2016 2017
Total import volume (TMT) 827 781 932
Source: General Customs Department (GCO), Local importers, Agromonitor, GTA
*Note: Other oilseed meals include peanut meal, cottonseed meal, sunflower meal, canola meal, rapeseed meals, copra meal,
and palm kernel meal
Table 17 below shows that total oil meals, DDGS, corn gluten meal, fishmeal, and other protein meal
imports were 3.3 MMT in MY2016/17.
Table 17: Other oilseed and protein meal imports by commodity in 2015-2017
Commodities
2015
2016
2017
HS Code Total (Unit: MT) 3,232,966 3,866,363 3,338,399 230110 Meat and bone meals 621,070 616,920 456,308
230120 Fishmeal 103,671 114,996 155,289
230210/
230310/
230330 DDGS; Corn gluten meal and other meal/residues 785,536
1,371,104
829,520
230230 Wheat bran 505,199 687,250 671,124
230220/
230240/
230690 Rice bran and other residues 324,000
288,280
280,091
230320 Beet-pulp, bagasse and other waste of sugar manufacture,
molasses, other residues
15,198 5,045
3,761
230500 Peanut meal 2,722 2,143 826
230610 Cotton seed meal 300
0 0
230620 Linseed meal 0 13 0
230630 Sunflower meal 5,461 17,764 58,314
230640/
230641/
230649 Canola/colza meal, rapeseed meal 413,389 343,979
369,620

20
230650 Copra cake and meal 156,725 84,161 98,068
230660 Palm Kernel meal 248,105 332,872 405,320
230700 Wine lees; argol 36,107 0 0
230800 Other vegetable residues and by-products 15,483 1,836 10,158
Source: General Customs Department (GCO), Local importers, Agromonitor, GTA
Export
Vietnam continue to export other oilseed and protein meals (see Table 18). Vietnam exported 190 TMT
fishmeal in MY2016/17, with China being the largest market (see Table 19). According to local traders,
Vietnam exports low-protein fishmeal, while importing high-protein fishmeal.
Table 18: Other oilseed and protein meal exports by commodity (2015-2017)
Commodities
2015 2016 2017
HS Code Total (Unit: MT) 1,246,207 487,032 521,123
230110 Meat bone meals 16,166 462 0
230120 Fishmeal 152,121 200,931 189,504
230210/
230310/
230330 DDGS and Corn gluten meal, other residues 93,584 69,815 58,012
230230 Wheat bran 798,328 7 0
230220
230240
230690 Rice bran and other residues 52,253 76,609 124,993
230320
Beet-pulp, bagasse and other waste of sugar manufacture, molasses,
other residues 20,395 19,805 13,662
230500 Peanut meal 590 214 593
230640
230641
230649 Canola meal, rapeseed meal 279 0 0
230650 Copra cake and meal 3,028 2,000 1,194
230660 Palm kernel meal 0 493 257
230700 Wine lees; argol 194 202 61
230800 Other vegetable residues and by-products 109,269 116,494 132,847
Source: GCO, Local importers, GTA
Table 19: Vietnam’s fishmeal exports by destination (2015-2017)
2015 2016 2017
Total in TMT 152.1 200.9 189.5
China 74.9 127.2 135.5
Thailand 12.4 37.8 26.0
Japan 26.7 8.4 10.5
Indonesia 9.7 11.1 6.8
Taiwan 16.2 5.9 6.5
South Korea 4.6 3.5 2.4
Malaysia 5.4 4.6 1.6
Australia 0.4 1.1 0
Cambodia 1 n/a 0
Others 0.8 1.3 0.2
Source: GTA, Local Traders, Agromonitor; Note: Fishmeal with HS code: 230120
21
Oil Situation and Outlook
PRODUCTION
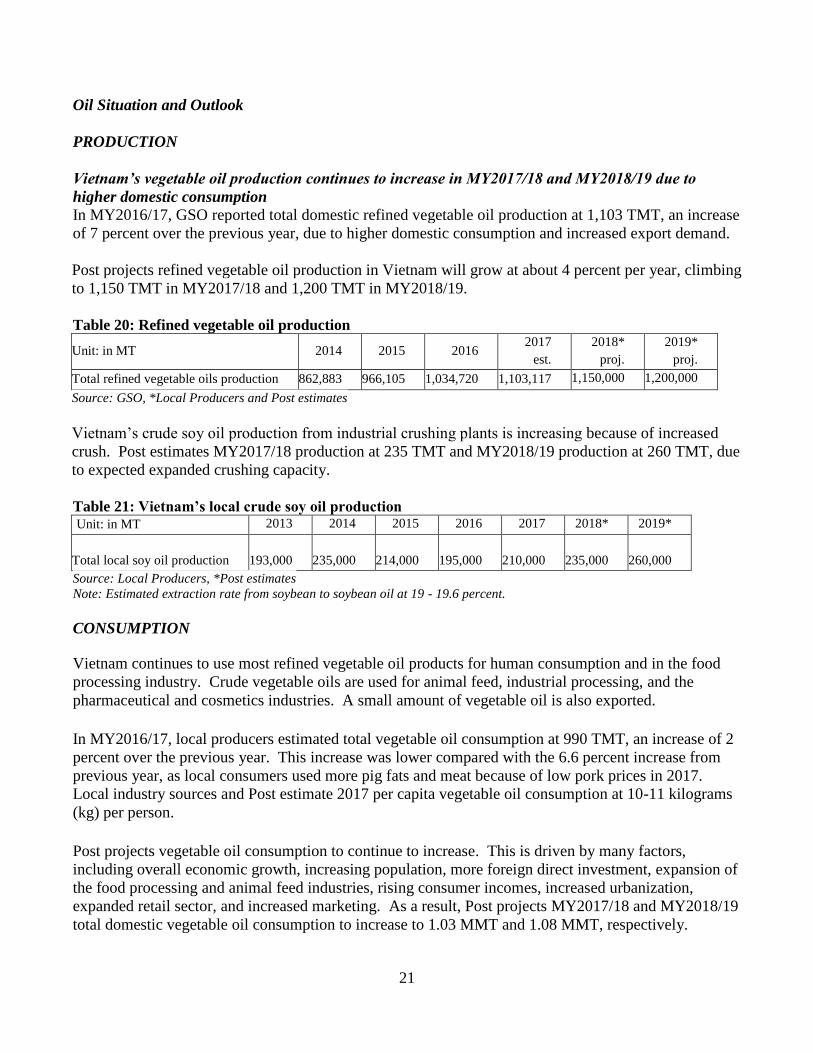
Vietnam’s vegetable oil production continues to increase in MY2017/18 and MY2018/19 due to
higher domestic consumption
In MY2016/17, GSO reported total domestic refined vegetable oil production at 1,103 TMT, an increase
of 7 percent over the previous year, due to higher domestic consumption and increased export demand.
Post projects refined vegetable oil production in Vietnam will grow at about 4 percent per year, climbing
to 1,150 TMT in MY2017/18 and 1,200 TMT in MY2018/19.
Table 20: Refined vegetable oil production
Unit: in MT 2014 2015 2016 2017
est.
2018*
proj.
2019*
proj.
Total refined vegetable oils production 862,883 966,105 1,034,720 1,103,117 1,150,000 1,200,000
Source: GSO, *Local Producers and Post estimates
Vietnam’s crude soy oil production from industrial crushing plants is increasing because of increased
crush. Post estimates MY2017/18 production at 235 TMT and MY2018/19 production at 260 TMT, due
to expected expanded crushing capacity.
Table 21: Vietnam’s local crude soy oil production Unit: in MT 2013 2014 2015 2016 2017 2018* 2019*
Total local soy oil production 193,000 235,000 214,000 195,000
210,000
235,000
260,000
Source: Local Producers, *Post estimates
Note: Estimated extraction rate from soybean to soybean oil at 19 - 19.6 percent.
CONSUMPTION
Vietnam continues to use most refined vegetable oil products for human consumption and in the food
processing industry. Crude vegetable oils are used for animal feed, industrial processing, and the
pharmaceutical and cosmetics industries. A small amount of vegetable oil is also exported.
In MY2016/17, local producers estimated total vegetable oil consumption at 990 TMT, an increase of 2
percent over the previous year. This increase was lower compared with the 6.6 percent increase from
previous year, as local consumers used more pig fats and meat because of low pork prices in 2017.
Local industry sources and Post estimate 2017 per capita vegetable oil consumption at 10-11 kilograms
(kg) per person.
Post projects vegetable oil consumption to continue to increase. This is driven by many factors,
including overall economic growth, increasing population, more foreign direct investment, expansion of
the food processing and animal feed industries, rising consumer incomes, increased urbanization,
expanded retail sector, and increased marketing. As a result, Post projects MY2017/18 and MY2018/19
total domestic vegetable oil consumption to increase to 1.03 MMT and 1.08 MMT, respectively.

22
Table 22: Vietnam’s domestic vegetable oil consumption
Unit 2015 2016 2017 2018
est.
2019
proj.
Vietnam’s population million persons 92 93 95 96 97
Total domestic vegetable oil consumption
1,000 MT
910
970
990
1,030
1,080
Per capita vegetable oil consumption
Kg/person/year
9.9
10.4
10.4
10.7
11.1
Source: GSO; MOIT; Estimates from local producers and Post
TRADE
Imports of vegetable oils (both crude and refined) will increase to meet increasing demand Vietnam’s vegetable oil industry continues to import both crude and refined oil to meet increasing
domestic and export demands. In MY2016/17, Post estimates total vegetable oil imports at 890 TMT.
Palm oil continues to be the major imported vegetable oil in Vietnam, accounting for 90 percent of the
total.
Post estimates MY2018/19 and MY2018/19 total vegetable oil imports in the 900-910 TMT range at a
growth rate of about one percent, although locally-produced vegetable oil production is expected to
increase due to higher demands of domestic consumption and exports to overseas countries.
Table 23: Total vegetable oil* imports per commodity
Year 2013 2014 2015 2016 2017**
est.
2018**
proj.
2019**
proj.
Total vegetable oil imports (TMT) 705.6 835.9 858.7 867.1 890
900 910
Palm oil 583.1 697.7 715.7 727.2 800 790 790
Soy oil 79.5 81.6 97.8 79.1 30 50 50
Coconut oil 2.4 6.3 2.1 1.7 3 4 6
Rapeseed (Colza) oil 2.8 4.6 3.1 1.6 2 3 4
Other vegetable oils 37.8 45.7 40.0 57.5 55 53 60
Source: GTA; **Post estimates and projections
*Note: Vegetable oils include all crude oils and refined oils
- Palm oils include crude palm oil (HS code 151110), crude palm kernel oil (HS code 151321), refined palm oil (HS code
151190) and refined palm kernel oil (HS code 151329)
- Soybean oils (HS code 1507) include both crude and refined oils
- Coconut oils include crude coconut oil (HS code 151311) and refined coconut (copra) oil (HS code 151319)
- Rapeseed (colza) oils include refined oils (HS codes 151419, 151499), crude oils (HS codes 151411, 151491)
- Other vegetable oils include refined peanut oil (HS code 150890); refined olive oil (HS code 150990;151000); refined
sunflower oil (HS code 151219); refined cottonseed oil (HS code 151229); refined linseed oil (HS code 151519); refined
corn oil (HS code 151529);Castor oil (HS code 151530); fixed vegetable oil (HS code 151590); other vegetable oil (HS code
151620); Crude Peanut oil (HS code 150810), Crude Olive oil (HS code 150910), Crude Sunflower oil (HS code 151211),
Crude Linseed oil (HS code 151511), Crude Corn oil (HS code 151521), and Crude Sesame oil (HS code 151550);
Exports In MY2016/17, local industry reported total vegetable oil exports at about 85 TMT, which was mainly
soy oils to neighboring Laos and Cambodia.
23
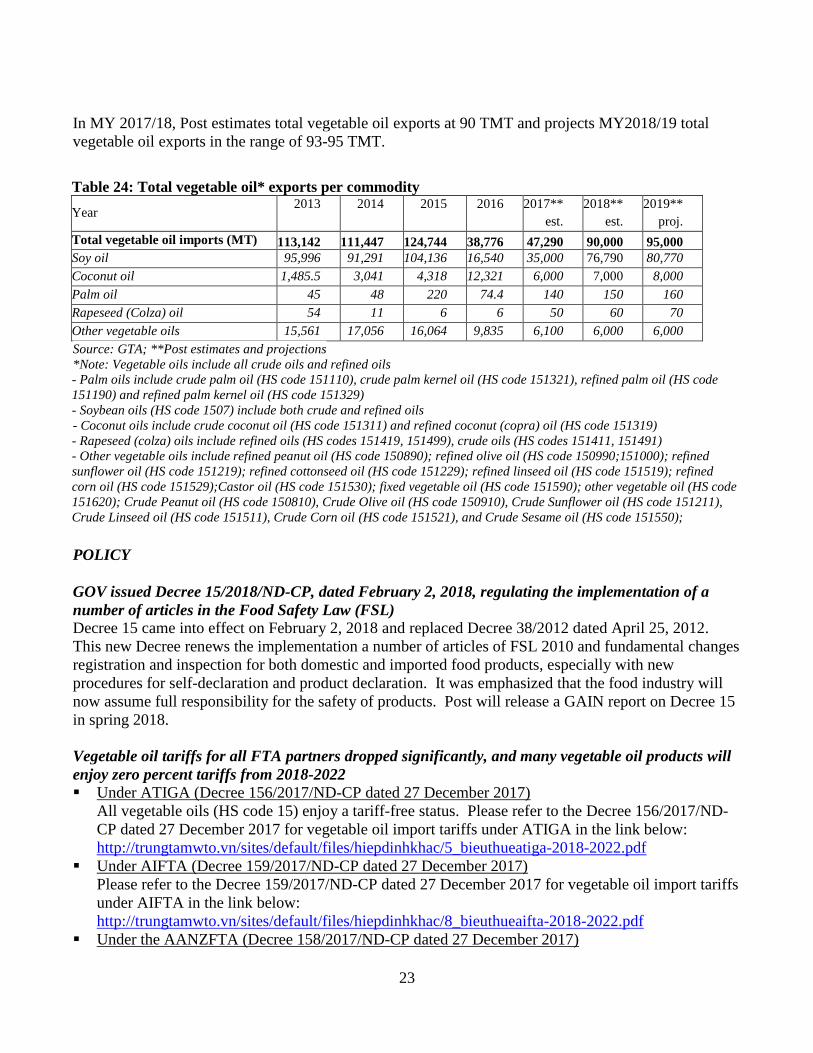
In MY 2017/18, Post estimates total vegetable oil exports at 90 TMT and projects MY2018/19 total
vegetable oil exports in the range of 93-95 TMT.
Table 24: Total vegetable oil* exports per commodity
Year 2013 2014 2015 2016 2017**
est.
2018**
est.
2019**
proj.
Total vegetable oil imports (MT) 113,142 111,447 124,744 38,776 47,290 90,000 95,000
Soy oil 95,996 91,291 104,136 16,540 35,000 76,790 80,770
Coconut oil 1,485.5 3,041 4,318 12,321 6,000 7,000 8,000
Palm oil 45 48 220 74.4 140 150 160
Rapeseed (Colza) oil 54 11 6 6 50 60 70
Other vegetable oils 15,561 17,056 16,064 9,835 6,100 6,000 6,000
Source: GTA; **Post estimates and projections
*Note: Vegetable oils include all crude oils and refined oils
- Palm oils include crude palm oil (HS code 151110), crude palm kernel oil (HS code 151321), refined palm oil (HS code
151190) and refined palm kernel oil (HS code 151329)
- Soybean oils (HS code 1507) include both crude and refined oils
- Coconut oils include crude coconut oil (HS code 151311) and refined coconut (copra) oil (HS code 151319)
- Rapeseed (colza) oils include refined oils (HS codes 151419, 151499), crude oils (HS codes 151411, 151491)
- Other vegetable oils include refined peanut oil (HS code 150890); refined olive oil (HS code 150990;151000); refined
sunflower oil (HS code 151219); refined cottonseed oil (HS code 151229); refined linseed oil (HS code 151519); refined
corn oil (HS code 151529);Castor oil (HS code 151530); fixed vegetable oil (HS code 151590); other vegetable oil (HS code
151620); Crude Peanut oil (HS code 150810), Crude Olive oil (HS code 150910), Crude Sunflower oil (HS code 151211),
Crude Linseed oil (HS code 151511), Crude Corn oil (HS code 151521), and Crude Sesame oil (HS code 151550);
POLICY
GOV issued Decree 15/2018/ND-CP, dated February 2, 2018, regulating the implementation of a
number of articles in the Food Safety Law (FSL)
Decree 15 came into effect on February 2, 2018 and replaced Decree 38/2012 dated April 25, 2012.
This new Decree renews the implementation a number of articles of FSL 2010 and fundamental changes
registration and inspection for both domestic and imported food products, especially with new
procedures for self-declaration and product declaration. It was emphasized that the food industry will
now assume full responsibility for the safety of products. Post will release a GAIN report on Decree 15
in spring 2018.
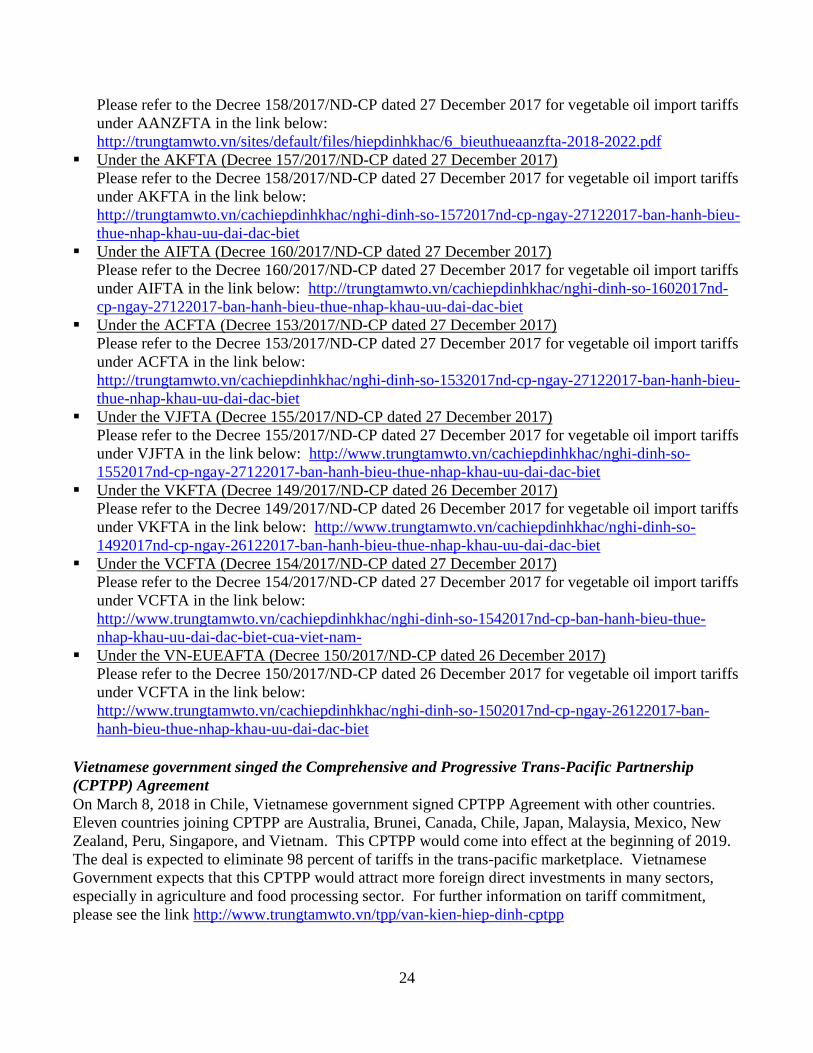
Vegetable oil tariffs for all FTA partners dropped significantly, and many vegetable oil products will
enjoy zero percent tariffs from 2018-2022
Under ATIGA (Decree 156/2017/ND-CP dated 27 December 2017)
All vegetable oils (HS code 15) enjoy a tariff-free status. Please refer to the Decree 156/2017/ND-
CP dated 27 December 2017 for vegetable oil import tariffs under ATIGA in the link below:
http://trungtamwto.vn/sites/default/files/hiepdinhkhac/5_bieuthueatiga-2018-2022.pdf
Under AIFTA (Decree 159/2017/ND-CP dated 27 December 2017)
Please refer to the Decree 159/2017/ND-CP dated 27 December 2017 for vegetable oil import tariffs
under AIFTA in the link below:
http://trungtamwto.vn/sites/default/files/hiepdinhkhac/8_bieuthueaifta-2018-2022.pdf
Under the AANZFTA (Decree 158/2017/ND-CP dated 27 December 2017)
24
Please refer to the Decree 158/2017/ND-CP dated 27 December 2017 for vegetable oil import tariffs
under AANZFTA in the link below:
http://trungtamwto.vn/sites/default/files/hiepdinhkhac/6_bieuthueaanzfta-2018-2022.pdf
Under the AKFTA (Decree 157/2017/ND-CP dated 27 December 2017)
Please refer to the Decree 158/2017/ND-CP dated 27 December 2017 for vegetable oil import tariffs
under AKFTA in the link below:
http://trungtamwto.vn/cachiepdinhkhac/nghi-dinh-so-1572017nd-cp-ngay-27122017-ban-hanh-bieu-
thue-nhap-khau-uu-dai-dac-biet
Under the AIFTA (Decree 160/2017/ND-CP dated 27 December 2017)
Please refer to the Decree 160/2017/ND-CP dated 27 December 2017 for vegetable oil import tariffs
under AIFTA in the link below: http://trungtamwto.vn/cachiepdinhkhac/nghi-dinh-so-1602017nd-
cp-ngay-27122017-ban-hanh-bieu-thue-nhap-khau-uu-dai-dac-biet
Under the ACFTA (Decree 153/2017/ND-CP dated 27 December 2017)
Please refer to the Decree 153/2017/ND-CP dated 27 December 2017 for vegetable oil import tariffs
under ACFTA in the link below:
http://trungtamwto.vn/cachiepdinhkhac/nghi-dinh-so-1532017nd-cp-ngay-27122017-ban-hanh-bieu-
thue-nhap-khau-uu-dai-dac-biet
Under the VJFTA (Decree 155/2017/ND-CP dated 27 December 2017)
Please refer to the Decree 155/2017/ND-CP dated 27 December 2017 for vegetable oil import tariffs
under VJFTA in the link below: http://www.trungtamwto.vn/cachiepdinhkhac/nghi-dinh-so-
1552017nd-cp-ngay-27122017-ban-hanh-bieu-thue-nhap-khau-uu-dai-dac-biet
Under the VKFTA (Decree 149/2017/ND-CP dated 26 December 2017)
Please refer to the Decree 149/2017/ND-CP dated 26 December 2017 for vegetable oil import tariffs
under VKFTA in the link below: http://www.trungtamwto.vn/cachiepdinhkhac/nghi-dinh-so-
1492017nd-cp-ngay-26122017-ban-hanh-bieu-thue-nhap-khau-uu-dai-dac-biet
Under the VCFTA (Decree 154/2017/ND-CP dated 27 December 2017)
Please refer to the Decree 154/2017/ND-CP dated 27 December 2017 for vegetable oil import tariffs
under VCFTA in the link below:
http://www.trungtamwto.vn/cachiepdinhkhac/nghi-dinh-so-1542017nd-cp-ban-hanh-bieu-thue-
nhap-khau-uu-dai-dac-biet-cua-viet-nam-
Under the VN-EUEAFTA (Decree 150/2017/ND-CP dated 26 December 2017)
Please refer to the Decree 150/2017/ND-CP dated 26 December 2017 for vegetable oil import tariffs
under VCFTA in the link below:
http://www.trungtamwto.vn/cachiepdinhkhac/nghi-dinh-so-1502017nd-cp-ngay-26122017-ban-
hanh-bieu-thue-nhap-khau-uu-dai-dac-biet
Vietnamese government singed the Comprehensive and Progressive Trans-Pacific Partnership
(CPTPP) Agreement
On March 8, 2018 in Chile, Vietnamese government signed CPTPP Agreement with other countries.
Eleven countries joining CPTPP are Australia, Brunei, Canada, Chile, Japan, Malaysia, Mexico, New
Zealand, Peru, Singapore, and Vietnam. This CPTPP would come into effect at the beginning of 2019.
The deal is expected to eliminate 98 percent of tariffs in the trans-pacific marketplace. Vietnamese
Government expects that this CPTPP would attract more foreign direct investments in many sectors,
especially in agriculture and food processing sector. For further information on tariff commitment,
please see the link http://www.trungtamwto.vn/tpp/van-kien-hiep-dinh-cptpp

25
STATISTICS
Oilseeds PSD Tables
Table 25: Soybeans Oilseed, Soybean 2016/2017 2017/2018 2018/2019 Market Begin Year Jan 2017 Jan 2018 Jan 2019
Vietnam USDA Official New Post USDA Official New Post USDA Official New Post
Area Planted 120 72 120 65 0 65
Area Harvested 100 69 105 60 0 60
Beginning Stocks 476 476 483 443 0 332
Production 157 102 165 90 0 90
MY Imports 1650 1576 1900 1650 0 1900
Total Supply 2283 2154 2548 2183 0 2322
MY Exports 0 1 0 1 0 1
Crush 1200 1100 1450 1200 0 1350
Food Use Dom. Cons. 430 430 460 460 0 490
Feed Waste Dom. Cons. 170 180 190 190 0 200
Total Dom. Cons. 1800 1710 2100 1850 0 2040
Ending Stocks 483 443 448 332 0 281
Total Distribution 2283 2154 2548 2183 0 2322
Yield 1.57 1.4783 1.5714 1.5 0 1.5
(1000 HA) ,(1000 MT) ,(MT/HA)
Source: GSO, BICO, GTA, GCO, Estimates from Local Producers, Local Traders, Post estimates
Note: Soybean (HS code: 1201)
Table 26: Peanuts* Oilseed, Peanut 2016/2017 2017/2018 2018/2019 Market Begin Year Jan 2017 Jan 2018 Jan 2019
Vietnam USDA Official New Post USDA Official New Post USDA Official New Post
Area Planted 0 195 0 190 0 190
Area Harvested 195 195 200 190 0 190
Beginning Stocks 81 81 25 59 0 44
Production 451 462 465 450 0 450
MY Imports 160 214 250 250 0 270
Total Supply 692 757 740 759 0 764
MY Exports 7 38 8 35 0 35
Crush 40 40 60 40 0 40
Food Use Dom. Cons. 620 620 650 640 0 660
Feed Waste Dom. Cons. 0 0 0 0 0 0
Total Dom. Cons. 660 660 710 680 0 700
Ending Stocks 25 59 22 44 0 29
Total Distribution 692 757 740 759 0 764
Yield 2.3128 2.3692 2.325 2.3684 0 2.3684
(1000 HA) ,(1000 MT) ,(MT/HA)
Source: GSO, MARD, GTA, Local Traders, Post estimates;
*Note: Peanuts are on in-shell basis, including in-shell peanut (HS code 120210; 120241) and shelled peanuts (HS code
120220; 120242 and 200811 – including peanut butter, but peanut butter volume negligible), and peanut seeds with HS code
120230. Conversion rate from shelled peanut into in-shell peanuts: 1.33.
Table 27: Copra Oilseed, Copra 2016/2017 2017/2018 2018/2019 Market Begin Year Jan 2017 Jan 2018 Jan 2019
Vietnam USDA Official New Post USDA Official New Post USDA Official New Post
Area Planted 0 170 0 172 0 175
26
Area Harvested 170 170 172 172 0 175
Trees 0 0 0 0 0 0
Beginning Stocks 17 0 16 0 0 0
Production 269 13 272 14 0 14
MY Imports 0 0 0 0 0 0
Total Supply 286 13 288 14 0 14
MY Exports 0 0 0 0 0 0
Crush 270 13 275 14 0 14
Food Use Dom. Cons. 0 0 0 0 0 0
Feed Waste Dom. Cons. 0 0 0 0 0 0
Total Dom. Cons. 270 13 275 14 0 14
Ending Stocks 16 0 13 0 0 0
Total Distribution 286 13 288 14 0 14
(1000 HA) ,(1000 TREES) ,(1000 MT) ,(MT/HA)
Source: GTA, APCC, Provincial DARDs, MARD, Local industry, Ben Tre Coconut Association, Ben Tre Department of
Trade and Industry, Post estimates
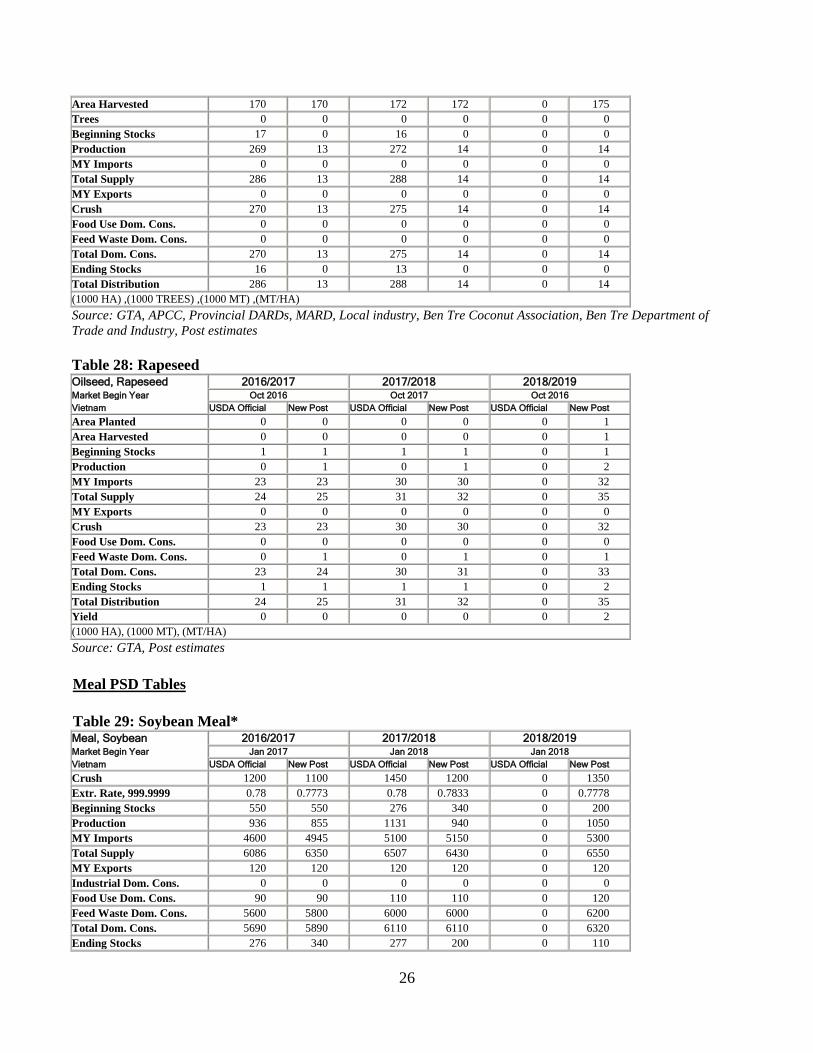
Table 28: Rapeseed Oilseed, Rapeseed 2016/2017 2017/2018 2018/2019 Market Begin Year Oct 2016 Oct 2017 Oct 2016
Vietnam USDA Official New Post USDA Official New Post USDA Official New Post
Area Planted 0 0 0 0 0 1
Area Harvested 0 0 0 0 0 1
Beginning Stocks 1 1 1 1 0 1
Production 0 1 0 1 0 2
MY Imports 23 23 30 30 0 32
Total Supply 24 25 31 32 0 35
MY Exports 0 0 0 0 0 0
Crush 23 23 30 30 0 32
Food Use Dom. Cons. 0 0 0 0 0 0
Feed Waste Dom. Cons. 0 1 0 1 0 1
Total Dom. Cons. 23 24 30 31 0 33
Ending Stocks 1 1 1 1 0 2
Total Distribution 24 25 31 32 0 35
Yield 0 0 0 0 0 2
(1000 HA), (1000 MT), (MT/HA)
Source: GTA, Post estimates
Meal PSD Tables
Table 29: Soybean Meal* Meal, Soybean 2016/2017 2017/2018 2018/2019 Market Begin Year Jan 2017 Jan 2018 Jan 2018
Vietnam USDA Official New Post USDA Official New Post USDA Official New Post
Crush 1200 1100 1450 1200 0 1350
Extr. Rate, 999.9999 0.78 0.7773 0.78 0.7833 0 0.7778
Beginning Stocks 550 550 276 340 0 200
Production 936 855 1131 940 0 1050
MY Imports 4600 4945 5100 5150 0 5300
Total Supply 6086 6350 6507 6430 0 6550
MY Exports 120 120 120 120 0 120
Industrial Dom. Cons. 0 0 0 0 0 0
Food Use Dom. Cons. 90 90 110 110 0 120
Feed Waste Dom. Cons. 5600 5800 6000 6000 0 6200
Total Dom. Cons. 5690 5890 6110 6110 0 6320
Ending Stocks 276 340 277 200 0 110
27
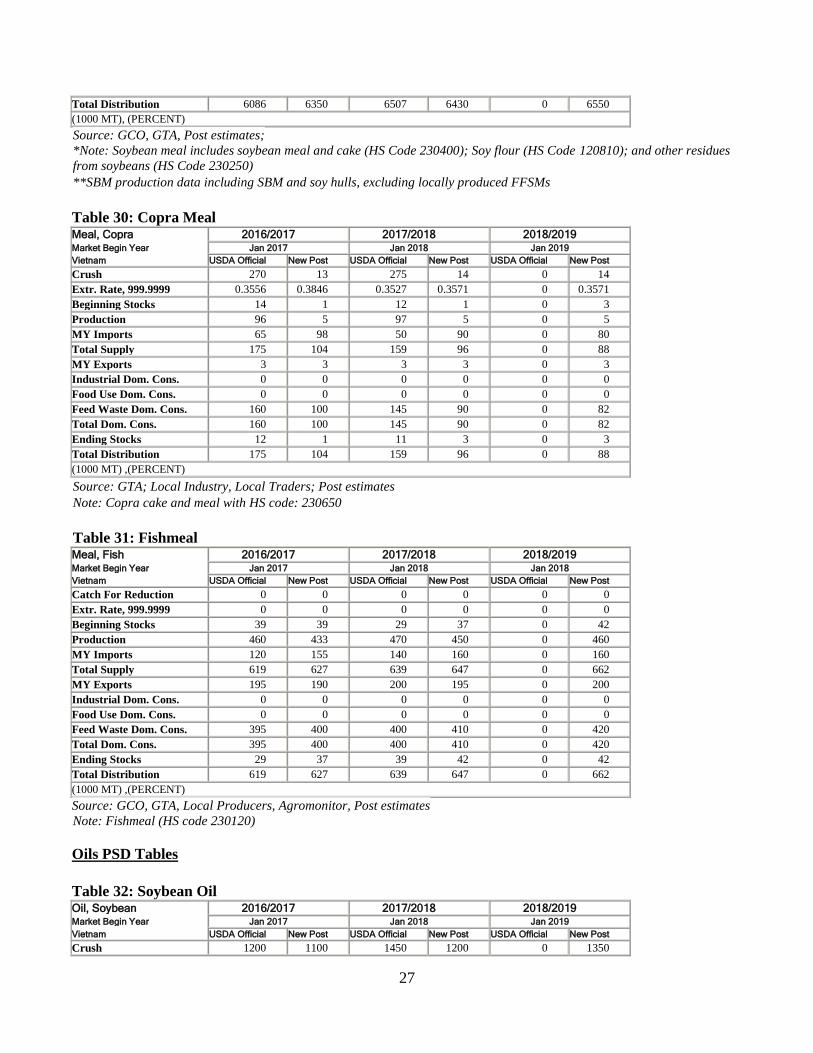
Total Distribution 6086 6350 6507 6430 0 6550
(1000 MT), (PERCENT)
Source: GCO, GTA, Post estimates;
*Note: Soybean meal includes soybean meal and cake (HS Code 230400); Soy flour (HS Code 120810); and other residues
from soybeans (HS Code 230250)
**SBM production data including SBM and soy hulls, excluding locally produced FFSMs
Table 30: Copra Meal Meal, Copra 2016/2017 2017/2018 2018/2019 Market Begin Year Jan 2017 Jan 2018 Jan 2019
Vietnam USDA Official New Post USDA Official New Post USDA Official New Post
Crush 270 13 275 14 0 14
Extr. Rate, 999.9999 0.3556 0.3846 0.3527 0.3571 0 0.3571
Beginning Stocks 14 1 12 1 0 3
Production 96 5 97 5 0 5
MY Imports 65 98 50 90 0 80
Total Supply 175 104 159 96 0 88
MY Exports 3 3 3 3 0 3
Industrial Dom. Cons. 0 0 0 0 0 0
Food Use Dom. Cons. 0 0 0 0 0 0
Feed Waste Dom. Cons. 160 100 145 90 0 82
Total Dom. Cons. 160 100 145 90 0 82
Ending Stocks 12 1 11 3 0 3
Total Distribution 175 104 159 96 0 88
(1000 MT) ,(PERCENT)
Source: GTA; Local Industry, Local Traders; Post estimates
Note: Copra cake and meal with HS code: 230650
Table 31: Fishmeal Meal, Fish 2016/2017 2017/2018 2018/2019 Market Begin Year Jan 2017 Jan 2018 Jan 2018
Vietnam USDA Official New Post USDA Official New Post USDA Official New Post
Catch For Reduction 0 0 0 0 0 0
Extr. Rate, 999.9999 0 0 0 0 0 0
Beginning Stocks 39 39 29 37 0 42
Production 460 433 470 450 0 460
MY Imports 120 155 140 160 0 160
Total Supply 619 627 639 647 0 662
MY Exports 195 190 200 195 0 200
Industrial Dom. Cons. 0 0 0 0 0 0
Food Use Dom. Cons. 0 0 0 0 0 0
Feed Waste Dom. Cons. 395 400 400 410 0 420
Total Dom. Cons. 395 400 400 410 0 420
Ending Stocks 29 37 39 42 0 42
Total Distribution 619 627 639 647 0 662
(1000 MT) ,(PERCENT)
Source: GCO, GTA, Local Producers, Agromonitor, Post estimates
Note: Fishmeal (HS code 230120)
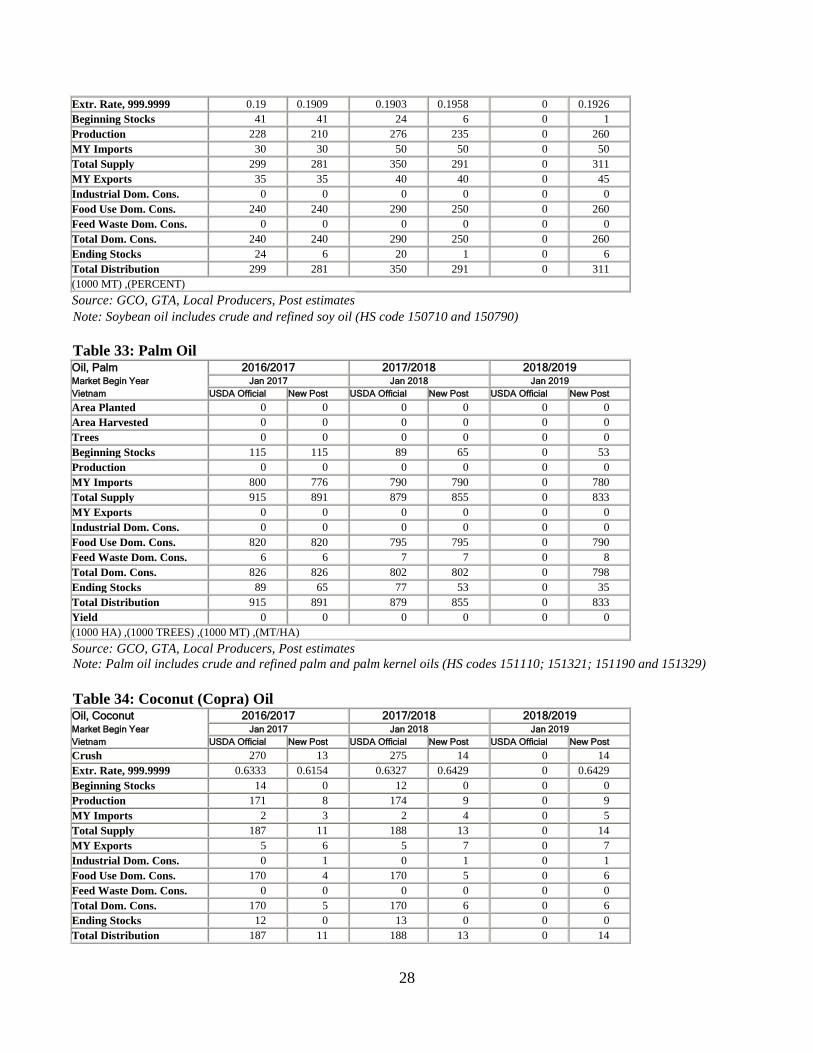
Oils PSD Tables
Table 32: Soybean Oil Oil, Soybean 2016/2017 2017/2018 2018/2019 Market Begin Year Jan 2017 Jan 2018 Jan 2019
Vietnam USDA Official New Post USDA Official New Post USDA Official New Post
Crush 1200 1100 1450 1200 0 1350
28
Extr. Rate, 999.9999 0.19 0.1909 0.1903 0.1958 0 0.1926
Beginning Stocks 41 41 24 6 0 1
Production 228 210 276 235 0 260
MY Imports 30 30 50 50 0 50
Total Supply 299 281 350 291 0 311
MY Exports 35 35 40 40 0 45
Industrial Dom. Cons. 0 0 0 0 0 0
Food Use Dom. Cons. 240 240 290 250 0 260
Feed Waste Dom. Cons. 0 0 0 0 0 0
Total Dom. Cons. 240 240 290 250 0 260
Ending Stocks 24 6 20 1 0 6
Total Distribution 299 281 350 291 0 311
(1000 MT) ,(PERCENT)
Source: GCO, GTA, Local Producers, Post estimates
Note: Soybean oil includes crude and refined soy oil (HS code 150710 and 150790)
Table 33: Palm Oil Oil, Palm 2016/2017 2017/2018 2018/2019 Market Begin Year Jan 2017 Jan 2018 Jan 2019
Vietnam USDA Official New Post USDA Official New Post USDA Official New Post
Area Planted 0 0 0 0 0 0
Area Harvested 0 0 0 0 0 0
Trees 0 0 0 0 0 0
Beginning Stocks 115 115 89 65 0 53
Production 0 0 0 0 0 0
MY Imports 800 776 790 790 0 780
Total Supply 915 891 879 855 0 833
MY Exports 0 0 0 0 0 0
Industrial Dom. Cons. 0 0 0 0 0 0
Food Use Dom. Cons. 820 820 795 795 0 790
Feed Waste Dom. Cons. 6 6 7 7 0 8
Total Dom. Cons. 826 826 802 802 0 798
Ending Stocks 89 65 77 53 0 35
Total Distribution 915 891 879 855 0 833
Yield 0 0 0 0 0 0
(1000 HA) ,(1000 TREES) ,(1000 MT) ,(MT/HA)
Source: GCO, GTA, Local Producers, Post estimates
Note: Palm oil includes crude and refined palm and palm kernel oils (HS codes 151110; 151321; 151190 and 151329)
Table 34: Coconut (Copra) Oil Oil, Coconut 2016/2017 2017/2018 2018/2019 Market Begin Year Jan 2017 Jan 2018 Jan 2019
Vietnam USDA Official New Post USDA Official New Post USDA Official New Post
Crush 270 13 275 14 0 14
Extr. Rate, 999.9999 0.6333 0.6154 0.6327 0.6429 0 0.6429
Beginning Stocks 14 0 12 0 0 0
Production 171 8 174 9 0 9
MY Imports 2 3 2 4 0 5
Total Supply 187 11 188 13 0 14
MY Exports 5 6 5 7 0 7
Industrial Dom. Cons. 0 1 0 1 0 1
Food Use Dom. Cons. 170 4 170 5 0 6
Feed Waste Dom. Cons. 0 0 0 0 0 0
Total Dom. Cons. 170 5 170 6 0 6
Ending Stocks 12 0 13 0 0 0
Total Distribution 187 11 188 13 0 14
29
(1000 MT) ,(PERCENT)
Source: GCO, GTA, Local Producers, Post estimates
Note: Coconut (Copra) oil includes Crude Coconut (Copra) Oil (HS code 151311) and Refined Coconut (Copra) Oil (HS
code 151319)