qatar university college of engineering development …
TRANSCRIPT

QATAR UNIVERSITY
COLLEGE OF ENGINEERING
DEVELOPMENT OF EMISSIONS REDUCTION TUBE FOR DIESEL ENGINES
BY
IHAB N. NASER
A Thesis Submitted to
the College of Engineering
in Partial Fulfillment of the Requirements for the Degree of
Masters of Science in Mechanical Engineering
January 2020
© 2019 IHAB N. NASER. All Rights Reserved.

ii
COMMITTEE PAGE
The members of the Committee approve the Thesis of
IHAB N. NASER defended on 04/12/2019.
Dr. Samer Ahmad
Thesis/Dissertation Supervisor
Name
Committee Member
Name
Committee Member
Name
Committee Member
Approved:
Dr. Khalid Kamal Naji, Dean, College of Engineering

iii
ABSTRACT
NASER, IHAB N., Masters: January : 2020,
Masters of Science in Mechanical Engineering
Title: Development of Emissions Reduction Tube for Diesel Engines.
Supervisor of Thesis: Samer A. Fikry.
Automobile industry have grown a lot since the last century and caused a serious
issue of emission releases to the atmosphere regardless of how useful it is to human
beings. Compression ignition diesel engines in particular will be the main focus of this
project due to the huge smoke emissions that are caused by incomplete combustion of
diesel fuel.
An emissions reduction tube has been fabricated and installed at the exhaust of
a single cylinder diesel engine that has a size of 230 cubic centimeters. Water and
sodium hydroxide were used as absorbing mediums.
The main effect was on engine’s emissions which are HC, CO, CO2, NOx and
smoke. Water has reduced hydrocarbon’s emissions by almost 40% but didn’t affect
the CO2 emissions. Sodium hydroxide solution which is 50% saturated however has
reduced carbon dioxides emissions almost by 90%. Moreover, NOx emissions were
reduced for both water and NaOH experiments. Smoke emissions were reduced by 80%
for both constant load and constant speed experiments.
In conclusion, NaOH and water showed that it is very possible to reduce or even
stop the harmful gasses from polluting the environment. An HC-CO2 reduction trade-
of relation has been found when using water and NaOH solution respectively, but in
general with a little bit of optimization, all emissions could be reduced to an acceptable

iv
limit keeping the environment as safe as possibly can.

v
DEDICATION
This work is dedicated for all those who gave me the courage to continue my studies. I
thank Al-mighty Allah and my family for the support they have given me during the
program. Special thanks go to my beloved wife Nariman who stood by me throughout
the report writing.

vi
ACKNOWLEDGMENTS
I’m really grateful to my friend Mohamed Elrentisy who supported me during
data collection. My gratitude to my colleagues Ahmad Saqer and Abo Baker for their
help in the lab. Special thanks to Dr. Samer Ahmad for keeping up with my work and
continuously guiding me until finalizing my research. I would like to thank our head of
mechanical Dr. Elsadig for understanding my situation at my work place where I had
to extend the program one more semester. Thanks to Qatar University’s committee for
accepting us in the Master’s Program.
Over and above all, I give praise to my creator Allah for his never-ending blessings in
my life.

vii
TABLE OF CONTENTS
DEDICATION ............................................................................................................... v
ACKNOWLEDGMENTS ............................................................................................ vi
LIST OF FIGURES ...................................................................................................... xi
chapter 1: Introduction ................................................................................................... 1
1.1 Problem Definition ............................................................................................... 1
1.2 Harmful gasses ..................................................................................................... 3
1.3 Smoke ................................................................................................................... 5
1.4 Diesel Engine’s emissions .................................................................................... 5
1.5 CO2 Reduction technique .................................................................................... 7
1.6 Objectives ............................................................................................................. 8
chapter 2: LITERATURE REVIEW ........................................................................... 10
2.1 Global Warming ................................................................................................. 10
2.1.1 Problem definition ....................................................................................... 10
2.1.2 Qatar’s Role and Vision .............................................................................. 10
2.2 Emissions from ICE ........................................................................................... 11
2.2.1 Particulate (PM) ........................................................................................... 12
2.2.2 Oxides of nitrogen emissions: ..................................................................... 12
2.2.3 Hydrocarbons and carbon monoxides emissions: ....................................... 13
2.2.4 HC, CO and NOx reduction ........................................................................ 15

viii
2.3 Carbon Dioxide Emissions ................................................................................. 16
2.4 Previous studies on capturing CO2 .................................................................... 17
2.4.1 Spraying of NaOH ....................................................................................... 18
2.4.2 Carbon Dioxide Capturing from automobiles ............................................. 19
2.4.3 Activated Charcoal ...................................................................................... 23
2.4.4 The Use of Solid Zeolite .............................................................................. 25
2.4.5 Absorption-desorption capabilities of 2-amino-2-methyl-1-propanol (AMP),
piperazine (PZ) and monoethanolamine (MEA) tri-solvent blends. .................... 27
2.4.6 Mixture of alumina, clay powder and an active component (Na2CO3) ...... 31
2.5 Smoke Emissions and reduction methods .......................................................... 34
2.5.1 Previous study on smoke reduction ............................................................. 34
2.5.2. Removal of carbon dioxide by a spray dryer ..................................................... 37
Chapter 3: Experimental Methods ............................................................................... 39
3.1 Test rig................................................................................................................ 39
3.1.1 The engine and it’s components .................................................................. 39
3.1.2 Emissions Reduction Tube .......................................................................... 45
3.1.3 Cooling system ............................................................................................ 47
3.1.4 The sodium hydroxide solution (NaOH) ..................................................... 50
3.2 Measuring devices .............................................................................................. 53
3.2.1 Gas Analyzer (ENERAC 700) ..................................................................... 53

ix
3.2.2 Smoke-o-meter ............................................................................................ 54
3.2.3 Thermocouple .............................................................................................. 56
Chapter 4: Results and Discussion ............................................................................... 57
4.1 Engine Performance ........................................................................................... 57
4.1.1 Volumetric efficiency .................................................................................. 58
4.1.2 Break Specific Fuel Consumption ............................................................... 60
4.1.3 Thermal Efficiency ...................................................................................... 62
4.1.4 Air to Fuel Ratio .......................................................................................... 64
4.2 Engine Emissions ............................................................................................... 66
4.2.1 Hydrocarbons (HC) ..................................................................................... 66
4.2.2 Carbon Dioxide (CO2) ................................................................................ 68
4.2.3 Carbon Monoxide (CO) ............................................................................... 71
4.2.4 Nitrogen oxides (NOx) ................................................................................ 73
4.2.5 Smoke (Opacity) .......................................................................................... 75
4.3 Temperature readings ......................................................................................... 77
4.3.1 Reference case ............................................................................................. 77
4.3.2 Water case .................................................................................................... 78
4.3.3 NaOH solution case ..................................................................................... 80
Chapter 5: Conclusions ................................................................................................ 82
References .................................................................................................................... 85

x
Appendix A: Calibration certificate ............................................................................. 87
Appendix B: naoh sds .................................................................................................. 88
Appendix c: Experiments excel tables ......................................................................... 95

xi
LIST OF FIGURES
Figure 1. Internal Combustion Engine [1] ..................................................................... 1
Figure 2. Three-way catalytic converter [7] .................................................................. 2
Figure 3. The greenhouse effect [2] ............................................................................... 4
Figure 4. Smoke emissions from a diesel car [11] ......................................................... 7
Figure 5. Saturation Curve for NaOH [7] ...................................................................... 8
Figure 6. Car's exhaust system [10] ............................................................................... 9
Figure 7. Specific NOx Vs. Load Percentage [12] ...................................................... 13
Figure 8. Specific HC Vs. Load Percentage [12]......................................................... 15
Figure 9. Historical data on HC, CO & NOx emissions [12] ...................................... 15
Figure 10. Regional Distribution of CO2 emissions in USA & Europe [13] .............. 17
Figure 11. Spraying of NaOH method [6] ................................................................... 19
Figure 12. Test rig schematic for CO2 capture [7] ...................................................... 20
Figure 13. CO2 absorption percentage as a function of time for various saturation limits
of NaOH [7] ................................................................................................................. 21
Figure 14. New designed distributor [8] ...................................................................... 22
Figure 15. Difference between old and new distributor in terms of CO2 absorption [8]
...................................................................................................................................... 23
Figure 16. Honeycomb design for CO2 capturing [9] ................................................. 25
Figure 17. CO2 emissions Vs Speed for different absorption materials [15] .............. 26
Figure 18. Absorption capacity of highly concentrated AMP-PZ-MEA tri-solvent
blends compared to MEA at atmospheric pressure, 313K (absorption temperature) and
15% v/vCO2 [14] ......................................................................................................... 30
xii
Figure 19. Heat duties of MEA and all the AMP-PZ-MEA blends using the correlation
suggested by Sakwattanapong et al.(2005) [14] .......................................................... 30
Figure 20. Schematic for test bed of Dinda's Experiment [16] .................................... 32
Figure 21. 2-D schematic for Whale Filter [17] .......................................................... 35
Figure 22. Engine's test bed “DY23-2B” ..................................................................... 40
Figure 23. Engine's specifications ............................................................................... 40
Figure 24. Dynamometer of the engine ....................................................................... 42
Figure 25. Engine's throttle pedal ................................................................................ 42
Figure 26. Tachometer ................................................................................................. 43
Figure 27. Fuel Guage.................................................................................................. 44
Figure 28. Manometer for indicating air flow into the engine in mmH2O.................. 44
Figure 29. Air intake conversion chart ........................................................................ 45
Figure 30. Emissions reduction pipe ............................................................................ 46
Figure 31. Emissions reduction dispenser ................................................................... 47
Figure 32. Cooling coil dimensions ............................................................................. 48
Figure 33. schematic for emissions reduction tube cooling system............................. 48
Figure 34. Cooling system radiator .............................................................................. 49
Figure 35. Test rig assembly ........................................................................................ 50
Figure 36. 1 kg bottle of NaOH pellets ........................................................................ 51
Figure 37. Preparation pan with ice bath for NaOH solution ...................................... 52
Figure 38. Gas analyzer "ENERAC700" ..................................................................... 53
Figure 39. Smoke-o-meter's display screen ................................................................. 55
Figure 40. Smoke-o-meter device "ECO SMOKE 100" ............................................. 55
Figure 41. Thermocouple ............................................................................................. 56

xiii
Figure 42. Volumetric efficiency vs. torque ................................................................ 58
Figure 43. Volumetric effeciency vs. speed ................................................................. 59
Figure 44. BSFC vs. torque.......................................................................................... 60
Figure 45. BSFC vs. speed ........................................................................................... 61
Figure 46. Thermal efficiency vs. torque ..................................................................... 62
Figure 47. Thermal efficiency vs. speed ...................................................................... 63
Figure 48. A/F ratio vs. torque ..................................................................................... 64
Figure 49. A/F ratio vs. speed ...................................................................................... 65
Figure 50. HC vs. torque .............................................................................................. 66
Figure 51. HC vs. speed ............................................................................................... 67
Figure 52. CO2 vs. torque ............................................................................................ 68
Figure 53. CO2 vs. speed ............................................................................................. 69
Figure 54. CO2 absorption efficiency curve ................................................................ 70
Figure 55. CO vs. torque .............................................................................................. 71
Figure 56. CO vs. speed ............................................................................................... 72
Figure 57. NOx vs. torque............................................................................................ 73
Figure 58. NOx vs. speed ............................................................................................. 74
Figure 59. Smoke vs. torque ........................................................................................ 75
Figure 60. Smoke vs. speed ......................................................................................... 76
Figure 61 Exhaust Temp Vs. Torque ........................................................................... 78
Figure 62 Exhaust Temp Vs. Speed ............................................................................. 78
Figure 63 Temp Diff Vs. Torque (Water Case) ........................................................... 79
Figure 64 Temp Diff Vs. Speed (Water Case) ............................................................. 79
Figure 65 Temp Diff Vs. Torque (NaOH Case) .......................................................... 80

xiv
Figure 66 Temp Diff Vs. Speed (NaOH Case) ............................................................ 81
Figure 67 . Calibration Certificate for ENERPAC700 Gas Analyzer ........................... 87
Figure 68 . SDS for NaOH ............................................................................................ 94
Figure 69. Reference experiment for constant speed ................................................... 95
Figure 70. Reference experiment for constant torque .................................................. 95
Figure 71. Water experiment for constant speed ......................................................... 96
Figure 72. Water experiment for constant torque ........................................................ 96
Figure 73. NaOH experiment for constant speed......................................................... 97
Figure 74. NaOH experiment for constant torque ....................................................... 97

1
CHAPTER 1: INTRODUCTION
In this chapter, a clear problem definition will be stated and addressed that
would clearly justify the needs of ways, techniques and efforts that individuals and
corporates are trying to study to come up with something that would stop or reduce the
large and hazardous amounts of automobile exhaust gasses released from diesel
engines.
1.1 Problem Definition
Automobiles play a crucial role in everyone’s daily life from transportation of
people to goods to trades etc. population growth has led to an increase in the number of
cars and trucks used on daily basis. Industrial continuous demand and revolution came
up with lots of improvements when it comes to automobiles. Hybrid and electrical cars
are a great alternative to internal combustion engine cars; however, they are still not
able to completely replace these highly efficient vehicles due to lack of power or the
very high cost of electric cars.
Figure 1. Internal Combustion Engine [1]

2
Internal combustion engines use the high energy content stored in gasoline and
diesel fuels and convert them into mechanical energy that drives the vehicles, figure
(1). The combustion of these fuels with air results in a great deal of hazardous emissions
like carbon dioxide CO2, carbon monoxide CO, unburned hydrocarbons HC, nitrogen
oxides NOx and smoke. These harmful gasses are bad to both people and environment.
The danger lies especially in carbon dioxide which plays a great role in global warming
which is because of a phenomenon called greenhouse gas effect.
Almost all automobile companies started using an environment friendly device called
the catalytic converter which is installed in the exhaust port of the vehicle. This device
converts harmful gasses into less harmful gasses, figure (2).
Figure 2. Three-way catalytic converter [7]
The catalytic converter or sometimes called diesel oxidation catalyst DOC in
diesel engines converts HC, NOx and CO into H2O, N2 and CO2 respectively. Carbon
dioxide will find its way to the atmosphere and forming some sort of a layer that traps
the ultraviolet and other radiations coming from the sun inside the hemisphere. This

3
will eventually and gradually increase the overall temperatures of the planet causing
problems to all living organisms.
1.2 Harmful gasses
The expansion of human’s activities reached high levels and affected the nature
of the globe. The natural systems on earth are being manipulated. It’s known that some
gases in atmosphere, such as nitrous oxide (N2O), methane (CH4), tropospheric ozone
(O3), and carbon dioxide (CO2) have been increasing in a tremendous manner in the
last century. Also, other gases which are not naturally a part of the natural system, such
as hydrocarbons (HC), chlorofluorocarbons and other gases are increasing as number
of vehicles, factories and different human activities increases. “These gases create a
thermal radiation shield; this shield reduces the amount of thermal radiation energy
allowed to escape from the earth, raising slightly the average earth temperature”
(Pulkrabek, 2004). This might negatively affect agriculture, sea levels, rain levels and
other impacts of the increment of the earth temperature, figure (3).

4
Figure 3. The greenhouse effect [2]
There are billions of vehicles on the road in whole the world. All these vehicles
together produce large amount of pollution. When it’s recognized that vehicles are the
major contributor in this problem, the governments created emission standards that
restrict the amount of pollution that vehicles can produce. Over the years, vehicle
companies made many improvements and modifications in engines to keep up with
these standards.
Currently, many researches investigate the most effective way to reduce carbon
dioxide emissions from vehicles and other types of internal combustion engines. So far,
the existed methods to reduce carbon dioxide are:
1- Using lower carbon content fuel, i.e. other than gasoline.
2- Using energy sources with low amount of carbon dioxide emissions, such as
wind, nuclear energy. (Replacing the internal combustion by other natural
power sources).

5
3- Increasing the combustion efficiency of the engine, this will burn huge amount
of carbon in the fuel by allowing for better mixing and burning, i.e. enhance
the combustion efficiency.
Also, some technologies are found to help in capturing carbon dioxide
emissions from burning fuel, such as solvent absorption, physical absorption and
adsorption, membrane systems, and other technologies. Also, there are some works still
in action on finding new ways to capture carbon dioxide, and one of these researches
might find a way to capture most of the carbon dioxide emissions, especially from
Mobile sources.
1.3 Smoke
Smoke is one of the most critical emissions of diesel engines. It is basically a
light black cloud that is formed due to incomplete combustion or oxidizing of fuel
inside the engine. Its composition may vary with the fuel type or rate of consumption,
or speed of engine operation. Smoke can cause lung cancer and can also lead to bladder
cancer [11]. Increasing load on the engine will lead to more injection of fuel into the
engine that can’t be burnt or oxidized completely due to no enough air to complete the
reaction and thus exiting through the exhaust.
1.4 Diesel Engine’s emissions
Diesel engines which are also called compression ignition engines (CIE) are
engines which run on diesel cycle, a combustion process of a reciprocating type. Fuel
is ignited due to the high temperature caused by compressing air into the cylinder. Fuel
in injected nearly at top dead center (TDC) after compression stroke. Diesel emissions

6
are gasses which come out from the exhaust of an automobile vehicle. The oxidation of
Diesel fuel result in the following by-products:
1. Nitrogen oxides (NOx), which are formed due to high temperature thermal fixation
of O2 and N2 in the air/fuel mixture, or due to reaction between ambient O2 and
N2-containing compounds in the fuel. The increase in temperature inside the
cylinder causes high formation of NOx. Also, lean fuel mixtures can cause high
formation of NOx due to slow flame speed.
2. Hydrocarbons (HC), which are formed due to incomplete combustion inside the
cylinder. Hydrocarbons are organic compounds containing carbon and hydrogen
atoms. Too lean and too rich fuel mixtures cause high release of HCs. Also, over
penetration of fuel molecules that wets the cylinder’s wall during ignition delay
(ID) cause high release of HCs.
3. Carbon oxide (CO), which is mainly formed due to incomplete oxidation of fuel.
Too rich mixtures cause high release in carbon monoxide. Carbon dioxide is formed
in the catalytic converter or the diesel oxidation catalyst due to oxidation of CO into
CO2.
4. Smoke, which is the black cloud that we mostly see from big truck’s exhausts figure
(4). Smoke is basically a form of unburned hydrocarbons that are light in weight.
Smoke is generated mainly due to incomplete combustion of fuel and is increased
with increasing load on the engine.

7
Figure 4. Smoke emissions from a diesel car [11]
1.5 CO2 Reduction technique
Sodium hydroxide also known as caustic soda is an inorganic compound that is
composed of both sodium positive ions and hydroxide negative ions. It is prepared by
adding the solid NaOH pellets or powder into water with different percentages and
molarities depending on the need. About 1.1 kg of NaOH is required to dissolve
completely in 1 Liter of water figure (5), this is called 100% saturated NaOH solution.
The reaction between solid NaOH and water is exothermic so care must be taken while
preparing the solution. NaOH has a great capability to react with CO2; as will be seen
later in the literature, or in other words absorbing it and not allow it to escape to the
atmosphere. Na2CO3 is called Sodium carbonate and it is the by-product of the
absorption reaction. It can be used in the manufacture of glass, paper, rayon, soaps, and
detergents.

8
NaOH ➔ Na+ + OH- + HEAT
NaOH + CO2 ➔ Na2CO3 + H2O
Figure 5. Saturation Curve for NaOH [7]
1.6 Objectives
The main motivation or driving force to do this project is to come up with a
device that can be easily installed at the back of an automobile’s exhaust that would
absorb or reduce all the less harmful gasses which are CO2, HC, NOx and smoke after
the diesel oxidation catalyst. For that, a simple cylindrical device with a special
designed dispenser or distributor were fabricated as per the nominal size of any exhaust
tailpipe and connected at the exhaust port of a single cylinder diesel engine that will be
elaborated more in the experimental methods section.
This device will be tested three times for three different experiments.
0
0.2
0.4
0.6
0.8
1
1.2
0 200 400 600 800 1000 1200
Wat
er (
Lite
rs)
NaOH (Grams)
NaOH Preparation CurveWater Volume Vs. NaOH

9
The objectives are as follows:
1. Develop an emission reduction tube that can be installed easily with the
current exhaust pipe of diesel vehicles.
2. Test the emissions reduction tube on a single cylinder diesel engine when
filled with water and NaOH solution and observe the exhaust gasses
concentrations.
3. Compare the engine performance and emissions of the engine when using the
developed tube with the reference parameters of the engine without using the
tube.
All of these 3 experiments will be done twice, for constant load-variable speed and
constant speed-variable load. The experiment with NaOH will be done as a function of
time in order to see how much the alkaline solution can last before it can’t absorb any
more CO2
In this project, the unused portion of the exhaust tailpipe will be utilized to
install the cylindrical device and thus not adding to the overall mass or volume of the
automobile’s exhaust system as can be seen in figure (6)
Figure 6. Car's exhaust system [10]

10
CHAPTER 2: LITERATURE REVIEW
In this part of the research, detailed studies that have been executed in the past
will be mentioned and discussed. The whole idea of carbon dioxide capturing was
limited to industries and power plants to be exact since “limiting pollution” has become
a viral part of the environmental sectors of governments in most of the developed
countries if not all. Nowadays, this idea has been extended to automobiles as well
because of its non-negligible amount of carbon dioxide release. In the following sub-
chapters, the evolving idea of carbon dioxide capturing in automobiles will be reviewed
thoroughly.
2.1 Global Warming
2.1.1 Problem definition
Unanimously, this problem would be global warming. Global warming is the
rise in the overall temperature of earth’s atmosphere due to the greenhouse effect. This
is caused by some hazardous gasses released to the air’s mixture. The main contributor
is a gas called carbon dioxide or CO2. Earth’s average temperature raised about 0.8oC
since the 1880s, with approximately two-thirds of the increase happening since 1980’s
[1].
Recent statistics conducted by NASA’s Goddard Institute for Space Studies (GISS) and
the National Climatic Data center showed that 2005 and 2010 were the warmest year
of planet earth [2]. Carbon dioxide blocks earth’s radiation back space. Sun radiates it
at near infrared. However, earth radiates out at far infrared.
2.1.2 Qatar’s Role and Vision
The state of Qatar has, and still is, witnessing a large growing economy in terms
of oil and gas profit. This growth of course comes with side effects. One of these major
side effects is the release of CO2 to the atmosphere which the ministry of environment

11
is trying to regulate and control.
According to Qatar National Vision 2030:
“The State shall preserve the environment and its natural balance in order to achieve
comprehensive and sustainable development for all generations” [3]
The need for developing in terms of environment has been set as a major pillar on which
the future of Qatar is based and depending on. Also the need of address the global
environmental issues of Global Warming has been directly highlighted in the 2030
vision.
Qatar is one of the largest producers of Natural Gas and CO2 is one of the byproducts
of this process. Whitson and Kuntadi [4] have stated, in a conference held in Qatar, that
the annual production of 2.54 million metric tons of CO2 in Qatar. Along with this,
there is significant amount of CO2 being produced in burning of fossil fuel and coal for
the production of electricity, cement production and many other industrial processes.
For time being, this research is focusing on how to minimize CO2 levels from reaching
out to the atmosphere until Qatar and other countries could find an alternative to fossil
fuels.
2.2 Emissions from ICE
Vehicles, trucks and other motors continue to play a leading role in increasing
the air pollution rates in the world today. It is the main source of volatile organic
compounds (VOCs), nitrogen oxides (NOx), carbon monoxide (CO), hydrocarbons
(HC), diesel particulate, and chlorofluorocarbons (CFCs).
In European countries, the vehicles are the largest source of emissions, such as CO,
NOx and HC. Researchers predicted that vehicles will remain the main source of
emissions for sometimes in the near future. “Currently, road vehicles account for 74%

12
of the nitrogen oxides and 94% of black smoke emissions in London”[5].
The vehicles are also considered as the main emission source in US and Japan.
“In overcrowded areas in US where the air pollution is severe, Environment Protection
Agency (EPA) has projected that vehicles will be the main source of 38% of NOx and
22% of total VOC in 2005” [5]
2.2.1 Particulate (PM)
Particulate is a mixture of liquid drops and solid particles found in the air. It includes
dirt, smoke and liquid drops. These particulates can be emitted by natural sources and
human made sources, such as dust from the wind, vehicles, industrial sites, and fires.
Also, it can be formed in the atmosphere by condensation or conversion of emitted
gases, such NOx, VOCs, and Sulphur dioxide SO2. These particulates are considered
one of the main reasons of lung cancer and other health symptoms.
2.2.2 Oxides of nitrogen emissions:
Under high temperature and pressure conditions in the engine, oxygen and nitrogen
atoms in the air reacts to form what is called nitrogen oxides (NOx). These nitrogen
oxides are one of the reasons of the acid rains and contribute in the destruction of the
ozone. In a study done by A. Avinash, P. Sasikumar to comprehensively study on the
emission. The variation of the specific brake oxides of the nitrogen emissions (in
g/kWh) with respect to the load (%) for several pre-mixed ratios is shown in figure 7.
The concept of premixing fuel and air in the inlet port of admission has reduced the
temperature of the mixture and this pre-cooling effect could be the reason for the
reduction of the combustion temperatures in the cylinder. In addition, improved
homogeneity due to premixing ensured that more air is now applied by the fuel. In fact,
this factor could have paved way to reduce the level of nitrogen oxides for premixed
fuel-air mixtures. Therefore, it was also observed from the experimental observations

13
that the range of the nitrogen oxides reduction is approximately 43% at 25% load to
approximately 48% at full load for 30% the premixed fraction when compared to diesel
base. As shown in figure 7, the emission values of nitrogen oxides at full load (100%)
are lower for all premixed ratios as compared to neat diesel. This tendency apparently
discloses the cooling effect of the ethanol addition on the gas temperature in the
premixed charge compression ignition cylinder
Figure 7. Specific NOx Vs. Load Percentage [12]
2.2.3 Hydrocarbons and carbon monoxides emissions:
Hydrocarbon emissions are produced when the fuel molecules in the vehicle do not
burn or only burn partially. When the nitrogen oxide and sunlight are available,
hydrocarbons particles make a reaction and form “ground level ozone”. High levels
of ozone during smog build-up can cause difficulty to people with respiratory ailments
like emphysema and asthma. Carbon monoxide (CO) is created due to incomplete
combustion, and it occurs when the carbon content in the fuel is not fully oxidized into
carbon dioxide (CO2). It causes few health problems, such as reduction of oxygen flow
in the blood stream. The variation of unburned hydrocarbons with respect to the load
for various premixed ratios is shown in figure 7. In this work, the unburned

14
hydrocarbons increased with the increase of the fractions premixed by the reduction of
the excess air with the increase of the fractions of the premix. The maximum value of
unburned hydrocarbons was observed for 30% of the premixed ratio. In addition,
hydrocarbons unburned were higher at lower loads (especially at 25% load) by an over-
leaning of the mixture, which no power sustained combustion since it is beyond the
flammability limit. Therefore, the premixed loading at lower loads could have
undergone poor combustion. However, at higher loads, the higher temperature inside
the combustion chamber could have contributed to better combustion during the
premixed loading mode. In general, the unburnt hydrocarbon from the premixed
charging operation is even greater than the diesel-based operation. The similar trend
observed with unburned hydrocarbons at the loads was evidently observed for the
emission of carbon monoxide as shown in figure 8. However, the trend was reversed at
higher loads due to the presence of oxygen in ethanol already. Higher temperature in
cylinders and higher loads. However, there was an increase in the emission of carbon
monoxide with the increase of the premix fraction. This increase can be explained by
the latent high heat of ethanol and another possible reason could be the effect of longer
ignition delay due to the addition of ethanol.

15
Figure 8. Specific HC Vs. Load Percentage [12]
2.2.4 HC, CO and NOx reduction
Recognition of the role of vehicle exhausts in the formation of greenhouse gases
led to the implementation of regulations controlling vehicle emissions starting in the
1960s in US. The development of control technology for vehicle emissions over the
past 5 decades has led to large decreases in the emissions as illustrated in Figure 9.
Figure 9. Historical data on HC, CO & NOx emissions [12]
The data for the 1957–1962 Fleet and 1963-1967 Fleet in Figure 9 are collected
from several hundred vehicles tested in the laboratories. The more recent data are
collected after applying the regulatory standards that must new vehicles met. It is clear
16
from increasing the regulatory standards and the huge difference between the latest
standards and the measured emissions from the 1957–1962 Fleet and 1963-1967 Fleet
that each vehicle per km basis has experienced major reduction in HC, CO, and NOx
emissions over the past 50 years. Even if the on-road vehicles number are increasing
dramatically these days, the total emissions of pollutants (i.e., HC, CO,
NOx, and PM) are projected to decline significantly in the coming decades. On a global
basis, the emissions of HC, CO, NOx in 2004 from light duty vehicles were
approximately 27, 160, and 8 Tg.
2.3 Carbon Dioxide Emissions
Recently, the Environmental Protection Agency (EPA) in US has started to consider
carbon dioxide, a product of “perfect” combustion, as a pollution source. Carbon
dioxide does not directly harm human health, but it is a “greenhouse gas” that traps the
earth’s heat and contributes in global warming phenomena.
As well as, according to a new study by the Europe authorities, carbon dioxide
emissions intensity (g CO2\km) of new passenger vehicles in Europe was determined
by the Europe authorities by 2009. As the diesel – gasoline CO2 emission difference is
small, and as the diesel have greater carbon fuel intensity, and emissions of carbon
dioxide per kilometer are related to the fuel intensity of passenger vehicles by
multiplying fuel/km times the carbon content of fuel, and it allows for normalized
comparison of diesel and gasoline vehicles and the aggregate emissions intensity.

17
Figure 10. Regional Distribution of CO2 emissions in USA & Europe [13]
Figure 10 show the regional distribution of CO2 emissions in US and Europe in
2004, which was taken from energy information administration [13]. The CO2
emissions which produced by different transportation sectors in US and Europe. Figure
10 shows the CO2 emissions produced by passenger vehicles which classified as new
vehicles and stock vehicles. Based on newer study by Europe authorities which is
consisting of 12 countries (EU12), through 8 countries data can be accredited, the fuel
emissions-intensity of diesel and gasoline have been calculated through years, and
released until 2008. The average vehicle in Europe release a 146.5 g of CO2 for each
kilometer driven [13]
2.4 Previous studies on capturing CO2
CO2 capture means trapping the CO2 at its emission source, transporting it to a
storage location, and isolates it. CO2 can be captured by three ways, post-combustion,
pre- combustion and oxy-fuel combustion.
In post-combustion, the CO2 is captured after the fuel is burned. This burning produces

18
different types of emissions, such as CO2, water vapor, sulfur dioxide and nitrogen
oxides. This process uses a filter to remove CO2 from other emissions. This filter is
basically a solvent that absorbs CO2. The solvent can be later heated, which will release
water vapor and leave concentrated CO2 behind. This process can prevent 80 % to 90%
of CO2 emissions from reaching the atmosphere.
In pre-combustion, CO2 is trapped before burning the fuel. The fuel is heated
in pure oxygen, producing a mixture composed of carbon monoxide and hydrogen.
Then, this mixture is passed through a catalytic converter with steam, which will
produce extra hydrogen atoms with CO2. These gases are fed into a flask with a
chemical called amine. The amine will bond with CO2 and fall to the bottom of the
flask, and the hydrogen will rise up out of the flask. Then, amine and CO2 mixture are
heated, where amine drop to the bottom of the flask, and CO2 rises to the top for
collection.
In oxy-fuel combustion, the fuel is burned in oxygen. This will produce a gas
mixture composed mostly of steam and CO2. The steam and CO2 are separated by
cooling and compressing the mixture. The oxygen required for this process is so
expensive, but researchers are developing new ways to capture CO2 in a most efficient
and cheap ways.
2.4.1 Spraying of NaOH
In contrast to the carbon capture systems for power plants, the system described
in this work captures CO2 directly from ambient air. This has the advantages that CO2
emission that left after combustion process to be captured. The objective of this research
is to determine the feasibility of a NaOH sprays for use in a CO2 capture system by
estimating the energy and cost requirements per unit CO2 captured, figure (11). A

19
prototype is constructed and tested to measure CO2 absorption, energy use, and the
costs of this process.
The analysis of the system indicates that CO2 capture from air is technically practical
by using NaOH spray technology. Drop coalescence apparently decreases the CO2
absorption efficiency; however, pump and fan energy requirements are still
manageable. “The cost of CO2 capture by using NaOH spray in the full-scale system is
96 $/ton-CO2 in the base case, and ranges from 53 to 127 $/ton-CO2 under alternate
operating parameters and assumptions regarding capital costs and mass transfer rate”
[6]. This is about 26.45 $/MWh
2.4.2 Carbon Dioxide Capturing from automobiles
A study by a group of people in Qatar University was conducted and considered
an eye opener to absorbing carbon dioxide. They have used NAOH solution in water
and subjected it to the exhaust of car’s engine [7]. Actually, the true experiment only
Figure 11. Spraying of NaOH method [6]
20
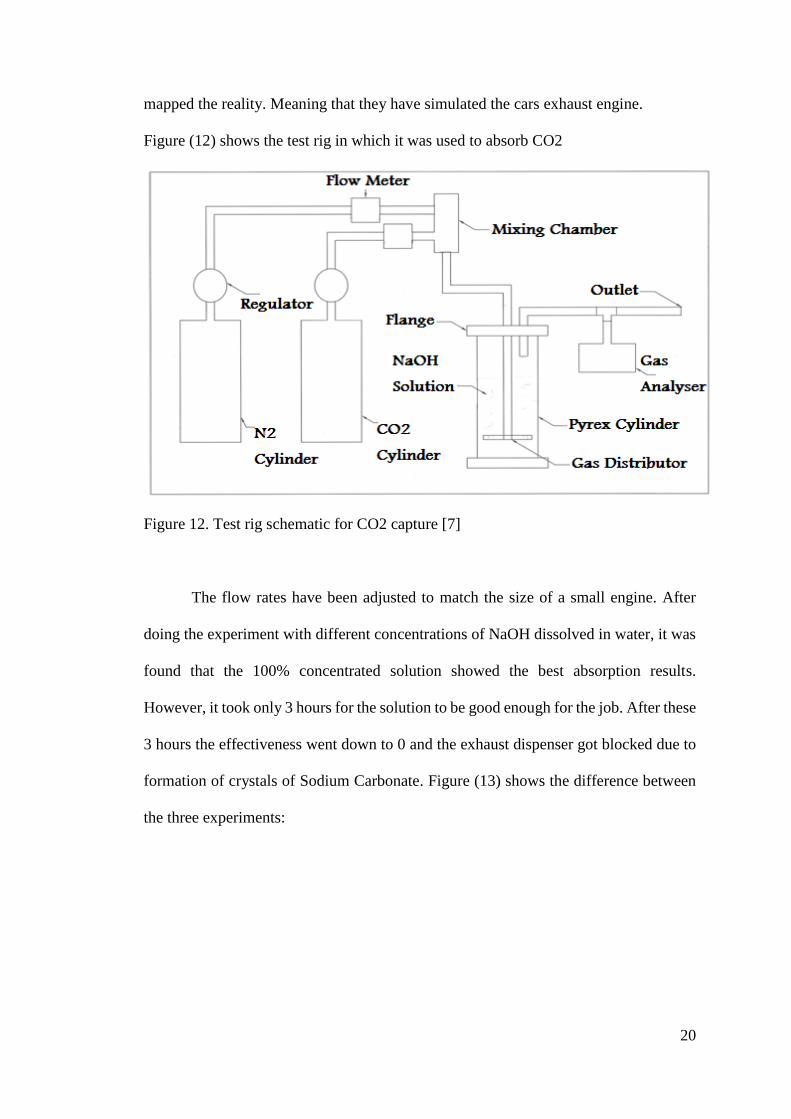
mapped the reality. Meaning that they have simulated the cars exhaust engine.
Figure (12) shows the test rig in which it was used to absorb CO2
Figure 12. Test rig schematic for CO2 capture [7]
The flow rates have been adjusted to match the size of a small engine. After
doing the experiment with different concentrations of NaOH dissolved in water, it was
found that the 100% concentrated solution showed the best absorption results.
However, it took only 3 hours for the solution to be good enough for the job. After these
3 hours the effectiveness went down to 0 and the exhaust dispenser got blocked due to
formation of crystals of Sodium Carbonate. Figure (13) shows the difference between
the three experiments:

21
Figure 13. CO2 absorption percentage as a function of time for various saturation limits
of NaOH [7]
A second trial by different group of students in Qatar University as well was
conducted. This time, the distributor in which the exhaust gases exits to mix with the
solution has been modified as in figure (14).
-20%
0%
20%
40%
60%
80%
100%
0 50 100 150 200 250
Car
bo
n C
aptu
re (
%)
Time (min)
Comparison between graphs
100% Saturated
50% Saturated
25% Saturated

22
Figure 14. New designed distributor [8]
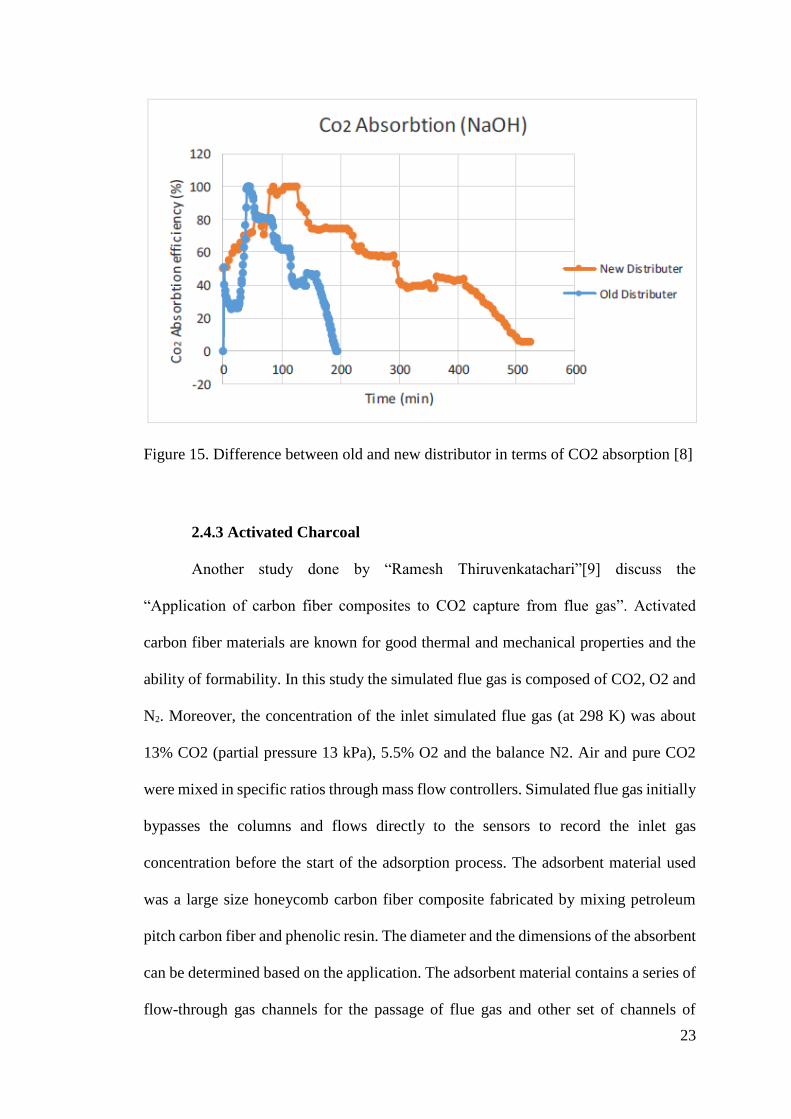
The new distributors allow for more interaction of atoms from exhaust gases
and NaOH solution. This was proven after taking the CO2 levels using a gas analyzer
after the exhausts leave the NaOH cylinder. The following figure (15) shows a
comparison between the old study and the new one:
23
Figure 15. Difference between old and new distributor in terms of CO2 absorption [8]
2.4.3 Activated Charcoal
Another study done by “Ramesh Thiruvenkatachari”[9] discuss the
“Application of carbon fiber composites to CO2 capture from flue gas”. Activated
carbon fiber materials are known for good thermal and mechanical properties and the
ability of formability. In this study the simulated flue gas is composed of CO2, O2 and
N2. Moreover, the concentration of the inlet simulated flue gas (at 298 K) was about
13% CO2 (partial pressure 13 kPa), 5.5% O2 and the balance N2. Air and pure CO2
were mixed in specific ratios through mass flow controllers. Simulated flue gas initially
bypasses the columns and flows directly to the sensors to record the inlet gas
concentration before the start of the adsorption process. The adsorbent material used
was a large size honeycomb carbon fiber composite fabricated by mixing petroleum
pitch carbon fiber and phenolic resin. The diameter and the dimensions of the absorbent
can be determined based on the application. The adsorbent material contains a series of
flow-through gas channels for the passage of flue gas and other set of channels of

24
different diameter to indirectly heat and cool the absorbent for regeneration (stain steel
can be used). Also, Triscar 3000 is used to determine the characteristics of the absorbent
such as the CO2 capture capacity. Two test columns to house the adsorbent material. A
stainless-steel column is placed inside the large column with the space between the two
columns filled with vacuum for insulation. Then, the absorbent material is wrapped
with Teflon and placed inside the inner diameter [9].
At the beginning of the process the CO2 entered the system with constant CO2
concentration and that is due to initial adsorbents regeneration but after about 14s the
sorbents begin to capture about 98% of CO2. However, near the breakthrough time the
CO2 uptake decreases as the column became fully saturated. As the flow rate increases
the viscous flow starts to increase resulting on earlier breakthrough time and a lower
CO2 capture. The study showed that the pore size distribution (PSD) is directly
proportional to the CO2 adsorption capacity as CO2 molecules are adsorbed mostly in
small micro-pores at 298 K and 760 mmHg,. The PSD is obtained from equilibrium
isotherms that show the mass transfer of CO2 through the porous solid. Follow are the
main results of this study:
• The CO2 adsorption capacities of the activated carbon composite at 298 K were
about 2.65 and 0.73 mmol/g at 760 and 99 mmHg, respectively.
• High gas separation ratio for CO2 from its mixture with N2.
• The carbon fiber composite has high adsorption heat which indicates high CO2
adsorption capacity.
The large size honeycomb shaped carbon fiber composite (HMCFC) absorbents
showed very high average CO2 adsorption capacity of 11.9 % (at 293 K and a1 atm),
figure (16). Also, CO2 capture efficiency was over 98 % before the absorbent become
fully saturated (breakthrough). Higher pore space than activated carbon fiber.

25
Increasing flow rate results in decreasing the CO2 adsorption. Adsorption capacity and
breakthrough were lower at high adsorption temperature.
Figure 16. Honeycomb design for CO2 capturing [9]
2.4.4 The Use of Solid Zeolite
Another work is conducted by Ahmad Numan, Ahmad Sakr, and Omar Amira
[15]. to develop carbon dioxide capture device for mobile system. Carbon dioxide
produces from human as bi-product of respiration, factories and anywhere there is
combustion reaction. Carbon dioxide itself in not harmful, but high level of it is harmful
because it is the main cause of greenhouse effect. This project is to design a system that
can be implemented in the automobiles, so it will minimize the pressure drop and
maximize the reaction area, as a result it will reduce the carbon dioxide emission. This
system is consisting of pipe of length 1m and diameter 50 mm that will be implemented
after the catalytic converter. This pipe contains small solid particles that it will absorb
the carbon dioxide from the gas outlet of the catalytic converter. This pipe is designed

26
to minimize the pressure drop; thus, it cannot harm the engine or its component. As the
material inside the pipe is solid, so it will work as adsorbent for the carbon dioxide that
is produced by the engine. There are many materials can be used to work as carbon
capture material, whoever only three materials have been chosen in this project which
are Silica-Aluminas (ERS-8(II)), Zeolite 13X, Metal Organic frameworks (Ru),
Sodium Hydroxide (NaOH), and mix of Sodium Hydroxide and Calcium Hydroxide
(NaOH + Ca(OH)2).
Figure 17. CO2 emissions Vs Speed for different absorption materials [15]
Above figure (17) shows the relation between the emissions of Carbon dioxide
with varying speed while the load is constant and equal 1.5 Nm. As it can be seen that
both Sodium hydroxide and the mixture of Sodium hydroxide and Calcium hydroxide
emit carbon dioxide lower than the performance test. The emission of both of them
increases gradually, the mixture intersects with the performance test at 1950 RPM, and
then it emits carbon dioxide higher than the performance test. This could be the same
reason as why the mixture produces more carbon dioxide than the performance test in

27
the varying load with constant speed. For the sodium hydroxide, it emits lower amount
of carbon dioxide than the performance test, in another word it is efficiently capture
carbon dioxide. It is end at 2100 RPM this due to failure in the exhaust pipe happened
while students conduct the experiment. On the other hand, Zeolite emits higher amount
of carbon dioxide than the performance test. To conclude, Zeolite fails in capture
Carbon dioxide.
2.4.5 Absorption-desorption capabilities of 2-amino-2-methyl-1-propanol
(AMP), piperazine (PZ) and monoethanolamine (MEA) tri-solvent blends.
A study conducted by Chikezie Nwaoha and Chintana Saiwan along with other authors
to achieve the task of enhancing the efficiency of CO2 capture a tri-solvent blend of
AMP-PZ-MEA was tested experimentally and the results were studied and discussed
thoroughly [14].
This study aimed at developing amine tri-solvent blend that will utilize the benefits of
the individual amine solvents and to reduce the individual problems accompanying
each. The blend of AMP-PZ-MEA was considered because of the high absorption
capacity of AMP and the superior absorption rate of PZ compared to primary amines
along with the good absorption rate of MEA as a primary amine. As a performance
monitoring criteria, this research analyzed the absorption capacity (AC, mol CO2/L
amine solution), cyclic capacity, initial absorption rates, initial desorption rates, and
heat duty (regeneration energy) of highly concentrated (6 kmol/m3) AMP-PZ-MEA tri-
solvent blends. The absorption capacity stated in this work is described as the
equilibrium CO2 loading multiplied by the amine concentration as seen in the below
equation. This will better indicate the total moles of CO2 absorbed by the amine
solution, because the total concentration of the AMP-PZ-MEA blends and MEA is 6
kmol/m3 and 5 kmol/m3 respectively.

28
𝐴𝐶 = 𝛼𝐶𝑂2𝑟𝑖𝑐ℎ ∗ 𝐶𝑎𝑚𝑖𝑛𝑒
Where 𝛼CO2rich is the equilibrium CO2 loading of the amine solution (mol CO2/mol
amine) and Camine is the total concentration of the aqueous amine solution (kmol/m3 or
mol/L of solution).
Based on the findings of this study the tri-solvent blend of AMP-PZ-MEA introduced
seems promising. At operating conditions of atmospheric pressure, 313K and 15.1%
v/v CO2, all the highly concentrated AMP-PZ-MEA tri-solvent blends possessed
slightly higher equilibrium CO2 loading (5.7-15.1%) compared to the conventional 5
kmol/m3 MEA. Additionally, all the tri-solvent blends showed higher absorption
capacities (29.1%-38.1% higher) than that of the standard 5 kmol/m3 MEA. While there
was no significant difference in the initial absorption rates of all studied amines, tri-
solvent blends (after the first 60 minutes). But the cyclic capacities were raised (100-
120%) by the AMP-PZ-MEA tri-solvent blends compared to the 5 Kmol/m3. There is
a trend in the results that was explained by an increase of easy to desorb bicarbonate
concentration as the AMP/PZ molar ratio increased [14]. The initial desorption rates of
the entire AMP-PZ-MEA tri-solvent blends were similar, thereby signifying slight
significant difference in their initial desorption rates. However, their initial desorption
rates were 93.5-125% higher than that of the single solvent 5 kmol/m3 MEA and the
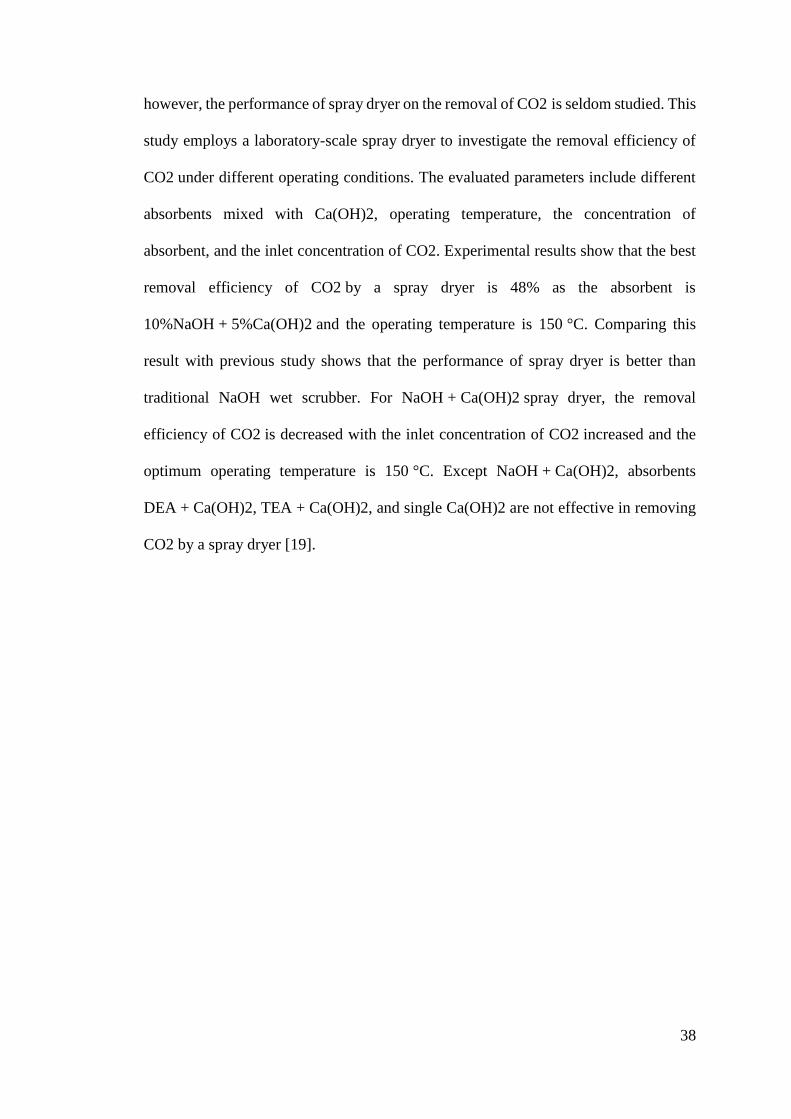
heat duties of all the AMP-PZ-MEA blends witnessed a large (50-54.5%) reduction
compared to that of the single solvent 5 kmol/m3 MEA. This experiment demonstrated
that the tri-solvent blends containing AMP-PZ-MEA are of high usefulness for CO2
capture in post combustion processes. Another possible adjustment to the blend that

29
might enhance the carbon dioxide capture characteristic is substituting the AMP with a
tertiary amine that has a similar initial absorption rate, higher cyclic capacity and lower
heat duty or substitute PZ with a polyamine with a superior CO2 absorption-desorption
capability. The significant 50% reduction in heat duty clarifies the possible usefulness
of AMP-PZ-MEA tri-solvent blends in carbon dioxide capture applications.
The results of this study are demonstrated in the figures below:
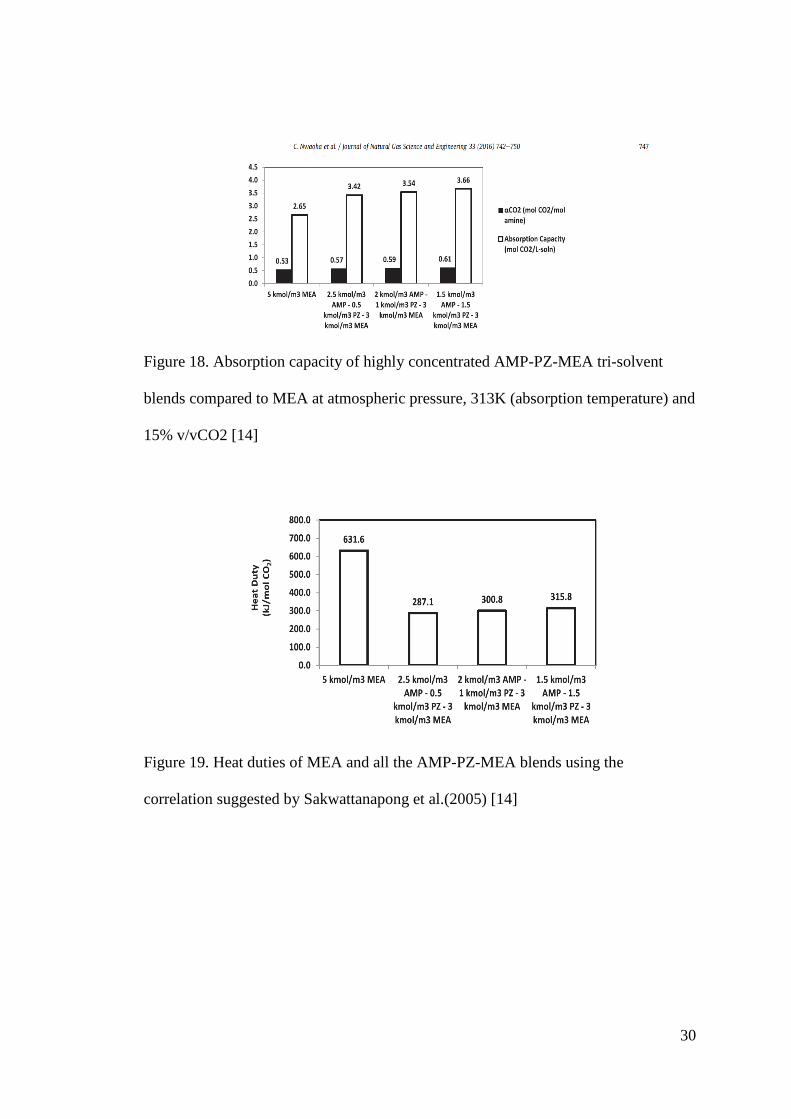
30
Figure 18. Absorption capacity of highly concentrated AMP-PZ-MEA tri-solvent
blends compared to MEA at atmospheric pressure, 313K (absorption temperature) and
15% v/vCO2 [14]
Figure 19. Heat duties of MEA and all the AMP-PZ-MEA blends using the
correlation suggested by Sakwattanapong et al.(2005) [14]

31
2.4.6 Mixture of alumina, clay powder and an active component (Na2CO3)
A study done by “Srikanta Dinda” under the name of “Development of solid adsorbent
for carbon dioxide capture from flue gas” focuses on the development of a low cost re-
generable solid adsorbent for the capture of CO2 from flue gas. The adsorption
experiments were carried out in a fixed bed flow reactor. For each experiment about 10
g solid adsorbent was loaded into the reactor. Simulated flue gas (a mixture of N2, CO2
and water vapor) was used to the study of CO2 adsorption. N2 and CO2 gas from two
different cylinder stocks was passed separately through mass flow controllers at
predetermined flow rates and are mixed together before passing through a water bubbler
where the gas mixture was allowed to saturate with water vapor. Then the gas mixture
(simulated flue gas) was passed through the adsorbent bed. The total flow rate of
simulated flue gas was kept constant at 150 ± 2 cc/min for all the experiments. The
reactor temperature was precisely controlled by using temperature controllers within
±1 °C. All the experiments were carried out at atmospheric pressure. The outlet
concentration of CO2 was measured by passing the reactor effluent through online CO2
IR analyzer. The total system was tested for leak-proof condition and calibrated
intermittently. [16].

32
Figure 20. Schematic for test bed of Dinda's Experiment [16]
The adsorbent material used was a mixture of alumina, china clay powder and an active
component of Na2CO3. It was observed that the surface area and pore-volume of the
prepared adsorbents decreased with increasing Na2CO3 loading. The effect of various
process parameters like adsorption temperature, CO2 level in the simulated flue gas,
loading of active component at different concentrations on CO2 and CO2 concentration
on the CO2 adsorption were discussed in this study. Simulated flue gas mixture
containing 3–9 vol% CO2 in N2, saturated with water vapor was passed through the
adsorbent bed. CO2 was chemically adsorbed by the supported Na2CO3 at 45–70 °C
temperature and desorbed in the temperature range between 120 °C and 130 °C. The
CO2 adsorption capacity of the adsorbents is expressed as the mmol of CO2 adsorbed
per unit mass of adsorbent. In order to determine the effect of adding Na2CO3 on CO2
adsorption, five different loading were examined starting from 5 wt% to 25 wt% at 55
°C temperature results show that, CO2 adsorption increased with the increase of
Na2CO3 loading up to 20 wt% and then drastically decreased at 25 wt% carbonate
loading (SM-SC-25) due to the decrease of the surface area for adsorption CO2.
Therefore, the maximum amount of Na2CO3 was 20 wt% (SM-SC-20). For the effect

33
of temperature on CO2 adsorption, four tests were done at different temperatures
ranging from 45 °C to 65 °C with three different concentrations of CO2.The results
showed that as the adsorption temperature was increased from 45 °C to 55 °C, CO2
uptake also increased. However, increasing the temperature above 55 °C resulted in
decreasing the CO2 uptake. This is due to the higher desorption rate of CO2. Moreover,
results showed that there is a negligible effect of temperature with low concentration of
CO2 due to the limitation of CO2 availability per site of adsorbent. For the effect on
CO2 concentration on the CO2 adsorption, four tests were done with the concentration
range 3-9 vol%. Results showed that as the CO2 concentration increased the adsorption
increased, however above 9 vol% there was no significant change in the adsorption
capacity due to the non-availability of free active sites. Also, an instrumental time lag
of around 3 min after which CO2 response was observed. Thus, this study shows that
using SM-SC-20 as a solid adsorbent with 20 wt% loading of Na2CO3 at a temperature
of 55 °C with CO2 concentration of 9vol% results in CO2 adsorption capacity of 0.37–
0.39 mmol/g. Also, the same adsorbent can be reuse for 3–4 times without significant
decrease of adsorbent capacity.

34
2.5 Smoke Emissions and reduction methods
Black Smoke is the most common type of smoke emissions generated from
diesel engine. It is simply an imbalance in the air to fuel ratio - too much fuel to not
enough air. This means either too much fuel is being added to the mix or there's not
enough oxygen being supplied to burn the fuel. The black smoke is full of particulates
that are basically large diesel particles that normally would be burned as fuel. Any way
you look at it, a diesel truck emitting black smoke is not going to be getting the optimal
fuel mileage it should be getting.
Most common causes of black smoke are faulty injectors, a faulty injector
pump, a bad air filter (causing not enough oxygen to be supplied), a bad EGR valve
(causing the valves to clog) or even a bad turbocharger.
2.5.1 Previous study on smoke reduction
In this work, the effect of using a Whale filter on the overall vehicle exhaust
emissions was evaluated [17]. A Whale filter is a South African patented diesel
particulate filter designed to operate as a secondary diesel filter for the removal of
particulate contaminants up to 0.5 microns in size in the fuel prior to injection. It is
believed that removal of contaminants prior to injection may improve the fuel injection
efficiency, thereby promoting efficient combustion, and thus resulting in reduced
emissions and fuel consumption. Emissions tests were conducted on four different
vehicle categories to validate this. All vehicles underwent pre-emissions testing prior
to installation of the Whale filter. Each test was conducted for a period of approximately
20 minutes by varying the engine speed. The Applus + Autologic Vehicle Emissions
Analyser was used to measure the emissions at each stage, and a similar procedure was
followed to measure the emissions after installation of the Whale filter. The results

35
showed a significant average reduction in carbon monoxide CO (35.3%), nitrogen
oxides NOx (26.1%) and hydrocarbons HC (34.3%) emissions after the Whale filter
was installed in the four vehicles.
Figure 21. 2-D schematic for Whale Filter [17]
The Whale filter is a South African patented secondary diesel filter designed by Mr
Hennie Joubert, the diesel filter is currently filed under patent number 2005/08375. The
filter has a cylindrical shape of 140 mm in diameter and 92 mm width as shown in
Figure 21.

36
The filter is made of transparent polypropylene plastic filter housing and polypropylene
base covers with perforated mild steel backing plates on the suction and delivery sides.
The fuel inlet and discharge nozzles are made from stainless steel 6 mm standard fitting
compatible with any diesel engine. The porous filter medium is made of natural cotton
fibres arranged in a specific pattern for uni-directional and uniform fuel flow
throughout the filter. The contaminants are captured through the filter media by
physical filtration process and accumulate from the inlet side to the suction side. The
end life cycle of the filter can also be verified by visual inspection of the filter media
through the transparent filter media housing. The filter has a larger active filtration area
compared to conventional primary filters and it targets micro particles of 0.5 μm and
smaller.
Four different vehicles categories were used for these tests and these include a 66 Seater
bus from Vaal Maseru, a Toyota Hilux bakkie from Semwes, a BELL 315SJ and John
Deere 7800 tractor from North River Carriers. All vehicles were subjected to pre-
emissions testing prior to fitment of the filter. Each vehicle was started and allowed to
idle for 5 minutes before a calibrated Autologic vehicle emission analyser probe was
inserted into the exhaust pipe. The analyser samples the exhaust gases at a pre-defined
time interval, the gases are diluted and analysed inside the analyser box. The analyser
measures the emissions present in the exhausts gases and record the data into the
analyser memory, the technical specifications of the emissions analyser used for this
experiment is presented in Table 3. The engine speed was increased to 1200 rpm and
kept constant for 5 minutes while the gas analyser was set to sample the gas every 5
seconds in order to obtain 60 data point over a 5 minutes interval. The same procedure
was followed at 1500 rpm and 900 rpm. The gas analyser intake filter was replaced and

37
a validation test was conducted. The data was downloaded to a computer and exported
to Microsoft Excel spread sheet for evaluation.
The overall average reduction in CO (35.3%), NOx (26.1%) and HC (34.3%) is
believed to be associated with the removal of fine particle contaminants in the diesel
using the Whale filter. The Whale filter is capable of filtering particles of up to 0.5 μm;
this was observed by a quick test conducted; whereby diesel fuel was contaminated
with black toner dust of an average particle size of 0.5 μm. The diesel was filtered
through a Whale filter in a single pass filtration resulting in a clear diesel filtrate. This
test has shown the ability of whale filter to capture toner particles. Most vehicles are
only fitted with primary diesel filters for the removal of particles contaminants prior to
combustion. Dust particles less than 5 μm can enter the fuel system through the fuel
cap when the vehicle is operated in dusty environment. Such particles are small enough
to pass through an in-line primary diesel filter into the fuel injector system. A whale
filter has been specially designed to work as a polishing filter for the primary fuel filter.
The whale filter removes finer particles from the pre-filtered diesel fuel by physical
filtration process through a filter media of helical platted cotton fibers with high packing
density.
2.5.2. Removal of carbon dioxide by a spray dryer
With the global warming due to greenhouse effects becoming serious, many efforts are
carried out to decrease the emissions of CO2 from the combustion of carbonaceous
materials. In Taiwan, there are 19 large-scale municipal solid waste incinerators
running and their total emission of CO2 is about 16 950 kton y−1. Spray dryer is the
most prevailing air pollution control devise for removing acid gas in waste incineration;
38
however, the performance of spray dryer on the removal of CO2 is seldom studied. This
study employs a laboratory-scale spray dryer to investigate the removal efficiency of
CO2 under different operating conditions. The evaluated parameters include different
absorbents mixed with Ca(OH)2, operating temperature, the concentration of
absorbent, and the inlet concentration of CO2. Experimental results show that the best
removal efficiency of CO2 by a spray dryer is 48% as the absorbent is
10%NaOH + 5%Ca(OH)2 and the operating temperature is 150 °C. Comparing this
result with previous study shows that the performance of spray dryer is better than
traditional NaOH wet scrubber. For NaOH + Ca(OH)2 spray dryer, the removal
efficiency of CO2 is decreased with the inlet concentration of CO2 increased and the
optimum operating temperature is 150 °C. Except NaOH + Ca(OH)2, absorbents
DEA + Ca(OH)2, TEA + Ca(OH)2, and single Ca(OH)2 are not effective in removing
CO2 by a spray dryer [19].

39
CHAPTER 3: EXPERIMENTAL METHODS
In this section of the report, the experiments which have been done will be
thoroughly elaborated and discussed. All of the experiment tools and apparatus will be
mentioned in details stating its function and a self-explanatory picture. The test rig was
designed and fabricated to match the size of a tail pipe of a common diesel engine. The
idea is to come up with a device that can be easily mounted at the back of any
automobile vehicle and fit properly.
In this experiment, a test rig which is a cylinder with a long dispenser will be installed
at the exhaust port; which is a flexible metallic hose, of a single cylinder diesel engine
in Qatar university’s heat engines laboratory. This test rig has been tested when it’s
empty “reference”, with water and finally with NaOH solution. Each one of these three
experiments have been tested for a constant load and variable speed at one time and for
a constant speed and variable load at the second. The engine parameters were taken and
tabulated as a function of torque and speed along with emissions using a gas analyzer
and smoke meter.
3.1 Test rig
3.1.1 The engine and it’s components
The engine used in this experiment is a single cylinder compression ignition
diesel engine figure (22). It is mounted on a fixed support and is attached to a
dynamometer to vary the load on the engine. The engine has a volume of 230 CC, 3.5
kW of maximum power at 1800 RPM and 21 N.m of maximum torque at 1100 RPM
figure (23)

40
Figure 22. Engine's test bed “DY23-2B”
Figure 23. Engine's specifications

41
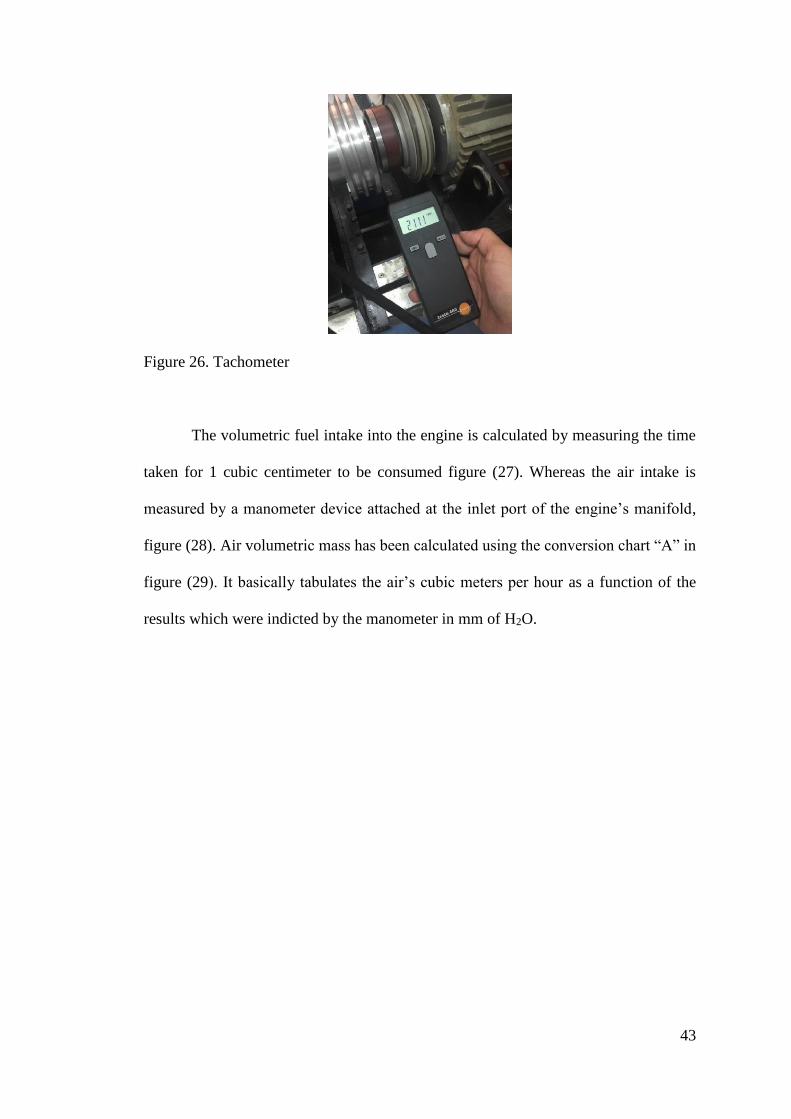
The engine’s shaft rotational speed is measured using a hand tachometer figure
(24). The tachometer gives the speed in RPM which will be converted to RPS for
calculations purpose. The engine has a manual pedal used to increase the amount of
fuel entering the engine’s cylinder increasing its power which in other words is called
the “throttle” figure (25). The dynamometer is connected to the engine’s protruded shaft
by means of a rigid coupling figure (26). This dynamometer can vary the load on the
shaft from 0 R to 5 R which can be converted to N.m using torque conversion tables.

42
Figure 24. Dynamometer of the engine
Figure 25. Engine's throttle pedal
43
Figure 26. Tachometer
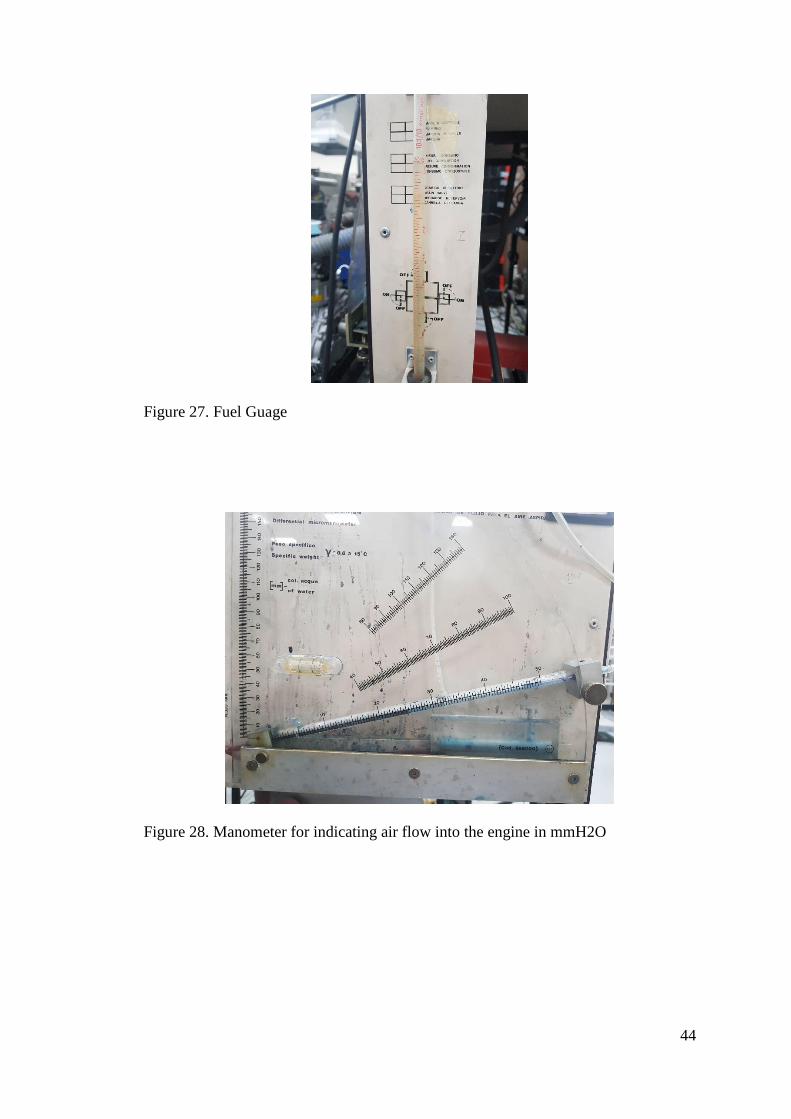
The volumetric fuel intake into the engine is calculated by measuring the time
taken for 1 cubic centimeter to be consumed figure (27). Whereas the air intake is
measured by a manometer device attached at the inlet port of the engine’s manifold,
figure (28). Air volumetric mass has been calculated using the conversion chart “A” in
figure (29). It basically tabulates the air’s cubic meters per hour as a function of the
results which were indicted by the manometer in mm of H2O.
44
Figure 27. Fuel Guage
Figure 28. Manometer for indicating air flow into the engine in mmH2O

45
Figure 29. Air intake conversion chart
3.1.2 Emissions Reduction Tube
The reduction tube basically a cylinder with 1.25 meters in length and 4 inches
in diameter figure (30). Inside of this cylinder is a dispenser that is 1 meter in length.
The dispenser is a smaller pipe that has a diameter of 1 inch and contains 10 holes of 5
millimeters diameter along its whole length. This is to allow of more surface of contact
between exhaust gasses and the liquid inside the cylinder thus enhancing the capturing
due to proper mixing figure (31). This whole system was designed and fabricated as
part of this study and the dimensions were chosen so that it can match the size of the
already existing exhaust pipe dimensions.

46
Figure 30. Emissions reduction pipe
The material used to fabricate this test rig is stainless steel 316L. This type of
metal was used to ensure that the alkaline solution NaOH does not react with the metal
causing corrosion and erosion to the material. The cylinder has a capacity of 23 Liters
but these 23 Liters will not be fully utilized with liquid since the dispenser will take
some of that space and also the cooling coil which will be mentioned later in this chapter
will take some of this space as well. These are the main disadvantages of this design. It
should be mentioned that the dispenser is directed by 45 degrees elbow to the bottom
of the 4 inches cylinder to maximize the area of contact.

47
Figure 31. Emissions reduction dispenser
3.1.3 Cooling system
Cooling system was added to the emissions reduction device in terms of a coil
immersed into the liquid in order to reduce the amount of evaporation due to high
exhaust temperature. The cooling system is composed of a cooling coil, a radiator,
normal water with a pump and an AC/DC converter. The cooling coil is basically a
copper tube with a diameter of 10 millimeters and a total length of 0.9 meters. The coil
has a mean diameter of 3 inches and is helical in shape. There are 30 coils in the 0.9
meters of the tube. The volume of the cooling coil is about 1.5 Liters which will not
take much of space from the cylinder. Normal water will be pumped into the cooling
coil which is chilled by a radiator that has 2 big fans attached to it. The pump and the 2
fans are attached to the AC/DC converter since the electrical supply inside the lab is
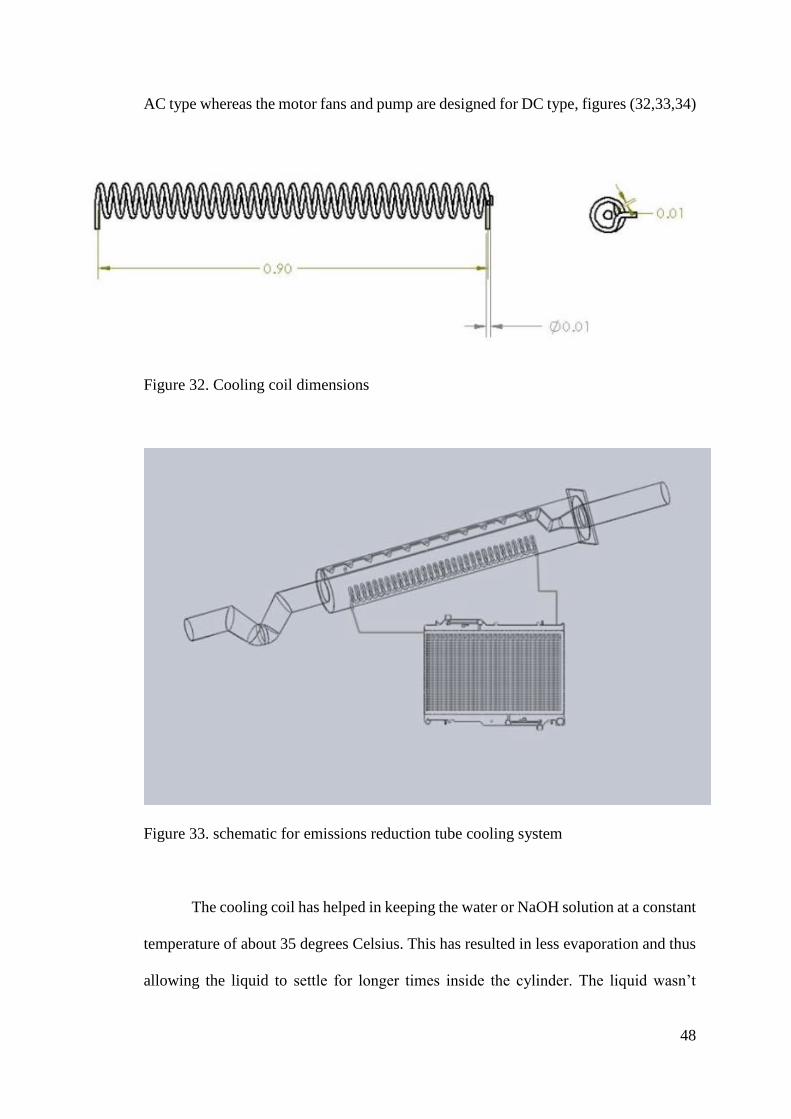
48
AC type whereas the motor fans and pump are designed for DC type, figures (32,33,34)
Figure 32. Cooling coil dimensions
Figure 33. schematic for emissions reduction tube cooling system
The cooling coil has helped in keeping the water or NaOH solution at a constant
temperature of about 35 degrees Celsius. This has resulted in less evaporation and thus
allowing the liquid to settle for longer times inside the cylinder. The liquid wasn’t

49
affected much from the high temperature exhaust gasses that are existing the flexible
exhaust metallic hose at around 120 degrees Celsius.
Figure 34. Cooling system radiator

50
Figure 35. Test rig assembly
Figure (35) shows the complete assembly of the emissions reduction tube with its
cooling device and outlet chimney to the atmosphere.
3.1.4 The sodium hydroxide solution (NaOH)
Sodium hydroxide (NaOH) comes in a form of powder or small pellets and is
converted to an alkaline solution by dissolving in water in a certain percentage. Every
1 kg of NaOH pellets dissolves completely in 1 liter of water making a 100% saturated

51
NaOH solution figure (36). In our experiment, only 0.5 kg was allowed to dissolve in
1 liter of water making a 50% saturated NaOH solution. This is to avoid the
crystallization of NaOH with CO2 from the engine’s emissions thus blocking the holes
of the dispenser as was seen in previous researches in the literature. The NaOH
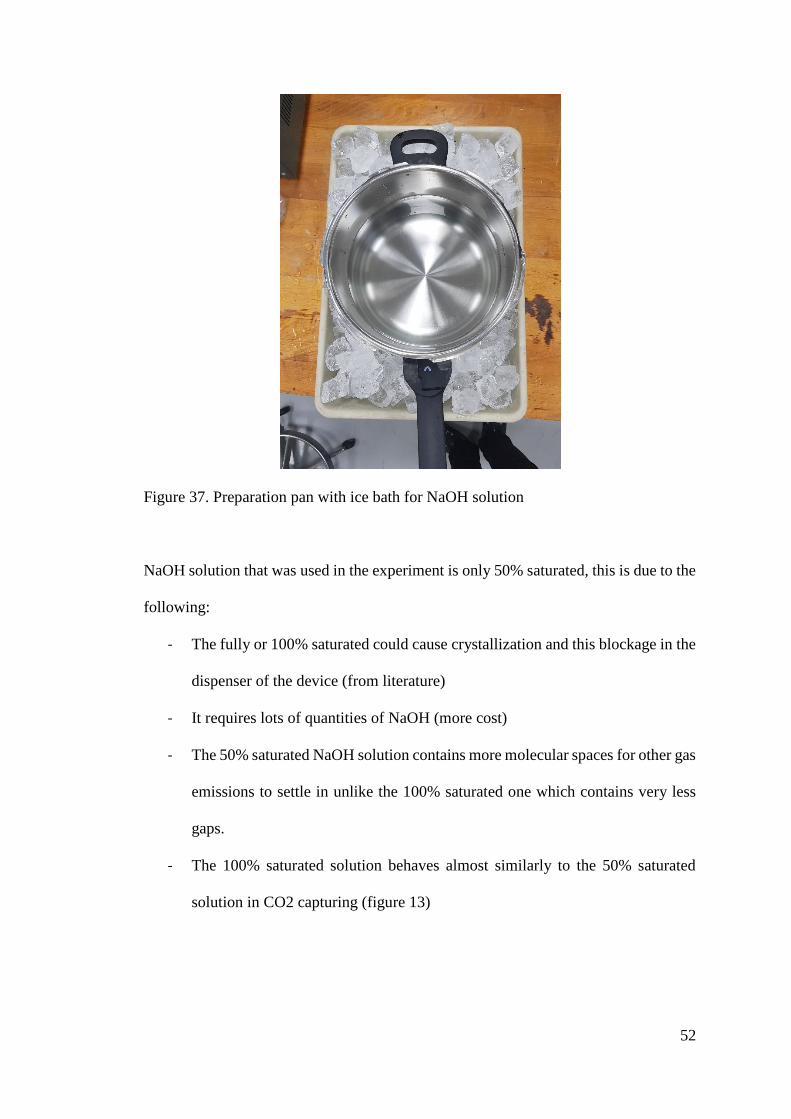
preparation is hazardous since the reaction with water is exothermic thus releasing heat.
So, an ice bath was used to cool down the reaction. NaOH pellets were added carefully
to the water pan that was immersed into the ice bath and stirred carefully to avoid
precipitation figure (37).
Figure 36. 1 kg bottle of NaOH pellets
52
Figure 37. Preparation pan with ice bath for NaOH solution
NaOH solution that was used in the experiment is only 50% saturated, this is due to the
following:
- The fully or 100% saturated could cause crystallization and this blockage in the
dispenser of the device (from literature)
- It requires lots of quantities of NaOH (more cost)
- The 50% saturated NaOH solution contains more molecular spaces for other gas
emissions to settle in unlike the 100% saturated one which contains very less
gaps.
- The 100% saturated solution behaves almost similarly to the 50% saturated
solution in CO2 capturing (figure 13)
53
3.2 Measuring devices
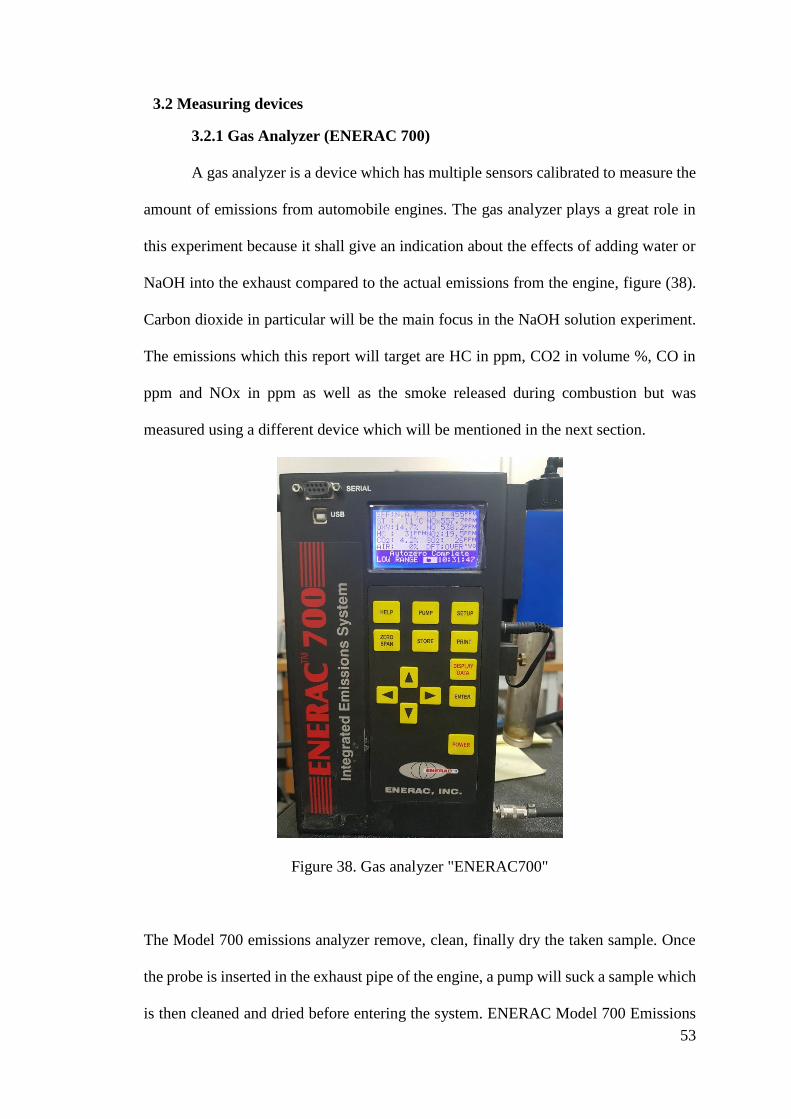
3.2.1 Gas Analyzer (ENERAC 700)
A gas analyzer is a device which has multiple sensors calibrated to measure the
amount of emissions from automobile engines. The gas analyzer plays a great role in
this experiment because it shall give an indication about the effects of adding water or
NaOH into the exhaust compared to the actual emissions from the engine, figure (38).
Carbon dioxide in particular will be the main focus in the NaOH solution experiment.
The emissions which this report will target are HC in ppm, CO2 in volume %, CO in
ppm and NOx in ppm as well as the smoke released during combustion but was
measured using a different device which will be mentioned in the next section.
Figure 38. Gas analyzer "ENERAC700"
The Model 700 emissions analyzer remove, clean, finally dry the taken sample. Once
the probe is inserted in the exhaust pipe of the engine, a pump will suck a sample which
is then cleaned and dried before entering the system. ENERAC Model 700 Emissions

54
system has large number of sensors that best serve the objective of this project. The
following are the integrated sensors which will be utilized during the experiment to
measure the targeted emissions:
A. Carbon monoxide sensor
B. Nitric oxide sensor
C. Nitrogen dioxide sensor
D. Sulfur dioxide sensor
E. Oxygen sensor
Calibration of the system is recommended annually. Through which the device is sent
to the factory for complete calibration depending on the sensor calibration span.
Calibration for the same system was done on the 6th of January, 2018 in order to ensure
accurate data and calibration certificate is attached as Appendix A
3.2.2 Smoke-o-meter
Smoke is a form of unburned light hydrocarbons which are called soot. The
smoke is one of the hazardous emissions from diesel engines and thus was important to
study. Smoke is measured by a device that takes part of the exhaust gases and allow it
to pass through a clear lens, the amount of soot accumulated on the lens will give an
indication of how much this soot covered the clean lens, figure (40). The unit of
measure is called opacity which shows in percentage how dirty the lens is for each run
or test.

55
Figure 39. Smoke-o-meter's display screen
Figure 40. Smoke-o-meter device "ECO SMOKE 100"

56
3.2.3 Thermocouple
A thermocouple was utilized to measure various temperatures at various points
on the test rig. Temperatures were taken at the intake manifold, exhaust manifold, inlet
and outlet of the cylinder capturing device.
Figure 41. Thermocouple

57
CHAPTER 4: RESULTS AND DISCUSSION
In this section of the report, the results obtained from the various experiments
will be discussed thoroughly. The experiment has been done to examine the emissions
reduction effectiveness of adding water or NaOH solution into a fabricated cylindrical
pipe in the exhaust of a single cylinder diesel engine. It is divided into three segments;
the first segment, in which it has been called the reference case, will show the various
emissions and engine parameters for a constant engine crank rotational speed at 1800
RPM with varying the torque from 0.9 NM to 5.1 with a 0.6 increment, and another test
with constant load of 1.5 NM but this time varying the speed from 1400 to 2600 with a
200 RPM increment. This experiment has been called the reference point because the
exhaust is open to atmosphere for comparison reasons. For the second and third
segments, the exact same thing was done except that water and NaOH solutions were
added respectively into the fabricated cylindrical device which is installed on the outlet
of the exhaust hose of the engine. The same emissions and engine parameters were
taken and calculated in order to compare them with the reference point.
4.1 Engine Performance
In this part of the results section, the engine parameters like volumetric
efficiency, break specific fuel consumption, thermal efficiency and air to fuel ratio will
be tabulated as a function of various torque values keeping speed at a constant rate.
Moreover, the same will be done for various speed values keeping the torque at a
constant rate. This has been done for the three experiments, i.e. without any liquid (Ref),
with water (W) and with sodium hydroxide (NaOH) solution.

58
4.1.1 Volumetric efficiency
Figure 42. Volumetric efficiency vs. torque
figure (42) shows the relation between the volumetric efficiency which is one
of the crucial engine parameters that directly contributes to the power and various
torque values for the three experiments. It basically means how well the engine can
breathe, i.e. the percentage in which the engine got air by how much the engine can
theoretically take. The volumetric efficiency didn’t change much for water experiment
but decreased around 2% from 68 to 66 % for NaOH solution experiment. It will be
explained later why it is still acceptable to lose this much of volumetric efficiency when
the results of emissions reduction are shown.
61
62
63
64
65
66
67
68
69
0.5 1 1.5 2 2.5 3 3.5 4
Vo
lum
etri
c Ef
f (%
)
Torque (N.m)
Volumetric Efficiency Vs. Torque
VE (%) Ref VE (%) W VE (%) NaOH

59
Figure 43. Volumetric effeciency vs. speed
Figure (43) shows the same relation as figure (42) but this time with varying the
engine’s speed. The engine experienced a decrease in volumetric efficiency for higher
RPMs. This means that the amount of air being taken by the engine is not big enough
to compensate the quick increase in the speed. The engine doesn’t have enough time to
let air into the cylinder, this could be due to the engine being a single cylinder.
Anyways, the water experiment shows higher average values of volumetric efficiency
with about 3% compared to the reference. The experiment with NaOH didn’t have
much effect and was almost similar to the reference.
55
57
59
61
63
65
67
69
71
73
75
1400 1600 1800 2000 2200 2400 2600
Vo
lum
etri
c Ef
f (%
)
Speed (RPM)
Volumetric Efficiency Vs. Speed
VE (%) Ref VE (%) W VE (%) NaOH

60
4.1.2 Break Specific Fuel Consumption
Figure 44. BSFC vs. torque
Figure (44) shows the relation between the break specific fuel consumption
values for all three experiments and various torque values of the engine. The patterns
are almost similar but with a slight increase of around 90 grams in the lower range
values of torque, i.e. from 0.5 to 1.5. It can be noticed that with the increased torque,
i.e. more load on the engine, the BSFC had an overall decrease from 1000 grams to 400
grams of fuel per kilowatt hours.
95
145
195
245
295
0.5 1 1.5 2 2.5 3 3.5 4
bSF
C (
g/kW
hr)
Torque (N.m)
bSFC Vs. Torque
bSFC (g/kW.hr) Ref bSFC (g/kW.hr) W bSFC (g/kW.hr) NaOH
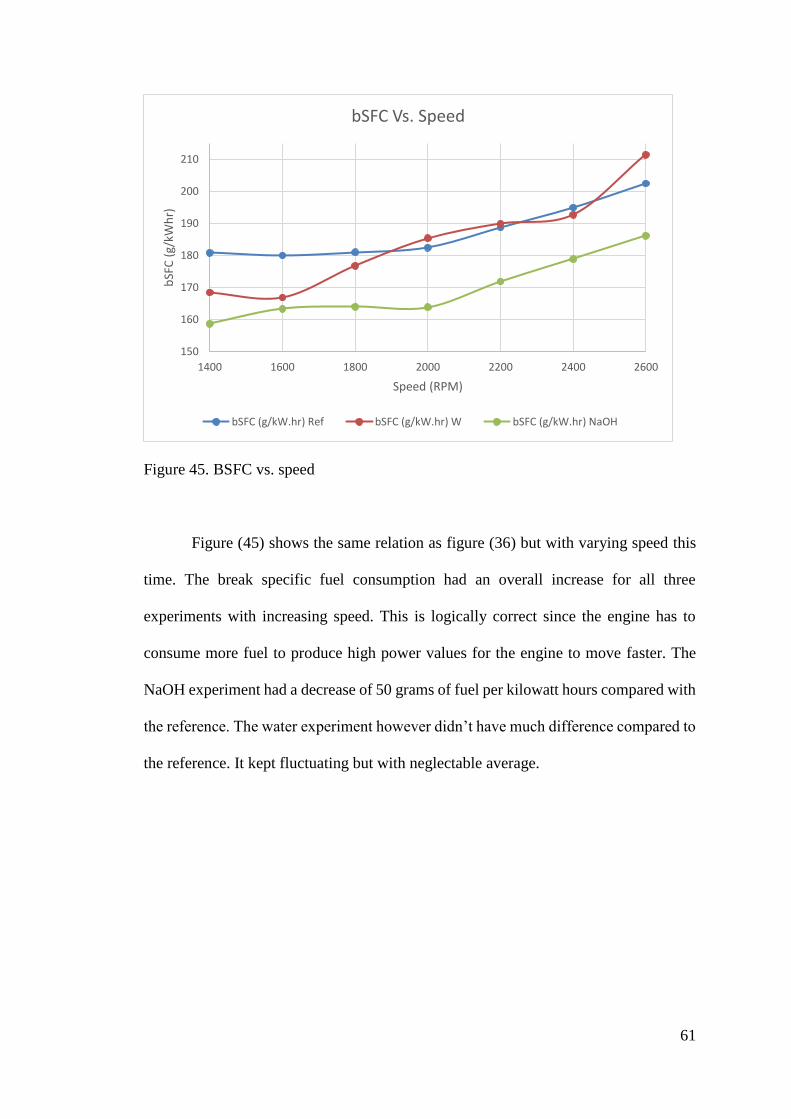
61
Figure 45. BSFC vs. speed
Figure (45) shows the same relation as figure (36) but with varying speed this
time. The break specific fuel consumption had an overall increase for all three
experiments with increasing speed. This is logically correct since the engine has to
consume more fuel to produce high power values for the engine to move faster. The
NaOH experiment had a decrease of 50 grams of fuel per kilowatt hours compared with
the reference. The water experiment however didn’t have much difference compared to
the reference. It kept fluctuating but with neglectable average.
150
160
170
180
190
200
210
1400 1600 1800 2000 2200 2400 2600
bSF
C (
g/kW
hr)
Speed (RPM)
bSFC Vs. Speed
bSFC (g/kW.hr) Ref bSFC (g/kW.hr) W bSFC (g/kW.hr) NaOH

62
4.1.3 Thermal Efficiency
Figure 46. Thermal efficiency vs. torque
Figure (46) shows a relation between the thermal efficiency of the engine and
the corresponding torques values for all experiments. On average, all three experiments
had the same increased factor of thermal efficiency. NaOH solution experiment shares
the same peak value with reference experiment of 21% at the same torque value. The
reason behind this increase in thermal efficiency is because the fuel is being well mixed
and almost completely burnt inside the cylinder.
5
7
9
11
13
15
17
19
21
23
0.5 1 1.5 2 2.5 3 3.5 4
Ther
mal
Eff
(%
)
Torque (N.m)
Thermal efficiency Vs. Torque
nth (%) Ref nth (%) W nth (%) NaOH
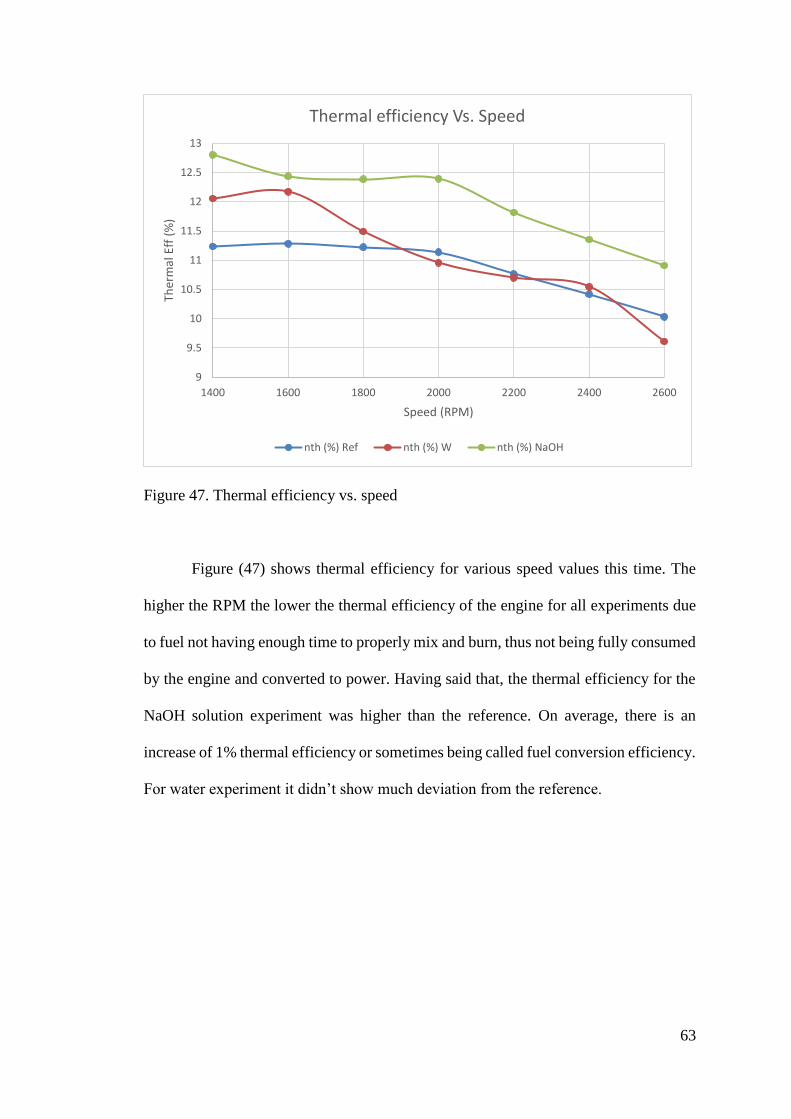
63
Figure 47. Thermal efficiency vs. speed
Figure (47) shows thermal efficiency for various speed values this time. The
higher the RPM the lower the thermal efficiency of the engine for all experiments due
to fuel not having enough time to properly mix and burn, thus not being fully consumed
by the engine and converted to power. Having said that, the thermal efficiency for the
NaOH solution experiment was higher than the reference. On average, there is an
increase of 1% thermal efficiency or sometimes being called fuel conversion efficiency.
For water experiment it didn’t show much deviation from the reference.
9
9.5
10
10.5
11
11.5
12
12.5
13
1400 1600 1800 2000 2200 2400 2600
Ther
mal
Eff
(%
)
Speed (RPM)
Thermal efficiency Vs. Speed
nth (%) Ref nth (%) W nth (%) NaOH

64
4.1.4 Air to Fuel Ratio
Figure 48. A/F ratio vs. torque
Figure (48) depicts that torque and air to fuel ratio are reversely proportional to
each other’s. This happened for all experiments with a similar factor of decreasing. At
lower values of torque, the NaOH solution experiment had lower values of A/F ratio of
about 10 than the reference. The decrease in A/F ratio means that for higher torque
values, the amount of air decreases as well. Although the fuel consumption decreases
from figure (44) which should result in higher A/F ratios, the percentage of air decreases
at a faster rate than fuel which results in an overall decrease in the air to fuel ratio.
20
25
30
35
40
45
50
55
60
0.5 1 1.5 2 2.5 3 3.5 4
A/F
Torque (N.m)
A/F Ratio Vs. Torque
A/F Ref A/F W A/F NaOH

65
Figure 49. A/F ratio vs. speed
Figure (49) shows the relation between A/F ratio and engine’s speed. The higher
the speed the lower the air to fuel ratio for all three experiments. This is because the
amount of air decreases for higher RPM as in figure (43) and amount of fuel increases
for higher RPM as in figure (45). Both NaOH solution and water experiments gave
better A/F ratios than the reference experiment. A/F ratio for NaOH solution experiment
had the same factor of increasing of about 5 for all RPM values.
From the experiments above, it is clearly shown and proven that engine
parameters were not affected much if not at all when adding the emissions reduction
tube which is containing the absorption mediums. This indicates that the addition of an
extra piece of device at the exhaust will not cause a serious or noticeable change in the
behavior of the engine. Also, it will not impact the power created by the engine hence
35
37
39
41
43
45
47
49
51
53
55
1400 1600 1800 2000 2200 2400 2600
A/F
Speed (RPM)
A/F Ratio Vs. Speed
A/F Ref A/F W A/F NaOH
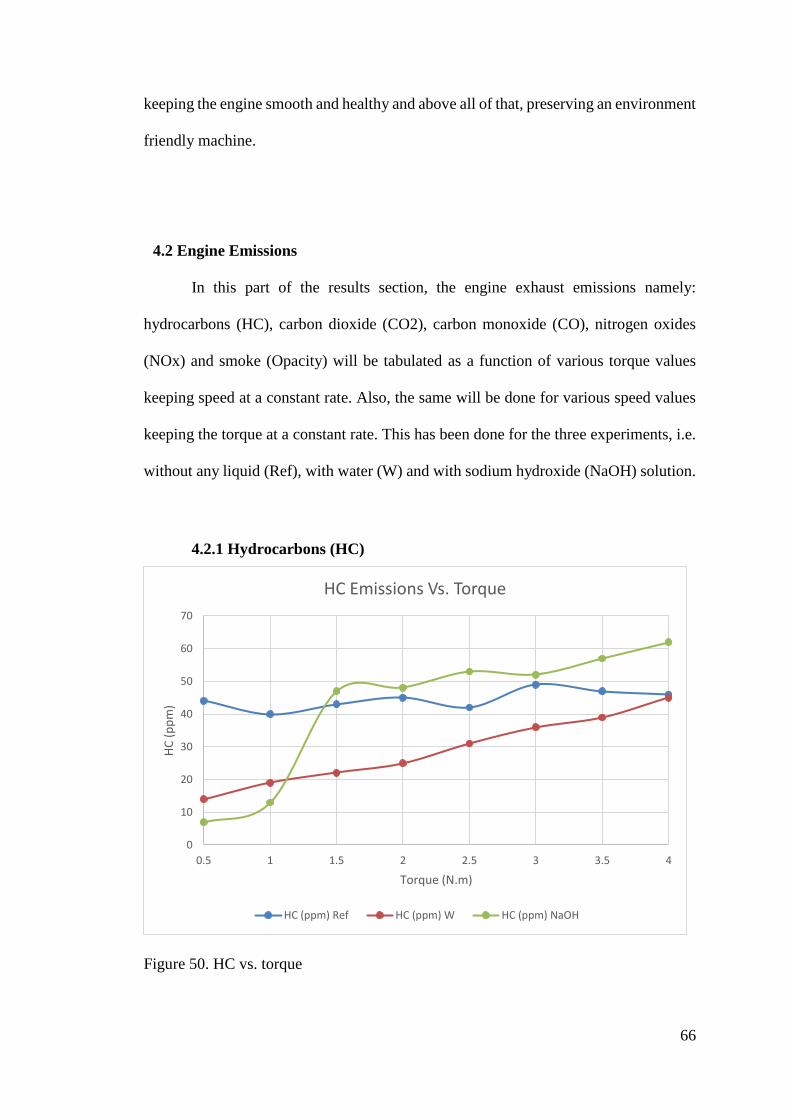
66
keeping the engine smooth and healthy and above all of that, preserving an environment
friendly machine.
4.2 Engine Emissions
In this part of the results section, the engine exhaust emissions namely:
hydrocarbons (HC), carbon dioxide (CO2), carbon monoxide (CO), nitrogen oxides
(NOx) and smoke (Opacity) will be tabulated as a function of various torque values
keeping speed at a constant rate. Also, the same will be done for various speed values
keeping the torque at a constant rate. This has been done for the three experiments, i.e.
without any liquid (Ref), with water (W) and with sodium hydroxide (NaOH) solution.
4.2.1 Hydrocarbons (HC)
Figure 50. HC vs. torque
0
10
20
30
40
50
60
70
0.5 1 1.5 2 2.5 3 3.5 4
HC
(p
pm
)
Torque (N.m)
HC Emissions Vs. Torque
HC (ppm) Ref HC (ppm) W HC (ppm) NaOH

67
The hydrocarbon emmisions are very common when it comes to diesel engines.
These are the side effects of uncomplete combustion which could happen due to many
factors like not proper mixing of air and fuel inside the cylinder or no enough time for
fuel mixture to burn. Figure (50) shows that for constant speed the HC emissions
increase for both NaOH solution and water experiments with increasing load on the
engine. However, for the reference it did not increase that much. Having said that, both
NaOH solution and water had lower values of HC emissions than the reference. HC
emissions deceased by 75% at lower torque values compared with reference case.
NaOH experiment didn’t have much effect for higher loads, but water experiment gave
much lower emissions than the others. This is because HC atoms have despersed into
the water and settled in leaving only small amount to exit the vehicles exhaust. It is as
if the HC dissolved into water.
Figure 51. HC vs. speed
0
5
10
15
20
25
30
35
1400 1600 1800 2000 2200 2400 2600
HC
(p
pm
)
Speed (RPM)
HC Emissions Vs. Speed
HC (ppm) Ref HC (ppm) W HC (ppm) NaOH

68
For constant load and varying speed tests, the above figure (51) clearly shows
that the overall HC emissions for all three experiments are lower than those in the
constant speed varying load tests. This is because with higher loads the fuel entering
the cylinder increases replacing the air and thus making the mixture richer which results
in uncomplete combustion. Figure (51) also shows that reference and NaOH
experiments have similar HC emissions, however, this is not the case for water. The
HC emissions decreased around 15 PPM on average compared with the reference. This
is because water molecules contain gaps that HC can easily fit in or in other words
dissolve into water unlike the NaOH solution which is 50% saturated in water.
4.2.2 Carbon Dioxide (CO2)
Figure 52. CO2 vs. torque
Carbon dioxide emissions are not that crucial when it comes to diesel engines
as it is not produced in high quantities like gasoline engines. This is because most
0
1
2
3
4
5
6
7
0.5 1 1.5 2 2.5 3 3.5 4
CO
2 (
%)
Torque (N.m)
CO2 Emissions Vs. Torque
CO2 (%) Ref CO2 (%) W CO2 (%) NaOH

69
gasoline engines contain a catalytic converter which converts the CO into CO2. Also,
diesel engines have higher thermal fuel conversion efficiencies. Anyways, it was worth
testing whether or not the CO2 emissions will be affected by adding water or NaOH
into the exhaust system. Figure (52) shows that both the reference and water
experiments have similar values of CO2 emissions with slightly less for water.
However, these emissions came down to almost nothing when tested with NaOH
solution. From literature review, it was proven in many researches that NaOH solution
is very effective for reducing the CO2 emissions [7]. Carbon dioxide reacts with sodium
hydroxide producing sodium carbonate Na2CO3 and water.
Figure 53. CO2 vs. speed
CO2 emissions for constant load variable speed are also similar for both
reference and water experiments, but in overall, they are lower than the emissions
produced in the constant speed variable torque tests. This is because CO2 is mainly
0
0.5
1
1.5
2
2.5
3
3.5
4
1400 1600 1800 2000 2200 2400 2600
CO
2 (
%)
Speed (RPM)
CO2 Emissions Vs. Speed
CO2 (%) Ref CO2 (%) W CO2 (%) NaOH

70
produced due to high temperatures inside the engine which is caused by too rich fuel
mixtures. The CO2 emissions as can be seen in the figure (53) also decreases by 85%
for NaOH when compared to reference case which is quite the same result as the
previous experiment with constant speed.
Figure 54. CO2 absorption efficiency curve
Engine was allowed to run until the NaOH solution can not react with CO2 any
more. In other words, the CO2 emissions were taken every hour until the percentage of
CO2 reaches that of the reference value without adding anything. As can been seen in
figure (54), the capturing efficiency dropped down from 100% to 60% for the first 2
hours. Then it dropped from 60% to 30% for the next 6 hours. Finally, it took another
7 hours for the NaOH to be fully saturated with CO2 and can’t do any more absorption.
0
10
20
30
40
50
60
70
80
90
100
0 2 4 6 8 10 12 14 16
% o
f C
O2
cap
ture
d
Time (Hours)
Percentage of CO2 absorbed as a function of time

71
At this stage, the solution needs to be refilled.
This experiment’s main point is to show how much time can the NaOH solution capture
CO2 before it gets exhausted and reach a 0% efficiency.
4.2.3 Carbon Monoxide (CO)
Figure 55. CO vs. torque
The CO emissions are cause by incomplete oxidation of fuel to CO2. CO
emissions increase with richer fuel mixture. This means that the mixture is too rich to
burn or no enough air is available to burn with fuel properly. All three experiments as
shown in figure (55) have the same pattern of increased CO production with increasing
load on the engine because more fuel is getting into the engine causing lower air intake
causing lower air to fuel rations resulting in incomplete combustion which results in
CO and CO2 production. NaOH solution gave worst results than the reference and
water tests.
300
350
400
450
500
550
600
650
700
750
800
0.5 1 1.5 2 2.5 3 3.5 4
CO
(p
pm
)
Torque (N.m)
CO Emissions Vs. Torque
CO (ppm) Ref CO (ppm) W CO (ppm) NaOH
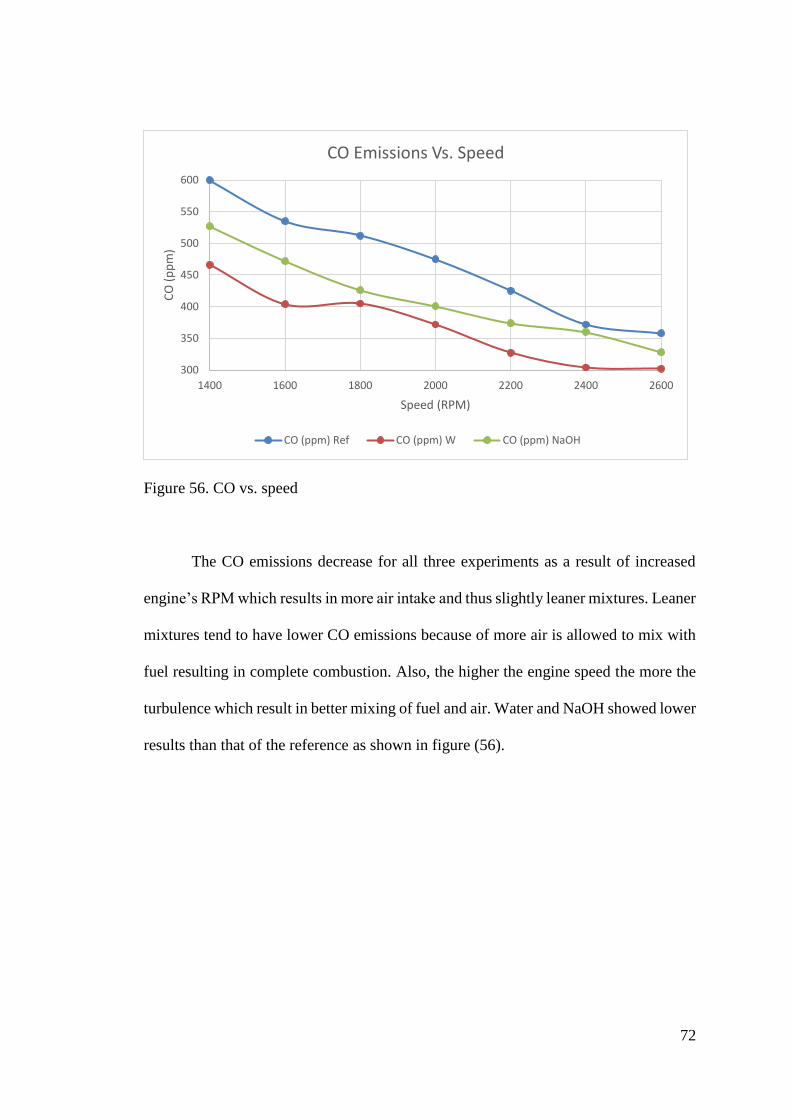
72
Figure 56. CO vs. speed
The CO emissions decrease for all three experiments as a result of increased
engine’s RPM which results in more air intake and thus slightly leaner mixtures. Leaner
mixtures tend to have lower CO emissions because of more air is allowed to mix with
fuel resulting in complete combustion. Also, the higher the engine speed the more the
turbulence which result in better mixing of fuel and air. Water and NaOH showed lower
results than that of the reference as shown in figure (56).
300
350
400
450
500
550
600
1400 1600 1800 2000 2200 2400 2600
CO
(p
pm
)
Speed (RPM)
CO Emissions Vs. Speed
CO (ppm) Ref CO (ppm) W CO (ppm) NaOH

73
4.2.4 Nitrogen oxides (NOx)
Figure 57. NOx vs. torque
Figure (57) shows the relation between NOx emissions and torque for constant
speed. The NOx emissions tend to increase with increasing load on the engine. This is
due to higher cylinder temperature which is caused by richer mixtures inside the
engine’s combustion chamber. Too lean mixture also tends to produce NOx because of
the lower flame speeds which is giving more time for NOx to form. NOx is produced
mainly due to high-temperature thermal fixation of molecular O2 & N2 existing in the
combustion air and also the reaction of atmospheric oxygen with nitrogen-containing
compounds in fuel molecules. Water and NaOH solution tend to reduce the NOx
emissions by 50% on average.
200
400
600
800
1000
1200
1400
0.5 1 1.5 2 2.5 3 3.5 4
NO
x (p
pm
)
Torque (N.m)
NOx Emissions Vs. Torque
NOx (ppm) Ref NOx (ppm) W NOx (ppm) NaOH

74
Figure 58. NOx vs. speed
NOx emissions tend to increase for lower RPMs but decrease for higher RPMS
as can be depicted from figure (58). Both water and NaOH gave better results than the
reference. NOx came down around 25% for NaOH solution and by 37% for water. The
NOx emissions decreased for higher RPMs due to better mixing of fuel and air. NOx is
dissolving more in water than NaOH because of the saturation limit. There are more
spaces in water than in NaOH for NOx to dissolve in thus giving water lower NOx
emissions.
200
250
300
350
400
450
500
1400 1600 1800 2000 2200 2400 2600
NO
x (p
pm
)
Speed (RPM)
NOx Emissions Vs. Speed
NOx (ppm) Ref NOx (ppm) W NOx (ppm) NaOH

75
4.2.5 Smoke (Opacity)
Figure 59. Smoke vs. torque
The smoke is the most pollutant of diesel engine’s emissions. Smoke is
considered as the light hydrocarbons. Larger hydrocarbons thermal crack into smaller
hydrocarbons under the effect of temperature which is raising due to lower air to fuel
ratios or higher equivalence ratios. Smoke is measured by a device that takes part of the
exhaust gases and allow it to pass through a clear lens, the amount of soot accumulated
on the lens will give an indication of how much this soot covered the clean lens. The
unit of measure is called opacity which shows in percentage how dirty the lens is for
each run or test.
Reference experiment produced lots of smoke which increased with increasing
the load on the engine. For water and NaOH experiments, the opacity decreased by 90%
compared to the reference case for higher torque values. This is logically true since
these light weight form of HCs dissolve easily in liquids.
0
2
4
6
8
10
12
14
0.5 1 1.5 2 2.5 3 3.5 4
Op
acit
y (%
)
Torque (N.m)
Opacity Vs. Torque
OP (%) Ref OP (%) W OP (%) NaOH

76
Figure 60. Smoke vs. speed
The opacity for constant load variable speed increased and then decreased when
it comes for the reference experiment. Maximum opacity value of about 5% at 2000
RPM was obtained for the reference experiment. The reason behind this bell-shaped
graph is that lower RPMs tend to have higher air to fuel ratios which means slightly
leaner mixtures and thus less production of unburned HCs due to incomplete
combustion. In other words, the combustion is kind of complete and negligible amount
of unburned HC is released. At 2000 RPM, the amount of air is not enough for burning
all fuel completely resulting in the release of unburned HCs and thus smoke. After 2000
RPM until 2600 RPM, the opacity decreases which means that the air drawn into the
engine is enough to burn the fuel injected into the cylinder at constant load resulting in
complete combustion and thus less unburned hydrocarbons. Water and NaOH again
showed great effect on smoke even for variable speed and constant load experiment.
0
1
2
3
4
5
6
1400 1600 1800 2000 2200 2400 2600
Op
acit
y (%
)
Speed (RPM)
Opacity Vs. Speed
OP (%) Ref OP (%) W OP (%) NaOH

77
From above experiments concerning engine emissions, it was clearly proven how much
the values can change when adding an absorption device with certain absorption liquids
such as water or NaOH solution. Water reduces HC emissions efficiently and NaOH
reduces CO2 efficiently. Both mediums have similar reduction effects for NOx and CO
emissions. Smoke is reduced dramatically as well for both water and NaOH.
4.3 Temperature readings
4.3.1 Reference case
The outlet temperatures of exhaust gases were taken for both constant torque and
constant speed as well. The thermocouple was installed at the very outlet tip of the
exhaust pipe. It was logically noticed that with higher speed and torque the temperature
of exhaust increase. The temperature readings are slightly more for constant speed
variable load since increasing the load on the engine makes it burn more fuel and thus
increasing the overall temperature inside the combustion chamber.

78
Figure 61 Exhaust Temp Vs. Torque
Figure 62 Exhaust Temp Vs. Speed
4.3.2 Water case
The temperatures of exhaust gases were taken for both constant torque and constant
speed as well. The thermocouples were installed at the inlet and outlet of the exhaust
reduction tube to give an insight about the temperature gradient of the absorption
medium. It was noticed that the overall temperature of the absorption medium increase
with both increasing speed and torque but more with increasing torque as explained in
0
20
40
60
80
100
120
140
160
0.5 1 1.5 2 2.5 3 3.5 4
Tem
per
atu
re (
C)
Torque (N.m)
Exhaust Temp Vs. Torque
0
20
40
60
80
100
120
1400 1600 1800 2000 2200 2400 2600
Tem
per
atu
re (
C)
Speed (RPM)
Exhaust Temp Vs. Speed

79
the previous page. Temperature gradient was kept to a maximum value of 4.5 degrees
Celsius. This is due to the cooling coil which was continuously removing heat from the
system at a constant rate.
Figure 63 Temp Diff Vs. Torque (Water Case)
Figure 64 Temp Diff Vs. Speed (Water Case)
2.5
3
3.5
4
4.5
5
0 0.5 1 1.5 2 2.5 3 3.5 4 4.5
Tem
p D
iff
(C)
Torque (N.m)
Temperature Gradient Vs. Torque
0
0.5
1
1.5
2
2.5
3
3.5
4
1400 1600 1800 2000 2200 2400 2600
Tem
p D
iff
(C)
Speed (RPM)
Temperature Gradient Vs. Speed

80
4.3.3 NaOH solution case
The temperatures of exhaust gases were taken for both constant torque and constant
speed as well. The thermocouples were installed at the inlet and outlet of the exhaust
reduction tube to give an insight about the temperature gradient of the absorption
medium. It was noticed that the overall temperature of the absorption medium increase
with both increasing speed and torque but more with increasing torque as explained in
the previous page. Temperature gradient was kept to a maximum value of 5 degrees
Celsius. This is due to the cooling coil which was continuously removing heat from the
system at a constant rate.
Figure 65 Temp Diff Vs. Torque (NaOH Case)
0
1
2
3
4
5
6
0 0.5 1 1.5 2 2.5 3 3.5 4 4.5
Tem
p D
iff
(C)
Torque (N.m)
Temperature Gradient vs. Torque
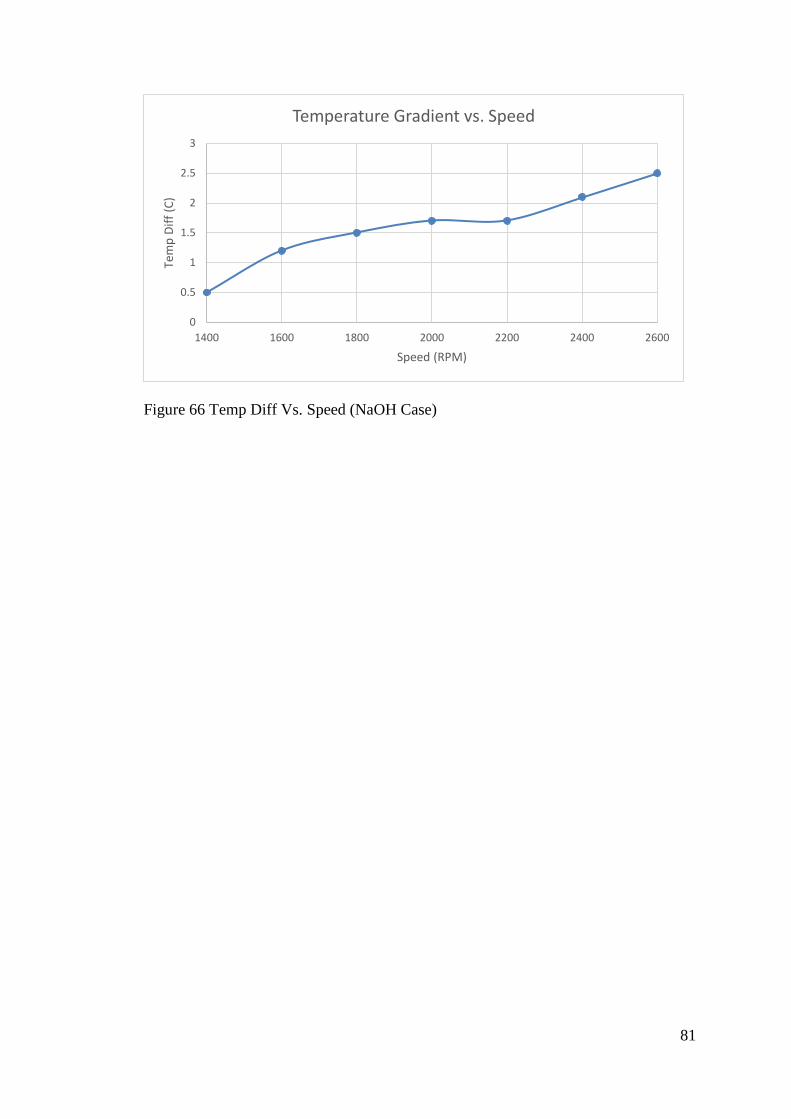
81
Figure 66 Temp Diff Vs. Speed (NaOH Case)
0
0.5
1
1.5
2
2.5
3
1400 1600 1800 2000 2200 2400 2600
Tem
p D
iff
(C)
Speed (RPM)
Temperature Gradient vs. Speed

82
CHAPTER 5: CONCLUSIONS
Diesel engines contribute in the release of many harmful gasses to the
environment due to the nature of diesel fuel that contains oil and lots of other forms of
hydrocarbons. The combustion process itself can never reach an optimum percentage
of completely oxidizing the fuel. This is because an ideal value of air to fuel can never
be reached in real life applications. A complete combustion can’t be practically reached
because of many reasons like ignition delay, compression ratio, inlet air density, valve
timings, fuel injector’s efficiency, intake and exhaust manifold designs, flow
restrictions and lots of other parameters.
In this report, the main concern was to test fluids like water and Sodium
Hydroxide (NaOH) and study their effect on exhaust gasses of a single cylinder diesel
engine of the type DY23-2B. A calibrated gas analyzer and smoke meter were utilized
to compare the results of the emissions one time without anything added to the exhaust,
second time with water added to the capturing device and third time with the alkaline
solution NaOH. Hydrocarbons, Nitrogen oxides, carbon monoxide, carbon dioxide and
smoke were taken for all three experiments two times, one time at a constant torque
value of 1.5 NM varying speed from 1400 RPM to 2600 RPM and a second time at a
constant speed value of 1800 RPM varying torque from 0.9 NM to 5.1 NM. If was
found that for hydrocarbon emissions; at both constant load and constant speed, water
experiment helped in reducing them. The reason lies behind the molecular gaps between
molecules of water that exists more in water than in NaOH solution which is 50%
saturated. For carbon dioxide emissions however, the reduction percentage reached
around 90% when using NaOH solution rather than water at both constant speed and
constant torque cases. Water did not show any reductions in CO2 levels and thus

83
resulting in a phenomenon of HC-CO2 reduction trade off. Levels of carbon monoxide
(CO) stayed almost the same when using water for the constant speed experiment but
increased when using NaOH. This problem can be solved after adding a diesel oxidation
catalyst (DOC) before the capturing device where almost all the CO can be oxidized to
CO2, hence captured by NaOH. NOx emissions did not show much deviation from the
reference for the constant speed experiment, but for constant load, the levels of NOx
decreased by almost 40% for both water and NaOH mediums. So, using any of both
would be fine leaving NOx as a non-decisive factor for choosing the most appropriate
medium. Or in other words, it would stand in the side of whichever gets better results
in all experiment in general. Last but not least is smoke, both experiments using water
or NaOH solution have resulted in reduced amount of smoke. This is because smoke is
a light form of HCs that; because if their light weight, dissolve easily in liquids [18]. In
other words, the liquid absorbs or captures the smoke and not allow it to escape to the
atmosphere. A reduction of 80% was noticed in for the constant load experiment and
85% for constant speed experiment.
Engine parameters like volumetric efficiency, thermal efficiency, air to fuel
ratio and break specific fuel consumption were also taken for all experiments with the
same variations of torque and speed. Volumetric efficiency for constant speed
experiment didn’t change for water but decreased when using NaOH. This might be
because of the higher density NaOH solution causing a little back pressure on the engine
unlike the lower density water. Having said that, the decrease was about 2% which is
negligible for the greater cause of reducing CO2 emissions. For constant load, varying
the speed didn’t seem to have much effect on volumetric efficiency. The break specific
fuel consumption didn’t show much variation for constant speed experiment for both
water and NaOH. However, NaOH solution showed better results for constant load. The
84
BSFC decreased by 100 g/kWhr which again gives more points to the NaOH solution
to be used as capturing material. No scientific reason was found to explain this
phenomenon. Thermal efficiency showed better results when using NaOH with an
increase of about 2% on average basis than the reference for the constant load
experiment. Lastly, the air to fuel ratio was enhanced when using NaOH and water for
the constant load experiment.
The solution of NaOH has been tested as a function of time in order to see how
much can the NaOH solution capture CO2 until it finally becomes fully saturated.
Taking into considerations that the solution was only 50% saturated, the solution lasted
around 15 hours until it was exhausted. No blockage was noticed in the dispenser even
after the solution being fully saturated.
As a final conclusion, using NaOH as capturing solution after the diesel
oxidation catalyst will result in general in a reduction in CO, CO2, NOx and smoke
emissions but with a slight negligible increase in the HC emissions. Also, using NaOH
will result in a decrease in BSFC and an increase in thermal efficiency and air to fuel
ration. However, the volumetric efficiency decreased but with a very negligible value
for a greater cause of CO2 reduction.

85
REFERENCES
[1] Washington D.C.: The National Academies Press, 2011, p. 15.
[2] J. Hansen, "Goddard Institue for Space Studies, GISS Surface Temperature
Analysis," NAZA Goddard Institute for Space Studies, 2006.
[3] Q. N. V. 2030, "Synthesis Report, General Secretariat of Development Planning,"
July 2008. [Online]. Available:
http://www2.gsdp.gov.qa/www1_docs/QNV2030_English_v2.pdf. [Accessed 12
December 2014].
[4] C. Whitson and A. Kuntadi, "Khuff Gas Condensate Development," in International
Petroleum Technology Conference, Doha, 2005.
[5] Walsh, P. (2000). VEHICLE EMISSION TRENDS. Prague: European conference
of ministers of transport.
[6] Joshuahk. Stoaroff, D. A. (2007). Carbon Dioxide Capture from. Environ. Sci.
Technol
[7] Naser, I. and Jama, S. (2012) Carbon Dioxide Capture Device for automobile
systems. Qatar University Senior Project. Department of Mechanical Engineering
[8] Magdy, A., Desouki, M. and Bahumaid, S. (2014) Development of Carbon Dioxide
Capture Device for Mobile Systems. Qatar University
[9] Ramesh Thiruvenkatachari, Shi Su, Xin Xiang Yu, Jun-Seok Bae R.
Thiruvenkatachari et al. (2013). Application of carbon fibre composites to co2 capture
from flue gas.
[10] Pulkrabek, W. W. (2004). Engineering fundamentals of the internal combustion
engine. Pearson Prentice-Hall.

86
[11] "IARC: DIESEL ENGINE EXHAUST CARCINOGENIC" (Press release).
International Agency for Research on Cancer (IARC). June 12, 2012. Retrieved August
14, 20F16.
[12] Avinash, A. and Sasikumar, P. (2015) A comprehensive study on the emission
characteristics of E-diesel dual-fuel engine. KPR institute of engineering and
Technology.
[13] Lee, M., Park, S. (2015). Silica-coated multi-walled carbon nanotubes impregnated
with polyethyleneimine for carbon dioxide capture under the flue gas condition. Journal
of Solid State Chemistry (226). 17-23.
[14] Nwaoha, C., Saiwan, C. et al (2016) Carbon dioxide (CO2) capture: Absorption-
desorption capabilities of 2-amino-2-methyl-1-propanol (AMP), piperazine (PZ) and
monoethanolamine (MEA) tri-solvent blends. Journal of Natural gas science and
technology (33). 742-750
[15] Numan, A., Sakr, A. and Amira, O. (2016). Design and test of a CO2 Capture
Vehicle Exhaust Pipe. Department of Mechanical Engineering. Qatar University.
[16] Dinda, S. (2013) Development of solid adsorbent for carbon dioxide capture from
flue gas. Separation and Purification Technology. Elsevier (109). 64-71
[17] Pilusa, T. & Muzenda, E. (2012). Reduction of Vehicle Exhaust Emissions from
Diesel Engines Using the Whale Concept Filter. Taiwan Association for Aerosol
Research. (12). 994-1006
[18] Eurekalert 1996, "Smoke in the water: Understanding the effects of smoke
compounds on seed germination" FEB 2014. [Online]. Available:
https://www.eurekalert.org/pub_releases/2014-02/ajob-sit022714.php
[19] Jyh-Cherng, ChenGuor-Cheng, FangJun-Tian, TangLi-PingLiu (2005). Removal
of carbon dioxide by a spray dryer. Chemosphere 59 (2005) 99–105

87
APPENDIX A: CALIBRATION CERTIFICATE
Figure 67 . Calibration Certificate for ENERPAC700 Gas Analyzer
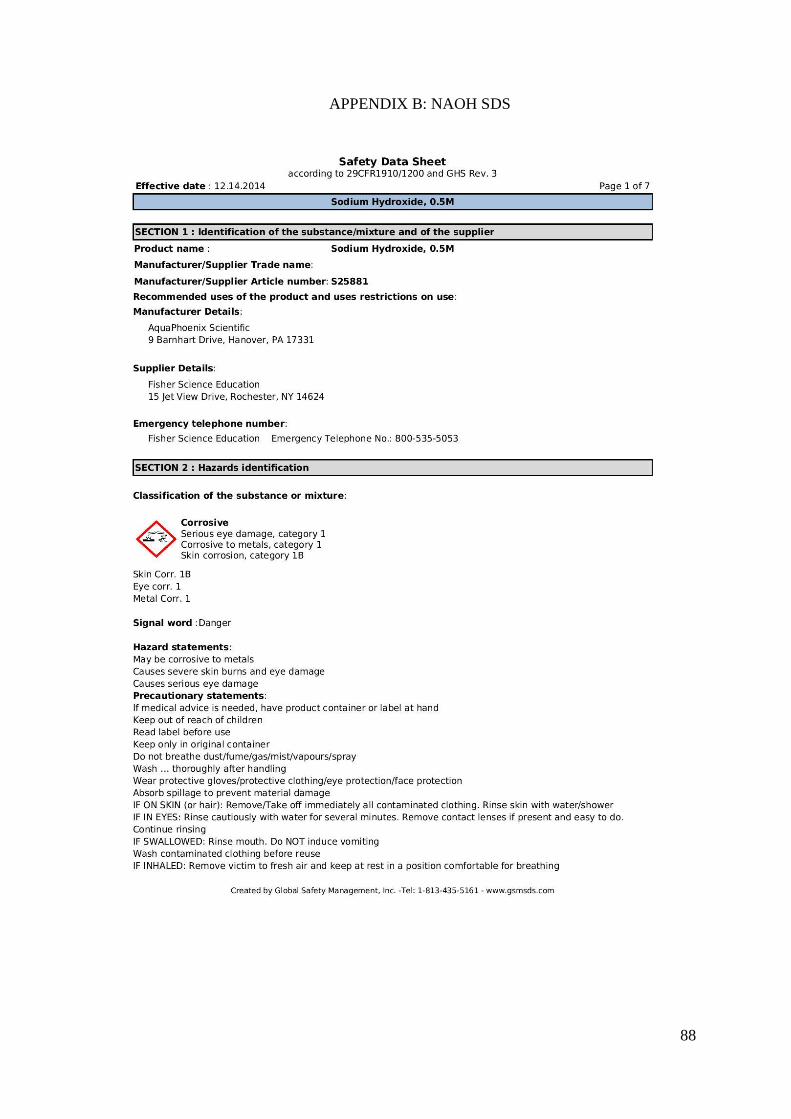
88
APPENDIX B: NAOH SDS

89

90

91

92

93

94
Figure 68 . SDS for NaOH

95
APPENDIX C: EXPERIMENTS EXCEL TABLES
Figure 69. Reference experiment for constant speed
Figure 70. Reference experiment for constant torque
T (ft.lb) T (NM) Torque Time(sec) Qf (cm3/sec) Mf (kg/sec) Qa (m3/hr) Speed of air (m/s) Ma (kg/sec) A/F
0.66 0.9 0.5 16.9 0.059171598 4.91124E-05 8.5 0.659528243 0.0026444 53.844712
1.11 1.5 1 14.59 0.068540096 5.68883E-05 8.4 0.651769088 0.0026133 45.937992
1.55 2.1 1.5 13.35 0.074906367 6.21723E-05 8.3 0.644009932 0.0025822 41.533333
1.99 2.7 2 12.02 0.083194676 6.90516E-05 8.3 0.644009932 0.0025822 37.395556
2.43 3.3 2.5 10.81 0.092506938 7.67808E-05 8.2 0.636250776 0.0025511 33.225917
2.88 3.9 3 10.49 0.095328885 7.9123E-05 8.1 0.62849162 0.00252 31.849157
3.32 4.5 3.5 8.72 0.114678899 9.51835E-05 8 0.620732464 0.0024889 26.148327
3.76 5.1 4 7.93 0.126103405 0.000104666 8 0.620732464 0.0024889 23.779384
HC (ppm) CO2 (%) CO (ppm) NOx (ppm) OP (%) Tout (C) VE (%) Pb (kW) Pb (HP) bMEP (kPA) bSFC (g/kW.hr) bSFC (kg/kW.hr) nth (%)
44 2.6 486 389.5 0.6 74 68.14173 0.169714 0.227587 48.97959184 1041.778182 1.041778182 7.800515186
40 3 385 446 0.8 79.3 67.34007 0.282857 0.379311 81.63265306 724.0329091 0.724032909 11.2238182
43 3.6 387 540.9 3.5 85 66.5384 0.396 0.531036 114.2857143 565.2027273 0.565202727 14.37787266
45 4.1 400 638.8 3.6 95 66.5384 0.509143 0.682761 146.9387755 488.2436364 0.488243636 16.64417619
42 4.5 544 726 5 106 65.73673 0.622286 0.834485 179.5918367 444.1864463 0.444186446 18.29505445
49 5 438 794 8 113 64.93506 0.735429 0.98621 212.244898 387.3153846 0.387315385 20.98138572
47 5.8 605 850 12 118 64.1334 0.848571 1.137934 244.8979592 403.8087879 0.403808788 20.12440604
46 6.5 700 970 12.5 134 64.1334 0.961714 1.289659 277.5510204 391.797861 0.391797861 20.74136987
RPS Speed Time(sec) Qf (cm3/sec) Mf (kg/sec) Qa (m3/hr) Speed of air (m/s) Ma (kg/sec) A/F
23.33333 1400 18.78 0.053248136 4.4196E-05 6.5 0.504345127 0.0020222 45.755823
26.66667 1600 16.5 0.060606061 5.0303E-05 7.2 0.558659218 0.00224 44.53012
30 1800 14.59 0.068540096 5.68883E-05 7.9 0.612973309 0.0024578 43.203588
33.33333 2000 13.03 0.076745971 6.36992E-05 8.3 0.644009932 0.0025822 40.537778
36.66667 2200 11.45 0.087336245 7.24891E-05 9.2 0.713842334 0.0028622 39.484873
40 2400 10.16 0.098425197 8.16929E-05 10 0.77591558 0.0031111 38.082999
43.33333 2600 9.03 0.110741971 9.19158E-05 11 0.853507138 0.0034222 37.232129
HC (ppm) CO2 (%) CO (ppm) NOx (ppm) OP (%) Tout (C) VE (%) Pb (kW) Pb (HP) bMEP (kPA) bSFC (g/kW.hr) bSFC (kg/kW.hr) nth (%)
24 3.1 600 400 0.4 63 66.9965 0.22 0.29502 81.63265306 723.2072727 0.723207273 11.23663956
25 3 535 453 0.9 78 64.93506 0.251429 0.337166 81.63265306 720.2475 0.7202475 11.28279646
29 3.1 512 442 3 82 63.33173 0.282857 0.379311 81.63265306 724.0329091 0.724032909 11.2238182
32 3.2 475 422 5 91 59.88456 0.314286 0.421457 81.63265306 729.6453818 0.729645382 11.13748771
33 3.2 425 382 3.5 97 60.3437 0.345714 0.463603 81.63265306 754.8451736 0.754845174 10.76566828
32 3.4 372 361 2 103 60.12506 0.377143 0.505749 81.63265306 779.7958636 0.779795864 10.42120109
30 3.5 358 333 0.5 110 61.05006 0.408571 0.547894 81.63265306 809.8874685 0.809887469 10.03399603

96
Figure 71. Water experiment for constant speed
Figure 72. Water experiment for constant torque
T (NM) Torque Time(sec) Qf (cm3/sec) Mf (kg/sec) Qa (m3/hr) Speed of air (m/s) Ma (kg/sec) A/F
0.9 0.5 16.17 0.061842919 5.13296E-05 8.4 0.651769088 0.0026133 50.912771
1.5 1 15.17 0.065919578 5.47132E-05 8.4 0.651769088 0.0026133 47.764177
2.1 1.5 13 0.076923077 6.38462E-05 8.3 0.644009932 0.0025822 40.444444
2.7 2 11.05 0.090497738 7.51131E-05 8.2 0.636250776 0.0025511 33.963588
3.3 2.5 10.53 0.094966762 7.88224E-05 8.1 0.62849162 0.00252 31.970602
3.9 3 9.95 0.100502513 8.34171E-05 8 0.620732464 0.0024889 29.83668
4.5 3.5 8.76 0.114155251 9.47489E-05 8 0.620732464 0.0024889 26.268273
5.1 4 7.93 0.126103405 0.000104666 7.9 0.612973309 0.0024578 23.482142
HC (ppm) CO2 (%) CO (ppm) NOx (ppm) OP (%) Tout (C) Tin Tout VE (%) Pb (kW) bSFC (g/kW.hr) bSFC (kg/kW.hr) nth (%)
14 2.4 372 291 0.05 67 31.6 28.8 67.34007 0.169714286 1088.809697 1.088809697 7.46356986
19 2.8 372 375 0.1 73 32.5 29.4 67.34007 0.282857143 696.3498182 0.696349818 11.6700015
22 3.3 419 435 0.3 85 33.2 30 66.5384 0.396 580.42 0.58042 14.0009247
25 3.9 430 515 0.4 96 34.5 30.2 65.73673 0.509142857 531.1027273 0.531102727 15.3010106
31 4.2 455 557 0.6 108.6 35.2 30.6 64.93506 0.622285714 455.9973554 0.455997355 17.821177
36 4.8 520 602 0.75 122.3 35.4 31.1 64.1334 0.735428571 408.3354545 0.408335455 19.9013144
39 5.3 560 650 0.9 128 35.4 31.1 64.1334 0.848571429 401.9650303 0.40196503 20.2167198
45 6.1 691 737 1 137.7 35 31 63.33173 0.961714286 391.797861 0.391797861 20.7413699
RPS Speed Time(sec) Qf (cm3/sec) Mf (kg/sec) Qa (m3/hr) Speed of air (m/s) Ma (kg/sec) A/F
23.33333 1400 20.15 0.049627792 4.11911E-05 7 0.543140906 0.0021778 52.870147
26.66667 1600 17.8 0.056179775 4.66292E-05 7.5 0.581936685 0.0023333 50.040161
30 1800 14.94 0.066934404 5.55556E-05 8 0.620732464 0.0024889 44.8
33.33333 2000 12.82 0.07800312 6.47426E-05 9 0.698324022 0.0028 43.248193
36.66667 2200 11.38 0.087873462 7.2935E-05 10 0.77591558 0.0031111 42.655957
40 2400 10.28 0.097276265 8.07393E-05 11 0.853507138 0.0034222 42.386078
43.33333 2600 8.65 0.115606936 9.59538E-05 11.5 0.892302917 0.0035778 37.286479
HC (ppm) CO2 (%) CO (ppm) NOx (ppm) OP (%) Tout (C) Tin Tout VE (%) Pb (kW) bSFC (g/kW.hr) bSFC (kg/kW.hr) nth (%)
24 2.8 466 257 0.7 37 32 29.9 72.15007 0.22 674.0361818 0.674036182 12.0563518
23 2.7 404 304 0.6 69 31.7 29.3 67.64069 0.251428571 667.6453636 0.667645364 12.1717441
20 2.9 405 304 0.2 82 32.1 29.3 64.1334 0.282857143 707.0712727 0.707071273 11.4930668
16 3.1 372 290 0.2 94 32.1 29.1 64.93506 0.314285714 741.5970545 0.741597055 10.9579887
12 3.1 327 268 0.3 105 31.7 29.6 65.59097 0.345714286 759.4884298 0.75948843 10.699852
10 3.3 304 252 0.25 115 32 29.1 66.13757 0.377142857 770.6933182 0.770693318 10.5442861
9 3.4 302 246 0.1 124 32.8 29 63.82506 0.408571429 845.467049 0.845467049 9.61174592

97
Figure 73. NaOH experiment for constant speed
Figure 74. NaOH experiment for constant torque
T (NM) Torque Time(sec) Qf (cm3/sec) Mf (kg/sec) Qa (m3/hr) Speed of air (m/s) Ma (kg/sec)A/F
0.9 0.5 14.95 0.066889632 5.55184E-05 8.2 0.636250776 0.0025511 45.950736
1.5 1 14.22 0.070323488 5.83685E-05 8.2 0.636250776 0.0025511 43.706988
2.1 1.5 13.68 0.073099415 6.06725E-05 8.2 0.636250776 0.0025511 42.047229
2.7 2 12.63 0.079176564 6.57165E-05 8 0.620732464 0.0024889 37.873092
3.3 2.5 11.42 0.087565674 7.26795E-05 8 0.620732464 0.0024889 34.244712
3.9 3 10.49 0.095328885 7.9123E-05 7.9 0.612973309 0.0024578 31.062758
4.5 3.5 8.9 0.112359551 9.32584E-05 7.8 0.605214153 0.0024267 26.020884
5.1 4 8.1 0.12345679 0.000102469 7.7 0.597454997 0.0023956 23.378313
HC (ppm) CO2 (%) CO (ppm) NOx (ppm) OP (%) Tout (C) Tin Tout VE (%) Pb (kW) bSFC (g/kW.hr) bSFC (kg/kW.hr) nth (%)
7 0.1 439 305 0.2 49 26.8 23.7 65.73673 0.169714 1177.66303 1.17766303 6.90045574
13 0 436 358 0 50 28.2 25 65.73673 0.282857 742.8718182 0.742871818 10.939184
47 0 475 400 0.4 54 29.9 27.2 65.73673 0.396 551.5681818 0.551568182 14.7332808
48 0 485 488.6 0.5 78.3 32.5 29.2 64.1334 0.509143 464.6621212 0.464662121 17.4888474
53 0 555 600 0.7 94 33.9 31.6 64.1334 0.622286 420.4599174 0.420459917 19.3274303
52 0 600 750 0.5 102 35.5 30.5 63.33173 0.735429 387.3153846 0.387315385 20.9813857
57 0 726 1000 0.8 111.4 35.5 32.1 62.53006 0.848571 395.641697 0.395641697 20.5398181
62 0 754 1246 1 119 36 32.5 61.7284 0.961714 383.5737968 0.383573797 21.1860146
RPS Speed Time(sec) Qf (cm3/sec) Mf (kg/sec) Qa (m3/hr) Speed of air (m/s) Ma (kg/sec)A/F
23.33333 1400 21.4 0.046728972 3.8785E-05 6.5 0.504345127 0.0020222 52.139224
26.66667 1600 18.19 0.054975261 4.56295E-05 7.2 0.558659218 0.00224 49.091084
30 1800 16.1 0.062111801 5.15528E-05 8 0.620732464 0.0024889 48.278447
33.33333 2000 14.5 0.068965517 5.72414E-05 8.6 0.667287399 0.0026756 46.741633
36.66667 2200 12.57 0.079554495 6.60302E-05 9.4 0.729360646 0.0029244 44.289478
40 2400 11.07 0.090334237 7.49774E-05 10.7 0.830229671 0.0033289 44.398554
43.33333 2600 9.82 0.101832994 8.45214E-05 11.4 0.884543762 0.0035467 41.961767
HC (ppm) CO2 (%) CO (ppm) NOx (ppm) OP (%) Tout (C) Tin Tout VE (%) Pb (kW) bSFC (g/kW.hr) bSFC (kg/kW.hr) nth (%)
29 0 527 305 0 45.5 30.9 30.4 66.9965 0.22 634.6636364 0.634663636 12.8042645
29 0 472 341 0.1 50 32 30.8 64.93506 0.251429 653.3314773 0.653331477 12.4384283
30 0.1 426 334.7 0.1 66.4 32.9 31.4 64.1334 0.282857 656.1265455 0.656126545 12.3854334
26 0.3 401 319.5 0.3 80.2 33.6 31.9 62.04906 0.314286 655.6742182 0.655674218 12.393981
29 0.5 374 302.8 0.1 89 34.1 32.4 61.65552 0.345714 687.5872066 0.687587207 11.8187293
27 0.8 360 280.1 0.1 95.2 34.6 32.5 64.33381 0.377143 715.6933636 0.715693364 11.3545961
29 1.2 328 271 0 101.3 35.2 32.7 63.27006 0.408571 744.734014 0.744734014 10.9118318