qatar university college of business and economics …
TRANSCRIPT

QATAR UNIVERSITY
COLLEGE OF BUSINESS AND ECONOMICS
WHAT DO PARENTS WANT? STUDY OF FACTORS THAT INFLUENCE
PARENTAL CHOICE OF PRIVATE AND PUBLIC SCHOOL IN QATAR
BY
SHAIMA IBRAHIM
A Project Submitted to
Faculty of the College of Business
and Economics
in Partial Fulfillment
of the Requirements
for the Degree of
Master of Business Administration
January 2018
© 2018 Shaima Ibrahim. All Rights Reserved.
ii
COMMITTEE PAGE
The members of the Committee approve the Project of Shaima
Ibrahim defended on 7th of January 2018.
Professor Adam Mohamed Ali Fadlalla
Thesis/Dissertation Supervisor
Professor Belaid Aouni
Committee Member

iii
ABSTRACT
IBRAHIM, SHAIMA A, Masters : January : [2018], Master of Business Administration
Title: What Do Parents Want? Study of Factors That Influence Parental Choice of Private
and Public School in Qatar
Supervisor of Project: Dr. Adam Mohamed Fadlalla.
This study aims to identify factors that significantly influence parents in Qatar in their
preference for private or public schools for their children. Determining the effects of
different factors regarding the choice of public or private school and identifying negative
and positive aspects of each school type will enhance Qatar education decision-makers
understanding of reasons influencing parental school choice which will help them in their
future policy decisions regarding education.
322 parents participated in a web-based questionnaire survey to identify the differences in
perceptions of public and private schools’ parents related to the academic factors; parent-
school relationship and convenience factors. The data were analyzed and showed that there
are five significant predictors of parental school choice.
Parents who identified the importance of class size factor, parent-school relationship factor
and additional curriculum factor are more likely to choose a private school. However,
parents who identified the importance of consideration of religious factor and school
facilities factor are less likely to send their children to a private school. The results from
this study also demonstrated that there is no significant relationship between parents’

iv
income and education levels and the school choice. This study contributes to the store of
academic knowledge on the subject in Qatar.
Keywords: School Choice, Factors, Private Schools, Public Schools, Parents, Qatar.

v
DEDICATION
I dedicate this work to my mother and father, to my husband Abdulrahman and to my
lovely daughters
Layla and Dana
I also dedicate this work and give special thanks to my best friends Kummum, Manal and
Salha.
vi
ACKNOWLEDGMENTS
Alhamdulillah to Allah the Almighty for putting me such great strength, patience, the
courage to complete this project. First and foremost, I would like to acknowledge my
husband, Abdulrahman. Your patient, wisdom, kindness, continues support and love have
helped me get through. I am greatly indebted to my parents for their constant prayers,
unconditional love, and continuous support which have brought this research work to a
successful end. I would like to acknowledge my supervisor Dr Adam Mohamed Fadlalla
who offered endless support, guidance, and encouragement through my research. I would
like to acknowledge my sisters and my brothers for their constant prayers and continuous
support. I would like to acknowledge my friends for their endless support. Finally, my
profound appreciation goes to all persons who in diverse ways have contributed to the
success of this research.

vii
CONTENTS
DEDICATION .................................................................................................................... v
ACKNOWLEDGMENTS ................................................................................................. vi
LIST OF TABLES ............................................................................................................. ix
LIST OF FIGURES ........................................................................................................... xi
CHAPTER 1 – INTRODUCTION ..................................................................................... 1
1.1 Introduction to the Research Context ........................................................................... 1
1.2 Significance of the Study .............................................................................................. 4
1.3 Research Objectives ...................................................................................................... 7
1.4 Research Questions ....................................................................................................... 7
1.5 Scope of the Research ................................................................................................... 8
CHAPTER 2: LITERATURE REVIEW ............................................................................ 9
2.1 Distinctions between Public and Private Schools ......................................................... 9
Qatar Context .................................................................................................................... 10
2.2 The Importance of School Choice .............................................................................. 11
The Qatari Context ............................................................................................................ 12
2.3 Review of Empirical Studies ...................................................................................... 13
2.3.1 Priorities and Major Issues in School Choice .......................................................... 13
2.3.1.1 Academic Factors.................................................................................................. 14
2.3.1.2 The Parent-School Relationship ........................................................................... 17
2.3.1.3 Factors of Convenience......................................................................................... 19
CHAPTER 3 – RESEARCH METHODOLOGY ............................................................ 24

viii
3.1 Theoretical Framework ............................................................................................... 24
3.2 Research Hypotheses .................................................................................................. 27
3.3 Research Design and Instrument ................................................................................ 28
3.4 Sampling and Data Collection .................................................................................... 30
3.5 Statistical Analysis ...................................................................................................... 30
CHAPTER 4 – RESEARCH FINDINGS ......................................................................... 33
4.1 Validity and Reliability of the Questionnaire ............................................................. 33
4.2 Demographic and Background Findings .................................................................... 35
4.3 Descriptive Statistics ................................................................................................... 41
4.4 Inferential Statistics .................................................................................................... 48
4.4.1 Independent Samples t-test ...................................................................................... 48
4.4.2 Logistic Regression .................................................................................................. 51
4.4.3 ANOVA Results ...................................................................................................... 57
CHAPTER 5 – CONCLUSION ....................................................................................... 64
5.1 Discussion of the Results ............................................................................................ 64
5.2 Recommendations for the Ministry ............................................................................ 65
5.3 Limitations of the Study.............................................................................................. 67
5.4 Recommendations for Future Studies ......................................................................... 68
5.5 Summative Conclusion ............................................................................................... 69
REFERENCES ................................................................................................................. 71
APPENDIX ....................................................................................................................... 79

ix
LIST OF TABLES
Table 1: Reliability and validity evaluation ...................................................................... 34
Table 2: Demographic profile of the respondents (N = 322) ............................................ 36
Table 3: Descriptive statistics of the items measuring the quality of the instruction factor
........................................................................................................................................... 42
Table 4: Descriptive statistics of the items measuring the class size factor ..................... 43
Table 5: Descriptive statistics of the items measuring the additional curriculum factor .. 44
Table 6: Descriptive statistics of the items measuring the consideration of religious factor
........................................................................................................................................... 44
Table 7: Descriptive statistics of the items measuring the parent-school relationship factor
........................................................................................................................................... 45
Table 8: Descriptive statistics of the items measuring the school facilities factor ........... 46
Table 9: Descriptive statistics of the items measuring the environment of learning factor
........................................................................................................................................... 47
Table 10: Group statistics - independent t-test regarding the difference between private
and public school choice to all factors .............................................................................. 49
Table 11: Classification from the null model ................................................................... 51
Table 12: Omnibus Tests of Model Coefficients for block 1 ........................................... 52
Table 13: Model Summary for block 1 ............................................................................. 52
Table 14: Classification for block 1 .................................................................................. 52
Table 15: Omnibus Tests of Model Coefficients for block 2 ........................................... 53
Table 16: Model Summary for block 2 ............................................................................. 53

x
Table 17: Classification for block 2 .................................................................................. 53
Table 18: Logistic regression model results ..................................................................... 55
Table 19: ANOVA results for parental age and academic and convenience factors ........ 58
Table 20: ANOVA results for monthly income and academic and convenience factors . 59
Table 21: ANOVA results for paternal (fathers) education level and academic and
convenience factors ........................................................................................................... 61
Table 22: ANOVA results for paternal (mothers) education level and academic and
convenience factors ........................................................................................................... 62

xi
LIST OF FIGURES
Figure 1: Research Conceptual Framework ...................................................................... 26
Figure 2: Nationality and the Choice of School................................................................ 38
Figure 3: Monthly Income and the Choice of School ....................................................... 38
Figure 4: Father Education Level and the Choice of School ............................................ 39
Figure 5: Mother Education Level and the Choice of School .......................................... 39
Figure 6: Father Job Sector and the Choice of School ...................................................... 40
Figure 7: Mother Job Sector and the Choice of School ................................................... 40

1
CHAPTER 1 – INTRODUCTION
1.1 Introduction to the Research Context
Qatar National Vision 2030 is based on four key pillars; Economic, Human,
Environmental and Social Development (Qatar Chamber, 2017). It is not possible for
Qatar to grow its economy and society if its resources and human capital are not
developed. According to QNV 2030, human development involves a modern and holistic
health care infrastructure that is available to all the citizens. It also includes a good
educational system which meets the best international standards; equipping students from
Qatar with the knowledge to face world challenges confidently and become future
entrepreneurs, innovators, and professionals. A good education system and equal chances
will drive Qataris to improve in all areas of their country’s economy (Hukoomi, 2017).
The educational system should be able to equip students with the knowledge to
accomplish their goals and to satisfy the requirements of Qatar’s society which include:
Training programs and educational curricula that is able to satisfy the current
and future requirements of the skills market
Excellent educational and training openings which are in line with each
individual's goals and skills
Educational programs which are accessible for life-long learning.
The education system of Qatar is directed and controlled jointly by the Ministry
of Education and Higher Education at all levels. The Emiri Resolution No.9 2016 of the
organizational structure of the Ministry of Education and Higher Learning has enabled

2
the Ministry of Education to undertake all education-related responsibilities and tasks.
Departments such as learning resources, student and teachers affairs, curriculum, early
education, and educational supervision are considered as fundamental by the Ministry of
Education. The Ministry of Education and Higher Education in Qatar focuses on internal
audit, publishes relevant circulars, and news follows up matters related to quality and
planning and legal affairs through the Department of Public Relations and
Communication in the local media. Besides, the Ministry of Education and Higher
Education takes up the development of educational policies, plans, training and
development, research and strategies of the ministry employees in providing an integrated
educational system of educational services. The aim of the integrated education is
attaining Qatar Vision 2030, which is entirely based on the development of advanced
society in ensuring prosperity for citizens by 2030 (Ministry of Education and Higher
Education - About MOE, 2017).
Qatar’s education system consists of 6-year elementary cycle which is followed
by a 3-year preparatory cycle, and a three year secondary cycle. After completing the
secondary cycle, students join labour markets or higher learning institutions such as
universities. In Qatar, the elementary and primary education is compulsory among
people. All the initial schools in Qatar were religious. Quranic schools were prevalent in
Qatar, where the young boys were guided in learning to recite the Quran alongside
gaining crucial Arabic literacy skills. In 1952 the initial secular elementary school for the
boys was established, which led to the development of education system in Qatar. The
first government ministry of education was established in 1956. Other than that, Girl’s

3
schools in Qatar were developed in middle 1950 a time at which the secondary education
was initiated. By 1980, the system in Qatar was fully established, such that there was the
introduction of technical, general academic, commercial courses, and religious training
(Education System of Qatar, Education Profile of Qatar, 2017).
According to statistics from the Ministry of Development Planning and Statistics,
Qatar’s population has increased by around 23.45% in the period between 2013 and
2016; this population is predicted to grow even further (Ministry of Development
Planning and Statistics, Population And Social Statistics, 2017).
To prepare the human capital which is needed for implementing the Qatar
National Vision 2030, and to satisfy the constantly increasing population in the country,
the Minister for Education and Higher Education, Dr Mohammed bin Abdul Wahed Al
Hammadi, has set a plan to open 99 government schools by the year 2030. He also plans
to encourage investors to create more private schools. Overcrowding in the public
schools made the government to support the establishment of more private schools in
Qatar as well as providing modern teaching methods which are in line with the
worldwide subject in the educational sector (The Peninsula Qatar, 2017). The Ministry of
Education has further permitted private schools considerable margins of freedom in
various education sectors like the teachers’ selection, encouraging small class sizes, and
providing extra-curricular activities (The Policy of Academic Monitoring of Private
Schools September 2016, 2017).

4
In recent years, the private schools demand in Qatar has greatly raised. A report
published by the Ministry of Education and Higher Education indicated that the number
of schools in Qatar has now grown to a total of 535 schools, both government and
private. The schools have enrolled over 234577 students in the four levels of
kindergarten, education- preparatory, primary and secondary. Currently, there are 245
private schools which have a total of 122227 students; this accounts for about 52%
(Education statistical Bulletin May 2016 – 2017,2017).
The popularity of private schools is increasing among the people of Qatar; parents
are constantly paying money to have their children attend international schools. The
public schools took advantage of a large number of enrolling students after they were
placed under the Ministry of Education and Higher Education and raised the quality
standards. The main aim in the education sector is to allow all the students in Qatar to get
a quality education, with school fees not being a determining factor. The competition will
increase not only between private schools but also between private and public schools;
this competition will help in promoting variety and improving education quality (Qatar
National Development Strategy 2011~2016, 2017).
1.2 Significance of the Study
According to a study conducted by Ikhlef & Knight (2013), Qatar is known for
providing students with quality education in both public and private schools. The
environments for student-centered learning and teaching in Qatari basic math and science
classrooms have greatly improved. The relationship between classroom processes and

5
achievement of curriculum standards has also improved. The public schools in Qatar
spend significant time trying to ensure quality education. However, they are limited in
their ability to offer high-quality education because they have a relatively low teacher to
student ratios. This means that one teacher must oversee very many students, thereby
reducing the quality of education. By contrast, private schools have a relatively high
teacher to student ratios. This means that teachers have to oversee far fewer students,
which increases the quality of education in private schools. The same study also shows
that teachers in private schools receive improved training and the students and teachers
are more motivated. Another study by Nasser (2017), Qatar’s public education is faced
with complications such as overpopulation, lowly qualified teachers, and poor learning
infrastructure. The same study suggests that not all private schools in Qatar are in a
position to offer quality education; some parents who have their children in private
schools are not usually contented with the performance despite paying large amounts of
money.
When the performance disappoints the parents, who are the main consumers, and
it does not meet their expectations, it leads to the parents’ dissatisfaction on the quality of
education that is being offered in Qatar despite huge amounts of money the government
spent to ensure that high-quality education is provided to all children. This failure also
affects other education consumers and stakeholders in the sector such as the government
itself, traders who rely on schools for their business.

6
Due to the inconsistency of the performance of private and public schools in
Qatar, there is need to conduct thorough research in establishing the potentials and
challenges, as well as determining important features of successful schools in Qatar.
Although there have been several global studies on school choice, few have focused on
Qatar resulting. Past studies that that were conducted outside Qatar have found that
parents prefer private schools because of the school’s small class size, quality buildings,
up-to-date information technology, and overall high performance. By contrast, other
parents prefer public schools because they are more affordable, especially for parents
from lower social classes (Claire, 2015).
There is few similar research that has been conducted focusing on investigating
the significant factors that influence parents in their choice for public or private schools
in Qatar. This study seeks to fill the existing knowledge gap by investigating the factors
related to school choice from the perceptions of parents in Qatar. The finding of this
research, therefore, will make a significant contribution by providing a useful addition to
the literature on private and public school choice in Qatar. Moreover, the findings will
enhance the decision-makers understanding of reasons and perceptions influencing
school choice which will help the Ministry of Education and Higher Education in its
future policy decisions regarding education.

7
1.3 Research Objectives
The objectives of this study are:
1. Investigate factors that significantly influence parents in Qatar in their
preference for private or public schools for their children.
2. Determining effects of independent variables on the parents in choosing either
public or private school.
3. Availing recommendations on Qatar education policymakers to develop
quality education systems.
1.4 Research Questions
1. Which factors influenced parents to consider enrolling their children in private or
public schools?
Academic factors
o Instructional quality
o Additional curriculum
o Class size
o Consideration of religious
Parent-school relationship
Convenience factors
o School facilities
o Environment of learning
o Social status determination

8
2. Do the outlined factors affect the parents’ choice of public or private school varies
depending on:
Monthly income
Parent education level
Parent age
1.5 Scope of the Research
This study consists of five chapters. Chapter One details the significance of the
study, objectives and research questions. Chapter Two reviews the literature related to
this study subject. Chapter Three includes the conceptual framework, hypotheses and
describes the study’s methodology. Following this, Chapter Four presents the data
analysis and findings. Chapter Five reports and discusses the findings, make
recommendations, presents limitations of the study as well as suggests recommendations
for further research.

9
CHAPTER 2: LITERATURE REVIEW
The purpose of the literature review is to provide background information, discuss
empirical studies, and examine theories related to the topic of the study, which is parental
school choice. To achieve its objectives, the literature review has been divided into three
major sections. First, the distinctions between public and private schools will be discussed
in greater detail. Second, the importance of school choice will be described in terms of
parental engagement and developmental goals. Third, empirical studies related to specific
predictors of parental choice will be analyzed and synthesized.
2.1 Distinctions between Public and Private Schools
There are numerous distinctions between public and private schools that have
been recognized in the literature. One distinction is that of cost. Public education is
typically provided without direct costs, although there are indirect costs of acquiring
academic materials. Private education is typically based on tuition although tuitions can
be waived for students of high need or academic promise (Chen & Sönmez, 2006).
Another distinction between public and private schools is that of instructional quality.
Private schools, being subsidized through tuition rather than tax rolls, typically have
larger budgets that can be applied to hiring better teachers, reducing the ration of students
per teacher, and purchasing added instructional materials such as books and computers
(Cowen, Fleming, Witte, Wolf, & Kisida, 2013). Also, private schools are often exempt
from high-stakes testing and therefore, in theory, possess more freedom to devise more
exacting academic standards for their students (Luis Bernal, 2005).

10
Finally, private schools are distinct from public schools in turns of socioeconomic
factors (Bell, 2009). Private-school students represent an elective community formed
from a stratum of society with higher levels of money, engagement, and academic
ambition, whereas the public school system represents a cross-section of all the citizens
in a given community. The self-selected nature of private schools often results in the
formation of a private-school community that has markedly higher resources, ambitions,
and capabilities than a comparable public-school community (Bosetti & Pyryt, 2007).
Qatar Context
The differences between private and public schools in Qatar are based on funding
and curriculum. Public schools are state-funded. The amount of funding allocated to each
Public school depends on the number of teachers and students (Hukoomi,2017).
Differently, the Private schools operate either as commercial establishments or non-profit
community schools sponsored by their embassies (Hukoomi,2017). Public schools
curriculum is guided by standards set by the Ministry of Education and Higher Education
of Qatar. On the contrary, the private schools have unique curricula which consist of
International Baccalaureate (IB), American, Indian, and British systems (The Policy of
Academic Monitoring of Private Schools, 2016). The private schools are required to
comply with all the admission decisions and policies made by Ministry of Education and
Higher Education. For example, according to Ministry of Education and Higher
Education Qatar, studying of Islamic education, Arabic language and Qatari History is
compulsory for all students in private schools. This aims at enhancing national identity
and values for students in private schools according to the aspirations of the Ministry of

11
Education and Higher Education to instill citizenship values and principles (Policy of
Academic Monitoring of Private Schools, 2016). Due to the different systems adopted by
the private schools, the private education consists of a wide selection of schools from
kindergarten to Grade 12 all consisting of different curricula and languages.
2.2 The Importance of School Choice
School choice is important because of the correlation between schools and
subsequent developmental pathways. In the past three decades, completion of college has
become more positively correlated with higher salaries and better job opportunities. In a
competitive educational marketplace, better colleges have better job placement rates, and
better schools tend to place a disproportionately high percentage of their students in
better colleges (Cohen-Zada & Justman, 2003). Therefore, school choice, even at the
primary or secondary levels, has important ramifications for a student’s future career and
life prospects. In this respect, school choice can be understood from a competitive
perspective in which the overarching purpose is to place students into the best possible
schools (Zellman, Ryan, & Karam, 2011).
However, school choice should also be understood as a delimited phenomenon.
Many parents do not possess the ability to choose schools. For economically
disadvantaged and geographically immobile parents, the only viable choice is likely to be
the local public school. School choice is more of a factor for parents who have the
tangible and intangible resources necessary to be able to choose from among numerous
school alternatives for their children (Chen & Sönmez, 2006).
12
The Qatari Context
Thus, Qatar’s public school system has changed radically in the past 15 years.
Before 2002, the government centrally controlled all public schools. Currently, the
independent school system has replaced the concept of government schools, and, in
consequence, the only two kinds of schools in Qatar are independent schools and private
schools. The private schools of Qatar have long tended to be schools for the children of
expatriates living in the country. However, Qatari children also attend private schools,
many of which offer curricula that are based in British, American, or International
Baccalaureate guidelines (Ikhlef & Knight, 2014). In Qatar, the guidelines for chartering
a private school are provided and maintained by the Ministry of Education and Higher
Education. Qatar’s educational policy vis-à-vis private schools appears to have two main
ends in mind, one of which is relatively recent. Given the prevalence of expatriates in
Qatar, the government has long envisioned private schools as being a factor in attracting
an expatriate workforce, particularly in the managerial class, to Qatar. However, from
2002 onwards, Qatar appears to be reframing its overall educational policy with a focus
on international competitiveness. From this perspective, the simplification of the private
school licensing process indicates the Qatari government belief in the ability of private
schools to improve the education of Qataris as well as expatriates. Given the various
advantages of private schools documented in the review of empirical studies, the Qatari
government’s increased attention to private schools seems to be justified.

13
2.3 Review of Empirical Studies
The purpose of this section is to describe, analyze, and synthesize empirical
results that are relevant to the topic of the study. The discussion of empirical studies has
been further subdivided into (a) academic factors, (b) the parent-school relationship, and
(c) factors of convenience. Each section contains a discussion of studies pertinent to one
aspect of parental school choice. Because of the existence of broad consensus in the
literature about the characteristics and advantages of private schools, each pertinent point
has been illustrated through the findings of several scholars.
2.3.1 Priorities and Major Issues in School Choice
One of the themes in the literature of school choice is the attempt of identifying
the factors influencing parents valuing school choice by focusing on the considering the
most significant criteria for choosing schools. Most of the studies are located in the
United Kingdom and the USA.
Coldron and Boulton (1991), outlined 30 reasons influencing parental choice and
summarizing them into four main categories. These categories are academic,
organization, safe school and source. While Taylor (1996) outlined four major factors
that attract parents in choosing certain schools which are convenience factors, religious
and moral factors, academic factors such as quality of curriculum and high achievement
and the closeness of school. According to Charles (2011), however, five main categories
attract parents when choosing schools for their children. The categories are the quality of
the instruction, supporting students learning, learning environment, school and parent
relationship and resource management.

14
The study aims to identify the factors within the three main categories that
significantly influenced Qatar parents’ when making decisions on choosing schools for
their children. The academic factors that are divided into four variables: the instructional
quality, the consideration of religious, the class size and the additional curriculum. The
second factor is the relationship between school and parents. The third factor is the
convenience factors which are divided into three variables: the school facilities, the
environment of learning and social status determinants.
2.3.1.1 Academic Factors
Numerous possible academic factors have been identified in the literature as
informing parental decisions to choose private schools. Some of these factors are as
follows: (a) Instructional quality, (b) the quality of relationships between teachers and
students, (c) class size, (d) the presence of a rich curriculum and other supporting
activities, and (e) treatment of religious preferences. Religion has historically played an
important role in private schools. In many countries, public-school education no longer
contains a religious component. Even in countries whose educational systems still include
religious elements, the kind of religious instruction offered might not be considered
appropriate by a parent (Opdenakker & Van Damme, 2006).
However, much of the recent literature on public schools focus on elements of
instructional quality and other academic factors more so than on religious elements.
Private schools have an economic advantage in that they are supported directly by tuition
and bequests that, in many cases, allow private schools to amass much larger budgets, on
a per capita basis, than comparable public schools (Chen & Sönmez, 2006). These

15
budgets are then utilized to hire better and more experienced teachers, buy more books
and computers, and otherwise increase the resource base necessary to deliver an
enhanced educational experience. One of the instructional quality advantages of private
schools is the nature of the teacher-student relationship (Hastings & Weinstein, 2008).
Often, teachers at private schools are more impassioned and experienced than their
counterparts at public schools. Because private schools can often afford to pay more to
teachers, they can attract teachers of a higher calibre, who, in turn, are more likely to
form enriching relationships with their students (Jensen, 2010).
Anderman & Kaplan (2008), explained that the relationship between the students
and teachers is of great importance in determining the school performance of the
students. The authors realized the importance of teacher-student relationship when they
measured the factors affecting performance. They illustrated that when the relationship
between educators and students is healthy, the academic performance of the students is
high. On the other side when the connection between the teachers and students is weak
then the school performance of the students is also poor. Klem & Connell (2004),
suggested that a good relationship between the teachers and students motivate students to
work harder. Their study was based on the premise that the students tend to accept the
education process when they relate well with their teachers. Teachers establish a good
relationship with their students through promoting closeness and encouraging them even
when they are not doing so well. Through encouragement and closeness between students
and teachers, the students feel they must work hard to please their teachers.

16
Various authors explain that the relationship between teachers and students is significant
regarding parents choosing a school for their children. A study conducted by Hughes &
Kwok (2007) discovered that parents prefer schools where students and teachers have
good relationships. The authors explained that parents majorly preferred private schools
because they cultivate positive relationships between the students and teachers improving
performance and students behavior.
In addition to being able to hire better teachers, private schools can reduce their
class sizes thus improve students and teachers relationship ( Sandström & Bergström,
2005). In public schools, class sizes are determined by two main forces: (a) budgets and
(b) the need to provide an education to a larger base of students. Because public school
education is construed as a basic right, no child can be turned away. Therefore, if a
particular public school has a large population that it serves, it is also likely to have larger
class sizes. Class sizes can also become a problem in terms of budgetary restraints that
prevent public schools from hiring additional teachers. Because the budgets of public
schools are determined by factors such as the existing tax base, public schools have little
flexibility to hire additional teachers as a means of lowering the ratio of students per
teacher ( Meador, 2016).
The presence of a rich curriculum and supporting activities is also an important
distinguishing feature of many private schools. In public schools, curricula are typically
set in deference to national education standards, which, in turn, are designed to ensure
that all students benefit. In this context, private schools can be more selective and
exacting in their design of a curriculum. There are also other potential advantages

17
enjoyed by private schools in the domain of curriculum design ( K. V. Greene & Kang,
2004). Private schools can, depending on the set of national laws to which are subject,
evade certain curricular requirements or constraints.
Supporting activities constitute another possible input into parental school choice.
In public schools, limited budgets often mean that certain activities—such as sports and
entertainment activities for students—can not be adequately funded. The larger budgets
of private schools make it possible for these schools to offer an expanded set of support
offerings. Such offerings have often been observed to attract parents to private schools
(Chen & Sönmez, 2006, p. 207 ).
2.3.1.2 The Parent-School Relationship
There are numerous aspects of the parent-school relationship that have been
identified. The parent-school relationship can be considered from numerous perspectives,
one of which is engagement. The level of engagement between a parent and a school—
which is manifested in behaviors such as regularly attending school meetings,
volunteering, donating, and other such activities—is a measure of parent-school
relationship that is typically determined by factors such as the income, educational level,
and parenting style of the parent (Fan & Williams, 2010; Hampden-Thompson et al.,
2013).
Many studies report that enhanced relations amongst parents and the school
improve students’ behavior significantly. Topor, Keane & Shelton (2010) explain that
one approach to help schools intending to unacceptable conduct among students is
through involving parents. The authors suggest that while troublesome behavior could

18
spread among students, making them ineffective, parental inclusion in the school
program could solve the issue. Virtanen and Rantti (2015) agree with Topor, Keane and
Shelton (2010) and add that to create a healthy relationship between the parents and the
school; parents are involved in decisions involving discipline. Through parental
involvement in control policies in the school, teachers feel comfortable disciplining
students to improve their behavior.
Several literatures indicates that parents are interested in taking their children to
schools where they have a stable relationship with the school and where they are involved
in making important decisions about the school. A study by Rehman, Khan and Triq
(2010) in Pakistan found that most parents preferred private schools because they had the
opportunity to be part of the school's committee. Most parents appreciated being part of
the school's committee because they enjoyed the chance to control and be part of
important decisions that could affect their children (Topor, Keane & Shelton, 2010). It is
thus clear that parental involvement is a major factor that parents look into when making
school choice for their children.
In the context of Qatar, the parent-school relationship can also be considered
considering nationality. Qatar’s Ministry of Education and Higher Education officially
recognizes private schools that have connections with over 20 foreign nations. For
expatriates in Qatar, sending their children to a private school associated with their home
nation might reflect the belief that a stronger parent-school relationship can be formed by

19
national factors. Another possible factor in the parent-school relationship in Qatar could
be the parental perception of how their children would be treated at a private school.
2.3.1.3 Factors of Convenience
There are numerous factors of convenience that can inform the decision to choose
a school. Some of these factors are as follows: (a) school facilities, (b) social status
determinants, and (c) learning environment and haven safety. One of the main such
factors is that, for many parents, the decision to send a child to private school is highly
inconvenient—if not impossible—in terms of cost, distance, and other factors (Cucchiara,
2013). For such parents, public school is a convenient alternative to private school.
However, for many parents who choose to send their children to private schools, the
perception of convenience is based on the ability to obtain access to a form of education,
and overall educational experience, that could not be obtained at a public school. Thus,
the psychological construct of convenience has been observed to function in different
ways depending on the economic means and social emplacement of parents making
school decisions on behalf of their children (Cullen et al., 2005).
The instruction quality depends significantly on the environment of the instructive
foundation itself. For the most part, school comprises of the arrangement of school
structures on a good site which incorporates the offices and the general surrounding given
to the students to focus and learn (Smith, 2000). It represents a place that operates the
complex organization in affecting the viewpoint of the people in terms of, school
administration, school association and class distribution and also instructor viability. All
in all, school altogether isn't a place that spotlights just on scholastic results, yet also

20
features the parts of individual or social advancement among individuals. Consequently,
the school must incorporate the components of accommodation, security, and desirability.
The instruction quality depends significantly on the environment of the instructive
foundation itself (Rehman, Khan &Triq, 2010). It can be confirmed that certain reasons
influence guardians in choosing the schools for their kids, for example, the level of
guardians' training, the parents’ profession, the classes estimate and the student-teacher
ratio. School buildings may likewise influence the performance of students. Private
schools promote students performance by building new structures or redesigning offices
and classes.
The age and the design of school buildings have been described to contribute
substantially to the student’s performance. According to a study conducted in Qatar by
Nessar (2017), modern classrooms with modern facilities resulted in high performance in
students and old and less equipped school buildings were associated with low
performance by the students. Various studies indicated that air conditioning and lighting
have a substantial effect on students’ performance. Claire (2015) postulated that schools
ought to set up conducive environment through creating spotlight lights, welcoming wall
colors and proper ventilation to promote students achievements. She suggested that
students’ performance was determined primarily by the environment that they study.
Regarding the use of information technology, various studies have different findings on
the influence of modern technology on students’ attainment. Rabayan (2015) conducted a
study to evaluate the impact of the utilization of laptops on the performance of students in

21
science. He found there are measurable contrasts between students who contemplated
science utilizing modern technology programs with those who studied conventionally.
Regarding school safety, many investigations have stressed the significance of the
status of the school as a haven as far as instructing and learning, given the dispute that
any occurrence of violence and injury sat school impacts on the students, as well as
disturbs the instructive procedure at school. Duszka (2015) bolstered the claim that
students exposed to violence are more probable to have a higher number of absenteeism
cases, poorer school performance, and lower IQ and perusing capacities, while, a safe
instructive environment, along with a secure feeling of care and well-being, often brings
about higher academic achievement. The author further explains that due to the safe
environment provided in schools, the students have an opportunity to concentrate on their
studies thus promoting student achievement.
Various studies have proved that parents consider the safety of their children
excellently when making school choice. A study by Great Schools (2013) looked into the
thought processes of parents when making school choice for their youngster and
discovered the top criteria mentioned by parents for evaluating schools are good teachers,
curriculum and academics, and school safety. Duszka (2015) explains that school should
not be a place that frightens students but instead a place that students feel happy to meet
other students.
The Social background indicators among individuals include income, race
occupation, the social economic status of the parents and the family possessions

22
(Catsambis, 1998). Additionally, social background indicators also include the
importance of parents’ occupational status. Parents with a high occupational status prefer
private school over public school for their children (Rehman et al. 2010). On the other
side, parents with a low status prefer public schools to private school. Furthermore,
various factors are considered by parents before choosing a school for their children
which includes, the performance of the school, qualifications of the staff working at the
school, the size of the family and education level of the parents. According to Fairlie
(2006), racial and ethnic disparities are also major social determinants of the school
choice made by parents. The author realized that ethnic disparities are determinants of
school choice from his study where he measured the reasons for the variances in school
choice. Private schools are accessible to a more extensive group of parents because the
expanding accessibility of private school vouchers that are focused to low-income family
units in low wage, high minority, and school locale (Goldring and Rowley, 2006). The
study shows social class creaming is present because parents with more extensive
interpersonal networks and more access to data will probably take part in the process of
school choice.
Income level is another factor which influences parents choice on the school to
take their children because money is required for school fee (Rehman et al., 2010). In
specific cases, there are parents with medium income that are well educated who discover
approaches to guarantee their kids are admitted to the best private schools. Dronkers and
Avram (2010), also presents cases where rich families decide the school choice of their
children depending on their income and education level.

23
According to Luis (2005), many parents send their children to private schools is
part of what has been described as social signaling. Social signaling is a form of
demonstrative behavior whose purpose is to mark an individual or a unit (such as a
family) as belonging to a special stratum of society. In the context of consumption, social
signaling takes place when, for example, individuals wear expensive watches or clothes,
live in large houses, or drive expensive cars. Such forms of consumption behaviors have
a separate dimension of social signaling. Private schools are also part of a system of
social signaling. By sending their children to private schools, parents are signaling that
they are able to afford the tuition, which is an economic signal. However, in choosing
private schools, parents also signal that they are caring and involved parents. In some
cases, it seems that social signaling is sufficient motivation for parents to choose private
schools for their children.
Qatar is a relatively wealthy country, with one of the highest gross domestic
products, measured on a per capita basis, in the world. However, Qatar also has a
working and middle class, and there are doubtlessly many Qatari parents for whom the
economic convenience of sending their children to a public school would outweigh the
conveniences of a private school. However, for wealthier Qataris, convenience can be
considered in light of the academic quality and other private school factors for which
parents are willing to pay.
24
CHAPTER 3 – RESEARCH METHODOLOGY
3.1 Theoretical Framework
The purpose of this sub-section of the chapter is to synthesize the empirical findings
presented earlier into a single explanatory framework. One means of synthesizing the
empirical findings is to note the existence of two diverging sets of motivations for choosing
a private school. One set of motivations can be situated within the framework of rational
decision-making, or, expressed in another manner, cost-benefit analysis. According to this
framework, parents decide to send or not send their children to specific school by
considerations related to academic quality, parents school relationship and other
convenience that can easily be integrated into a rational decision-making system. However,
the other set of motivations appears to be more irrational. For example, the decision to send
a child to a private school solely by social signalling suggests that parents have not engaged
in a true cost-benefit analysis of the schooling decision. Indeed, in economics, the
consumption of a good—a so-called Veblen good (Eaton & Eswaran, 2009)—that is
overpriced about what it delivers is treated separately from goods that are consumed on the
basis of rational decision-making. Thus, one means of synthesizing the body of empirical
literature on parental schooling decisions is to assign individual studies into one of these
two categories, that is, (a) rational versus (b) irrational decision-making.
According to all previous studies in the literature review, Private school parents
will differ in their perception of all aspects of schooling from public school parents.
25
Moreover, there will be a strong positive relationship between the perception of all factors
and the choice of private school except for consideration of religious factor which will be
higher for public schools according to the literature.
The conceptual framework in Figure (1) below illustrates the objectives of the
study, which are to investigate the factors influenced parents to consider enrolling their
children in private or public schools. Additionally, the study analyzes the relationship
between parent social status and the outlined factors. The independent variables are (a)
academic factors, (b) parent-school relationship factors, and (c) convenience factors, and
the dependent variable is the decision to send a child to a private or public school.

26
Figure 1: Research Conceptual Framework

27
3.2 Research Hypotheses
Based on the objectives of the research and the proposed conceptual framework
above, the following hypotheses have been formulated:
H1: Parent perception of instructional quality is positively related to the private
school choice
H2: Parent perception of consideration of religious is positively related to the private
school choice
H3: Parent perception of class size is positively related to the private school choice
H4: Parent perception of additional curriculum is positively related to the private
school choice
H5: Parent perception of parent-school relationship factor is positively related to the
private school choice
H6: Parent perception of school facilities is positively related to the private school
choice
H7: Parent perception of environment of learning is positively related to the private
school choice
H8: There is a significant relationship between parents with high social status and the
choice of private school

28
H9: High social statues parents will consider academic performance aspects of
schooling very important more often than low social statues parents.
H10: High social statues parents will consider parent-school relationship aspects of
schooling very important more often than low social statues parents.
3.3 Research Design and Instrument
To answer the research questions, a descriptive research design was adopted. An
online English and Arabic questionnaire was designed and shared with the participants
through various electronic platforms to collect data. The questionnaire consists of 45 close-
ended questions and two open-ended questions. The online questionnaire has many
advantages such as low cost as there is no papers and printing cost. Also, it allows using a
wide range of electronic platforms to reach out to the participants. Moreover, it can be
exported to statistical packages and save time. The questionnaire organized into four
sections as follows:
A) First Section (Demographic): This section consisted of 14 demographic factors that are
important for understanding the characteristics and the social status of the sample. Also,
these questions were relevant since they aim to examine if there is any relationship
between parental school choice behavior and parents’ background (Hypotheses 8).
These were Nationality, Age Group, Parental Educational Level, Parent Employment
Status, Parental Job Sector, Monthly Income, Number of Kids, Child Educational
Stage, Child Gender, Child School Type and Nationality. Moreover, the two most

29
commonly used indicators of social status which are Parental Educational Level and
Monthly Income are essential to test Hypotheses 9 and 10.
B) Second Section: this measured the parents’ perception of academic performance factor
of their child school. Questions 3.7.1, 3.7.2, 3.7.3, 3.7.4, 3.7.5 and 3.7.6 were designed
to measure the importance of instructional quality aspects regarding school choice
(Hypotheses 1). Questions 3.7.7 and 3.7.8 were intended to measure the importance of
class size concerning school choice (Hypotheses 3). Questions 3.7.9 and 3.7.10 were
designed to measure the significance of the availability of extra additional curriculum
regarding school choice (Hypotheses 4). Items 3.7.11 and 3.7.12 required to measure
the importance of religious Consideration variable that could influence parents in their
school choice (Hypotheses 2).
C) Third Section: this measured the parents’ perception of the parent school relationship
of their child school. Questions 3.8.1, 3.8.2, 3.8.3 and 3.8.4 were designed to measure
the importance of parent-school relationship and get information about parents who
showed an interest in aspects of administration when they choose schools for their
children (Hypotheses 5).
D) Fourth Section: this measured the parents’ perception of the convenience factors of
their child school. The questions in this part were divided into two parts. The first part
intended to determine the importance of school facilities regarding school choice and
was measured by questions 3.9.1 to 3.9.7. The second part designed to assess the
importance of environment of learning and school safety regarding school choice and
was measured by questions 3.10.1 to 3.10.8.

30
E) The questionnaire that was used for data collection is in the Appendix. The five-point
Likert scale was used for measuring each item in the questionnaire. The Likert scale is
designed to examine how strongly the respondents agree or disagree with the statement
on a five-point scale (Cavana et al., 2001). This research used 1 to represent ‘strongly
disagree’, 2 to represent ‘disagree’, 3 to represent ‘don’t know, 4 to represent ‘agree’
and 5 to represent ‘strongly agree.’
3.4 Sampling and Data Collection
The target population of this research was Qatari and non-Qatari parents in Qatar
who have children in schools. Data were collected through a web-based questionnaire.
The online questionnaire was designed on Qualtrics (mmqataru.eu.qualtrics.com) and
distributed through various platforms including emails, Twitter, Instagram, Snapchat and
WhatsApp using random sampling. Respondents were given sufficient time to fill the
questionnaire which was two weeks. The questionnaire was sent 22th of November 2017
and ended on 5th of December 2017. A total of 864 responses was received, but only 322
of them were completed.
3.5 Statistical Analysis
In this study, only quantitative data were collected, and hence only statistical data
analysis method was employed. Statistical Package of Social Science (SPSS 23) package
was used in analyzing the collected data. The frequencies, means, standard deviation,

31
reliability coefficients, principal components were computed. Lastly, multiple regression
models were used to test the hypothesis the study conceptual model.
1. The data collected was downloaded to an Excel sheet from the survey website.
2. The data were examined for missing and invalid values.
3. The data were coded. For example, strongly agree (5) strongly disagree (1)
4. The data were exported to SPSS
5. The reliability and validity of the collected data were tested by employing
Cronbach’s Alpha and corrected item-total correlation. The recommended
value of Cronbach’s Alpha is 0.70 or greater (Cavana et al., 2001).
6. Simple descriptive statistical tools including frequencies and proportions were
calculated to illustrate the sample demographic information.
7. Descriptive statistics were used for all scale-items: mean, frequency and
standard deviation.
8. Sample T-tests were run to determine the statistically significant differences
between parents of public and private schools regarding seven factors: Quality
of instruction, class size, additional curriculum, religious considerations,
parent-school relationship, convenience factors, and learning environment
9. Logistic regression was used to determine the significant factors that of the
influence parents to choose a specific school.

32
10. All the assumptions of the regression model were taken into consideration and
evaluated.
11. An analysis of variance (ANOVA) was carried out to determine whether the
identified factors differed based on parents’ socio-economic, educational, and
age characteristics.

33
CHAPTER 4 – RESEARCH FINDINGS
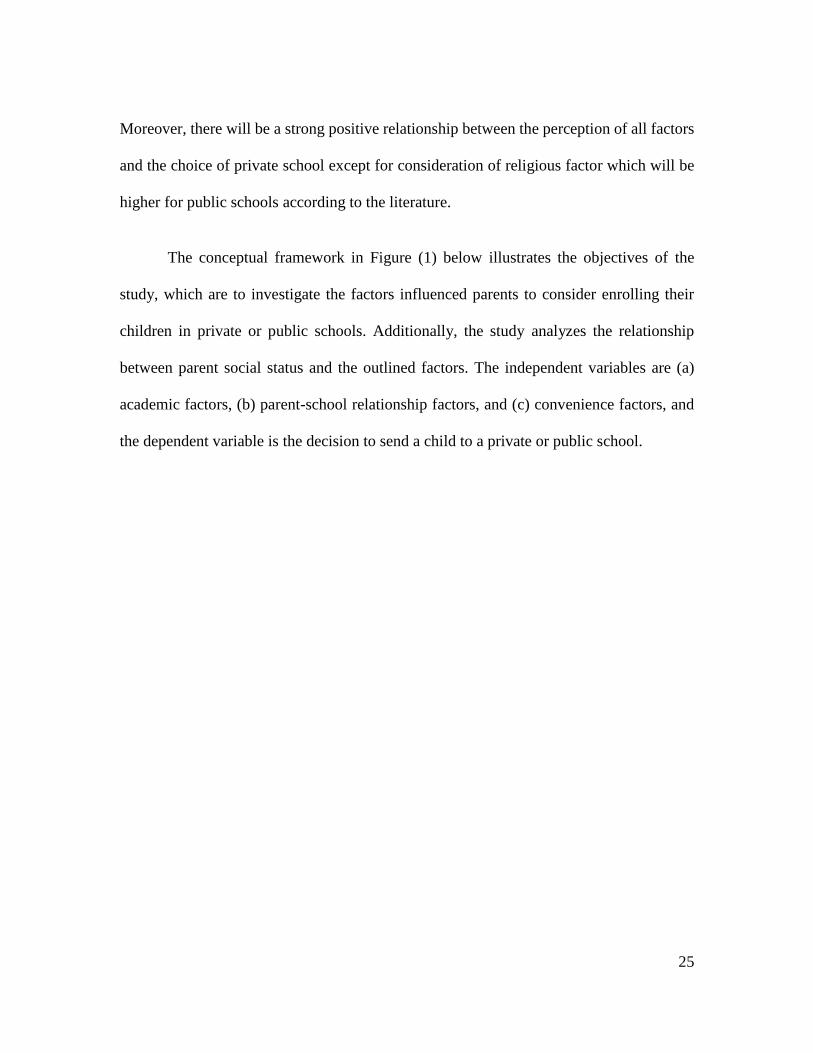
4.1 Validity and Reliability of the Questionnaire
Table 1 below shows the summary of variables included in this research, the
number of items used for measuring each variable and reliability coefficient for each
variable. Based on the data collected from the survey, it shows that the minimum
Cronbach’s alpha (0.70) was met by all constructs which means that the instrument has
very good reliability (Cavana et al., 2001). Cronbach’s alpha values ranged from 0.749 to
0.946. Regarding environment of learning variable, the number of items at the beginning
was eight; however, two items were dropped because the Cronbach alpha for them was
less than 0.70 which is not acceptable. All items loaded on their intended construct.
Moreover, the Corrected Item-Total Correlation values for all items show a high
correlation which was an indication of high convergent validity.
34
Table 1: Reliability and validity evaluation
Instr
uctio
nal
qualit
y
Class
size
Additional
curriculu
m
Considerati
on of
religious
Parent-
school
relationshi
p
School
facilitie
s
Environme
nt of
learning
Corrected
Item-Total
Correlatio
n
3.7.1 .69
4
.833
3.7.2 .71
2
.808
3.7.3 .80
6
.706
3.7.4 .61
5
.807
3.7.5 .57
2
.775
3.7.6 .52
1
.715
3.7.7 .68
9
.660
3.7.8 .81
8
.660
3.7.9 .823 .625
3.7.10 .763 .625
3.7.11 .853 .609
3.7.12 .787 .609
3.8.1 .831 .676
3.8.2 .783 .618
3.8.3 .836 .685
3.8.4 .806 .651
3.9.1 .892 .847
3.9.2 .896 .852
3.9.3 .922 .887
3.9.4 .828 .768
3.9.5 .902 .861
3.9.6 .849 .791
3.9.7 .808 .745
3.10.1 .855 .760
3.10.2 .812 .707
3.10.3 .868 .783
3.10.4 .656 .543
3.10.5 .818 .726
3.10.6 .743 .638
Cronbach's
Alpha
.921 0.79
2
.769 .749 0.829 0.946 0.882

35
4.2 Demographic and Background Findings
Table 2 below contains an overview of the demographics of the 322 participants
of the study. A majority (n = 231, 84.5%) of the participants were women. 50% of
participants were in the 30-39 year age group, 25.2% were between 20 and 29 years, 20.8
% between 40 and 49 years and 3.7 % were between 50 and 59 years. Regarding
nationality, 71.7% of the participants were Qatari while 28.8% were non-Qatari. For
parent education level, more than 60% of fathers and 70% of mothers held a Bachelor’s
degree or above. For the income level, more than 50% of parents made over 30,000
Qatari riyals monthly, 16% made between 15000 to 25000 Qatari riyals monthly and
almost 13% of them made between 5000 to 15000 Qatari riyals monthly. For fathers’ job
sector, 61.5% of fathers worked in the government sector, 27.6 % worked in the private
sector, 7.5% are self-employed, and 3.4% are not working. For mothers’ job sector,
44.7% of mothers worked in the government sector, 10.9 % worked in the private sector,
3.4% are self-employed, and 41% are not working. For the school choice, 204 parents
(63.4%) in the sample had a child or children in private school, with the remaining 118
parents (36.6%) having a child or children in public school. A full demographic profile
of the sample of the study is provided in Table 2.

36
Table 2: Demographic profile of the respondents (N = 322)
Demographic Frequency Percent
Nationality
Non-Qatari 91 28.3
Qatari 231 71.7
Age
20-29 81 25.2
30-39 162 50.3
40-49 67 20.8
50-59 12 3.7
Relation with the student
Father 50 15.5
Mother 272 84.5
Monthly income
Under 5,000 3 .9
5k-9k 19 5.9
10k-14k 25 7.8
15k-19k 26 8.1
20k-24k 25 7.8
25k-29k 39 12.1
>30k 185 57.5
Father job sector
None 11 3.4
Private 89 27.6
Public 198 61.5
Self-employed 24 7.5
Mother job sector
None 132 41.0
Private 35 10.9
Public 144 44.7
Self-employed 11 3.4
Father education level
Bachelor 152 47.2
Certificate/Diploma 34 10.6
Master/ PhD 57 17.7
Primary 28 8.7
Secondary 51 15.8
Mother education level
Bachelor 207 64.3
Certificate/Diploma 16 5.0
Master/ PhD 30 9.3
Primary 8 2.5
Secondary 61 18.9
Child gender
Female 142 44.1
Male 180 55.9
Child school type
Private 204 63.4
Public 118 36.6
Child educational stage
Early childhood education 79 24.5
Preparatory education 41 12.7
Primary education 154 47.8
Secondary education 48 14.9

37
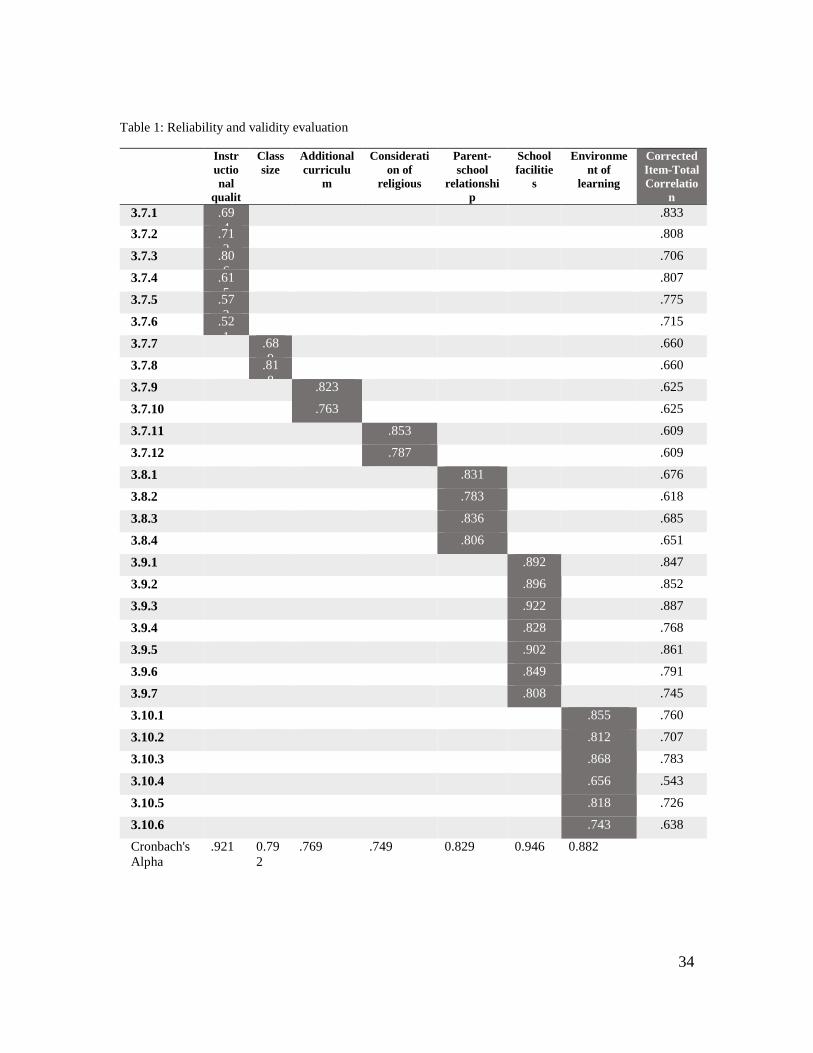
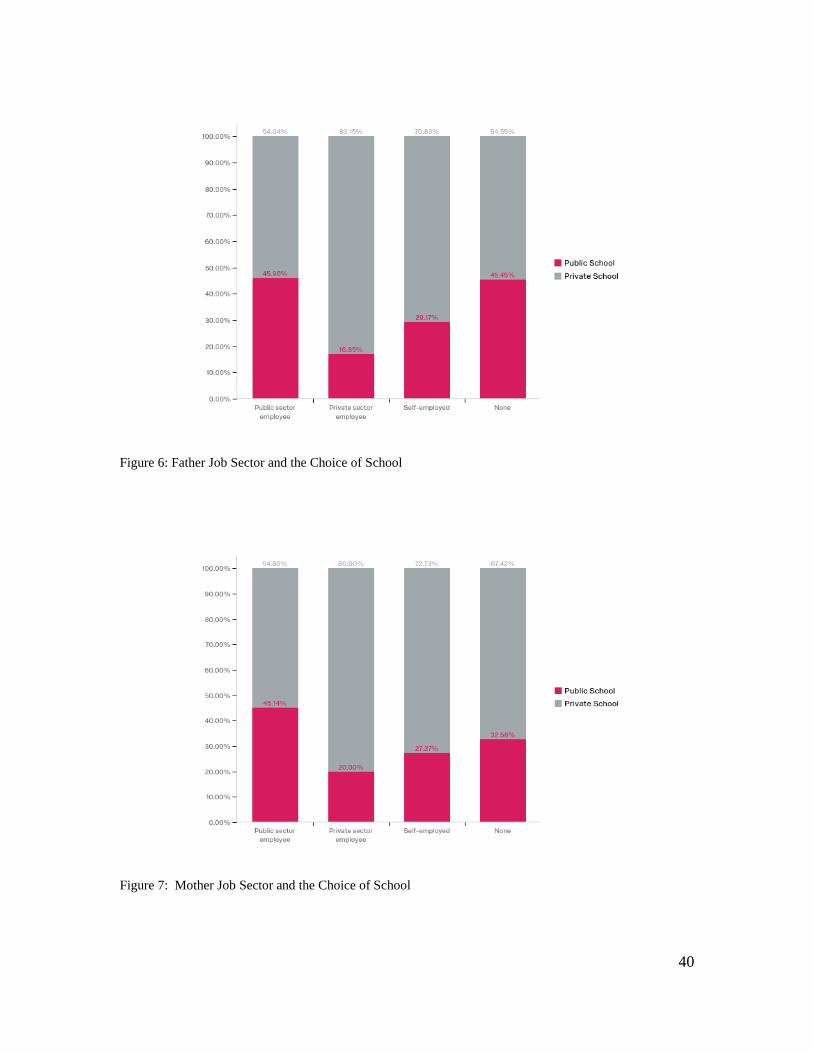
Figures 2-7 below contain a visual depiction of the demographics of the sample as sorted
separately for the parents of children in private school and the parents of children in
public school. Figure 2 shows that there is no significant difference in the percentage of
children in public or private schools for Qatari and non-Qatari parents. Regarding
monthly income level, Figure 3 shows that the higher the monthly income, the greater the
proportion of children in private schools. For parents' educational level, Figure 4 and
Figure 5 show that the higher the level of education of parents, the higher the proportion
of children in private schools than in public schools. For the parents' job sector, Figure 6
and Figure 7 show that the proportion of children in public schools is higher for parents
who work in the government sector or who do not have work. However, the proportion
of children is greater in private schools for parents who are self-employed or work in the
private sector.

38
Figure 2: Nationality and the Choice of School
Figure 3: Monthly Income and the Choice of School

39
Figure 4: Father Education Level and the Choice of School
Figure 5: Mother Education Level and the Choice of School
40
Figure 6: Father Job Sector and the Choice of School
Figure 7: Mother Job Sector and the Choice of School

41
4.3 Descriptive Statistics
Descriptive statistics for the study were carried out through the creation of tables
that presented the rank, mean, and standard deviation for numerous measures in the
study, including the following:
Academic performance factor which is divided into four dimensions that are
quality of instruction, class size, additional curriculum and religious
considerations
Parent-school relationship
Convenience factors which are divided into two dimensions that are school
facilities and learning environment
Table 3 demonstrates the most important quality of instruction items for parents
who have children in public and private schools. Regarding parents who have
children in private schools, the most important item was: the school is doing a good
job teaching mathematics, sciences and English. This was rated at 4.09 which is very
close to the second-ranked item that was the education offered to students at the
school is of high quality. The third most important item was: The school is doing a
good job teaching subjects other than subjects mentioned, rated at 3.8 followed by the
teaching strategies used at this school are innovative, teachers use advanced
technology to deliver knowledge to students, such as computers, smart boards,
projectors, and social media and teachers are well prepared and highly qualified
which rated 3.79,3.79 and 3.74 respectively. In contrast, parents who have children in
private schools, the most important item was: The education offered to students at the

42
school is of high quality which rated 3.61. The second important item was teachers
use advanced technology to deliver knowledge to students, such as computers, smart
boards, projectors, and social media that was rated 3.49. The third impotent item that
was very close to the second is the school is doing a good job teaching subjects other
than mathematics, sciences and English rated 3.42. On the other hand, the less
important items were the school is doing a good job teaching mathematics, sciences
and English, the teaching strategies used at this school are innovative, and Teachers
are well prepared and highly qualified.
Table 3: Descriptive statistics of the items measuring the quality of the instruction factor
Private Public
Quality of instruction Rank Mean S.D Rank Mean S.D
The education offered to students at
the school is of high quality
2 4.05 1.0
28
1 3.61 1.295
The school is doing a good job
teaching mathematics, sciences and
English
1 4.09 .99
4
4 3.39 1.241
The school is doing a good job
teaching subjects other subjects
3 3.80 1.1
23
3 3.42 1.277
The teaching strategies used at this
school are innovative
4 3.79 1.0
96
5 3.28 1.233
Teachers are well prepared and highly
qualified
5 3.74 .97
2
6 3.25 1.260
Teachers use advanced technology to
deliver knowledge to students, such as
computers, smart boards, projectors,
and social media
4 3.79 1.1
60
2 3.49 1.279

43
The second dimension of the academic performance factor is the class size. Table
4 below shows that although the ranking for both items was the same for parents who
have children in public and private schools, there is a big difference in their means.
Parents who have children in private schools show higher perceptions about the
importance of class size regarding school choice than parents who have children in public
schools.
Table 4: Descriptive statistics of the items measuring the class size factor
Private Public
Class size Rank Mean S.D Rank Mean S.D
The relationship between the teachers
and students is very good
1 3.97 .999 1 3.42 1.243
Class size at the school is appropriate
for effective learning
2 3.84 1.157 2 3.27 1.357
The third dimension of the academic performance factor is the offering of
additional curriculum and activities. Table 5 below shows that there is a big difference in
items mean between public and private school in the perception of parents. Private
schools have a much higher score than public schools for this dimension.

44
Table 5: Descriptive statistics of the items measuring the additional curriculum factor
Private Public
Additional curriculum Rank Mean S.D Rank Mean S.D
The school provides additional
curriculum, such as other languages
and computer sciences
2 3.76 1.098 1 3.21 1.287
The school provides extracurricular
activities, such as sports, field trips,
student clubs, volunteering, etc
1 3.93 .987 2 3.02 1.294
Table 6 represents the fourth dimension of the academic performance factor
which is the consideration of religious. This dimension revealed a high level of
agreement between parents in term of ranking however public schools have higher
parents’ perception than private schools for this dimension.
Table 6: Descriptive statistics of the items measuring the consideration of religious factor
Private Public
Consideration of religious Rank Mean S.D Rank Mean S.D
The school emphasizes religion 2 3.55 1.310 2 3.80 1.318
There are prayer rooms 1 3.84 1.129 1 3.97 1.037

45
Table 7 demonstrates the most important items of parent-school relationship
which also revealed a high level of agreement between participants in term of ranking,
however, there is a slight difference in the perceptions mean for each item for parents
who have children in private schools and parents who have children in public schools.
Table 7: Descriptive statistics of the items measuring the parent-school relationship factor
Parent-school relationship
Private Public
Rank Mean S.D Rank Mean S.D
The school provides sufficient
opportunities for parents involvement
in the school development
4 3.48 1.094 4 3.23 1.105
The school uses technology to provide
parents with information about the
progress of students at the school
2 4.07 1.125 2 3.71 1.206
Parents opinions are considered when
important decisions are made
3 3.54 1.042 3 3.25 1.014
The parents and school - The school
keeps me informed
1 4.12 .972 1 3.73 1.130
Table 8 and Table 9 represents the dimensions of the convenience factors which
are school facilities and learning environment. Regarding school facilities, Table 8 shows
that the most important item for parents who send their children to private schools are
Electricity facility, sufficient fans, tube light and air conditioning are satisfactory and
Availability of playground (indoor and outdoor). Followed by Furniture (desks, chairs) is

46
satisfactory, Blackboard, whiteboard, and audiovisual aids are sufficient, Classrooms are
enough, according to the number of students, the school building is standard, neat, clean,
airy and with boundary wall and finally Computer labs, laboratories, and library are
available. On the other hand, Computer labs, laboratories, and library are available
followed by Furniture (desks, chairs) is satisfactory were the most important items for
parents who have children in public schools. The less important item for them was the
availability of playground (indoor and outdoor) which was number one for parents who
have children in private schools.
Table 8: Descriptive statistics of the items measuring the school facilities factor
Private Public
School facilities Rank Mean S.D Rank Mean S.D
The school building is standard, neat,
clean, airy and with boundary wall
4 3.80 1.158 3 3.78 1.241
Electricity facility, sufficient fans,
tube light and air conditioning are
satisfactory
1 3.91 1.084 4 3.77 1.165
Furniture (desks, chairs) is satisfactory 2 3.90 1.048 2 3.85 1.181
Classrooms are enough, according to
number of students
4 3.76 1.116 5 3.65 1.165
Blackboard, whiteboard, and
audiovisual aids are sufficient
3 3.82 1.031 6 3.70 1.112
Computer labs, laboratories, and
library are available
5 3.78 1.066 1 3.86 1.072
Availability of playground (indoor and
outdoor)
1 3.91 1.093 6 3.53 1.252

47
Regarding the school environment of learning and safety, Table 9 shows that the
most important item for parents who send their children to private or public schools was:
there is no physical abuse (knives) at the school. The second important item for both was:
the school provides a safe and orderly environment for learning. The less important item
for parents who send their children to private school was: Cheating is strongly not
tolerated at the school. While for parents who send their children to public school the less
important item was: School rules apply equally to all students.
Table 9: Descriptive statistics of the items measuring the environment of learning factor
Private Public
Environment of learning Rank Mean S.D Rank Mean S.D
The school environment encourages
teaching and learning
3 3.97 .997 3 3.59 1.149
School rules apply equally to all
students
4 3.82 .987 5 3.48 1.107
The school provides a safe and orderly
environment for learning
2 4.02 .890 2 3.81 1.111
The school has procedures to avoid
substance abuse (drugs, alcohol)
5 3.61 .927 2 3.81 1.096
There is no physical abuse (knives) at
the school
1 4.09 1.065 1 4.07 1.123
Cheating is strongly not tolerated at
the school
6 3.57 .920 4 3.52 1.138

48
4.4 Inferential Statistics
4.4.1 Independent Samples t-test
Numerous inferential statistics were conducted for the study. The first set of
inferential statistics were based on an independent samples t-test. The purpose of the
independent samples t-test was to determine whether the mean scores of seven variables
(Quality of instruction, class size, additional curriculum, religious considerations, parent-
school relationship, convenience factors, and learning environment) differed between the
parents of children in public schools and the parents of children in private schools. Table
10 below contains the group statistics for the seven variables, after which a discussion of
their t-values and statistical significances has been provided.

49
Table 10: Group statistics - independent t-test regarding the difference between private and public school
choice to all factors
Levene's Test
for Equality of
Variances
t-test for Equality of Means
F Sig. t df
Sig.
(2-
tailed)
Mean
Difference
Std. Error
Difference
Instructional
quality
Equal
variances
assumed
12.
128 .001
4.24
2 320 .000 .4707 .1109
Equal
variances not
assumed
3.97
1
199.
153 .000 .4707 .1185
Class size Equal variances
assumed
11.71
8 .001 4.544 320 .000 .555 .122
Equal
variances not
assumed
4.33
8
211.
606 .000 .555 .128
Additional
curriculum
Equal variances
assumed 9.863 .002 6.201 320 .000 .7312 .1179
Equal
variances not
assumed
5.86
4
205.
423 .000 .7312 .1247
Consideration
of Religious
Equal variances
assumed
1.884 .171 2.047 320 .041 .2488 .1216
Equal
variances not
assumed
2.102 264.5
40
.036 .2488 .1184
The
relationship
between the
parents and
school
Equal variances
assumed 2.722 .100 3.195 320 .002 .32299 .10111
Equal
variances not
assumed
3.10
2
223.
047 .002 .32299 .10413
School
facilities
Equal variances
assumed 1.458 .228 .956 320 .340 .10767 .11260
Equal
variances not
assumed
.930 224.
255 .353 .1077 .1158
Environment
for learning
Equal variances
assumed 3.955 .048 1.452 320 .147 .1369 .0943
Equal
variances not
assumed
1.38
6
211.
338 .167 .1369 .0989

50
The mean of instructional quality differed significantly between private and
public school parents, t(199.153) = 3.971, p=0.000 (p<0.001). Private-school parents
placed a significantly higher mean importance on instructional quality. The mean of
class size differed significantly between private and public school parents, t(211.606) =
4.338, p=0.000 (p<0.001). Private-school parents were more likely to believe that class
sizes were appropriate. The mean of additional curriculum differed significantly between
private- and public school parents, t(205.423) = 5.864, p=0.000 (p<0.001). Private-school
parents placed a significantly higher mean importance on additional curriculum factors.
The t-test results also showed that there was a significant difference between parents who
chose private schools and parents who chose public schools in term of consideration of
religious: t(322)= 2.047, p=0.041 (p<0.05). The public school parents showed a higher
score of 3.945, compared to the private school parents, who had a score of 3.696.
Therefore, the consideration of religion in a school appeared to influence parents school
choice significantly. The higher the rating of consideration of religious the more likely to
choose public schools. The t-test results also revealed that there was a significant
difference between private schools parents public schools parents regarding the parent-
school relationship t(230)= 3.195, p=0.002 (p>0.01). The private school parents showed a
score of 3.8039, compared to the public school parents who had a score of 3.4809. The
higher the rating of parent-school relationship the more likely to choose private schools.
Table 10 shows that there was not a significant difference between private and public
schools parents (p>0.05) in term of school facilities and environment for learning aspects.
Therefore, they have no significant effect on the school choice decisions.

51
4.4.2 Logistic Regression
A logistic regression analysis was run to measure the impact of academic factors,
convenience factors and the effect of demographic variables on the school choice. In the
first step, the independent variables (income, parent education and parent job sector) were
entered. In the second step, the academic and convenience factors were entered as an
independent variable.
Table 11 is the results of the intercept model. That is the Maximum Likelihood
model if only the intercept is included without any of the independent variables in the
analysis. In this part of the output, the percent of cases for which the dependent variable
was correctly predicted was 63.4 = 204/322.
Table 11: Classification from the null model
Observed Predicted
School Choice Percentage
Correct 0 1
Step 0 School Choice 0 0 118 .0
1 0 204 100.0
Overall Percentage 63.4
Table 12, Table 13 and Table 14 were the results of adding the social status
predictors only. Table 14 gives the percent of cases for which the dependent variables were
correctly predicted by the model 73% = 233/322. Table 12 shows that the model was

52
significant, χ2(20) = 85.602, p < .001, Nagelkerke R2 = 0.319. Thus, the social status
predictors explained 23.3% of the variation in school choice (Table 13).
Table 12: Omnibus Tests of Model Coefficients for block 1
Chi-square df Sig.
Step 1 Step 85.602 20 .000
Block 85.602 20 .000
Model 85.602 20 .000
Table 13: Model Summary for block 1
Step -2 Log likelihood Cox & Snell R Square Nagelkerke R Square
1 337.535a .233 .319
Table 14: Classification for block 1
Observed Predicted
School Choice Percentage
Correct 0 1
Step 1 School Choice 0 59 59 50.0
1 28 176 86.3
Overall Percentage 73.0
Table 15, Table 16, Table 17 and Table 18 were the results of adding the social
status predictors and the academic and convenience factors to the model. Table 17 gives
the percent of cases for which the dependent variables were correctly predicted by the

53
model 82.9%. Table 15 shows that the model was significant, χ2(25) = 170.667, p < .001.
Table 16 shows that the Nagelkerke R2 was 0.563 which indicates that the model is good
but not great. Thus, 41% probability of the choosing the private school is explained by the
logistic model.
Table 15: Omnibus Tests of Model Coefficients for block 2
Chi-square df Sig.
Step 1 Step 85.065 5 .000
Block 85.065 5 .000
Model 170.667 25 .000
Table 16: Model Summary for block 2
Step -2 Log likelihood Cox & Snell R Square Nagelkerke R Square
1 252.470a .411 .563
Table 17: Classification for block 2
Observed Predicted
School Choice Percentage
Correct 0 1
Step 1 School Choice 0 85 33 72.0
1 22 182 89.2
Overall Percentage 82.9

54
Table 18 below contains the results of the hierarchical logistic regression model. In
this model, the predictors found to be significant, at p < .05, were monthly income, parental
education, parental job sector, class size, additional curriculum, religion, parent-school
relationships, and school facilities. The coefficients for monthly were negative at lower
income levels and positive at higher income levels, indicating that as monthly income
increased, so did the chance that parents would send their child or children to a private
school. The same pattern was observed in educational levels. Higher levels of maternal
education and paternal education were associated with positive coefficients, suggesting
that the children of more highly educated parents were more likely to attend private school.
Additionally, the coefficients for class size, additional curriculum, and parent-
school relationships were positive, whereas the coefficients for religion and school
facilities were negative. Thus, parents who were more concerned about religious
accommodations were less likely to send their children to private schools, as were parents
who had concerns about school facilities. On the other hand, parents who believed in the
importance of lower class sizes, an expanded curriculum, and better parent-school
relationships were all more likely to send their children to private school.

55
Table 18: Logistic regression model results
B S.E. Wald df Sig. Exp(B)
MonthlyIncome 25.081 6 .000
MonthlyIncome(5k-9k) -1.191 1.465 .661 1 .416 .304
MonthlyIncome(10k-14-k) -1.700 1.460 1.356 1 .244 .183
MonthlyIncome(15k-19k) .145 1.432 .010 1 .919 1.156
MonthlyIncome(20k-24k) -.936 1.472 .404 1 .525 .392
MonthlyIncome(25k-29k) .631 1.415 .199 1 .655 1.880
MonthlyIncome(>30k) 1.129 1.382 .668 1 .414 3.093
FatherEducation 10.595 4 .032
FatherEducation(Secondary) -.155 .662 .055 1 .815 .857
FatherEducation(Certificate/Diplo
ma)
.705 .725 .948 1 .330 2.025
FatherEducation(Bachelor) 1.238 .629 3.873 1 .049 3.450
FatherEducation(Master/PhD) .980 .688 2.029 1 .154 2.664
FatherJobSector 21.014 3 .000
FatherJobSector(self-employed) -.646 1.095 .349 1 .555 .524
FatherJobSector(private) -.717 .966 .551 1 .458 .488
FatherJobSector(Public) -2.543 .965 6.946 1 .008 .079
MotherJobSector 9.910 3 .019
MotherJobSector(self-employed) -.093 .939 .010 1 .921 .911
MotherJobSector(private) .029 .624 .002 1 .963 1.029
MotherJobSector(Public) -1.181 .399 8.758 1 .003 .307
MotherEducation 10.086 4 .039
MotherEducation(Secondary) 2.726 1.302 4.388 1 .036 15.278
MotherEducation(Certificate/Diplo
ma)
2.718 1.469 3.423 1 .064 15.148
MotherEducation(Bachelor) 2.238 1.294 2.991 1 .084 9.377
MotherEducation(Master/PhD) 3.776 1.427 7.001 1 .008 43.662
Classsize .552 .231 5.686 1 .017 1.736
Additionalcurriculum 1.246 .246 25.622 1 .000 3.477
Religion -1.585 .279 32.160 1 .000 .205
Therelationshipbetweentheparents
andschool
.702 .272 6.677 1 .010 2.018
Schoolfacilities -.757 .248 9.289 1 .002 .469
Constant -.548 2.003 .075 1 .784 .578

56
The significant coefficients in Table 18 above were transformed into odds ratios (ORs) in
order to more easily interpret the results of the study. The OR results are as follows:
Fathers with a Bachelor’s degree were 3.45 times more to send their children to
private school as compared to fathers at all other levels of education.
Fathers who worked in the public sector were 0.08 times as likely to send their
children to private school as compared to fathers in all other employment sectors.
Mothers who worked in the public sector were 0.31 times as likely to send their
children to private school as compared to mothers in all other employment sectors.
Mothers with secondary school level were 15.27 times as likely to send their
children to private school as compared to mothers at all other education levels.
Mothers who had Master or PhD education were 43.64 times as likely to send their
children to private school as compared to mothers at all other education levels.
Regarding coefficient interpretations, rather than OR interpretations, the following effects
were noted.
A 1-unit increase in the perceived importance of class size was associated with a
1.736 log-odds increase in the probability of sending a child to private school rather
than to public school.
A 1-unit increase in the perceived importance of an additional curriculum was
associated with a 3.477 log-odds increase in the probability of sending a child to
private school rather than to public school.
A 1-unit increase in the perceived importance of religious accommodations was

57
associated with a 0.205 log-odds decrease in the probability of sending a child to
private school rather than to public school.
A 1-unit increase in the perceived importance of parental-school relationships was
associated with a 2.018 log-odds increase in the probability of sending a child to
private school rather than to public school.
A 1-unit increase in the perceived importance of school facilities was associated
with a 0.479 log-odds decrease in the probability of sending a child to private school
rather than to public school.
Based on the hierarchical logistic regression results, H3, H4 and H5 were supported,
whereas H1, H2, H6 and H7 were rejected. H8 is partially supported.
4.4.3 ANOVA Results
An analysis of variance (ANOVA) was carried out to determine whether the
identified factors differed based upon parents’ socio-economic, educational, and age
characteristics. First, an ANOVA was carried out with parental age as the sorting group.
Table 19 below shows that there was no significant effect of parental age on the dependent
variables of (a) perceived importance of instructional quality (F = 0.351, p = .788); (b)
perceived importance of class size (F = 0.167, p = .918); (c) perceived importance of
additional curriculum (F = 0.754, p = .522); (d) perceived importance of religion (F =
0.482, p = .695); (e) perceived importance of school facilities (F = 1.371, p = .254); and (f)
perceived importance of environment for learning (F = 0.963, p = .412). However, there
was a significant effect of parental age on perceived importance of parental-school
relationship, F = 2.996, p = .033.

58
Table 19: ANOVA results for parental age and academic and convenience factors
Sum of
Squares
df Mean Square F Sig.
Instructional
quality
Between Groups 1.357 3 .452 .351 .788
Within Groups 180.159 140 1.287
Total 181.515 143
Class size Between Groups .706 3 .235 .167 .918
Within Groups 197.183 140 1.408
Total 197.889 143
Additional
curriculum
Between Groups 2.946 3 .982 .754 .522
Within Groups 182.380 140 1.303
Total 185.326 143
Religion Between Groups 1.727 3 .576 .482 .695
Within Groups 167.266 140 1.195
Total 168.993 143
The relationship
between the
parents and
school
Between Groups 7.613 3 2.538 2.99
6
.033
Within Groups 118.602 140 .847
Total 126.215 143
School facilities Between Groups 4.676 3 1.559 1.37
1
.254
Within Groups 159.204 140 1.137
Total 163.880 143
Environment for
learning
Between Groups 2.461 3 .820 .963 .412
Within Groups 119.270 140 .852
Total 121.731 143
Second, an ANOVA was carried out with monthly income as the sorting group.
Table 20 below shows that there was no significant effect of monthly income on the
dependent variables of (a) perceived importance of instructional quality (F = 1.969, p =
.070); (b) perceived importance of class size (F = 1.279, p = .266); (c) perceived

59
importance of additional curriculum (F = 1.823, p = .094); (d) perceived importance of
religion (F = 0.252, p = .695); (e) perceived importance of school facilities (F = 1.071, p
= .380); and (f) perceived importance of environment for learning (F = 1.231, p = .290).
However, there was a significant effect of monthly income on perceived importance of
parental-school relationship, F = 2.463, p = .024.
Table 20: ANOVA results for monthly income and academic and convenience factors
Sum of
Square
s
df Mean
Square
F Sig.
Instructional
quality
Between Groups 11.244 6 1.874 1.969 .070
Within Groups 299.839 315 .952
Total 311.083 321
Class size Between Groups 9.022 6 1.504 1.279 .266
Within Groups 370.258 315 1.175
Total 379.280 321
Additional
curriculum
Between Groups 12.500 6 2.083 1.823 .094
Within Groups 360.059 315 1.143
Total 372.559 321
Religion Between Groups 1.713 6 .285 .252 .958
Within Groups 356.465 315 1.132
Total 358.178 321
The
relationship
between the
parents and
school
Between Groups 11.310 6 1.885 2.463 .024
Within Groups 241.041 315 .765
Total 252.350 321
School
facilities
Between Groups 6.078 6 1.013 1.071 .380
Within Groups 298.073 315 .946
Total 304.151 321
Environmen
t for
learning
Between Groups 4.911 6 .819 1.231 .290
Within Groups 209.396 315 .665
Total 214.307 321

60
Third, an ANOVA was carried out with paternal (fathers) education level as the
sorting group. Table 21 below shows that there was no significant effect of paternal
education e on the dependent variables of (a) perceived importance of instructional
quality (F = 0.698, p = .594); (b) perceived importance of class size (F = 0.571, p =
.684); (c) perceived importance of additional curriculum (F = 1.590, p = .177); (d)
perceived importance of religion (F = 1.991, p = .096); (e) perceived importance of
paternal-school relationship (F = 0.454, p = .769); (f) perceived importance of school
facilities (F = 0.476, p = .380); and (g) perceived importance of environment for learning
(F = 0.463, p = .763).

61
Table 21: ANOVA results for paternal (fathers) education level and academic and convenience factors
Sum of
Squares
df Mean
Square
F Sig.
Instructional quality Between
Groups
2.714 4 .679 .698 .594
Within Groups 308.369 317 .973
Total 311.083 321
Class size Between
Groups
2.715 4 .679 .571 .684
Within Groups 376.564 317 1.188
Total 379.280 321
Additional curriculum Between
Groups
7.328 4 1.832 1.590 .177
Within Groups 365.231 317 1.152
Total 372.559 321
Religion Between
Groups
8.780 4 2.195 1.991 .096
Within Groups 349.398 317 1.102
Total 358.178 321
The relationship
between the parents and
school
Between
Groups
1.439 4 .360 .454 .769
Within Groups 250.912 317 .792
Total 252.350 321
School facilities Between
Groups
1.816 4 .454 .476 .753
Within Groups 302.335 317 .954
Total 304.151 321
Environment for
learning
Between
Groups
1.245 4 .311 .463 .763
Within Groups 213.063 317 .672
Total 214.307 321
Fourth, an ANOVA was carried out with maternal education level as the sorting
group. Table 22 below shows that there was no significant effect of maternal education e
on the dependent variables of (a) perceived importance of instructional quality (F =
0.975, p = .422); (b) perceived importance of class size (F = 1.023, p = .395); (c)
perceived importance of additional curriculum (F = 0.407, p = .803); (d) perceived

62
importance of religion (F = 0.892, p = .469); (e) perceived importance of paternal-school
relationship (F = 1.838, p = .121); (f) perceived importance of school facilities (F =
1.809, p = .127); and (g) perceived importance of environment for learning (F = 2.103, p
= .080).
Table 22: ANOVA results for paternal (mothers) education level and academic and convenience factors
Sum of
Squares
df Mean
Square
F Sig.
Instructional quality Between
Groups
3.779 4 .945 .975 .422
Within Groups 307.304 317 .969
Total 311.083 321
Class size Between
Groups
4.835 4 1.209 1.023 .395
Within Groups 374.444 317 1.181
Total 379.280 321
Additional curriculum Between
Groups
1.905 4 .476 .407 .803
Within Groups 370.654 317 1.169
Total 372.559 321
Religion Between
Groups
3.988 4 .997 .892 .469
Within Groups 354.190 317 1.117
Total 358.178 321
The relationship
between the parents and
school
Between
Groups
5.719 4 1.430 1.838 .121
Within Groups 246.632 317 .778
Total 252.350 321
School facilities Between
Groups
6.789 4 1.697 1.809 .127
Within Groups 297.362 317 .938
Total 304.151 321
Environment for
learning
Between
Groups
5.540 4 1.385 2.103 .080
Within Groups 208.767 317 .659
Total 214.307 321

63
Based on the ANOVA results, H9 and H10 were rejected. The importance of
academic and convenience factors in the perception of parents was not dependent on their
age, their socio-economic or their educational level.

64
CHAPTER 5 – CONCLUSION
5.1 Discussion of the Results
The main results of the study indicated that parents who choose private schools
for their children are significantly different from parents who choose public schools. The
purpose of this section of the conclusion is to discuss these significant findings in light of
existing theories and empirical findings. The most important finding of the study, with
respect to both theories and empirical findings related to school choice, was that income
and parent education level were not significant determinants of the odds of choosing a
private school (see logistic regression results in Table 18 above). As discussed in detail in
the second chapter of the study, researchers have often discovered that private schools are
disproportionately chosen by wealthy and educated parents (Dronkers & Avram, 2010)
however this finding was not replicated in the current study. In specific cases, there are
parents with medium income that are well educated who discover approaches to
guarantee their kids are admitted to the best private schools (Rehman et al., 2010).
One plausible explanation for the failure of income to significantly determine
school choice in Qatar is that parents do not perceive private schools to have advantages
over public schools. In this study, it was found that, in fact, there were some reasons why
parents perceived public schools to have advantages over private schools. Based on the
logistic regression results presented in Chapter 4, it was found that parents believed
public schools to possess advantages in terms of (a) religious consideration and (b)
school facilities. Both findings were unexpected, as, according to the literature, private

65
schools have historically been more accommodating of denominational needs as well as
more likely to possess better school facilities (Opdenakker & Van Damme, 2006).
However, certain findings were expected on the basis of previous findings. It was
found that parents believed private schools to possess advantages in terms of (a) class
size, (b) an additional curriculum, and (c) parental-school relations. Based on the
literature, private schools are often considered to hold advantages over public schools in
each of these assessment areas (Charles, 2011; Fan & Williams, 2010). Because of the
absence of a weighted or ranked approach (as discussed subsequently in this chapter), it
was not possible to determine whether the factors associated with pro-private school
decisions were more or less important than factors associated with pro-public school
decisions. However, it should be observed that the support for public schools found in the
current study was limited in comparison to support for private schools. Public schools
only enjoyed an advantage in two attitudinal categories.
Regarding the second question of the research, ANOVA results showed that the
importance of academic and convenience factors in the perception of parents was not
dependent on their age, their socio-economic or their educational level.
5.2 Recommendations for the Ministry
There are numerous recommendations for the Qatar Ministry for Education and
Higher Education that can be made based on the results of this study. One set of
recommendations can be made based on the need for further information. For instance, in
the current study, parental preference for public schools’ facilities and religious
consideration was found. The Qatar Ministry for Education and Higher Education should

66
independently attempt to determine (a) whether, in fact, public schools in Qatar have
strengths in the domains of religious consideration and facilities; and (b) what the bases
for these strengths might be. In terms of what is known about Qatari educational policy, it
could be the case that compulsory Islamic education in public schools could represent a
perceived advantage for the parents of Muslim schoolchildren. Such a possibility would
help to explain the findings of the study, in which, despite believing private schools to
possess other advantages, parents were more likely to favor public schools for religious
consideration.
More concerning, from the perspective of the Qatar Ministry for Education and
Higher Education, is the lower perceived performance of public schools in numerous
domains—in particular, in terms of added curriculum, class size, and parent-school
relationships. The recent reform in Qatari educational policy, whereby independent
schools were co-opted into the framework of public education in 2002, was designed to
lead to a higher standard for all public schools. To the extent that parents in Qatar
continue to perceive private schools as possessing several advantages over public
schools, an important goal of Qatari educational policy is not being realized.
The findings of this study indicate that three domains in which the Qatar Ministry
for Education and Higher Education could concentrate its resources are the domains of
(a) additional curricula, (b) parent-school relationships, and (c) class size. In theory, if the
Qatar Ministry of Education can (a) expand the curricula taught in public schools, (b)
promote best practices in parent-school relationships, and (c) lower class sizes, public
schools in Qatar should be able to achieve competitive parity with private goals. Such a

67
policy goal would require a concentration of budgetary resources on (a) researching how,
and in what ways, to expand the curricula of Qatari public schools to match the curricula
of private schools while remaining within the ambit of Qatari educational policy; (b)
investing resources into understanding more about the relationships between parents and
public schools and finding means of improving school personnel’s ability to
communicate with parents; and (c) using optimization and other techniques to reduce the
ratio of students to teachers.
5.3 Limitations of the Study
The study had several important limitations. One of the limitations was that, even
though the topic of the study was on school choice, parents were only asked where their
child or children went to school. It is possible—and, on the basis of previous empirical
findings that for many parents, public choice is not so much a choice as an economic
necessity. However, in this study, parents were not asked whether they had truly chosen
public schools. One of the consequences of this limitation is a lack of construct validity,
as public-school enrollment might not reflect a choice, but, rather, a form of revealed
behavior rooted in economic necessity.
Another limitation of the study was the absence of ranking or weighted models.
Specifically, participants in the study were not asked about the relative importance of
factors such as quality of instruction, class size, additional curriculum, religious
considerations, parent-school relationship, convenience factors, and learning
environment. If participants had been asked to rank the relative importance of these

68
factors, it would have been possible to learn more about the determinative factors of
school choice.
5.4 Recommendations for Future Studies
There are numerous recommendations for future studies that can be made on the
basis of the limitations of the current study. One such recommendation is for future
scholars to ask parents about both (a) whether or not their children attend public or
private school and (b) whether or not attending public school is a true choice. The
validity of choice is an important consideration. It is likely that the most appropriate
comparison to private-school parents consists of parents (a) whose children are attending
public school and (b) who have made an actual choice to attend public school. It is not
necessarily the case that the preferences of parents who have been economically
compelled to send their children to public school can be reliably compared to the
preferences of parents who have the ability to choose private schools for their children. In
future studies, asking parents of public-school children about their choices, as well as
their revealed behaviors, could allow future researchers to generate more useful insights
about the dynamics of school choice.
Another recommendation for future studies is to ask participants about the relative
weighting of determinative factors. Such weighting could allow an adjustment of the
effects of certain variables (such as such as quality of instruction, class size, additional
curriculum, religious considerations, parent-school relationship, convenience factors, and
learning environment) on school choice. In future studies, participants could be asked to
rank each factor, and this ranking could be used to create weights in logistic regression.
69
Qualitative studies can also add substantially to what is known of parental choice
of schools. In the current study, it was found that parents do not have a uniformly
positive view of private schools in Qatar; in the dimensions of school facilities and
religious accommodations, for example, public schools were preferred. Given the
complexity of preferences, qualitative interviews might be more successful in identifying
the underlying determinants of school choice.
5.5 Summative Conclusion
The purpose of this quantitative, correlational, and survey-based study was to
examine determinants of school choice in the context of the country of Qatar. Three
hundred and twenty-two parents were sampled and asked questions relating to their (a)
demographics, (b) school choices, and (c) attitudes to various variables related to school
choice. Several important distinctions between private and public school parents were
identified. In particular, it was found that (a) private-school parents placed a significantly
higher mean importance on the parent-school relationship, (b) private-school parents
were more likely to believe that class sizes were appropriate, (c) private-school parents
placed a significantly higher mean importance on additional curriculum factors. The five
most important statistically significant findings of the study were as follows: (1) A 1-unit
increase in the perceived importance of class size was associated with a 1.736 log-odds
increase in the probability of sending a child to private school rather than to public
school. (2) A 1-unit increase in the perceived importance of an additional curriculum was
associated with a 3.477 log-odds increase in the probability of sending a child to private
school rather than to public school. (3) A 1-unit increase in the perceived importance of

70
religious consecration was associated with a 0.205 log-odds decrease in the probability of
sending a child to private school rather than to public school. (4) A 1-unit increase in the
perceived importance of parental-school relationships was associated with a 2.018 log-
odds increase in the probability of sending a child to private school rather than to public
school. (5) A 1-unit increase in the perceived importance of school facilities was
associated with a 0.479 log-odds decrease in the probability of sending a child to private
school rather than to public school. These empirical findings added to the highly limited
body of knowledge on school choice in Qatar and demonstrated the usefulness of logit
approaches to analyzing school choices.
The main limitations of the study were acknowledged as being a failure to
measure genuine choice and the absence of weighting. Suggestions to correct these
limitations in future studies were made. The main recommendations made to the Qatar
Ministry of Education and Higher Education were as follows: (a) Research how, and in
what ways, to expand the curricula of Qatari public schools to match the curricula of
private schools while remaining within the ambit of Qatari educational policy; (b) invest
resources into understanding more about the relationships between parents and public
schools and finding means of improving school personnel’s ability to communicate with
parents; and (c) use optimization and other techniques to reduce the ratio of students to
teachers. Applying these methods can assist Qatari public schools to become more
competitive with private schools.

71
REFERENCES
Adamski, A., Fraser, B. J., & Peiro, M. M. (2013). Parental involvement in schooling,
classroom environment and student outcomes. Learning Environments Research,
16(3), 315-328. doi:10.1007/s10984-012-9121-7
Anderman, L. H., & Kaplan, A. (2008). The role of interpersonal relationships in student
Motivation. The Journal of Experimental Education, 76, 115–119.
Beabout, B. R., & Cambre, B. M. (2013). Parental voucher enrollment decisions: Choice
within choice in New Orleans. Journal of School Choice, 7(4), 560-588.
Bell, C. (2009). Geography in parental choice. American Journal of Education, 115(4),
493-521.
Bondy, E., Ross, D. D., Gallingane, C., & Hambacher, E. (2007). Creating environments
of success and resilience: Culturally responsive classroom management and more.
Urban Education, 42(4), 326-348.
Bosetti, L. (2004). Determinants of school choice: Understanding how parents choose
elementary schools in Alberta. Journal of Education Policy, 19(4), 387-405.
Bosetti, L., & Pyryt, M. C. (2007). Parental motivation in school choice: Seeking the
competitive edge. Journal of School Choice, 1(4), 89-108.
Carbonaro, W. (2006). Public-private differences in achievement among kindergarten
students: Differences in learning opportunities and student outcomes. American
Journal of Education, 113(1), 31-65.
Cavana, R. Y., Delahaye, B. L., & Sekaran, U. (2001). Applied Business Research:
Qualitative and Quantitative Methods. Singapore: John Wiley & Sons.

72
Charles, G. W. (2011). Parental perceptions of school quality in public and private
schools. Northcentral University.
Chen, Y., & Sönmez, T. (2006). School choice: an experimental study. Journal of
Economic Theory, 127(1), 202-231.
Claire, C. M.,, (2015). Determinants of school choice : factors affecting student
enrolment in independent schools in Malta. [online] Available at:
https://www.um.edu.mt/library/oar/handle/123456789/2644.
Cohen-Zada, D., & Justman, M. (2003). The political economy of school choice: linking
theory and evidence. Journal of Urban Economics, 54(2), 277-308.
Coldren, J. and Boulton, P. (1991). Happiness as a criterion of parents’ choice of school.
Journal of Education Policy, 6(2): 169-178.
Cowen, J. M., Fleming, D. J., Witte, J. F., Wolf, P. J., & Kisida, B. (2013). School
vouchers and student attainment: Evidence from a state‐ mandated study of
Milwaukee's parental choice program. Policy Studies Journal, 41(1), 147-168.
Cucchiara, M. (2013). “Are we doing damage?” Choosing an urban public school in an
era of parental anxiety. Anthropology & Education Quarterly, 44(1), 75-93.
Cullen, J. B., Jacob, B. A., & Levitt, S. (2006). The effect of school choice on
participants: Evidence from randomized lotteries. Econometrica, 74(5), 1191.
Cullen, J. B., Jacob, B. A., & Levitt, S. D. (2005). The impact of school choice on student
outcomes: an analysis of the Chicago Public Schools. Journal of Public
Economics, 89(5), 729-760.
Dronkers J. & S. Avram, (2010). Social Class Dimensions in the Selection of a Private

73
School: A Cross8-National Analysis Using PISA. Educational Research and
Evaluation .pp. 4-5.
Duszka, C., (2015) The Effects of School Safety on School Performance. International
Journal of Education and Social Science, Vol. 2 No. 8.
Eaton, B. C., & Eswaran, M. (2009). Well‐ being and affluence in the presence of a
Veblen Good. The Economic Journal, 119(539), 1088-1104.
Ellen B. Goldring & Kristie J.R. Phillips. (2008) Parent Preferences and Parent Choices:
The Public-Private Decision About School Choice. Journal of Education, Vol. 23.
Fan, W., & Williams, C. M. (2010). The effects of parental involvement on students’
academic self‐ efficacy, engagement and intrinsic motivation. Educational
Psychology, 30(1), 53-74.
Fairlie R. W. (2006), Racial Segregation and the Private/Public School Choice,
University of California, Santa Cruz.
Geller, C. R., Sjoquist, D. L., & Walker, M. B. (2006). The effect of private school
competition on public school performance in Georgia. Public Finance Review,
34(1), 4-32.
Greatschools.org. (2013). How do parents research and choose schools?. [online]
Available at:
https://www.greatschools.org/catalog/pdf/How_Do_Parents_Research_and_Choo
se_Schools.pdf
Greene, K. V., & Kang, B.-G. (2004). The effect of public and private competition on
high school outputs in New York State. Economics of Education Review, 23(5),

74
497-506.
Griner, A. C., & Stewart, M. L. (2013). Addressing the achievement gap and
disproportionality through the use of culturally responsive teaching practices.
Urban Education, 48(4), 585-621.
Guarino, C. M., Galama, T., Constant, L., Gonzalez, G., Tanner, J. C., Goldman, C. A.,
(2009). Developing a School Finance System for K--12 Reform in Qatar.
Retrieved on 25th September, 2017 from
https://www.rand.org/content/dam/rand/pubs/monographs/2009/RAND_MG839.p
df
Hampden-Thompson, G., Guzman, L., & Lippman, L. (2013). A cross-national analysis
of parental involvement and student literacy. International Journal of
Comparative Sociology, 54(3), 246-266.
Hanushek, E. A., Kain, J. F., Rivkin, S. G., & Branch, G. F. (2007). Charter school
quality and parental decision making with school choice. Journal of Public
Economics, 91(5), 823-848.
Hastings, J. S., & Weinstein, J. M. (2008). Information, school choice, and academic
achievement: Evidence from two experiments. The Quarterly Journal of
Economics, 123(4), 1373-1414.
Hsieh, C.-T., & Urquiola, M. (2006). The effects of generalized school choice on
achievement and stratification: Evidence from Chile's voucher program. Journal
of Public Economics, 90(8), 1477-1503.
Hughes, J., & Kwok, O. (2007). Influence of Student–Teacher and Parent–Teacher

75
Relationships on Lower Achieving Readers’ Engagement and Achievement in the
Primary Grades. Journal of Educational Psychology, 99(1), 39–51.
http://doi.org/10.1037/0022-0663.99.1.39
Hukoomi. (2017). Qatar Official e-Government Portal. [online] Available at:
http://www.hukoomi.qa/wps/portal/topics/Education+and+Training/Independent+
Schools [Accessed 5 Dec. 2017].
Ikhlef, A.,& Knight, S. L., (2014) Conditions for student-centered teaching and learning
in Qatari in Qatar-Finland International School. [online] Available at:
http://www.qscience.com/doi/pdf/10.5339/nmejre.2013.4
Jensen, R. (2010). The (perceived) returns to education and the demand for schooling.
The Quarterly Journal of Economics, 125(2), 515-548.
Jeong, S., Kwak, D.-H., Moon, B., & San Miguel, C. (2013). Predicting school bullying
victimization: Focusing on individual and school environmental /security factors.
Journal of Criminology, 13(2), 1-16.
Klem, A. M., & Connell, J. P. (2004). Relationships matter: Linking teacher support to
student engagement and achievement. The Journal of School Health, 74, 262–
274.
Luis Bernal, J. (2005). Parental choice, social class and market forces: the consequences
of privatization of public services in education. Journal of Education Policy,
20(6), 779-792.
Meador, D. (2016). Solutions for Teaching in an Overcrowded Classroom. [online]
Available at from https://www.thoughtco.com/teaching-in-an-overcrowded-

76
classroom-3194352 [Accessed 5 Dec. 2017].
Ministry of Development Planning and Statistics. (2017). Population And Social
Statistics. [online] Available at: https://www.mdps.gov.qa/en/statistics/Statistical
Releases/Population/Population/2016/Population_social_1_2016_AE.pdf.
Ministry of Development Planning and Statistics. (2017). Qatar National Development
Strategy 2011~2016. [online] Available at:
https://www.mdps.gov.qa/en/knowledge/HomePagePublications/Qatar_NDS_repr
int_complete_lowres_16May.pdf.
Ministry of Education and Higher Education. (2017). About MOE. [online] Available at:
http://www.edu.gov.qa/En/about/Pages/default.aspx [Accessed 20 Dec. 2017].
Ministry of Education and Higher Education. (2017). The Policy of Academic
Monitoring of Private Schools September 2016. [online] Available at:
http://www.edu.gov.qa/En/ServicesCenter/PSO/SchoolsRolesEnglish/PolticPrivat
eSchoolsEnglish.pdf.
Ministry of Education and Higher Education. (2017). Education statistical Bulletin May
2016 - 2017. [online] Available at:
http://www.edu.gov.qa/Ar/structure/deputy/MonthlytStatisticsIssues/StatisticsMa
y2017.pdf.
Opdenakker, M.-C., & Van Damme, J. (2006). Differences between secondary schools: A
study about school context, group composition, school practice, and school effects
with special attention to public and Catholic schools and types of schools. School
Effectiveness and School Improvement, 17(1), 87-117.

77
Plunkett, S. W., Behnke, A. O., Sands, T., & Choi, B. Y. (2009). Adolescents’ reports of
parental engagement and academic achievement in immigrant families. Journal of
Youth and Adolescence, 38(2), 257-268.
Qatar Chamber. (2017). Pillars of Qatar National Vision 2030. [online] Available at:
http://qatarchamber.com/qatar-national-vision-2030/ [Accessed 20 Dec. 2017]
Qatareducation.info. (2017). Education System of Qatar, Education Profile of Qatar.
[online] Available at: http://www.qatareducation.info/Education-
System/Education-Profile.html [Accessed 10 Dec. 2017].
Rabayah, Khalid. (2015). INFORMATION TECHNOLOGY USE AND ACADEMIC
ACHIEVEMENTS OF STUDENTS IN PRIMARY SCHOOLS. Information
Technologies and learning tools. 43. 40 - 55.
Ramzi Nasser (2017) Qatar’s educational reform past and future: challenges in teacher
development, Open Review of Educational Research, 4:1, 1-19, DOI:
10.1080/23265507.2016.1266693
Rehman, Naeem & Khan, Jangraiz & Tariq, Muhammad & Tasleem, Sajjad & Phil
Scholar, M. (2010). Determinants of Parents' Choice in Selection of Private
Schools for their Children in District Peshawar of Khyber Pakhunkhwa Province.
European Journal of Scientific Research. Vol.44 No.1, pp.140-151.
Romanowski, M. H., Cheriff, M. E., Almmari, B. A., & Attiyah, A, (2013). Qatar’s
Educational Reform: The Experiences and Perceptions of Principals, Teachers
and Parents. [online] Available at: http://drbadreya.com/wp-
content/uploads/2017/05/3995-15444 1-PB-with-Michael.pdf.

78
Sandström, F. M., & Bergström, F. (2005). School vouchers in practice: Competition will
not hurt you. Journal of Public Economics, 89(2), 351-380.
Smith, H.H, (2000). The Citizen’s Guide to Planning (3rd Ed). Chicago, Illinois:
American Planning Association.
Taylor, A., & Mackay, J. (2008). Three decades of choice in Edmonton schools. Journal
of Education Policy, 23(5), 549-566.
Taylor, R. J. K. (1996). Variables motivating parents to choose a specific type of private
school. Miami: Florida International University.
Topor, D. R., Keane, S. P., Shelton, T. L., & Calkins, S. D. (2010). Parent involvement
and student academic performance: A multiple mediational analysis. Journal of
Prevention & Intervention in the Community, 38(3), 183–197.
http://doi.org/10.1080/10852352.2010.486297
Virtanen,A., & Runtti,S., (2015). Parents` satisfaction on the quality of education and
care in Qatar-Finland International School. [online] Available at
https://jyx.jyu.fi/dspace/bitstream/handle/123456789/45982/URN:NBN:fi:jyu-
201505211940.pdf?sequence=1
Xu, J. Z., Coats, L. T., & Davidson, M. L. (2012). Making science homework work: The
perspectives of exemplary African American science teachers. Teachers College
Record, 114(7), 1-13.
Zellman, G. L., Ryan, G. W., Karam, R., Constant, L., Salem, H., Gonzalez, G., ... & Al-
Obaidli, K. (2011). Implementation of the K-12 Education Reform in Qatar's
Schools. QNRS Repository, 2011(1), 3653.
79
APPENDIX
Dear Parent if you have kids in schools
We invite you to participate in our research study titled “What do parents want? Study of factors that
influence parental choice of private and public school in Qatar”
The aims of this study will be to identify factors that significantly influence parents in Qatar in their
preference for independent or private schools for their children.
1. Investigate factors that attract parents to either independent or private schools, factors behindtheir preferred schools.
2. Determining effects of independent variables on the parents in choosing either public or privateschool.
3. Providing the administrators and teachers of independent or private schools with factors forpreference on either of the schools.
4. Availing recommendations on Qatar education policy makers to develop quality educationsystems.
The researcher assures you that the results of the analysis will be strictly used by the researcher for study
purposes only and no individuals will be identified from their responses. Please note that there is no right
or wrong answer, therefore, we seek your assistance to be as open, fair, honest as possible as you can in
your responses.
Your participation should take between 5 to 10 minutes. The information collected will be kept strictly
confidential and there are no requests for disclosure of confidential information in the questionnaire. Your
participation is completely voluntary and you may withdraw from this study at any time.
The questionnaire comprises two parts:
1. Demographics1. 2. Factors that may influence the choice of school by the parent (for one child only)
a. Academic performanceb. The relationship between the parents and schoolc. Convenience Factors
If you have any questions you may contact me at
Thank you for your valuable time
Shaima Ibrahim
MBA student/ Qatar University
Supervised by
Prof.Adam Mohamed Ali Fadlalla
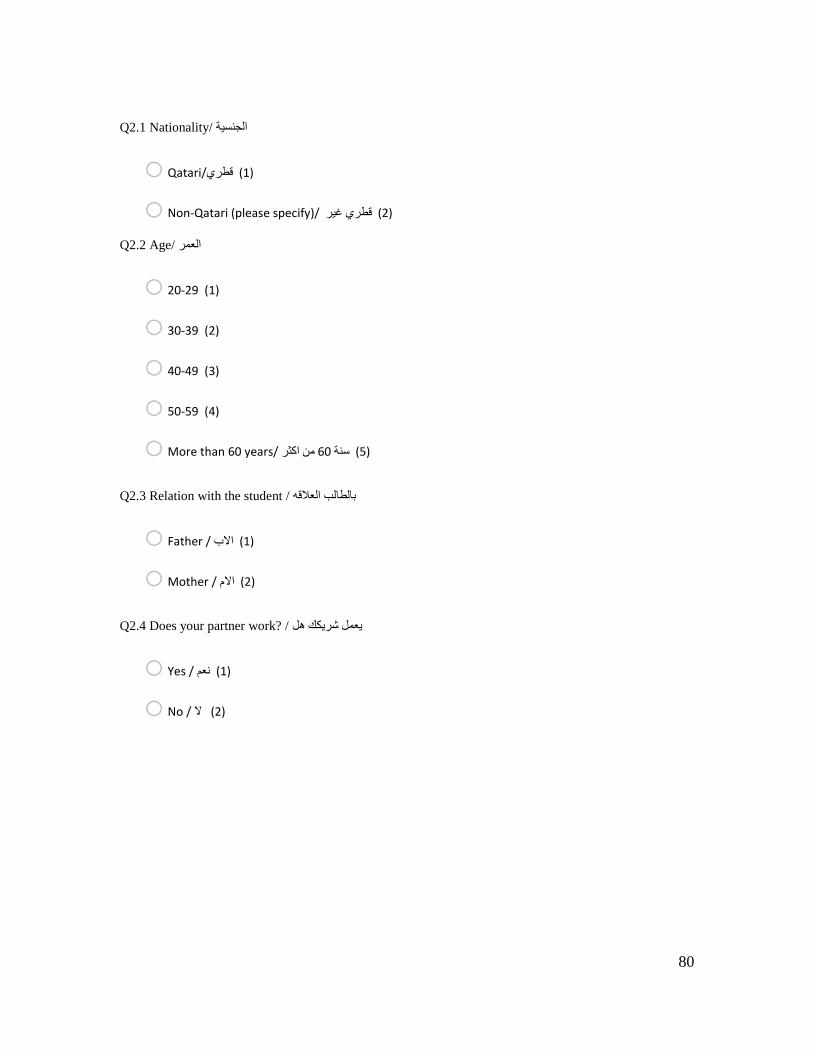
80
Q2.1 Nationality/ الجنسية
o Qatari/(1) قطري
o Non-Qatari (please specify)/ (2) قطري غير
Q2.2 Age/ العمر
o 20-29 (1)
o 30-39 (2)
o 40-49 (3)
o 50-59 (4)
o More than 60 years/ (5) سنة 60 من اكثر
Q2.3 Relation with the student / بالطالب العلاقه
o Father / (1) الاب
o Mother / (2) الام
Q2.4 Does your partner work? / يعمل شريكك هل
o Yes / (1) نعم
o No / (2) لا

81
Q2.5 Your estimated monthly family income /للأسرة الشهـري الدخـل
o Under 5,000 / (1) 5,000 من اقل
o Between 5,000- 9,999 (2)
o Between 10,000 – 14,999 (3)
o Between 15,000 - 19,999 (4)
o Between 20,000-24,999 (5)
o Between 25,000-29,999 (6)
o More than 30,000 / (7) 30,000 من اكثر
Q2.6 Father’s Employment / الأب وظيفة
o Public sector employee / (1) العام القطاع في موظف
o Private sector employee / (2) الخاص القطاع في موظف
o Self-employed / (3) الخاص للحساب العمل
o None / (4) لايوجد
Q2.7 Mother’s Employment / الام وظيفة
o Public sector employee / (1) العام القطاع في موظف
o Private sector employee / (2) الخاص القطاع في موظف
o Self-employed / (3) الخاص للحساب العمل
o None / (4) لايوجد

82
Q2.8 Father’s Education Level /للاب التعليمي المستوى
o Primary School level/ (1) العامة الثانوية من أقل
o Secondary School level/ (2) ثانوي
o Certificate/Diploma/ (3) دبلوم
o Bachelor’s Degree (Undergraduate) / (4) جامعي
o Master/ PhD (Postgraduate) (5) دكتواره / ماجستير
Q2.9 Mother’s Education Level /للام التعليمي المستوى
o Primary School level/ (1) العامة الثانوية من أقل
o Secondary School level/ (2) ثانوي
o Certificate/Diploma/ (3) دبلوم
o Bachelor’s Degree (Undergraduate) / (4) جامعي
o Master/ PhD (Postgraduate) (5) دكتواره / ماجستير

83
Q2.10 Number of children in school / المدارس في الاطفال عدد
Gender/الجنس Type of school/المدرسة نوع
Male (1) Female (2) Independent
school (1) Private school
(2)
Child 1 / 1 الطفل (1) o o o o
Chidl 2 / 2 الطفل (2) o o o o
Child 3 / 3 الطفل (3) o o o o
Child 4 / 4 الطفل (4) o o o o
Chidl 5/ 5 الطفل (5) o o o o
Child 6/ 6 الطفل (6) o o o o
Child 7/ 7 الطفل (7) o o o o
Child 8 / 8 الطفل (8) o o o o
Child 9/ 9 الطفل (9) o o o o
Child 10/ الطفل 10 (10) o o o o

84
Q3.1 Please answer the questions below for one child only/ فقط واحد لطفل أدناه الأسئلة عن الإجابة الرجاء
Q3.2 Your child gender/ ابنتك-ابنك جنس
o Male /(1) ذكر
o Female/(2) انثى
Q3.3 Your child school type/ حاليا فيها يدرس التي المدرسة نوع
o Independent school /(1) مستقلة مدرسة
o Private school/ (2) خاصة مدرسة
Q3.4 Your child educational stage/ الدراسية المرحلة
o Early childhood education/(1) المبكرة الطفولة تعليم
o primary education/(2) ابتدائي تعليم
o Preparatory education/(3) اعدادي تعليم
o secondary education/(4) الثانوي التعليم
Q3.5 Your child school name/ المدرسة اسم
Q3.6 Payment mechanism for your child school / طفلك لمدرسة الدفع آلية
o You pay the full amount by your self /(1) بنفسك المبلغ كامل تدفع أنت
o You get full (100%) support from government/ your work/ الحكومة من (٪100) الكامل الدعم على تحصل / (2) عملك
o You get partial support from government/your work/ (3) عملك / الحكومة من جزئي دعم على تحصل
o It is free / (4) مجاني إنه

85
Q3.7 Academic performance/ العوامل التعليمية I have enrolled my child in the school he/she is currently
studying in because ألحقت ابني بالمدرسة التي يدرس فيها حالياً لان
Strongly
Disagree
(1)
Disagree (2) Don’t know
(3)
Agree (4) Strongly
Agree (5)
The education offered to
students at the school is of
high quality/ المقدم التعليم
جودة ذو المدرسة في للطلاب
(1) عالية
o o o o o
The school is doing a good
job teaching mathematics,
sciences and English/ لان
الرياضيات بتدريس تهتم المدرسة
بشكل الإنجليزية واللغة والعلوم
(2) جيد
o o o o o
The school is doing a good
job teaching subjects other
than subjects mentioned in
2 above/ تدرس المدرسة لان
اعلاه المذكورة غير الاخرى المواد
(3) جيد بشكل
o o o o o
The teaching strategies
used at this school are
innovative/ استراتيجيات
هذه في المستخدمة التدريس
(4) مبتكرة المدرسة
o o o o o
Teachers are well prepared
and highly qualified/
(5) عاليا تأهيلا مؤهلون المعلمونo o o o o
Teachers use advanced
technology to deliver
knowledge to students,
such as computers, smart
boards, projectors, and
social media/ المعلمون يستخدم
المعرفة لتقديم المتقدمة التكنولوجيا
الكمبيوتر، أجهزة مثل للطلاب،
العرض، وأجهزة ذكية، ولوحات
(6) الاجتماعية الإعلام ووسائل
o o o o o
The relationship between
the teachers and students
is very good/ بين العلاقة
(7) جدا جيدة والطلاب المعلمين
o o o o o

86
Class size at the school is
appropriate for effective
learning/ في الطلاب عدد
(8) الفعال للتعلم مناسب الصف
o o o o o
The school provides
additional curriculum,
such as, other languages
and computer sciences/
دراسية مناهج المدرسة توفر
الأخرى اللغات مثل إضافية،
(10) الحاسوب وعلوم
o o o o o
The school provides
extracurricular activities,
such as sports, field trips,
student clubs,
volunteering, etc/ توفر
المناهج خارج أنشطة المدرسة
الرياضة، مثل الدراسية،
ونوادي الميدانية، والرحلات
(11) التطوعي والعمل الطلاب،
o o o o o
The school emphasizes
religion/ نببالجا المدرسة تهتم
(13) الدينيo o o o o
There are prayer rooms/
o o o o o (9) للصلاة غرف هناك

87
Q3.8 The relationship between the parents and school/بالمدرسة الأمر ولي علاقة I have enrolled my child in
the school he/she is currently studying in because لتيا بالمدرسة ابني ألحقت لان حاليًا فيها يدرس
Strongly Disagree
(1)
Disagree (2) Don’t know
(3) Agree (4)
Strongly Agree (5)
The school provides sufficient
opportunities for parents involvement
in the school development/ المدرسة لمشاركة كافية فرصا توفر
اتخاذ في الأمور أولياء تطوير في تسهم قرارات
(1) المدرسة
o o o o o
The school uses technology to provide
parents with information about the progress of students at the school/ المدرسة مثل حديثة تقنيات تستخدم ورسائل الالكتروني البريد
بمعلومات الاباء لتزويد الجوالمأبنائه أداء عن المدرسة في
(2)
o o o o o
Parents’ opinions are considered when
important decisions are made/ نظر وجهة بعين تؤخذ الامور أولياء
القرارات اتخاذ عند الاعتبار (3) المهمة
o o o o o
The school keeps me informed/ تبقي المدرسة باي علم على الامور اولياء
o o o o o (4) جديد

88
Q3.10 Convenience Factors/ عوامل الرضا والراحة
Environment for learning/البيئة التعليمية في المدرسة I have enrolled my child in the school he/she is
currently studying in because
لان حاليًا فيها يدرس التي بالمدرسة ابني ألحقت
Strongly Disagree
(1)
Disagree (2) Don’t know (3)
Agree (4) Strongly Agree (5)
The school environment encourages teaching and
learning/ المدرسية البيئة (1) والتعلم التعليم تشجع
o o o o o
School rules apply equally to all
students/ قواعد تطبق على بالتساوي المدرسة
(2) الطلاب جميع
o o o o o
The school provides a safe and
orderly environment for
learning./ المدرسة توفر (3) للتعلم ومنظمة آمنة بيئة
o o o o o
The school has procedures to avoid
substance abuse (drugs, alcohol)/ إجراءات لديها المدرسة المخدرات تعاطي لتجنب
(4) والكحول
o o o o o
There is no physical abuse (knives) at the
school/ أي توجد لا في (السكاكين) جسدية إساءة
(5) المدرسة
o o o o o
Cheating is strongly not tolerated at the school/ مع التسامح عدم
(6) المدرسة في الغش
o o o o o

89
The school provides safe
transportation for the students / لتوفر
البيت من للطلبة الامن النقل (7) والعكس المدرسة إلى
o o o o o
Proximity of the school’s location/ موقع من المدرسة لقرب
(8) سكني
o o o o o
Q3.11 Do you have any additional comments, opinions, or concerns you would like to share? أي لديك هل
مشاركتها؟ تود إضافية آراء أو تعليقات
________________________________________________________________
________________________________________________________________
________________________________________________________________
________________________________________________________________
________________________________________________________________