qatar university college of engineering operational …
TRANSCRIPT
QATAR UNIVERSITY
COLLEGE OF ENGINEERING
OPERATIONAL MODEL ANALYSIS AND FINITE ELEMENT MODEL UPDATE
USING AMBIENT VIBRATION DATA FOR AL-SINYAR TOWER
BY
KHALID AL-KHAMIS
A Thesis Submitted to
the Faculty of The College of
Engineering
In Partial Fulfillment
of the Requirements
for the Degree of
Masters of Science in Civil Engineering
January 2018
© 2018. Khalid Al-Khamis. All Rights Reserved.

ii
COMMITTEE PAGE
The members of the Committee approve the Thesis of Khalid Al-Khamis
defended on 14/12/2017.
Dr. Mohammed Farouk Mohammed Hussein
Thesis/Dissertation Supervisor
Dr Iman Hajirasouliha
Committee Member
Dr. Mohammad Roshun
Committee Member
Approved:
Khalifa Al-Khalifa, Dean, College of Engineering

iii
ABSTRACT
AL-KHAMIS, KHALID, M., Masters : January : [2018], Masters of Science in Civil Engineering
Title: Operational Model Analysis and Finite Element Model Update using Ambient
Vibration Data for Al-Sinyar Tower
Supervisor ofThesis: Dr. Mohammed Farouk Mohammed Hussein.
Buildings in Qatar rely on minimum structural code requirements implemented by
design consultants’ offices. Qatar 2030 vision considers increasing of structures’
sustainability and serviceability as a high priority, which require testing structures under
real full scale modeling.
The process of monitoring structures’ behavior over time for aerospace, civil and
mechanical engineering infrastructure is referred to as structural health monitoring (SHM).
In Qatar, most high-rise building stability design is based on wind loading. According to
Uniform Building Code3 1997 (UBC1997) which classifies seismic zones on a scale of
zero to four, Qatar’s seismic classification on the scale is zero which is the minimum
seismic risk value. Qatar Meteorological data on wind speeds enabled analysis of extreme
winds to be undertaken in structural designs.
This study aims to identify dynamic properties of the structural by using wired and
wireless accelerometers in order to assess structural performance to update Finite Element
Model (FEM). By updating FEM, engineers are enabled to support clients to make quick
and correct decisions in extreme emergency situations in the case of boundary conditions

iv
changes and loads such as seismic vibration and wind pressure changes, during a
structure’s life. The objective of this research is to apply and evaluate a single output-only
procedure on a reinforced concrete tower building, Al Sinyar Tower, which consists of
2B+G+52 floors in Al Dafna Area in Qatar, with a total built up area of 74,747 sqm and is
the tallest residential building in Qatar with a total height of 230 m . A Finite Element
model using Sap2000 program was used to model and analyze building values in order to
compare results with the real test results. The different forms of response data from ambient
vibration were scrutinized to evaluate structure performance. Mode shapes, natural
frequencies, modal damping ratios were studied, while the results of tests carried under
ambient conditions were used to update the Finite Element model based on modules of
elasticity, density and also connections fixity.
The thesis concluded that wired sensors are not practical to use for low frequencies
measurements in high rise buildings and that it is tremendously challenging and difficult to
deal with more than 1000 meter long cables, especially with a very sensitive devices. Frequencies
values from wired sensors could not been captured, whereas wireless connection provided
more reasonable values. Ambient vibration results based on as-built environment provided
higher frequency values in comparison to FEM because the stiffness provided by cladding,
façade and walls eventually increased the system’s stiffness, which cannot be revealed in
FEM based on structural drawings only. The foremost concept of Model Updating is to
have an ideal simulation of structure that can represent real structure behavior. The Final
Updated model results founded satisfactory according to modal assurance criterion (MAC)
value with 98.9% and frequency deference errors average of 7.6%.

v
DEDICATION
This thesis is dedicated to a number of people, without whom it might not have been
completed, and to whom I am deeply indebted. To my parents and parents-in-law who
supported me in every day of my journey and were always a source of love and
encouragement. To my dear wife who remains willing to engage practically and
emotionally in supporting my work and igniting my commitment. It is also dedicated to
special friends and colleagues who were tremendously and continuously supportive. For
them I extend my deepest gratitude.

vi
ACKNOWLEDGMENTS
To begin with, I am profoundly grateful to Allah for the countless blessings and
bounties, with which he has enabled me to progress and succeed in my thesis.
I would like to express my profound appreciation to my professors, Dr. Onur Avci
and Dr. Mohammed Hussein, who were tremendously generous with their deep knowledge
and valuable time.
Many sincerely felt thanks to Engineer Osama Abdeljaber who undertook the
painstaking task of reading and reflecting on my work throughout the entire journey and
supervised my work on daily basis.
I owe special thanks and appreciation to Project Manager Mr. Kaied Abo Daya
from Derwind trading and contracting Company for his continuous support in site location
during experimental tests.
I owe sincere gratitude to Qatar University’s different departments for enabling me
to undertake my research by providing continuous assistance when demanded.
Particular thanks to the members of the Department of Civil Engineering for their
unrelenting support.
Additional appreciations go to all teachers and mentor-teachers I have ever worked
with, for their critical ideas and passionate discussions have been and will always be an
endless source of inspiration.

vii
TABLE OF CONTENTS
DEDICATION ........................................................................................................................... v
ACKNOWLEDGMENTS .......................................................................................................... vi
LIST OF TABLES ..................................................................................................................... ix
LIST OF FIGURES ................................................................................................................... xi
CHAPTER 1: INTRODUCTION AND LITERATURE REVIEW .............................................. 1
1.1 Modal Analysis in Structure Vibration ............................................................................... 3
1.2 Excitation in Model Analysis............................................................................................. 5
1.2.1 Forced Vibration......................................................................................................... 7
1.2.2 Ambient vibration ....................................................................................................... 8
1.2.3 Free Vibration ............................................................................................................ 8
1.3 Experimental Modal Analysis (EMA) ................................................................................ 9
1.4 Operational Modal Analysis (OMA). ............................................................................... 15
1.5 Modal Analysis Preliminary Concepts ............................................................................. 20
1.5.1 Frequency Response Function (FRF) ........................................................................ 22
1.5.2 Frequency-Domain Decomposition FDD .................................................................. 23
1.5.3 Signal Processing and data sampling: ........................................................................ 23
1.6 Operational Model Analysis - Practical Application ......................................................... 24
1.6.1 Structure Health Monitoring (SHM) ......................................................................... 24
1.6.2 Damaged detection methodology .............................................................................. 26
1.6.3 Historical Building health Assessment ...................................................................... 29
1.6.4 Updating FEM model During Construction stages .................................................... 32
1.7 Motivation and Focus of the Thesis ................................................................................. 33
CHAPTER 2: FINITE ELEMENT MODEL (FEM) .................................................................. 37
2.1 Model Description – Al- Sinyar Tower ............................................................................ 37
2.1.1 Location of the Tower .............................................................................................. 37
2.1.2 Structure Specification .............................................................................................. 38
2.1.3 Tower Design Aspects and Techniques: .................................................................... 39
2.1.4 Tower layout ............................................................................................................ 41
2.1.5 Modules elasticity used in FEM ................................................................................ 43
2.1.6 Tower Concrete grades and specifications ................................................................. 43
2.1.7 Reinforcement strength for structure elements .......................................................... 44
2.2 FE Modeling Process for Al Sinyar Tower ...................................................................... 47
2.2.1 Model Geometry....................................................................................................... 48
2.2.2 Model Assumptions .................................................................................................. 49

viii
2.2.3 Material properties of structure ................................................................................. 50
2.2.4 Section properties ..................................................................................................... 51
2.2.5 Defining elements of FEM ........................................................................................ 52
2.2.6 Procedure of solution using SAP2000 Program ......................................................... 53
2.3 Mode Shapes and Natural Frequencies ............................................................................ 54
2.4 Elements Meshing ........................................................................................................... 54
CHAPTER 3: AMBIENT VIBRATION TEST ......................................................................... 59
3.1 Introduction..................................................................................................................... 59
3.2 Selection of the Measurement Scheme ............................................................................. 60
3.3 Transducers ..................................................................................................................... 61
3.3.1 Test using Wired Transducers ................................................................................... 62
3.3.2 Test using Wireless Transducers ............................................................................... 65
3.4 Sensor Installation ........................................................................................................... 67
3.5 OMA using ME ‘Scope ................................................................................................... 69
3.6 Model Identification ........................................................................................................ 69
3.7 Comparison between FEM and Experimental Values ....................................................... 74
CHAPTER 4: MODEL UPDATING ......................................................................................... 77
4.1 Introduction..................................................................................................................... 77
4.2 Optimizing of Density ..................................................................................................... 77
4.3 Optimizing of Modules of Elasticity ................................................................................ 80
4.4 Final Model Update ......................................................................................................... 83
CHAPTER 5: Conclusions And recommendation ...................................................................... 86
REFERENCES ......................................................................................................................... 88
APPENDICES .......................................................................................................................... 93
Appendix A: Columns Elements Arrangement ...................................................................... 94
Appendix B : Shape Matrix ................................................................................................... 97

ix
LIST OF TABLES
Table 1 : Comparison Of Data Output Steel Grid From Different Papers In (Laboratory
Modeling, FE Modeling) ............................................................................................... 17
Table 2: Typhoon York Behavior Study From Two University (Hong Kong, Tsing Hua)
...................................................................................................................................... 20
Table 3: Tower Area And Floors ................................................................................... 39
Table 4: Concrete Grade Distribution ............................................................................ 44
Table 5 : Material Properties - Steel Data ....................................................................... 50
Table 6 : Material Properties Concrete Data ................................................................... 50
Table 7: Frame Section Properties ................................................................................. 51
Table 8: Area Section Properties .................................................................................... 52
Table 9: Element Meshing Size ..................................................................................... 55
Table 10 : Natural Frequencies And Damping Ratios For Each Mode From Experimental
Test ............................................................................................................................... 74
Table 11: Comparison Between Frequencies Obtained From Experimental And FEM
Values ........................................................................................................................... 75
Table 12 : Optimization Values – Density Parameter ..................................................... 78
Table 13 : Comparison Between Frequencies Obtained From Experimental And FEM
Update- Density Parameter ............................................................................................ 79
Table 14 : Optimization Values – - Elasticity Parameter ................................................ 81
Table 15 : Comparison Between Frequencies Obtained From Experimental And FEM
Update- Elasticity Parameter.......................................................................................... 82
Table 16 : Optimization Values – Final Model Update 1/2 ............................................. 83

x
Table 17 Optimization Values – Final Model Update 2/2 ............................................... 84
Table 18 : Comparison Between Frequencies Obtained From Experimental And Final
Model Update ................................................................................................................ 84

xi
LIST OF FIGURES
Figure 1. Diaphragms Produce Rigid Body. ("World Of Anti-Vibration Engineering.,") ..2
Figure 2. Point A – D Characterize Stage Of Acceleration Of Corrosion ("Effective
Repair And Maintenance Strategies For Parking Structures," 2015) .................................2
Figure 3. Concrete Cracks Deterioration. (Baiant, 1975). .................................................3
Figure 4. Theoretical Sequence Of Vibration Analysis. ....................................................4
Figure 5. Modal Response Sequence (Operational Model Analysis (OMA)) ....................5
Figure 6. FRF And FDD - Peak Picking ...........................................................................7
Figure 7. Roving Hammer Test. ..................................................................................... 11
Figure 8. Shaker Device Test. ........................................................................................ 11
Figure 9. Steel Gird Testing (Gul & Catbas,2010). ......................................................... 12
Figure 10: Reponses From Impact And Ambient Tests (Burkett, 2005) .......................... 14
Figure 11. Finite Element Model For Steel Grid (Burkett, 2005). ................................... 14
Figure 12. FRF Spectrum ............................................................................................... 22
Figure 13. Sample Of Measured Acceleration At All Levels Of Khalefa Tower
(Abdelrazaq) .................................................................................................................. 25
Figure 14. SHM And Damaged Detection System ......................................................... 28
Figure 15.A. Cathedral Of Monza (Modena Et Al., 2004), 15.B. Trabzon, Turkey
(Bayraktar, Türker, Sevım, Altunişik, & Yildirim, 2009), 15.C. University Of Coimbra
(Modena, Lourenco, & Roca, 2004) ............................................................................... 30
Figure 16: Sinyar Tower 1/3 .......................................................................................... 35
Figure 17. Sinyar Tower 2/3 .......................................................................................... 36
Figure 18. Sinyar Tower 3/3 .......................................................................................... 36
xii
Figure 19. Al Dafna/Qatar ............................................................................................. 38
Figure 20. Moment And Horizontal Loading Disruption ................................................ 40
Figure 21. Tower Shear Core Under Wind Loading ....................................................... 41
Figure 22. Floor 52 During Construction Stage .............................................................. 42
Figure 23. Summary Of Concrete Grad And Strength .................................................... 45
Figure 24. Structural Layout .......................................................................................... 46
Figure 25. FEM MODEL ............................................................................................... 48
Figure 26. FEM MODES ............................................................................................... 57
Figure 27: Wired Sensors , Accessories And Cable Termenation ................................... 63
Figure 28: Validation Test For Wires Sensors ................................................................ 64
Figure 29: Wireless Sensors Setup – TROMINO- .......................................................... 66
Figure 30: Sensors Location .......................................................................................... 68
Figure 31: Acquisition Window Showing The Sampling Tab ......................................... 70
Figure 32: Cross Power Spectral Density Of Two Modes . ............................................. 71
Figure 33: First 10 Mode Shape From Me’Scope . ......................................................... 73
Figure 34: MAC Values ( FEM / Experemental ) ........................................................... 76
Figure 35: MAC Values (FEM Update By Density Parameter/ Experimental)................ 80
Figure 36: MAC Values (FEM Update By Elasticity Parameter/ Experimental) ............. 82
Figure 37: MAC Values (Final Model Update/ Experimental) ....................................... 85

1
CHAPTER 1: INTRODUCTION AND LITERATURE REVIEW
Strength, Safety and durability of complex structure such as towers and bridges play
a very important role to societies economic and owners perspectives. In high rise buildings,
it is very important to ensure adequate stiffness to resist lateral forces induced by wind or
seismic or blast effects. These forces can develop high stresses and produce a sway
movement or vibration that can cause a discomfort to the occupants. Concrete shear walls
and columns which have high in plane stiffness with the floor contribution will act as a
diaphragm in each floor that will displaced in its horizontal plan as rigid body (Figure 1).
A structure is undergoing free vibration when it is disrupted from its static equilibrium
position and then allowed to vibrate without external dynamic excitation. Analytical
solution of equation of motion is usually not possible if the excitation applied forces or
ground acceleration varies arbitrary with time and the system of the load applied is
nonlinear. When we design a structure against earthquake and wind, one of the most
recommended methods by design specifications is “response spectrum analysis” (Freeman,
Nicoletti, & Tyrell, 1975) in which rather than time history analysis, maximum responses
are estimated by this method. As structures aging and deteriorating over time due to
creeping and shrinkage of concrete, the durability and structure serviceability have become
a highly researched area (Baiant, 1975). Therefore, structure deteriorations need a repair
and maintenance when needed. Building repaired at early stage will reduce cost of
maintenance (Figure 2 and 3).

2
Figure 1. Diaphragms produce rigid body. ("World of Anti-Vibration Engineering.,")
Figure 2. Point A – D characterize stage of acceleration of corrosion ("Effective repair and maintenance strategies for
parking structures," 2015)

3
Figure 3. Concrete cracks deterioration. (Baiant, 1975).
1.1 Modal Analysis in Structure Vibration
To study structure vibration and analyze structure response to obtain modes,
frequencies and modal parameters, engineers use two main methods: a theoretical
sequence; and modal response sequence. The theoretical sequence for vibration analysis
is demonstrated in (Figure 4) which clarifies the progress of a typical vibration analysis
through three stages. In general, the analysis begins with the specification of the physical
attributes of the structure, typically in terms of its damping properties, stiffness and mass,
which are attributed to the spatial model. Subsequently, an analytical modal analysis is
performed on the spatial model in which the behavior of the structure is denoted as a
group of vibration modes, or otherwise, the modal model. The latter is, by definition, a
group of natural frequencies with their analogous modal damping factors and mode
shapes. The numerous ways in which natural vibration could occur in the structure are
always described by this solution. The next phase reveals information about the excitation
conditions. Obviously, this will be determined not only by the structure characteristics

4
but also by the magnitude and nature of the exposed excitation and thus countless
solutions of this kind will be available. Nevertheless, it is favorable to proffer a study of
the reaction of the structure to a ‘standard’ excitation and to refer to this analysis as the
response model. A unit-amplitude sinusoidal force (Kuroiwa, 1967) that is applied to the
structure at every point independently and at each frequency within the indicated range
might be a standard excitation. Consequently, the response model will comprise a group
of Frequency Response Functions (FRFs) that should be determined over the pertinent
frequency range (Ewins, 1984).
Structure
Description, and
Specification
Vibration
Modes
Response level
SPATIAL
MODEL MODAL
MODEL RESPONSE
MODEL
Mass, Stiffness,
Damping
Natural
Frequencies, Mode
Shapes
Frequencies
Response, Impulse
Response
Figure 4. Theoretical sequence of Vibration Analysis.

5
Through this thesis study, attention will be focused on the three phases and forms
of model – spatial, modal and response – then it is crucial to comprehend their mutuality
as it is upon this property that the modal testing principles are originated. It is also viable
to advance from the spatial model via the analysis of the response. As can be concluded
from (Figure 4), an analysis could be undertaken reversely. Modal and spatial properties
can be deduced. This, otherwise defined as the vibration analysis ‘experimental route’, is
presented in (Figure 5).
1.2 Excitation in Model Analysis.
There are four categories of testing scheme: Single Input Single Output (SISO),
Single Input Multiple Output (SIMO), Multiple Input Single Output (MISO) and Multiple
Input Multiple Output (MIMO). The subject of this study focuses on output-only modal
tests which are of the MIMO type since there are assumptions made about the input. (Gul
& Catbas, 2008). This paper, referring to peak picking method, uses the information that
Response
Properties
Vibration
Modes
Structural Model
Figure 5. Modal Response Sequence (Operational Model Analysis (OMA))

6
the dimension of (Frequency Response Function-FRF) becomes very high as it is
approaching the same natural frequencies of the structure. Frequency response function
expresses the tower or bridge response due to excitation force as a function of frequency
(Brincker, Zhang, & Andersen) demonstrates the modal parameters of the structures such
as damping, stiffness and resonance frequency situation with output data. FRF method can
be categorized as time-domain and frequency-domain. Ren & Zong, 2004 state that the
spectral density of ambient vibration of structure is used as another method of FRFs.
(Frequency Domain Decomposition-FDD) has been used for ambient investigation to
mitigate the frequency output from FRF by using the Singular Value Decomposition -SVD
of the output spectrum matrix. This method also called Complex Mode Indicator Function
- CMIF (Catbas et al.; Peeters & De Roeck, 2001).
In spite of the dissimilarities in terms of excitation, the same three steps involved
in the typical input-output testing make up the output-only modal testing:
• Tests planning and execution: this phase involves defining the experimental
setup (cable paths, attachment of sensors, sensor layout, measurement chain, etc.) as well
as the data gathering parameters (sampling frequency, duration of records).
• Data analysis and the modal parameters identification: this stage
encompasses validating and pre-treating (decimation, filtering, etc.) the collected data,
performing several signal processing operations (e.g. for the computation of random
decrement functions, PSD functions, transmissibility functions, correlation functions, etc.),
besides estimating the modal parameters.
• Finally, Validation of the estimates of modal parameters.
In this field of research, three different tests used to identify the behavior of

7
structure depending on the way of excitation used. Those types illustrated briefly below
(Figure 6). The type of vibration forces demand according to the parameters that the
research need to identify.
Figure 6. FRF and FDD - Peak Picking
1.2.1 Forced Vibration
Excitation of known force by a designed excitation machine such as hummers or
mass shakers gives frequencies of interest and the Structure characteristics in any direction
horizontally or vertically. The type of forces provided contains liner mass which is a liner
force of steady state or eccentric mass that import sinusoidal force. This type of structure

8
test should be in a closed environment in order to operate this kind of forcing and usually.
Also, the size of structure must be modelled properly to have an accurate approximation of
data analysis and results (Peeters & De Roeck, 2001).
1.2.2 Ambient vibration
This type of test is related to the unknown excitation of forces that are not under
control. Data collection from the structure will give an estimate of the dynamics
characteristic of structure and the main parameters. Excitation forces can be from sources
like wind, seismic earthquakes, pedestrians and any activities that case vibrations of
structure. This type of assessment is related to structures with lack of data and information
and engineers use this type of test widely in real structure analysis because of the non-
linearity systems exhibited in the real structure (Ivanovic, Trifunac, & Todorovska, 2000).
1.2.3 Free Vibration
Tests that contains an initial input that will impact a structure to introduce a change
in an initial static equilibrium. The response is disrupted from the allowable freely
movement of structure with no external force applied to structure during this free vibration.
System will lose energy because of damping properties of the structure and the energy will
decay. It is difficult to apply this test in a large structure and full-scale structures. However,
modelling and testing will give a good indication of behavior of damping and frequency
properties of the real structure (Mottershead, Friswell, Ng, & Brandon, 1996).
Inaccuracies associated with model setting and discretization result in modal
parameter estimates that are, predominating, not completely reliable. Consequently, a
numerical model does not usually represent the structure’s actual dynamic behavior; hence

9
a correction is necessary to increase its reliability and proximity to the experimental
observations. The correction is established according to the evaluation of the link between
numerical and experimental modal properties’ estimates as well as a guided model
modification, with the aim of predicting the structure’s dynamic behavior more reliably
after the update. The model validation or otherwise, calibration guarantees increased
accuracy in predicting the structure’s vibration response to different stimuli and further
reliability in evaluating the impacts of perilous natural or artificial events. Damage
detection is one more typical use of the updated model (Teughels & De Roeck, 2004).
The estimated modal parameters help in forecasting the impacts of structural
modifications as well as assessing several solutions for the vibration issue without going
through the expensive costs usually accompanying actual interferences. Supposing that the
structural modifications are adequately slight, a linear sensitivity analysis facilitates
identifying the structure’s most sensitive parts for applying the structural modification and
solving the vibration issue. SHM and Damage detection are relevant fields of use of the
identified modal parameters.
1.3 Experimental Modal Analysis (EMA)
Supposing that a structure’s dynamic behavior can be seen as a group of modes,
each one categorized by some parameters such as mode shape, damping ratio or natural
frequency. This parameters values vary depending on boundary conditions, material
properties and geometry which can be identified by Experimental Modal Analysis (EMA)
using measurements of the vibration response and the applied force. Over the past few
decades, ground-breaking inventive methods for understanding and controlling vibrations,
design optimization as well as structures’ performance and health state assessment have

10
been provided by the system identification principles and the modal parameters’
experimental estimation (Rainieri & Fabbrocino, 2014). Although the rapid evolution in
computing technologies besides the Finite Element (FE) technique have made outstanding
analysis tools accessible to the technical community, the innovation and advancement of
high-performance materials and the structures’ growing complexity have demanded
powerful tools to validate and aid the numerical analyses. In this framework, identifying
modal properties experimentally undeniably assists professionals to obtain in-depth
physical perception about a structure’s dynamic behavior and to differentiate between
errors caused by discretization and those created by incorrect modeling assumptions. There
are many examples of an EMA tests such as Impact Testing by measuring multiple inputs
and their corresponding values from single row of Frequency Response Function (FRF)
matrix. This impact inputs usually by using roving hammer (Figure 7) or also shaker test
by using shaker device to measure multiple outputs and their equivalent values from single
columns of FRF matrix (Figure 8) (Schwarz & Richardson, 1999).

11
Figure 7. Roving hammer Test.
Figure 8. Shaker device Test.
Laboratory studies were conducted in many research papers to demonstrate the
efficiency of the methodology. Researchers apply an excitation in a lab model and study

12
the impact of these loads. This methodology can be extended to a complex and compound
experiment structure.
Steel grid is usually used in many lab structure material studies (Figure 9) and the
main purposes are to confirm the EMA methods, to discover novel technologies, and to
standardize applications that can then be conducted on complex structures such as towers
and bridges. The structure is generally designed to have the dynamic characteristics of
bridges. The bridges sizes and dimensions vary from paper to paper such as (Burkett, 2005;
Gul & Catbas, 2010). Put the most important thing is that researchers provide a comparison
between lab test and finite element modeling by using software. Before applying force to
study the impact and ambient vibration assessment a Finite Element method (FE) (Figure
10) was prepared to model steel grid in order to calculate the dynamic properties of the
structure.
Figure 9. Steel gird testing (Gul & Catbas,2010).

13
Then, impact tests were conducted to confirm the ambient vibration results. The
model bridges were excited by an impact hammer with random excitation on the structure
generated by gradual hits in the model at different locations simultaneously. Then the
acceleration data where taken by using the accelerometers sensors.
The analysis as mentioned before for all researchers was planned to be carried out
until 150 Hz the preliminary (FE) model (Figure 10) after designing the models of bridges
also shows that 0–150 Hz frequency range will be sufficient to obtain the modes exists on
the model. The unscaled function were adjusted by an averaged data to mitigate problems
when reaching the stage of FFT process. For example, leakage and miscorrelation of points
(Fladung & Rost, 1997). After this iteration, the unscaled functions where used to FRF by
taking FFT. This FRF data where used in CMIF and the CMIF curves where obtained for
impact excitation and ambient tests. Plotting CMIF after RD mitigation where give an
indicator of steady and smooth plotting in a very good correlation with a smaller amount
of noise which give a clear resonance peaks. After that; researchers selected the peaks using
CMIF curves. Then the damping ratio, natural frequency values, and mode shapes where
obtained by FRFs. (Figure 10).

14
Figure 10: Reponses from impact and ambient tests (Burkett, 2005)
Figure 11. Finite element model for steel grid (Burkett, 2005).

15
Results of the FE model shows higher values more than experimental models, this
happened because of the factor of safety with the known input in designs codes for real life
structure. Noting that; Impact and ambient are a quick method that can supply us a good
indications and results.
1.4 Operational Modal Analysis (OMA).
Basically, OMA is the modal testing method through which the structure’s modal
parameters could be experimentally estimated based solely on dynamic response
measurements. The idea behind this procedure is to exploit the freely available natural
excitation caused by ambient forces along with operational loads such as wind or earth
quick to substitute simulated excitation. Accordingly, instead of being regarded as
disturbance, they facilitate large structures’ dynamic identification. Since this method
prerequisite nothing other than the structure’s vibration response measurements in
operational conditions, while being exposed to the ambient excitation, OMA is also called
“output-only modal analysis” or “ambient vibration modal identification”. OMA is
tremendously appreciated in the civil engineering field, since tests are fast and inexpensive,
besides creating no interference with the structure’s normal use. Additionally, the
structure’s actual behavior in its operative conditions is well represented by the identified
modal parameters, since it uses natural excitation instead of artificial one. From research
papers studied in this knowledge area, researchers and engineers apply methods of
operational modeling to study structure health monitoring (SHM) and also to update finite
element model from practical measurement collected from building under natural ambient
vibration (Chang, Flatau, & Liu, 2003) (Park, Sohn, Farrar, & Inman, 2003).
Damping ratios of the structure when applying a forced impact and ambient tests

16
are in good correlation where the values founded are smooth and reasonable and that
correlation happened because of the mitigation for modes. The frequency varies among
experimental approaches in research papers, however a comparison between (FE) and
(impact and ambient) provide by each researcher (Michel, Guéguen, El Arem, Mazars, &
Kotronis, 2010). The proposed method for unknown inputs perform accurate values of
frequency and mode shape that is correlated with the results. Resolution of the FE model
shows higher values more than experimental models, this happened because of the
accelerometers absorption of energy and this issue will be mitigated in real life structure as
a factor of safety with the known input case. Impact and ambient are a quick method that
can supply us a good indications and results.
Experimental modal parameter identification and the data input and output were set
in (Table 1) for 5 modes as an example of approaching the system frequency by impact
and ambient method. This data is generally identified by methods for identification
unknown modal properties of a system. Relationships between the experimental and
numerical approaches for modal limitation have been addressed and in (Table 1) there is a
good indication of the coloration between the data sets.

17
Table 1
Comparison of data output steel grid from different papers in (Laboratory Modeling, FE
Modeling)
Researches provided an understanding about model dynamic testing by using
software as finite elements modals with all known data of the structure as computerized
simulations. Then, comparing this data with a model of the same structure in lab with an
excitation of known forces using necessary calibration and mitigation to simulate actual
structures, after those comparing results with another test using unknown forces excitation
on the same modal. Therefore, after those three tests, a full-scale testing were shown in
(Table 1) a collection of date that give a proven truth about structural performance without
known of the energy of excitation and the stiffness of structure. This evaluation gives a
way to use it as advanced assessment of structural condition, detection of damage, dynamic
performance and structure health monitoring with an unknown stiffness and unknown
excitation in real structures construction quality, validation of design assumptions, and also
as lessons for future design and construction of similar structures.
Grid/Deck Model Test Results By
Korhan (Ciloglu, 2006)
Steel Grid Model Test Results By
Mustafa (Gul & Catbas, 2008)
Steel Stringer Bridge Modal Test By
Catbas (Catbas Et Al.)
MODE Impact
(Hz)
Ambient
(Hz)
%
diff
MODE Impact
(Hz)
Ambie
nt
(Hz)
% diff MODE Impac
t (Hz)
Ambie
nt (Hz)
%
diff
1 5.04 5.05 0.19 1 22.37 22.38 0.04 1 1.64 1.69 3.04
2 7.8 7.8 0 2 22.70 27.03 19.07 2 1.9 1.86 -2.10
3 17.84 17.97 0.72 3 33.38 33.44 0.18 3 3.69 3.7 0.27
4 22.29 22.44 0.67 4 40.91 40.96 0.12 4 4.86 4.97 2.26
5 28.09 28.59 1.78 5 64.93 64.88 -0.07 5 5.33 5.28 -0.93

18
Furthermore, as the vibration response arises from modes, that are mainly
properties of the structure, enormous vibration responses are yielded by magnifying loads
at resonant frequencies, which can cause damage or discomfort. Identifying modal
parameters regularly as well as analyzing their variation can aid the structural performance
and integrity assessment. Thus, lately, the attention of civil engineers has been more
concentrated on the opportunities which Operational Modal Analysis (OMA) provides.
Kaynardağ & Soyoz, 2017 , represent a model study for 26 floor building in Istanbul
constructed based on design drawings and updated to optimize the actual mode shapes and
frequencies of the building. Results present that frequency from ambient test were less than
frequencies obtained from FE model and the updated FE model had an Error percentage of
1.5%.
FE modeling and ambient vibration tests were used to test two towers commercial
building in Shenzhen city (Zhou, 2008) and the dynamic characters and natural frequency
of the buildings have been obtained and results from the updated model shows a percentage
error of 1.8%. It can be realized that the stiffness of the structure is larger, if we compare
it with FE model by 1.7 times. This increase in stiffness provided by wall, façade and other
facilities
Brincker, Ventura, & Andersen (2003) , demonstrate the possibility to use ambient
vibration as a modal identification technique to modify and improve FE model on fifteen
story building. Author present a behavior study for two high-rise building located in
Vancouver. Modes shape, Natural frequencies and damping were determined
experimentally and analytically using FE. Frequencies for ambient vibration value is

19
0.68Hz and for Finite element model is 0.402 Hz for both testes.
From this paper and as shown in table 1 before, the period values obtained from FE
modeling are larger than ambient vibration and this because of the assumption during FE
modeling such as moment of inertia were assumed to be constant however its varies in
columns weak axis. Furthermore, the density and stiffness parameters for the building seem
that it was overestimated. This conclusion from author perspective highlight our
assumption that FE model will give us a lower frequency as stiffness provided by cladding,
façade and walls eventually will increase system stiffness that cannot be reflected in FE
modeling based on structure drawings only.
As features of SHM expanded in last few years, engineers decided to design sensors
to measure more than the structure behavior. Such as wind characteristics, guest factor,
wind spectrum, turbulence intensity and also concrete settlement (Xua, 2000). This paper
studies the wind characteristics and structure deformation in Typhoon York building
located in Hong Kong - 69 stories reinforced concrete -. The validation of structure
properties in this research allow the author to evaluate the response of the structure during
earthquake. Displacement and deformation where measured from two university as the
following table (Table 2).

20
Table 2
Typhoon York behavior study from two university (Hong Kong, Tsing Hua)
Hong Kong Polytechnic University,
Ambient Test Lateral Longitudinal Torsional
Frequency 0.170 Hz 0.201 Hz 0.280 Hz
Damping 1.07% 0.99% 1.36%
Tsing Hua University
Ambient Test Lateral Longitudinal Torsional
Frequency 0.178 0.210 0.298
Damping 1.02% 0.96% 0.78%
FE Model
Frequency 0.186 0.201 0.370
Frequency Domain Decomposition (FDD), Random Decrement Technique (RDT)
and Basic Frequency Domain (BFD) where used to identify the structure behavior in
(Lorenzo, Mercerat, d'Avila, Bertrand, & Deschamps, 2015) these three methods are
techniques in Operational Modal Analysis (OMA) depending on ambient vibration testing.
The authors in this paper present results from FE and ambient vibration in tall building that
have 22 story Reinforced concrete - located in Nice, and results error were less than 2%.
1.5 Modal Analysis Preliminary Concepts
In order to elucidate the comprehensive context of the notions demonstrated in this
research and to set some terminology, an introductory discourse about systems and signals
is undeniably worthwhile. The indispensable cultural background prerequisite to approach
the discussion of OMA is obliquely defined by the summarized concepts about structural
dynamics, signals and systems.

21
A signal, by definition, is any physical quantity that is dependent on a single or
numerous independent variables and linked to data of interest. An input signal is converted
into an output signal by a system. Significant information about a system could be revealed
through plotting the response to a certain stimulus. For example, analyzing a building’s
swinging (output signal) due to wind load, which can be considered an input signal,
supports and facilitates the study of the modal specification of the structure. Problems in
engineering are typically classified as forward problems; they intend to approximate the
response of a certain system to a particular input. Nevertheless, the focus of this research
is on another type known as inverse problems, where neither the system characteristics nor
the input are unknown but the output is known. Specifically, this study examines the
identification of the system characteristics given the output signal (besides several
assumptions regarding the input). (Rainieri & Fabbrocino, 2014)
Noise is a term that denotes any unsought signal that overlays the desired signal.
The noise amount in a signal is measured by the Signal-To-Noise Ratio (SNR), in decibels
(dB) as follows:
𝑆𝑁𝑅 = 20 log (𝐴𝑠
𝐴𝑛) Equation 1.5.1
where As stands for the signal amplitude and An refers to the noise amplitude, both
expressed in the same units. When the value of signal-to-noise ratio is small, the desired
signal can become indiscernible. Hence, proper data gathering approaches should be
implemented to diminish the noise level that inescapably impacts measurements. (Johnson,
2006).

22
Generally, structure’s dynamics can be defined and expressed in terms of its
stiffness, mass and damping properties, or in terms of the properties of its vibration (mode
shapes, damping ratios and natural frequencies) or, otherwise, in terms of its response to a
particular stimulus.
1.5.1 Frequency Response Function (FRF)
A frequency response function expresses the structural response to an applied
excitation as a function of frequency. When a structure is subjected to any excitation, the
period of the response will be different than that of the excitation. The phase variation
among the response and the excitation will be different according to frequency. The
characteristics of the structure that explain its response to excitation as the function of
frequency is the Frequency Response Function H(f) define as the proportion of the
compound spectrum of the response to the compound spectrum of the excitation (Figure
12) (Gentile; Lorenzo et al.; Rainieri, Fabbrocino, Cosenza, & Manfredi).
Figure 12. FRF Spectrum

23
1.5.2 Frequency-Domain Decomposition FDD
The Frequency Domain Decomposition (FDD) method is identified for operational
modal analysis of structures, used as the modal data in a system for structural health
monitoring (Brincker, Andersen, & Jacobsen) it is a basic technique that is very easy to
use. Only choose the modes by locate the peaks in the Singular value decomposition (SVD)
plots of responses .As the FDD technique is based on using a single frequency line it can
predict frequencies and mode shapes and as well enable damping evaluation.
1.5.3 Signal Processing and data sampling:
Fast Fourier Transform (FFT) converts a uniformly tested time waveform signal to
corresponding Digital Fourier Transform (DFT). It is worth to mention that sampling time
domain shall be calculated based on frequency range of building that need to be captured
before starting test experiment. As FFT assumes sampling time contains of N uniformly
spaced in time domain related to the following equation:
T = N × delta t Equation 1.5.1
Digital Fourier Transform (DFT) the DFT contains (N/2) evenly spread out data of
composite (phases and magnitudes) resolution or time spaces between frequency denoted
as delta frequency as the following equation
Delta f = 1/T (in Hz) Equation 1.5.2
This equation represents a sampling length window of T corresponding to resolution of
delta f set that need to be measured.

24
1.6 Operational Model Analysis - Practical Application
1.6.1 Structure Health Monitoring (SHM)
(SHM) promises a new technology to test and analyze the behavior of structure
mode excited by any load that cause the structure to deform. This technology will provide
an important information for engineers to study the ductility and durability of structure
(Abdelrazaq,2010). It is a development of mathematical models to characterize behavior
of unknown forces and data by means of experimental data. The best practice now a day is
a dynamic testing for condition assessment and damage identification of existing
structures. A structure will act as rigid body when dynamic analysis treats forces motion.
Structural Health Monitoring consists of sensors such as accelerometers displacement
transducers that have to be installed in the structure to collect all data, thus data will be
transmitted to a computer of server to analyze them with a software in order to approach
an assessment strategy for the structure depending on their mode shapes and the behavior
during the excitation of loads. This methodology called ambient vibration resting where
the data required such as forces excitation or stiffness of the structure are not available.
(Birtharia & Jain, 2015)
SHM is classified into two groups:
1- Short-term monitoring in short time as temporal inspection of structures
2- Long-term monitoring for a long period or continuous investigation of structures.
While long-term monitoring is applied in highly important structures such as cable
bridges, plants, high-rise buildings and nuclear power, it is also necessary to apply short-
term monitoring for complex building structures such as towers. Maintenance activities

25
should achieve numerous stages of tests and inspection periodically. Temporal inspection
sensors usually installed at structure to identify structure behavior in various level of
periodically inspections where the most concern values obtained is damping, natural
frequency and mode shapes.
Burj Khalifa in Dubai is a good example of a tower with SHM scheme. A dozen of
sensors distributed along the height of the tallest building in the world (Abdelrazaq,2010)
in order to measure by time ambient vibration impact and also temperature changes effect
on structures elements.
Figure 13. Sample of measured acceleration at all levels of Khalefa Tower (Abdelrazaq)

26
1.6.2 Damaged detection methodology
According to the examination of the variations in the modal properties estimations,
the foremost downside of damage detection procedures is associated to the impact of
environmental, operational factors and boundary conditions on the estimates. The
structure’s integrity can be evaluated, theoretically, by comparing the subsequent estimates
of modal parameter with the reference estimates. Over the past decades, the techniques of
structure damage assessment based on vibration have been successfully developed so that
they not only identify the damage presence, but moreover quantify and localize it.
Comprehensive reviews about these methods are presented in literature. (Doebling, Farrar,
Prime, & Shevitz, 1996; Farrar & Worden, 2012; Park et al., 2003)
One more pertinent constraint to the widespread use of these damage detection
methods was the absence of completely automated techniques for estimating the monitored
structure’s modal parameters.
Researches and recent papers –cited in this literate review - present a methodology
to analyze and assists real life application structures using data collection from ambient
vibration tests and laboratory testing by combining Complex Mode Indicator Function
(CMIF) method and Random Decrement (RD) method, develop an estimation of location
and identification monitoring and controlling system of damage of an existing structure
during structure life time. Damage discovery is an extremely critical aspect of SHM.
Damage detection in the circumstance of SHM can utilize a collection of strong and
practical damage detection methodologies to classify, trace, and compute damage or
changes in apparent performance. Also, it can enhance and build a world class expertise
with a full-scale modeling of behavior dynamics of structure with its corresponding mode

27
shape. This kind of analysis will give an indication of structure stiffness and energy loss
depending on the response and the change of mode shape in a function of time. Exploring
elements behavior from the mode shape of a structure such as shear wall and columns
behavior under forces and lateral excitation, will give engineers a full vision on how the
building elements react with the excitation and whether there are any serious drifting of
displacement that need to be calibrated. Hence, this method will work as a mitigation plan
before disaster may happen. Using the theoretical background design and the situation
existing in life time of structure mode shapes will aid engineers to improve the structural
design methodology, particularly in controlling sway-drifting and longtime deflection.
The unscaled flexibility matrix is used to establish deflection profiles of the
laboratory experiment structure for healthy and damaged situation such as in this research
paper (Fladung & Rost, 1997). However, in towers and tall buildings, the design
complexity is being overcome by the availability and advances in programming and
structural analysis tools as the minimum code requirement still controls the design that yet
have to be validated in full scale. In this case, real value can be optimized with ambient
vibration measured because modeling in lab will be a time consuming to get a reasonable
accurate measurement as in real life structure.
Structural Health Monitoring systems use a network of sensors (accelerometers) connected
to an input data analyzer to monitor and measure response spectrum and dynamic
parameters of the building. When the Input data from ambient vibration and other climate
factors response parameters exceed updated finite element model design values, the system
will alarm warning signals. As the updated model, that has incorporated data and
information, system will routinely interrogate data and simulate building response
28
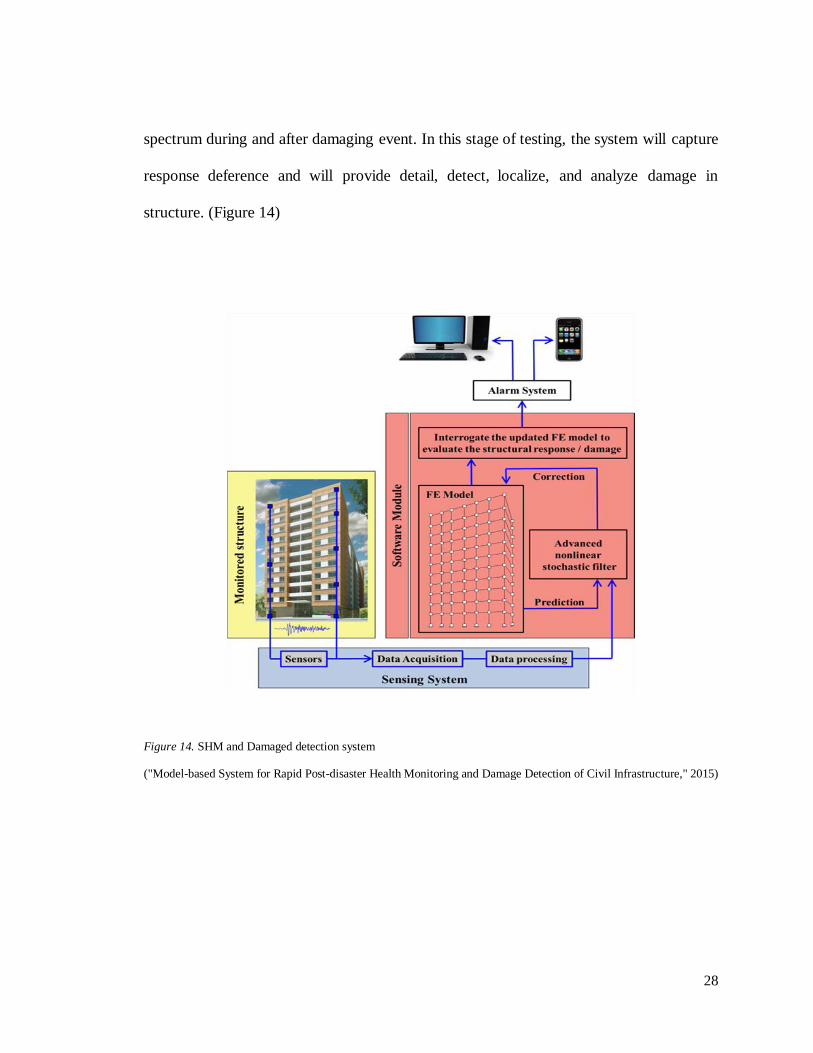
spectrum during and after damaging event. In this stage of testing, the system will capture
response deference and will provide detail, detect, localize, and analyze damage in
structure. (Figure 14)
Figure 14. SHM and Damaged detection system
("Model-based System for Rapid Post-disaster Health Monitoring and Damage Detection of Civil Infrastructure," 2015)

29
1.6.3 Historical Building health Assessment
Architectural Heritage Conservation is a cultural necessity that has been a central
concern in the cultural background of humankind, arising from buildings’ historical value.
Modern societies view ancient buildings as icons of culture and diversity and strongly
believe that their existence should be eternal. However, this demand poses high difficulties
to everyone since deterioration is instinctive to life. Bell towers, masonry towers and
historical religious buildings are examples of the most endangered erections because of
their age, slenderness, monumental height and the presence of significant dead loads that
make them extremely susceptible to dynamic forces. Particularly, the preservation of
historical masonry towers and the evaluation of their structural safety have become
exceptionally critical, possibly due to the several tragic collapses recorded in Europe,
including the abrupt collapse of Italy’s Civic Tower, collapse of the bell tower of St.
Magdalena church in Germany in 1992 and the collapse of the Campanile, in 1902 in San
Marco Square, Venice. (Binda, Gatti, Mangano, Poggi, & Landriani, 1992; Lionello et al.)
More recent examples of dramatic deteriorations include renowned structures such as
Venice’s St. Stefano bell-tower and the Civic Tower in the Italian city of Vicenza
(Valluzzi, Da Porto, & Modena, 2003).
Cities in Europe are characterized by a high density of historical, globally renowned
edifices. The majority of these buildings are still functional, but demanding regular
maintenance. Basically, the notion behind vibration-based health assessment, which was
founded in the late 1970s, supposes that the irreversible modifications in modal are a
consequence of structural damage. Actually, dynamic theory of structures asserts that the
existence of any damage impacts the structure’s stiffness damping, resulting in a diverse

30
vibration response.
Figure 15.a. Cathedral of Monza (Modena et al., 2004), 15.b. Trabzon, Turkey (Bayraktar, Türker, Sevım, Altunişik, &
Yildirim, 2009), 15.c. University of Coimbra (Modena, Lourenco, & Roca, 2004)
For structures, FE model must offer an advanced diagnosis level since it could be
applied in structural safety evaluation under service loads, prediction of the structure’s
performance under extraordinary loads (for instance, earthquakes) and simulation of the
impacts of repair interventions or structural changes. Whatever the case may be, a
numerical model should be corrected or validated using previous acquaintance.
Thus, in such interdisciplinary structural health evaluation approach, permanent
vibration monitoring must not only be merely introduced but must be regarded as a vital
solution. In reality, due to the numerous benefits of ambient dynamic monitoring, it seems
to be the perfect method to procedurally complement the tests carried out to evaluate
historic buildings’ structural safety. More precisely, vibration monitoring is the only

31
approach to acquire worthwhile data (in terms of modal parameters) on the structure’s
inclusive dynamic behavior, providing an accurate and effective model validation
preceding its application in upcoming numerical analysis.
Regardless of this, a protocol regarding long-term dynamic monitoring for civil or
historic structures does not exist yet neither in the national code nor the international codes
or other manuals. Hence, because of the extreme challenges that face long-term vibration
monitoring which demand considering a variety of factors, codes and references are a
serious necessity, particularly for historic infrastructures and structures because of their
inherent complexity.
Nonetheless, it is worth mentioning that long-term dynamic monitoring of cultural
heritage structures and historic buildings is a relatively new subject that is rarely
completely investigated in literature. (Binda et al., 1992; Lionello et al.; Valluzzi et al.,
2003) Particularly, a close agreement between experimental and theoretical modal
parameters was achieved for comparatively low values of the model Young’s modulus in
the highly impaired tower regions.
Moreover, the vibration-based model updating, done through two different
methods, resulted in steady structural parameters (distribution of Young’s modulus in the
masonry) which are in good match with the double flat-jack tests results.
Because of the good relationship between theoretical and experimental models, the
modified model seems to be sufficient to deliver trustworthy forecasts to evaluate the
tower’s structural health, which is principally important bearing in mind the vastly
inhomogeneous materials (cycloptic concrete and stones) that make up the tower itself.
Dynamic tests are typically repeated by researchers after the strengthening so as to examine

32
the relationship between the changes in the structure’s modal parameters and the repair. As
the cracks have advanced gradually throughout the years, a material’s potential time-
dependent behavior can be assumed due to the weighty dead load, besides wind actions
and temperature variations (Modena et al., 2004).
1.6.4 Updating FEM model During Construction stages
As operational model analysis and structure health monitoring structure have
received a tremendous attention those days due to the possibility of identifying structure
dynamic properties using the ambient vibration forces, structure engineers assume input
signal as a noise to drawback a methodology to capture peaks in input spectrum to evaluate
structure modes and natural frequencies.
There is no doubt that finite element method (FEM) using advanced modeling
software is the dominating analysis strategy in most of designs consultant's offices.
However, structure design engineer has to accept various simplifications and assumptions
based on minimum code requirements of the real construction in geometry, masses,
stiffness, elasticity, loads, and other limitations during the stage of design. This is actually
happened because the level of details to get the exact structure simulation will take an
extensive amount of efforts, time and expenditures. For that reason, it’s significant to
monitor, control and analyze calculation during construction stage by implementing on-
site measurements. This step will make sure that the simplification and assumption during
design stage will not disrupt building response criteria. And also, to update and validate
structure design during construction planning.
Response by ambient vibration will primarily respond in natural building frequency

33
and fundamental modes (Zhou, 1999). This hypothesis might be established by many case
studies, for example (Chintalapudi et al.; Wu & Li, 2007). Consequently, to know
fundamental frequency does not need destruction or costly dynamic testing process but still
it offers a valid technique aimed to check assumptions and simplifications during design.
Abdelrazaq,2010, as tower shape is not symmetrical per floor and also the difference
between center of gravity and stiffness center. It's very important to track building
movements as this tower is the highest structure in the world any minor movements
different than design in any level of the building will facilitate a major consequence later
on.
Monitoring building response during construction implemented in many towers like
Shanghai Tower, Ruihua Tower, and Di wang Tower and Canton Tower. Engineers
consider monitoring the response for both scenarios, during construction phase and also
for a long-time period to do the regular maintenance and damage deduction analysis
(Chang et al., 2003; Ko & Ni, 2005; Moyo, Brownjohn, Suresh, & Tjin, 2005; Ni, Xia,
Liao, & Ko, 2009; Park et al., 2003)
1.7 Motivation and Focus of the Thesis
Skyscrapers are nowadays omnipresent in the skylines of wealthy modern
metropolises. Within the past few decades, these soaring buildings have reserved positions
in the most Arabian Gulf cities such as Doha, Kuwait, Dubai, Riyadh, Abu Dhabi and
Jeddah. Yet it is undeniable that the dizzying heights of skyscrapers predominantly denote
mankind’s profound desire to declare technological force, power, progress, and wealth, in
addition to mirroring countries’ prominent positions on the international political and

34
economic stages. The commercial rivalry that created the skyscrapers in Doha was mainly
concerned with national branding and image-making, reflecting the city’s modernity and
development.
Qatar Projects have expanded a lot and the number of high-rise buildings and
complex structures are increasing. Government in alignment with its corporate strategy that
outlines its direction and the operational procedures which need to be followed in order to
achieve the Qatar 2030 mission and vision.. These visions focus not only on the upgrade
and maintenance of existing national assets, but also on the development of major new
building projects across Qatar.
Literature and research regarding vibration analysis of Doha towers is undeniably
lacking. In an attempt to fill this gap, this study scrutinizes the behavior of - Sinyar Tower,
in which studies and test results caused by ambient conditions and wind conditions were
used to find out structure modal parameters to validate and update structure finite element
modal according to structure design specification and structure drawings. The purpose is
to study dynamic properties of the structural system with output OMA techniques by using
wired and wireless accelerometers in order to update finite element model (FEM). By
updating FEM, engineers are enabled to support clients to make quick and correct decisions
in extreme emergency situations in the case of boundary conditions and excitation changes,
during a structure’s service. This evaluation gives a way to use it as advanced assessment
of structural condition. Mode shapes, natural frequencies, modal damping ratios were
studied, while the results of tests carried under ambient conditions and wind conditions
were used to update the Finite Element model. Thesis concluded that FEM updating is
important as values from full-scale testing provides higher frequency values in comparison

35
to design. This mainly because of design codes factor of safety and also the stiffness
provided by cladding, façade and walls eventually increased the system’s stiffness, which
cannot be revealed in FE modeling based on structural design only. Furthermore; wired
sensors are not practical for high rise building.
Figure 16: Sinyar Tower 1/3
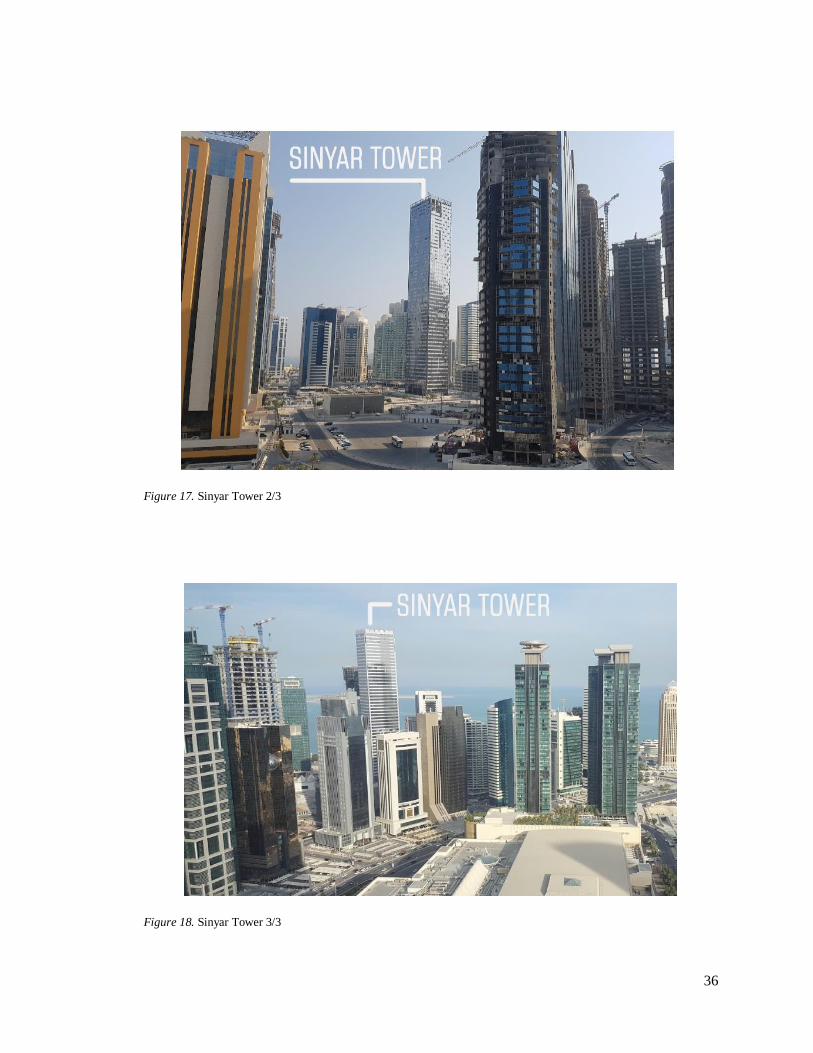
36
Figure 17. Sinyar Tower 2/3
Figure 18. Sinyar Tower 3/3

37
CHAPTER 2: FINITE ELEMENT MODEL (FEM)
2.1 Model Description – Al- Sinyar Tower
High rise buildings in general are considered as one of the important factors that
affect the economy of the country and showing the power. Furthermore, generate office
space, living space on a smaller piece of (mostly expensive) land. Improvements in
economy, jobs, trade can be achieved through those projects.
Concrete building is ideal in Arabian gulf because of the concrete resources
availability in the local markets and also the availability of qualified concrete structure
engineering, this study focusing on Al-Sinyar Tower that contain 2B+G+52 floor used
mainly for residential and hospitality as Hilton hotel apartments in Al Dafna Doha / Qatar.
Al-Sinyar Tower has a total area of 74,747 sqm. With a total of 340 service apartments,
and 7 Passenger/customers elevators and it’s the highest residential tower in Qatar.
2.1.1 Location of the Tower
Al Dafna is a seaside region in Doha/Qatar located on west Bay. As the huge
number of skyscrapers in this area it considered as one of the greatest prominent regions.
Since 1980s, Qatar government focused in Al Dafna to develop and create a business region
district. This start with a huge land renovation along Al Dafna coastline.in 1990s dozens
of skyscrapers have risen in this district and recently this area becoming a new center to
Doha. (Figure 21)

38
Figure 19. Al Dafna/Qatar
2.1.2 Structure Specification
The structure arrangement contains flat slab (reinforced concrete with drop panel
to transfer loads to beams. Central core walls, boundary columns mounting the floor
concrete system and boundary beams. This is the main Skelton of Al Sinyar structure,
columns and core walls were introduced with different sizes along the tower height to
reduce structure dead loads and also to control story drifts (Table 3).

39
Table 3
Tower area and floors
Total Plot Land Area 3,394.00 SQ.M Height: To Tip 230 m / 755 ft
Average Floor Area 1,288.04 SQ.M Floors Above Ground 53
Total building Area 19,907.32 SQ.M number of Apartments 340
2.1.3 Tower Design Aspects and Techniques:
The Construction and Design of high rise buildings involve two main aspects:
safety and severability. As in any building structure self-weight loads increase vertical with
respect to building height and lateral loads large effect coming from horizontal wind-load.
Tower behavior under the lateral loading distribution work as cantilever fixed at the ground
(Figure 22) Wind uniform distribution growth in quadratic manner with the elevation
which gives uniform larger base-moment. High-rise building designers design buildings to
be able to absorb the lateral loading and to transfer resulting moment throw building lateral
elements system into foundation.

40
Figure 20. Moment and Horizontal loading disruption
The most effective way to achieve this by vertical walls this is the most popular
way used in tower designs in Qatar. Though, with the consideration of tensile stresses
concrete walls designers use building self-weight to minimize tensile stresses by slabs,
beams. Etc. to increase compressive stresses. Al-Sinyar Tower façade transfers wind load
to slabs that works as diaphragms. Its worth to mention here that slabs system in Al-Sinyar
are flat slabs with a drop beams without any posttension tendons. However most of towers
in Doha used Posttension slabs to decrease structure self-weight as steel tendons provide
more compression stresses into concrete slabs and increase steel tension stresses.
The horizontal load from wind working as a distributed load on the facade, which
transfers the load to the slabs that works as diaphragms to delivers lateral shear loading too
the vertical system (Figure 23). The shear forces in the diaphragms occur mainly in the
concrete because of its in-plane stiffness.
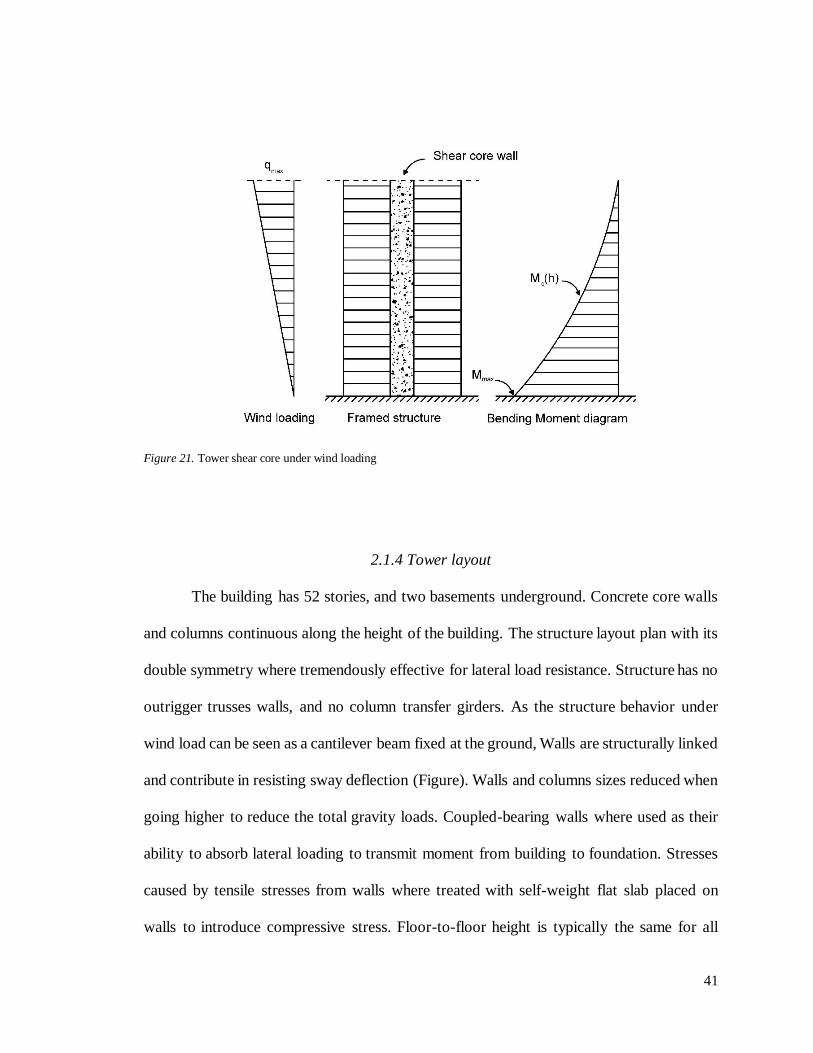
41
Figure 21. Tower shear core under wind loading
2.1.4 Tower layout
The building has 52 stories, and two basements underground. Concrete core walls
and columns continuous along the height of the building. The structure layout plan with its
double symmetry where tremendously effective for lateral load resistance. Structure has no
outrigger trusses walls, and no column transfer girders. As the structure behavior under
wind load can be seen as a cantilever beam fixed at the ground, Walls are structurally linked
and contribute in resisting sway deflection (Figure). Walls and columns sizes reduced when
going higher to reduce the total gravity loads. Coupled-bearing walls where used as their
ability to absorb lateral loading to transmit moment from building to foundation. Stresses
caused by tensile stresses from walls where treated with self-weight flat slab placed on
walls to introduce compressive stress. Floor-to-floor height is typically the same for all

42
levels expect lobby and mechanical floor. Floor Height equal 3.5 meter and the Tower
flooring system typically framed with 300mm thick reinforced concrete flat slab
surrounded with boundary beams with two sizes (1.20x0.45 m) and (1.00 x0.45 m). It is
worth to mention that tower still under construction stage and progress of work
approximately reached 90% as the contractor work in finishing and façade elements
installation. (Figure 22)
Figure 22. Floor 52 during Construction stage

43
2.1.5 Modules elasticity used in FEM
As consultant design aspects to use ACI code 318-08 (metric) and ASCE7-05 to
design and analyze structure members, the modulus of elasticity has been calculated
based on the following equations: -
• For normal weight concrete with a density of 2300 kg/m3, ACI Section
gives the modulus of elasticity as
𝐸𝑐 = 4700 √𝑓𝑐′ 𝑀𝑝𝑎 Equation 2.1.5.1
• But ACI Committee 363 [3-8] proposed the following equation for high-
strength concretes (50 Mpa and more)
𝐸𝑐 = 3320 √𝑓𝑐′ + 6895 𝑀𝑝𝑎 Equation 2.1.5.2
2.1.6 Tower Concrete grades and specifications
Grade of concrete is indicated as C50/20 in which 50 is the cube strength of
concrete in N/mm2 and 20 is the nominal maximum size of the aggregate in mm as per
code BD 5328.
The following table shows concrete grade distribution (Table 4).

44
Table 4
Concrete Grade distribution
For suspended slabs & beams
Cement - ordinary Portland cement (OPC)
Grade – From B2 to L20 is C50
From L20 to Roof C45
For Wall
Cement - ordinary Portland cement (OPC)
Grade – From Raft to L10 is C70
From L10 to L25 C60
From L25 to Roof C50
For Columns
Cement - ordinary Portland cement (OPC)
Grade – From Raft to L20 is C70
From L20 to L30 C60
From L30 to Roof C50
2.1.7 Reinforcement strength for structure elements
Reinforcement high yield stress = 460 N/mm2.
A summary of concrete grade and strength can be demonstrated in the following
(Figure 25).

45
Figure 23. Summary of concrete grad and strength
46
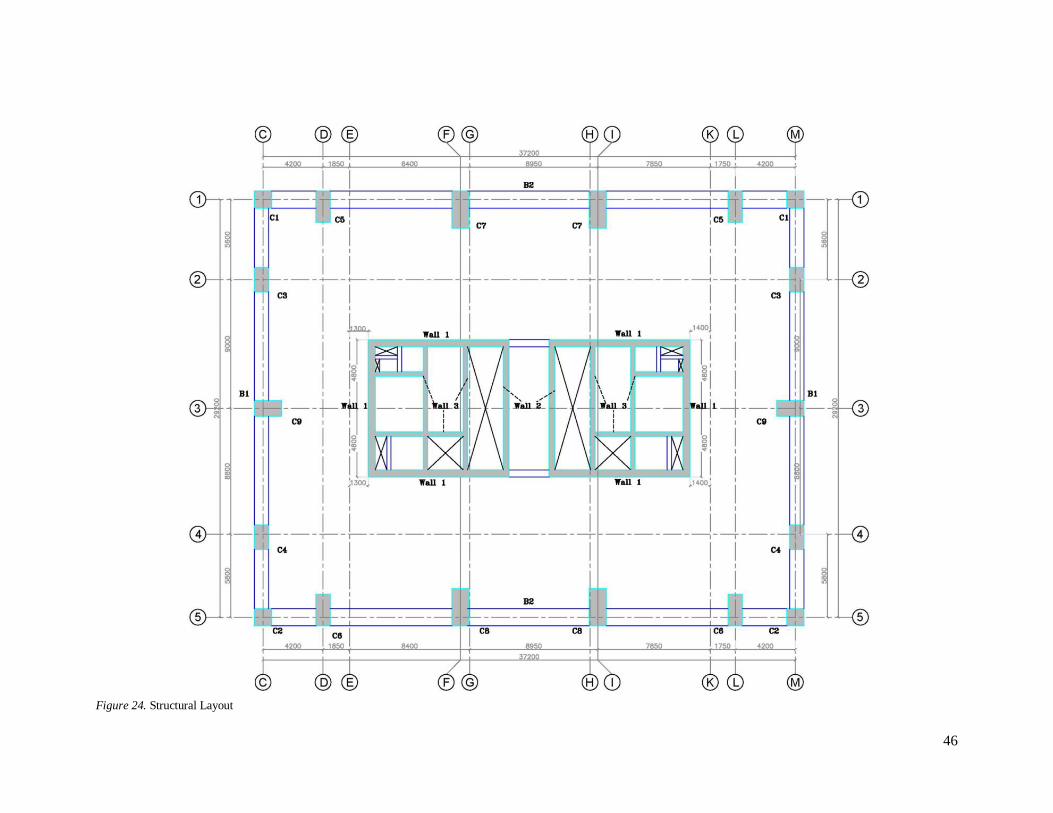
Figure 24. Structural Layout

47
2.2 FE Modeling Process for Al Sinyar Tower
Finite element method (FEM) uses many elements in any continuum analyzing. As
the number of used elements increases, the time and effort required to prepare the relevant
and necessary data and interpret the results increases. Meshing is performed to discrete the
geometry created into small pieces called elements the rationale behind this to divide
(meshed) a body or a problem domain into small elements or cells using a set of grids or
nodes, the solution within an element can be approximated by simple functions. In the
building industry, the use of advanced finite element tools has not only allowed the
introduction of innovative and efficient building products, but also the development of
accurate design methods.
SAP2000 model was used in this thesis. This program represents objects as a
physical structure member by using graphical interface. It is a user-friendly program that
provide users drawing tools to draw structure members, assigning properties and load to
the members to fully define an FE Model (Figure 27).
When running Program analysis, program automatically renovates objects to
elements according to certain meshing criteria defined by user in order to facilitate analysis
to create a traditional FE model. The impact of analysis will be represented in model
geometry as deformation shape. Sap2000 have the following terminology:
• Static and dynamic analysis
• Dynamic seismic analysis and static pushover analysis
• Linear and nonlinear analysis

48
2.2.1 Model Geometry
Figure 25. FEM MODEL
SAP2000 Model of Al Sinyar Tower contain all components that effect mass,
forces, strength, dynamic, deflection and also stiffness of building. Building effective

49
elements consists of beams, slabs, walls and columns. However, the foundations were
considered as fixed because this research considers dynamic analysis of superstructure
elements and the deformation of foundation is not captured here.
Referring to Chapter 2: Building Description, building FE Model introduced tower
structure arrangement according to design drawings and specification taking in
consideration all loads cases and wind load parameters.
The structure is divided, discretized, into a finite number of discrete components.
Characteristics of elements and their behavior their nodal transpositions and responses can
be quantified by finite function shapes. In order to capture the exact movement of elements
in tower, structure drawings measurements where used taking in consideration thickness,
distances and location of members to obtain accurate result.
2.2.2 Model Assumptions
As any program in FE modelling the following assumption were introduce in order
to obtain reasonable values and comparing values with real test by sensors:
1- Beams connection Pin-Pin – and this assumption will be discussed during
model updating.
2- Walls and Columns Connection Fix-Fix
3- All the structure dimensions for beam + Column + Slab + Core taken from
structure drawings and the arrangement dimension in excel sheet shown in appendix.
4- All material properties for the concrete were taken from structure drawings
and the arrangement also in Excel sheet attached
5- Dead load and live load taken from structure general notes: - DL: 6.5 KN

50
and LL: 2.5 KN.
6- Mass source considered structure elements + Load patterns with
Multipliers: DL =1 and LL = 0.25
7- Base connection is fixed
8- A linear elastic behavior is assumed for Reinforced Concrete material,
appropriate under the assumption of small strains. Taken as typical properties for
Reinforced Concrete
2.2.3 Material properties of structure
This section provides material property information for materials used in model.
Table 5
Material Properties - Steel Data
Material Fy KN/m2 Fu KN/m2
A992Fy50 3.45E+05 4.48E+05
Table 6
Material Properties Concrete Data
Material Fc KN/m2
C40/50 4.00E+04
C45/55 4.50E+04
C50/60 5.00E+04
C60/75 6.00E+04
C70/85 7.00E+04

51
2.2.4 Section properties
This section provides section property information for objects used in the model,
as per structural drawings.
Table 7
Frame Section Properties
Section Name Material width depth Area I33 I22
m m m2 m4 m4
B0.3x0.5 C45/55 0.500 0.300 0.150 0.003 0.001
B0.4x0.7 C50/60 0.700 0.400 0.280 0.011 0.004
B1.0x0.45 C50/60 0.450 1.000 0.450 0.008 0.038
B1.2x0.45 C50/60 0.450 1.200 0.540 0.009 0.065
C0.6x1.4 (C50) C50/60 1.400 0.600 0.840 0.137 0.025
C0.6x1.9 (C50) C50/60 1.900 0.600 1.140 0.343 0.034
C0.7x0.8 (C50) C50/60 0.800 0.700 0.560 0.030 0.023
C0.8x1.6 (C60) C60/75 1.600 0.800 1.280 0.273 0.068
C0.8x2.1 (C60) C60/75 1.200 0.800 0.960 0.115 0.051
C0.8x2.3 (C50) C50/60 2.300 0.800 1.840 0.811 0.098
C0.9x0.9 (C60) C60/75 0.900 0.900 0.810 0.055 0.055
C0.9x1.6 (C70) C70/85 1.600 0.900 1.440 0.307 0.097
C0.9X2.5 (C60) C60/75 2.500 0.900 2.250 1.172 0.152
C1.0x1.7 (C70) C70/85 1.700 1.000 1.700 0.409 0.142
C1.0x2.1 (C70) C70/85 2.100 1.000 2.100 0.772 0.175
C1.0x2.3 (C70) C70/85 2.300 1.000 2.300 1.014 0.192
C1.1x1.1 (C70) C70/85 1.100 1.100 1.210 0.122 0.122
C1.1x2.6 (C70) C70/85 2.600 1.100 2.860 1.611 0.288
C1.2x1.2 (C70) C70/85 1.200 1.200 1.440 0.173 0.173
C1.2x2.6 (C70) C70/85 2.600 1.200 3.120 1.758 0.374
C1.7x0.6 (C50) C50/60 0.600 1.700 1.020 0.031 0.246
C1.9X0.7 (C60) C60/75 1.900 0.700 1.330 0.400 0.054
C1.9x0.9 (C70) C70/85 0.900 1.900 1.710 0.115 0.514
C1.9x1.1 (C70) C70/85 1.100 1.900 2.090 0.211 0.629

52
Table 8
Area Section Properties
Section Material Thickness Bend Thick
m m
SLAB(0.3) C45/55 0.3 0.3
Wall300 C50/60 0.3 0.3
Wall300 (60) C70/85 0.3 0.3
Wall300 (C70) C70/85 0.3 0.3
Wall400 (C70) C70/85 0.4 0.4
Wall450 (C60) C60/75 0.45 0.45
Wall500 (C70) C70/85 0.5 0.5
Wall600 (C70) C70/85 0.6 0.6
2.2.5 Defining elements of FEM
In the models with the element type walls, the feature floor diaphragm is used to
simulate a slab. The floor diaphragm works as a rigid link where each node in each story
are linked to a master node located in or close to the stories’ center of mass. The nodes
linked to the master node are called slave nodes. The stiffness of the diaphragms are close
to infinitely stiff, to simulate a slab transferring the lateral loads to the vertical elements.
The diaphragms only transfers axial force and no out-of-plane shear or bending. For the
meshed models there is no need for floor diaphragms since the slab is meshed with plate
elements and have stiffness, both in-plane and out-of-plane bending, and connects all nodes
in the plane. This provides stiffness in-plane and the load can be transferred to the vertical
elements. A general modelling feature that is unchanged for all models are the connections
between the columns and all beams except those running between the two cores. These

53
connections are modelled as hinged in order to avoid statically indeterminate load
distribution. This Model is a three dimensional, Liner and Isotropic. The X, Z, Y axes
represent N-E and S-E and vertical direction respectively.
2.2.6 Procedure of solution using SAP2000 Program
SAP2000 is a broad-purpose finite element software which carries out the linear or
nonlinear, dynamic or static analysis of structural systems. In addition, it is a potent design
tool for designing structures based on ACI and AISC building codes as well as AASHTO
specifications. These characteristics and countless more make this program the most
advanced in structural analysis. The GUI, or graphic user interface, in SAP2000 is used to
design, model, display and analyze the structure properties, geometry and analysis results.
There are three stages in the analysis procedure:
1. Pre-processing. This phase is for building the model and adding the desired
restrictions and loads, specifying the geometry, defining material properties and element
type and Meshing, or dividing the object into small elements.
2. Solving. In this stage, the algebraic equations system which represents physical
system are assembled and solved.
3. Post-processing, where the manipulation of numerical results is facilitated, either
in graphical form or in the form of tables and lists.
AL Sinyar Tower was modelled using frame and plane elements. While the floors
and the shear walls were modelled by the plane elements, the beams were modelled by the
frame elements, and 4522 frames, 35053 joints, and 41068 plane elements were used to
model the whole structure. It is assumed that all degrees of freedom under the building’s

54
base are fixed.
2.3 Mode Shapes and Natural Frequencies
Two types of modal analysis in SAP2000 that can be used for dynamic analysis.
Eigenvector analysis and Ritz-vector analysis. Eigenvector analysis provides the
undamped mode shapes with free vibration in order to get natural modes. However Ritz-
vector analysis need a set of load dependent ritz vectors in order to get good results. In this
research Eigenvector analysis where chosen. Eigenvector analysis use the following
equation to solve eigenvalue problem:
[ 𝐾 − Ω2 𝑀 ]Ф = 0 Equation 2.3.1
where K is the stiffness Matrix, M is Mass Matrix, Ω2 is the diagonal Matrix and
Ф the eigenvectors mode shapes matrix. After running the model analysis in SAP2000, the
first 10 modes are demonstrated in (Figure 28).
2.4 Elements Meshing
In order to have appropriate meshing, several trials were done using different
mesh sizes. Eventually, a selective criteria of meshing were chosen in order to have a
convergence and to ensure that changes in frequency values are less than 0.0001Hz.
Meshing size of different elements are shown as following (Table 9):

55
Table 9
Element Meshing Size
Element Meshing size
Slab 0.5m
Wall 0.3m
Column 0.5m
Beam 0.5m
a) MODE 1: 0.1504 b) MODE 2: 0.2062
*continued

56
c) MODE 3: 0.4724 d) MODE 4: 0.6059
e) MODE 5: 0.7501 f) MODE 6: 1.2939
*continued

57
g) MODE 7: 1.4357 h) MODE 8: 1.6165
i) MODE 9: 2.2104 j) MODE 10: 2.6090
Figure 26. FEM MODES

58
Natural frequency from FEM are listed in the following table (Table 9) and a
comparison with experimental full scale test will be discussed in CHAPTER 4.
Table 10
Natural Frequencies for each mode
MODE Frequency
1 0.1504
2 0.2062
3 0.47245
4 0.6059
5 0.7501
6 1.2939
7 1.4357
8 1.6165
9 2.2104
10 2.6090

59
CHAPTER 3: AMBIENT VIBRATION TEST
3.1 Introduction
In an ambient modal analysis test, the key components are the structure being
investigated, a data acquisition device, a number of motion sensors and a data processing
system to extract the modal information from the obtained data. Regarding the transducers,
any sensor’s function is to transform a physical quantity into an electrical one, usually
voltage. Afterwards, the voltage is transmitted, for digitization, to the data acquisition
hardware. The foremost benefit of ambient vibration testing is that, in order to evaluate the
dynamic characteristics of a structure, no “artificial” excitation has to be introduced. A
natural source such as wind dynamically excites the structure continuously. These naturally
occurring “loads”, along with proper data analysis tools and instrumentation, can be
exploited to determine dynamic characteristics of an enormous structure such as SYNIAR
TOWER. In this chapter, Operational Modal Analysis (OMA) method was used to conduct
a full-scale vibration test of the structure under ambient vibrations using wired sensors and
wireless sensors. Ambient vibration testing’s main objective was to evaluate the dynamic
characteristics of Al- Syniar Tower. The relevant modal parameters were to the torsional
and lateral natural periods along with their mode shapes. The aim was to record the
structure’s first ten modes and natural periods as first ten modes represent structure
behavior in low frequency range.

60
3.2 Selection of the Measurement Scheme
The first essential step for an effective modal identification is high-quality
measurements. If noise entirely corrupts measurements, any OMA method is
unsuccessful. Low-quality measurements can be due to an improper selection of
measurement hardware or sensors, but they can as well be the consequence of incorrect
wiring. In reality, various measurement schemes can usually be adopted for a given
selection of the sensors and measurement hardware. The gathering of high-quality data
relies heavily on the adoption of the associated specifications for the whole analog signal
path besides the selection of the most suitable cabling scheme. Nowadays, the market
provides versatile data collection systems, permitting diverse wiring configurations.
If such schemes can easily be applied in the instance of commercial systems,
attention is required whenever an own measurement system is developed a programmable
hardware or when data acquisition systems come from different manufacturers. In both
instances, the proper wiring is often in the user’s full responsibility.
An exhaustive analysis of noise control techniques and cabling schemes is out of
the scope of this research, but a general illustration about them can still offer valuable
suggestions to refrain from common errors in performing measurement. The herein stated
guidelines cannot substitute an in-depth analysis of specifications and documents
accompanying measurement systems and sensors for the determination of the proper wiring
scheme, but they can undeniably help the inexpert user in the choice of the measurement
scheme and chain. As wireless sensors is very expensive, first test were implemented by
using wires sensors and all this steps will be discussed in wires sensors testing.
61
3.3 Transducers
Obtaining electrical signals from physical quantities is the role of transducers. For
example, motion transducers translate velocity, displacement or acceleration into voltage
that is proportional to the considered physical quantity’s magnitude. Civil Structures’
dynamic response can be measured by numerous types of sensors available in the market.
Piezoelectric sensors translate the mechanical quantity into an electrical one. Due to
piezoelectricity, positive and negative ions mount up onto the crystals opposite surfaces
when a force is applied to the crystal.
The accumulated charge amount is directly proportional to the magnitude of the
applied force. In piezoelectric accelerometers the crystal is coupled to a mass. At the
accelerometer’s base, the application of an input acceleration leads to a deformation of the
crystal due to the inertia force of the mass. An electric charge proportional to the
deformation is generated by the piezoelectric material. The structure’s limited frequency
range and low amplitude of motion under test direct the selection towards high-sensitivity
accelerometers like those employed for seismic networks. Nevertheless, parameters other
than sensitivity and frequency band should also be taken into consideration. In order to
appropriately choose the sensors and use them for a particular application, sensor
specifications must be carefully studied. Precisely, it is worth remarking that some sensor
features, such as sensitivity or dynamic range, might depend on frequency. Accordingly, a
sensor could show better properties in a particular frequency band and worse features
elsewhere. This condition should be taken into consideration when selecting a sensor. In
this research, two test were implemented by using wires and also wireless sensors.

62
3.3.1 Test using Wired Transducers
The selection of the cable type as well as the connection with the terminals impacts
the measurements quality. Cable selection were studied deeply before testing by wires
sensors. To transfer the analog signals to the data collection system from the sensors
As a first step to test sensors connectivity a mockup test were implemented in lab
by using Coaxial cables. For piezoelectric accelerometers, coaxial cables are often used,
which are extremely inexpensive cables but are the most susceptible to electrical noise
exposure; For force balance accelerometers, cables involving several individually shielded
twisted pairs are used, and although these are weighty and costly but are the least subjected
to collect noise from the surroundings.
DT9857E modules were used which have a high-accuracy dynamic signal analyzer
with 16 IEPE inputs or two stimulus waveform output channels RG58/U, 50 OHM, with
Shield low noise Coaxial Cable were used to connect sensors with the module. (Figure 29).
For Piezoelectric accelerometers (PCB 393b04) 10 V/g sensitivity and 0.5 g peak
acceleration with (0.1 to 200 Hz)

63
Figure 27: Wired sensors , accessories and cable termenation

64
Another critical aspect is the assembly of the wires with the terminals, because an
improper connection promotes the intervention of electrical noise. In this viewpoint as our
observation during lab testing, certain attention has to be concentrated on good shield
termination, preventing ground current flows within the shield. This can be achieved
through connecting the shield to the ground at a single end only. Directions for cable
connections offered by data acquisition system and sensor manufacturers must be taken
seriously. In order to test long coaxial cables, a mockup test were conducted on a model
steel stadium in lab to check if the data transmitted throw the cable would suffer losses
once increasing cable length. Raw data were in a good quality and ready for analysis
(Figure 30)
Figure 28: Validation test for wires sensors
In fact, results from lab testing were satisfying however results from Syniar tower
were disappointing due to the following:
65
• The picked up signal contains of high range of noise. The acquired signal
which carrying this amount of noise stands against implement OMA techniques effectively.
• Sensor frequency range from 0.1 up to 200 Hz. As SYNIAR tower consist
of 52 floor sensors failed to capture low frequencies below 0.5 Hz.
• Distances between sensors and modules were more than 50 m, especially
for sensor in 48th floor, a huge noise effect signals carried by the cables.
• Practically, it’s hard to deal with more than 1000 meter cables especially
with a very sensitive device.
3.3.2 Test using Wireless Transducers
In the last decade, considerable efforts were put into the improvement of wireless
sensor networks for health monitoring and structural testing. This field earned an increasing
interest of the scientific and professional community, and has experienced an
unprecedented development. Due to the affordable cost and the option to join multiple
sensors in the same wireless node, this technology gained a commercial success (Lynch &
Loh, 2006).
Despite the abundance of wireless sensing solutions available today, providing
attractive attributes such as the reduction of installation time and costs linked to the cables
use, they have not entirely substituted wired systems. The time synchronization of the
channels is the major benefit of wired systems over wireless sensor network. Concurrent
sampling, actually, guarantees the phase consistency among all the measurement channels,
avoiding errors in the computation of cross-spectral and cross correlation density functions.
In wireless sensor networks, time synchronization demands particular solutions whereas it

66
is a normal task when wired sensors and a single data acquisition system are adopted. Each
node in wireless sensor networks has its own ADC. Accordingly, an external time base
providing a time reference is required for the time synchronization of the different ADCs.
Recently; TROMINO used for the operational modal analysis of structures to such as the
Eiffel tower, and Golden Gate Bridge in San Francisco. In this project, TROMINO use 3
channels connected to 3 orthogonal electrodynamics with selectable gain for vibration
tremor acquisition. (Figure 31)
Figure 29: wireless Sensors Setup – TROMINO-

67
3.4 Sensor Installation
The selection of the sensor layout relies on the modal identification test objectives,
the number of available sensors, and the required data about the mode shapes, which may
bring about altered requirements in terms of sensors’ spatial density. Literature on the
optimization of sensor location is abundant. Yet, the adopted criteria and optimization
techniques highly influence the results acquired from the application of those methods,
resulting in various possible layouts. Hence, although those techniques can aid the
definition of the test layout, a specific amount of physical insight besides cautious planning
by the test engineer still play an essential role in the definition of test layouts that are
capable of maximizing the modes’ observability and the amount of data obtained from the
sensors.
When some theoretical information regarding the mode shapes exists, a successful
sensor layout can be achieved by setting up the sensors in a set of points. Mode shapes
were taken from FEM in sap2000 in order to locate sensors in the Anti-nodes of the mode
shape.
Accordingly from FEM model of SYNIAR tower which provides us first mode
equal 0.15 Hz that means sampling window shall be 1/0.15 which is equal of 7 second per
each window time frame as a minimum value in order to have a good resolution of
frequency. However as TROMINO sensor capable to carry smaller window time frame, a
1/128 seconds where chosen to have higher resolution in this project test. And Data was
collected for a period of 90 minutes at a rate of 128 sample per second. In order to have a
constant measurement and a reasonable data collection, first and last 10 minutes were
removed from the analysis. The location of sensors were in opposite corners in each

68
instrumented floor. And the first reference sensor were placed in the first floor (Figure 32).
Figure 30: sensors location

69
3.5 OMA using ME ‘Scope
ME ‘Scope designed to capture and analyze vibration and modal dynamic
identification. Modular design allows users to create a 3D modal and this 3D modal interact
with the data sets input to create deflection shapes and mode shapes by using multichannel
time and frequency domains acquired during structure operation. To analyze cross-channel
functions like Frequency Response Functions or cross-spectrum. A measurement sets used
as an input data from acceleration sensor – TROMINO- used in Al- Syniar Tower. Active
channels of data sets have to be simultaneously acquired. In ME ‘scope all data sets
represented as channel spreadsheet with a Degree of freedoms which will be discussed later
on. And all data sets shall be saved as an Acquisition file. After setting out data sets a mode
shape shall be animated as a response of vibration on 3D mode1.
3.6 Model Identification
First ten modes were considered in this study from the Model identification
outcomes for SYNIAR TOWER using TORMONO sensors along with ME ‘Scope
program.. as discussed previously. And the model assurance criterion (MAC) used to
compare results between FEM and ambient vibration test. As an example; (Figure 33)
displays sensors ambient vibration data from 48th floor that were located in corner.

70
Figure 31: Acquisition Window Showing the Sampling Tab
(Figure 34) shows the cross power spectral density and peaks represent natural
frequencies of SYNIAR TOWER. From this figure it is observed that the first 10 Modes
contribute in low frequencies and as expected from FEM model. Once power spectral
density have been calculated throw ME ‘Scope, damping identification of the structure is
performed.

71
Figure 32: Cross Power Spectral Density of two Modes .
In order to simplify the visualization of mode shapes in ME ‘Scope, A graphical
tool were used to represent the structure with corresponding mode shapes as following;
(Figure 35)

72
a) MODE 1: 0.200 Hz b) MODE 2: 0.250 Hz
c) MODE 3: 0.405 Hz d) MODE 4: 0.720 Hz
e) MODE 5: 0.921 Hz f) MODE 6: 1.120 Hz

73
g) MODE 7: 1.670 Hz h) MODE 8: 1.900 Hz
g) MODE 9: 1.970 Hz h) MODE 10: 2.690 Hz
Figure 33: First 10 Mode Shape from Me’Scope .
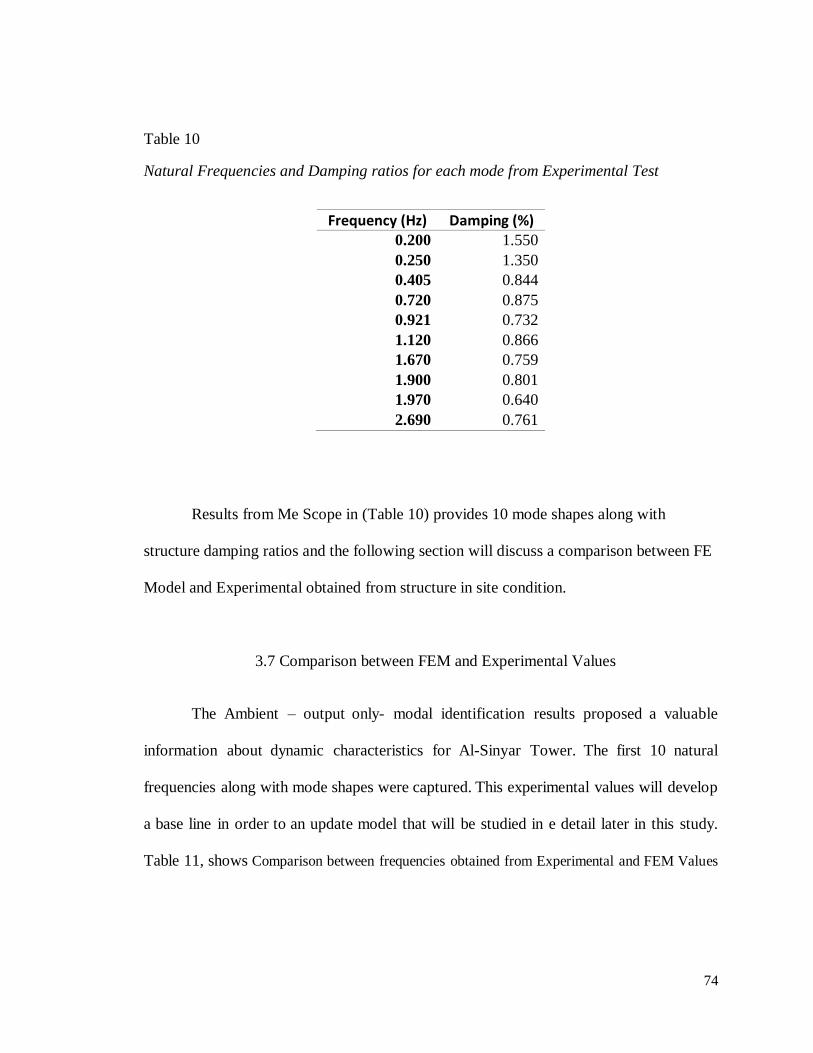
74
Table 10
Natural Frequencies and Damping ratios for each mode from Experimental Test
Frequency (Hz) Damping (%) 0.200 1.550
0.250 1.350
0.405 0.844
0.720 0.875
0.921 0.732
1.120 0.866
1.670 0.759
1.900 0.801
1.970 0.640
2.690 0.761
Results from Me Scope in (Table 10) provides 10 mode shapes along with
structure damping ratios and the following section will discuss a comparison between FE
Model and Experimental obtained from structure in site condition.
3.7 Comparison between FEM and Experimental Values
The Ambient – output only- modal identification results proposed a valuable
information about dynamic characteristics for Al-Sinyar Tower. The first 10 natural
frequencies along with mode shapes were captured. This experimental values will develop
a base line in order to an update model that will be studied in e detail later in this study.
Table 11, shows Comparison between frequencies obtained from Experimental and FEM Values
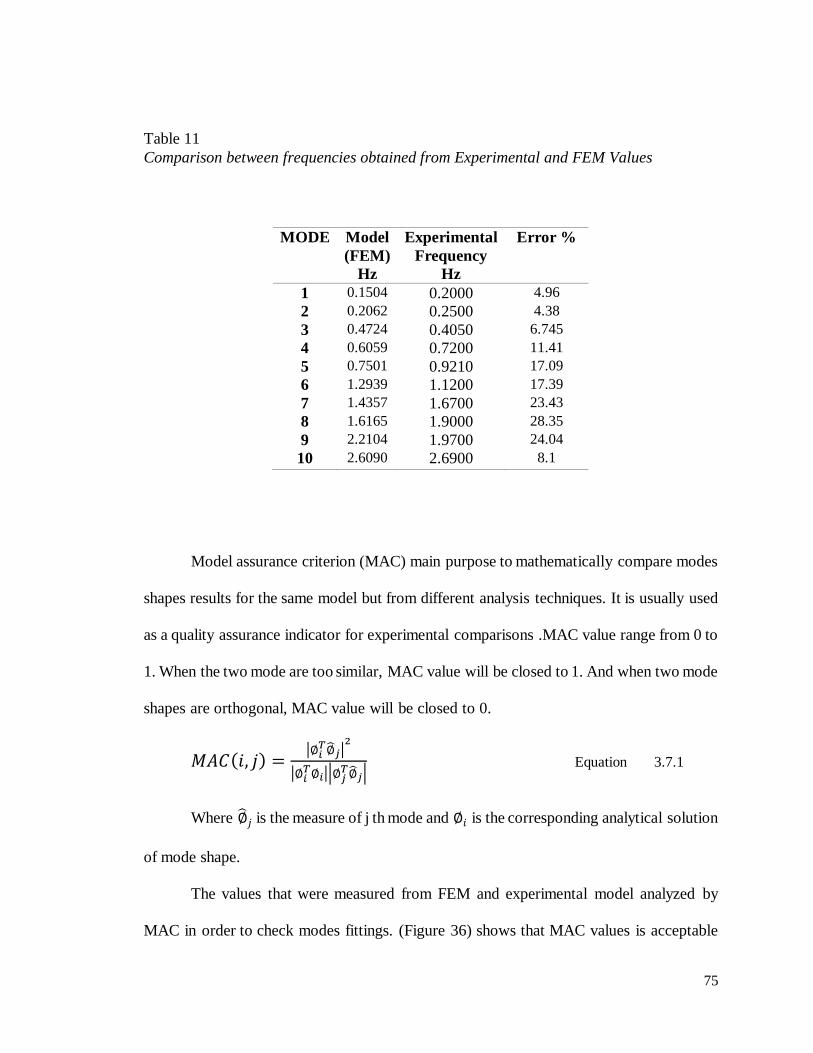
75
Table 11
Comparison between frequencies obtained from Experimental and FEM Values
Model assurance criterion (MAC) main purpose to mathematically compare modes
shapes results for the same model but from different analysis techniques. It is usually used
as a quality assurance indicator for experimental comparisons .MAC value range from 0 to
1. When the two mode are too similar, MAC value will be closed to 1. And when two mode
shapes are orthogonal, MAC value will be closed to 0.
𝑀𝐴𝐶(𝑖, 𝑗) =|∅𝑖
𝑇∅𝑗|2
|∅𝑖𝑇∅𝑖||∅𝑗
𝑇∅𝑗| Equation 3.7.1
Where ∅𝑗 is the measure of j th mode and ∅𝑖 is the corresponding analytical solution
of mode shape.
The values that were measured from FEM and experimental model analyzed by
MAC in order to check modes fittings. (Figure 36) shows that MAC values is acceptable
MODE Model
(FEM)
Hz
Experimental
Frequency
Hz
Error %
1 0.1504 0.2000 4.96
2 0.2062 0.2500 4.38
3 0.4724 0.4050 6.745
4 0.6059 0.7200 11.41
5 0.7501 0.9210 17.09
6 1.2939 1.1200 17.39
7 1.4357 1.6700 23.43
8 1.6165 1.9000 28.35
9 2.2104 1.9700 24.04
10 2.6090 2.6900 8.1
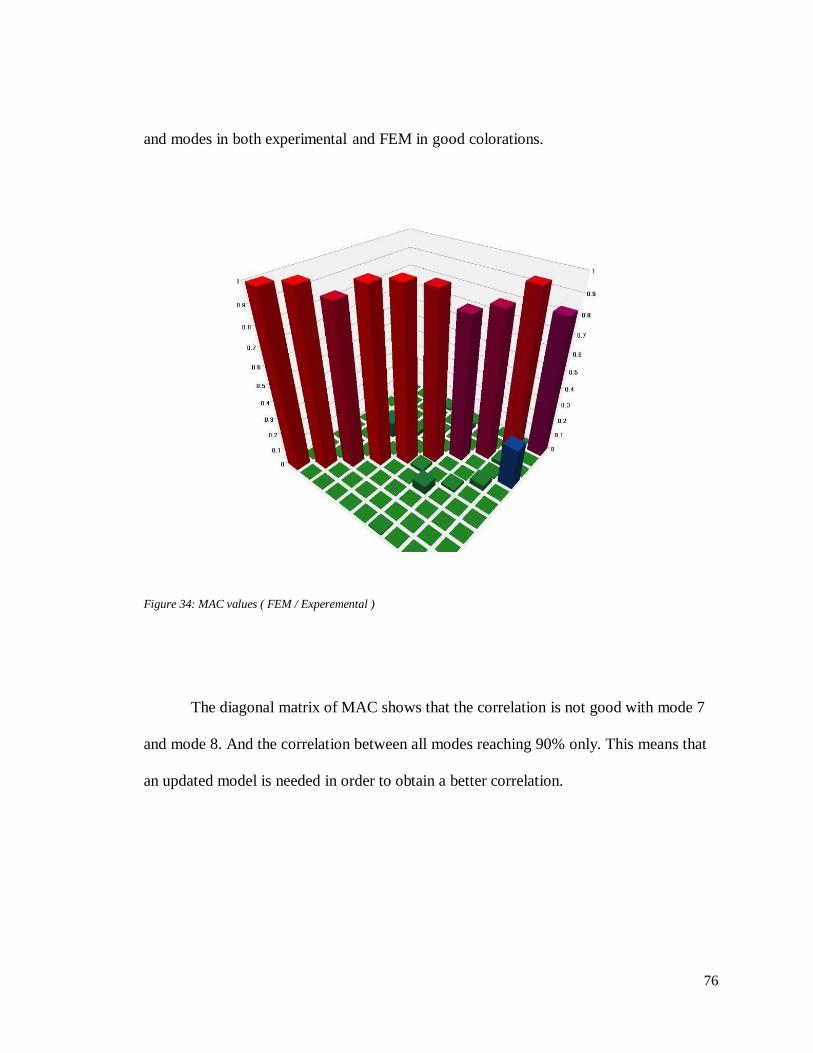
76
and modes in both experimental and FEM in good colorations.
Figure 34: MAC values ( FEM / Experemental )
The diagonal matrix of MAC shows that the correlation is not good with mode 7
and mode 8. And the correlation between all modes reaching 90% only. This means that
an updated model is needed in order to obtain a better correlation.

77
CHAPTER 4: MODEL UPDATING
4.1 Introduction
Model updating relies on changes of certain structure parameters in order to have a
closely matching values that were obtained by FEM. This depend on performing some
adjustments in FEM to minimize corresponding differences between experimental ambient
testing and numerical structure design. In this chapter; a study will be considered mainly
to optimize parameters such as the modules of Elasticity, Density and fixity release of
structural elements and how it will effect FEM dynamic values such as frequencies mode
shapes to give an understanding of parameters that will effect model to have a better
reflection of experimental response values obtained from ambient vibration testing.
However, structure design engineer has to accept various simplifications and assumptions
based on minimum code requirements of the real construction in geometry, masses,
stiffness, elasticity, loads, and other limitations during the stage of creation design model
in finite element model.
Three FEM updating techniques were used in this research by updating Modules of
Elasticity, Density and also combination of both parameters along with partial fixity
releases in order to have a final model update that represent experimental model with fairly
values. Accordingly MAC ratio were studied per each model update to check mode shape
coloration between update modes and experimental modes.
4.2 Optimizing of Density
In this optimization; a modification of material density of concrete was considered
as the frequency is increasing while density is decreasing according to the following

78
percentage of reduction. The density of concrete is a measurement of concrete’s solidity.
The density of concrete of normal weight is about 2,400 kg per cubic meter. And the
following table shows that in order to minimize frequency errors for the first 10 Mode,
density of concrete have to decrease 58 percent. These values were obtained by analyzing
model with the following density values (27000 kg, 20000 kg, 15000 kg and 14000 kg).
(Table 12)
Table 12
optimization values – Density parameter
Concrete Density as structure
specification (FEM)
Concrete Density
Optimization value
Percentage of
Optimization
24000 kg per meter 14000 kg per meter - 58.00%
After updating density parameter, the following natural frequency were obtained.
(Table 13)

79
Table 13
Comparison between frequencies obtained from Experimental and FEM Update- Density
parameter
The values that were measured from- FEM Updated by Density Parameter and
experimental model, analyzed by MAC in order to check modes fittings. (Figure 37)
shows that MAC values is increasing more than the values of MAC analysis in FEM
model discussed earlier.
MODE Model Update
(Density Parameter)
Experimental
Frequency
Error %
1 0.2009 0.2000 0.45
2 0.2555 0.2500 2.20
3 0.5232 0.4050 29.19
4 0.7535 0.7200 4.65
5 0.9877 0.9210 7.24
6 1.3288 1.1200 18.64
7 1.8112 1.6700 8.46
8 2.0745 1.9000 9.18
9 2.2532 1.9700 14.38
10 2.9422 2.6900 9.38

80
Figure 35: MAC values (FEM Update by Density Parameter/ Experimental)
4.3 Optimizing of Modules of Elasticity
In this optimization; a modification of Modules of Elasticity were considered as
the frequency is increasing while density is Modules of Elasticity increase according to
the following percentage of increment:
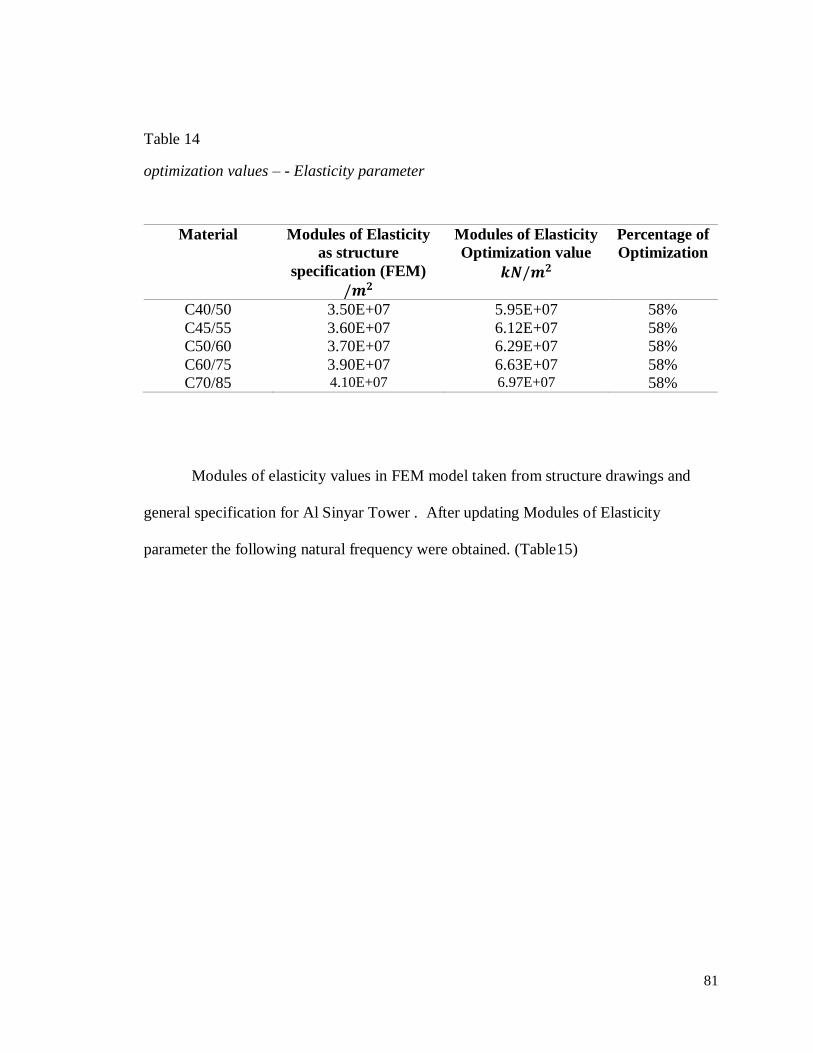
81
Table 14
optimization values – - Elasticity parameter
Material Modules of Elasticity
as structure
specification (FEM)
/𝒎𝟐
Modules of Elasticity
Optimization value
𝒌𝑵/𝒎𝟐
Percentage of
Optimization
C40/50 3.50E+07 5.95E+07 58%
C45/55 3.60E+07 6.12E+07 58%
C50/60 3.70E+07 6.29E+07 58%
C60/75 3.90E+07 6.63E+07 58%
C70/85 4.10E+07 6.97E+07 58%
Modules of elasticity values in FEM model taken from structure drawings and
general specification for Al Sinyar Tower . After updating Modules of Elasticity
parameter the following natural frequency were obtained. (Table15)

82
Table 15
Comparison between frequencies obtained from Experimental and FEM Update-
Elasticity parameter
And the MAC values as following (Figure 38)
Figure 36: MAC values (FEM Update by Elasticity Parameter/ Experimental)
MODE Model Update
(Elasticity
Parameter)
Experimental
Frequency
Error %
1 0.1961 0.2000 1.95
2 0.2588 0.2500 3.52
3 0.5010 0.4050 23.70
4 0.7550 0.7200 4.86
5 0.9780 0.9210 6.19
6 1.3170 1.1200 17.59
7 1.7920 1.6700 7.31
8 2.0866 1.9000 9.82
9 2.2321 1.9700 13.30
10 2.8785 2.6900 7.01

83
4.4 Final Model Update
From previous optimization torsional modes 3, 6 and 9 natural frequencies have a
high Error percentage. As this thesis main scope is to update FEM model in order to best
fit experimental model a deep investigation in SAP2000 Manual take place and after many
iteration the main controlling of torsion is related to end frame fixity, partial releases.
Going back to our assumption that columns beams connection is pin, it is an
assumption that codes and consultant office based their calculation. As cracked section
analysis concept is to let steel carry a full tensile loading and release moments throw pin
connection. However during structure service the connection between beam and columns
is partially fixed and this allow moment to be transferred to column and the behavior of
building act as a full frame during ambient vibration. And this is a valid point that can be
consider as a reason also to have a stiffer structure in reality more than Finite Element
model structure.
From this point a partial releases of torsion and moment were released as 50% and
the following optimization were considered:

84
Table 16
optimization values – Final Model Update 1/2
Material Modules of Elasticity
as structure
specification (FEM)
KN/m2
Modules of Elasticity
Optimization value
KN/m2
Percentage of
Optimization
C40/50 3.50E+07 4.39E+07 + 22.00%
C45/55 3.60E+07 4.51E+07 + 22.00%
C50/60 3.70E+07 4.76E+07 + 22.00%
C60/75 3.90E+07 5.00E+07 + 22.00%
C70/85 4.10E+07 4.39E+07 + 22.00%
Table 17
optimization values – Final Model Update 2/2
Concrete Density as structure
specification (FEM)
Concrete Density
Optimization value
Percentage of
Optimization
24000 kg per meter 18720 kg per meter - 22.00%
After this final iteration torsion modes were updated and this final updated Model is
satisfactory based on Error percent and Mac Values as below (Table18) (Figure 39)
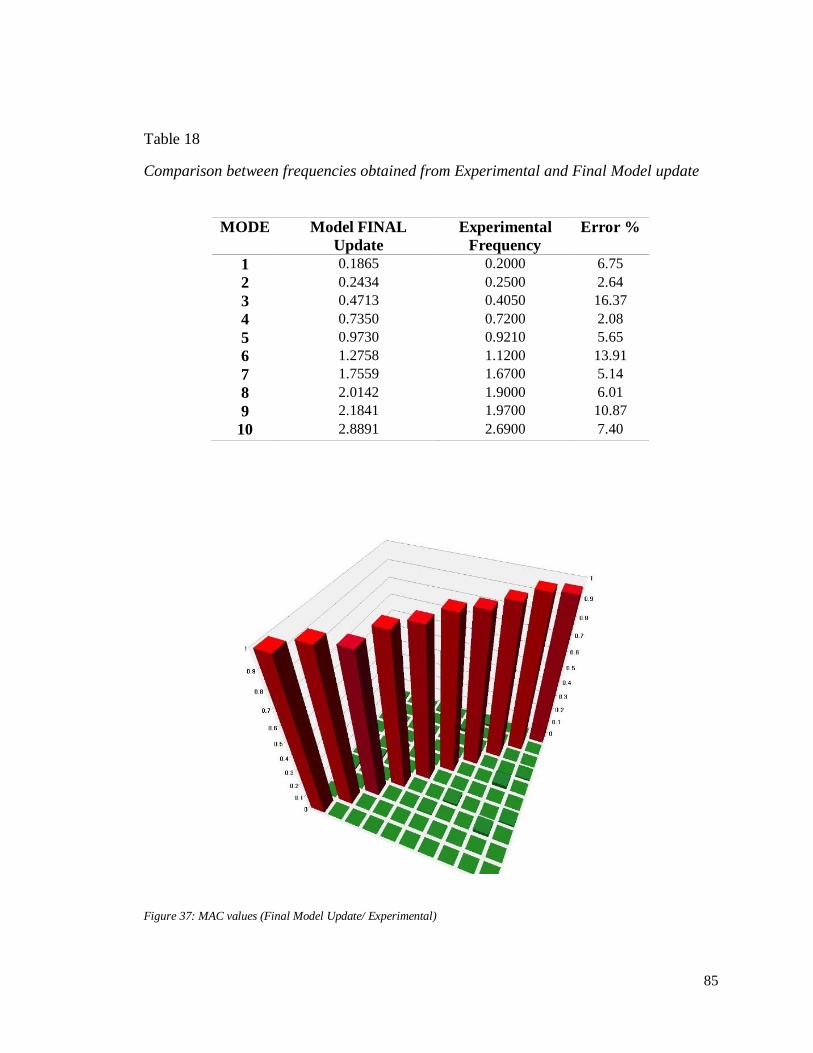
85
Table 18
Comparison between frequencies obtained from Experimental and Final Model update
Figure 37: MAC values (Final Model Update/ Experimental)
MODE Model FINAL
Update
Experimental
Frequency
Error %
1 0.1865 0.2000 6.75
2 0.2434 0.2500 2.64
3 0.4713 0.4050 16.37
4 0.7350 0.7200 2.08
5 0.9730 0.9210 5.65
6 1.2758 1.1200 13.91
7 1.7559 1.6700 5.14
8 2.0142 1.9000 6.01
9 2.1841 1.9700 10.87
10 2.8891 2.6900 7.40

86
CHAPTER 5: CONCLUSIONS AND RECOMMENDATION
This study focus on ambient vibration testing on the SYNIAR TOWER, a 52-story
high building which consists of 2B+G+52 floors in Al Dafna Area in Qatar, with a total
built up area of 74,747 sqm. Testing was conducted to determine structure modal
characteristics which include natural periods, damping ratios and mode shapes by using
ME’SCOPE program. Results from analyzing this building by ambient vibration testing
were compared to FE modeling in SAP2000 that were modeled using structure drawings
and specifications from consultant office. Ambient test were conducted by using wires and
wireless sensors and the following conclusion can be drawn from this study:
1- Distances between sensors and modules were more than 50 m, especially for
sensor in 48th floor. So Practically, it’s hard to deal with more than 1000 meter
cables especially with a very sensitive device
2- Ambient vibration results based on As-built environment provided higher
frequencies values in comparison to FEM because the stiffness provided by
cladding, façade and walls eventually increased the system’s stiffness, which
cannot be revealed in FE modeling based on structural drawings only.
3- This first 10 modes and corresponding mode shapes were determine from
ambient test and the fundamental frequency of the building was 0.2 Hz
4- The stiffness impact of non-structure elements were found to be important factor
to minimize the differences between experimental and analytical natural
frequencies and mode shapes.
5- Results from model updating shows that structure was sensitive to the following
a. Young’s Modulus for the reinforced concrete.

87
b. Materials Density for columns and walls.
c. Fixity connection between columns and beams.
6- Initial model analysis through SAP2000 was implemented by using structural
drawings and the first natural periods obtained are 65% less than natural periods
that were obtained from ambient test.
7- Final updated model were satisfactory according to modal assurance criterion
(MAC) and frequency deferent errors.
8- Model updating main concept to have an ideal simulation of structure that can
represent real structure behavior and optimized values of deferent parameters can
exceed limitation in order to obtain sufficient results that can represent structure
experimental behavior.
Due to the limitation time of this test in site and the complexity of structure
geometry that include structure and non-structure elements, further investigation is needed
to study structure design of high-rise building and the effect of non-liner behavior of
concrete cracked sections and load disruptions throw beams , columns and walls.

88
REFERENCES
Abdelrazaq, A. (2010). Design and construction planning of the Burj Khalifa, Dubai,
UAE.
Baiant, Z. P. (1975). Theory of creep and shrinkage in concrete structures: a précis of
recent developments, Mechanics Today, Vol. 2. In: Pergamon Press, New York,
NY.
Bayraktar, A., Türker, T., Sevım, B., Altunişik, A. C., & Yildirim, F. (2009). Modal
parameter identification of Hagia Sophia bell-tower via ambient vibration test.
Journal of Nondestructive Evaluation, 28(1), 37-47.
Binda, L., Gatti, G., Mangano, G., Poggi, C., & Landriani, G. S. (1992). Collapse of the
civic tower of Pavia: a survey of the materials and structure. Masonry
International, 6(1), 11-20.
Birtharia, A., & Jain, S. (2015). Applications of Ambient Vibration Testing: An
Overview. International Research Journal of Engineering and
Technology (IRJET), 02(05), 845-852.
Brincker, R., Andersen, P., & Jacobsen, N.-J. (2007). Automated frequency domain
decomposition for operational modal analysis.
Brincker, R., Ventura, C., & Andersen, P. (2003). Why output-only modal testing is a
desirable tool for a wide range of practical applications.
Brincker, R., Zhang, L., & Andersen, P. (2000). Modal identification from ambient
responses using frequency domain decomposition.
Burkett, J. L. (2005). Benchmark studies for structural health monitoring using analytical
and experimental models.

89
Catbas, F. N., Lenett, M., Brown, D. L., Doebling, S. W., Farrar, C. R., & Turer, A.
(1997). Modal analysis of multi-reference impact test data for steel stringer
bridges.
Chang, P. C., Flatau, A., & Liu, S. C. (2003). Health monitoring of civil infrastructure.
Structural health monitoring, 2(3), 257-267.
Chintalapudi, K., Paek, J., Gnawali, O., Fu, T. S., Dantu, K., Caffrey, J., . . . Masri, S.
(2006). Structural damage detection and localization using NETSHM.
Ciloglu, S. K. (2006). The impact of uncertainty in operational modal analysis for
structural identification of constructed systems.
Doebling, S. W., Farrar, C. R., Prime, M. B., & Shevitz, D. W. (1996). Damage
identification and health monitoring of structural and mechanical systems from
changes in their vibration characteristics: a literature review.
Ewins, D. J. (1984). Modal testing: theory and practice (Vol. 15): Research studies press
Letchworth.
Farrar, C. R., & Worden, K. (2012). Structural health monitoring: a machine learning
perspective: John Wiley & Sons.
Fladung, W., & Rost, R. (1997). Application and correction of the exponential window
for frequency response functions. Mechanical systems and signal processing,
11(1), 23-36.
Freeman, S. A., Nicoletti, J. P., & Tyrell, J. V. (1975). Evaluations of existing buildings
for seismic risk – A case study of Puget Sound Naval Shipyard. Paper presented at
the U.S. National Conference on Earthquake Engineering, Bremeton.
Gentile, C. (2005). Operational modal analysis and assessment of historical structures.
90
Gul, M., & Catbas, F. N. (2005). Structural system identification: Evaluation of two
methods and example applications.
Gul, M., & Catbas, F. N. (2008). Ambient vibration data analysis for structural
identification and global condition assessment. Journal of Engineering
Mechanics, 134(8), 650-662.
Ivanovic, S. S., Trifunac, M. D., & Todorovska, M. I. (2000). Ambient vibration tests of
structures-a review. ISET Journal of Earthquake Technology, 37(4), 165-197.
Johnson, D. H. (2006). Signal-to-noise ratio. Scholarpedia, 1(12), 2088.
Kaynardağ, K., & Soyoz, S. (2017). Effect of identification on seismic performance
assessment of a tall building. Bulletin of Earthquake Engineering, 15(8), 3227-
3243.
Ko, J. M., & Ni, Y. Q. (2005). Technology developments in structural health monitoring
of large-scale bridges. Engineering structures, 27(12), 1715-1725.
Kuroiwa, J. (1967). Vibration tests of a multistory building.
Lionello, A., Cavaggioni, I., Modena, C., Casarin, F., Rossi, P. P., & Rossi, C. (2004).
Experimental and numerical analysis of the structural behaviour of St. Stefano’s
bell-tower in Venice.
Lorenzo, G. W. F., Mercerat, D., d'Avila, M. P. S., Bertrand, E., & Deschamps, A.
(2015). Operational Modal Analysis of a high rise RC building and modelling.
Lynch, J. P., & Loh, K. J. (2006). A summary review of wireless sensors and sensor
networks for structural health monitoring. Shock and Vibration Digest, 38(2), 91-
130.
Michel, C., Guéguen, P., El Arem, S., Mazars, J., & Kotronis, P. (2010). Full‐scale

91
dynamic response of an RC building under weak seismic motions using
earthquake recordings, ambient vibrations and modelling. Earthquake
Engineering & Structural Dynamics, 39(4), 419-441.
Model-based System for Rapid Post-disaster Health Monitoring and Damage Detection
of Civil Infrastructure. (2015). Retrieved from
https://techtransfer.universityofcalifornia.edu/NCD/24387.html
Modena, C., Lourenco, P. B., & Roca, P. (2004). Structural Analysis of Historical
Constructions-2 Volume Set: Possibilities of Numerical and Experimental
Techniques-Proceedings of the IVth Int. Seminar on Structural Analysis of
Historical Constructions, 10-13 November 2004, Padova, Italy: CRC Press.
Mottershead, J. E., Friswell, M. I., Ng, G. H. T., & Brandon, J. A. (1996). Geometric
parameters for finite element model updating of joints and constraints.
Mechanical Systems and Signal Processing, 10(2), 171-182.
Moyo, P., Brownjohn, J. M. W., Suresh, R., & Tjin, S. C. (2005). Development of fiber
Bragg grating sensors for monitoring civil infrastructure. Engineering structures,
27(12), 1828-1834.
Ni, Y. Q., Xia, Y., Liao, W. Y., & Ko, J. M. (2009). Technology innovation in
developing the structural health monitoring system for Guangzhou New TV
Tower. Structural Control and Health Monitoring, 16(1), 73-98.
Park, G., Sohn, H., Farrar, C. R., & Inman, D. J. (2003). Overview of piezoelectric
impedance-based health monitoring and path forward. Shock and Vibration
Digest, 35(6), 451-464.
Peeters, B., & De Roeck, G. (2001). Stochastic system identification for operational

92
modal analysis: a review. Journal of Dynamic Systems, Measurement, and
Control, 123(4), 659-667.
Rainieri, C., & Fabbrocino, G. (2014). Operational modal analysis of civil engineering
structures. Springer, New York, 142, 143.
Rainieri, C., Fabbrocino, G., Cosenza, E., & Manfredi, G. (2007). The Operational
Modal Analysis for the identification of historical structures: the Tower of the
Nations in Naples.
Ren, W.-X., & Zong, Z.-H. (2004). Output-only modal parameter identification of civil
engineering structures. Structural Engineering and Mechanics, 17(3-4), 429-444.
Schwarz, B. J., & Richardson, M. H. (1999). Experimental modal analysis. CSI
Reliability week, 35(1), 1-12.
Teughels, A., & De Roeck, G. (2004). Structural damage identification of the highway
bridge Z24 by FE model updating. Journal of Sound and Vibration, 278(3), 589-
610.
Valluzzi, M. R., Da Porto, F., & Modena, C. (2003). Structural investigations and
strengthening of the civic tower in Vicenza. Structural Faults & Repair-2003,
Commonwealth Institute, Kensington, London, UK.
Wu, Z., & Li, S. (2007). Two-level damage detection strategy based on modal parameters
from distributed dynamic macro-strain measurements. Journal of Intelligent
Material Systems and Structures, 18(7), 667-676.
Yingying, Z., Xiaoguang, S., Qilin, Z., & Henglin, L. V. (2015). Fracture failure analysis
and strength criterion for PTFE-coated woven fabrics. Journal of Composite
Materials, 49(12), 1409-1421.

93
APPENDICES
Appendix A: Columns Elements Arrangement
Appendix B: Shape Matrix

94
Appendix A: Columns Elements Arrangement
Column Arrangement
Floor C1 C2 C3 C4 C5 C6 C7 C8 C9
G 1200x1200 1200x1200 1000x1700 1000x1700 100x2300 100x2300 1200x2600 1200x2600 1900x1100
1 1200x1200 1200x1200 1000x1700 1000x1700 100x2300 100x2300 1200x2600 1200x2600 1900x1100
2 1200x1200 1200x1200 1000x1700 1000x1700 100x2300 100x2300 1200x2600 1200x2600 1900x1100
3 1200x1200 1200x1200 1000x1700 1000x1700 100x2300 100x2300 1200x2600 1200x2600 1900x1100
4 1200x1200 1200x1200 1000x1700 1000x1700 100x2300 100x2300 1200x2600 1200x2600 1900x1100
5 1200x1200 1200x1200 1000x1700 1000x1700 100x2300 100x2300 1200x2600 1200x2600 1900x1100
6 1200x1200 1200x1200 1000x1700 1000x1700 100x2300 100x2300 1200x2600 1200x2600 1900x1100
7 1200x1200 1200x1200 1000x1700 1000x1700 100x2300 100x2300 1200x2600 1200x2600 1900x1100
8 1100x1100 1100x1100 900x1600 900x1600 1000x2100 1000x2100 1100x2600 1100x2600 1900x900
9 1100x1100 1100x1100 900x1600 900x1600 1000x2100 1000x2100 1100x2600 1100x2600 1900x900
10 1100x1100 1100x1100 900x1600 900x1600 1000x2100 1000x2100 1100x2600 1100x2600 1900x900
11 1100x1100 1100x1100 900x1600 900x1600 1000x2100 1000x2100 1100x2600 1100x2600 1900x900
12 1100x1100 1100x1100 900x1600 900x1600 1000x2100 1000x2100 1100x2600 1100x2600 1900x900
13 1100x1100 1100x1100 900x1600 900x1600 1000x2100 1000x2100 1100x2600 1100x2600 1900x900

95
14 1100x1100 1100x1100 900x1600 900x1600 1000x2100 1000x2100 1100x2600 1100x2600 1900x900
15 1100x1100 1100x1100 900x1600 900x1600 1000x2100 1000x2100 1100x2600 1100x2600 1900x900
16 1100x1100 1100x1100 900x1600 900x1600 1000x2100 1000x2100 1100x2600 1100x2600 1900x900
17 1100x1100 1100x1100 900x1600 900x1600 1000x2100 1000x2100 1100x2600 1100x2600 1900x900
18 1100x1100 1100x1100 900x1600 900x1600 1000x2100 1000x2100 1100x2600 1100x2600 1900x900
19 1100x1100 1100x1100 900x1600 900x1600 1000x2100 1000x2100 1100x2600 1100x2600 1900x900
20 1100x1100 1100x1100 900x1600 900x1600 1000x2100 1000x2100 1100x2600 1100x2600 1900x900
21 900x900 900x900 800x1600 800x1600 800x2100 800x2100 900x2500 900x2500 1900x700
22 900x900 900x900 800x1600 800x1600 800x2100 800x2100 900x2500 900x2500 1900x700
23 900x900 900x900 800x1600 800x1600 800x2100 800x2100 900x2500 900x2500 1900x700
24 900x900 900x900 800x1600 800x1600 800x2100 800x2100 900x2500 900x2500 1900x700
25 900x900 900x900 800x1600 800x1600 800x2100 800x2100 900x2500 900x2500 1900x700
26 900x900 900x900 800x1600 800x1600 800x2100 800x2100 900x2500 900x2500 1900x700
27 900x900 900x900 800x1600 800x1600 800x2100 800x2100 900x2500 900x2500 1900x700
28 900x900 900x900 800x1600 800x1600 800x2100 800x2100 900x2500 900x2500 1900x700
29 900x900 900x900 800x1600 800x1600 800x2100 800x2100 900x2500 900x2500 1900x700
30 900x900 900x900 800x1600 800x1600 800x2100 800x2100 900x2500 900x2500 1900x700
31 900x900 900x900 800x1600 800x1600 800x2100 800x2100 900x2500 900x2500 1900x700
32 900x900 900x900 800x1600 800x1600 800x2100 800x2100 900x2500 900x2500 1900x700
33 900x900 900x900 800x1600 800x1600 800x2100 800x2100 900x2500 900x2500 1900x700
34 900x900 900x900 800x1600 800x1600 800x2100 800x2100 900x2500 900x2500 1900x700
35 900x900 900x900 800x1600 800x1600 800x2100 800x2100 900x2500 900x2500 1900x700

96
36 700x800 700x800 600x1400 600x1400 600x1900 600x1900 800x2300 800x2300 1700x600
37 700x800 700x800 600x1400 600x1400 600x1900 600x1900 800x2300 800x2300 1700x600
38 700x800 700x800 600x1400 600x1400 600x1900 600x1900 800x2300 800x2300 1700x600
39 700x800 700x800 600x1400 600x1400 600x1900 600x1900 800x2300 800x2300 1700x600
40 700x800 700x800 600x1400 600x1400 600x1900 600x1900 800x2300 800x2300 1700x600
41 700x800 700x800 600x1400 600x1400 600x1900 600x1900 800x2300 800x2300 1700x600
42 700x800 700x800 600x1400 600x1400 600x1900 600x1900 800x2300 800x2300 1700x600
43 700x800 700x800 600x1400 600x1400 600x1900 600x1900 800x2300 800x2300 1700x600
44 700x800 700x800 600x1400 600x1400 600x1900 600x1900 800x2300 800x2300 1700x600
45 700x800 700x800 600x1400 600x1400 600x1900 600x1900 800x2300 800x2300 1700x600
46 700x800 700x800 600x1400 600x1400 600x1900 600x1900 800x2300 800x2300 1700x600
47 700x800 700x800 600x1400 600x1400 600x1900 600x1900 800x2300 800x2300 1700x600
48 700x800 700x800 600x1400 600x1400 600x1900 600x1900 800x2300 800x2300 1700x600
49 700x800 700x800 600x1400 600x1400 600x1900 600x1900 800x2300 800x2300 1700x600
50 700x800 700x800 600x1400 600x1400 600x1900 600x1900 800x2300 800x2300 1700x600
51 700x800 700x800 600x1400 600x1400 600x1900 600x1900 800x2300 800x2300 1700x600
52 700x800 700x800 600x1400 600x1400 600x1900 600x1900 800x2300 800x2300 1700x600
ROOF 700x800 700x800 600x1400 600x1400 600x1900 600x1900 800x2300 800x2300 1700x600

97
Appendix B : Shape Matrix
Experimental Model Test Model SHAPE1 SHAPE2 SHAPE3 SHAPE4 SHAPE5 SHAPE6 SHAPE7 SHAPE8 SHAPE9 SHAPE10
1X:2X 5.00E-06 3.20E-04 -2.11E-04 1.61E-05 1.94E-03 -4.91E-04 2.75E-05 3.00E-03 -1.35E-03 2.95E-05
1Y:2X 5.97E-05 -8.35E-06 3.30E-04 1.36E-04 2.71E-05 6.55E-04 2.06E-04 -1.26E-04 1.90E-03 1.29E-04
2X:2X 5.02E-06 3.96E-04 2.57E-04 9.38E-06 2.07E-03 5.77E-04 1.37E-05 3.11E-03 1.72E-03 3.80E-06
2Y:2X 7.09E-05 7.50E-05 -3.47E-04 1.50E-04 1.38E-04 -7.09E-04 2.29E-04 1.55E-04 -2.00E-03 1.64E-04
3X:2X 3.19E-05 2.86E-03 -2.58E-03 9.61E-05 1.63E-02 -5.37E-03 1.35E-04 1.80E-02 -1.10E-02 9.80E-05
3Y:2X 4.66E-04 -1.75E-04 3.62E-03 1.44E-03 -1.35E-03 7.62E-03 1.52E-03 -2.24E-03 1.63E-02 5.22E-04
4X:2X 8.99E-06 2.91E-03 2.72E-03 3.66E-05 1.62E-02 5.88E-03 3.30E-05 1.74E-02 1.30E-02 -2.88E-05
4Y:2X 4.33E-04 3.09E-05 -3.24E-03 1.34E-03 2.87E-04 -6.76E-03 1.48E-03 3.51E-04 -1.44E-02 6.27E-04
5X:2X 7.11E-05 9.05E-03 -6.74E-03 1.33E-04 2.63E-02 -7.51E-03 -1.91E-05 -2.87E-03 3.97E-03 -1.15E-04
5Y:2X 1.22E-03 -3.70E-04 8.72E-03 2.22E-03 -1.53E-03 9.92E-03 -7.62E-06 5.51E-04 -5.08E-03 -5.31E-04
6X:2X -5.58E-06 8.12E-03 6.35E-03 2.86E-05 2.33E-02 7.39E-03 -8.75E-06 -1.95E-03 -3.75E-03 3.38E-05
6Y:2X 1.32E-03 9.26E-05 -8.87E-03 2.35E-03 2.97E-04 -9.93E-03 -2.27E-05 -6.38E-04 5.20E-03 -7.10E-04
7X:2X 8.30E-05 1.24E-02 -8.30E-03 3.27E-05 7.64E-03 -5.75E-04 -1.29E-04 -1.88E-02 1.20E-02 7.46E-05
7Y:2X 1.91E-03 -5.88E-04 1.22E-02 7.15E-04 -4.42E-04 9.24E-04 -1.88E-03 2.47E-03 -1.83E-02 2.52E-04
8X:2X -3.99E-05 1.37E-02 9.54E-03 -7.99E-06 8.47E-03 8.12E-04 -3.33E-05 -1.88E-02 -1.48E-02 -2.82E-05
8Y:2X 1.74E-03 1.09E-04 -1.04E-02 6.45E-04 -2.02E-04 -8.00E-04 -1.73E-03 -6.17E-04 1.54E-02 3.45E-04
9X:2X 4.94E-06 1.63E-02 -9.86E-03 -2.34E-05 -2.02E-02 7.44E-03 5.08E-05 9.58E-03 -8.70E-03 -2.80E-05
9Y:2X 2.56E-03 -1.78E-04 1.37E-02 -1.94E-03 8.15E-04 -1.05E-02 9.16E-04 -1.08E-03 1.26E-02 1.54E-05
10X:2X -1.02E-04 1.77E-02 1.12E-02 8.87E-06 -2.15E-02 -8.64E-03 -1.82E-05 9.47E-03 1.05E-02 1.98E-05
10Y:2X 2.49E-03 3.89E-04 -1.29E-02 -1.83E-03 -5.85E-04 9.78E-03 9.34E-04 6.57E-04 -1.15E-02 -4.88E-05

98
Finite Element Model SHAPE1 SHAPE2 SHAPE3 SHAPE4 SHAPE5 SHAPE6 SHAPE7 SHAPE8 SHAPE9 SHAPE10
1X:2X 0.00E+00 0.00E+00 0.00E+00 0.00E+00 0.00E+00 0.00E+00 0.00E+00 0.00E+00 0.00E+00 0.00E+00
1Y:2X 0.00E+00 0.00E+00 0.00E+00 0.00E+00 0.00E+00 0.00E+00 0.00E+00 0.00E+00 0.00E+00 0.00E+00
2X:2X 0.00E+00 0.00E+00 0.00E+00 0.00E+00 0.00E+00 0.00E+00 0.00E+00 0.00E+00 0.00E+00 0.00E+00
2Y:2X 0.00E+00 0.00E+00 0.00E+00 0.00E+00 0.00E+00 0.00E+00 0.00E+00 0.00E+00 0.00E+00 0.00E+00
3X:2X 1.23E-06 9.00E-04 -1.50E-04 -1.60E-06 3.00E-03 -5.31E-03 -1.80E-05 -4.20E-03 -1.14E-02 1.70E-05
3Y:2X -8.00E-04 -4.16E-07 2.34E-04 -2.60E-03 -5.50E-06 8.29E-03 -4.20E-03 1.80E-05 1.86E-02 -4.40E-03
4X:2X -2.40E-07 9.00E-04 1.82E-04 -2.90E-06 3.20E-03 3.57E-03 -3.80E-06 -4.30E-03 8.26E-03 -4.00E-05
4Y:2X -8.00E-04 2.00E-06 -2.46E-04 -2.60E-03 1.59E-05 -6.68E-03 -4.10E-03 -3.10E-05 -1.50E-02 -4.50E-03
5X:2X 4.35E-06 2.50E-03 -1.83E-03 -1.30E-06 4.40E-03 -7.42E-03 -2.60E-05 -1.90E-03 4.13E-03 2.00E-06
5Y:2X -2.40E-03 1.80E-06 2.57E-03 -4.50E-03 -3.02E-06 1.08E-02 -2.50E-03 -2.00E-05 -5.83E-03 3.00E-03
6X:2X 1.00E-06 2.50E-03 1.93E-03 1.02E-06 4.40E-03 4.48E-03 2.00E-05 -1.90E-03 -2.40E-03 5.00E-05
6Y:2X -2.40E-03 5.00E-06 -2.30E-03 -4.50E-03 8.77E-06 -9.86E-03 -2.40E-03 2.00E-05 5.41E-03 3.00E-03
7X:2X 7.95E-06 4.10E-03 -4.45E-03 -5.80E-06 1.20E-03 -5.68E-04 -7.00E-06 4.40E-03 1.25E-02 2.00E-05
7Y:2X -4.10E-03 4.00E-06 6.19E-03 -1.70E-03 1.05E-05 1.01E-03 4.10E-03 -5.00E-04 -2.10E-02 7.00E-05
8X:2X 1.09E-06 4.10E-03 4.51E-03 9.80E-06 1.20E-03 4.92E-04 3.00E-05 4.50E-03 -9.40E-03 5.00E-05
8Y:2X -4.10E-03 7.00E-06 -6.30E-03 -1.60E-03 -1.37E-05 -7.90E-04 4.20E-03 6.00E-05 1.60E-02 -2.00E-04
9X:2X 1.97E-05 5.50E-03 -5.89E-03 -1.35E-05 -4.00E-03 7.36E-03 2.50E-05 -2.20E-03 -9.06E-03 -1.60E-05
9Y:2X -5.60E-03 6.60E-06 8.66E-03 4.00E-03 2.38E-05 -1.14E-02 -1.80E-03 -5.20E-05 1.45E-02 -2.00E-04
10X:2X 5.46E-06 5.50E-03 6.39E-03 -1.35E-05 -4.00E-03 -5.24E-03 -3.58E-05 -2.30E-03 6.70E-03 1.40E-05
10Y:2X -5.60E-03 7.70E-06 -7.38E-03 4.00E-03 -2.74E-05 9.68E-03 -1.90E-03 -5.10E-05 -1.20E-02 -2.00E-04

99
Model Update by optimizing Density SHAPE1 SHAPE2 SHAPE3 SHAPE4 SHAPE5 SHAPE6 SHAPE7 SHAPE8 SHAPE9 SHAPE10
1X:2X 0.00E+00 0.00E+00 0.00E+00 0.00E+00 0.00E+00 0.00E+00 0.00E+00 0.00E+00 0.00E+00 0.00E+00
1Y:2X 0.00E+00 0.00E+00 0.00E+00 0.00E+00 0.00E+00 0.00E+00 0.00E+00 0.00E+00 0.00E+00 0.00E+00
2X:2X 0.00E+00 0.00E+00 0.00E+00 0.00E+00 0.00E+00 0.00E+00 0.00E+00 0.00E+00 0.00E+00 0.00E+00
2Y:2X 0.00E+00 0.00E+00 0.00E+00 0.00E+00 0.00E+00 0.00E+00 0.00E+00 0.00E+00 0.00E+00 0.00E+00
3X:2X 1.93E-06 1.30E-03 -2.27E-03 -2.00E-06 4.30E-03 -5.34E-03 2.50E-05 -5.70E-03 -1.09E-02 -2.30E-05
3Y:2X -1.20E-03 -3.90E-07 3.19E-03 -3.80E-03 -6.90E-06 7.58E-03 -5.50E-03 2.50E-05 1.62E-02 -5.90E-03
4X:2X -2.40E-07 1.30E-03 2.39E-03 -3.00E-06 4.30E-03 5.85E-03 -5.00E-05 -5.70E-03 1.29E-02 -5.00E-05
4Y:2X -8.00E-04 4.10E-06 -2.85E-03 -3.80E-03 2.20E-05 -6.73E-03 -5.50E-03 -4.20E-05 -1.43E-02 -6.00E-03
5X:2X 6.20E-06 3.50E-03 -5.93E-03 -2.17E-06 5.80E-03 -7.47E-03 -2.00E-05 -5.00E-05 3.95E-03 8.00E-05
5Y:2X -3.40E-03 2.80E-06 7.67E-03 -5.90E-03 -3.02E-06 9.87E-03 -9.00E-04 -4.00E-05 -5.05E-03 5.70E-03
6X:2X 1.70E-06 3.50E-03 5.59E-03 2.00E-06 5.80E-03 7.35E-03 4.00E-05 2.40E-05 -3.73E-03 8.00E-05
6Y:2X -3.40E-03 7.70E-06 -7.81E-03 -5.90E-03 9.60E-06 -9.88E-03 -8.00E-04 5.00E-05 5.17E-03 5.80E-03
7X:2X 1.09E-05 5.70E-03 -3.92E-03 -1.24E-05 1.10E-03 -5.72E-04 -1.00E-05 5.90E-03 1.19E-02 2.00E-05
7Y:2X -5.70E-03 4.66E-05 5.45E-03 -1.60E-03 1.50E-05 9.19E-04 5.90E-03 -5.00E-05 -1.82E-02 -3.50E-03
8X:2X 4.30E-06 5.70E-03 3.97E-03 1.24E-05 1.00E-03 8.08E-04 2.80E-05 6.00E-03 -1.47E-02 7.50E-05
8Y:2X -5.70E-03 9.60E-06 -5.54E-03 -1.60E-03 -2.00E-05 -7.96E-04 6.00E-03 6.00E-05 1.53E-02 -3.60E-03
9X:2X 1.50E-05 7.50E-03 -8.68E-03 -1.90E-05 -5.90E-03 6.62E-03 3.70E-05 -2.90E-03 -7.74E-03 -2.00E-05
9Y:2X -7.60E-03 9.60E-06 1.21E-02 6.00E-03 3.00E-05 -9.35E-03 -2.40E-03 7.00E-05 1.12E-02 -3.00E-04
10X:2X 6.60E-06 7.50E-03 9.86E-03 -1.90E-05 -6.00E-03 -7.69E-03 -5.00E-05 -3.00E-03 9.35E-03 2.00E-05
10Y:2X -7.60E-03 1.20E-05 -1.14E-02 6.10E-03 -3.50E-05 8.70E-03 -2.50E-03 -7.00E-05 -1.02E-02 -2.00E-04
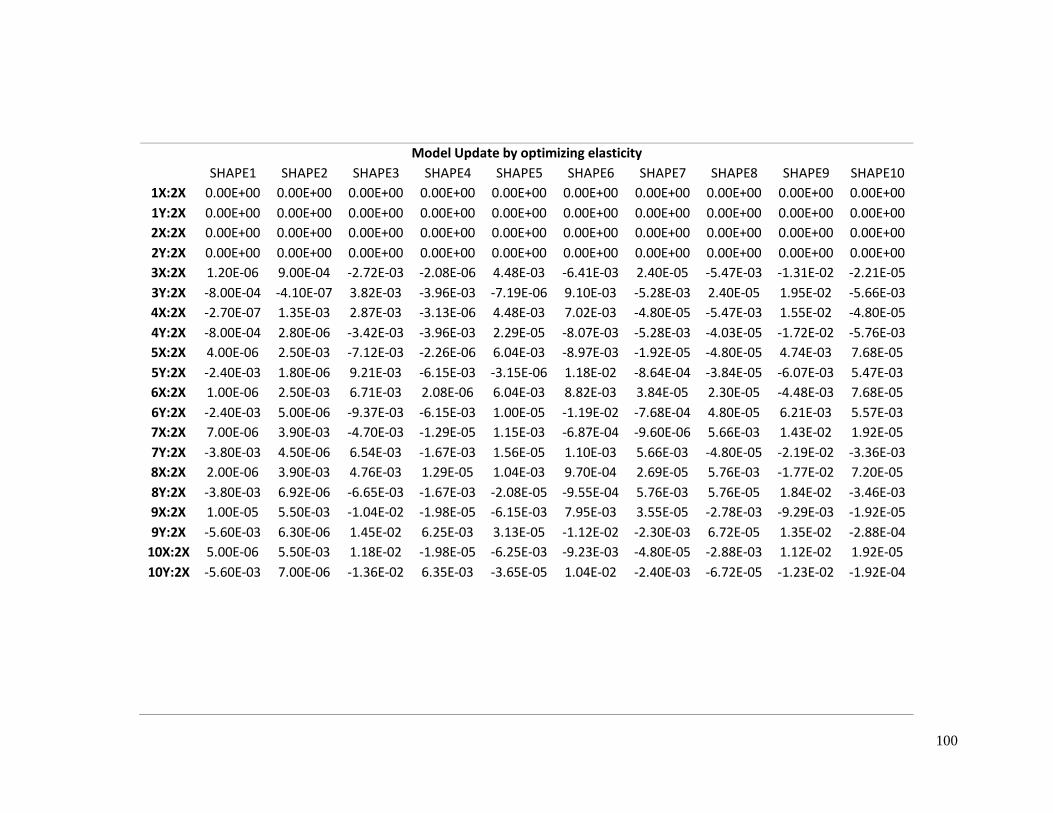
100
Model Update by optimizing elasticity SHAPE1 SHAPE2 SHAPE3 SHAPE4 SHAPE5 SHAPE6 SHAPE7 SHAPE8 SHAPE9 SHAPE10
1X:2X 0.00E+00 0.00E+00 0.00E+00 0.00E+00 0.00E+00 0.00E+00 0.00E+00 0.00E+00 0.00E+00 0.00E+00
1Y:2X 0.00E+00 0.00E+00 0.00E+00 0.00E+00 0.00E+00 0.00E+00 0.00E+00 0.00E+00 0.00E+00 0.00E+00
2X:2X 0.00E+00 0.00E+00 0.00E+00 0.00E+00 0.00E+00 0.00E+00 0.00E+00 0.00E+00 0.00E+00 0.00E+00
2Y:2X 0.00E+00 0.00E+00 0.00E+00 0.00E+00 0.00E+00 0.00E+00 0.00E+00 0.00E+00 0.00E+00 0.00E+00
3X:2X 1.20E-06 9.00E-04 -2.72E-03 -2.08E-06 4.48E-03 -6.41E-03 2.40E-05 -5.47E-03 -1.31E-02 -2.21E-05
3Y:2X -8.00E-04 -4.10E-07 3.82E-03 -3.96E-03 -7.19E-06 9.10E-03 -5.28E-03 2.40E-05 1.95E-02 -5.66E-03
4X:2X -2.70E-07 1.35E-03 2.87E-03 -3.13E-06 4.48E-03 7.02E-03 -4.80E-05 -5.47E-03 1.55E-02 -4.80E-05
4Y:2X -8.00E-04 2.80E-06 -3.42E-03 -3.96E-03 2.29E-05 -8.07E-03 -5.28E-03 -4.03E-05 -1.72E-02 -5.76E-03
5X:2X 4.00E-06 2.50E-03 -7.12E-03 -2.26E-06 6.04E-03 -8.97E-03 -1.92E-05 -4.80E-05 4.74E-03 7.68E-05
5Y:2X -2.40E-03 1.80E-06 9.21E-03 -6.15E-03 -3.15E-06 1.18E-02 -8.64E-04 -3.84E-05 -6.07E-03 5.47E-03
6X:2X 1.00E-06 2.50E-03 6.71E-03 2.08E-06 6.04E-03 8.82E-03 3.84E-05 2.30E-05 -4.48E-03 7.68E-05
6Y:2X -2.40E-03 5.00E-06 -9.37E-03 -6.15E-03 1.00E-05 -1.19E-02 -7.68E-04 4.80E-05 6.21E-03 5.57E-03
7X:2X 7.00E-06 3.90E-03 -4.70E-03 -1.29E-05 1.15E-03 -6.87E-04 -9.60E-06 5.66E-03 1.43E-02 1.92E-05
7Y:2X -3.80E-03 4.50E-06 6.54E-03 -1.67E-03 1.56E-05 1.10E-03 5.66E-03 -4.80E-05 -2.19E-02 -3.36E-03
8X:2X 2.00E-06 3.90E-03 4.76E-03 1.29E-05 1.04E-03 9.70E-04 2.69E-05 5.76E-03 -1.77E-02 7.20E-05
8Y:2X -3.80E-03 6.92E-06 -6.65E-03 -1.67E-03 -2.08E-05 -9.55E-04 5.76E-03 5.76E-05 1.84E-02 -3.46E-03
9X:2X 1.00E-05 5.50E-03 -1.04E-02 -1.98E-05 -6.15E-03 7.95E-03 3.55E-05 -2.78E-03 -9.29E-03 -1.92E-05
9Y:2X -5.60E-03 6.30E-06 1.45E-02 6.25E-03 3.13E-05 -1.12E-02 -2.30E-03 6.72E-05 1.35E-02 -2.88E-04
10X:2X 5.00E-06 5.50E-03 1.18E-02 -1.98E-05 -6.25E-03 -9.23E-03 -4.80E-05 -2.88E-03 1.12E-02 1.92E-05
10Y:2X -5.60E-03 7.00E-06 -1.36E-02 6.35E-03 -3.65E-05 1.04E-02 -2.40E-03 -6.72E-05 -1.23E-02 -1.92E-04

101
Model Update - Final Revision SHAPE1 SHAPE2 SHAPE3 SHAPE4 SHAPE5 SHAPE6 SHAPE7 SHAPE8 SHAPE9 SHAPE10
1X:2X 0.00E+00 0.00E+00 0.00E+00 0.00E+00 0.00E+00 0.00E+00 0.00E+00 0.00E+00 0.00E+00 0.00E+00
1Y:2X 0.00E+00 0.00E+00 0.00E+00 0.00E+00 0.00E+00 0.00E+00 0.00E+00 0.00E+00 0.00E+00 0.00E+00
2X:2X 0.00E+00 0.00E+00 0.00E+00 0.00E+00 0.00E+00 0.00E+00 0.00E+00 0.00E+00 0.00E+00 0.00E+00
2Y:2X 0.00E+00 0.00E+00 0.00E+00 0.00E+00 0.00E+00 0.00E+00 0.00E+00 0.00E+00 0.00E+00 0.00E+00
3X:2X 1.20E-06 9.00E-04 -2.72E-03 -2.08E-06 4.48E-03 -6.41E-03 2.40E-05 -5.47E-03 -1.31E-02 -2.21E-05
3Y:2X -8.00E-04 -4.10E-07 3.82E-03 -3.96E-03 -7.19E-06 9.10E-03 -5.28E-03 2.40E-05 1.95E-02 -5.66E-03
4X:2X -2.70E-07 1.35E-03 2.87E-03 -3.13E-06 4.48E-03 7.02E-03 -4.80E-05 -5.47E-03 1.55E-02 -4.80E-05
4Y:2X -8.00E-04 2.80E-06 -3.42E-03 -3.96E-03 2.29E-05 -8.07E-03 -5.28E-03 -4.03E-05 -1.72E-02 -5.76E-03
5X:2X 4.00E-06 2.50E-03 -7.12E-03 -2.26E-06 6.04E-03 -8.97E-03 -1.92E-05 -4.80E-05 4.74E-03 7.68E-05
5Y:2X -2.40E-03 1.80E-06 9.21E-03 -6.15E-03 -3.15E-06 1.18E-02 -8.64E-04 -3.84E-05 -6.07E-03 5.47E-03
6X:2X 1.00E-06 2.50E-03 6.71E-03 2.08E-06 6.04E-03 8.82E-03 3.84E-05 2.30E-05 -4.48E-03 7.68E-05
6Y:2X -2.40E-03 5.00E-06 -9.37E-03 -6.15E-03 1.00E-05 -1.19E-02 -7.68E-04 4.80E-05 6.21E-03 5.57E-03
7X:2X 7.00E-06 3.90E-03 -4.70E-03 -1.29E-05 1.15E-03 -6.87E-04 -9.60E-06 5.66E-03 1.43E-02 1.92E-05
7Y:2X -3.80E-03 4.50E-06 6.54E-03 -1.67E-03 1.56E-05 1.10E-03 5.66E-03 -4.80E-05 -2.19E-02 -3.36E-03
8X:2X 2.00E-06 3.90E-03 4.76E-03 1.29E-05 1.04E-03 9.70E-04 2.69E-05 5.76E-03 -1.77E-02 7.20E-05
8Y:2X -3.80E-03 6.92E-06 -6.65E-03 -1.67E-03 -2.08E-05 -9.55E-04 5.76E-03 5.76E-05 1.84E-02 -3.46E-03
9X:2X 1.00E-05 5.50E-03 -1.04E-02 -1.98E-05 -6.15E-03 7.95E-03 3.55E-05 -2.78E-03 -9.29E-03 -1.92E-05
9Y:2X -5.60E-03 6.30E-06 1.45E-02 6.25E-03 3.13E-05 -1.12E-02 -2.30E-03 6.72E-05 1.35E-02 -2.88E-04
10X:2X 5.00E-06 5.50E-03 1.18E-02 -1.98E-05 -6.25E-03 -9.23E-03 -4.80E-05 -2.88E-03 1.12E-02 1.92E-05
10Y:2X -5.60E-03 7.00E-06 -1.36E-02 6.35E-03 -3.65E-05 1.04E-02 -2.40E-03 -6.72E-05 -1.23E-02 -1.92E-04