qatar university college of engineering design and …
TRANSCRIPT

QATAR UNIVERSITY
COLLEGE OF ENGINEERING
DESIGN AND PROCESS ECONOMICS OF A MONOETHYLENE GLYCOL
(MEG) RECOVERY SYSTEM FROM PRODUCED WATER
BY
ASMAA OTHMAN BASHIR MOHAMED
A Thesis Submitted to
the Faculty of the College of Engineering
in Partial Fulfillment of the Requirements for the Degree of
Masters of Science in Environmental Engineering
June 2019
© 2019 Asmaa Mohamed. All Rights Reserved.

ii
COMMITTEE PAGE
The members of the Committee approve the Thesis of
Asmaa Mohamed defended on 18/04/2019.
Dr. Fares Al-Momani
Thesis/Dissertation Supervisor
Dr. Saad Al-Sobhi
Co-Supervisor
Dr. Evans Chirwa
Committee Member
Dr. Majeda Kharshieh
Committee Member
Approved:
Abdel Magid Hamouda, Dean, College of Engineering

iii
ABSTRACT
MOHAMED, ASMAA, O., Masters: June :[2019:],
Masters of Science in Environmental Engineering
Title: Design and Process Economics of a MEG Recovery System from Produced
Water
Supervisor of Thesis: Fares, O., Al-Momani, Saad, A., Al-Sobhi.
Monoethylene glycol (MEG) is a widely used hydrate inhibitor in the oil and
gas industry to reduce the risk of hydrate formation in pipelines that could cause a
blockage. Large volumes of MEG are used annually as an effective hydrate control
strategy adding an extra cost on oil and gas industries. The spent MEG is disposed of
afterward by injection in wells. The environmental impact of the disposal of MEG has
not been well studied yet, but it is expected to gain importance in the near future. The
development of an effective process for MEG recovery has been gaining importance to
reduce its purchase cost and eliminate the environmental concern of its disposal after
use. Hence, the present study was performed to develop and optimize MEG recovery
process based on a simulation method and to evaluate the economic feasibility of
recycling and reusing the recovered MEG. The simulation process was carried out using
Aspen Plus and a built-in ELEC-NRTL thermodynamic package, while the process
economics was investigated using the economic analyzer tool add-in to estimate the
cost of the design developed. The process simulation was conducted in two distinct
designs with four scenarios. The results revealed that an optimized process consists of
a flash separator and a distillation column operated under vacuum pressure recovering
99.7% of high purity (99.7wt%) MEG. The capital expenditures (CAPEX) and
operating expenses (OPEX) associated with the optimized process reported as present

iv
worth, project lifetime of 20 years and annual interest rate of 8%, were estimated to be
11.5 and 35 MMUSD, respectively. All studied scenarios achieved the required MEG
recovery and purity reaching values up to 99.7% as per the requirement of the Qatari
industry in general and ConocoPhillips in specific. The similarity in the trends for all
scenarios is due to the homogenous water chemistry as well as the low amount of total
dissolved solids (TDS). Applying the proposed MEG recovery system can save at least
50% of the MEG purchase cost if MEG passes through one regeneration cycle in the
unit. Moreover, this study shows that 80% of MEG purchase cost can be saved when
MEG is regenerated up to 5 times. Finally, an environmental benefit is achieved due to
the considerable reduction in the disposal of spent MEG.

v
ABSTRACT (IN ARABIC)
من مثبطات هيدرات الغاز الأكثر استعمالاً في قطاع صناعة النفط والغاز (MEG) الإيثلينجلايكول يُعتبر احادي
للحد من مشاكل تكون هيدرات الغاز التي تؤدي إلى انسداد خطوط نقل الغاز. يتم استخدام كميات كبيرة من احادي
سنوياً كاستراتيجية فعالة للتحكم في تكون هيدرات الغاز مما يضيف تكلفة إضافية على صناعات لينالإيثجلايكول
إلى .المستهلك بعد ذلك عن طريق الحقن في الآبار الإيثلينجلايكول احادي يتم التخلص من. النفط والغاز
ولكن بشكلٍ جيد، المستهلكالإيثلين جلايكول احاديالتخلص من الآن، لم يتم دراسة الآثار البيئية الناتجة عن
جلايكول احاديلقد ازدادت أهمية تطوير عملية فعالة لاسترجاع من المتوقع أن تكتسب أهمية في المستقبل القريب.
تم إجراء هذه وبالتالي، لخاص بعملية التخلص منه بعد الاستعمال.الإيثلين لتقليل تكلفة الشراء و تجاهل القلق ا
وتقييم الجدوى باستخدام برنامج محاكاة الإيثلينجلايكول احادي استرجاعالدراسة لتطوير وتحسين عملية
المسترجع. تم تنفيذ عملية المحاكاة باستخدام برنامج الإيثلينجلايكول احادي استخدامو تدويرالاقتصادية لإعادة
Aspen Plus و حزمة الديناميكا الحراريةELEC-NRTL ،ص اقتصاديات العملية باستخدام في حين تم فح
من تم إجراء محاكاة العملية . لتقدير تكلفة التصميم الذي تم تطويرهالمدمجة بالبرنامج أداة التحليل الاقتصادي
وعمود حراري كشفت النتائج أن العملية المحسنة تتكون من فاصل مع أربعة سيناريوهات.مين مختلفين خلال تصمي
٪ ٩٩٬٧الإيثلين عالي النقاء )جلايكول احادي٪ من ٩٩٬٧استعادة التفريغ ينتُج عنها تحت ضغط ن يعملا تقطير
للعملية (OPEX) روفات الجارية و المص (CAPEX)بالوزن(. تم تقدير القيمة الحالية للنفقات الرأسمالية
مليون دولار أمريكي ٣٥و ١١٬٥٪ بمبلغ ٨عاماً للمشروع و سعر الفائدة السنوية المقدرة ب ٢٠المحسنة لمدة
ونسبة استرجاع لاحادي جلايكول الايثلين . حققت جميع السيناريوهات التي تمت دراستها معدل نقاء على التوالي
vi
بشكل خاص. بقطر ConocoPhillipsشركة طلبات الصناعة القطرية بشكل عام و وفقًا لمت٪ ٩٩٬٧تصل إلى
الأملاحجميع السيناريوهات إلى كيمياء المياه المتجانسة بالإضافة إلى انخفاض كمية نتائجيرجع التشابه في
على الأقل ٪٥٠حوالي المقترح أن يوفر الإيثلينجلايكول احادي استرجاع(. يمكن لتطبيق نظام TDSالذائبة )
على ذلك ، علاوةً وحدة الاسترجاع. دورة تجديد واحدة في بإذا مرت الإيثلينجلايكول احاديمن تكلفة شراء
مرات. ٥حتى ه عندما يتم تجديد الإيثلينجلايكول احاديمن تكلفة شراء ٪٨٠أنه يمكن توفير هذه الدراسةتوضح
جلايكول احاديفي التخلص من الملحوظبسبب الانخفاض من عملية الاسترجاع فائدة بيئية أخيرًا ، يتم تحقيق
المستهلك. الإيثلين

vii
DEDICATION
This thesis is dedicated to my beloved parents who has provided me with continuous
support and motivation throughout the two years of my Master’s study. The
achievement of this thesis would not have been possible without their patience.

viii
ACKNOWLEDGMENTS
Foremost, I would like to express my gratitude to my thesis supervisor Prof.
Fares Al-Momani and co-supervisor Dr. Saad Al-Sobhi for their guidance and support
throughout the master’s thesis development. Their feedback was always useful to fill
the gaps within my thesis in order to reach this level. Besides my supervisors, I would
like to show my sincere appreciation to Eng. Ahmed Al-Nouss for his continuous
assistance and support in completing this study and working it out through Aspen plus
by giving me insightful comments and valuable pieces of advice which helped resolve
any technical issues.
Special thanks go to Dr. Majeda Khraisheh who was the initiative of this thesis
work and paved the path for working with ConocoPhillips Global Water Sustainability
Center (GSWC) team, Dr. Samer Adham, Eng. Arnold Janson, Eng. Dareen Dardor,
Eng. Mashael Al-Maas, who provided continuous assistance with the necessary
information in addition to their valuable feedback on the outputs of the project. I would
also like to acknowledge Dr. Saad Al-Sobhi and Dr. Hazim Qiblawey for being part of
the team.
Last but not least, I would like to thank my parents and my beloved friends for
giving me the strength to finish my master’s degree and helping me to stay calm and
sane during the critical times in the past two years.
ix
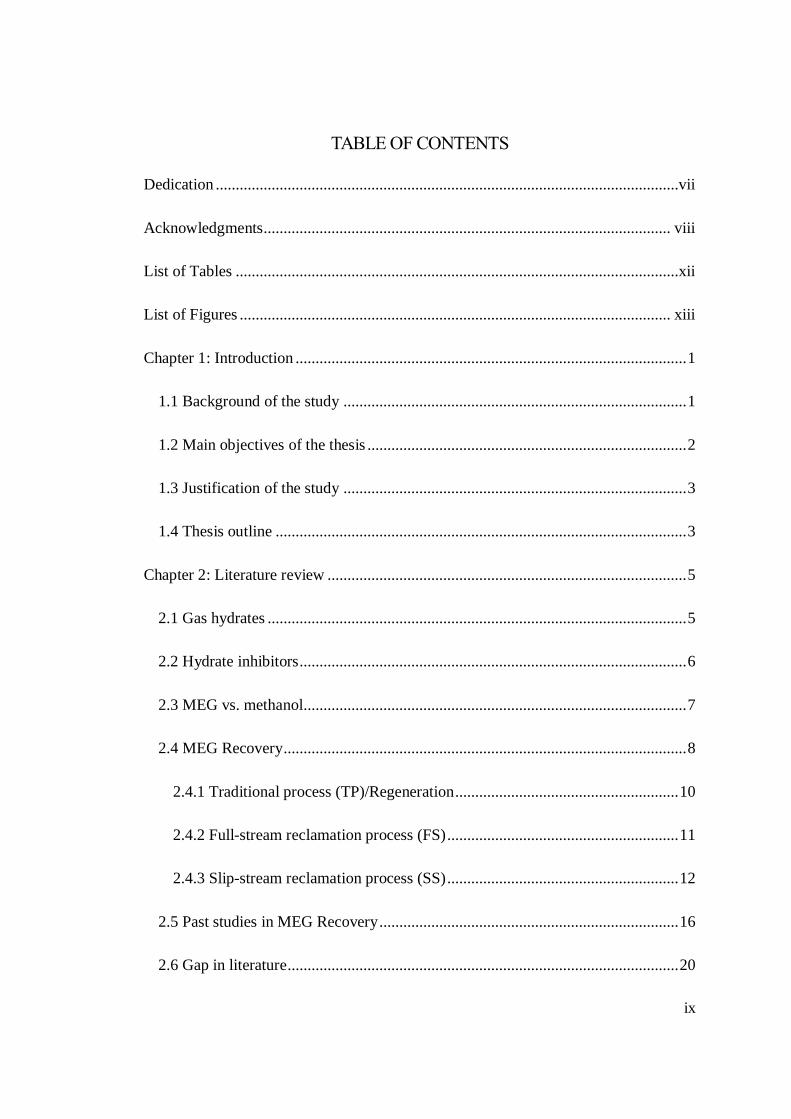
TABLE OF CONTENTS
Dedication ....................................................................................................................vii
Acknowledgments...................................................................................................... viii
List of Tables ...............................................................................................................xii
List of Figures ............................................................................................................ xiii
Chapter 1: Introduction .................................................................................................. 1
1.1 Background of the study ...................................................................................... 1
1.2 Main objectives of the thesis ................................................................................ 2
1.3 Justification of the study ...................................................................................... 3
1.4 Thesis outline ....................................................................................................... 3
Chapter 2: Literature review .......................................................................................... 5
2.1 Gas hydrates ......................................................................................................... 5
2.2 Hydrate inhibitors ................................................................................................. 6
2.3 MEG vs. methanol................................................................................................ 7
2.4 MEG Recovery ..................................................................................................... 8
2.4.1 Traditional process (TP)/Regeneration ........................................................ 10
2.4.2 Full-stream reclamation process (FS) .......................................................... 11
2.4.3 Slip-stream reclamation process (SS) .......................................................... 12
2.5 Past studies in MEG Recovery ........................................................................... 16
2.6 Gap in literature .................................................................................................. 20

x
Chapter 3: Approach and Methodology ....................................................................... 21
3.1 Data collection.................................................................................................... 21
3.2 Assumptions ....................................................................................................... 22
3.3 Process design and simulation............................................................................ 23
3.4 Sensitivity analysis and optimization studies ..................................................... 29
3.5 Comparing the designs ....................................................................................... 30
Chapter 4: Results and discussion................................................................................ 32
4.1 Design 1 simulation results ................................................................................ 32
4.2 Design 2 simulation results ................................................................................ 36
4.3 Economic evaluation for design 1 ...................................................................... 38
4.4 Economic evaluation for design 2 ...................................................................... 41
4.5 Sensitivity analysis on the performance of the unit ........................................... 43
4.5.1 Variation of rich MEG feed flow rate ......................................................... 43
4.5.2 Variation of rich MEG concentration .......................................................... 45
4.5.3 Variation of inlet salt concentration ............................................................ 46
4.5.4 Variation of the design parameters of the distillation column..................... 46
4.6 Sensitivity analysis on the economics of the unit .............................................. 47
4.6.1 Effect of different operating conditions on the process economics ............. 48
4.6.2 Economics of the unit at different product purities ..................................... 49
4.7 Economic comparison between the two designs ................................................ 52

xi
4.8 The Engineering solution in establishing a MEG Recovery unit ....................... 55
4.9 Environmental benefit of establishing MEG recovery unit ............................... 57
4.10 Comparing the results of this work to the results in literature ......................... 58
Chapter 5: Conclusions and recommendations ............................................................ 60
References .................................................................................................................... 62
Appendix A: Duties for the heater and flash separator for all scenarios at different
operating conditions ..................................................................................................... 69
Appendix B: Calculations for the amount of sodium hydroxide required for injection in
design 2 ........................................................................................................................ 71
Appendix C: Data table for the cost and utility requirement for design 1 at different
operational conditions .................................................................................................. 72
Appendix D: Calculations for the annual purchase cost of MEG ................................ 73
Appendix E: Data table for MEG savings per regeneration cycles ............................. 74
Appendix F: Published work from the thesis ............................................................... 75
• Conference presentation................................................................................... 75
• Poster presentation ........................................................................................... 78
xii
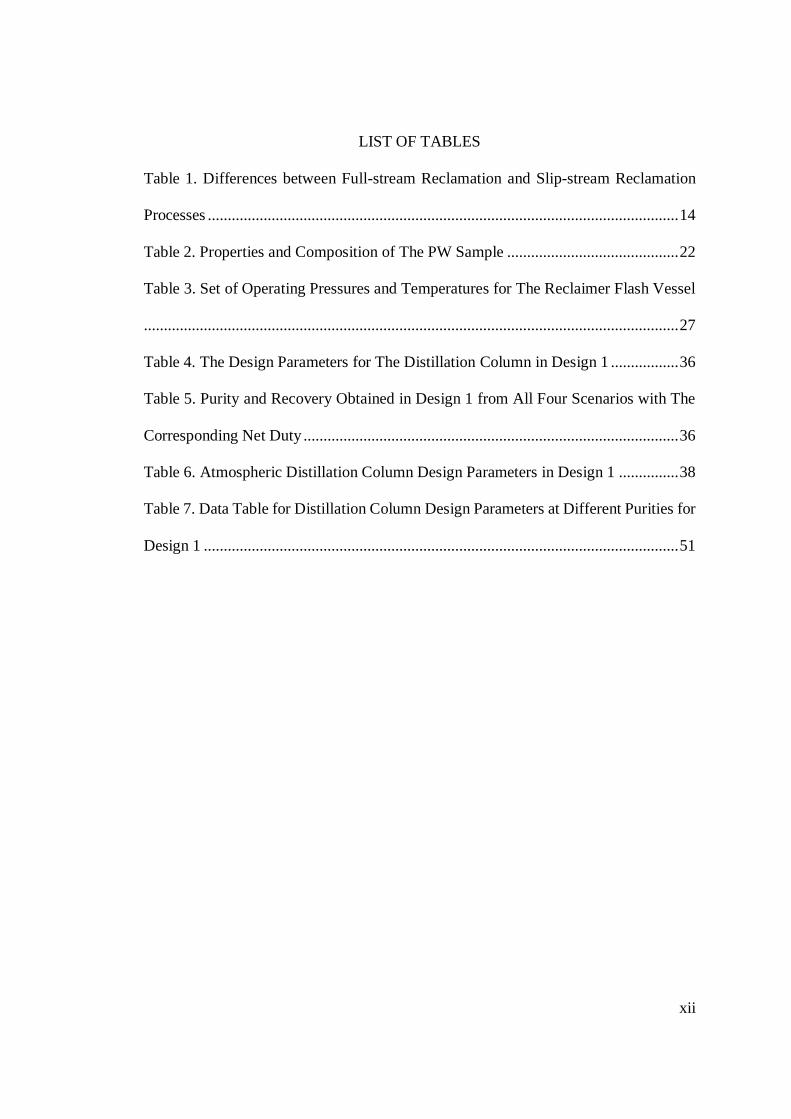
LIST OF TABLES
Table 1. Differences between Full-stream Reclamation and Slip-stream Reclamation
Processes ...................................................................................................................... 14
Table 2. Properties and Composition of The PW Sample ........................................... 22
Table 3. Set of Operating Pressures and Temperatures for The Reclaimer Flash Vessel
...................................................................................................................................... 27
Table 4. The Design Parameters for The Distillation Column in Design 1 ................. 36
Table 5. Purity and Recovery Obtained in Design 1 from All Four Scenarios with The
Corresponding Net Duty .............................................................................................. 36
Table 6. Atmospheric Distillation Column Design Parameters in Design 1 ............... 38
Table 7. Data Table for Distillation Column Design Parameters at Different Purities for
Design 1 ....................................................................................................................... 51

xiii
LIST OF FIGURES
Figure 1. Remediation of a hydrate plug in natural gas transportation pipeline [14]. ... 5
Figure 2. Hydrate equilibrium shift with increasing MEG(THI) concentration [21]. ... 7
Figure 3. Typical regeneration unit [34]. ..................................................................... 11
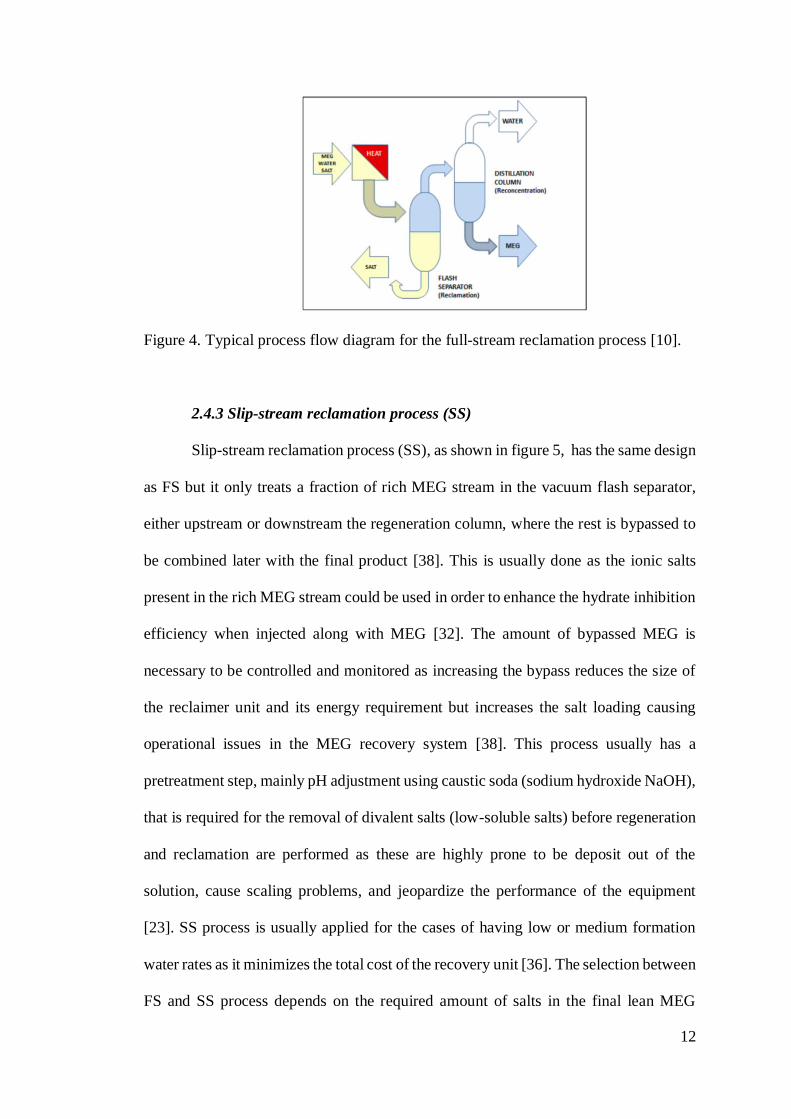
Figure 4. Typical process flow diagram for the full-stream reclamation process [10].
...................................................................................................................................... 12
Figure 5. Typical process flow diagram for slip-stream reclamation [10]. ................. 13
Figure 6. Illustration for the scenarios under study. .................................................... 24
Figure 7. PFD for design 1 for MRU. .......................................................................... 28
Figure 8. PFD for design 2 for MRU. .......................................................................... 31
Figure 9. Variations in heater’s and flash separator’s duties for all scenarios with
varying operating conditions. The scenario includes a) monovalent and divalent ions
with no salt precipitation. b) monovalent ions only with no salt precipitation. c)
monovalent and divalent ions with salt precipitation. d) monovalent ions with salt
precipitation. ................................................................................................................ 34
Figure 10. CAPEX and OPEX present worth for the four scenarios for design 1 at an
operational pressure of 0.05 bar. .................................................................................. 39
Figure 11. The contribution of each equipment to the total equipment cost in design 1.
...................................................................................................................................... 40
Figure 12. The contribution of utilities to the operating cost in design 1. ................... 41
Figure 13. The contribution of each equipment to the total equipment cost in design 2.
...................................................................................................................................... 42
Figure 14. The contribution of utilities to the operating cost in design 2. ................... 43
Figure 15. Variation of the heater and FLS duty with the feed flow rate. ................... 44

xiv
Figure 16. Variation of the condenser and reboiler duty with the feed flow rate. ....... 45
Figure 17. Variation in the MEG purity and recovery with varying inlet MEG
concentration. ............................................................................................................... 46
Figure 18. Variation in the condenser and reboiler duty with varying reflux ratio. .... 47
Figure 19. Effect of different temperature and pressure on the CAPEX and OPEX of
design 1. ....................................................................................................................... 49
Figure 20. Varying CAPEX with product purity for all four scenarios in design 1. ... 51
Figure 21. Varying OPEX with product purity for all four scenarios in design 1. ...... 52
Figure 22. Varying total cost with product purity for scenario 3 in design 1. ............. 52
Figure 23. Equipment cost comparison between the two proposed designs................ 54
Figure 24. Utility cost comparison between the two proposed designs. ...................... 54
Figure 25. Overall project cost comparison between the two proposed designs. ........ 55
Figure 26 Variation in MEG purchase cost and percent savings with the number of
regeneration cycles....................................................................................................... 57

1
CHAPTER 1: INTRODUCTION
1.1 Background of the study
As the world’s energy demand is in a continuous surge, oil and gas exploration
processes have been moving to offshore and deep subsea environments in order to
maximize their production and profitability. The world has been relying recently on
offshore oil and gas production which was stated to represent 33% of the total
production in 2014, and that might surge due to the abundance of deep offshore oil and
gas fields in addition to the exhaust of shallow water reservoirs [1]. With the increasing
exploration and production of natural gas in offshore fields, the emergence of
production challenges is inevitable. One major concern in natural gas production is flow
assurance that is associated with ensuring the safe production and transportation of
natural gas from production sites to the processing facilities. Being placed in cold deep-
water at high pressures, the transportation pipelines are susceptible to the formation of
gas hydrates due to the gas’s water content, which ends up causing a blockage in
pipelines leading to severe problems. These hydrates can cause huge safety and
economic issues on gas processing, and production as the hydrate plugging can be
simple stopping the production for days or even months, or severe causing potentially
hazardous pipeline explosion [2]. The formation of these gas hydrates is becoming a
huge challenge in the production of natural gas that needs to be stopped. As the
remediation of these plugs has economic and time constraints, hydrate prevention
mechanisms become necessary to be implemented. Conventionally, hydrate formation
is avoided by the continuous injection of some field chemicals known as hydrate
inhibitors that work on reducing the water activity in pipelines during transportation
which in turn reduces the likelihood of gas hydrate formation. In Qatar, hydrate
inhibitors are usually injected in natural gas wells during the winter months between

2
December and March [3]. Furthermore, Qatargas has been leaning on the injection of
kinetic hydrate inhibitors and monoethylene glycol (KHI/MEG) in order to prevent
hydrate formation during the winter season, but due to several issues, a decision was
made in order to replace KHI with MEG for hydrate control purposes [4,5]. Numerous
gas fields operators have been leaning on MEG as the main hydrate inhibitor utilized
due to its relatively simple recovery process compared to other hydrate inhibitors [6–
8]. The process of MEG recovery is increasingly becoming of considerable importance
since MEG is expensive and significant volumes are required for effective hydrate
inhibition which in turn raises economic, environmental, and logistics concerns in terms
of their supply and disposal after use[8–10]. Thus, a process that can be used to recover
and reuse MEG several times is highly required. It was stated that MEG
recovery/regeneration has numerous benefits including the reduction in the purchased
amount of fresh MEG, the protection against hydrate formation due to utilizing more
pure MEG with less water content, and the reduction in corrosion, scaling and fouling
issues [11]. Since MEG after being used and separated from the gas stream at the
processing facility is obtained as rich MEG loaded with water, the proposed recovery
process should focus on the removal of water and dissolved solids to obtain highly pure
lean MEG that can be reused as a hydrate inhibitor.
1.2 Main objectives of the thesis
The scope of this thesis focuses on the design of a MEG recovery process from
produced water to permit its reuse with minor losses. The study also focused on the
economic feasibility of the designed process based on CAPEX and OPEX. The process
design and economic evaluation was carried out using Aspen plus simulation software.
Different scenarios were evaluated to select an optimum design with maximum
percentage recovery and high MEG purity. The overall project cost justifying the

3
establishment of a MEG recovery was presented. Other specific objectives are:
1. Develop a simulation model for different processes, assess and compare the
energy requirement for each process using Aspen Plus.
2. Prepare and study the change in capital expenditures (CAPEX) and operational
expenses (OPEX) for each process using Aspen Plus economic analyzer
3. Compare the economic and environmental benefits of each process with respect
to the current MEG disposal practice.
1.3 Justification of the study
For hydrate inhibition purposes, large volumes of MEG are required in order to
suppress the hydrate formation conditions. Besides, when MEG is separated from the
natural gas, the industrial practice for its disposal is through injection in deep onshore
wells having considerable costs and posing environmental concerns if it finds its way
through aquatic environments. Furthermore, since hydrate inhibition is a critical
requirement during gas production, the purchase of fresh MEG is a necessity. Taking
into consideration all the formerly mentioned reasons, it is necessary to establish a
MEG recovery unit in order to facilitate its re-injection in transportation lines. The
results achieved from this study will help policymakers and industries decide whether
to implement the MEG recovery process or keep on with the current disposal practice.
1.4 Thesis outline
This thesis is organized as follows: Chapter 2 provides a general background
about gas hydrates, hydrate inhibitors and the selection of MEG as a hydrate inhibitor.
Followed by a description of MEG recovery processes and past studies conducted in
the design of the MEG recovery unit and the associated process economics highlighting
the gaps found in the literature. Chapter 3 describes in detail the exact methodology
followed in order to achieve the study objectives. In chapter 4, the results of the

4
designed process are presented with details on the design parameters and the cost
analysis study performed. Finally, chapter 5 summarizes the main conclusions of this
thesis and highlights some recommendations for the future outlook.

5
CHAPTER 2: LITERATURE REVIEW
2.1 Gas hydrates
Gas hydrates are ice-like clathrates of crystalline structure that form when the
water content of the gas freezes and solidifies causing a pipeline plug that stops the gas
flow and causes pressure build-up upstream the plug which ends up causing a pipeline
rupture [9,12]. Gas hydrates can form at temperatures above the freezing point of water
at high pressures; eventually, hydrate formation is triggered at temperatures lower than
20℃ and pressures higher than 30 bar [13]. These hydrates have significant safety risks,
and economic challenges in gas production as this issue ends with up with a complete
operational shut-down for an extended period in order to remove or remedy these plugs
(Figure 1). Since the remediation of these plugs can be of a considerable cost and time-
consuming, it is necessary to provide a better alternative for the remediation process.
In offshore production, measures for avoiding, mitigating and control of these hydrates
is necessary. The formation of gas hydrates can be avoided by either dehydrating the
gas, maintaining the temperature of the pipelines above the hydrate’s formation
temperature by heating or thermal insulation, depressurization of the pipelines, or
injecting a hydrate inhibitor. In most of the cases, the first three options may not be
practical or feasible due to their limitations in their applicability and flexibility.
Therefore, it becomes necessary to inject a hydrate inhibitor.
Figure 1. Remediation of a hydrate plug in natural gas transportation pipeline [14].

6
2.2 Hydrate inhibitors
Hydrate inhibitors are chemicals added to pipelines to prevent the formation of
gas hydrates during transport between the production wells and processing sites. The
continuous injection of hydrate inhibitors in transportation pipelines is a promising
alternative to prevent, retard, or reduce the chances of gas hydrate formation. Hydrate
inhibitors can be classified into two main categories based on their working
mechanisms: Thermodynamic hydrate inhibitors (THIs) and low dosage hydrate
inhibitors (LDHIs). THIs are preventive inhibitors as they reduce water activity by
shifting the hydrate formation equilibrium to lower temperatures and higher pressures
as shown in figure 2. The more the equilibrium curve is shifted to the left, the better the
inhibition is. The most common THIs used in industry are glycols (monoethylene glycol
(MEG), diethylene glycol (DEG), and triethylene glycol (TEG)), ethanol and methanol.
LDHIs do not lower the hydrate formation temperature as in THIs’ case; instead, they
diminish the effect of hydrate formation. LDHIs can be classified into two different
categories: kinetic hydrate inhibitors (KHIs) and anti-agglomerating hydrate inhibitors
(AAHIs). KHIs are polymer-based chemicals that act as retarding inhibitors that slow
down the kinetics of crystal growth and hydrate formation inhibiting its development
for a defined period. Typical examples of KHIs are polyvinyl caprolactam and
polyvinylpyrrolidone [15]. AAHIs are merely dispersing agents of quaternary salts or
surfactants that hinder the small crystals from agglomerating into large structures of gas
hydrates[15]. In terms of global consumption, THIs are the most commonly used
hydrate inhibitors among the other types because of their effectiveness and
reliability[16–18]. The reason behind that is the limitation in using AAHIs and KHIs
as AAHIs work effectively only there is a specific amount of condensate/ oil phase
along with the gas while KHIs are limited in their ability to suppress hydrate formation

7
in addition to its low efficiency at high pressures[19]. Generally, THIs are commonly
injected at large dosages ranging from 20% up to 70% of the total water produced in a
typical offshore deepwater system raising concerns regarding their management after
utilization [20].
Figure 2. Hydrate equilibrium shift with increasing MEG(THI) concentration [21].
2.3 MEG vs. methanol
For continuous injection, glycols are preferred with systems at low temperatures
up to – 40C. The reason behind that is their economic advantage in terms of their
recovery by distillation. However, below this temperature, methanol is preferred
because the glycol’s viscosity makes the separation less effective than methanol’s
separation[22]. The most common THIs used in industry are methanol and MEG due
to their high performance and relatively low cost [19]. Methanol is advantageous in
terms of being less expensive compared to MEG, requiring lower concentration for
inhibition and inhibiting to lower temperatures than MEG; as smaller volumes of
methanol than MEG are required for the same hydrate inhibition effect[8]. Besides,
during its regeneration, the dissolved salts are more soluble in water than in methanol

8
leaving it pure. Despite these advantages, methanol is profoundly lost with
hydrocarbons vapor and liquid, in addition to the aqueous stream that is difficult to
recover methanol from posing some economic concerns in the recovery process [19,21].
Moreover, it is not as safe as MEG since it is more toxic and flammable than MEG. For
these reasons, the industry is starting to divert towards MEG as a potential hydrate
inhibitor for use. MEG is characterized by having low solubility in the liquid
hydrocarbon phase, being effectively recovered from the aqueous phase after use with
minor losses, and possessing a huge potential of hydrate depression temperature; in
addition to having an advantageous feature of providing corrosion inhibition in
pipelines saving operational costs associated with supplying corrosion inhibitors
[2,19,23]. Another advantage of MEG over methanol is that it can be used for
continuous inhibition while methanol can be used only when occasional inhibition is
required [24,25]. Another driving criterion for MEG selection is that MEG recovery
units are easy to operate, safe, reliable, cost-effective, of high MEG recovery, low
energy consumption and carbon emissions, and moderate disposal of salts within the
acceptable levels of HSE standards[26]. Finally, the water obtained from MEG
recovery poses less environmental hazards compared to that obtained from methanol
recovery [10].
2.4 MEG Recovery
After injection in pipelines, MEG flows with the gas along with produced water
ensuring its safe delivery without any hydrate blockage. As soon as the production
fluids reach the processing facilities, they pass through the slug catcher and then they
are separated in a 3-phase separator to an upper gas stream – natural gas, intermediate
condensate stream – liquid hydrocarbons, and a bottom aqueous stream – rich MEG
along with produced water and dissolved salts. The gas and the condensate streams are
9
passed to further processing and sales unit onshore while rich MEG is passed to the
regeneration unit. Before MEG can be reused for hydrate inhibition, re-concentration
(water removal) and reclamation (salt removal) are necessary in order to obtain pure
MEG to be effective in hydrate inhibition. In addition, the continuous use of MEG in
hydrate inhibition might cause its contamination and degradation if the impurities are
not removed regularly in a controlled manner. After MEG is separated from its
impurities, water, and salts, it is produced as a concentrated stream known as lean MEG
which returns to the injection point as a recycled hydrate inhibitor.
The underlying reason behind developing MEG recovery systems is that the
prices for glycol have been increasing significantly in recent years necessitating the
need for recovery systems for a cost-efficient application of hydrate inhibition [27].
PUREMEG process is one of the well-known MEG recovery units globally having an
overall MEG recovery of 99.5% [28]. MEG recovery units (MRUs) are characterized
by being a small unit and having a simple design. Usually, MEG recovery units are
comprised of 2 stages which are regeneration and reclamation. Regeneration is
concerned with water removal while reclamation is concerned with salt removal. One
challenge encountered in most MEG recovery units is the presence of salts, their
accumulation within MEG loops and scaling problems that lead to equipment failure.
Hence, special regeneration and reclamation designs are implemented in MRUs,
usually vacuum systems [24]. Vacuum systems are usually essential in order to vaporize
MEG from salts stream which is not achievable at the atmospheric boiling point 197 ℃
since MEG thermally degrades at around 160 ℃, and major losses are expected when
vaporized at atmospheric conditions [12,29]. Hence, a vacuum pressure of 0.1 – 0.3
bara is used in order to lower MEG’s boiling point below its degradation point avoiding
from one side its degradation and from the other side its contamination with salts [30].

10
Of special concern in MRUs is the presence of divalent ions, such as calcium and
magnesium as they tend to precipitate out of the aqueous stream and deposit on
pipelines and equipment easily. Hence, some systems employ a pretreatment stage in
order to remove the potentially hazardous divalent salts that induce scaling leaving
behind monovalent salts to be removed by reclamation. Generally, three modes of MEG
recovery can be implemented: traditional process (TP), full-stream reclamation process
(FS), and slip-stream reclamation process (SS).
2.4.1 Traditional process (TP)/Regeneration
This process is comprised only of a single distillation column that separates
MEG from water at atmospheric conditions obtaining lean MEG as a bottom product
with concentrations up to 90wt% [31]. Typical regeneration unit in Minerva Gas Plant
is shown in figure 3. At atmospheric conditions, only 90wt% lean MEG can be achieved
since the distillation column is operated at a temperature around 130 °C that is enough
to boil off water and keep MEG in the liquid phase [8]. The advantages of this process
are simple, low process economics, and low energy requirements making it
economically attractive for MEG regeneration.
Nevertheless; this process is effective when rich MEG contains no/low total
dissolved solids; however, any increase in the salt levels within rich MEG beyond the
tolerable limits, the salts end up accumulating and precipitating in the processing
facilities leading to salt deposition and equipment fouling [10,26]. Thus, this process is
the least employed process in MEG recovery since rich MEG streams are usually
expected to be loaded with salts. Another disadvantage of this process is that it is not
capable of producing MEG with purity > 90wt% as this requires additional heating
increasing the temperature profile of the column. At elevated temperatures, MEG
undergoes thermal degradation where it breaks down forming organic acids such as

11
glycolic, formic, and acetic acid which in turn accelerates pipelines corrosion,
deteriorates hydrate inhibition performance, and requires further MEG makeup which
increases the operating costs [32,33]
Figure 3. Typical regeneration unit [34].
2.4.2 Full-stream reclamation process (FS)
Full-stream reclamation process (FS) is comprised of a distillation column
imitating the one present in TP followed by a reclaimer vessel. The reclaimer is a flash
separator that is usually operated under vacuum conditions (10-15 kPa) in order to
vaporize MEG-water completely removing both monovalent and divalent salts leaving
them behind as a concentrated brine stream which is usually separated using a
centrifuge [19,29]. Sometimes, the flash separator is followed by another sub-
atmospheric distillation column for further water removal where the first distillation
column is omitted [35]. It was reported that the FS process is necessary whenever high
formation water rates are expected [36]. Figure 4 shows a typical FS reclamation
process.
12
Figure 4. Typical process flow diagram for the full-stream reclamation process [10].
2.4.3 Slip-stream reclamation process (SS)
Slip-stream reclamation process (SS), as shown in figure 5, has the same design
as FS but it only treats a fraction of rich MEG stream in the vacuum flash separator,
either upstream or downstream the regeneration column, where the rest is bypassed to
be combined later with the final product [38]. This is usually done as the ionic salts
present in the rich MEG stream could be used in order to enhance the hydrate inhibition
efficiency when injected along with MEG [32]. The amount of bypassed MEG is
necessary to be controlled and monitored as increasing the bypass reduces the size of
the reclaimer unit and its energy requirement but increases the salt loading causing
operational issues in the MEG recovery system [38]. This process usually has a
pretreatment step, mainly pH adjustment using caustic soda (sodium hydroxide NaOH),
that is required for the removal of divalent salts (low-soluble salts) before regeneration
and reclamation are performed as these are highly prone to be deposit out of the
solution, cause scaling problems, and jeopardize the performance of the equipment
[23]. SS process is usually applied for the cases of having low or medium formation
water rates as it minimizes the total cost of the recovery unit [36]. The selection between
FS and SS process depends on the required amount of salts in the final lean MEG

13
product for reinjection for hydrate inhibition. Table 1 shows the main differences
between these two reclamation processes.
Figure 5. Typical process flow diagram for slip-stream reclamation [10].

14
Table 1. Differences between Full-stream Reclamation and Slip-stream Reclamation Processes
Full-stream reclamation (FS) Slip-stream reclamation (SS)
Mode of
operation
Complete reclamation of rich MEG removing all
dissolved salts.
A portion of rich MEG stream enters the reclaimer for
salt removal leaving some salts behind in the bypassed
stream.
Advantages • Complete salt removal from rich MEG avoiding
any scaling or equipment fouling issues in
addition to having salt-free MEG at injection
points.
• It is effective when the total dissolved salts (TDS)
is high [39].
• It has a smaller footprint compared to SS due to
the reduction in the number of equipment making
it favorable for off-shore applications [30].
Lean MEG contains some inhibitors and pH stabilizers
that are entirely lost in the FS process along with the brine
stream [29]. These compounds are usually useful to be
injected in pipelines for corrosion control purposes.

15
Full-stream reclamation (FS) Slip-stream reclamation (SS)
Disadvantages High energy requirements due to the complete
vaporization of MEG and water in the reclaimer vessel
leading to elevated operational costs associated with the
vaporization process
• It has a potential of equipment fouling due to the
build-up and accumulation of salts with time
leading to detrimental failure in the MEG loop
[38].
• It cannot handle high levels of TDS in rich MEG
especially if MEG is alkaline and is loaded with
calcium and iron [39,40].
• This configuration is difficult to be handled if
MEG is alkaline and contains a significant
amount of calcium and iron [40].

16
The major challenge in MEG recovery is the presence of salts and the issues
associated with their deposition and precipitation within equipment that causes their
fouling; hence, it is crucial during the design of the MEG loop to assure that the flow
of MEG from the injection point up to downstream the recovery unit is unrestricted by
scaling/deposition and force precipitation at the intended locations, i.e. reclaimer vessel
[40].
2.5 Past studies in MEG Recovery
Through the literature review process, it was found that the number of studies
conducted focusing on MEG recovery is limited with a weak focus on the design
details. In addition, all the studies conducted are published recently indicating that this
kind of work is still new and requires extended research work. There were only five
published papers studying the MEG recovery which will be summarized and criticized
below.
The first paper published approached the design using the concept of exergy
analysis in order to determine the amount of energy degraded in MEG recovery process.
Teixeira [2] carried out a comparative study between TP, FS, and SS in terms of energy
consumption, carbon dioxide emissions and exergy performance through simulation
using Aspen HYSYS as a software and glycol thermodynamic property package for a
rich MEG feed of 100 ton/day of 55wt% MEG. In their design, TP process was
comprised of a single atmospheric distillation column while the FS and SS process
started with an atmospheric distillation to remove a fraction of the water; then it was
followed by a flash separator and another distillation column that were operating under
vacuum conditions. In their study, they set an operating pressure of 0.2 bar with process
feed containing NaCl as the main salt constituent representing 1-3wt% of rich MEG as
other salts did not contribute significantly to the thermal effects due to their low

17
concentrations. However, they did not consider any salt presence in their simulation
justifying that it does not affect energy consumption since it settles after MEG-water
evaporation beside the fact that the trial of salt inclusion differed by 1-2% in terms of
heat duty. The outcomes of their study included a maximum MEG purity of 93%
obtained from FS process compared to 85% maximum purity obtained from TP and SS
process with the energy consumption highest in FS followed by SS and TP having
reduced energy consumption of 18.75% and 27.5%, respectively. The study has come
up with good results; however, it could have been enhanced if salt inclusion was done
and providing more details on their design.
Another study conducted by Zaboon [36] comparing the output from MEG
recovery design on an experimental basis and a simulation basis. Experimentally, they
operated a distillation column at different trials salt-free and salt-inclusive at operating
conditions of 30 ℃ and 140 kPa coming to the conclusion of designing a 6-stage
distillation column obtaining a MEG purity of 80-90wt% for salt-free rich MEG and
70-80wt% for salt-laden rich MEG. On a simulation basis, they conducted different
trials one using Aspen HYSYS with PENG-ROBINSON (PR) property package, one
using Aspen HYSYS also but with glycol property package and finally using Aspen
plus with ELEC-NRTL property package. In their simulation, they have only
considered monovalent cations sodium and potassium; however, they did not simulate
them. Operating with the same conditions as the experimental conditions, they come to
a conclusion that glycol property package failed to match the experimental results while
using PR they obtained MEG purity of 78-86wt% and using ELECNRTL they obtained
71-80wt%. Although their study was successful in comparing different trials through
different methods, they did not go into the detail of the design in addition to the poor
purity obtained.

18
Son [37] studied the process modeling and simulation of a MEG recovery unit
using a combination of simulators. The simulation for the re-concentration stage was
done using a commercial simulator called “Unisim Design” with PENG Robinson and
NRTL as the thermodynamic package while the simulation for reclamation stage was
done on Aspen plus interface using ELEC-NRTL as a property model for the salts
present, mainly sodium, calcium, and chloride. By operating the reclaimer at Full-
stream reclamation mode with an operating pressure of 35 kPa and a distillation column
having 26 stages and operating a reflux ratio of 0.56, they obtained an overall MEG
recovery of 99.42% and MEG purity of 80wt%. The only comment on this study that
the results might not be accurate as they simulated each sub-unit of the MEG recovery
unit in different software without providing a logical justification for their approach.
Finally, the two studies that have made significant contributions to this field and
have provided a detailed design with a focus on the economic part as well. Kim [41]
proposed a modified design for the slip-stream reclamation process having two
distillation columns: an atmospheric column before reclamation and a vacuum column
after reclamation. This modification was done in order to compare it to the conventional
reclamation in terms of salt precipitation incidence and total project cost on a simulation
basis using Aspen plus software and ENRTL-RK property package. In their simulation,
the salts simulated was obtained using electrolyte wizard for salt precipitation of
sodium, calcium, chloride, and bicarbonate ions. They concluded that their modified
design provided a reduced cost compared to the conventional design with more
tolerance to the salts present and fewer precipitation incidences. In addition, their
design achieved an overall MEG recovery of 99.5% with a purity of 97wt%. Assuming
a project lifetime of 15 years, the design had an economic benefit with 9.8% reduction
in its capital cost (CAPEX) and 8.6% reduction in the operating cost (OPEX) having

19
values of 5.88 MMUSD and 101.84 MMUSD, respectively.
Similarly, the main author conducted another work using Aspen HYSYS and
PR property package without considering the salt presence using full-stream
reclamation concept operating the reclaimer and distillation column at vacuum
conditions. Kim [25] obtained 99.5% MEG recovery but a purity 90wt% with a CAPEX
of 8.5 MMUSD and OPEX of 47.33 MMUSD. Comparing this study to the former one,
although they obtained a purity of 90wt% instead of 97wt%, the overall project cost
was reduced by 50% approximately making the second design considering that 90wt%
MEG can provide an effective hydrate inhibition for many injection cases [42].
Taking an overall look in the past studies in literature review; there was no
uniform approach for designing a MEG recovery unit in addition to having numerous
designs developed, so the process of comparing designs and outcomes was redundant.
Moving to the equipment design, even though all the studies agreed on the design of
the reclaimer operating at vacuum conditions, there were discrepancies in distillation
column design. To illustrate, looking into the distillation column design, Zaboon [36]
stated that 6-stage distillation is adequate for obtained 80-90wt% MEG compared to 26
staged-distillation for 80wt% MEG obtained by Son [37]. Considering that the reflux
ratio for both columns was in a close agreement, having a quadruple number of stages
make the design process debatable. Moving to the economic aspect, minimum studies
were done to be looked upon. To conclude, there is a huge gap in literature that needs
to be filled by looking at the approach of design, the design itself, salt precipitation and
deposition issues and how to troubleshoot/overcome them, the optimum product purity,
and the economics of the recovery process justifying its establishment instead of
purchasing fresh product.

20
2.6 Gap in literature
As mentioned earlier and after a thorough investigation of existing literature
about the design of a reliable MEG recovery unit with attractive outputs, there has been
limited work investigating the recovery of MEG in oil and gas production processes
which also had significant discrepancies in the equipment designs, outcomes, and
design considerations. Although there are many MEG recovery technologies beyond
the formerly mentioned studies that are applied and exist in different plants around the
world, this information was not accessible, and the available ones were of minor details
because of being companies’ confidential information. To the best knowledge, it has
not been discussed in detail the operating conditions of different equipment in the
process and how they affect the output of the project. In addition, no one has addressed
with numbers how much would MEG recovery save from its purchase cost.
Accordingly, there will be an in-depth discussion regarding these two aspects of this
thesis work. Another contribution to the literature from this work is considering all the
salts present in rich MEG and evaluating their effect on the unit performance and
product recovery.

21
CHAPTER 3: APPROACH AND METHODOLOGY
The main objective of this study is to design a MEG recovery unit in order to
recover pure MEG from produced water and determine the associated cost with the
recovery process. The objective was approached by designing the unit with equipment
that is selective to the impurities that need to be removed. During this stage, different
scenarios and designs were obtained for the MEG recovery unit depending on the feed
quality and the final lean MEG requirement.
3.1 Data collection
The specifications for the rich MEG sample under study was obtained from
ConocoPhillips Global Water Sustainability Center (GWSC) based on on-site analysis
conducted by them. Table 2 shows the quality of the produced water (PW) associated
with MEG in the rich MEG stream. This PW was collected from a treatment facility in
the North Field in Qatar sampled downstream the slug catcher. A design basis was
developed for the MEG recovery unit where it is designed to treat 50 m3/hr of rich MEG
at a temperature and pressure of 30 ℃ and 3 bar containing 50wt% MEG and 50wt%
produced water. The target for the final product was set with a minimum purity of
90wt% up to 99wt% with an overall MEG recovery of 99.5% and above.

22
Table 2. Properties and Composition of The PW Sample
3.2 Assumptions
1. The sulfide content was not included in the simulation as it is typically stripped
out upstream the MRU [43].
2. The scope of the design starts downstream rich MEG storage tanks and ends
upstream the lean MEG storage tanks.
3. The target concentration of the recovered MEG was set at 99wt% with an
overall loss of MEG within the unit premises not exceeding 0.5%.
4. The total cost of the project includes the capital cost (CAPEX) and the operating
costs (OPEX) as per Aspen Plus economic analyzer tool estimation.
PRODUCED WATER PROPERTIES
COD 1600 mg/L
TOC 500 mg/L
CHLORIDE (CL-) 2300 mg/L
SODIUM (NA+) 1000 mg/L
CALCIUM (CA2+) 350 mg/L
SULFIDE (S2-) 800 mg/L
MAGNESIUM (MG2+) 60 mg/L
BROMIDE (BR-) 50 mg/L
SULFATE (SO42-) 50 mg/L
POTASSIUM (K+) 40 mg/L
ACETATE (CH3COO-) 350 mg/L
TOTAL DISSOLVED SOLIDS 5000 mg/L

23
5. The utilities used in this process include only electricity, steam for heating
purposes and either refrigerant Freon R-12 or cooling water for cooling
purposes depending on the scenario requirement.
6. As per the industrial regulations, the maximum alkalinity of the product should
be 20 mmol/kg.
7. The economic evaluation was based on a project life of 20 years with an interest
rate of 8% per year.
3.3 Process design and simulation
The design process was carried out on a simulation basis using Aspen Plus
software. The selection for this software is attributed to its reflection upon different
parameters that could be interpreted from an industrial perspective. In addition, Aspen
Plus is a reliable software that has an advantageous feature of handling the presence of
solids and salts that other simulation software such as HYSYS and Promax cannot
simulate.
The initial procedure was to assess the system under study and define its
chemical components (MEG, water and dissolved ions) on the Aspen interface;
different scenarios were suggested in order to see how the system reacts to any
alteration to the quality of the dissolved ions present. Four scenarios were tested as
shown in figure 6:
1. The salts present include monovalent and divalent ions with no salt
precipitation.
2. The salts present include monovalent ions only with no salt precipitation.
3. The salts present include monovalent and divalent ions with salt precipitation.
4. The salts present include monovalent ions only with salt precipitation.

24
Figure 6. Illustration for the scenarios under study.
These scenarios were suggested in order to assure that the salts remain dissolved
in the aqueous stream and do not precipitate out; this is the reason behind simulating
scenarios without precipitation and scenarios with precipitation. In overall, these
scenarios were implemented in order to analyze how the process performance,
operating conditions, and process economics could change for each scenario.
Highlighting that scenario 3 is the case that imitates the real-life application in industry,
so it is the scenario with the most expected results to be endorsed.
After defining all the components associated with MEG recovery unit, it was
essential to select the most appropriate thermodynamic property package to use with
the simulation. By using the methods assistant tool in Aspen Plus and defining the case
under study, which mainly is an electrolyte system, the most convenient
thermodynamic property packages selected for this system were ENRTL-RK and
ELEC-NRTL due to their capability of simulating electrolytes as it is the case
experienced in the industry during MEG recovery.
Following that, the simulation design was initiated by defining the feed as per
the specifications provided earlier in table 2, and the electrolyte wizard was used in
4 scenarios
Monovalent & divalent salts
With precipitation
No precipitation
Monovalent salts only
With precipitation
No precipitation

25
order to simulate the scenarios that include salt precipitation. Figure 7 shows the
process flow diagram (PFD) developed for the recovery unit on Aspen interface based
on equipment selection; each is selective to one type of contaminant. This will be
elaborated more in the upcoming sections with the design details.
To start with, since the produced water has a considerable COD and TOC
values, a flash drum (FLASH) operating at 55 ℃ was added in order to flash off any
traces of hydrocarbons in the rich MEG stream that could contribute to the COD and
TOC content. The presence of hydrocarbons could cause damage to the regenerator
internals and packings leading as well as foaming issues [44,45]; preceding that, the
feed is passed through a pressure reducing valve (PRV) in order to reduce the pressure
of rich MEG to 1 atm in order to accelerate the vaporization of the dissolved
hydrocarbons. Since the solubility of monovalent salts, which are the main ionic species
in rich MEG stream, decreases with increasing MEG concentration [41,46], it was
decided to find a method to remove the salts/ions first and then separate MEG from
water. This was achieved by using a reclaimer vessel/flash separator (FLS) that works
on vaporizing MEG completely from the accompanying salts. One obstacle faced
during this process is that MEG can be vaporized at 1 atm if it is heated up to 197 ℃,
but it is commonly known that MEG thermally degrades if it is heated to around 163
℃ where it breaks down to its organic acids such as acetic acid, glycolic acid, and
formic acids and become hugely lost [12,29]. Hence, the reclaimer vessel was operated
at vacuum conditions in order to vaporize MEG at a lower temperature than its
degradation temperature. Vacuum pumps were added to the outlet streams of the
reclaimer vessel to guarantee that the vacuum pressure inside the reclaimer is well
maintained.
26
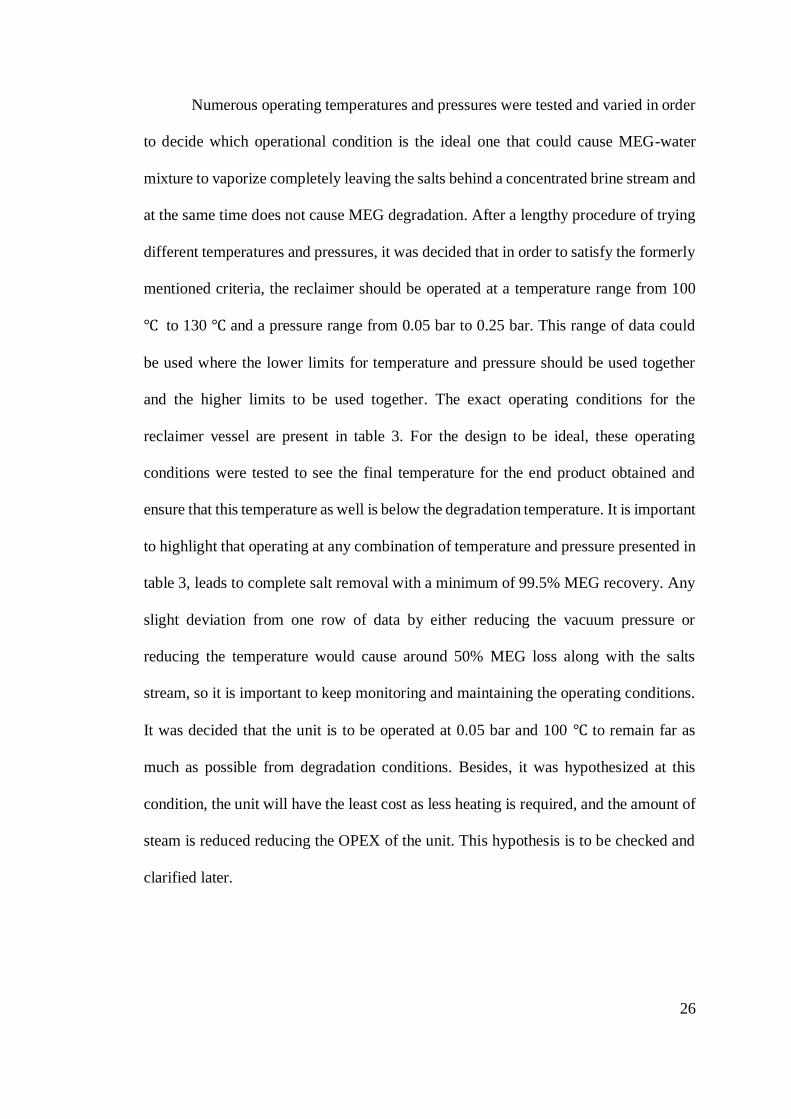
Numerous operating temperatures and pressures were tested and varied in order
to decide which operational condition is the ideal one that could cause MEG-water
mixture to vaporize completely leaving the salts behind a concentrated brine stream and
at the same time does not cause MEG degradation. After a lengthy procedure of trying
different temperatures and pressures, it was decided that in order to satisfy the formerly
mentioned criteria, the reclaimer should be operated at a temperature range from 100
℃ to 130 ℃ and a pressure range from 0.05 bar to 0.25 bar. This range of data could
be used where the lower limits for temperature and pressure should be used together
and the higher limits to be used together. The exact operating conditions for the
reclaimer vessel are present in table 3. For the design to be ideal, these operating
conditions were tested to see the final temperature for the end product obtained and
ensure that this temperature as well is below the degradation temperature. It is important
to highlight that operating at any combination of temperature and pressure presented in
table 3, leads to complete salt removal with a minimum of 99.5% MEG recovery. Any
slight deviation from one row of data by either reducing the vacuum pressure or
reducing the temperature would cause around 50% MEG loss along with the salts
stream, so it is important to keep monitoring and maintaining the operating conditions.
It was decided that the unit is to be operated at 0.05 bar and 100 ℃ to remain far as
much as possible from degradation conditions. Besides, it was hypothesized at this
condition, the unit will have the least cost as less heating is required, and the amount of
steam is reduced reducing the OPEX of the unit. This hypothesis is to be checked and
clarified later.

27
Table 3. Set of Operating Pressures and Temperatures for The Reclaimer Flash Vessel
P (bar) T (℃) Lean MEG temperature (℃)
0.05 100 121
0.1 110 136
0.15 120 146
0.2 125 152
0.25 130 158
0.3 135 162
The next step was to find a method to separate MEG from water which was
selected to be distillation since there is a huge difference in their boiling points (100 ℃
for water compared to 197 ℃ for MEG at 1 atm) that could make the separation process
easy. Hence, the separation was tested in Aspen using ‘DSTWU’ shortcut distillation
model by setting the water as a light key with a recovery of 99.9% and MEG as a heavy
key with a. recovery of 0.1%, both in the distillate stream in order to ensure the
complete separation. In addition, the operating pressures for the condenser and reboiler
were set to be the exact vacuum pressure (= 0.05 bar) of the reclaimer since aiming for
a highly pure MEG would require a complete separation which at atmospheric
conditions is achievable at high temperatures that could cause thermal degradation of
MEG. Hence, vacuum distillation was used in order to increase the relative volatility
and obtain the desired separation of the key components at lower temperatures. The
vacuum pressure was also maintained here by adding vacuum pumps at all the outlet
streams of this equipment in order to ensure that the design has excellent preservation
of the vacuum pressure. After running the simulation, the design parameters for the

28
distillation column such as the reflux ratio, number of stages, feed stage, and distillate-
to-feed ratio. These parameters were used later to run ‘RadFrac’ full distillation column
model obtaining lean MEG as a bottom product.
Figure 7. PFD for design 1 for MRU.
In order to ensure the smooth operation of the process, some important
considerations were taken in the simulation:
1. Salt precipitation scenarios were simulated after defining all the salts that can
form from the combination of ions present in the feed. In addition, the formation
reaction of each salt was defined using the chemistry environment in order to
check if the process is to be encountered with any salt precipitation incidence.
2. The maximum temperature for the preheater was set to be at 130C in order to
avoid any high temperatures occurring during the process that could cause MEG
degradation and loss. Furthermore, it was stated that higher operating
temperatures might cause salt precipitation, especially calcium salts, and
equipment failure that could adversely affect the separation efficiency [36]. The
maximum limit was selected after testing different operating temperatures and
monitoring the product’s temperature concluding that the final product reaches

29
the degradation temperature when the system is operating at 135C. Hence, the
maximum operating temperature was set to be 130C.
3. The distillation column pressure was set at the same pressure of the flash
separator in order to avoid additional equipment duty and operational costs.
4. Vacuum pumps were added to all the outlet streams from the flash separator
and the distillation column in order to maintain vacuum pressure within these
units.
After obtaining the desired effluent quality specifications, the Aspen Economic
Evaluation Add-in was used in order to determine the capital (CAPEX) and operating
(OPEX) costs as well as the utilities and equipment costs. This was useful in order to
decide if establishing a MEG recovery unit can reduce the costs associated with
purchasing fresh MEG to be injected in wells for hydrate inhibition.
3.4 Sensitivity analysis and optimization studies
Besides the approach stated earlier, additional simulation trials were done as a
sensitivity analysis step in order to optimize the performance of the unit and check how
the CAPEX and OPEX change. First of all, different sets of temperatures and pressures
were tested for the heater and flash separator to monitor at what conditions MEG and
water vaporize from the brine stream taking into consideration that MEG loss with brine
does not exceed 0.5%. The obtained set of temperatures and pressures were tested
against the purity of the product, the recovery, and the cost. In addition, the distillation
column performance was altered and tested against producing MEG at different purities
of 99wt%, 95wt%, 92wt%, and 90wt% and monitor how the total cost of the unit reacts
to this alteration.

30
3.5 Comparing the designs
During the process of developing the first design and carrying out the
optimization process, another design was developed for the MEG recovery unit but with
a different product quality specification. Figure 8 presents the PFD for this developed
design which differs from the first design in the fact that it is selective to the type of
salt it removes. In this design, after flashing the hydrocarbons, caustic soda (NaOH) is
injected in order to precipitate divalent ions, mainly calcium and magnesium, as
hydroxides and remove them. These divalent salts can be removed completely in a
pretreatment unit as these types of salts tend to precipitate out easily and then the
monovalent salts can be removed later. Also, this design tests operating the distillation
column at atmospheric pressure and determine the purity of MEG that could be
obtained without losing it due to degradation. After various trials, it was found that rich
MEG can be distilled increasing its concentration up to 90wt% MEG as lean MEG is
obtained at a final temperature of 140 ℃. Finally, it was found that this stream can be
vaporized only under a vacuum pressure of 0.1 bar to remove the monovalent salts.
Generally, design 1 follows the FS concept while design 2 follows the SS
concept. Both designs were compared to each other based on the final product obtained
at purity 90wt% as it is the maximum limit for design 2 in addition to the associated
economics in order to determine which design is more cost-effective.

31
Figure 8. PFD for design 2 for MRU.
Finally, after determining the costs associated with MEG recovery units, the
prices for purchasing fresh MEG for injection was compared to the cost of establishing
this unit based on a project life of 20 years and an interest rate of 8% per year.

32
CHAPTER 4: RESULTS AND DISCUSSION
4.1 Design 1 simulation results
The MEG recovery unit was successfully simulated through Aspen plus with
MEG recovery and final lean MEG purity exceeding 99.7% in all scenarios
implemented. In the design process, all the equipment was sequentially optimized in
the order they appear in the flowsheet. To start with, in the reclamation design the heater
and flash separator temperature and pressure were varied simultaneously to obtain the
optimum operating conditions that could vaporize at least 99.5% of the MEG present
in the feed from the accompanying salts leaving behind a concentrated brine stream.
This was accomplished in all four scenarios, presented earlier in figure 6, at a set of
optimized pressures and temperatures for flashing as shown previously in table 3. The
last set of data in that table was not considered in the simulation since at these
conditions the lean MEG product is obtained at 162 ℃ where MEG starts to degrade
thermally. As the values in table 3 demonstrate, if rich MEG is to be passed down to
the flash separator (FLS) at a lower temperature, more vacuum is required since the
vaporization of MEG can be achieved either by heating at a high temperature or
reducing the pressure but since MEG degrades at a temperature lower than its boiling
temperature, extreme vacuum conditions were used. Since each set of temperature and
pressure has produced MEG at the same purity (>99wt%) and recovery (>99.7%) for
all four scenarios, the set of data was tested in all four scenarios against its effect on the
energy requirement of the process. Analyzing the energy requirement for each
equipment in all four scenarios as shown in figure 9, the overall conclusion that can be
made is that there is no considerable discrepancy in the energy requirement at any of
the reported operating conditions between any of the scenarios. This is due to the low
amount of total dissolved salts and the water chemistry that does not contribute majorly

33
to the vaporization energy required; however, there were minor differences in the
obtained duties where the exact values are presented in Appendix A. In addition, it can
be deduced from the figure that at extreme vacuum condition the FLS duty outweighs
the heater duty, and as the vacuum is reduced and the heater’s temperature is increased,
the heater’s duty increases making the net duty in overall constant.
Looking closely at any of the scenarios in figure 9 (i.e. scenario 1), it can be
observed that when the temperature increases from 100 ℃ to 110 ℃, the heater’s duty
triples. Simultaneously, the vacuum pressure is reduced by increasing the pressure from
0.05 bar to 0.1 bar causing around 22% reduction in FLS duty; however, in overall, the
net duty for both equipment remains constant. As the temperature is furtherly increased
and vacuum pressure is reduced, the heater’s duty increases but by a small factor
compared to moving from 100 ℃ to 110 ℃, while the FLS duty decreases making the
net duty at all conditions exactly the same.

34
a) Scenario 1 b) Scenario 2
c) Scenario 3 d) Scenario 4
Figure 9. Variations in heater’s and flash separator’s duties for all scenarios with varying operating conditions. The scenario includes a)
monovalent and divalent ions with no salt precipitation. b) monovalent ions only with no salt precipitation. c) monovalent and divalent ions
with salt precipitation. d) monovalent ions with salt precipitation.
- 5,000
10,000
15,000 20,000
25,000
30,000
Tota
l du
ty (
kW)
Temperature (C) [Pressure (bar)]
FLS
Heater - 5,000
10,000
15,000 20,000
25,000
30,000
Tota
l du
ty (
kW)
Temperature (C) [Pressure (bar)]
FLS
Heater
- 5,000
10,000 15,000 20,000 25,000 30,000
Tota
l du
ty (
kW)
Temperature (C) [Pressure (bar)]
FLS
Heater - 5,000
10,000
15,000 20,000
25,000
30,000
Tota
l du
ty (
kW)
Temperature (C) [Pressure (bar)]
FLS
Heater
35
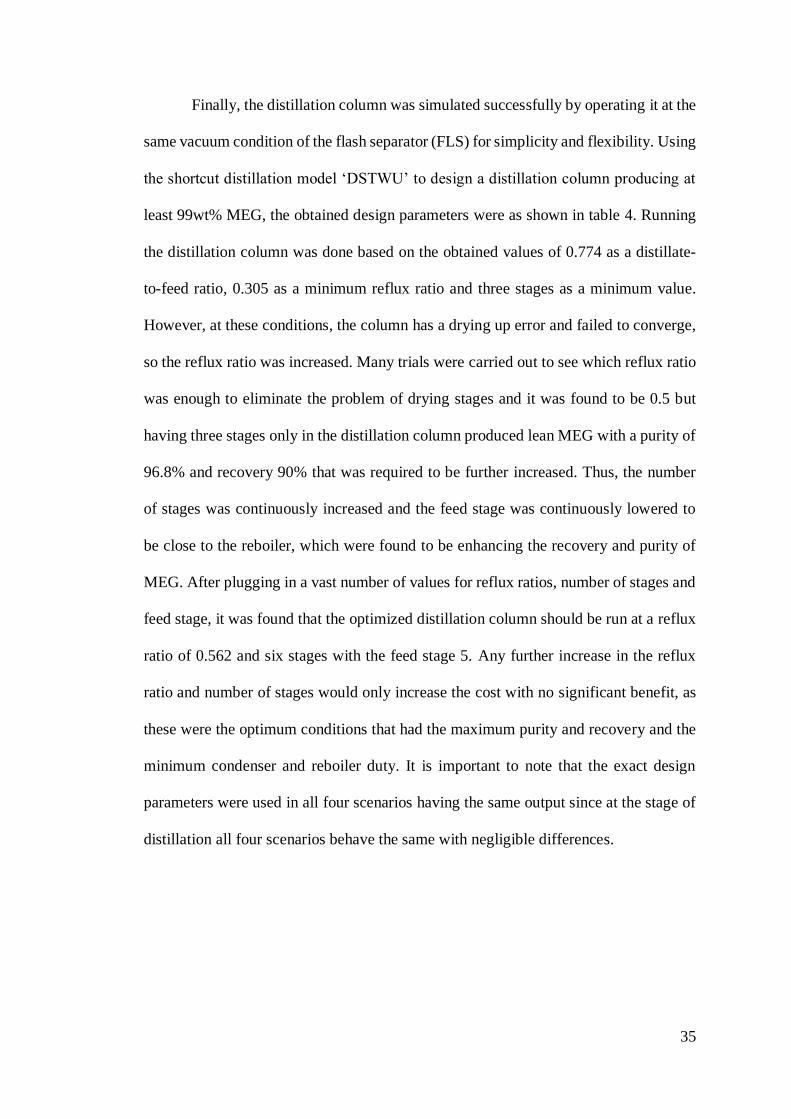
Finally, the distillation column was simulated successfully by operating it at the
same vacuum condition of the flash separator (FLS) for simplicity and flexibility. Using
the shortcut distillation model ‘DSTWU’ to design a distillation column producing at
least 99wt% MEG, the obtained design parameters were as shown in table 4. Running
the distillation column was done based on the obtained values of 0.774 as a distillate-
to-feed ratio, 0.305 as a minimum reflux ratio and three stages as a minimum value.
However, at these conditions, the column has a drying up error and failed to converge,
so the reflux ratio was increased. Many trials were carried out to see which reflux ratio
was enough to eliminate the problem of drying stages and it was found to be 0.5 but
having three stages only in the distillation column produced lean MEG with a purity of
96.8% and recovery 90% that was required to be further increased. Thus, the number
of stages was continuously increased and the feed stage was continuously lowered to
be close to the reboiler, which were found to be enhancing the recovery and purity of
MEG. After plugging in a vast number of values for reflux ratios, number of stages and
feed stage, it was found that the optimized distillation column should be run at a reflux
ratio of 0.562 and six stages with the feed stage 5. Any further increase in the reflux
ratio and number of stages would only increase the cost with no significant benefit, as
these were the optimum conditions that had the maximum purity and recovery and the
minimum condenser and reboiler duty. It is important to note that the exact design
parameters were used in all four scenarios having the same output since at the stage of
distillation all four scenarios behave the same with negligible differences.

36
Table 4. The Design Parameters for The Distillation Column in Design 1
Purity (wt%) 99.9
Rmin 0.305
R 0.562
Nmin 3
N 6
NF 4
D/F 0.774
In overall, this design has shown good performance with favorable outcomes in
terms of the purity and MEG recovery in all four scenarios implemented as shown in
table 5. The net duty requirement for the unit was found to be around 55 MW producing
99.9wt% MEG with a minimum overall recovery of 99.7% for all four scenarios.
Table 5. Purity and Recovery Obtained in Design 1 from All Four Scenarios with The
Corresponding Net Duty
Scenario 1 Scenario 2 Scenario 3 Scenario 4
Purity (wt%) 99.90 99.89 99.95 99.94
Recovery (%) 99.72 99.73 99.93 99.99
Net duty (kW) 55,776 55,797 55,845 55,864
4.2 Design 2 simulation results
As the design shows in figure 8 presented earlier, after flashing off the
hydrocarbons, rich MEG is mixed with sodium hydroxide in order to precipitate out the
divalent cations, mainly calcium and magnesium. For that, some calculations were

37
made to determine the exact amount of NaOH required since it is unfavorable to inject
it more than required. The reason behind injecting the minimum amount of NaOH is
that it is highly alkaline and will increase the alkalinity of the lean MEG if injected
more than required which in turn is not recommended as it increases the risk of calcium
carbonate precipitation and scale formation in pipelines downstream MEG injection
points [40,47–49]. Thus, based on the concentration of these ions given in table 2, the
exact amount of NaOH required was calculated as shown in Appendix B. It was found
that NaOH should flow at a rate of 40 kg/hr in order to completely precipitate out the
divalent salts. Then, in a similar manner rich MEG was passed down to a distillation
column which was run in shortcut model first to obtain the design parameters where the
light key set as water with a recovery of 90% in the distillate and MEG as a heavy key
with a recovery of 0.1% in the distillation. Water recovery was set as 90% since any
increase in water recovery for a distillation column operating under atmospheric
conditions would cause an increase in the temperature profile of the column which is
known to cause MEG degradation. The condenser and reboiler’s pressure were set as 1
bar to test the distillation at atmospheric conditions. The values obtained are present in
table 6 and they were tested and used similarly as in design 1. The column was found
to be having six stages as in the first design with feed stage 5, which provides the
required separation operating at a reflux ratio of 0.1. This reflux ratio is lower compared
to the first design since less water has to be evaporated as the first design produces
99.9% pure MEG while the second design obtained a maximum purity of 90wt% since
any attempt to increase the purity would cause MEG degradation and loss due to
elevated temperatures in the distillation column. Finally, lean MEG was vaporized in a
flash separator operating at 140 ℃ (the temperature of the bottom product from
distillation column) and 0.1 bar in order to remove the monovalent salts. The selection
38
of the extreme vacuum pressure was made since it was the only condition achieving
monovalent salts separations.
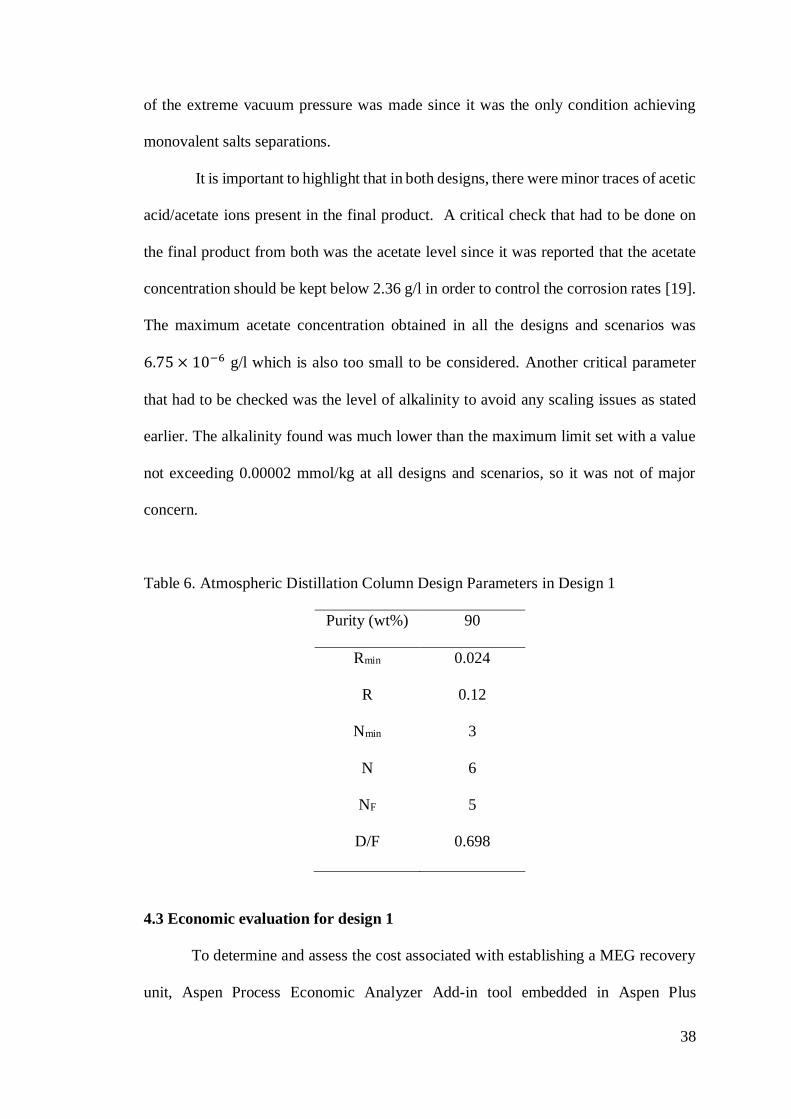
It is important to highlight that in both designs, there were minor traces of acetic
acid/acetate ions present in the final product. A critical check that had to be done on
the final product from both was the acetate level since it was reported that the acetate
concentration should be kept below 2.36 g/l in order to control the corrosion rates [19].
The maximum acetate concentration obtained in all the designs and scenarios was
6.75 × 10⁻⁶ g/l which is also too small to be considered. Another critical parameter
that had to be checked was the level of alkalinity to avoid any scaling issues as stated
earlier. The alkalinity found was much lower than the maximum limit set with a value
not exceeding 0.00002 mmol/kg at all designs and scenarios, so it was not of major
concern.
Table 6. Atmospheric Distillation Column Design Parameters in Design 1
Purity (wt%) 90
Rmin 0.024
R 0.12
Nmin 3
N 6
NF 5
D/F 0.698
4.3 Economic evaluation for design 1
To determine and assess the cost associated with establishing a MEG recovery
unit, Aspen Process Economic Analyzer Add-in tool embedded in Aspen Plus

39
environment was used to provide an estimate for the capital cost (CAPEX) and
operating cost (OPEX) for the MEG recovery unit simulated earlier for all the four
scenarios. Assuming a project life of 20 years and interest rate of 8% per year, the
capital (CAPEX) and operating costs (OPEX) for all four scenarios are obtained and
calculated as a present worth that can be seen in figure 10. As it can be observed, the
same cost was obtained for all four scenarios which were expected since all the
scenarios have behaved similarly. In overall, it was deduced in the cost estimation
process that there was no significant difference in the obtained values for all the
scenarios; thus, from now on, only one scenario is adopted, analyzed and discussed as
a representative. On average, the cost associated with design 1 producing 99.9wt%
MEG is 11.5 MMUSD as a CAPEX and 35 MMUSD as OPEX which equates to an
annual cost of 3.5 MMUSD.
Figure 10. CAPEX and OPEX present worth for the four scenarios for design 1 at an
operational pressure of 0.05 bar.
Looking at the breakdown of the total cost for design 1, for the CAPEX, around
11.5 11.5 11.5 11.6
35.2 35.2 35.3 35.3
0
5
10
15
20
25
30
35
40
Scenario 1 Scenario 2 Scenario 3 Scenario 4
Co
st (
USD
)
Mill
ion
s
CAPEX (USD) OPEX (USD)

40
50% of the cost is dedicated to the purchase and installation of the equipment with an
average total installed cost 5.2 MMUSD for all four scenarios. Figure 11 presents the
contribution of each equipment to the total equipment cost for design 1 where there is
no significant difference in the reported values for all scenarios; thus, one scenario has
been adopted and discussed. As it can be seen, the vacuum distillation has the dominant
cost of all the equipment with 85% contribution which is expected since distillation
columns are usually expensive adding to that the fact that this column runs at extreme
vacuum conditions which generally indicates high vapor loads in the column and
having the column of huge size due to increased diameter [50]. Furthermore, it was
stated that running under vacuum conditions involves additional overhead equipment
to maintain the vacuum which also requires a large diameter column in order to prevent
flooding [38]. The vacuum flash separator has also contributed with almost 10% of the
cost due to its increased size. Regarding the remaining of the CAPEX aside from the
equipment, these costs could be related to piping, instrumentation, insulation, paint,
contract fees, escalation, contingencies, General and Administrative (G&A) expenses.
Figure 11. The contribution of each equipment to the total equipment cost in design 1.
Moving to the OPEX which was found to be around 3.5 MMUSD/yr, this cost
Heater
2%
FLS
9%
Vacuum
pumps2%
Flash
3%
VACDIST
84%
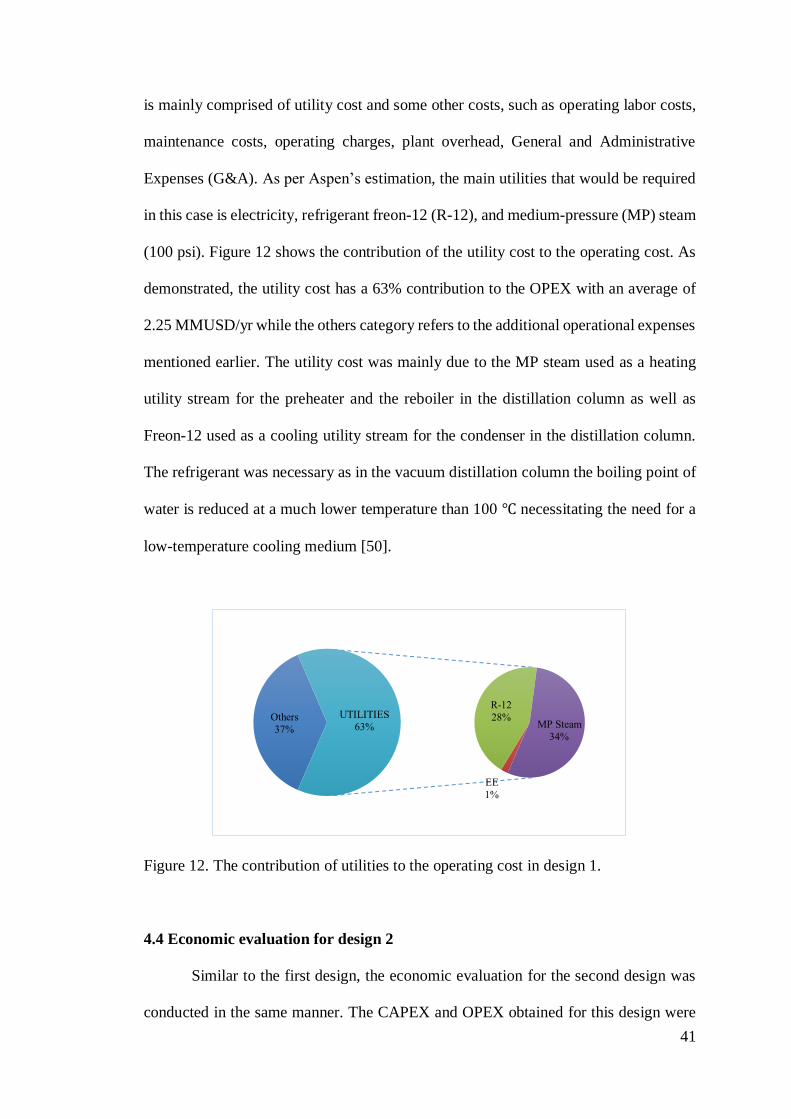
41
is mainly comprised of utility cost and some other costs, such as operating labor costs,
maintenance costs, operating charges, plant overhead, General and Administrative
Expenses (G&A). As per Aspen’s estimation, the main utilities that would be required
in this case is electricity, refrigerant freon-12 (R-12), and medium-pressure (MP) steam
(100 psi). Figure 12 shows the contribution of the utility cost to the operating cost. As
demonstrated, the utility cost has a 63% contribution to the OPEX with an average of
2.25 MMUSD/yr while the others category refers to the additional operational expenses
mentioned earlier. The utility cost was mainly due to the MP steam used as a heating
utility stream for the preheater and the reboiler in the distillation column as well as
Freon-12 used as a cooling utility stream for the condenser in the distillation column.
The refrigerant was necessary as in the vacuum distillation column the boiling point of
water is reduced at a much lower temperature than 100 ℃ necessitating the need for a
low-temperature cooling medium [50].
Figure 12. The contribution of utilities to the operating cost in design 1.
4.4 Economic evaluation for design 2
Similar to the first design, the economic evaluation for the second design was
conducted in the same manner. The CAPEX and OPEX obtained for this design were
Others
37%
EE
1%
R-12
28%MP Steam
34%
UTILITIES
63%

42
6.5 MMUSD and 8.2 MMUSD/yr, respectively. For the capital cost, the total equipment
installation cost was around 33% of the capital cost with an investment of 2.2 MMUSD
divided on the unit’s equipment as shown in figure 13. As shown the distillation column
has the highest cost as expected with a share of almost 50%. Then, it is followed by the
divalent ions’ precipitator with a share of 20% as it does the job of a reactor (reacting
caustic soda with divalent ions) and settler (allow the formed the solids from the
reaction to settle down by gravity). Also, the vacuum flash separator has a contribution
of 10% as it works under vacuum indicating its large size while the remaining other
equipment has shares <10%.
Figure 13. The contribution of each equipment to the total equipment cost in design 2.
Moving to the operational costs, it can be realized from figure 14 that the utility
cost represents 78% of the OPEX mainly influenced by the steam cost as this design
carries out the vaporization at atmospheric conditions having high temperatures
requiring a tremendous amount of steam. For cooling purposes, some amount of cooling
water was required having a share of 7% to the total operational cost.
Cooler
6%
DIST
48%
Flash
8%
FLS
11%
Heater
6%
Vacuum pump
1%
Divalent
precipitator20%

43
Figure 14. The contribution of utilities to the operating cost in design 2.
4.5 Sensitivity analysis on the performance of the unit
In order to determine if the unit is flexible to any operational changes, it was
essential to conduct the sensitivity analysis to see how the performance of the unit is
affected by the variation of different parameters. In principle, the sensitivity analysis
was performed on the first design only as the second design was not flexible to the
variation in the operational conditions or feed conditions because its design is specific
to the conditions provided and any minor changes in that would cause significant MEG
loss and to confirm that three conditions were tested in Aspen plus and the simulation
has failed to converge. Besides, the sensitivity analysis presented here is based on
design 1. In addition, it is important to highlight that scenario 3 shows the most realistic
case with both types of salts are present and taking into consideration the chances of
salt precipitation incidence, so most of the sensitivity analysis studies are based on this
scenario.
4.5.1 Variation of rich MEG feed flow rate
The variation in the feed’s flow rate was tested against different parameters,
others
22%
Electricity
1%
Cooling water
7%
MP steam
70%Utilities
78%

44
such as equipment duties, salt precipitation, salt carryover with MEG, MEG recovery,
and purity. Figures 15 & 16 show an increasing linear trend for the duties of the heater,
vacuum flash separator (FLS), condenser, and reboiler of the distillation column with
increasing feed flow rate which indicates increasing cost. However, there were no
incidences of severe salt precipitation or salt carryover with the product which indicates
the excellent performance of the unit even at high loads of double the design flow rate;
adding to that; there was no deterioration either in the quality of the product nor its
purity. Looking closely at the figures below, in figure 15 it can be observed that the
variation in the FLS duty is much higher than the heater’s duty because of the extreme
vacuum the unit is operated at. In figure 16, it is observed that the condenser’s duty is
increasing considerably compared to the reboiler’s duty and this is due to the same
reason of operational vacuum condition that increases the cooling requirements due to
low operating temperatures.
Figure 15. Variation of the heater and FLS duty with the feed flow rate.
0
10,000
20,000
30,000
40,000
50,000
0 20000 40000 60000 80000 100000
Net
du
ty (
kW)
Feed flow rate (kg/hr)
Heater FLS
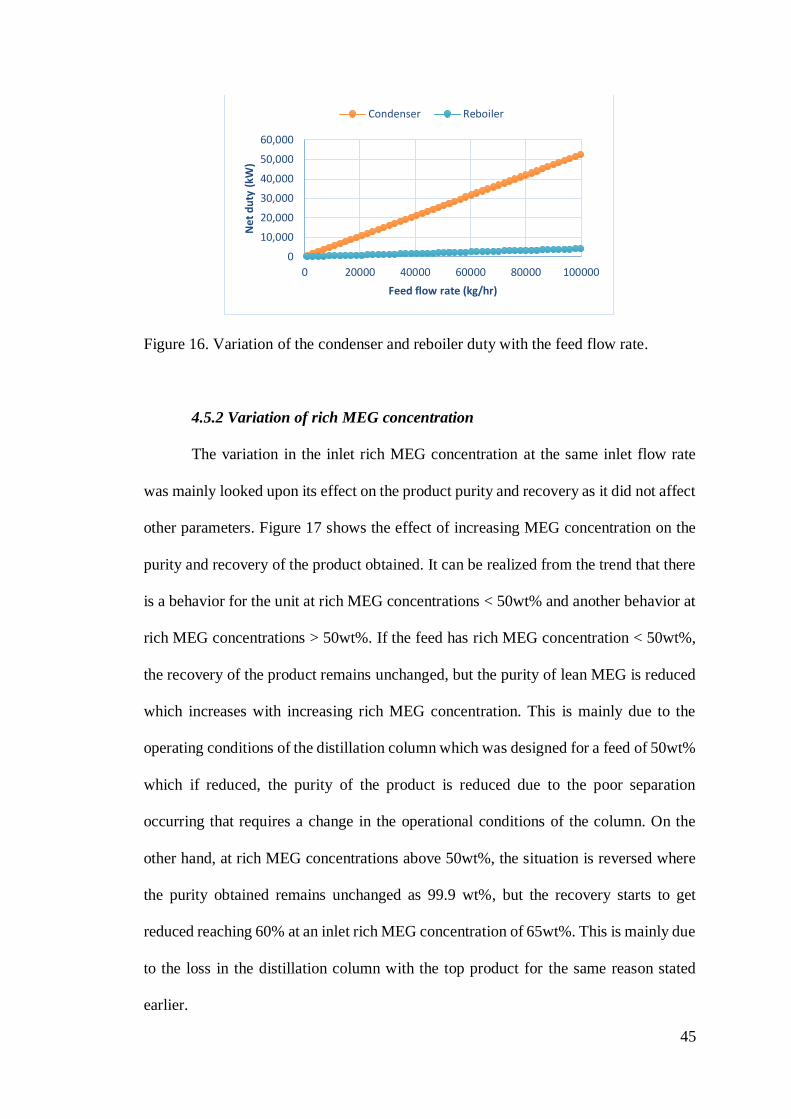
45
Figure 16. Variation of the condenser and reboiler duty with the feed flow rate.
4.5.2 Variation of rich MEG concentration
The variation in the inlet rich MEG concentration at the same inlet flow rate
was mainly looked upon its effect on the product purity and recovery as it did not affect
other parameters. Figure 17 shows the effect of increasing MEG concentration on the
purity and recovery of the product obtained. It can be realized from the trend that there
is a behavior for the unit at rich MEG concentrations < 50wt% and another behavior at
rich MEG concentrations > 50wt%. If the feed has rich MEG concentration < 50wt%,
the recovery of the product remains unchanged, but the purity of lean MEG is reduced
which increases with increasing rich MEG concentration. This is mainly due to the
operating conditions of the distillation column which was designed for a feed of 50wt%
which if reduced, the purity of the product is reduced due to the poor separation
occurring that requires a change in the operational conditions of the column. On the
other hand, at rich MEG concentrations above 50wt%, the situation is reversed where
the purity obtained remains unchanged as 99.9 wt%, but the recovery starts to get
reduced reaching 60% at an inlet rich MEG concentration of 65wt%. This is mainly due
to the loss in the distillation column with the top product for the same reason stated
earlier.
0
10,000
20,000
30,000
40,000
50,000
60,000
0 20000 40000 60000 80000 100000
Net
du
ty (
kW)
Feed flow rate (kg/hr)
Condenser Reboiler
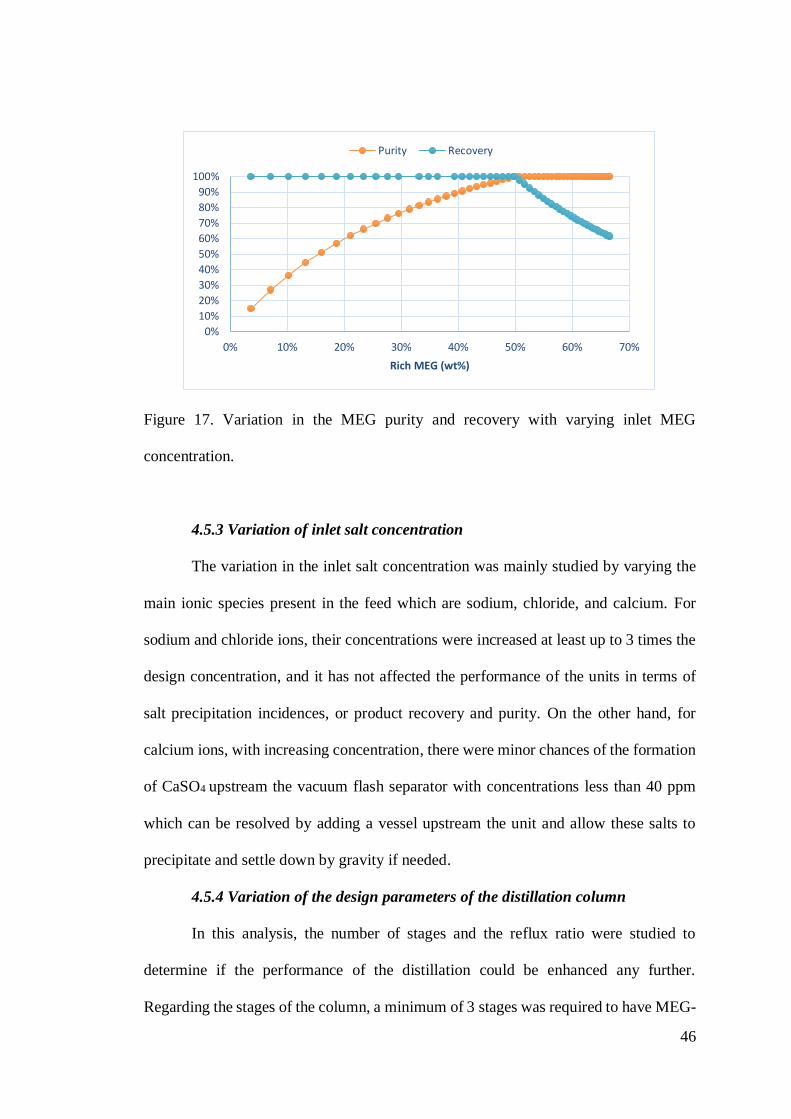
46
Figure 17. Variation in the MEG purity and recovery with varying inlet MEG
concentration.
4.5.3 Variation of inlet salt concentration
The variation in the inlet salt concentration was mainly studied by varying the
main ionic species present in the feed which are sodium, chloride, and calcium. For
sodium and chloride ions, their concentrations were increased at least up to 3 times the
design concentration, and it has not affected the performance of the units in terms of
salt precipitation incidences, or product recovery and purity. On the other hand, for
calcium ions, with increasing concentration, there were minor chances of the formation
of CaSO4 upstream the vacuum flash separator with concentrations less than 40 ppm
which can be resolved by adding a vessel upstream the unit and allow these salts to
precipitate and settle down by gravity if needed.
4.5.4 Variation of the design parameters of the distillation column
In this analysis, the number of stages and the reflux ratio were studied to
determine if the performance of the distillation could be enhanced any further.
Regarding the stages of the column, a minimum of 3 stages was required to have MEG-
0%
10%
20%
30%
40%
50%
60%
70%
80%
90%
100%
0% 10% 20% 30% 40% 50% 60% 70%
Rich MEG (wt%)
Purity Recovery

47
water separation, but with stages between three and six, the column has shown an
enormous load on the condenser and reboiler duty in addition to having high
temperatures in the column that could cause MEG degradation. Having 6-staged
distillation has shown an acceptable operational temperature with obtaining the
maximum separation which was ideal for the design. Further increase in the number of
stages has not demonstrated any enhancement in the performance as well as increasing
the capital cost of the column; thus, the column was designed to have six stages. Moving
to the reflux ratio, the selected value for the design was around 0.56, below that the
simulation has failed to converge due to the drying up of the column. On the other hand,
operating the column above the designed reflux ratio with an attempt to reduce the
number of stages has shown no favor as the utility requirement increased tremendously
with a minor reduction in the initial cost of the column. This can be affirmed by
observing figure 18.
Figure 18. Variation in the condenser and reboiler duty with varying reflux ratio.
4.6 Sensitivity analysis on the economics of the unit
As mentioned earlier, the sensitivity analysis was conducted on the first design
0
10,000
20,000
30,000
40,000
50,000
60,000
70,000
80,000
0 0.5 1 1.5 2 2.5 3 3.5
Net
du
ty (
kW)
Reflux ratio
CONDUTY REBDUTY
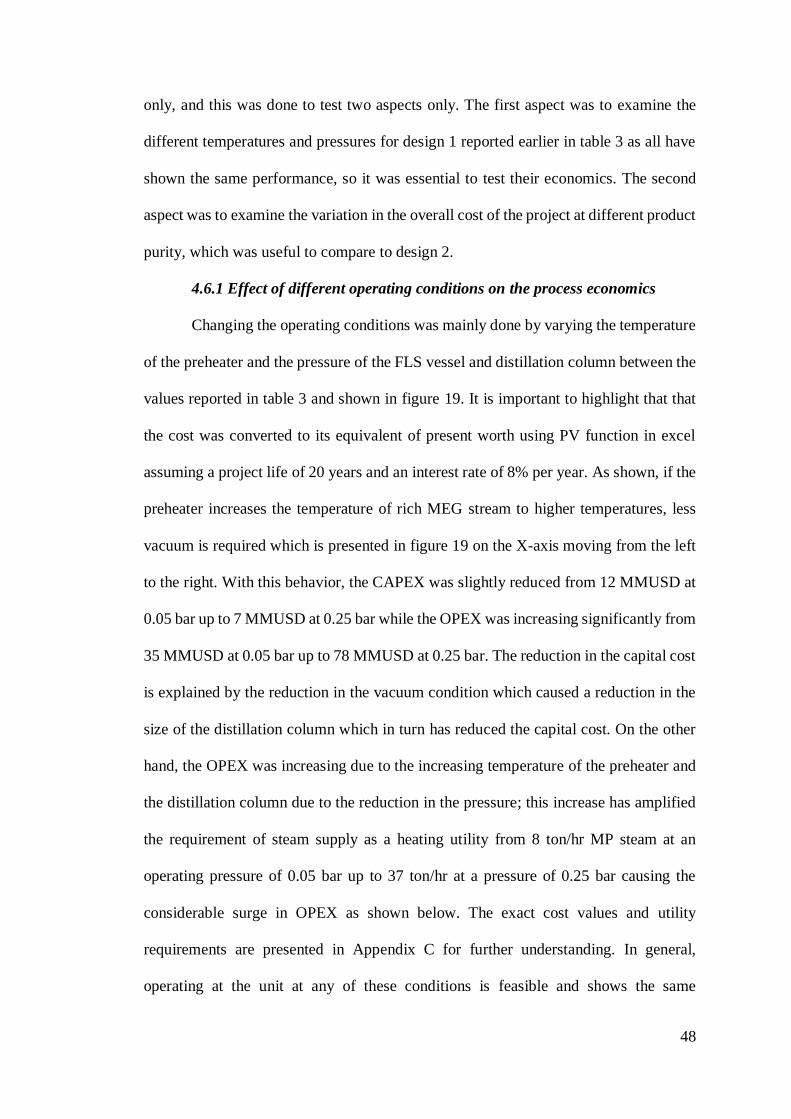
48
only, and this was done to test two aspects only. The first aspect was to examine the
different temperatures and pressures for design 1 reported earlier in table 3 as all have
shown the same performance, so it was essential to test their economics. The second
aspect was to examine the variation in the overall cost of the project at different product
purity, which was useful to compare to design 2.
4.6.1 Effect of different operating conditions on the process economics
Changing the operating conditions was mainly done by varying the temperature
of the preheater and the pressure of the FLS vessel and distillation column between the
values reported in table 3 and shown in figure 19. It is important to highlight that that
the cost was converted to its equivalent of present worth using PV function in excel
assuming a project life of 20 years and an interest rate of 8% per year. As shown, if the
preheater increases the temperature of rich MEG stream to higher temperatures, less
vacuum is required which is presented in figure 19 on the X-axis moving from the left
to the right. With this behavior, the CAPEX was slightly reduced from 12 MMUSD at
0.05 bar up to 7 MMUSD at 0.25 bar while the OPEX was increasing significantly from
35 MMUSD at 0.05 bar up to 78 MMUSD at 0.25 bar. The reduction in the capital cost
is explained by the reduction in the vacuum condition which caused a reduction in the
size of the distillation column which in turn has reduced the capital cost. On the other
hand, the OPEX was increasing due to the increasing temperature of the preheater and
the distillation column due to the reduction in the pressure; this increase has amplified
the requirement of steam supply as a heating utility from 8 ton/hr MP steam at an
operating pressure of 0.05 bar up to 37 ton/hr at a pressure of 0.25 bar causing the
considerable surge in OPEX as shown below. The exact cost values and utility
requirements are presented in Appendix C for further understanding. In general,
operating at the unit at any of these conditions is feasible and shows the same

49
performance. The selection of any of them has a major trade-off between maintaining
the extreme vacuum conditions and the higher economics at lower vacuum conditions.
The concern of operating at 0.05 bar can be resolved by knowing that in the industry
up to 2 mbar pressure levels are already applied [50]. As can be seen in figure 19 below,
the hypothesis of operating at 100 ℃ and 0.05 bar would have the lowest cost has been
clarified.
Figure 19. Effect of different temperature and pressure on the CAPEX and OPEX of
design 1.
4.6.2 Economics of the unit at different product purities
In order to test the flexibility of the design and compare its economics to the
economics of the second designs, the design was tested against producing four different
MEG purities (99wt%, 95wt%, 92.5wt%, and 90wt%). This analysis was successfully
conducted by changing the design parameters of the distillation column, mainly the
reflux ratio and the distillate-to-feed ratio at the same number of stages. This analysis
was done at an operating pressure of 0.05 bar as it shows the minimum overall cost
12 10 9 8 7
3547
68 74 78
$0
$10
$20
$30
$40
$50
$60
$70
$80
$90
100[0.05] 110[0.1] 120[0.15] 125[0.2] 130 [0.25]
Mil
lions
Temperature (0C) Pressure (bar)
OPEX
CAPEX
47$
57$
77$82$
85$

50
based on the previous analysis. Generally, all the four scenarios have produced the same
output in this analysis with the same reflux ratio and the distillate-to-feed ratio at a
given purity. The values obtained are present in table 7. Generally, the change in these
parameters has reduced the reboiler’s duty four times with decreasing purity from
99.9wt% to 90wt%. This is because less water has to be evaporated from MEG which
in turn reduces the load on the reboiler of the column. Figures 20 to 22 show the
variation in capital cost, operational cost, and the total project cost for all four scenarios
whose trends are the same at each scenario. From figure 20, it can be seen that there is
a slight reduction in the capital cost with decreasing purity which is mainly due to the
reduction in the size of the distillation column. Figure 21 shows the variation in the
OPEX with purity which mainly tends to reduce with decreasing purity. This is mainly
due to the reduction in the steam requirement as the reboiler’s duty has been reduced.
In overall, figure 22 shows the reduction in the total project cost from 47 MMUSD at a
purity of 99.9 wt% to 40 MMUSD at a purity of 90 wt%. Generally, from this analysis
with decreasing purity, the following was obtained:
1- 2.5% reduction in the refrigerant requirement.
2- 35% reduction in the steam requirement.
3- 10% reduction in the distillation column purchase and installation cost.

51
Table 7. Data Table for Distillation Column Design Parameters at Different Purities for
Design 1
Purity Reflux ratio (R) Distillate-to-feed ratio (D/F)
99.9wt% 0.56 0.774
95wt% 0.59 0.736
92.5wt% 0.65 0.713
90wt% 0.71 0.69
Figure 20. Varying CAPEX with product purity for all four scenarios in design 1.
$0.0
$2.0
$4.0
$6.0
$8.0
$10.0
$12.0
Scenario 1 Scenario 2 Scenario 3 Scenario 4
CA
PE
X (
US
D)
Million
s
99.9 wt%
95wt%
92.5wt%
90 wt%

52
Figure 21. Varying OPEX with product purity for all four scenarios in design 1.
Figure 22. Varying total cost with product purity for scenario 3 in design 1.
4.7 Economic comparison between the two designs
To select the best of the two designs, an economic comparison was conducted
between them based on a similar performance. Since the second design produces MEG
with a purity of 90wt%, so it is compared to the first design at the operating conditions
that produce 90wt% MEG. Figures 23 & 24 present the difference in equipment cost
$0.0
$5.0
$10.0
$15.0
$20.0
$25.0
$30.0
$35.0
$40.0
Scenario 1 Scenario 2 Scenario 3 Scenario 4
OP
EX (
USD
)
Mill
ion
s
99.9 wt%
95wt%
92.5wt%
90 wt%
$12 $11 $11 $11
$35
$29 $29 $29
$0.0
$5.0
$10.0
$15.0
$20.0
$25.0
$30.0
$35.0
$40.0
$45.0
$50.0
99.9 wt% 95wt% 92.5wt% 90 wt%
Million
s 46.8$
39.9$ 39.6$ 39.1$

53
and utilities cost for both designs. It can be observed in figure 24 that the distillation
column has significantly higher costs than other equipment being four times higher in
the first design compare to the second design. The reason behind that is that the
distillation column in the first design is operated under vacuum while in the second
design is at atmospheric condition making the column in design 1 of a huge size
compared to that in the second design. On the other hand, looking at the utilities cost
present in figure 24, which shows that the steam cost is the primary controller in the
utility cost being five times higher in the second design compared to the first one. This
is due to the same reason mentioned earlier; the second column operating under
atmospheric pressure has higher operational temperatures requiring vast amounts of the
steam. In overall, analyzing the results present in figure 25, although the CAPEX of
design 2 is lower than design 1, the high OPEX associated with the second design as
steam accounts for 70% of this cost makes the overall project cost comparably higher
than the first design for a project life of 20 years and interest rate 8% per year. The
OPEX is around 12 times the CAPEX in the second design, as MP steam is used to
increase the operational temperatures of the distillation column. Thus, design 1 is more
attractive as it has lower cost and higher flexibility to changes in operational conditions,
so it is recommended to adopt the first design with an overall project cost of 39 million
USD for 90wt% MEG production or 47 million USD for 99wt% MEG production. If
this design is compared to past studies in literature, this design has the least cost of all.

54
Figure 23. Equipment cost comparison between the two proposed designs.
Figure 24. Utility cost comparison between the two proposed designs.
$0.0
$0.5
$1.0
$1.5
$2.0
$2.5
$3.0
$3.5
$4.0
Equip
men
t co
st (
US
D) Millions
Design 1 Design 2
$0 $1 $2 $3 $4 $5 $6
Electricity
Cooling utility
MP Steam
Utility cost (USD/yr)
Millions
Design 1 Design 2

55
Figure 25. Overall project cost comparison between the two proposed designs.
4.8 The Engineering solution in establishing a MEG Recovery unit
The idea of establishing a MEG recovery unit seems promising as the hydrate
inhibitor is purified and recycled for injection. However, this will not be attractive
unless there are benefits to be drawn and MEG purchase costs are reduced or saved.
Hence, after deciding to adopt design 1, it was necessary to conduct an additional
economic study to compare the prices of purchasing fresh MEG and the costs of
establishing a MEG recovery unit and come to a conclusion if the cost of MEG recovery
unit is justified or not.
A basis of 28% MEG in the aqueous phase is assumed, and this dosage is
correlated to a produced water flow of 60 m3/hr in an LNG train having a natural gas
production of 7.8 million tons annually. Also, it is assumed that the MEG injected is
pure with a density of 1,110 kg/m3 at 25 oC and an approximate cost of 700 USD/ton
[24]. Based on this information, the annual cost associated with MEG purchase was
estimated to be around 175 million USD as shown in the calculations present in
Appendix D. It is important to recall that the overall project cost of a MEG recovery
$10.6$6.5
$28.5
$80.7
$39.1
$87.2
$0
$10
$20
$30
$40
$50
$60
$70
$80
$90
Design 1 Design 2
Mil
lion
s
CAPEX (USD) OPEX (USD) Total cost

56
unit producing 99wt% MEG based on a present worth calculation for a project life of
20 years and interest rate 8% per year was estimated to be around 47 MMUSD.
Assuming that the purchase prices of MEG are to be reasonably stable over 20
years [6], the present worth of the annual costs of MEG purchase estimated earlier was
estimated as a present worth with an approximate value of 1.9 billion USD. Hence, this
amount represents the cost of MEG purchase for 20 years without
recovery/regeneration. This cost was used as a basis of comparison to the purchase cost
of MEG if it is to be regenerated. For that, it was assumed that MEG could be
regenerated up to 5 times comparable to 9 regeneration cycles for MEG that was
reported to perform well in hydrate inhibition as per an experimental analysis[42].
Thus, this analysis was done on MEG if it is to be regenerated once, twice, thrice,
quadruple, and five times before being disposed of. Figure 26 presents the cost savings
associated with MEG regeneration; the exact values are given in Appendix E. To start
with if MEG is regenerated once after being utilized and then disposed of, almost 50%
of its purchase cost can be saved based on a lifetime of 20 years. The savings percentage
increases exponentially with increasing number of regeneration cycles reaching up to
80% saving in purchase cost for five regeneration cycles. Based on this analysis, the
installation of a MEG recovery unit can be justified economically.

57
Figure 26 Variation in MEG purchase cost and percent savings with the number of
regeneration cycles.
4.9 Environmental benefit of establishing MEG recovery unit
An important aspect to look at is the environmental concern associated with the
installation of a MEG recovery unit. Regularly, if a plant does not have a MEG recovery
unit, the fate of spent MEG after separation from natural gas is the disposal through
injection into deep onshore wells. If it is decided to install a MEG recovery unit, it is
essential to have an idea regarding the waste streams produced within the unit. In this
unit, there are two main wastes in the process which are the concentrated brine from
the reclaimer vessel and the water from the regeneration distillation column. For the
concentrated brine/slurry, different treatment methods can be used. A salt handling
system can process the salts by sending them to a centrifuge or a hydrocyclone to obtain
a clean salt that can be sent for sales or disposed of as a solid waste [28,38]. Another
treatment is its redissolution and dilution with seawater to be disposed to the sea if the
appropriate regulations are set [12]. For the PW coming out of the regeneration column,
0%
47%
64%71%
75%79%
0%
10%
20%
30%
40%
50%
60%
70%
80%
90%
$0.0
$0.2
$0.4
$0.6
$0.8
$1.0
$1.2
$1.4
$1.6
$1.8
$2.0
0 1 2 3 4 5
Per
sen
t sa
vin
g i
n M
EG
purc
has
e
Pre
sen
t w
ort
h o
f M
EG
purc
has
e fo
r 20 y
ears
Bil
lion
s
Regeneration cycle
MEG purchase amount Percent saving

58
it is clean enough to be sent for re-injection [26]. Hence, the wastes coming from a
MEG recovery unit does not pose a substantial environmental concern adding to that
the significant reduction in the disposal of spent MEG through injection into deep wells.
Finally, concluding that the disposal is avoided by investing in the regeneration system
removing the burden of the environmental concern.
4.10 Comparing the results of this work to the results in literature
Looking into the details, this work has included the salts/ions present in rich
MEG in the simulation which was ignored by some other studies [2,25] making the
designs presented in this study unique, effective and reliable. Other studies have
considered the presence of salts/ions in their simulation [36,37], but there was no
detailed information regarding the designed process, approach, and performance.
Moreover, MEG recovery process was optimized for high purity and low cost in terms
of operating pressure and distillation column design parameters, which was ignored in
previous studies as presented by Zaboon [36] and Son [37].
Distillation column configuration is another aspect that can be compared with
results from literature. The present study showed an effective MEG recovery with a
distillation column of six stages, operated under a reflux ratio of 0.562 and a pressure
of 0.05 bar. These operational conditions resulted in almost pure MEG with a recovery
of 99.9%. The recovery percentage achieved in this study is better than the value
(86wt%) reported by Zaboon et al. [36] who have tested MEG recovery experimentally
and using simulation in a 6-staged distillation column operated at 1.4 bar. On the other
hand, Son [37] designed a distillation column operated at 0.35 bar with a reflux ratio of
0.56 and producing MEG with a purity not exceeding 80wt% in 26 stages distillation
column.
In addition, the results in this work are comparable to all other studies where a

59
design was obtained producing 99.9wt% MEG with an overall project cost of 46
MMUSD for a lifetime of 20 years. Kim [41] developed a MEG recovery process that
consists of a flash drum, two distillation column in parallel, a vacuum flash separator,
and another vacuum distillation column. This design was capable of recovering 97wt%
MEG with an overall project cost of 110 MMUSD for a project lifetime of 15 years. In
another study, Kim [25] showed a design having a vacuum flash separator and a vacuum
distillation similar to design 1 in this work with a total project cost of 55 MMUSD, yet,
the maximum purity obtained was 90%. Based on the previous comparison, it can be
concluded that the design presented in this study is cost-effective and of a recognizable
performance.
To summarize, if all the results of this work are well studied and compared to
all the research work and studies in literature, it would be observed that this work covers
many aspects that other studies failed to include. The only one research work that was
published with considerable results that could be compared with this study is the one
conducted by Kim [41], but even this work did not consider different scenarios or
having a design that is flexible to change the product purity or optimizing distillation
columns with detailing design parameters. Thus, in overall, this work can have a
significant contribution in literature for MEG recovery field.

60
CHAPTER 5: CONCLUSIONS AND RECOMMENDATIONS
In this thesis, a MEG recovery unit was designed employing Aspen Plus
simulation software, which was a suitable means of assessing different process
configurations. After developing 2 designs, carrying out an optimization process for the
operating conditions, conducting sensitivity analysis studies to determine the ideal
conditions, and evaluating the process economics for all designs and scenarios
implemented, it was found that design 1 operating under a vacuum pressure of 0.05 bar
has shown the best performance obtaining the maximum purity and recovery with
values of 99.9% for both and the minimum project cost with CAPEX and OPEX values
of 11.5 and 35 MMUSD, respectively. To the best knowledge, the novelty of this thesis
is filling the gaps in the literature related to the lack in a detailed analysis of the
optimum operational conditions for MEG recovery and their effect on product purity,
energy consumption, and cost. This study, therefore, has provided a sequential
optimization on each equipment within MEG recovery process to obtain the best
performance with the minimum cost. It was observed that MEG could be recovered at
high purity if the OPEX and energy footprint of the process are optimized. The study
also showed that being a distillation-based process, MEG recovery is combined with
high and intensive heat requirements. In other words, the decision to install a MEG
recovery unit is driven by an economic trade-off between the capital cost and
operational costs. For these reasons, as a future perspective, it is recommended to
conduct a sensitivity analysis on the effect of changing utility prices on the decision of
installing the recovery unit and whether it would be economically justified if the utility
cost surges in the future. Furthermore, in order to proceed with this study and test it in
the industrial field, it is recommended to test the salt precipitation incidences and
include in the investigation any scale inhibitors or corrosion inhibitors that could be

61
injected in the pipelines along with MEG. Finally, It is also important to consider that
during real-life application in Qatar, MEG is commonly injected 4-5 months per year
during the winter season; thus, a study can be conducted to analyze if this would affect
MEG recovery, cause significant changes in the cost and have positive outcomes.

62
REFERENCES
[1] J. Lehmköster, T. Schröder, D. Ladischensky, Oil and gas from the sea, 3 (2014).
https://worldoceanreview.com/wp-
content/downloads/wor3/WOR3_chapter_1.pdf.
[2] A.M. Teixeira, L. de O. Arinelli, J.L. de Medeiros, O. de Q.F. Araújo, Exergy
Analysis of Monoethylene glycol recovery processes for hydrate inhibition in
offshore natural gas fields, J. Nat. Gas Sci. Eng. 35 (2016) 798–813.
doi:https://doi.org/10.1016/j.jngse.2016.09.017.
[3] A. Janson, A. Santos, A. Hussain, S. Judd, A. Soares, S. Adham, Biotreatment
of Hydrate-Inhibitor-Containing Produced Waters at Low pH, SPE J. 20 (2015)
1254–1260. doi:10.2118/174551-PA.
[4] S. Adham, A. Hussain, J. Minier-Matar, A. Janson, R. Sharma, Membrane
applications and opportunities for water management in the oil & gas industry,
Desalination. 440 (2018) 2–17. doi:https://doi.org/10.1016/j.desal.2018.01.030.
[5] P. Kumar, S. Mitra, Challenges in Uninterrupted Production and Supply of Gas
to Mega LNG Trains, in: Int. Pet. Technol. Conf., Doha, 2014: pp. 1–8.
doi:10.2523/iptc-17499-ms.
[6] K. van Son, C. Wallace, Reclamation/Regeneration of glycols used for hydrate
inhibition, Deep Offshore Technol. (2000).
[7] S. Baraka-Lokmane, C. Hurtevent, J.-L. Ohanessian, G. Rousseau, M. Seiersten,
S. Deshmush, Prediction of Mineral Scaling in a MEG Loop System of a Gas
Production Offshore, in: SPE Int. Conf. Exhib., Aberdeen, 2012.
doi:10.2118/155124-MS.
[8] K. Alef, A. Barifcani, The Effect of Salt-Laden Degraded MEG on Gas Hydrate
Inhibition, SPE Kingdom Saudi Arab. Annu. Tech. Symp. Exhib. (2018) 9.

63
doi:10.2118/192447-MS.
[9] N.A. Sami, J. Sangwai, B. Subramanian, Gas hydrate applications and problems
in oil and gas industry, Int. J. Sci. Eng. Res. 4 (2013).
[10] C. Bikkina, N. Radhakrishnan, S. Jaiswal, R. Harrington, M. Charlesworth,
Development of MEG Regeneration Unit Compatible Corrosion Inhibitor for
Wet Gas Systems, SPE Asia Pacific Oil Gas Conf. Exhib. (2012) 11.
doi:10.2118/160301-MS.
[11] Proserant MEG Regeneration & Reclaiming Technology, DigitalRefining.
(2017). https://www.digitalrefining.com/data/literature/file/1789223046.pdf.
[12] P. Boschee, Gas hydrate control using monoethylene glycol in the Gulf of
Mexico, Oil Gas Facil. 1.
[13] A. Sinquin, T. Palermo, Y. Peysson, Rheological and Flow Properties of Gas
Hydrate Suspensions, Oil Gas Sci. Technol. - Rev. IFP. 59 (2004) 41–57.
https://doi.org/10.2516/ogst:2004005.
[14] S. Zarinabadi, A. Samimi, Problems of hydrate formation in oil and gas pipes
deals, 2011.
[15] E.M. Grzelak, M. Stenhaug, A More Efficient Use of MEG to Fully Inhibit
Hydrates with Reduced Cost, Offshore Technol. Conf. Asia. (2016) 9.
doi:10.4043/26854-MS.
[16] C.A. Koh, R.E. Westacott, W. Zhang, K. Hirachand, J.L. Creek, A.K. Soper,
Mechanisms of gas hydrate formation and inhibition, Fluid Phase Equilib. 194–
197 (2002) 143–151. doi:https://doi.org/10.1016/S0378-3812(01)00660-4.
[17] B. Tohidi, R. Anderson, M. Houra, F. Tohidi, The Return of Kinetic Hydrate
Inhibitors, Energy & Fuels. 29 (2015) 8254–8260.
doi:10.1021/acs.energyfuels.5b01794.

64
[18] M.G. Akpabio, Cold flow in long-distance subsea pipelines, Norwegian
University of Science and Technology, 2013.
[19] S. Brustad, K. Løken, J.G. Waalmann, Hydrate Prevention using MEG instead
of MeOH : Impact of experience from major Norwegian developments on
technology selection for injection and recovery of MEG, in: Offshore Technol.
Conf., Texas, 2005: pp. 1–10.
[20] F.A.E. Gizah, T.A.R. Ali, M. Baydoon, S. Allenson, A. Scott, Pioneer challenge
Reduction of MEG consumption using KHI for hydrate control in a deepwater
environment offshore Egypt, Offshore Technol. Conf. (2010) 10.
doi:10.4043/20338-MS.
[21] S. Mokhatab, R.J. Wilkens, K.J. Leontaritis, A review of strategies for solving
gas-hydrate problems in subsea pipelines, Energy Sources. 29 (2007) 39–45.
doi:10.1080/009083190933988.
[22] A. Bahadori, Chapter 9 - Natural Gas Dehydration, in: A.B.T.-N.G.P. Bahadori
(Ed.), Gulf Professional Publishing, Boston, 2014: pp. 441–481.
doi:https://doi.org/10.1016/B978-0-08-099971-5.00009-X.
[23] B.A. Perlmutter, C. Gassen, Removing salts and contaminants in glycol
regeneration, (n.d.).
https://www.digitalrefining.com/article/1000958,Removing_salts_and_contami
nants_in_glycol_regeneration.html#.XJtDT-szbq0.
[24] GPSA Engineering Data Handbook, 13th ed., Gas Processors Suppliers
Association (GPSA), Tulsa, Oklahoma, 2012.
[25] H. Kim, W. Yoo, Y. Lim, Y. Seo, Economic evaluation of MEG injection and
regeneration process for oil FPSO, J. Pet. Sci. Eng. 164 (2018) 417–426.
doi:10.1016/j-petrol.2018.01.071.
65
[26] C.A. Nazzer, J. Keogh, Advances in Glycol Reclamation Technology, in:
Offshore Technol. Conf., Texas, 2006.
[27] CCR-Technologies, Introduction to Solvent Reclaiming .... the CCR Way, The
Reclaimer. (2013).
[28] PUREMEG Monoethylene glycol reclamation and regeneration unit, (2016).
https://www.slb.com/~/media/Files/processing-separation/brochures/puremeg-
br.pdf.
[29] A.M. Teixeira, L.D.O. Arinelli, J.L. de Medeiros, O. de Q.F. Araujo,
Monoethylene Glycol as Hydrate Inhibitor in Offshore Natural Gas Processing
From Fundamentals to Exergy Analysis, Springer International Publishing,
Cham, Switzerland, 2018. doi:10.1007/978-3-319-66074-5.
[30] OLI stream analyzer in the design of monoethylene glycol (MEG) reclamation
units, in: OLI Simul. Conf., New Jersey, 2012.
http://downloads.olisystems.com/OLISimulationConferences/SIMCONF12/Pre
sentations/II3-Messenger.pdf.
[31] M.N. Psarrou, L.O. Jøsang, K. Sandengen, T. Østvold, Carbon Dioxide
Solubility and Monoethylene Glycol (MEG) Degradation at MEG
Reclaiming/Regeneration Conditions, J. Chem. Eng. Data. 56 (2011) 4720–
4724. doi:10.1021/je200709h.
[32] K.M.A. AlHarooni, Gas Hydrates Investigations of Natural Gas with High
Methane Content and Regenerated Mono-Ethylene Glycol, Curtin University,
2017.
[33] K. Alharooni, A. Barifcani, D. Pack, R. Gubner, V. Ghodkay, Inhibition effects
of thermally degraded MEG on hydrate formation for gas systems, J. Pet. Sci.
Eng. 135 (2015) 608–617. doi:10.1016/j.petrol.2015.10.001.

66
[34] MEG regeneration technical meeting, (2009).
https://higherlogicdownload.s3.amazonaws.com/SPE/b21d5158-ada7-4105-
a570-17a7bc5f5c09/UploadedImages/2009/SPE MEG Workshop 18 June
2009.pdf.
[35] A.M. Teixeira, J.L. Medeiros, O.Q.F. Araújo, Offshore Monoethylene Glycol
Recovery Units: The Importance of Choice of MEG State in the Reference
Environment for Effective Exergy Analysis, OTC Bras. (2015) 10.
doi:10.4043/26135-MS.
[36] S. Zaboon, A. Soames, V. Ghodkay, R. Gubner, A. Barifcani, Recovery of
mono-ethylene glycol by distillation and the impact of dissolved salts evaluated
through simulation of field data, J. Nat. Gas Sci. Eng. 44 (2017) 214–232.
doi:10.1016/j.jngse.2017.04.007.
[37] H. Son, Y. Kim, S. Park, M. Binns, J. Kim, Simulation and modeling of MEG (
Monoethylene Glycol ) regeneration for the estimation of energy and MEG
losses, Energy. (2018) 10–18. doi:10.1016/j.energy.2018.05.128 0360-5442/©.
[38] T.M. Latta, M.E. Seiersten, S. a Bufton, Flow Assurance Impacts on Lean / Rich
MEG Circuit Chemistry and MEG Regenerator / Reclaimer Design, in: Offshore
Technol. Conf., Texas, 2013. doi:10.4043/24177-MS.
[39] L. Addicks, Method for regeneration and reclamation of mono ethylene glycol
using a vacuum slip stream, 2010.
[40] M. Seiersten, E. Brendsdal, S. Deshmukh, A. Dugstad, G. Endrestøl, A. Ek, G.
Watterud, J.-P. Andreassen, E.M. Flaten, Development Of A Simulator For
Ethylene Glycol Loops Based On Solution Thermodynamics And Particle
Formation Kinetics, Corros. 2010. (2010) 7. https://doi.org/.
[41] H. Kim, Y. Lim, Y. Seo, M. Ko, Life cycle cost analysis of MEG regeneration
67
process incorporating a modified slip stream concept, Chem. Eng. Sci. 166
(2017) 181–192. doi:https://doi.org/10.1016/j.ces.2017.03.045.
[42] K. Alef, C. Smith, S. Iglauer, R. Gubner, A. Barifcani, The effect of regenerated
MEG on hydrate inhibition performance over multiple regeneration cycles, Fuel.
222 (2018) 638–647. doi:10.1016/j.fuel.2018.02.190.
[43] A. Janson, A. Santos, M. Katebah, A. Hussain, J. Minier-Matar, S. Judd, S.
Adham, Assessing the Biotreatability of Produced Water From a Qatari Gas
Field, SPE J. (2015).
[44] M.E. Haque, Ethylene Glycol Regeneration Plan: A Systematic Approach to
Troubleshoot the Common Problems, 2013. doi:10.3329/jce.v27i1.15853.
[45] J. Esquier, How to select best MEG recovery unit’s configuration?, (2014).
[46] R. Masoudi, B. Tohidi, R. Anderson, R.W. Burgass, J. Yang, Experimental
measurement and thermodynamic modelling of clathrate hydrate equilibria and
salt solubility in aqueous ethylene glycol and electrolyte solutions, Fluid Phase
Equilib. 219 (2004) 157–163. doi:10.1016/J.FLUID.2004.01.031.
[47] S. Baraka-Lokmane, C. Hurtevent, M. Seiersten, E. Flaten, M. Farrell, O.
Bradshaw, S. Hare, M. Bonis, F. Jacob, N. Carles, Technical challenges and
solutions in a closed loop MEG regeneration system for gas field offshore , UK,
in: WIT Press, 2013. doi:10.2495/MPF130421.
[48] M. Seiersten, S.S. Kundu, Scale Management in Monoethylene Glycol MEG
Systems - A Review, SPE Int. Oilf. Scale Conf. Exhib. (2018) 10.
doi:10.2118/190738-MS.
[49] A. Yong, E.O. Obanijesu, Influence of natural gas production chemicals on scale
production in MEG regeneration systems, Chem. Eng. Sci. 130 (2015) 172–182.
doi:https://doi.org/10.1016/j.ces.2015.03.037.

68
[50] W. Jorisch, Vacuum Technology in the Chemical Industry, 2014.
doi:10.1002/9783527653898.

69
APPENDIX A: DUTIES FOR THE HEATER AND FLASH SEPARATOR FOR
ALL SCENARIOS AT DIFFERENT OPERATING CONDITIONS
Scenario 1
T (℃) P(bar) Heater duty (kW) FLS duty (kW) Net duty (kW)
100 0.05 2,405 23,912 26,317
110 0.1 8,039 18,534 26,573
120 0.15 15,306 11,536 26,843
125 0.2 17,094 9,879 26,973
130 0.25 18,514 8,592 27,106
Scenario 2
T (℃) P(bar) Heater duty (kW) FLS duty (kW) Net duty (kW)
100 0.05 2,407 23,929 26,336
110 0.1 8,264 18,113 26,377
120 0.15 15,408 11,438 26,846
125 0.2 17,172 9,743 26,915
130 0.25 18,576 8,482 27,058

70
Scenario 3
T (℃) P(bar) Heater duty (kW) FLS duty (kW) Net duty (kW)
100 0.05 2,405 23,930 26,335
110 0.1 8,043 18,554 26,597
120 0.15 15,387 11,477 26,864
125 0.2 17,210 9,786 26,996
130 0.25 18,622 8,507 27,130
Scenario 4
T (℃) P(bar) Heater duty (kW) FLS duty (kW) Net duty (kW)
100 0.05 2,407 23,929 26,336
110 0.1 8,264 18,113 26,377
120 0.15 15,408 11,438 26,846
125 0.2 17,172 9,743 26,915
130 0.25 18,576 8,482 27,058

71
APPENDIX B: CALCULATIONS FOR THE AMOUNT OF SODIUM
HYDROXIDE REQUIRED FOR INJECTION IN DESIGN 2
[𝐶𝑎2+] = 350𝑚𝑔
𝐿 , [𝑀𝑔2+] = 60
𝑚𝑔
𝐿
𝐶𝑎2+ + 2𝑁𝑎𝑂𝐻 → 𝐶𝑎(𝑂𝐻)2 + 2𝑁𝑎+ → (1)
𝑀𝑔2+ + 2𝑁𝑎𝑂𝐻 → 𝑀𝑔(𝑂𝐻)2 + 2𝑁𝑎+ → (2)
• 𝑁𝑎𝑂𝐻 required in reaction 1:
350𝑚𝑔 𝐶𝑎2+
𝐿×
1 𝑚𝑚𝑜𝑙 𝐶𝑎2+
40.078 𝑚𝑔 𝐶𝑎2+×
2 𝑚𝑚𝑜𝑙 𝑁𝑎𝑂𝐻
1 𝑚𝑚𝑜𝑙 𝐶𝑎2+= 17.5
𝑚𝑚𝑜𝑙
𝐿 𝑁𝑎𝑂𝐻
• 𝑁𝑎𝑂𝐻 required in reaction 2:
60𝑚𝑔 𝑀𝑔2+
𝐿×
1 𝑚𝑚𝑜𝑙 𝐶𝑎2+
24.305 𝑚𝑔 𝐶𝑎2+×
2 𝑚𝑚𝑜𝑙 𝑁𝑎𝑂𝐻
1 𝑚𝑚𝑜𝑙 𝐶𝑎2+= 5
𝑚𝑚𝑜𝑙
𝐿 𝑁𝑎𝑂𝐻
[𝑁𝑎𝑂𝐻] = 17.5 + 5 = 22.5𝑚𝑚𝑜𝑙
𝐿
Since the feed flow rate id 50 m3/hr
[𝑁𝑎𝑂𝐻] = 22.5𝑚𝑚𝑜𝑙
𝐿×
1000 𝐿
1 𝑚3× 50
𝑚3
ℎ𝑟= 1.125 × 10⁶
𝑚𝑚𝑜𝑙
ℎ𝑟= 1.125
𝑘𝑚𝑜𝑙
ℎ𝑟
�̇�𝑁𝑎𝑂𝐻 = 1.125𝑘𝑚𝑜𝑙
ℎ𝑟× 40
𝑘𝑔
𝑘𝑚𝑜𝑙= 45
𝑘𝑔
ℎ𝑟
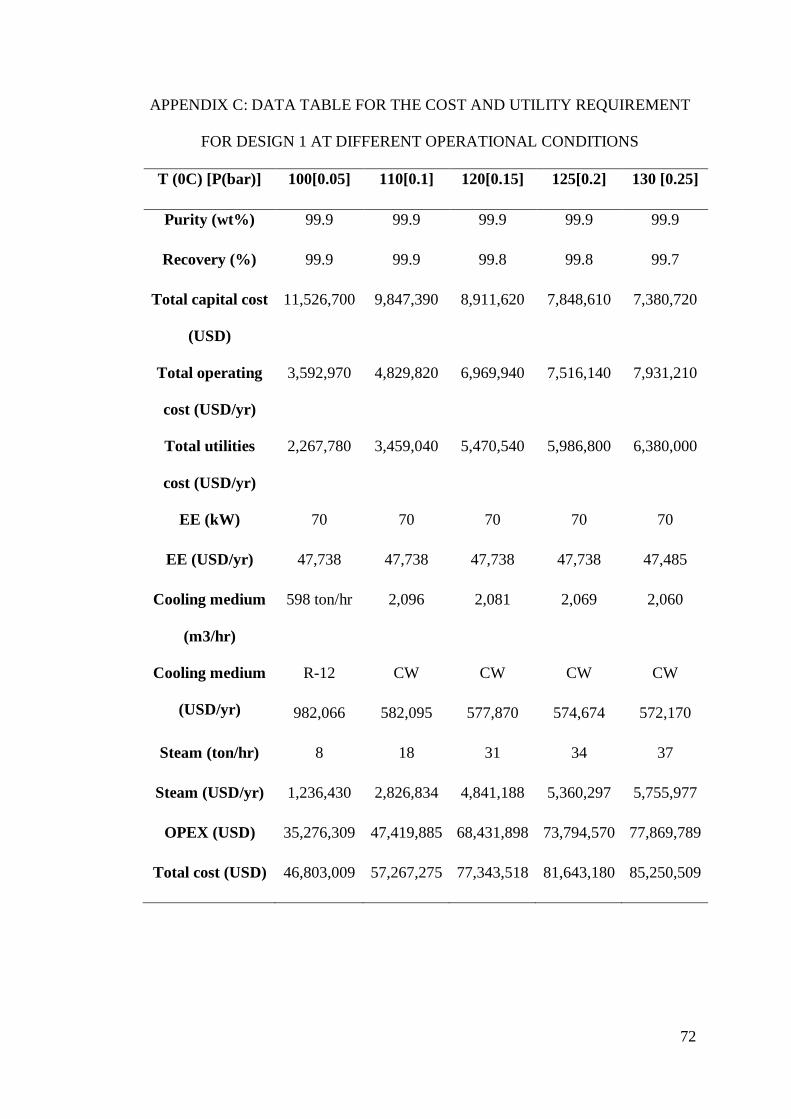
72
APPENDIX C: DATA TABLE FOR THE COST AND UTILITY REQUIREMENT
FOR DESIGN 1 AT DIFFERENT OPERATIONAL CONDITIONS
T (0C) [P(bar)] 100[0.05] 110[0.1] 120[0.15] 125[0.2] 130 [0.25]
Purity (wt%) 99.9 99.9 99.9 99.9 99.9
Recovery (%) 99.9 99.9 99.8 99.8 99.7
Total capital cost
(USD)
11,526,700 9,847,390 8,911,620 7,848,610 7,380,720
Total operating
cost (USD/yr)
3,592,970 4,829,820 6,969,940 7,516,140 7,931,210
Total utilities
cost (USD/yr)
2,267,780 3,459,040 5,470,540 5,986,800 6,380,000
EE (kW) 70 70 70 70 70
EE (USD/yr) 47,738 47,738 47,738 47,738 47,485
Cooling medium
(m3/hr)
598 ton/hr 2,096 2,081 2,069 2,060
Cooling medium
(USD/yr)
R-12 CW CW CW CW
982,066 582,095 577,870 574,674 572,170
Steam (ton/hr) 8 18 31 34 37
Steam (USD/yr) 1,236,430 2,826,834 4,841,188 5,360,297 5,755,977
OPEX (USD) 35,276,309 47,419,885 68,431,898 73,794,570 77,869,789
Total cost (USD) 46,803,009 57,267,275 77,343,518 81,643,180 85,250,509

73
APPENDIX D: CALCULATIONS FOR THE ANNUAL PURCHASE COST OF
MEG
Given:
• 𝑀𝐸𝐺 𝑐𝑜𝑛𝑐𝑒𝑛𝑡𝑟𝑎𝑡𝑖𝑜𝑛 𝑖𝑛 𝑡ℎ𝑒 𝑎𝑞𝑢𝑒𝑜𝑢𝑠 𝑝ℎ𝑎𝑠𝑒 (𝑣𝑜𝑙%) = 28%
• 𝐿𝑁𝐺 𝑝𝑟𝑜𝑑𝑢𝑐𝑡𝑖𝑜𝑛 = 7.8 × 10⁶ 𝑡𝑜𝑛
𝑦𝑟
• 𝑃𝑊 𝑓𝑙𝑜𝑤 = 60𝑚3
ℎ𝑟
• 𝑀𝐸𝐺 𝑝𝑢𝑟𝑖𝑡𝑦 = 100%
• 𝑀𝐸𝐺 𝑐𝑜𝑠𝑡 = 700𝑈𝑆𝐷
𝑡𝑜𝑛
𝑃𝑊 𝑓𝑙𝑜𝑤 = 60𝑚3
ℎ𝑟×
24 ℎ𝑟
1 𝑑𝑎𝑦×
365 𝑑𝑎𝑦
𝑦𝑟= 525,600
𝑚3
𝑦𝑟
𝐴𝑞𝑢𝑒𝑜𝑢𝑠 𝑝ℎ𝑎𝑠𝑒 𝑓𝑙𝑜𝑤 =525,600
𝑚3
𝑦𝑟
1 − 28%= 730,000
𝑚3
𝑦𝑟
𝑀𝐸𝐺 𝑓𝑙𝑜𝑤 = 28% × 730,000𝑚3
𝑦𝑟= 204,400
𝑚3
𝑦𝑟
𝐷𝑒𝑛𝑠𝑖𝑡𝑦 𝑜𝑓 𝑀𝐸𝐺 @ 25℃ = 1,110 𝑘𝑔/𝑚3
𝑀𝐸𝐺 𝑎𝑛𝑛𝑢𝑎𝑙 𝑐𝑜𝑛𝑠𝑢𝑚𝑝𝑡𝑖𝑜𝑛 = 204,400𝑚3
𝑦𝑟× 1,110
𝑘𝑔
𝑚3= 2.27 × 10⁸
𝑘𝑔
𝑦𝑟
𝑀𝐸𝐺 𝑎𝑛𝑛𝑢𝑎𝑙 𝑐𝑜𝑠𝑡 = 2.27 × 10⁸𝑘𝑔
𝑦𝑟×
1 𝑡𝑜𝑛
907.185 𝑘𝑔×
700 $
𝑡𝑜𝑛= 175 × 106 𝑈𝑆𝐷
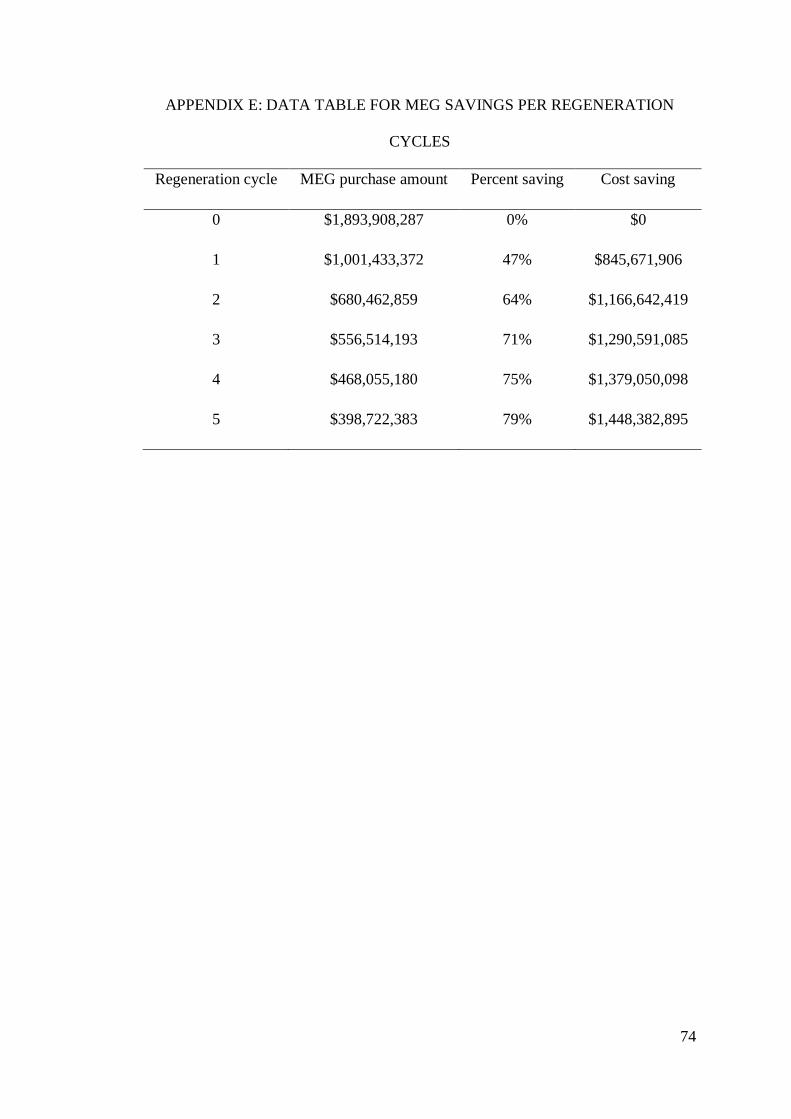
74
APPENDIX E: DATA TABLE FOR MEG SAVINGS PER REGENERATION
CYCLES
Regeneration cycle MEG purchase amount Percent saving Cost saving
0 $1,893,908,287 0% $0
1 $1,001,433,372 47% $845,671,906
2 $680,462,859 64% $1,166,642,419
3 $556,514,193 71% $1,290,591,085
4 $468,055,180 75% $1,379,050,098
5 $398,722,383 79% $1,448,382,895
75
APPENDIX F: PUBLISHED WORK FROM THE THESIS
• Conference presentation
The work produced in this thesis has been used as a contribution to the 8th Global
Conference on Global Warming (GCGW) held in Qatar, where two abstracts have been
submitted and accepted in the conference to be presented and published through high-
impact journals. The details for the two abstracts are as follows:
Abstract 1:
• Title: Design and simulation of mono-ethylene glycol (MEG) Recovery unit
• Authors: Asmaa Othman, Fares AlMomani, Majeda Khraisheh, Ahmed
AlNouss.
• Abstract:
The world has been relying recently on offshore oil and gas production which was
stated to represent 33% of the total production in 2014 and that might surge due to the
abundance of deep offshore fields and the exhaust of shallow water reservoirs. One
major concern in natural gas production is flow assurance that is associated with
ensuring the safe production and transportation of natural gas from production sites to
processing facilities. Being placed in cold deep-water at high pressures, the natural gas
within the transportation pipelines is likely to form gas hydrates due to the stimulating
surrounding conditions. Gas hydrates form when the water content of the gas freezes
and solidifies causing a plug in pipelines that stops the gas flow and the pressure builds
up leading to its rupture. Hydrate inhibitors are chemicals added to pipelines in order
to prevent the formation of gas hydrates during transport between offshore wells and
onshore processing sites. In Qatar, hydrate inhibitors are usually injected in natural gas
wells during the winter months between December and March. The present study was
conducted in order to design a mono-ethylene glycol (MEG) recovery unit in order to

76
extract and recover MEG from produced water to permit its reuse. This study was
carried out in a simulation basis using Aspen plus software with the support of the
economic evaluation tool add-in for the economic analysis. The process was designed
using Aspen plus environment using ELEC-NRTL as a property package, the recovery
of MEG was successfully achieved by the separation of MEG-water vapor mixture from
the salts present in produced water using vacuum followed by the vacuum distillation
of MEG-water vapor mixture in order to obtain lean MEG as a bottom product. It was
observed that a vacuum pressure of 0.05 – 0.4 bar provides a complete salt separation
from MEG. In addition, it was found that six stages are required in the distillation
column in order to obtain at least 99% MEG recovery and purity. Different scenarios
were implemented in order to see how the system responds to susceptible alterations to
the salts present in rich MEG stream. The scenarios were subjected to changes in the
quality of the salts and the incidence of salt precipitation. In overall, it was realized that
the main challenge in this process is the presence of dissolved salts and how to remove
that at earlier stages in order to avoid their deposition on the equipment that could lead
to their failure with time. One realization made is that there might be a risk of calcium
sulphate (CaSO4) precipitation in the feed that might require a pretreatment step for
this removal for the case of long-term operation.
Keywords: offshore oil, transportation of natural gas, Gas hydrates
Abstract 2:
• Title: Conceptual Process Design and Economic Analysis of MEG Recovery
System Based on sequential salt precipitation and vacuum distillation
• Authors: Asmaa Othman, Fares AlMomani, Majeda Khraisheh, Saad Ali
AlSobhi, Ahmed AlNouss.
• Abstract:

77
The recovery of monoethylene glycol (MEG) from aqueous streams via sequential salt
separation followed by the vacuum distillation is evaluated as an alternative technology
to conventional recovery methods. In this study, MRU is simulated in Aspen plus
environment using ELEC-NRTL convenient thermodynamic to accommodate the
presence of salts using the electrolyte wizard. Four different scenarios were considered
1- Monovalent and divalent salts without precipitation.
2- Monovalent salt alone without precipitation.
3- Monovalent and divalent salts with salt precipitation.
4- Monovalent ions only with salt precipitation.
The presence of monovalent salts only without divalent salts was studied in order to
determine how the process would react to that change. In addition, it is common for
divalent salts to be removed in an initial pretreatment vessel through pH adjustment
with sodium hydroxide or caustic soda in order to avoid the associated problems of
precipitation, scaling and equipment failure. Hence, it was necessary to simulate a case
with monovalent salts. The third and fourth scenario were simulated to see how the
process reacts in case salt precipitation occurs within MEG loops either when all salts
are present or when monovalent salts only are present. In overall, these scenarios were
implemented in order to analyze how the process performance, operating conditions,
and process economics could change for each case. In order to ensure the smooth
operation of the process, some important considerations were taken in the simulation.
The results show that sequential salt separation followed by the vacuum distillation
technology offers high energy savings, around 99% of MEG was recovered. Another
outcome from this study using the economic evaluation analysis tool in Aspen, the
CAPEX and OPEX estimated for the most industrial-imitating scenario were around
$11.5 MM and $35MM, respectively.

78
Keywords: Produced water, hydrate, CAPEX, OPEX
• Poster presentation
Another contribution was made from this work by a poster to be presented in The
Annual Research Forum & Exhibition 2019 held in Qatar University. A snapshot for
the poster is presented below.