qatar university college of engineering flexural …
TRANSCRIPT
QATAR UNIVERSITY
COLLEGE OF ENGINEERING
FLEXURAL BEHAVIOR OF BASALT FIBER REINFORCED CONCRETE BEAMS
WITH RECYCLED CONCRETE COARSE AGGREGATES
BY
OMAR RAAD NAJI ALJIDDA
A Thesis Submitted to the Faculty of
The College of Engineering
In Partial Fulfillment
of the Requirements
for the Degree of
Master of Science in Civil Engineering
January 2017
© 2017. Omar Raad Naji Aljidda. All Rights Reserved
ii
COMMITTEE PAGE
The members of the Committee approve the Thesis of Omar Raad Naji Aljidda defended
on 26/02/2017.
Dr. Wael Alnahhal
Thesis Supervisor
Dr. Usama Ebead
Committee Member
Dr. Mohammed Al-Ansari
Committee Member
Dr. Shahria Alam
Committee Member
Dr. Arslan Ayari
Committee Member
Approved:
Khalifa Al-Khalifa, Dean, College of Engineering

iii
ABSTRACT
Aljidda Omar, Masters: January: 2017, Masters of Science in Civil Engineering.
Title: Flexural Behavior of Basalt Fiber Reinforced Concrete Beams with Recycled
Concrete Coarse Aggregates.
Supervisor of Thesis: Dr. Wael Alnahhal
The State of Qatar has experienced tremendous economic development in the last
decades. As a result, massive quantities of building materials have been used to
accommodate the great pace in construction. However, Qatar suffers from the shortage of
natural resources needed for concrete production. Therefore, it is essential to investigate
the feasibility of reusing construction and demolition waste as aggregates to maintain the
concrete construction industry. Recycled concrete aggregate (RCA) has been produced in
Qatar since 2009 as a result of the extensive construction and demolition activities.
The purpose of this study is to study the effect of using RCA combined with a newly
developed basalt macro fibers (BMF) on the flexural behavior and ultimate capacity of
beams with different replacement ratios of RCA experimentally and analytically.
A total of 16 concrete beam specimens were flexural tested until failure. The parameters
investigated included the RCA replacement ratio (0%, 25%, 50%, and 100%) and the BMF
volume fraction (0%, 0.5%, 1% and 1.5%). The deflection, concrete compressive strain
and steel tensile strain at mid-span of the tested beams were measured and recorded. The
testing results of the specimens were compared to the control beam specimen with natural
aggregate (Gabbro), without BMF. In addition, a critical comparison study was carried out
between the experimental findings of this research and the analytical formulations based
on the existing code-based analytical models. The test results showed an improvement in
the flexural capacity of the beam specimens with the addition of BMF, while there are no
remarkable effects of RCA on flexural strength of the tested beams. Test results clearly
showed that both RCA and BMF in Qatar can be used as sustainable and eco-friendly
alternative materials in concrete structures.
iv
ACKNOWLEDGMENTS
I am sincerely grateful to all who supported me in completing this project
effectively and on time. I put forward my profound appreciation to my thesis supervisor,
Dr. Wael Alnahhal for his counseling and advice throughout the study. Dr. Alnahhal has
always been a source of inspiration for me. The way of his thinking and very well decision-
making at critical situations have really been a good support for me. I thank him again for
all the assistance and technical support he has provided for me, never at all failing me at
any stage.
It is also an honor and privilege to have Dr. Usama Ebead and Dr. Mohammed Al-Ansari
serving on my Master thesis committee. For all pieces of advice and insightful suggestions
and directions received from them, they are highly appreciated. My gratitude also goes to
Dr. Shahria Alam of the University of British Columbia, for serving as the outside reader.
His thorough review and insightful comments are very much appreciated.
This work was funded by Qatar University; their financial support through the internal
research grant QUUS-CENG-SPR14/15-21 is greatly appreciated and acknowledged. I
am grateful to the Construction Materials Co L.L.C. (Qatar Quarry Company-
Lafarge Middle East) for providing the RCA. In particular, special thanks are due to Mr.
Salim Kutty who was very supportive of the research work. In addition, the support
provided by ReforceTech, AS (Norway) is gratefully acknowledged.
Any words would not be enough to express my gratitude to my dearest parents, whose
continued encouragement, constant prayers and unlimited supported to me have never
refrained throughout my life. Whatever I am and whatever I shall be, I owe it all to them.
v
TABLE OF CONTENTS
ACKNOWLEDGMENTS ................................................................................................ IV
LIST OF FIGURES .......................................................................................................... IX
LIST OF TABLES ......................................................................................................... XIV
NOMENCLATURE ........................................................................................................ XV
SYMBOLS ..................................................................................................................... XVI
CHAPTER 1 ....................................................................................................................... 1
1.1 RESEARCH SIGNIFICANCE ........................................................................................... 4
1.2 RESEARCH OBJECTIVES .............................................................................................. 5
1.3 THESIS ORGANIZATION............................................................................................... 6
CHAPTER 2 ....................................................................................................................... 7
2.1 RECYCLED CONCRETE AGGREGATES (RCA) ................................................................ 7
2.2 BASALT MACRO FIBER (BMF) .................................................................................. 11
CHAPTER 3 ..................................................................................................................... 15
3.1 MATERIALS CHARACTERIZATION .............................................................................. 15
3.1.1 Recycled Concrete Aggregates (RCA) and Natural Coarse Aggregates (NCA)
................................................................................................................................... 15
3.1.1.1 Specific Gravity .................................................................................................... 15
3.1.1.2 Water Absorption ................................................................................................. 16
3.1.1.3 L.A. Abrasion Test ............................................................................................... 17
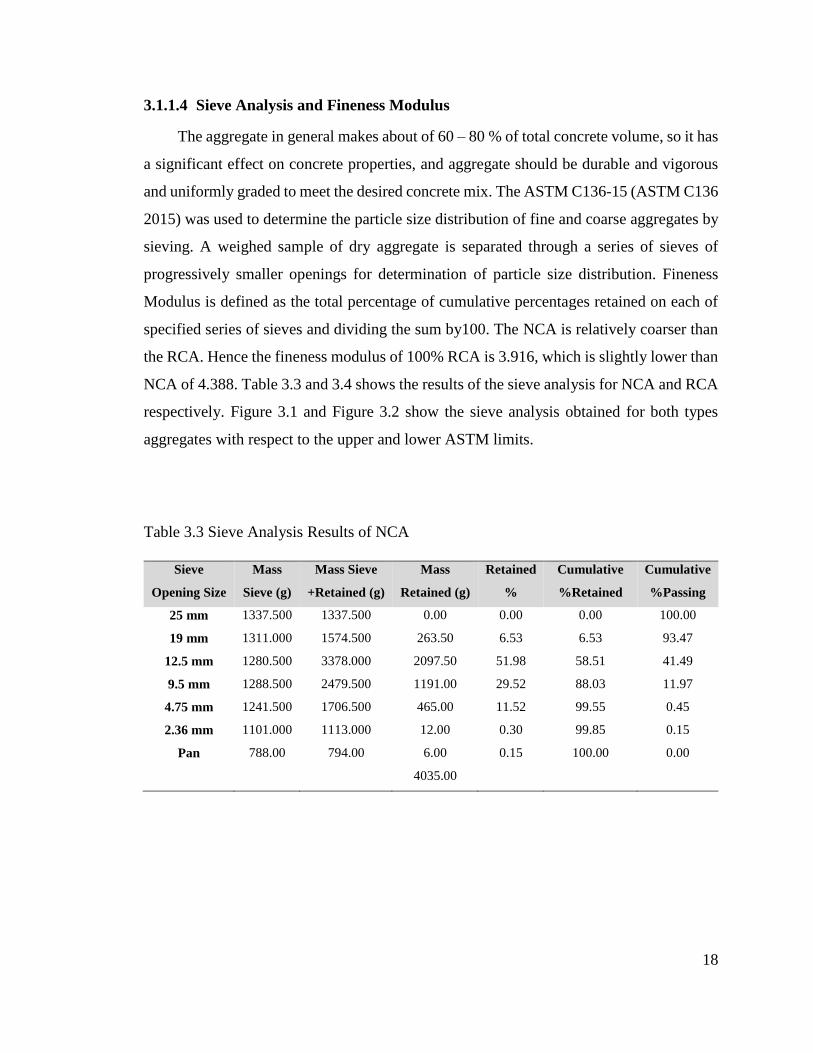
3.1.1.4 Sieve Analysis and Fineness Modulus ................................................................. 18
3.1.2 Fine Aggregates ............................................................................................... 20
3.1.3 Cement ............................................................................................................. 20
3.1.4 Water ................................................................................................................ 20
3.1.5 Basalt Macro Fiber (BMF) .............................................................................. 21
3.1.6 Steel Reinforcement Properties........................................................................ 22
vi
3.2 TEST MATRIX ............................................................................................................ 23
3.3 CONCRETE MIX DESIGN ............................................................................................. 24
3.4 FABRICATION OF RC BEAMS ..................................................................................... 25
3.4.1 Grinding of The Steel Rebar Surface ............................................................... 25
3.4.2 Steel Fabrication and Formwork ..................................................................... 26
3.4.3 Installation of Strain Gauges ........................................................................... 29
3.5 MATERIALS AND MIXTURE PREPARATION ................................................................. 29
3.6 CASTING OF TEST SPECIMENS .................................................................................... 32
3.6.1 Curing of Test Specimens................................................................................. 34
3.6.2 Transportation of Test Specimens .................................................................... 35
3.7 COMPRESSIVE STRENGTH .......................................................................................... 35
3.8 FLEXURAL TENSILE STRENGTH (MODULUS OF RAPTURE) .......................................... 36
3.9 BEAM TESTING SET-UP ............................................................................................. 37
CHAPTER 4 ..................................................................................................................... 41
4.1 INTRODUCTION ......................................................................................................... 41
4.2 PROPERTIES OF HARDENED CONCRETE ..................................................................... 42
4.2.1 Flexural Tensile Strength (Modulus of Rapture) Testing Results .................... 42
4.2.1.1 Effect of Volume Fraction of BMF ...................................................................... 43
4.2.1.2 Effect of RCA ....................................................................................................... 45
4.2.2 Compressive Strength Testing Results ............................................................. 47
4.2.2.1 Effect of Volume Fraction of BMF ...................................................................... 49
4.2.2.2 Effect of RCA ....................................................................................................... 50
4.3 LARGE SCALE BEAM TESTING RESULTS ..................................................................... 52
4.3.1 Introduction...................................................................................................... 52
4.3.2 Specimen A1 (0%RCA+0%BMF) .................................................................... 52
4.3.3 Specimen A2 (25%RCA+0%BMF) .................................................................. 55
4.3.4 Specimen A3 (50%RCA+0%BMF) .................................................................. 58
4.3.5 Specimen A4 (100%RCA+0%BMF) ................................................................ 61
4.3.6 Specimen A5 (0%RCA+0.5%BMF) ................................................................. 64
4.3.7 Specimen A6 (25%RCA+0.5%BMF) ............................................................... 67
4.3.8 Specimen A7 (50%RCA+0.5%BMF) ............................................................... 70

vii
4.3.9 Specimen A8 (100%RCA+0.5%BMF) ............................................................. 73
4.3.10 Specimen A9 (0%RCA+1.0%BMF) ............................................................... 76
4.3.11 Specimen A10 (25%RCA+1.0%BMF) ........................................................... 79
4.3.12 Specimen A11 (50%RCA+1.0%BMF) ........................................................... 82
4.3.13 Specimen A12 (100%RCA+1.0%BMF) ......................................................... 85
4.3.14 Specimen A14 (25%RCA+1.5%BMF) ........................................................... 88
4.3.15 Specimen A15 (50%RCA+1.5%BMF) ........................................................... 91
4.3.16 Specimen A16 (100%RCA+1.5%BMF) ......................................................... 94
4.4 DISCUSSION OF TEST RESULTS .................................................................................. 97
4.4.1 Effect of Fiber Volume Fraction Ratio ............................................................ 98
4.4.1.1 Specimens A1, A5 and A9 ................................................................................... 98
Failure Mode and Load vs. Deflection ............................................................................. 98
Crack Pattern .................................................................................................................. 100
Strain in Concrete ........................................................................................................... 101
Ductility Index (DI) ........................................................................................................ 102
4.4.1.2 Specimens A2, A6, A10 and A14 ...................................................................... 103
Failure Mode and Load vs. Deflection ........................................................................... 103
Crack Pattern .................................................................................................................. 104
Strain in Concrete ........................................................................................................... 106
Ductility Index (DI) ........................................................................................................ 107
Tensile Strain in Main Steel Reinforcement .................................................................. 108
4.4.1.3 Specimens A3, A7, A11 and A15 ...................................................................... 109
Failure Mode and Load vs. Deflection ........................................................................... 109
Crack Pattern .................................................................................................................. 110
Strain in Concrete ........................................................................................................... 112
Ductility Index (DI) ........................................................................................................ 113
4.4.1.4 Specimens A4, A8, A12 and A16 ...................................................................... 114
Failure Mode and Load vs. Deflection ........................................................................... 114
Crack Pattern .................................................................................................................. 115
Strain in Concrete ........................................................................................................... 117
Ductility Index (DI) ........................................................................................................ 118
4.4.2 Effect of Aggregate Replacement Ratio of the RCA....................................... 119
4.4.2.1 Specimens A1, A2, A3, and A4 ......................................................................... 119
viii
Failure Mode and Load vs. Deflection ........................................................................... 119
Crack Pattern .................................................................................................................. 120
Strain in Concrete ........................................................................................................... 122
Tensile Strain in Main Steel Reinforcement .................................................................. 123
Ductility Index (DI) ........................................................................................................ 124
4.4.2.2 Specimens A5, A6, A7, and A8 ......................................................................... 125
Failure Mode and Load vs. Deflection ........................................................................... 125
Crack Pattern .................................................................................................................. 126
Strain in Concrete ........................................................................................................... 128
Ductility Index (DI) ........................................................................................................ 129
4.4.2.3 Specimens A9, A10, A11, and A12 ................................................................... 130
Failure Mode and Load vs. Deflection ........................................................................... 130
Crack Pattern .................................................................................................................. 131
Strain in Concrete ........................................................................................................... 133
Ductility Index (DI) ........................................................................................................ 134
4.4.2.4 Specimens A14, A15, and A16 .......................................................................... 134
Failure Mode and Load vs. Deflection ........................................................................... 134
Crack Pattern .................................................................................................................. 136
Strain in Concrete ........................................................................................................... 137
Ductility Index (DI) ........................................................................................................ 138
CHAPTER 5 ................................................................................................................... 139
5.1 FLEXURAL CALCULATIONS .......................................................................... 140
5.1.1 Prediction of the Cracking Moment (Mcr) ..................................................... 140
5.1.2 Prediction of the ultimate moment (Mu)......................................................... 142
5.2 ANALYTICAL MODELS FOR DEFLECTION CALCULATION .......................................... 144
CHAPTER 6 ................................................................................................................... 152
6.1 SUMMARY .............................................................................................................. 152
6.2 CONCLUSION .......................................................................................................... 152
6.3 RECOMMENDATIONS............................................................................................... 154
6.4 FUTURE WORK ....................................................................................................... 154
REFERENCES ............................................................................................................... 156
ix
LIST OF FIGURES
Figure 3.1 Sieve Analysis for NCA .................................................................................. 19
Figure 3.2 Sieve Analysis for RCA .................................................................................. 20
Figure 3.3 Basalt Macro Fiber (BMF) .............................................................................. 21
Figure 3.4 Grinded Steel Bars ........................................................................................... 26
Figure 3.5 Reinforcement Details and Cross Section (Dimensions are in mm) ............... 27
Figure 3.6 Steel Cages ...................................................................................................... 27
Figure 3.7 Stirrups Distribution ........................................................................................ 28
Figure 3.8 Framework and Steel Cage with Cover Spacer ............................................... 28
Figure 3.9 Fixing of Steel Strain Gauges .......................................................................... 29
Figure 3.10 Moisturizing the Aggregates in Water Tanks ................................................ 30
Figure 3.11 Drying the Aggregates to Achieve the SSD Condition ................................. 30
Figure 3.12 Mixing Water with Admixture ...................................................................... 31
Figure 3.13 Adding BMF Inside the Concrete Mechanical Mixer ................................... 31
Figure 3.14 Coded Beam Ready for Casting .................................................................... 33
Figure 3.15 Casting of the Concrete Beams ..................................................................... 33
Figure 3.16 Curing of Beam Specimens ........................................................................... 34
Figure 3.17 Curing of Concrete Cylinders and Prisms ..................................................... 34
Figure 3.18 Compressive Strength Test Setup .................................................................. 36
Figure 3.19 Tensile Strength Test Setup ........................................................................... 37
Figure 3.20 Detail of loading pattern (Dimensions are in mm) ........................................ 38
Figure 3.21 Beam test setup and measuring sensors (Dimensions are in mm) ................. 38
Figure 3.22 Left and Right Side Linear Variable Deflection Transducers (LVDT) ......... 39
Figure 3.23 Concrete Strain Gauge (Top Side) ................................................................ 39
Figure 3.24 Data logger (TML Data Logger Multi-Channel Digital Strain meter DRA-
30A) .......................................................................................................................... 40
Figure 3.25 Instron 1500HDX Static Hydraulic Universal Testing machine with the
deflection transducers and data acquisition system .................................................. 40
Figure 4.1 Failure Mode of Typical Concrete Prism ........................................................ 42
Figure 4.2 Flexural Tensile Strength Test Results for Different RCA Replacement Ratios
................................................................................................................................... 45
x
Figure 4.3 Flexural Tensile Strength Test Results for Different Fiber Volume Fraction
Ratios ........................................................................................................................ 47
Figure 4.4 Failure Mode of Typical Cylinder Specimen .................................................. 48
Figure 4.5 Compressive Strength Test Results for Different RCA Replacement Ratios . 50
Figure 4.6 Compressive Strength Test Results for Different Fiber Volume Fraction Ratios
................................................................................................................................... 51
Figure 4.7 Cracking Pattern of Beam A1.......................................................................... 53
Figure 4.8 Test Results for Beam A1. a) Load vs. Deflection, b) Load vs. Concrete Strain
................................................................................................................................... 54
Figure 4.9 Deformed Shapes at Different Load Levels at the Bottom Surface ................ 55
Figure 4.10 Cracking Pattern of Beam A2 ........................................................................ 56
Figure 4.11 Test Results for Beam A2. a) Load vs. Deflection, b) Load vs. Concrete
Strain ......................................................................................................................... 57
Figure 4.12 Deformed Shapes at Different Load Levels at the Bottom Surface .............. 58
Figure 4.13 Cracking Pattern of Beam A3 ........................................................................ 59
Figure 4.14 Test Results for Beam A3. a) Load vs. Deflection, b) Load vs. Concrete
Strain, ........................................................................................................................ 60
Figure 4.15 Deformed Shapes at Different Load Levels at the Bottom Surface .............. 61
Figure 4.16 Cracking Pattern of Beam A4 ........................................................................ 62
Figure 4.17 Test Results for Beam A4. a) Load vs. Deflection, b) Load vs. Concrete
Strain ......................................................................................................................... 63
Figure 4.18 Deformed Shapes at Different Load Levels at The Bottom Surface ............. 64
Figure 4.19 Cracking Pattern of Beam A5 ........................................................................ 65
Figure 4.20 Test Results for Beam A5. a) Load vs. Deflection, b) Load vs. Concrete
Strain ......................................................................................................................... 66
Figure 4.21 Deformed Shapes at Different Load Levels at the Bottom Surface .............. 67
Figure 4.22 Cracking Pattern of Beam A6 ........................................................................ 68
Figure 4.23 Test Results for Beam A6. a) Load vs. Deflection, b) Load vs. Concrete
Strain ......................................................................................................................... 69
Figure 4.24 Deformed Shapes at Different Load Levels at the Bottom Surface .............. 70
Figure 4.25 Cracking Pattern of Beam A7 ........................................................................ 71
xi
Figure 4.26 Test Results for Beam A7. a) Load vs. Deflection, b) Load vs. Concrete
Strain, ........................................................................................................................ 72
Figure 4.27 Deformed Shapes at Different Load Levels at the Bottom Surface .............. 73
Figure 4.28 Cracking Pattern of Beam A8 ........................................................................ 74
Figure 4.29 Test Results for Beam A8. a) Load vs. Deflection, b) Load vs. Concrete
Strain ......................................................................................................................... 75
Figure 4.30 Deformed Shapes at Different Load Levels at the Bottom Surface .............. 76
Figure 4.31 Cracking Pattern of Beam A9 ........................................................................ 77
Figure 4.32 Test Results for Beam A9. a) Load vs. Deflection, b) Load vs. Concrete
Strain ......................................................................................................................... 78
Figure 4.33 Deformed Shapes at Different Load Levels at the Bottom Surface .............. 79
Figure 4.34 Cracking Pattern of Beam A10 ...................................................................... 80
Figure 4.35 Test Results for Beam A10. a) Load vs. Deflection, b) Load vs. Concrete
Strain ......................................................................................................................... 81
Figure 4.36 Deformed Shapes at Different Load Levels at the Bottom Surface .............. 82
Figure 4.37 Cracking Pattern of Beam A11 ...................................................................... 83
Figure 4.38 Test Results for Beam A11. a) Load vs. Deflection, b) Load vs. Concrete
Strain ......................................................................................................................... 84
Figure 4.39 Deformed Shapes at Different Load Levels at the Bottom Surface .............. 85
Figure 4.40 Cracking Pattern of Beam A12 ...................................................................... 86
Figure 4.41 Test Results for Beam A12. a) Load vs. Deflection, b) Load vs. Concrete
Strain ......................................................................................................................... 87
Figure 4.42 Deformed Shapes at Different Load Levels at the Bottom Surface .............. 88
Figure 4.43 Cracking Pattern of Beam A14 ...................................................................... 89
Figure 4.44 Test Results for Beam A14. a) Load vs. Deflection, b) Load vs. Concrete
Strain ......................................................................................................................... 90
Figure 4.45 Deformed Shapes at Different Load Levels at the Bottom Surface .............. 91
Figure 4.46 Cracking Pattern of Beam A15 ...................................................................... 92
Figure 4.47 Test Results for Beam A15. a) Load vs. Deflection, b) Load vs. Concrete
Strain ......................................................................................................................... 93
Figure 4.48 Deformed Shapes at Different Load Levels at the Bottom Surface .............. 94
xii
Figure 4.49 Cracking Pattern of Beam A16 ...................................................................... 95
Figure 4.50 Test Results for Beam A16. a) Load vs. Deflection, b) Load vs. Concrete
Strain ......................................................................................................................... 96
Figure 4.51 Deformed Shapes at Different Load Levels at the Bottom Surface .............. 97
Figure 4.52 Load vs. Deflection for Specimens A1, A5 and A9 ...................................... 99
Figure 4.53 Crack Pattern in Test Beams A1, A5 and A9 .............................................. 100
Figure 4.54 Concrete strain for test beams A1, A5 and A9 ............................................ 102
Figure 4.55 Ductility Index vs. Volume Fraction of Fiber for Beams A1, A5 and A9 .. 103
Figure 4.56 Load vs. Deflection for Specimens A2, A6, A10 and A14 ......................... 104
Figure 4.57 Crack Pattern in Test Beams A2, A6, A10 and A14 ................................... 105
Figure 4.58 Concrete strain for test beams A2, A6, A10 and A14 ................................. 107
Figure 4.59 Ductility Index vs. Volume Fraction of Fiber for Beams A2, A6, A10 and
A14 .......................................................................................................................... 108
Figure 4.60 Steel Strain for test beams A2, A6, A10 and A14 ....................................... 109
Figure 4.61 Load vs. Deflection for Specimens A3, A7, A11 and A15 ......................... 110
Figure 4.62 Crack Pattern in Test Beams A3, A7, A11 and A15 ................................... 111
Figure 4.63 Concrete strain for test beams A3, A7, A11 and A15 ................................. 113
Figure 4.64 Ductility Index vs. Volume Fraction of Fiber for Beams A3, A7, A11and
A15 .......................................................................................................................... 114
Figure 4.65 Load Vs. Deflection for Specimens A4, A9, A12 and A16 ........................ 115
Figure 4.66 Crack Pattern in Test Beams A4, A9, A12 and A16 ................................... 116
Figure 4.67 Concrete strain for test beams A4, A9, A12 and A16 ................................. 118
Figure 4.68 Ductility Index vs. Volume Fraction of Fiber for Beams A4, A8, A12and
A16 .......................................................................................................................... 119
Figure 4.69 Load Vs. Deflection for Specimens A1, A2, A3 and A4 ............................ 120
Figure 4.70 Crack Pattern in Test Beams A1, A2, A3 and A4 ....................................... 121
Figure 4.71 Concrete strain for test beams A1, A2, A3 and A4 ..................................... 122
Figure 4.72 Steel Strain for test beams A1, A2, A3 and A4 ........................................... 123
Figure 4.73 Ductility Index vs. Replacement Ratio of RCA for Specimens A1, A2, A3
and A4 ..................................................................................................................... 124
Figure 4.74 Load Vs. Deflection for Specimens A5, A6, A7 and A8 ............................ 126
xiii
Figure 4.75 Crack Pattern in Test Beams A5, A6, A7 and A8 ....................................... 127
Figure 4.76 Concrete strain for test beams A5, A6, A7 and A8 ..................................... 128
Figure 4.77 Ductility Index vs. Replacement Ratio of RCA for Specimens A5, A6, A7
and A8 ..................................................................................................................... 129
Figure 4.78 Load Vs. Deflection for Specimens A9, A10, A11 and A12 ...................... 131
Figure 4.79 Crack Pattern in Test Beams A9, A10, A11 and A12 ................................. 132
Figure 4.80 Concrete strain for test beams A9, A10, A11 and A12 ............................... 133
Figure 4.81 Ductility Index vs. Replacement Ratio of RCA for Specimens A9, A10, A11
and A12 ................................................................................................................... 134
Figure 4.82 Load Vs. Deflection for Specimens A14, A15 and A16 ............................. 135
Figure 4.83 Crack Pattern in Test Beams A14, A15 and A16 ........................................ 136
Figure 4.84 Concrete strain for test beams A14, A15 and A16 ...................................... 137
Figure 4.85 Ductility Index vs. Replacement Ratio of RCA for Specimens A14, A15 and
A16 .......................................................................................................................... 138
Figure 5.1Stress and Strain for RC beam with BMF ...................................................... 142
Figure 5.2 The simply-supported beam subjected to two equal concentrated loads
symmetrically placed about the beam centerline .................................................... 144
Figure 5.3 Comparison of Predicted and Experimental Deflection ................................ 150
xiv
LIST OF TABLES
Table 3.1 Specific Gravity and Absorption ratio of NCA and RCA ................................ 16
Table 3.2 Abrasion Resistance Results of NCA and RCA ............................................... 17
Table 3.3 Sieve Analysis Results of NCA ........................................................................ 18
Table 3.4 Sieve Analysis Results of RCA ........................................................................ 19
Table 3.5 Characterization of Basalt Macro Fiber (BMF) ................................................ 22
Table 3.6 Properties of Steel Reinforcement .................................................................... 22
Table 3.7 Test Matrix for Beam Samples ......................................................................... 23
Table 3.8 Concrete Mixture Proportions .......................................................................... 25
Table 4.1 Average Flexural Tensile Strength of Concrete Prisms.................................... 43
Table 4.2 Average Compressive Strength Test Results .................................................... 48
Table 4.3 Summary of Tests Results ................................................................................ 98
Table 4.4 Summary of Number of Cracks ...................................................................... 101
Table 4.5 Summary of Number of Cracks ...................................................................... 106
Table 4.6 Summary of Number of Cracks ...................................................................... 112
Table 4.7 Summary of Number of Cracks ...................................................................... 117
Table 4.8 Summary of Number of Cracks ...................................................................... 122
Table 4.9 Summary of Number of Cracks ...................................................................... 127
Table 4.10 Summary of Number of Cracks .................................................................... 132
Table 4.11Summary of Number of Cracks ..................................................................... 137
Table 5.1 Theoretical and Experimental cracking moments .......................................... 141
Table 5.2 Theoretical and Experimental Ultimate Flexural Moments ........................... 143
Table 5.3 Theoretical and Experimental Mid-Span Deflection of the Tested Beams .... 146

xv
NOMENCLATURE
Abbreviations
RCA Recycled Concrete Aggregates
NCA Natural Coarse Aggregates
LVDT Liner Variable Differential Transducer
RC Reinforced Concrete
BMF Basalt Macro Fiber
CC Conventional Concrete
W/C Water to Cement ratio
SCC Self Compacted Concrete
ITZ Interfacial Transition Zone
LVDT Liner Variable Differential Transducers
FRP Fiber Reinforced Polymer
BFRP Basalt Fiber Reinforced Polymer
FRC Fiber Reinforced Concrete
SFRP Steel Fiber Reinforced Concrete
SF Silica Fume
GGBFS Ground Granulated Blast Furnace Slag
xvi
Symbols
Ie Moment of inertia of gross section
Icr Moment of inertia of the cracked transformed section
Pu Ultimate load
A Mass of Oven Dray Test Sample
B Mass of Saturated Surface Dry Test Sample
Y Final mass of test sample
P Total concentrated load
DI Ductility index
∆I Instantaneous deflection
fr Modulus of rapture
f’c Compressive strength
b Width of beam
h Height of beam
d Effective depth of beam
L Span of beam
a Depth of compressive stress block
x Distance from compression surface to the beam to the natural axis
n Modular ratio
yt Centroidal axis for uncracked section
As Area of steel bar
Af Area of BMF in tensile zone
Af’ Area of BMF in compression zone
fy Yield strength of steel
σt Tensile stress in fibrous concrete
e Distance from extreme compressive fiber to top of tensile stress block
ϵf Tensile strain of fiber
c Distance from extreme compression fiber to natural axis
Vf Volume fraction of BMF
Fbe Bond efficiency of BMF
xvii
Ƞl Length efficiency factor of BMF
Ƞ0 Orientation factor before cracking of the composite material
Ƞ’0 Orientation factor after cracking of the composite material
Ec Modulus of elasticity of concrete
Ef Modulus of elasticity of BMF
Ecf Modulus of elasticity of concrete with BMF
Ma Applied moment
Mcr Cracking moment
Mu Ultimate moment
1
CHAPTER 1
INTRODUCTION
The State of Qatar has experienced tremendous economic development during the
last decades. Thus, massive quantities of building materials have been used to
accommodate the great pace in construction. Qatar is anticipated to spend USD 17 billion
on its infrastructure as part of its preparation to host the Soccer World Cup in 2022. Most
of these expenses will go towards the construction of new hotels, stadiums, facilities, and
tourism attractions (Qatar 2022).Major projects such as the stadiums for the World Cup
2022, Doha Metro, an international harbor and huge real-estate projects, have nominated
Qatar as the fastest growing construction market within the Gulf Cooperation Council
(GCC). Concrete is the main material used in construction in Qatar and in most of the Gulf
Cooperation Council (GCC) countries. However, most of these countries suffer from the
shortage of natural resources required for concrete production. For example, the quantities
of imported aggregates in the State of Qatar have increased from 9.5 million tons in 2006
to 21.5 million tons in 2008 (Qatar Customs 2010). Therefore, it is essential to investigate
the feasibility of using recycled materials in concrete production.
Several types of recyclable materials are currently used in concrete. One of the potential
resources of recycled concrete is the construction and demolition waste. Construction and
demolition waste is one of the largest and most massive waste streams produced in the
State of Qatar. The GCC countries produce about 120 million tons per year of waste
(Emmanuelle Landais 2008).Recycled concrete aggregate (RCA) has been produced in
Qatar since 2009 as a result of the extensive construction and demolition activities (Al-
Ansary & Iyengar 2013).Little data is available on the quantity or scale of the construction
and demolition wastes in Qatar. Nevertheless, construction and demolition wastes have
been generated from various extensive construction activities undertaken all over the State
of Qatar since early 2000 to date. The use of RCA in concrete applications has major
economic and environmental benefits to Qatar. RCA can partially replace the relatively
expensive imported Gabbro aggregates commonly used in Qatar, thus saving on the total
2
cost of the concrete projects. Gabbro is a natural coarse aggregate, which is unavailable in
Qatar but imported from the United Arab Emirates. Several economic and environmental
advantages are connected with using RCA. Recycling construction and demolition waste
will have a significant environmental impact due to the reduction in demand of virgin
aggregates. Moreover, using waste materials would partially solve a significant
environmental concern about land-filling the large quantities of waste construction
materials produced every year. In addition, using recycled aggregates can reduce the
carbon footprint of a building. Moreover, the unit cost of RCA is less than natural aggregate
resulting from a significant reduction in material prices.
Recycled aggregates can be crushed into several forms and dimensions. Recycled
aggregates can be used as fine and coarse aggregates in concrete. However, RCA have
different properties and characteristics from natural coarse aggregates (NCA). As a result,
the hardened and fresh concrete properties can vary considerably, depending on the type
of coarse aggregate that used. However, reinforced concrete (RC) structures using RCA
exhibit high deflections and large crack widths due to the weaker interfacial transition zone
(ITZ) between RCA and new cement mortar. Previous investigations have shown that using
discrete steel fibers in concrete increases its ductility and reduces the crack width due to
the large compressive strains exhibited at failure (Holschemacher et al. 2010) (Mohammadi
et al. 2009) and (Katzer & Domski 2012).The fibers can act as a bridge between the two
adjacent cracked sections of the concrete, which will reduce the crack width. Though, the
main disadvantage of using steel fibers is corrosion, especially in the harsh environment
that characterizes the Gulf area. Research studies, carried out on the effect of using discrete
fibers on the structural performance of concrete structures reinforced with FRP are limited
(Urbanski et al. 2013), not to mention the use of basalt macro fibers (BMF), which could
be attributed to their recent presence in the construction field.
Basalt fiber is a natural material that is found in volcanic basalt rocks formed in a melting
temperature comprised between 1500 to 1700 C. Basalt fiber products are available around
the world in various forms such as bars, mesh, spirals, fabric and chopped. Basalt fibers
are environmentally safe, non-toxic, resisting high temperatures, strength, and durable.
Researchers show the advantages of the use of BMF in concrete elements; basalt fiber will

3
modify the cracking mechanism, increases flexural tensile strength and average residual
strength, reduce the crack width and high tensile strength and bond with concrete.(Sudeep
Adhikari 2013),(Anil et al. 2013) and (Banibayat & Patnaik 2014).
For all construction material, stiffness and strength are of greatest importance in most of
structural applications. Depending upon the purpose of the structure, there is always a need
for reciprocal trade-off between these two parameters. Composite materials such as fiber
reinforced concrete, both concrete and BMF were introduced to serve that specific purpose.
BMF contributes to the improvement of the toughness characteristics of normal concrete.
Toughness of a material is the physical measure of the energy that is required to deform
the material to a particular strain.
Basalt macro fiber is a non-corrosive structural macro fiber, made from basalt fiber
reinforced polymer (BFRP) bars. The method for manufacturing BMF is a simplified
automated method called wet-ley up process, which is the same method of the manufacture
of BFRP bar. BMF possesses higher tensile strength and stiffness compared to other
standard synthetic fibers and at the meantime it is non-corrosive (Sudeep Adhikari 2013).
BMF acts as the proactive reinforcement that provides the immediate tensile load, carrying
capacity when micro cracks develop in concrete. Numerous applied applications have been
successfully demonstrated in Europe, showing the functional and economic benefits of
FRC with BMF for constructing façade walls, pontoons and inner walls (Banibayat &
Patnaik 2014). The crack width of plain concrete is higher than the crack width of
polypropylene fiber concrete, which is also higher than the crack width for MRC (Bajaj
2012). In addition, BMF has a higher density closet to concrete than the density of synthetic
or steel fiber (Anil et al. 2013). This gives minibar an advantage over other fibers during
mixing of concrete.
4
1.1 RESEARCH SIGNIFICANCE
Having in mind that the state of Qatar suffers from the shortage of natural resources
needed for concrete production, it is imperative for the country to investigate the feasibility
of reusing construction and demolition waste as aggregates to maintain the concrete
construction industry. The use of RCA in concrete applications has major economic and
environmental benefits to Qatar. RCA can partially replace the relatively expensive
imported Gabbro aggregates commonly used in Qatar, thus saving on the total cost of the
concrete projects. Recycling construction and demolition waste will also have a significant
environmental impact, due to the reduction in demand of virgin aggregates. Moreover,
using waste materials would partially solve a significant environmental concern about land-
filling the large quantities of waste construction materials produced every year. This will
lead also to a drop in the carbon emissions from concrete structures. Thus, this research
effort is aligned with Qatar National Vision 2030 to promote environmental related
research as a top priority in Qatar.
In addition, most of the construction work in Qatar is built from RC structures. Therefore,
they are vulnerable to damage from environmental factors. Corrosion, in particular, has led
to the premature deterioration of RC structures. As a result, it may instead be beneficial to
seek alternative materials and construction practices. With recent advances in the
development of high-performance composite materials and the escalation of the cost of
conventional materials, the time may now be right for the development of new alternative
construction materials such as basalt macro fiber in combination with concrete is a possible
solution to enhance the structural performance of concrete structures made with RCA. The
test results shed light on the feasibility of using BMF to enhance the flexural performance
of concrete beams made with RCA. It also provides researchers and practicing engineers
with better understanding of the ultimate capacity and the failure mechanisms of the FRC
beams made with RCA. The success of the project will have a significant influence on the
use of fiber reinforced concrete in the gulf area, especially in Qatar, where harsh
environment is dominating. In this aspect, the implementation of anti-corrosive basalt
fibers in the structural field will overcome the corrosion problem usually associated with
steel reinforcement/fibers.

5
To the best of the authors’ knowledge, this research on the behavior of FRC beams with
RCA produced in Qatar will be the first conducted in the GCC region. The test results shed
light on the feasibility of using sustainable FRC structures made from recycled materials
produced in Qatar. It also provides researchers and practicing engineers with better
understanding of the ultimate capacity and the serviceability performance of the FRC
beams made with RCA.
1.2 RESEARCH OBJECTIVES
The primary aim of this study is to use recycled concrete aggregates and basalt macro
fiber in concrete structural elements and verify the feasibility of these proposed materials
experimentally and analytically. The following points summarize the major objectives of
this project:
- Investigating the feasibility of using RCA and Basalt Macro Fiber (BMF) as
alternative materials in RC structural system.
- Examining experimentally the material characterization of the RCA, and the Basalt
FRC made with RCA.
- Evaluating the effect of the volume fraction of BMF, and the replacement ratio of
RCA on the hardened properties of concrete.
- Studying and quantifying experimentally the deflection and the load-carrying
capacity of RC beams made with different replacement ratios of RCA and various
percentage of BMF. Crack patterns, failure mechanisms, and mode of failures are
among the scope of the study.
- Conducting an analytical study on the flexural behavior and the predicted deflection
of the RC beams made with different replacement ratios of RCA and various
percentage of BMF.
6
1.3 THESIS ORGANIZATION
This thesis contains six chapters arranged as follows:
Chapter 1: An introduction, research significance and research objectives.
Chapter 2: Background and Literature review: This chapter contains a detailed review of
previous works related to the current research.
Chapter 3: Experimental program: This chapter introduces the material characterization of
all materials. Further, describes the procedure followed in preparation, casting and testing
the test specimens.
Chapter 4: Result and discussion: covers the detailed test results of each specimen, the test
results include the graphs of cracking pattern, load vs deflection, compressive concrete
strain, and deformed shape. The latter section covers a summary of the test results and the
effect of different parameters in order to understand the behavior of RCA and BMF to
make comparisons among all groups.
Chapter 5: Theoretical deflection and flexural calculations: this chapter describes the step-
by-step formulations adopted for calculating the deflection and flexural strength of RC
beams with and without BMF.
Chapter 6: Summary, conclusion and recommendations: This chapter contains the
summary, conclusions of the study, recommendations and future work.
7
CHAPTER 2
BACKGROUND AND LITERATURE REVIEW
Qatar 2022 bidding committee official website stated that the State of Qatar has
recently experienced great economic developments. As a result, massive amounts of
construction materials have been used to accommodate the excessive pace in construction.
The State is expected to spend USD 17 billion on its infrastructure as part of its preparation
to host the Football World Cup in 2022. Most of these expenses will go to the construction
of new, stadiums, hotels, facilities, and tourism attractions.
Concrete is the main material used in construction in Qatar and all Gulf countries.
However, most of these countries suffer from the lack of natural resources required for
concrete production. Qatar Customs Database announced that the quantities of imported
aggregates into the State of Qatar have increased from 9.5 million tons in 2006 to 21.5
million tons in 2008. Therefore, it is essential to investigate the possibility of using recycled
materials like fine and coarse aggregates in concrete production.
Gulf News (2008) stated that numerous kinds of recyclable materials were currently used
in concrete. One of the potential resources of recycled concrete is the construction and
demolition waste. The gulf countries produce about 120 million tons per year of waste.
In the past, a wide range of experimental studies were made on the overall durability and
strength of recycled concrete aggregates (RCA). Special considerations were also
attributed to the effect of Basalt macro fiber (BMF) on concrete properties. Some of these
researches are highlighted below.
2.1 RECYCLED CONCRETE AGGREGATES (RCA)
Qatar Construction Specification (QCS, 2014) define the recycled aggregates as the
aggregates resulting from the processing of inorganic material previously used in
construction. It shall be free from any deleterious matter and conform to the requirements
of physical and chemical properties as a minimum of QCS requirements and shall meet
with ASTM standards. (Al-Ansary & Iyengar 2013) investigated the resources, production,
properties and experimental evaluation of RCA in the State of Qatar, finding out that the
RCA has been produced in Qatar since 2009 as a result of the extensive construction and
8
demolition activities. Approximately 20000 tons of concrete debris have to be discarded
every day, and half of that quantity converted to RCA.This study shows the initial
physiochemical characterization of the NCA and compares them with RCA as per Qatar
construction specifications limits. The use of RCA in concrete applications has major
economic and environmental benefits to Qatar. RCA can partially replace the relatively
expensive imported Gabbro aggregates, commonly used in Qatar, thus saving on the total
cost of the concrete projects. Recycling construction and demolition waste will also have
a significant environmental impact, due to the reduction in demand of natural aggregates.
Moreover, using waste materials would partially solve a significant environmental concern
over land-filling the large quantities of waste construction materials produced every year.
(Poon & Chan 2007) of Hong Kong estimated that around 20 million tons of construction
and demolished waste were produced in 2004, although 12% of the waste could be disposed
of at landfills and 88% was used as backfilling materials. The main objective was to
investigate the possibility of using construction and demolition wastes in concrete. Their
research work provided some preliminary results on the effects of using recycled
aggregates on the hardened concrete properties. (Abbas et al. 2007) and (Zhang & Ingham
2010), have presented the economic and environmental benefits of using RCA in the
construction sector in Canada and New Zealand. Most of the RCA have used as highway
construction, and only a slight portion of the solid waste is reused as an aggregate in new
concrete construction.The comparable results between RCA and NCA indicated that RCA
is a viable alternative to NCA. (Silva et al. 2014) have presented the main factors affecting
the physical, chemical, mechanical, permeation and compositional properties of recycled
aggregates originated form construction and demolition waste that is mainly used for
construction field. The investigation results show the classifications based on the quality
of recycled aggregates can be re-used to produce concrete with predictable performance.
(Abdulla 2012). presented the test results of the mechanical properties of eight different
types of recycled aggregates in Iraq and evaluated the influences and performance of these
types of the properties on concrete mix produced by using recycled aggregates.(Huda &
Alam 2014) investigated the fresh and the hardened properties of three different
generations of repeated recycled concrete, which were produced using 100% of RCA as a
replacement of NCA. RCA was recycled three times over its life span. The results showed

9
that the bulk density and specific gravity of different generations of repeated of RCA
decreased with the increased number of repetitions, the air content of fresh concrete mix
increased with the increased number of repetitions. In addition, the results showed a slight
decrease in the concrete compressive strength compared with the control specimen.
However, all concrete mixes successfully achieved their target strength at 56th days expect
the third generation concrete this is due to the reduced bulk density, adhered mortar and
weak interfacial transition zone (ITZ). Though all concrete mixes exceeded the target
strength at 120 days. The peak axial strain values were higher for repeated RCA. In
addition, the values of the splitting tensile strength of first and second generations were
higher than the control specimen. (McNeil & Kang 2013) discussed and reviewed the
properties of RCA and their impact on the structural concrete elements. Testing results
showed that using RCA resulted in a decrease in the compressive strength. They found out
that the modulus of rupture for RCA concrete was less than the normal concrete and the
modulus of elasticity was also less than expected. A number of studies showed that RC
beams made with RCA did experience larger deflection and lesser cracking moment and
the ultimate moment compared with RC made with RCA. (Panda & Bal 2013) , (Grdic et
al. 2010) and (Kou & Poon 2009). Several researchers have studied and evaluated both the
hardened and fresh properties of self-compacted concrete (SCC) mixtures produced by
different percentage of RCA instead of NCA. (Katz 2004) found that RCA is commenly
covered with loose particles and attached mortar, which prevent the high bonding between
the new cement matrix and RCA, and different methods of RCA’s treatments by
impregnation of silica fume solution and by ultrasonic cleaning could increase the
compressive strength by 15% and 7%, respectively. (Liang et al. 2013), (Purushothaman
et al. 2000) and (Güneyisi et al. 2014), have investigated experiementaly various surface
pretreatment methods for RCA and their effect on the quality, hardened and fresh
properties of concrete mix produce by using a surface treated RCA. (Çakir 2014) studied
the influence of mineral additives like silica fume (SF) and ground granulated blast furnace
slag (GGBFS) at several percentages with RCA on the hardened properties of concrete.
The results showed that the compressive strength of the concrete gradually decreases as the
amount of RCA increases. The test results showed that at 100 % of replacing RCA, the
compressive strength at 28 day decreased by 24% and strength reduction is more significant
10
with 50% RCA content.The ratios between the tensile splitting strength to the compressive
strength are higher in the RCA concretes with GGBFS than the RCA concretes with SF.
(Dilbas et al. 2014) investigated the mechanical and physical properties of concrete
containing different ratios of SF with RCA. The properties of RCA can vary depending on
their source. RCA affects more on the splitting tensile strength rather than the compressive
strength. The results demonstrated that the compressive strength decreased for specimen
produced by concrete mix contain RCA. As well. the results showed significant
improvement in tensile splitting strength but the modulus of elasticity was decreased with
increasing the RCA content. (Choi & Yun 2013) Presented experimental results on the
flexural behavior and long-term deflection of beams made with RCA under sustained loads
for a period of 380 days. The principal objective was to evaluate and compare the
experimental result with the code-based equations calculated using the ACI 318 Code.
They found that the maximum flexural strength of the beams without NCA was 20% higher
than that of the beams with RCA. Similar crack patterns were observed regrdless of the
aggregates type.Though, more cracks were present in the beams composed of RCA, and
the instant deflection values of the beam with RCA were smaller than the beams with NCA.
(Knaack & Kurama 2014) conducted an experimental program to assess shear and flexural
behavior of reinforced concrete beams, produced by concrete mix made with RCA. The
study found the results were reasonable and did not cause any noticeable alteration on the
shear and flexural strength of the beams. (Arezoumandi et al. 2015) conducted an
experimental study on the flexural strength of concrete beams constructed with RCA as
well as with NCA.The experiemntal results showed that the deflection corresponding to
the ultimate flexural strength of a beam made with RCA about 13% higher than the
comparable beam made with NCA.(Pereira-De-Oliveira et al. 2014) investigated the
influence of RCA on perpeability properties of SCC. They have used four different types
of concrete mixes. One of them was taken as a reference with 100% NCA. It was compared
with the remaining concrete mix with 20%, 40%, and 100% of RCA respectively.A larger
amount of superplasticizer for concrete mix with RCA was required because of the high
water absorption presented by RCA. As a result, the density of concrete was less when
increasing RCA. The results from fresh and hardened concrete properties lead to the
conclusion that it is viable to replace NCA by RCA since this research did not show any
11
detrimental to the SCC permeability properties. (Kutalmıs et al. 2015) investigated the
usability of polypropylene fiber in recycled aggregates concrete in order to be used
primarily in construction field. The results of using RCA with different amount of fiber
showed reduction in concrete workability with no significant influence observed on the
compressive strength. However, both of the flexural and splitting tensile strength were
increased with adding the fibers.(Dong et al. 2017) focussed on the mechanical properties
of the concrete made with RCA and basalt fiber, the major parameters were the replacement
ratio of RCA (0%, 50% and100%) and basalt fiber (0, 2 and 4 kg/m3). The results obtaind
from this study showed that the mechanical properties of concrete made with RCA are
decreased with increasing the RCA replacement ratio. However they could be enhanced by
using basalt fiber. The scanning electron microscope observations of the concrete revealed
that the basalt fiber accumulated in pores and on the surface of the attached morter can not
only strengthen the RCA ,but also improve the microstructure of the interfacial transition
zone, which further enhances the strength and ductility of the concrete.
2.2 BASALT MACRO FIBER (BMF)
Fiber composites have been developed to improve mechanical properties and long-
term severability of the structure in respect of serviceability, which can be enhanced by
using the fibers to control the cracking as well as to prevent the occurrence of large crack
width (ACI 544.1R-96 2002). Fiber reinforced concrete (FRC) is concrete made primarily
of hydraulic cement containing coarse aggregates, fine aggregates and discontinuous
discrete reinforcing fibers. Fibers suitable for reinforcing concrete are produced from steel,
glass, polymers (synthetic fibers) and other materials. The concrete matrices may be
mortars, normally proportioned mixes, or mixes specifically formulated for a particular
application. Generally, the length and diameter of the fibers used for FRC do not exceed
76 mm and 1 mm, respectively. Basalt is a rock with higher percentage of iron and
magnesium than granite. The ocean floor is almost completely made up of basalt. Most of
the basalt found on earth was produced in three rock-forming environments: 1) oceanic
divergent boundaries, 2) oceanic hotspots, and 3) mantle plumes and hotspots beneath
continents. Basalt rock has long been known for its thermal properties, strength, and
durability. The density of basalt rock is between 2.8 g/cm3, and 2.9 g/cm3. Crushed basalt
12
is used in road base, concrete aggregates, asphalt pavement aggregates, railroad ballast,
and filter stone in drain fields. Polished, thin basalt slabs are used as floor tiles and building
veneer (Subramanian 2010).
Basalt filaments are made by melting crushed volcanic basalt rock to about 1400oC to
1700°C for about 6 hours. The molten material is then extruded through special platinum
bushings to produce continuous filaments of basalt fiber. The three main manufacturing
techniques of basalt filaments are 1) centrifugal-blowing, 2) centrifugal-multiroll, 3) die
blowing. The fibers cool into hexagonal chains resulting in a resilient structure
substantially stronger than steel or glass fibers. Its production creates no environmental
waste and it is non-toxic in use or recycling. Basalt fibers are manufactured in a single-
stage process by melting pure raw crushed volcanic basalt rock (Brik 1997). They are
environmentally harmless, non-toxic, possess high heat stability and insulating
characteristics. Basalt fiber is extremely strong and durable and hence, it is a perfect
material for structural applications. It provides unique mechanical properties when used in
composite materials. The mechanical characteristics depend on the diameter of the
elemental fibers. Fibers with smaller diameter show higher tensile strength and modulus of
elasticity than those fibers with larger diameter. Continuous roving basalt fiber can be used
to produce a wide range of composite materials with high reliability.(Jiang et al. 2014)
evaluated and analyzed the effects of the length and volume fraction of basalt fiber on the
engineering properties of fiber reinforced concrete. The results obtained showed that there
was a steady increase in tensile strength, toughness index, flexural strength and an excellent
bond between basalt fiber surface and cement contents, comparing with plain concrete.
Also, these corresponding strengths will profoundly influence if the length of basalt fiber
is increasing, but the compressive strength increases slightly and that addition of basalt
fiber to the concrete mix leads to decrease concrete workability.( Zielinski & Olszewski
2005) investigated the mechanical and physical properties of basalt fiber reinforced
concrete at 28 days’ concrete age. The test results show the addition of basalt fiber causes
a smaller shrinkage, decrease in bending strength and concrete workability, and this
recommended study allows an optimum percentage of basalt fiber in concrete from 0.5%
to 0.8% of cement weight to achieve the best concrete properties.(Dias & Thaumaturgo
2005) investigated the influence of the volumetric fraction of the fibers on the fracture
13
toughness of geopolymeric cement concrete reinforced with basalt fiber. The results
indicated that the concrete have better fracture properties than conventional concrete, with
less number of crack. (Tumadhir 2013) studied the mechanical and thermal properties of
basalt fiber reinforced concrete, with fiber volume fraction ranging (0.1%,0.2%,0.3%, and
0.5%) by total mix volume. The final test results indicated that increasing the basalt fiber
content slightly increased the splitting tensile strength but did not affect the compressive
strength up to 0.3 % of basalt fiber which then decreased with 0.5% of basalt fiber. The
compressive strength increases with the increase of fiber content till 0.3 %of Basalt fiber,
then there is a slightly decrease when Basalt fiber increases when 0.5 % fiber was used.
This study also reported a reduction in fresh concrete properties as the basalt fiber volume
content was increased. (High et al. 2015) investigated the effect of using two different types
of chopped basalt fibers to enhance the mechanical properties of concrete. The results
indicate that the use of basalt fiber had increased the modulus of rupture and slightly
increased the compressive strength of concrete, however the increase in the flexural
strength of concrete was more pronounced. (Byung & Oh 1993) Investigated the flexural
behavior of reinforced concrete beams containing steel fiber. An experimental program
was included two series of singly reinforced concrete beams and one series of doubly
reinforced concrete beams, the fiber contents for each series were 0%, 1%, and 2% by total
mix volume. The result indicated that the ultimate strength of FRC beams is increased with
an increase of fiber content, and the ductility and energy absorption capacity are
considerably enhanced with the addition of steel fiber. In addition, the crack width
increases almost linearly with increase of steel stress and that the crack width is remarkably
reduced as the fiber amount in the beam increases. The FRC beams exhibited considerably
less cracking and have remarkable resistance to tensile cracking.(Mertol et al. 2015)
investigated the flexural behavior of large-scale steel fiber reinforced concrete beams
(SFRC), with lightly and heavily reinforcement. The main parameters in this study were
the type of concrete and the amount of longitudinal reinforcement. The results indicate that
the use of SFRC increases the ultimate load and service stiffness of the beams slightly
compared to the conventional concrete (CC). As reinforcement ratio increases, the ultimate
deflection of SFRC beams become significantly greater than that of CC beams, the flexural
14
toughness of SFRC specimens is greater than that of CC specimens with the difference
being significantly larger for over-reinforced sections.
15
CHAPTER 3
EXPERIMENTAL PROGRAM
In this chapter, the material characterizations for all materials are presented and
discussed. In addition, the testing set-up, and testing protocol including the preparation of
beams specimens for the four-point load flexural testing is highlighted.
3.1 MATERIALS CHARACTERIZATION
3.1.1 Recycled Concrete Aggregates (RCA) and Natural Coarse Aggregates
(NCA)
The construction sector requires a supply of aggregates, but a state of Qatar does
not possess any sources of hard rock aggregates. The aggregate that use to produce concrete
(Gabbro) is imported from the United Arab Emirates. The redevelopment of Qatar has also
generated massive quantities of construction and demolition waste. This waste is taken to
the duping site in Rawdat Rashid area and it is divided depend on the source of waste.
Since 2013 a large-scale recycled aggregate plant has been operating at the site by Lafarge
Qatar Quarry Company and had supplied the required RCA for this project.
3.1.1.1 Specific Gravity
Relative density or specific gravity is expressed by the ASTM as the ratio of the
density of aggregates particles to the density of distilled water at a specified temperature.
It was calculated in this study according to ASTM C127-15 (ASTM C127 2015). Here
below the procedure used for obtaining specific gravity.
Specific Gravity(OD) =A
B−C 3-1
Specific Gravity(SSD) =B
B−C 3-2
Where OD is specific gravity of oven-dry coarse aggregates, SSD is specific gravity of
saturated-surface-dry, A is the mass of oven-dry test sample in air, B is the mass of
16
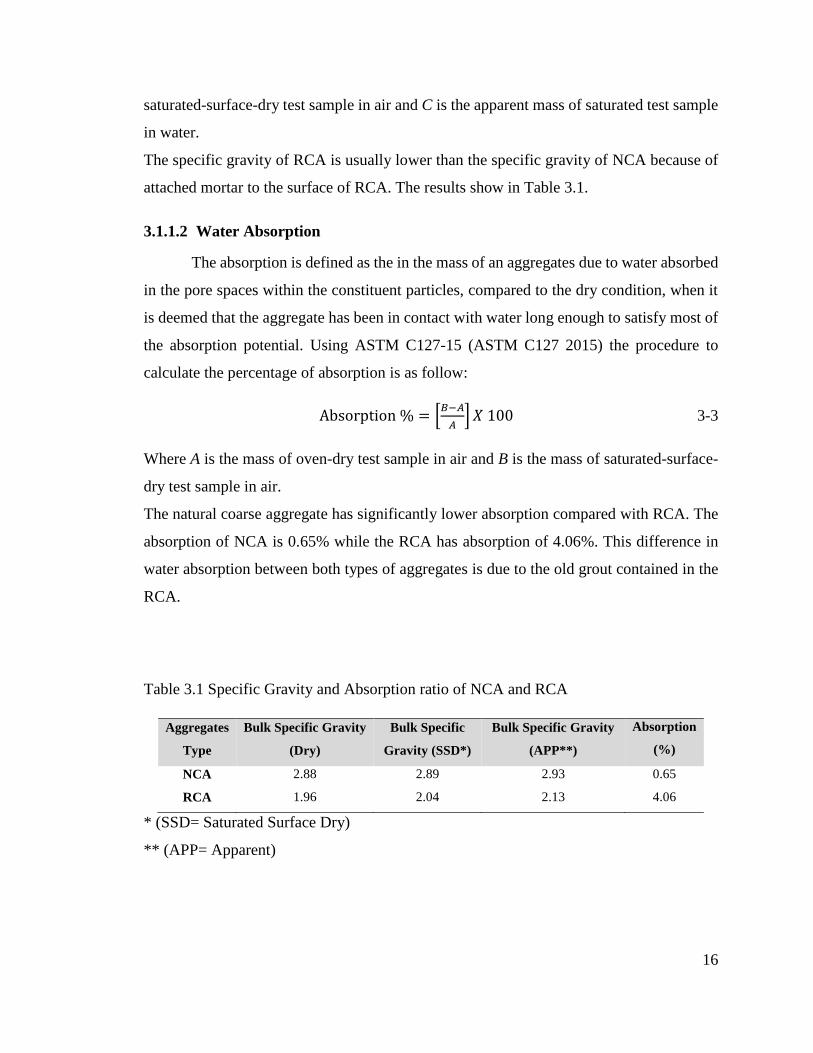
saturated-surface-dry test sample in air and C is the apparent mass of saturated test sample
in water.
The specific gravity of RCA is usually lower than the specific gravity of NCA because of
attached mortar to the surface of RCA. The results show in Table 3.1.
3.1.1.2 Water Absorption
The absorption is defined as the in the mass of an aggregates due to water absorbed
in the pore spaces within the constituent particles, compared to the dry condition, when it
is deemed that the aggregate has been in contact with water long enough to satisfy most of
the absorption potential. Using ASTM C127-15 (ASTM C127 2015) the procedure to
calculate the percentage of absorption is as follow:
Absorption % = [𝐵−𝐴
𝐴] 𝑋 100 3-3
Where A is the mass of oven-dry test sample in air and B is the mass of saturated-surface-
dry test sample in air.
The natural coarse aggregate has significantly lower absorption compared with RCA. The
absorption of NCA is 0.65% while the RCA has absorption of 4.06%. This difference in
water absorption between both types of aggregates is due to the old grout contained in the
RCA.
Table 3.1 Specific Gravity and Absorption ratio of NCA and RCA
Aggregates
Type
Bulk Specific Gravity
(Dry)
Bulk Specific
Gravity (SSD*)
Bulk Specific Gravity
(APP**)
Absorption
(%)
NCA 2.88 2.89 2.93 0.65
RCA 1.96 2.04 2.13 4.06
* (SSD= Saturated Surface Dry)
** (APP= Apparent)
17
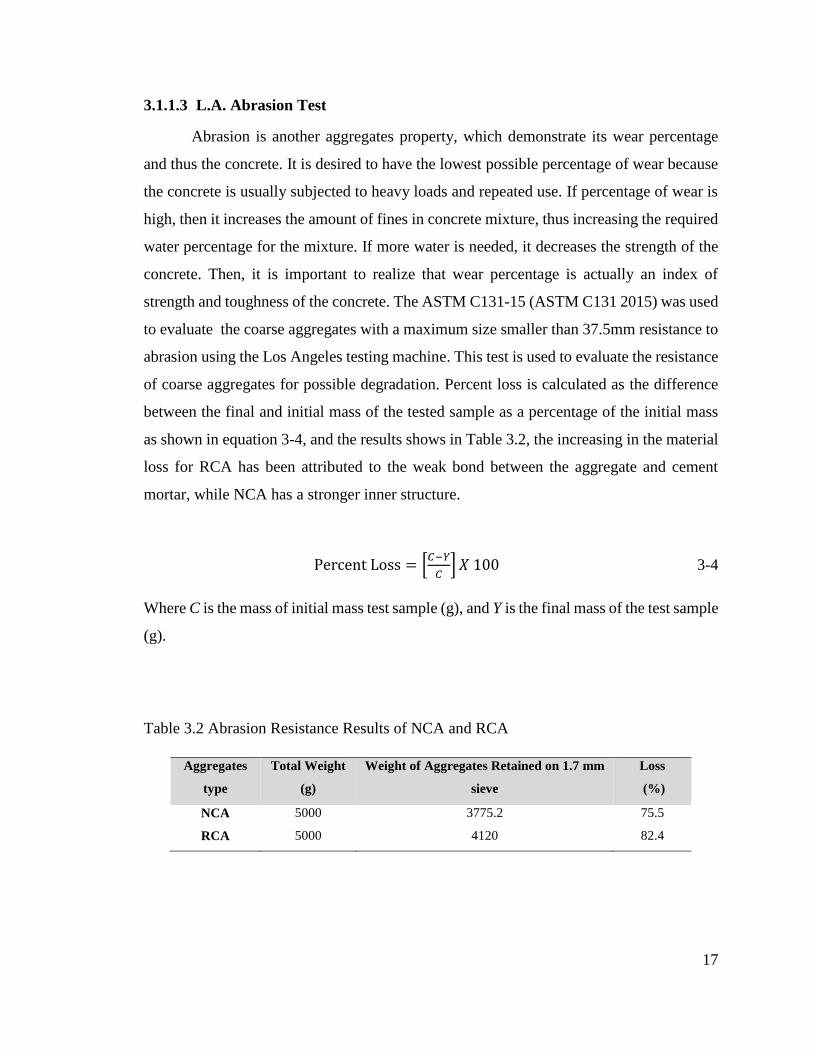
3.1.1.3 L.A. Abrasion Test
Abrasion is another aggregates property, which demonstrate its wear percentage
and thus the concrete. It is desired to have the lowest possible percentage of wear because
the concrete is usually subjected to heavy loads and repeated use. If percentage of wear is
high, then it increases the amount of fines in concrete mixture, thus increasing the required
water percentage for the mixture. If more water is needed, it decreases the strength of the
concrete. Then, it is important to realize that wear percentage is actually an index of
strength and toughness of the concrete. The ASTM C131-15 (ASTM C131 2015) was used
to evaluate the coarse aggregates with a maximum size smaller than 37.5mm resistance to
abrasion using the Los Angeles testing machine. This test is used to evaluate the resistance
of coarse aggregates for possible degradation. Percent loss is calculated as the difference
between the final and initial mass of the tested sample as a percentage of the initial mass
as shown in equation 3-4, and the results shows in Table 3.2, the increasing in the material
loss for RCA has been attributed to the weak bond between the aggregate and cement
mortar, while NCA has a stronger inner structure.
Percent Loss = [𝐶−𝑌
𝐶] 𝑋 100 3-4
Where C is the mass of initial mass test sample (g), and Y is the final mass of the test sample
(g).
Table 3.2 Abrasion Resistance Results of NCA and RCA
Aggregates
type
Total Weight
(g)
Weight of Aggregates Retained on 1.7 mm
sieve
Loss
(%)
NCA 5000 3775.2 75.5
RCA 5000 4120 82.4
18
3.1.1.4 Sieve Analysis and Fineness Modulus
The aggregate in general makes about of 60 – 80 % of total concrete volume, so it has
a significant effect on concrete properties, and aggregate should be durable and vigorous
and uniformly graded to meet the desired concrete mix. The ASTM C136-15 (ASTM C136
2015) was used to determine the particle size distribution of fine and coarse aggregates by
sieving. A weighed sample of dry aggregate is separated through a series of sieves of
progressively smaller openings for determination of particle size distribution. Fineness
Modulus is defined as the total percentage of cumulative percentages retained on each of
specified series of sieves and dividing the sum by100. The NCA is relatively coarser than
the RCA. Hence the fineness modulus of 100% RCA is 3.916, which is slightly lower than
NCA of 4.388. Table 3.3 and 3.4 shows the results of the sieve analysis for NCA and RCA
respectively. Figure 3.1 and Figure 3.2 show the sieve analysis obtained for both types
aggregates with respect to the upper and lower ASTM limits.
Table 3.3 Sieve Analysis Results of NCA
Sieve
Opening Size
Mass
Sieve (g)
Mass Sieve
+Retained (g)
Mass
Retained (g)
Retained
%
Cumulative
%Retained
Cumulative
%Passing
25 mm 1337.500 1337.500 0.00 0.00 0.00 100.00
19 mm 1311.000 1574.500 263.50 6.53 6.53 93.47
12.5 mm 1280.500 3378.000 2097.50 51.98 58.51 41.49
9.5 mm 1288.500 2479.500 1191.00 29.52 88.03 11.97
4.75 mm 1241.500 1706.500 465.00 11.52 99.55 0.45
2.36 mm 1101.000 1113.000 12.00 0.30 99.85 0.15
Pan 788.00 794.00 6.00 0.15 100.00 0.00
4035.00
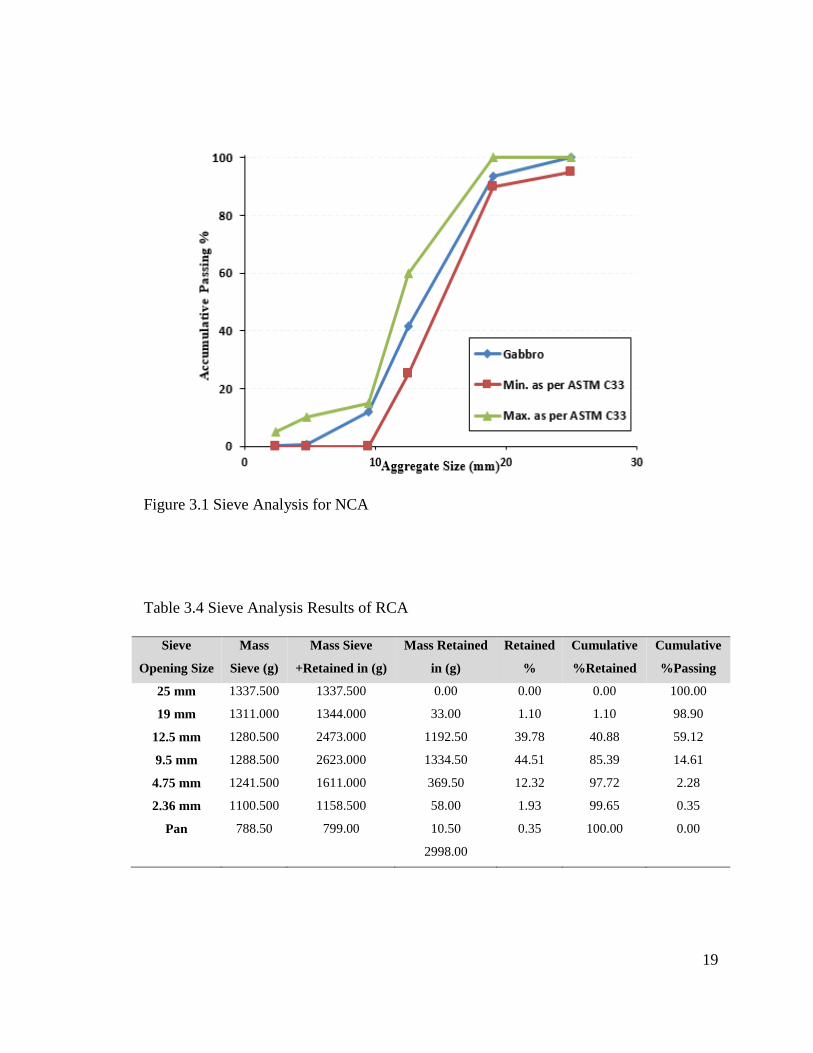
19
Figure 3.1 Sieve Analysis for NCA
Table 3.4 Sieve Analysis Results of RCA
Sieve
Opening Size
Mass
Sieve (g)
Mass Sieve
+Retained in (g)
Mass Retained
in (g)
Retained
%
Cumulative
%Retained
Cumulative
%Passing
25 mm 1337.500 1337.500 0.00 0.00 0.00 100.00
19 mm 1311.000 1344.000 33.00 1.10 1.10 98.90
12.5 mm 1280.500 2473.000 1192.50 39.78 40.88 59.12
9.5 mm 1288.500 2623.000 1334.50 44.51 85.39 14.61
4.75 mm 1241.500 1611.000 369.50 12.32 97.72 2.28
2.36 mm 1100.500 1158.500 58.00 1.93 99.65 0.35
Pan 788.50 799.00 10.50 0.35 100.00 0.00
2998.00
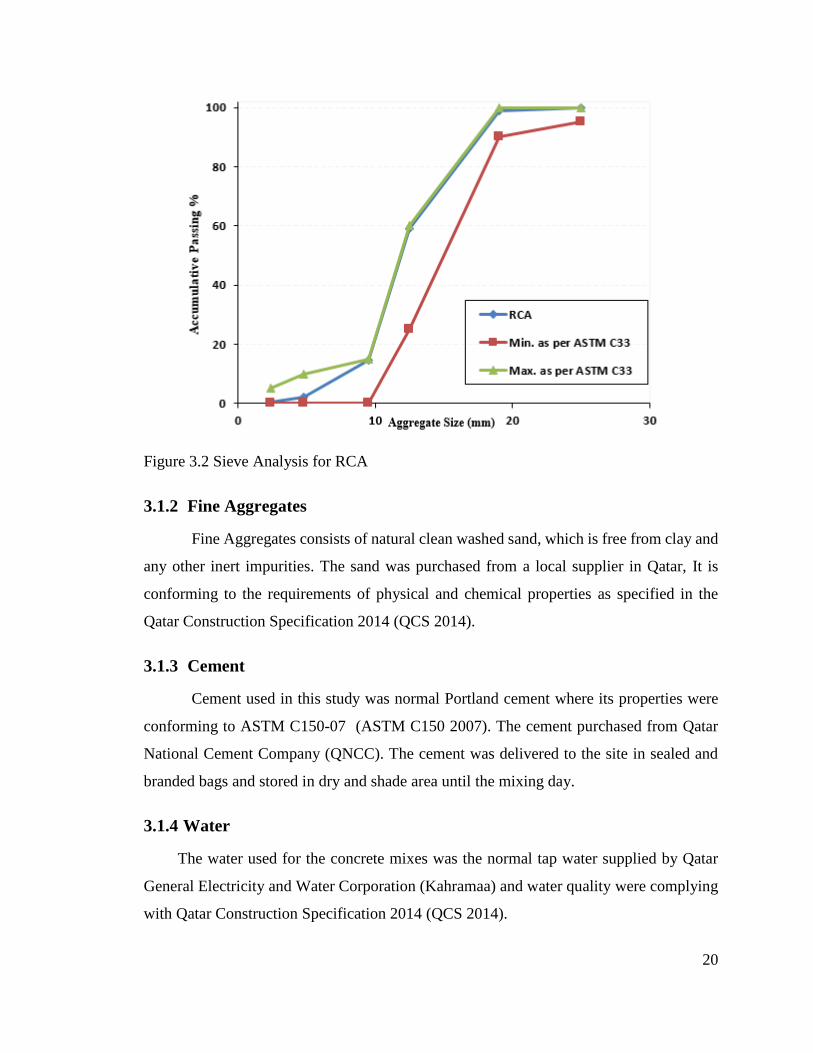
20
Figure 3.2 Sieve Analysis for RCA
3.1.2 Fine Aggregates
Fine Aggregates consists of natural clean washed sand, which is free from clay and
any other inert impurities. The sand was purchased from a local supplier in Qatar, It is
conforming to the requirements of physical and chemical properties as specified in the
Qatar Construction Specification 2014 (QCS 2014).
3.1.3 Cement
Cement used in this study was normal Portland cement where its properties were
conforming to ASTM C150-07 (ASTM C150 2007). The cement purchased from Qatar
National Cement Company (QNCC). The cement was delivered to the site in sealed and
branded bags and stored in dry and shade area until the mixing day.
3.1.4 Water
The water used for the concrete mixes was the normal tap water supplied by Qatar
General Electricity and Water Corporation (Kahramaa) and water quality were complying
with Qatar Construction Specification 2014 (QCS 2014).
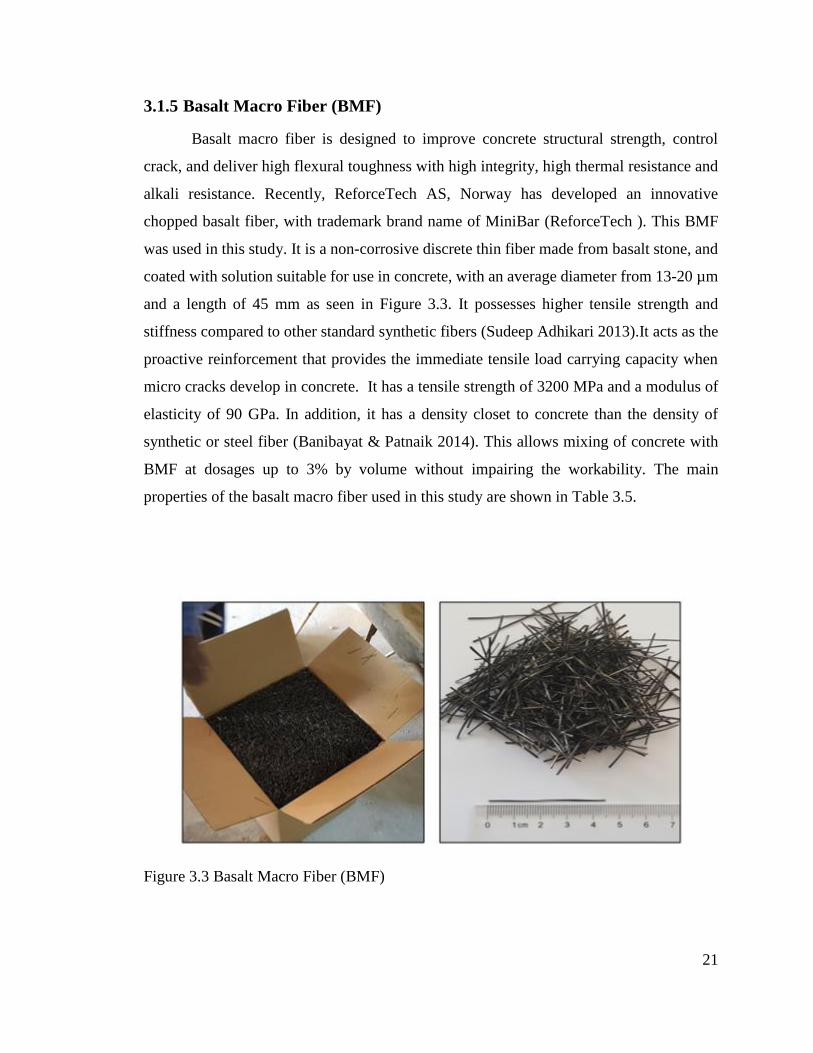
21
3.1.5 Basalt Macro Fiber (BMF)
Basalt macro fiber is designed to improve concrete structural strength, control
crack, and deliver high flexural toughness with high integrity, high thermal resistance and
alkali resistance. Recently, ReforceTech AS, Norway has developed an innovative
chopped basalt fiber, with trademark brand name of MiniBar (ReforceTech ). This BMF
was used in this study. It is a non-corrosive discrete thin fiber made from basalt stone, and
coated with solution suitable for use in concrete, with an average diameter from 13-20 µm
and a length of 45 mm as seen in Figure 3.3. It possesses higher tensile strength and
stiffness compared to other standard synthetic fibers (Sudeep Adhikari 2013).It acts as the
proactive reinforcement that provides the immediate tensile load carrying capacity when
micro cracks develop in concrete. It has a tensile strength of 3200 MPa and a modulus of
elasticity of 90 GPa. In addition, it has a density closet to concrete than the density of
synthetic or steel fiber (Banibayat & Patnaik 2014). This allows mixing of concrete with
BMF at dosages up to 3% by volume without impairing the workability. The main
properties of the basalt macro fiber used in this study are shown in Table 3.5.
Figure 3.3 Basalt Macro Fiber (BMF)
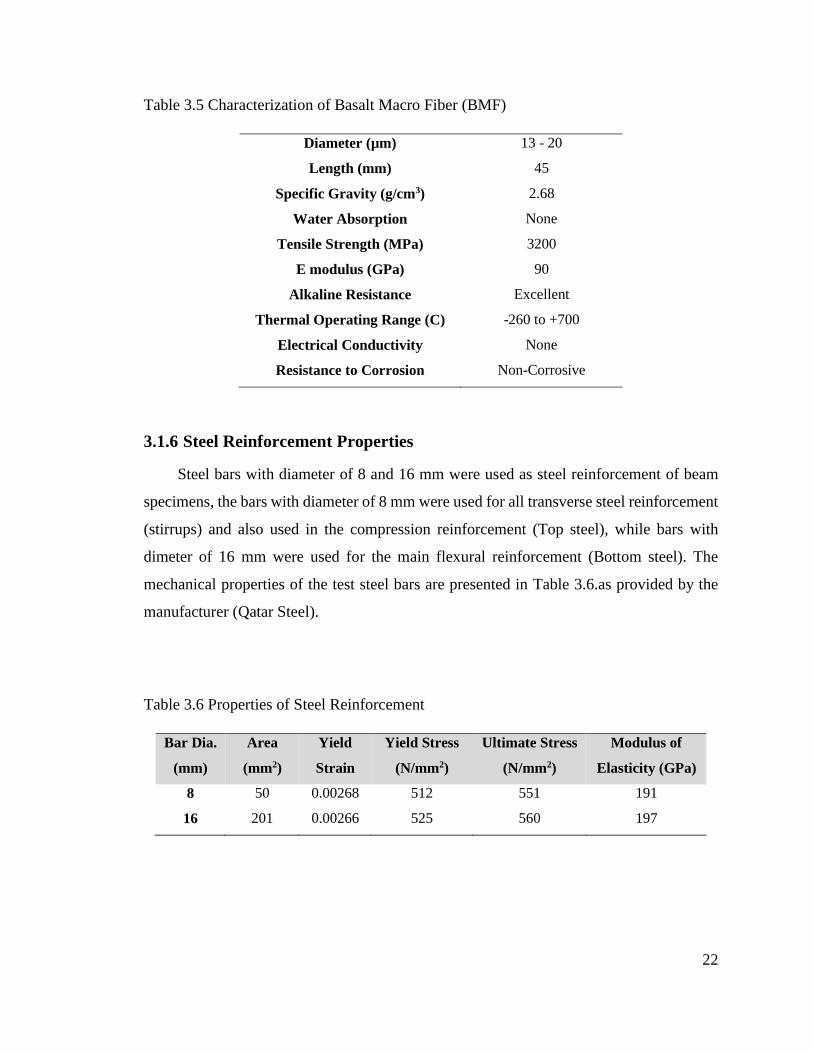
22
Table 3.5 Characterization of Basalt Macro Fiber (BMF)
Diameter (µm) 13 - 20
Length (mm) 45
Specific Gravity (g/cm3) 2.68
Water Absorption None
Tensile Strength (MPa) 3200
E modulus (GPa) 90
Alkaline Resistance Excellent
Thermal Operating Range (C) -260 to +700
Electrical Conductivity None
Resistance to Corrosion Non-Corrosive
3.1.6 Steel Reinforcement Properties
Steel bars with diameter of 8 and 16 mm were used as steel reinforcement of beam
specimens, the bars with diameter of 8 mm were used for all transverse steel reinforcement
(stirrups) and also used in the compression reinforcement (Top steel), while bars with
dimeter of 16 mm were used for the main flexural reinforcement (Bottom steel). The
mechanical properties of the test steel bars are presented in Table 3.6.as provided by the
manufacturer (Qatar Steel).
Table 3.6 Properties of Steel Reinforcement
Bar Dia.
(mm)
Area
(mm2)
Yield
Strain
Yield Stress
(N/mm2)
Ultimate Stress
(N/mm2)
Modulus of
Elasticity (GPa)
8 50 0.00268 512 551 191
16 201 0.00266 525 560 197
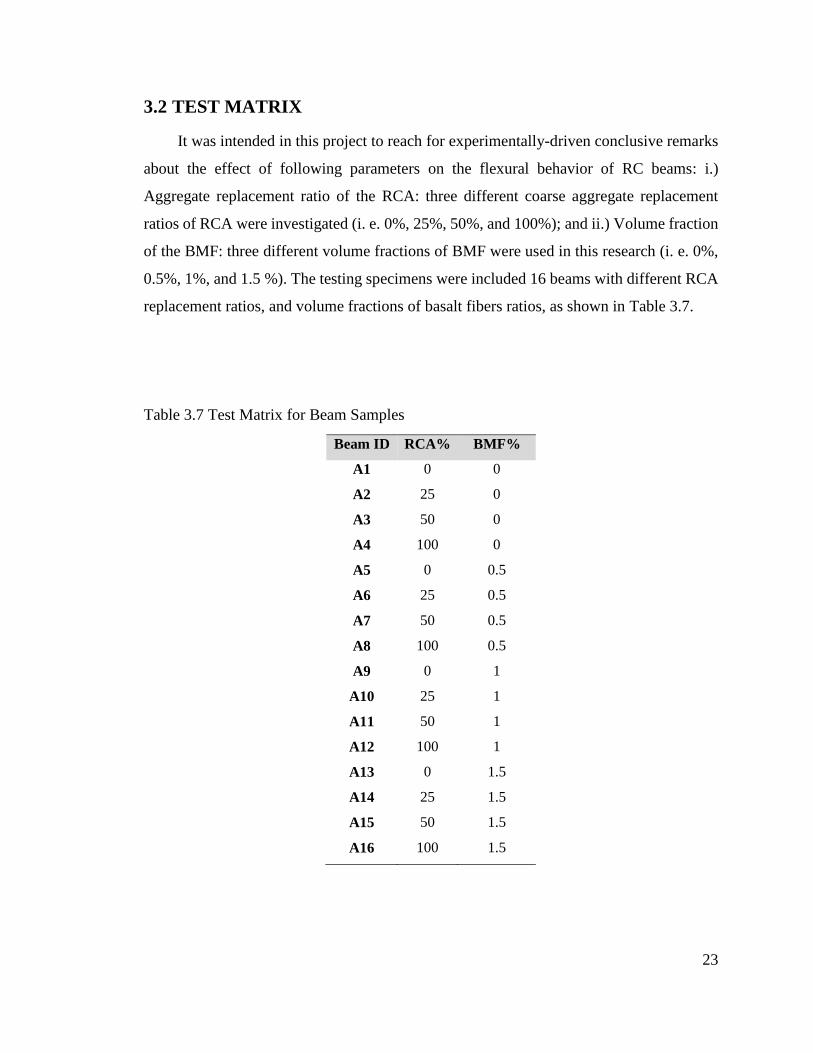
23
3.2 TEST MATRIX
It was intended in this project to reach for experimentally-driven conclusive remarks
about the effect of following parameters on the flexural behavior of RC beams: i.)
Aggregate replacement ratio of the RCA: three different coarse aggregate replacement
ratios of RCA were investigated (i. e. 0%, 25%, 50%, and 100%); and ii.) Volume fraction
of the BMF: three different volume fractions of BMF were used in this research (i. e. 0%,
0.5%, 1%, and 1.5 %). The testing specimens were included 16 beams with different RCA
replacement ratios, and volume fractions of basalt fibers ratios, as shown in Table 3.7.
Table 3.7 Test Matrix for Beam Samples
Beam ID RCA% BMF%
A1 0 0
A2 25 0
A3 50 0
A4 100 0
A5 0 0.5
A6 25 0.5
A7 50 0.5
A8 100 0.5
A9 0 1
A10 25 1
A11 50 1
A12 100 1
A13 0 1.5
A14 25 1.5
A15 50 1.5
A16 100 1.5
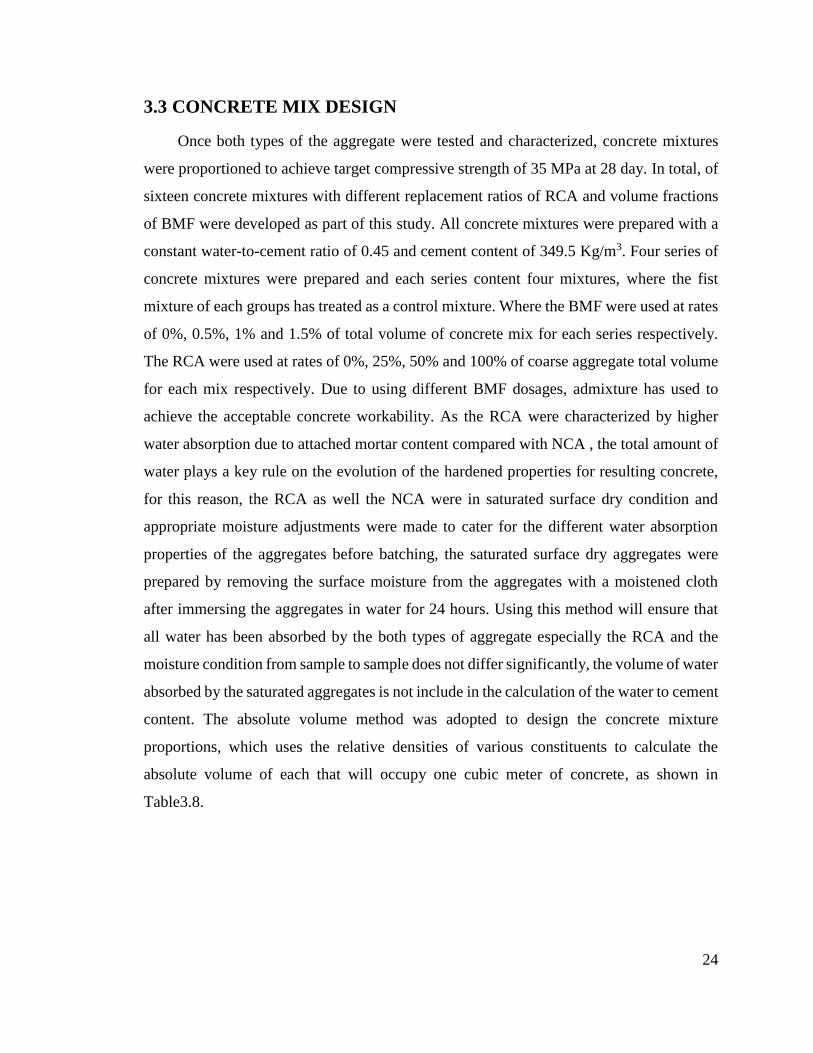
24
3.3 CONCRETE MIX DESIGN
Once both types of the aggregate were tested and characterized, concrete mixtures
were proportioned to achieve target compressive strength of 35 MPa at 28 day. In total, of
sixteen concrete mixtures with different replacement ratios of RCA and volume fractions
of BMF were developed as part of this study. All concrete mixtures were prepared with a
constant water-to-cement ratio of 0.45 and cement content of 349.5 Kg/m3. Four series of
concrete mixtures were prepared and each series content four mixtures, where the fist
mixture of each groups has treated as a control mixture. Where the BMF were used at rates
of 0%, 0.5%, 1% and 1.5% of total volume of concrete mix for each series respectively.
The RCA were used at rates of 0%, 25%, 50% and 100% of coarse aggregate total volume
for each mix respectively. Due to using different BMF dosages, admixture has used to
achieve the acceptable concrete workability. As the RCA were characterized by higher
water absorption due to attached mortar content compared with NCA , the total amount of
water plays a key rule on the evolution of the hardened properties for resulting concrete,
for this reason, the RCA as well the NCA were in saturated surface dry condition and
appropriate moisture adjustments were made to cater for the different water absorption
properties of the aggregates before batching, the saturated surface dry aggregates were
prepared by removing the surface moisture from the aggregates with a moistened cloth
after immersing the aggregates in water for 24 hours. Using this method will ensure that
all water has been absorbed by the both types of aggregate especially the RCA and the
moisture condition from sample to sample does not differ significantly, the volume of water
absorbed by the saturated aggregates is not include in the calculation of the water to cement
content. The absolute volume method was adopted to design the concrete mixture
proportions, which uses the relative densities of various constituents to calculate the
absolute volume of each that will occupy one cubic meter of concrete, as shown in
Table3.8.
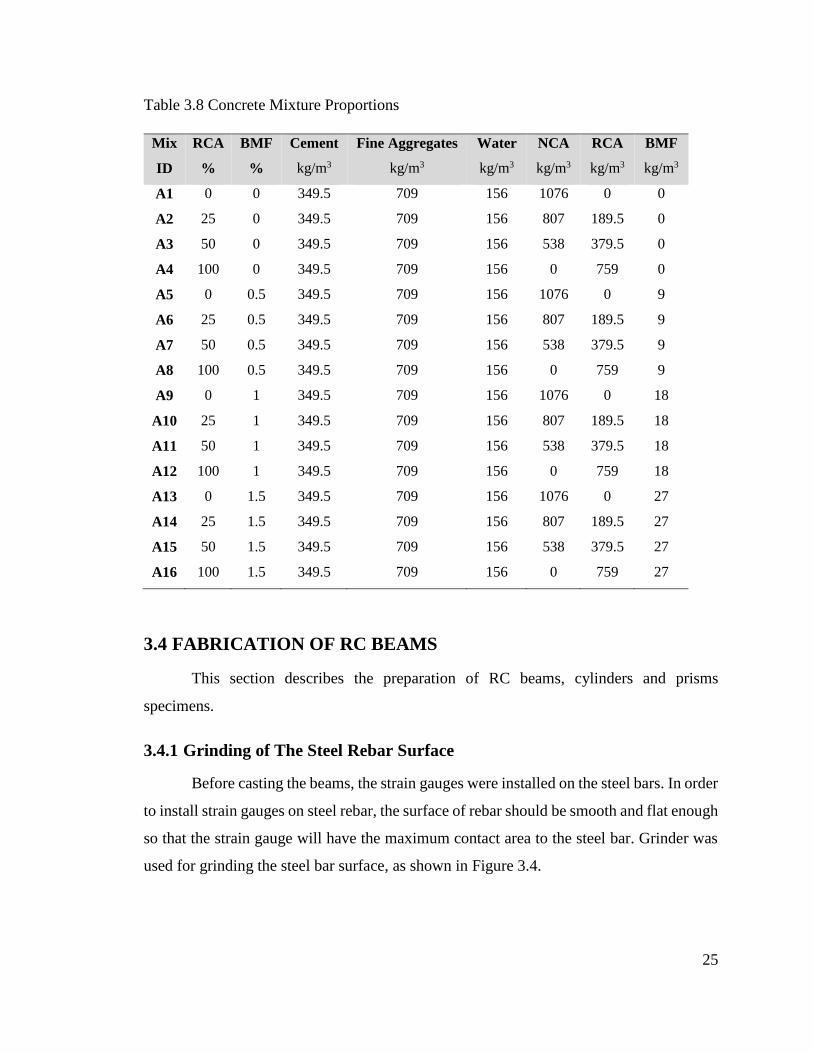
25
Table 3.8 Concrete Mixture Proportions
Mix
ID
RCA
%
BMF
%
Cement
kg/m3
Fine Aggregates
kg/m3
Water
kg/m3
NCA
kg/m3
RCA
kg/m3
BMF
kg/m3
A1 0 0 349.5 709 156 1076 0 0
A2 25 0 349.5 709 156 807 189.5 0
A3 50 0 349.5 709 156 538 379.5 0
A4 100 0 349.5 709 156 0 759 0
A5 0 0.5 349.5 709 156 1076 0 9
A6 25 0.5 349.5 709 156 807 189.5 9
A7 50 0.5 349.5 709 156 538 379.5 9
A8 100 0.5 349.5 709 156 0 759 9
A9 0 1 349.5 709 156 1076 0 18
A10 25 1 349.5 709 156 807 189.5 18
A11 50 1 349.5 709 156 538 379.5 18
A12 100 1 349.5 709 156 0 759 18
A13 0 1.5 349.5 709 156 1076 0 27
A14 25 1.5 349.5 709 156 807 189.5 27
A15 50 1.5 349.5 709 156 538 379.5 27
A16 100 1.5 349.5 709 156 0 759 27
3.4 FABRICATION OF RC BEAMS
This section describes the preparation of RC beams, cylinders and prisms
specimens.
3.4.1 Grinding of The Steel Rebar Surface
Before casting the beams, the strain gauges were installed on the steel bars. In order
to install strain gauges on steel rebar, the surface of rebar should be smooth and flat enough
so that the strain gauge will have the maximum contact area to the steel bar. Grinder was
used for grinding the steel bar surface, as shown in Figure 3.4.
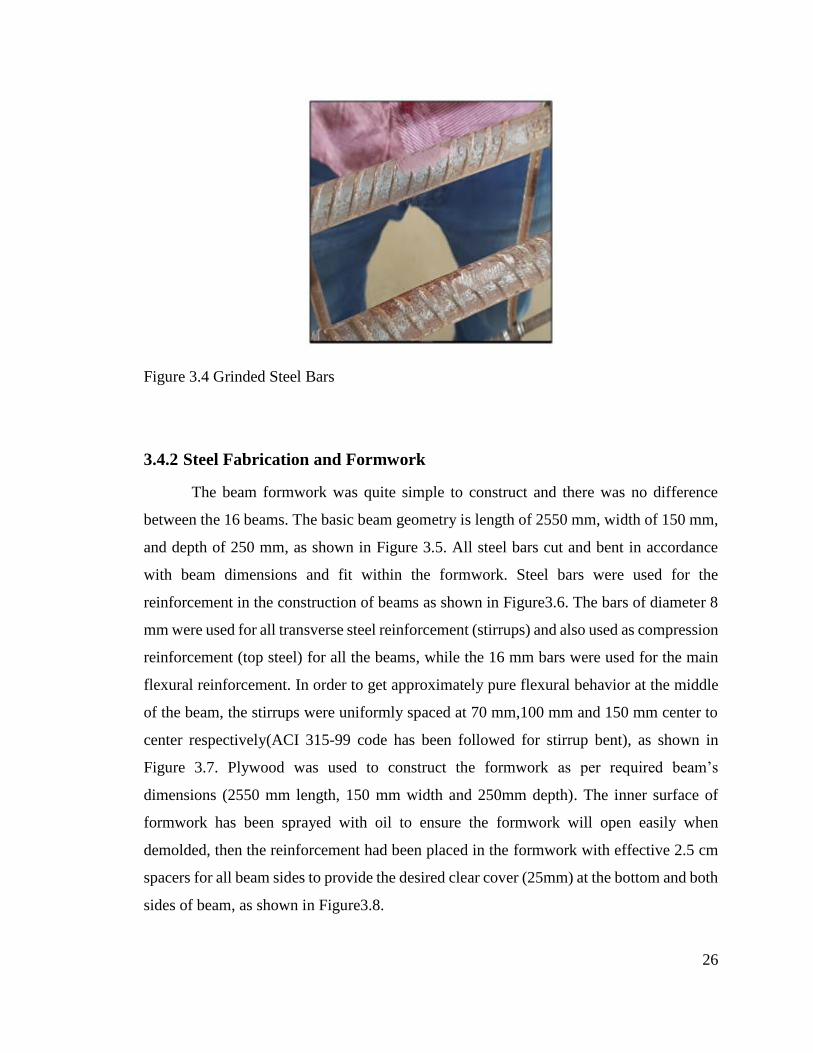
26
Figure 3.4 Grinded Steel Bars
3.4.2 Steel Fabrication and Formwork
The beam formwork was quite simple to construct and there was no difference
between the 16 beams. The basic beam geometry is length of 2550 mm, width of 150 mm,
and depth of 250 mm, as shown in Figure 3.5. All steel bars cut and bent in accordance
with beam dimensions and fit within the formwork. Steel bars were used for the
reinforcement in the construction of beams as shown in Figure3.6. The bars of diameter 8
mm were used for all transverse steel reinforcement (stirrups) and also used as compression
reinforcement (top steel) for all the beams, while the 16 mm bars were used for the main
flexural reinforcement. In order to get approximately pure flexural behavior at the middle
of the beam, the stirrups were uniformly spaced at 70 mm,100 mm and 150 mm center to
center respectively(ACI 315-99 code has been followed for stirrup bent), as shown in
Figure 3.7. Plywood was used to construct the formwork as per required beam’s
dimensions (2550 mm length, 150 mm width and 250mm depth). The inner surface of
formwork has been sprayed with oil to ensure the formwork will open easily when
demolded, then the reinforcement had been placed in the formwork with effective 2.5 cm
spacers for all beam sides to provide the desired clear cover (25mm) at the bottom and both
sides of beam, as shown in Figure3.8.
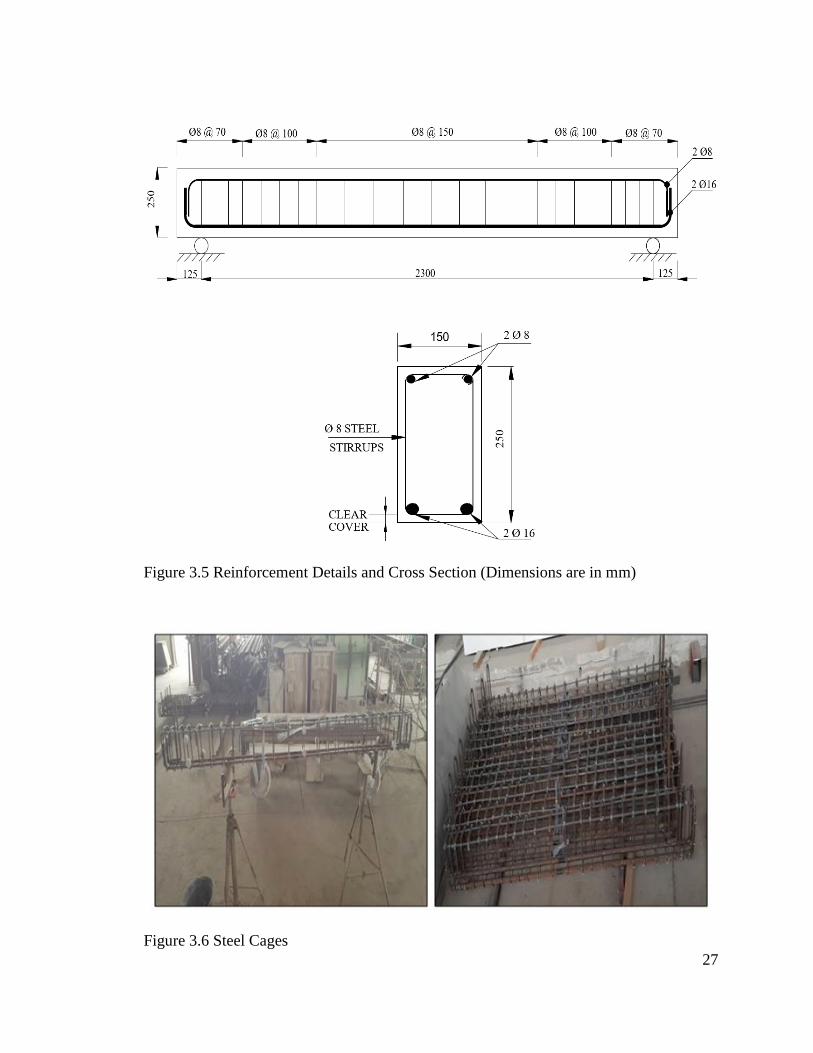
27
Figure 3.5 Reinforcement Details and Cross Section (Dimensions are in mm)
Figure 3.6 Steel Cages
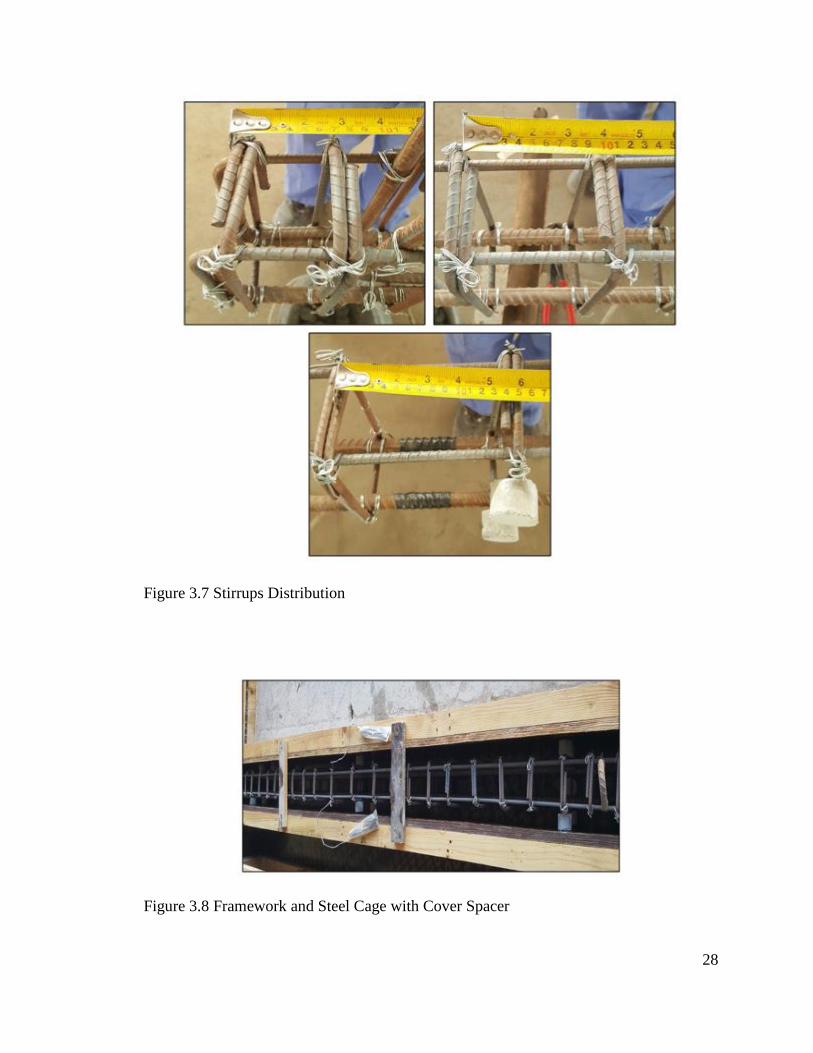
28
Figure 3.7 Stirrups Distribution
Figure 3.8 Framework and Steel Cage with Cover Spacer
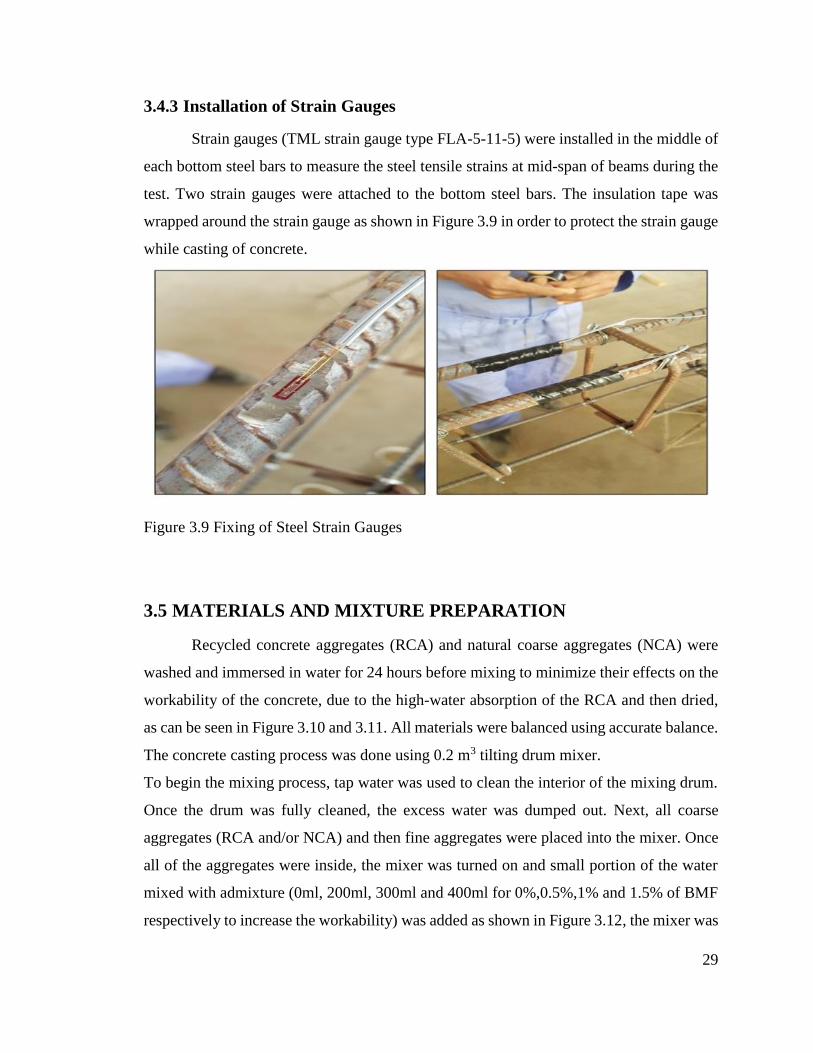
29
3.4.3 Installation of Strain Gauges
Strain gauges (TML strain gauge type FLA-5-11-5) were installed in the middle of
each bottom steel bars to measure the steel tensile strains at mid-span of beams during the
test. Two strain gauges were attached to the bottom steel bars. The insulation tape was
wrapped around the strain gauge as shown in Figure 3.9 in order to protect the strain gauge
while casting of concrete.
Figure 3.9 Fixing of Steel Strain Gauges
3.5 MATERIALS AND MIXTURE PREPARATION
Recycled concrete aggregates (RCA) and natural coarse aggregates (NCA) were
washed and immersed in water for 24 hours before mixing to minimize their effects on the
workability of the concrete, due to the high-water absorption of the RCA and then dried,
as can be seen in Figure 3.10 and 3.11. All materials were balanced using accurate balance.
The concrete casting process was done using 0.2 m3 tilting drum mixer.
To begin the mixing process, tap water was used to clean the interior of the mixing drum.
Once the drum was fully cleaned, the excess water was dumped out. Next, all coarse
aggregates (RCA and/or NCA) and then fine aggregates were placed into the mixer. Once
all of the aggregates were inside, the mixer was turned on and small portion of the water
mixed with admixture (0ml, 200ml, 300ml and 400ml for 0%,0.5%,1% and 1.5% of BMF
respectively to increase the workability) was added as shown in Figure 3.12, the mixer was
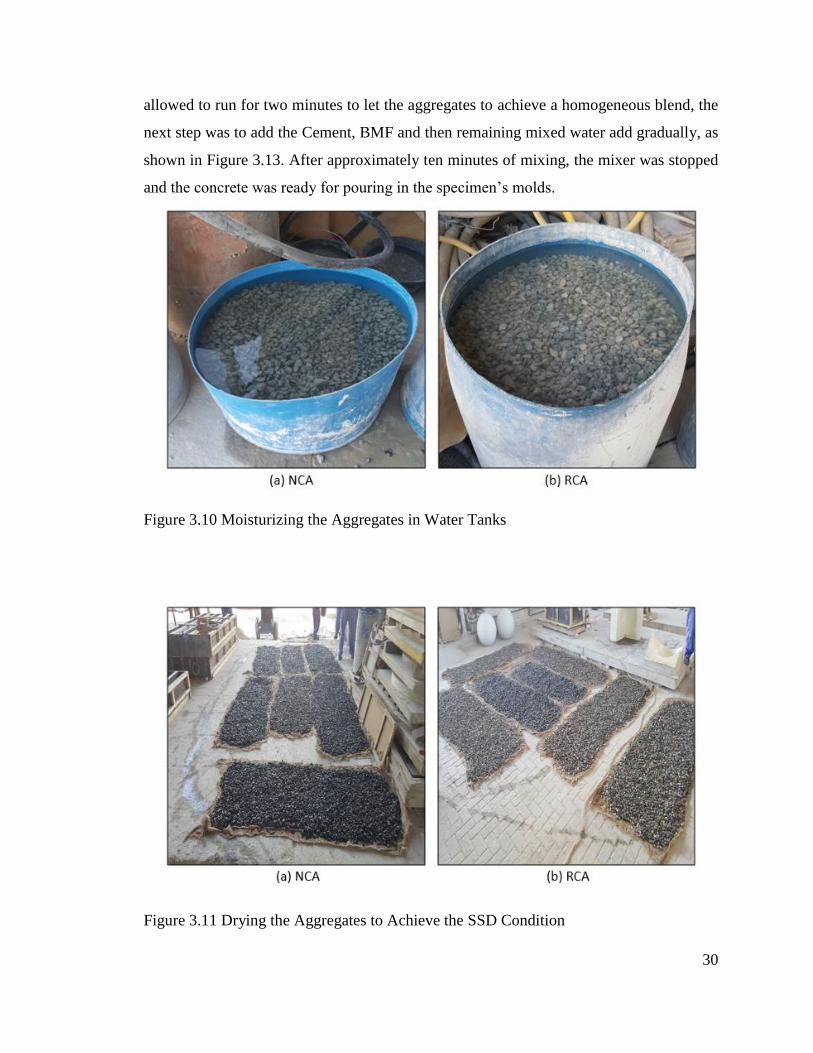
30
allowed to run for two minutes to let the aggregates to achieve a homogeneous blend, the
next step was to add the Cement, BMF and then remaining mixed water add gradually, as
shown in Figure 3.13. After approximately ten minutes of mixing, the mixer was stopped
and the concrete was ready for pouring in the specimen’s molds.
Figure 3.10 Moisturizing the Aggregates in Water Tanks
Figure 3.11 Drying the Aggregates to Achieve the SSD Condition
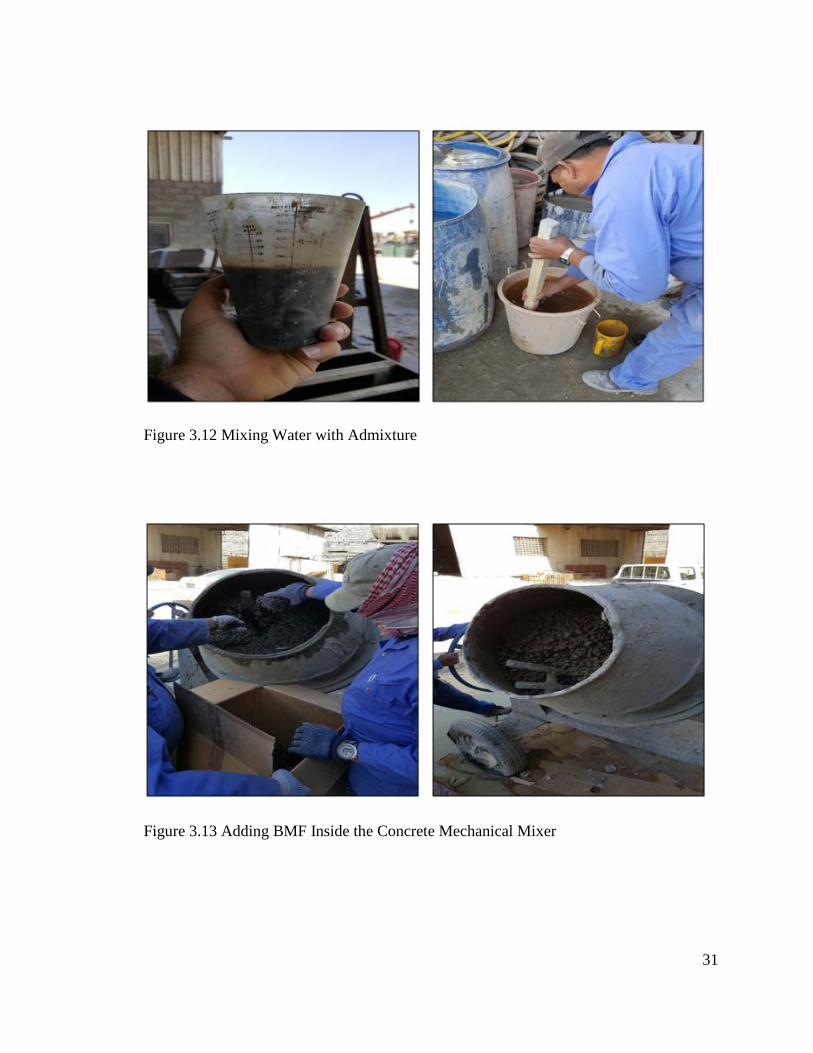
31
Figure 3.12 Mixing Water with Admixture
Figure 3.13 Adding BMF Inside the Concrete Mechanical Mixer

32
3.6 CASTING OF TEST SPECIMENS
The steel cages were placed into the formwork and coded as per concrete design
mix, as seen in Figure3.14. It was confirmed wires of strain gauges were not damaged
during casting of the concrete. Each beam had a concrete volume of 0.096 m3 and it was
casted in addition to the cylinders and prisms in one batch from the concrete mixer. Before
casting the concrete specimens, the formwork was cleaned by compressed air to make sure
that there was no dust. Then a brush was used to oiling the inner surface of formwork with
two perpendicular coats to prevent any contact between the concrete and the formwork.
Then the formwork was filled with concrete in two layers, each layer was compacted
properly using electrical vibrator to avoid having any air bubbles inside the concrete and
achieve full compaction and then the beam’s top surface was finished accurately. At the
same time three cylinders and three prisms were casted for each beam mixture for
compressive strength and tensile strength tests, respectively as shown in Figure3.15 The
concrete casting process took about one week for all specimens. The BMF were placed in
the concrete mix during casting at the assigned volume fractions. The BMF were dispersed
in both the compression and the tension zones of the beam specimens. Physical inspection
of the fresh concrete showed that satisfactory workability was achieved with the addition
of BMF for all samples except sample “A13”. The BMF was found to be uniformly
distributed within the concrete for all samples except sample “A13”. That is because
sample “A13” was the first casted one with a higher percentage of BMF (1.5%), which
resulted in having balling and segregation in that sample. However, a modified mixing
procedure were used in casting samples (A14 to A16), which satisfied the workability
requirements.

33
Figure 3.14 Coded Beam Ready for Casting
Figure 3.15 Casting of the Concrete Beams

34
3.6.1 Curing of Test Specimens
The specimens were coded and de-shuttered 24 hours after concrete casting when
they had reached sufficient strength to carry their own weight. Curing is the process in
which the concrete is protected from loss of moisture and kept within a reasonable
temperature range. Tap water was used to cured all 16 beams three times per day for 28
days under shaded area and covered by wet burlap sacks in order to achieve the required
compressive strength of concrete, as can be seen in Figure3.16. All cylinders and prisms
were immersed in water tank for 28 days, and then kept in shaded area before the test day,
as shown in Figure3.17.
Figure 3.16 Curing of Beam Specimens
Figure 3.17 Curing of Concrete Cylinders and Prisms
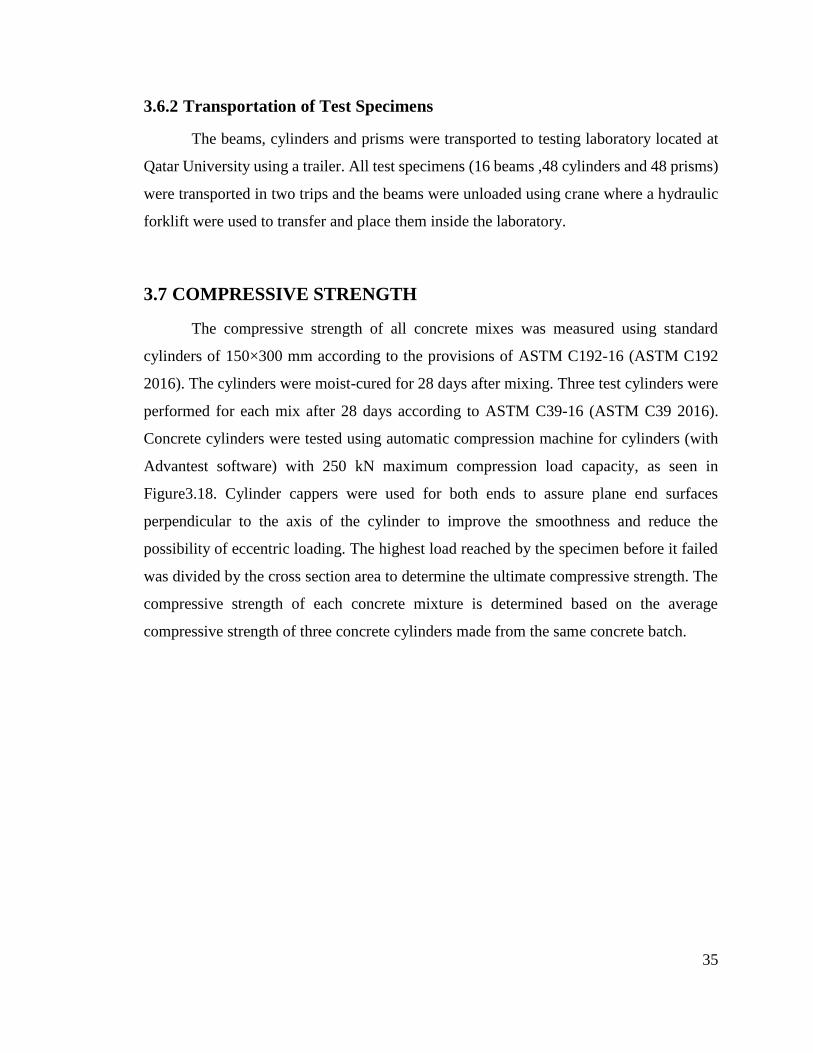
35
3.6.2 Transportation of Test Specimens
The beams, cylinders and prisms were transported to testing laboratory located at
Qatar University using a trailer. All test specimens (16 beams ,48 cylinders and 48 prisms)
were transported in two trips and the beams were unloaded using crane where a hydraulic
forklift were used to transfer and place them inside the laboratory.
3.7 COMPRESSIVE STRENGTH
The compressive strength of all concrete mixes was measured using standard
cylinders of 150×300 mm according to the provisions of ASTM C192-16 (ASTM C192
2016). The cylinders were moist-cured for 28 days after mixing. Three test cylinders were
performed for each mix after 28 days according to ASTM C39-16 (ASTM C39 2016).
Concrete cylinders were tested using automatic compression machine for cylinders (with
Advantest software) with 250 kN maximum compression load capacity, as seen in
Figure3.18. Cylinder cappers were used for both ends to assure plane end surfaces
perpendicular to the axis of the cylinder to improve the smoothness and reduce the
possibility of eccentric loading. The highest load reached by the specimen before it failed
was divided by the cross section area to determine the ultimate compressive strength. The
compressive strength of each concrete mixture is determined based on the average
compressive strength of three concrete cylinders made from the same concrete batch.
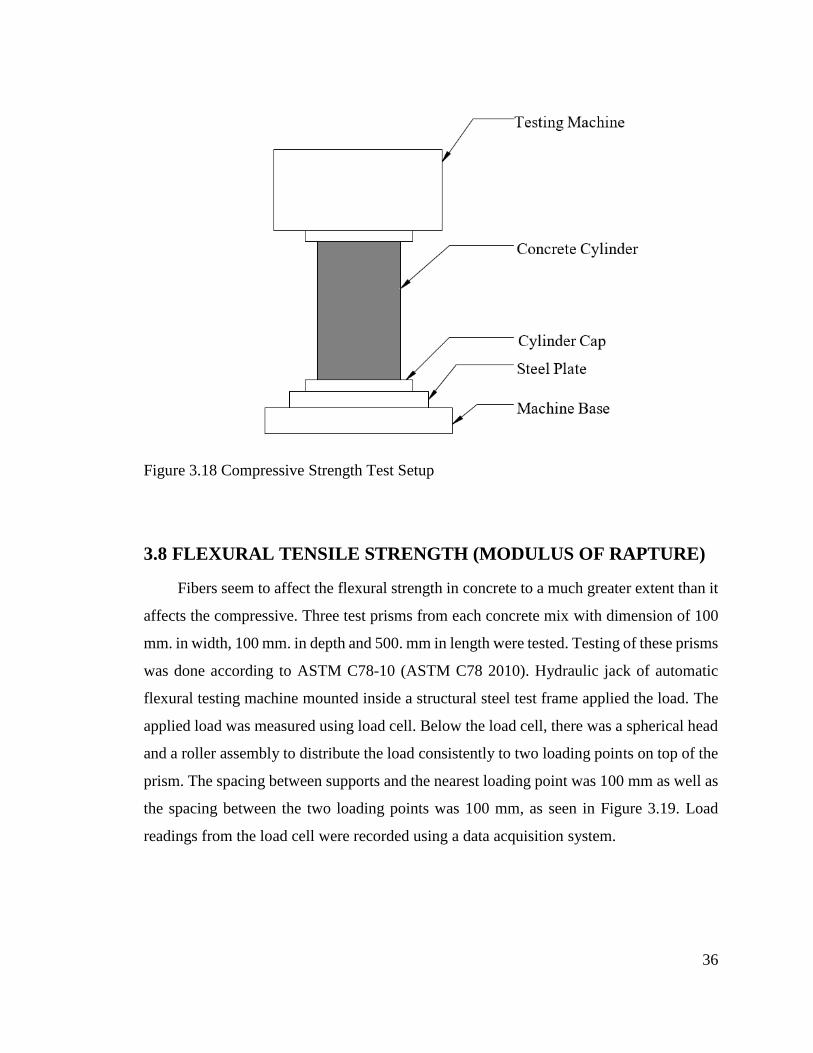
36
Figure 3.18 Compressive Strength Test Setup
3.8 FLEXURAL TENSILE STRENGTH (MODULUS OF RAPTURE)
Fibers seem to affect the flexural strength in concrete to a much greater extent than it
affects the compressive. Three test prisms from each concrete mix with dimension of 100
mm. in width, 100 mm. in depth and 500. mm in length were tested. Testing of these prisms
was done according to ASTM C78-10 (ASTM C78 2010). Hydraulic jack of automatic
flexural testing machine mounted inside a structural steel test frame applied the load. The
applied load was measured using load cell. Below the load cell, there was a spherical head
and a roller assembly to distribute the load consistently to two loading points on top of the
prism. The spacing between supports and the nearest loading point was 100 mm as well as
the spacing between the two loading points was 100 mm, as seen in Figure 3.19. Load
readings from the load cell were recorded using a data acquisition system.
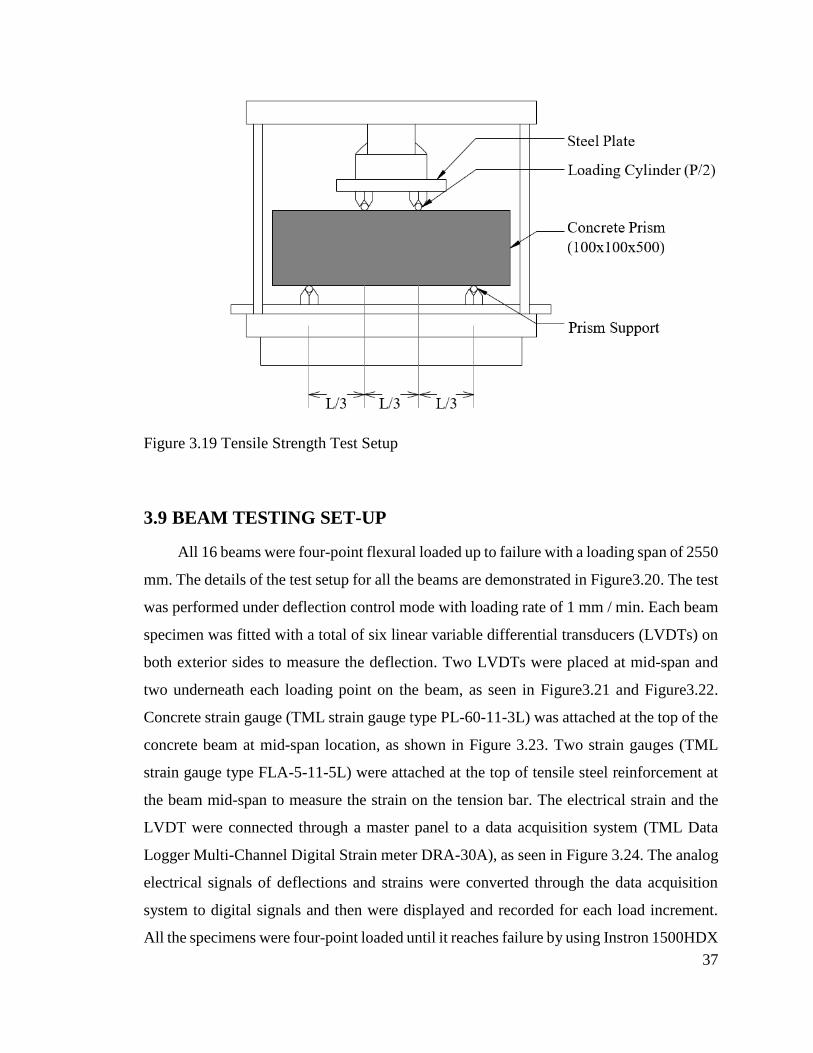
37
Figure 3.19 Tensile Strength Test Setup
3.9 BEAM TESTING SET-UP
All 16 beams were four-point flexural loaded up to failure with a loading span of 2550
mm. The details of the test setup for all the beams are demonstrated in Figure3.20. The test
was performed under deflection control mode with loading rate of 1 mm / min. Each beam
specimen was fitted with a total of six linear variable differential transducers (LVDTs) on
both exterior sides to measure the deflection. Two LVDTs were placed at mid-span and
two underneath each loading point on the beam, as seen in Figure3.21 and Figure3.22.
Concrete strain gauge (TML strain gauge type PL-60-11-3L) was attached at the top of the
concrete beam at mid-span location, as shown in Figure 3.23. Two strain gauges (TML
strain gauge type FLA-5-11-5L) were attached at the top of tensile steel reinforcement at
the beam mid-span to measure the strain on the tension bar. The electrical strain and the
LVDT were connected through a master panel to a data acquisition system (TML Data
Logger Multi-Channel Digital Strain meter DRA-30A), as seen in Figure 3.24. The analog
electrical signals of deflections and strains were converted through the data acquisition
system to digital signals and then were displayed and recorded for each load increment.
All the specimens were four-point loaded until it reaches failure by using Instron 1500HDX
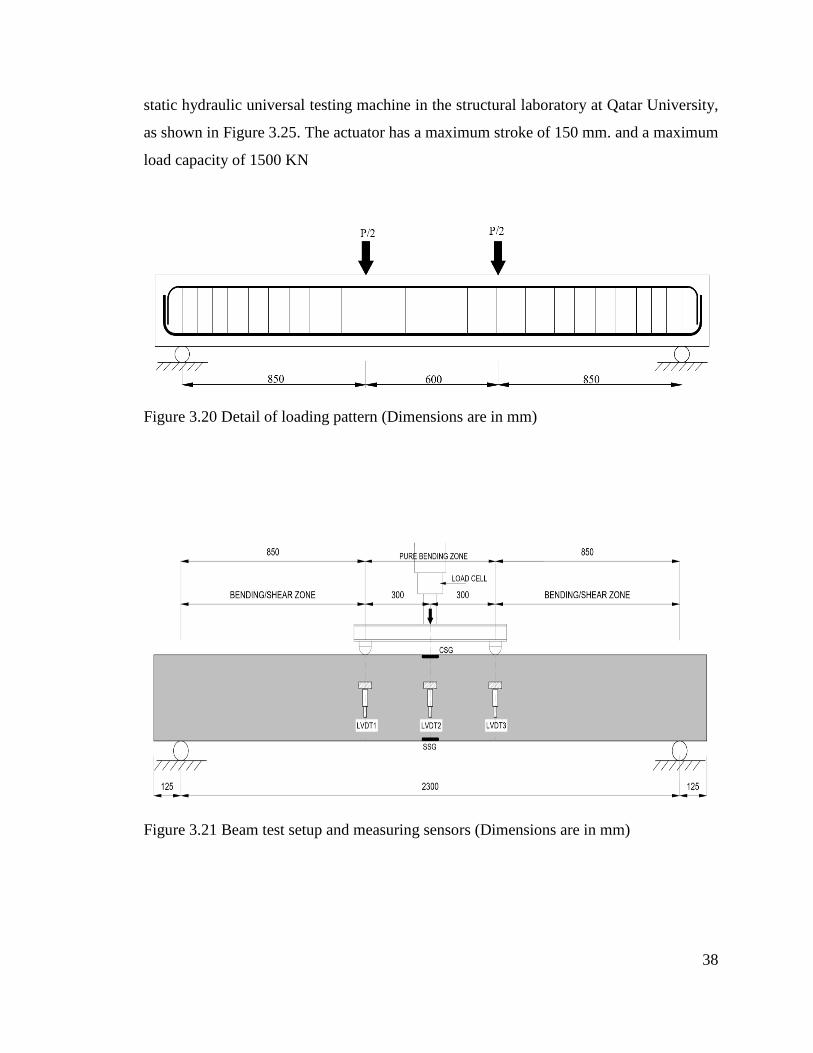
38
static hydraulic universal testing machine in the structural laboratory at Qatar University,
as shown in Figure 3.25. The actuator has a maximum stroke of 150 mm. and a maximum
load capacity of 1500 KN
Figure 3.20 Detail of loading pattern (Dimensions are in mm)
Figure 3.21 Beam test setup and measuring sensors (Dimensions are in mm)
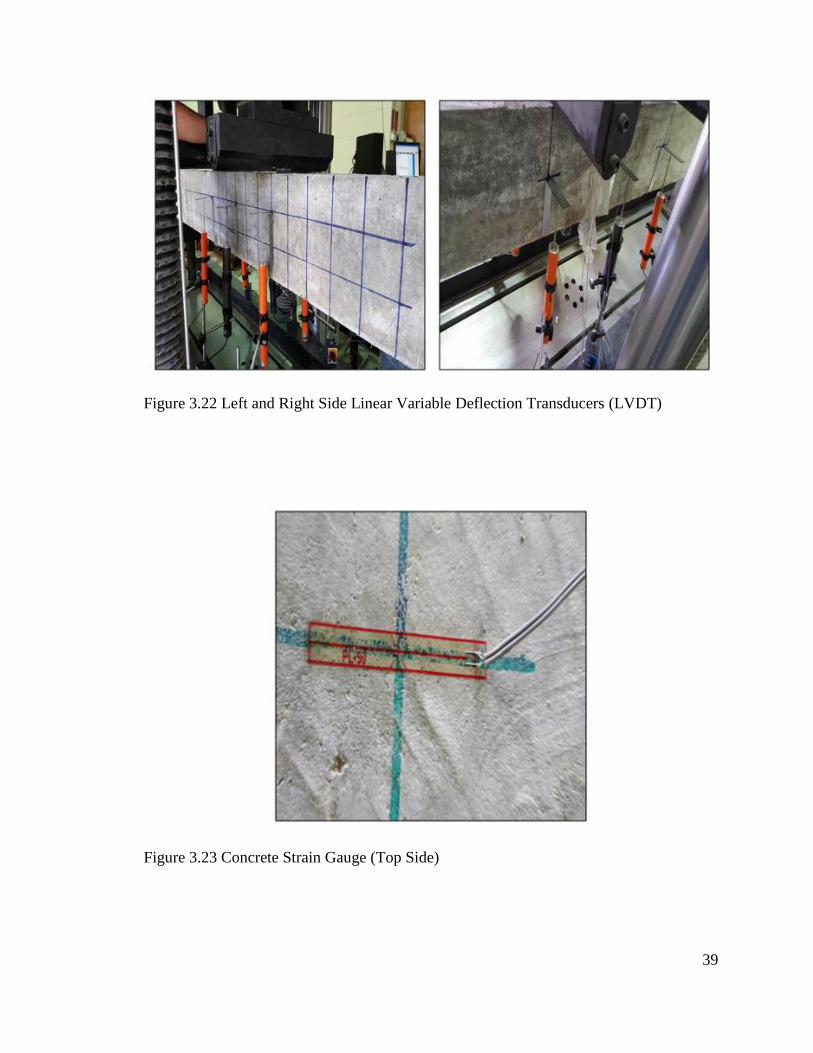
39
Figure 3.22 Left and Right Side Linear Variable Deflection Transducers (LVDT)
Figure 3.23 Concrete Strain Gauge (Top Side)
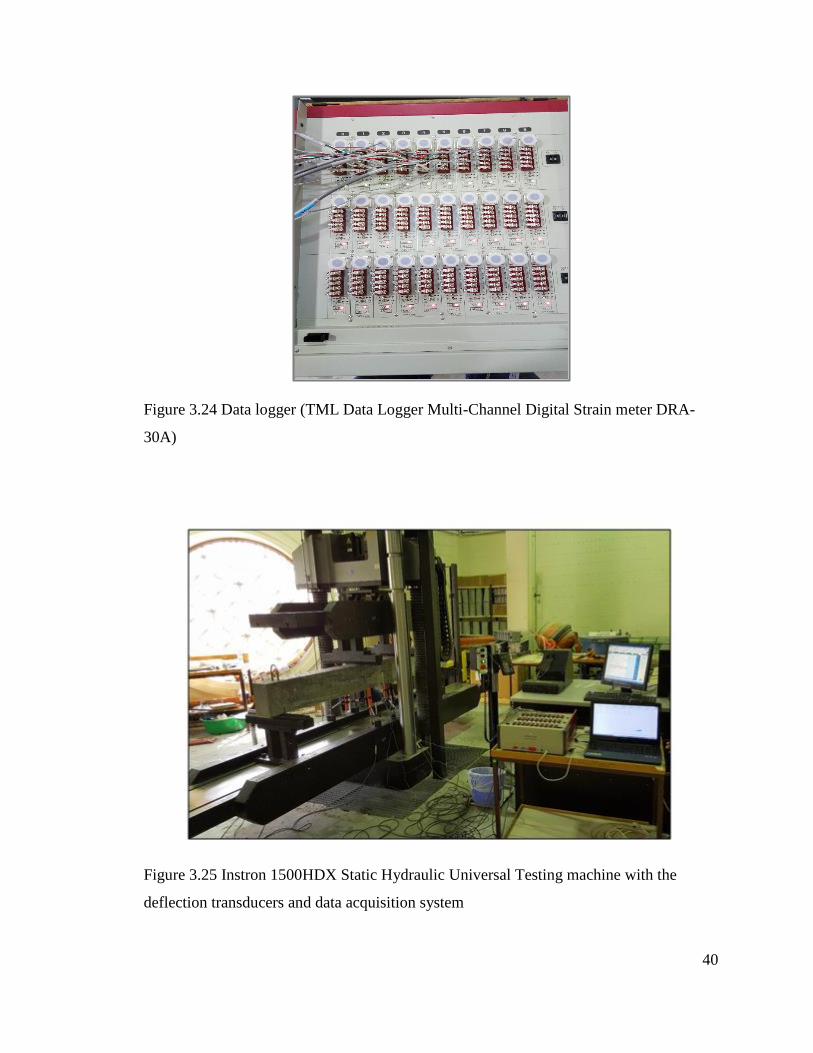
40
Figure 3.24 Data logger (TML Data Logger Multi-Channel Digital Strain meter DRA-
30A)
Figure 3.25 Instron 1500HDX Static Hydraulic Universal Testing machine with the
deflection transducers and data acquisition system
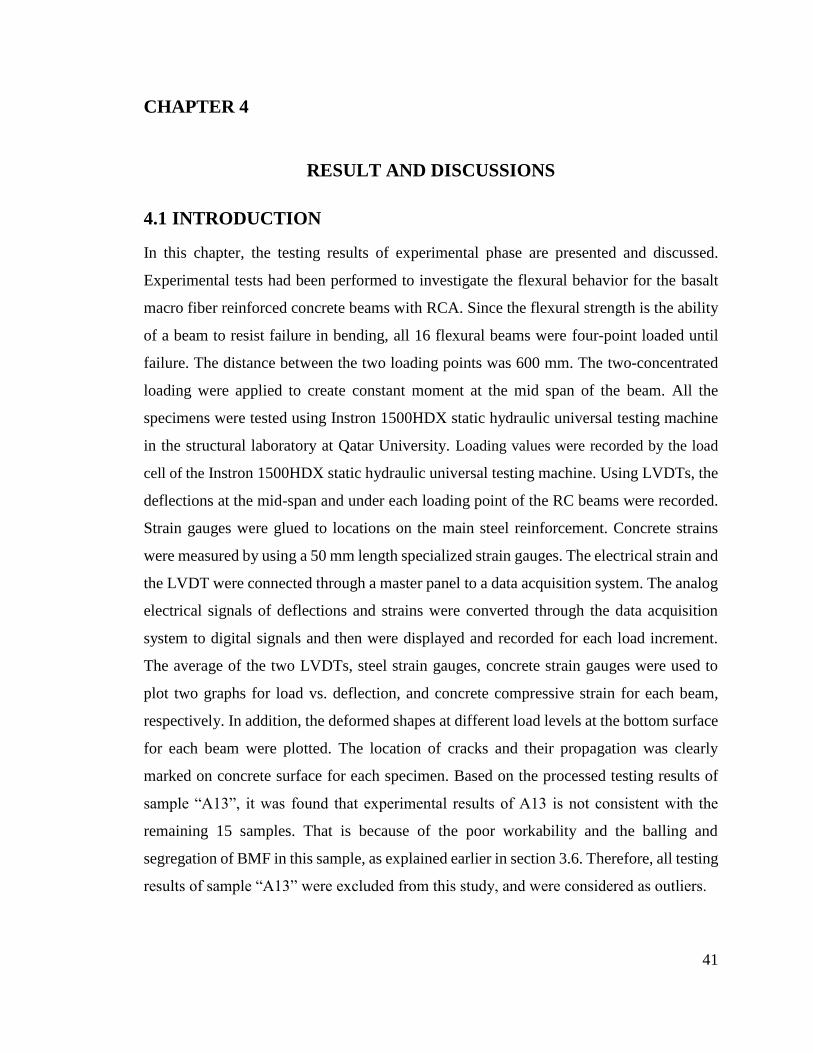
41
CHAPTER 4
RESULT AND DISCUSSIONS
4.1 INTRODUCTION
In this chapter, the testing results of experimental phase are presented and discussed.
Experimental tests had been performed to investigate the flexural behavior for the basalt
macro fiber reinforced concrete beams with RCA. Since the flexural strength is the ability
of a beam to resist failure in bending, all 16 flexural beams were four-point loaded until
failure. The distance between the two loading points was 600 mm. The two-concentrated
loading were applied to create constant moment at the mid span of the beam. All the
specimens were tested using Instron 1500HDX static hydraulic universal testing machine
in the structural laboratory at Qatar University. Loading values were recorded by the load
cell of the Instron 1500HDX static hydraulic universal testing machine. Using LVDTs, the
deflections at the mid-span and under each loading point of the RC beams were recorded.
Strain gauges were glued to locations on the main steel reinforcement. Concrete strains
were measured by using a 50 mm length specialized strain gauges. The electrical strain and
the LVDT were connected through a master panel to a data acquisition system. The analog
electrical signals of deflections and strains were converted through the data acquisition
system to digital signals and then were displayed and recorded for each load increment.
The average of the two LVDTs, steel strain gauges, concrete strain gauges were used to
plot two graphs for load vs. deflection, and concrete compressive strain for each beam,
respectively. In addition, the deformed shapes at different load levels at the bottom surface
for each beam were plotted. The location of cracks and their propagation was clearly
marked on concrete surface for each specimen. Based on the processed testing results of
sample “A13”, it was found that experimental results of A13 is not consistent with the
remaining 15 samples. That is because of the poor workability and the balling and
segregation of BMF in this sample, as explained earlier in section 3.6. Therefore, all testing
results of sample “A13” were excluded from this study, and were considered as outliers.
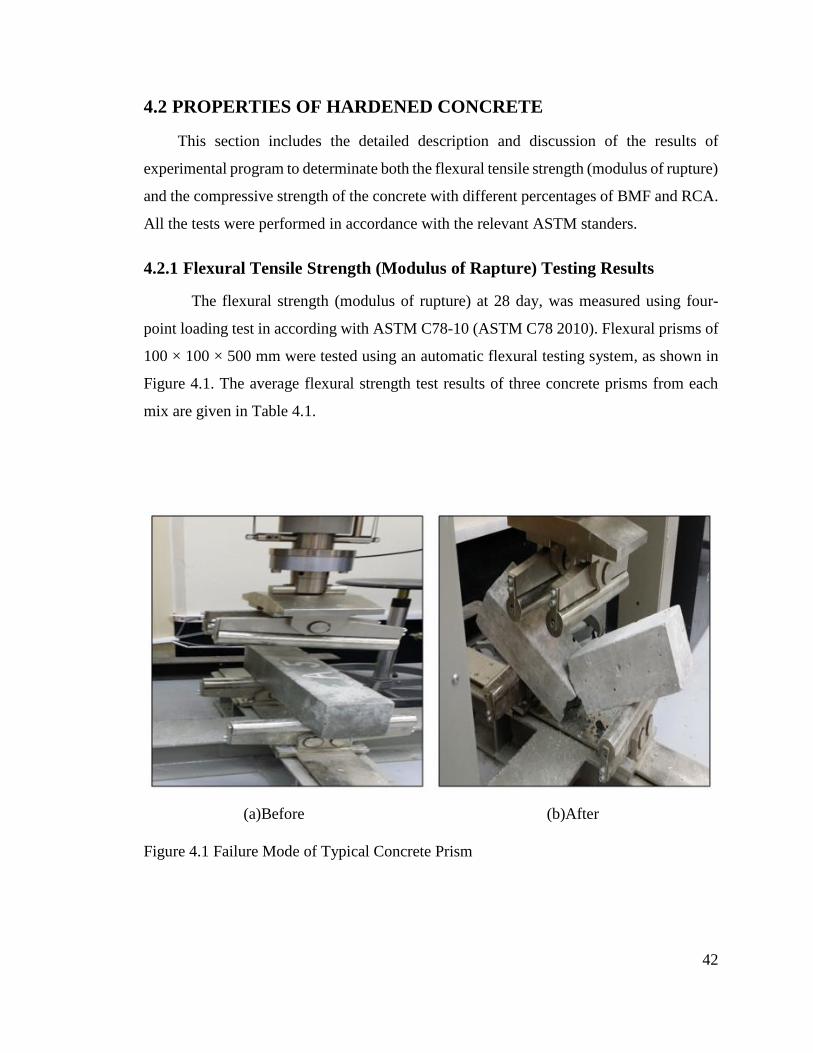
42
4.2 PROPERTIES OF HARDENED CONCRETE
This section includes the detailed description and discussion of the results of
experimental program to determinate both the flexural tensile strength (modulus of rupture)
and the compressive strength of the concrete with different percentages of BMF and RCA.
All the tests were performed in accordance with the relevant ASTM standers.
4.2.1 Flexural Tensile Strength (Modulus of Rapture) Testing Results
The flexural strength (modulus of rupture) at 28 day, was measured using four-
point loading test in according with ASTM C78-10 (ASTM C78 2010). Flexural prisms of
100 × 100 × 500 mm were tested using an automatic flexural testing system, as shown in
Figure 4.1. The average flexural strength test results of three concrete prisms from each
mix are given in Table 4.1.
(a)Before (b)After
Figure 4.1 Failure Mode of Typical Concrete Prism
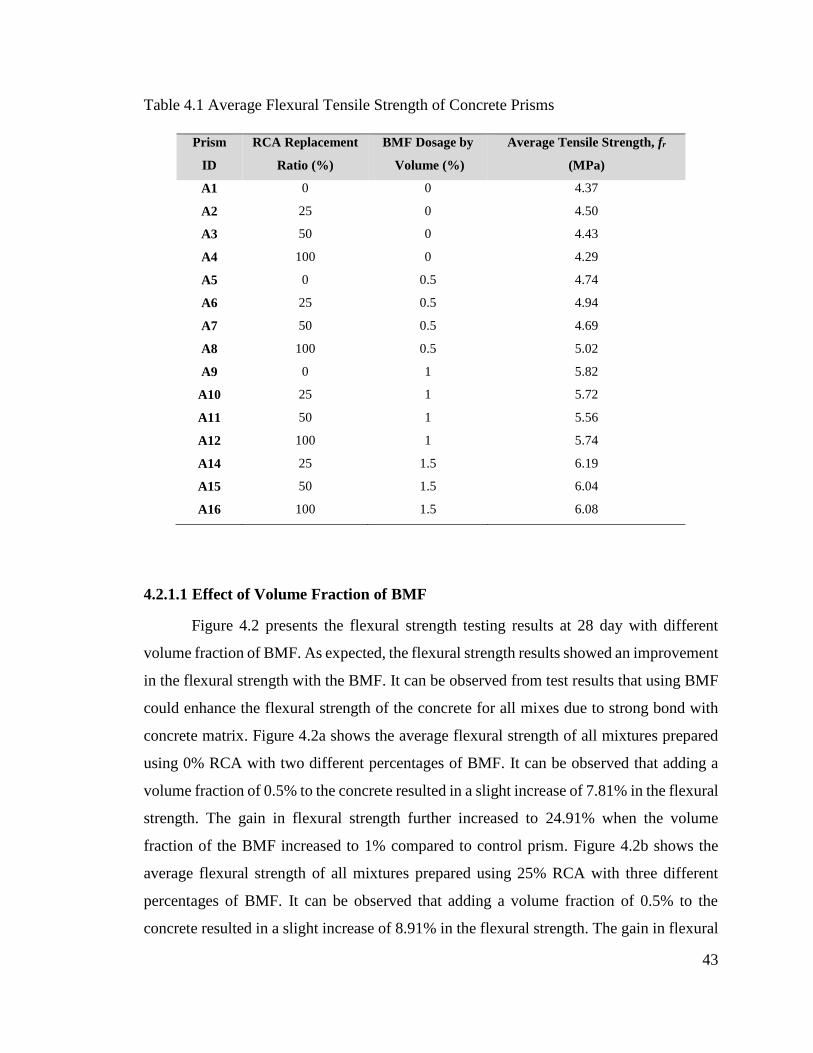
43
Table 4.1 Average Flexural Tensile Strength of Concrete Prisms
Prism
ID
RCA Replacement
Ratio (%)
BMF Dosage by
Volume (%)
Average Tensile Strength, fr
(MPa)
A1 0 0 4.37
A2 25 0 4.50
A3 50 0 4.43
A4 100 0 4.29
A5 0 0.5 4.74
A6 25 0.5 4.94
A7 50 0.5 4.69
A8 100 0.5 5.02
A9 0 1 5.82
A10 25 1 5.72
A11 50 1 5.56
A12 100 1 5.74
A14 25 1.5 6.19
A15 50 1.5 6.04
A16 100 1.5 6.08
4.2.1.1 Effect of Volume Fraction of BMF
Figure 4.2 presents the flexural strength testing results at 28 day with different
volume fraction of BMF. As expected, the flexural strength results showed an improvement
in the flexural strength with the BMF. It can be observed from test results that using BMF
could enhance the flexural strength of the concrete for all mixes due to strong bond with
concrete matrix. Figure 4.2a shows the average flexural strength of all mixtures prepared
using 0% RCA with two different percentages of BMF. It can be observed that adding a
volume fraction of 0.5% to the concrete resulted in a slight increase of 7.81% in the flexural
strength. The gain in flexural strength further increased to 24.91% when the volume
fraction of the BMF increased to 1% compared to control prism. Figure 4.2b shows the
average flexural strength of all mixtures prepared using 25% RCA with three different
percentages of BMF. It can be observed that adding a volume fraction of 0.5% to the
concrete resulted in a slight increase of 8.91% in the flexural strength. The gain in flexural

44
strength further increased to 20.61%, and 27.3% when the volume fraction of the BMF
increased to 1%. and 1.5% respectively compared to control prism. Figure 4.2c shows the
average flexural strength of all mixtures prepared using 50% RCA with three different
percentages of BMF. It can be observed that adding a volume fraction of 0.5% to the
concrete resulted in a slight increase of 5.54% in the flexural strength. The gain in flexural
strength further increased to 20.32%, and 26.66% when the volume fraction of the BMF
increased to 1%. and 1.5% respectively compared to control prism. Figure 4.2d shows the
average flexural strength of all mixtures prepared using 100% RCA with three different
percentages of BMF. It can be observed that adding a volume fraction of 0.5% to the
concrete resulted in a slight increase of 14.54% in the flexural strength. The gain in flexural
strength further increased to 25.3%, and 29.44% when the volume fraction of the BMF
increased to 1%. and 1.5% respectively compared to control prism.
(a) 0% RCA (b) 25% RCA
4.374.74
5.82
0
1
2
3
4
5
6
7
0% 0.50% 1%
Fle
xura
l Str
en
gth
(M
Pa)
Volume Fraction of BMF, %
0% RCA
4.5
4.94
5.72
6.19
0
1
2
3
4
5
6
7
0.0% 0.5% 1.0% 1.5%
Fle
xura
l Str
en
gth
(M
Pa)
Volume Fraction of BMF, %
25% RCA
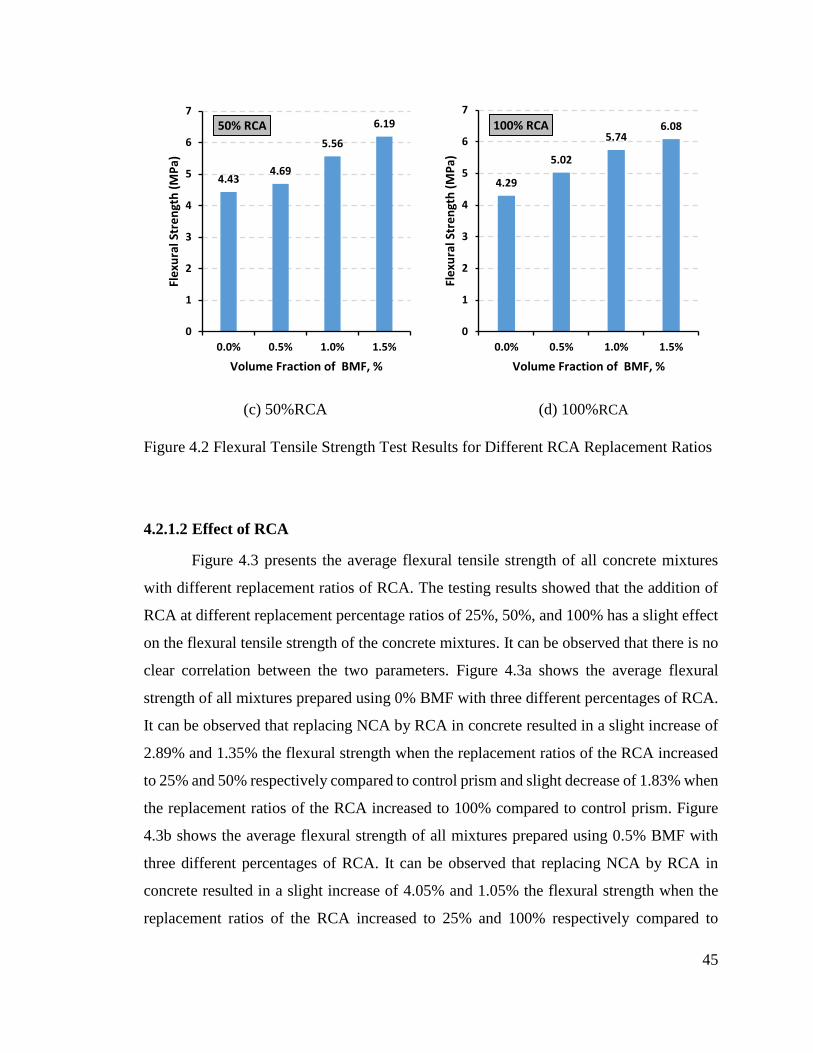
45
(c) 50%RCA (d) 100%RCA
Figure 4.2 Flexural Tensile Strength Test Results for Different RCA Replacement Ratios
4.2.1.2 Effect of RCA
Figure 4.3 presents the average flexural tensile strength of all concrete mixtures
with different replacement ratios of RCA. The testing results showed that the addition of
RCA at different replacement percentage ratios of 25%, 50%, and 100% has a slight effect
on the flexural tensile strength of the concrete mixtures. It can be observed that there is no
clear correlation between the two parameters. Figure 4.3a shows the average flexural
strength of all mixtures prepared using 0% BMF with three different percentages of RCA.
It can be observed that replacing NCA by RCA in concrete resulted in a slight increase of
2.89% and 1.35% the flexural strength when the replacement ratios of the RCA increased
to 25% and 50% respectively compared to control prism and slight decrease of 1.83% when
the replacement ratios of the RCA increased to 100% compared to control prism. Figure
4.3b shows the average flexural strength of all mixtures prepared using 0.5% BMF with
three different percentages of RCA. It can be observed that replacing NCA by RCA in
concrete resulted in a slight increase of 4.05% and 1.05% the flexural strength when the
replacement ratios of the RCA increased to 25% and 100% respectively compared to
4.434.69
5.56
6.19
0
1
2
3
4
5
6
7
0.0% 0.5% 1.0% 1.5%
Fle
xura
l Str
en
gth
(M
Pa)
Volume Fraction of BMF, %
50% RCA
4.29
5.02
5.746.08
0
1
2
3
4
5
6
7
0.0% 0.5% 1.0% 1.5%
Fle
xura
l Str
en
gth
(M
Pa)
Volume Fraction of BMF, %
100% RCA
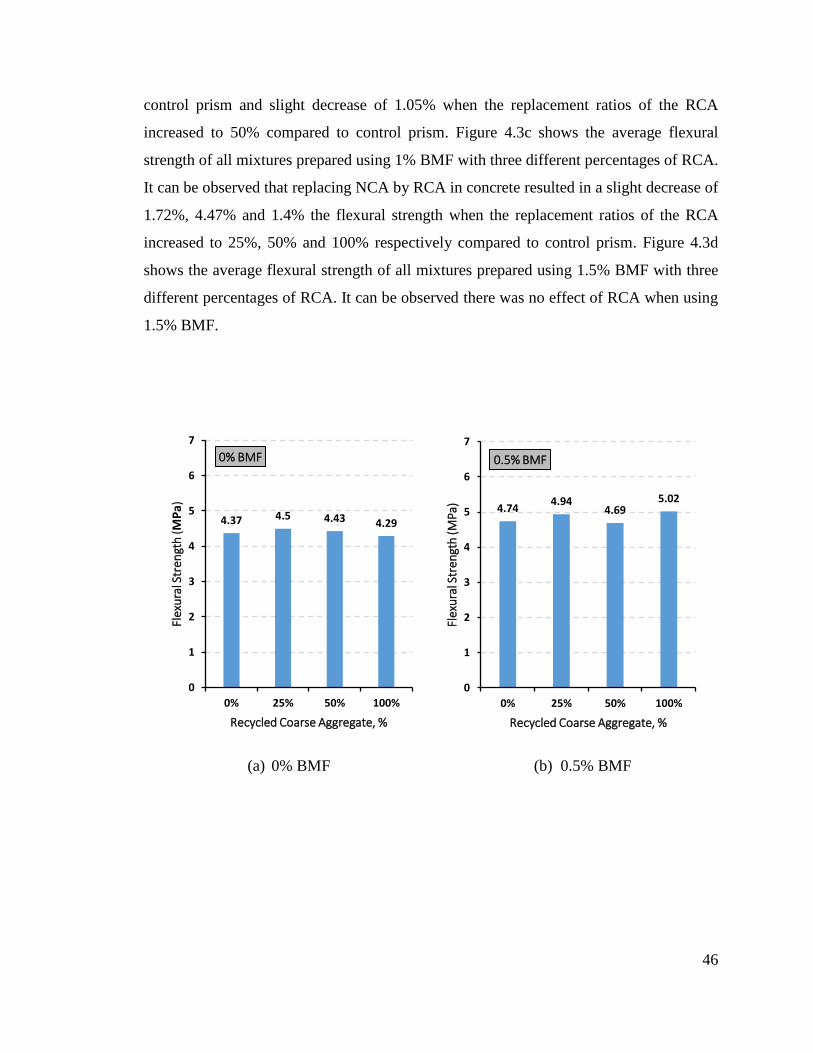
46
control prism and slight decrease of 1.05% when the replacement ratios of the RCA
increased to 50% compared to control prism. Figure 4.3c shows the average flexural
strength of all mixtures prepared using 1% BMF with three different percentages of RCA.
It can be observed that replacing NCA by RCA in concrete resulted in a slight decrease of
1.72%, 4.47% and 1.4% the flexural strength when the replacement ratios of the RCA
increased to 25%, 50% and 100% respectively compared to control prism. Figure 4.3d
shows the average flexural strength of all mixtures prepared using 1.5% BMF with three
different percentages of RCA. It can be observed there was no effect of RCA when using
1.5% BMF.
(a) 0% BMF (b) 0.5% BMF
4.37 4.5 4.43 4.29
0
1
2
3
4
5
6
7
0% 25% 50% 100%
Flex
ura
lStr
engt
h(M
Pa)
Recycled Coarse Aggregate, %
0% BMF
4.744.94
4.695.02
0
1
2
3
4
5
6
7
0% 25% 50% 100%
Flex
ura
l Str
engt
h (M
Pa)
Recycled Coarse Aggregate, %
0.5% BMF
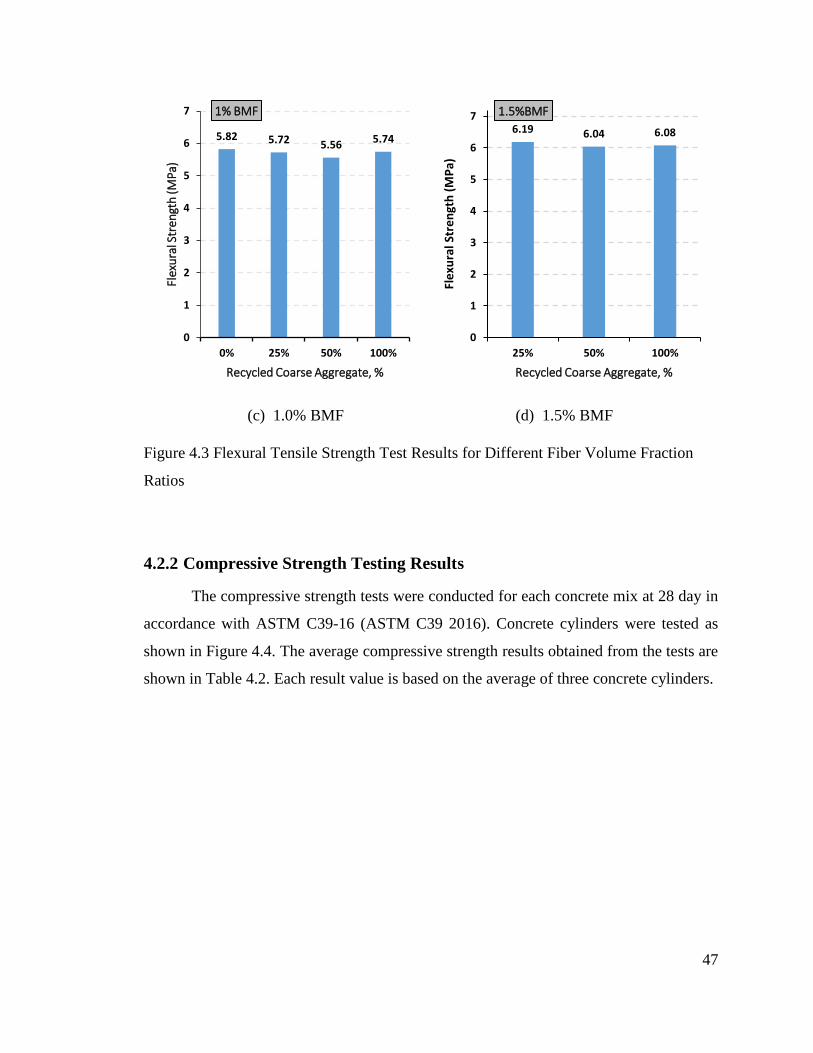
47
(c) 1.0% BMF (d) 1.5% BMF
Figure 4.3 Flexural Tensile Strength Test Results for Different Fiber Volume Fraction
Ratios
4.2.2 Compressive Strength Testing Results
The compressive strength tests were conducted for each concrete mix at 28 day in
accordance with ASTM C39-16 (ASTM C39 2016). Concrete cylinders were tested as
shown in Figure 4.4. The average compressive strength results obtained from the tests are
shown in Table 4.2. Each result value is based on the average of three concrete cylinders.
5.82 5.72 5.56 5.74
0
1
2
3
4
5
6
7
0% 25% 50% 100%
Flex
ura
l Str
engt
h (M
Pa)
Recycled Coarse Aggregate, %
1% BMF
6.19 6.04 6.08
0
1
2
3
4
5
6
7
25% 50% 100%
Fle
xura
l Str
en
gth
(M
Pa)
Recycled Coarse Aggregate, %
1.5%BMF
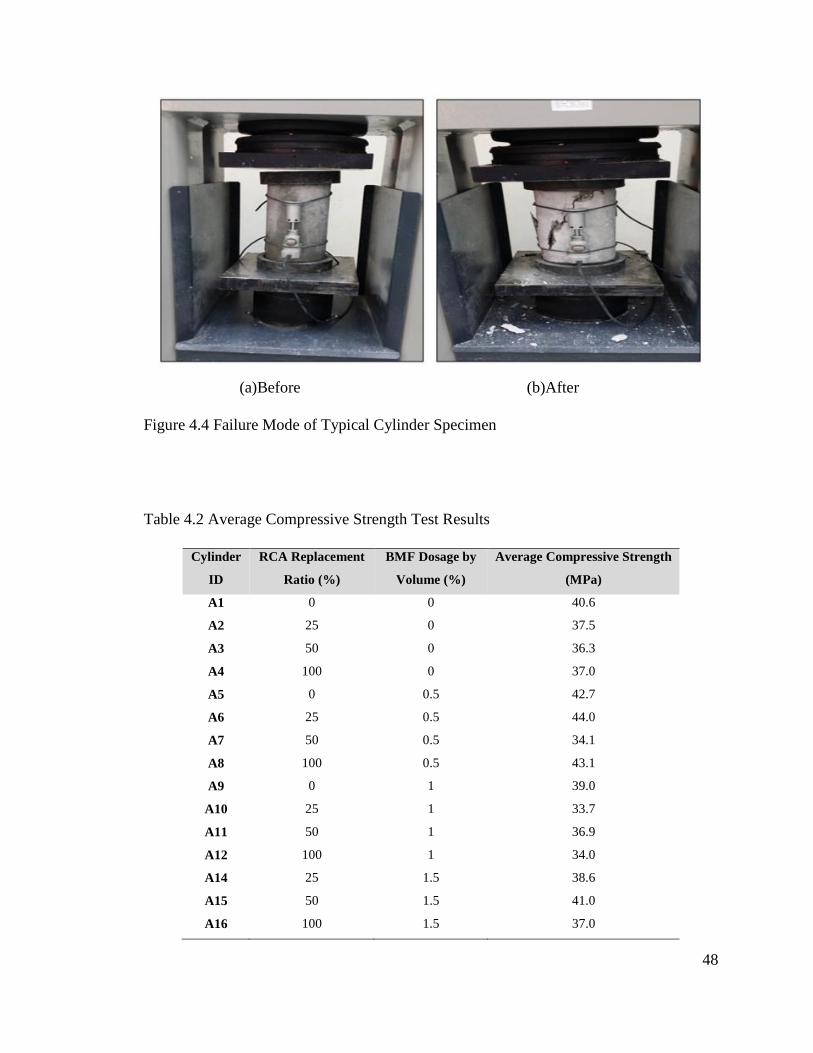
48
(a)Before (b)After
Figure 4.4 Failure Mode of Typical Cylinder Specimen
Table 4.2 Average Compressive Strength Test Results
Cylinder
ID
RCA Replacement
Ratio (%)
BMF Dosage by
Volume (%)
Average Compressive Strength
(MPa)
A1 0 0 40.6
A2 25 0 37.5
A3 50 0 36.3
A4 100 0 37.0
A5 0 0.5 42.7
A6 25 0.5 44.0
A7 50 0.5 34.1
A8 100 0.5 43.1
A9 0 1 39.0
A10 25 1 33.7
A11 50 1 36.9
A12 100 1 34.0
A14 25 1.5 38.6
A15 50 1.5 41.0
A16 100 1.5 37.0
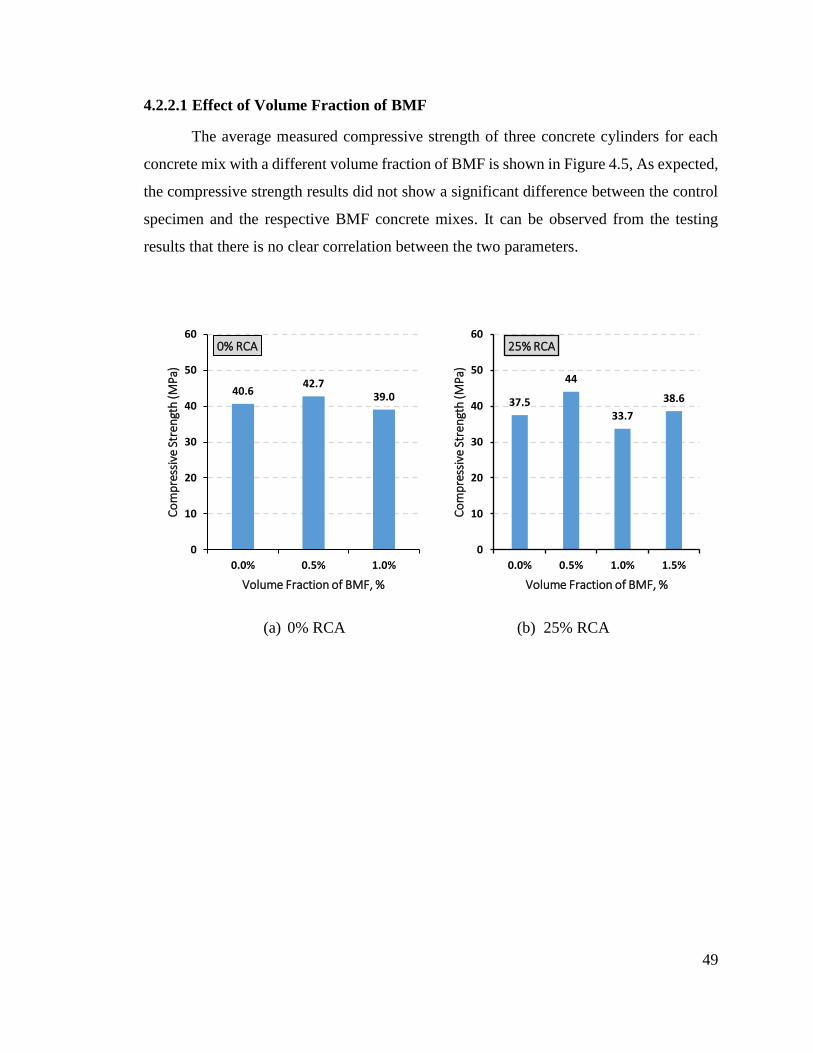
49
4.2.2.1 Effect of Volume Fraction of BMF
The average measured compressive strength of three concrete cylinders for each
concrete mix with a different volume fraction of BMF is shown in Figure 4.5, As expected,
the compressive strength results did not show a significant difference between the control
specimen and the respective BMF concrete mixes. It can be observed from the testing
results that there is no clear correlation between the two parameters.
(a) 0% RCA (b) 25% RCA
40.642.7
39.0
0
10
20
30
40
50
60
0.0% 0.5% 1.0%
Co
mp
ress
ive
Stre
ngt
h (
MP
a)
Volume Fraction of BMF, %
0% RCA
37.5
44
33.7
38.6
0
10
20
30
40
50
60
0.0% 0.5% 1.0% 1.5%
Co
mp
ress
ive
Stre
ngt
h (
MP
a)
Volume Fraction of BMF, %
25% RCA
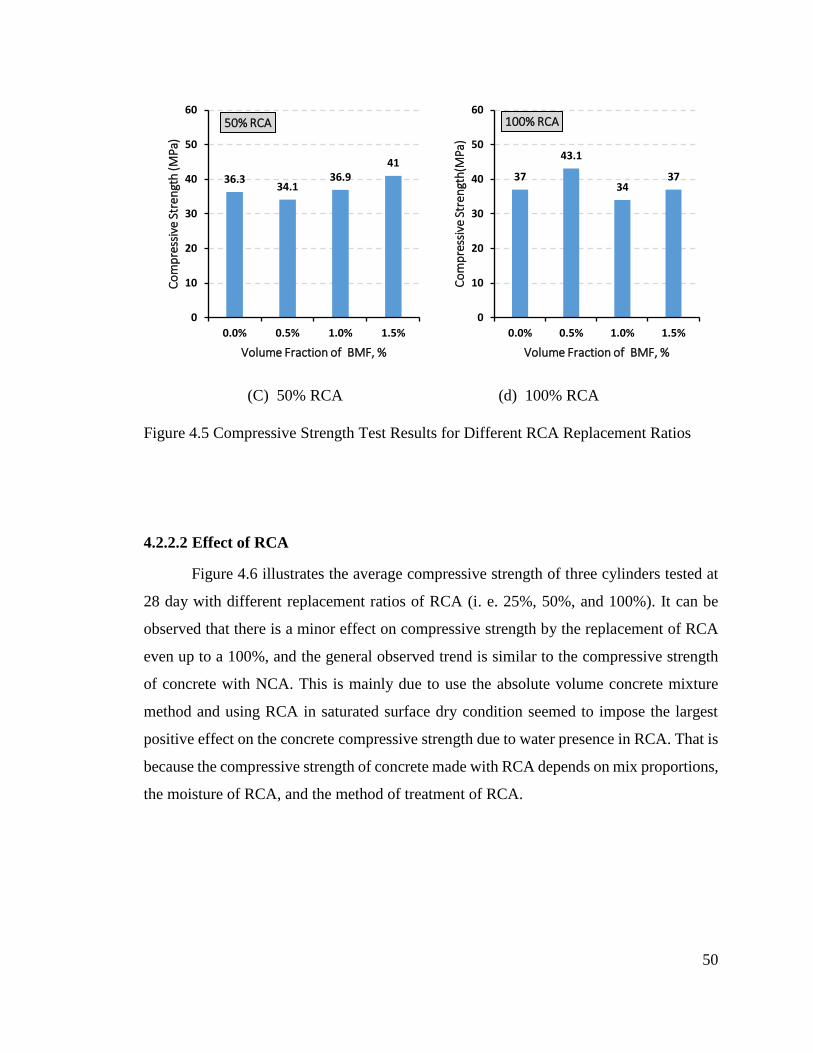
50
(C) 50% RCA (d) 100% RCA
Figure 4.5 Compressive Strength Test Results for Different RCA Replacement Ratios
4.2.2.2 Effect of RCA
Figure 4.6 illustrates the average compressive strength of three cylinders tested at
28 day with different replacement ratios of RCA (i. e. 25%, 50%, and 100%). It can be
observed that there is a minor effect on compressive strength by the replacement of RCA
even up to a 100%, and the general observed trend is similar to the compressive strength
of concrete with NCA. This is mainly due to use the absolute volume concrete mixture
method and using RCA in saturated surface dry condition seemed to impose the largest
positive effect on the concrete compressive strength due to water presence in RCA. That is
because the compressive strength of concrete made with RCA depends on mix proportions,
the moisture of RCA, and the method of treatment of RCA.
36.334.1
36.941
0
10
20
30
40
50
60
0.0% 0.5% 1.0% 1.5%
Co
mp
ress
ive
Stre
ngt
h (
MP
a)
Volume Fraction of BMF, %
50% RCA
37
43.1
3437
0
10
20
30
40
50
60
0.0% 0.5% 1.0% 1.5%
Co
mp
ress
ive
Stre
ngt
h(M
Pa)
Volume Fraction of BMF, %
100% RCA
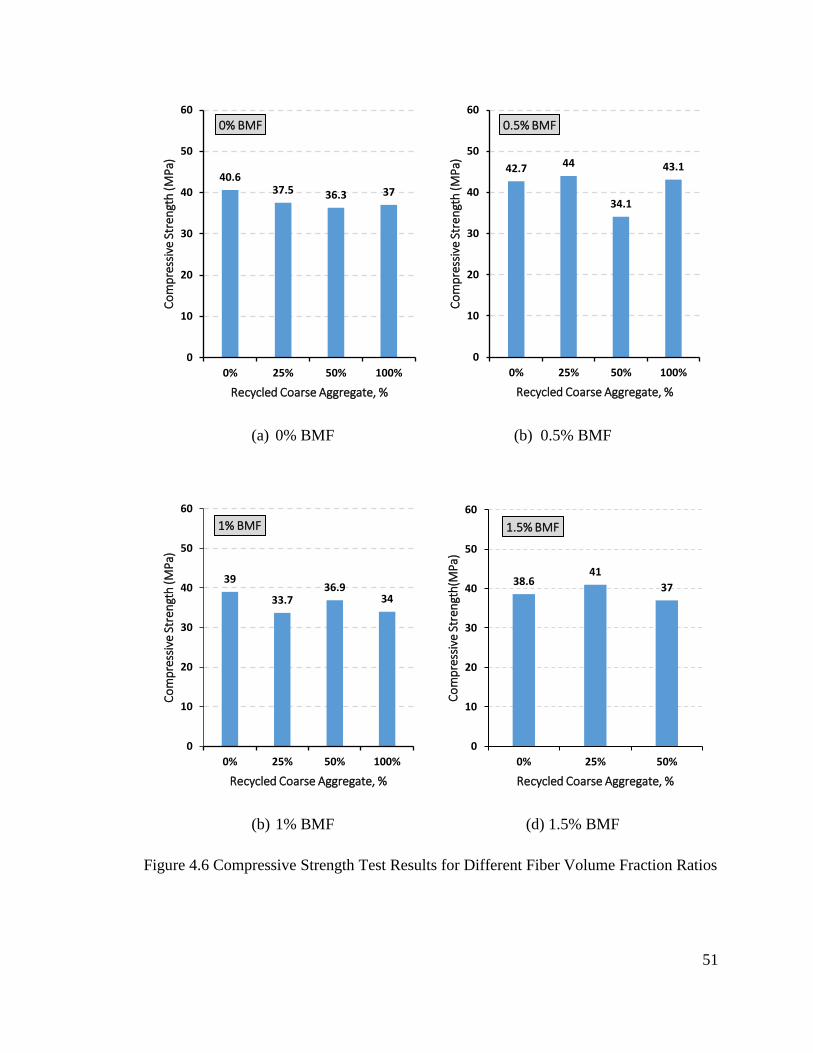
51
(a) 0% BMF (b) 0.5% BMF
(b) 1% BMF (d) 1.5% BMF
Figure 4.6 Compressive Strength Test Results for Different Fiber Volume Fraction Ratios
40.637.5 36.3 37
0
10
20
30
40
50
60
0% 25% 50% 100%
Co
mp
ress
ive
Stre
ngt
h (
MP
a)
Recycled Coarse Aggregate, %
0% BMF
42.7 44
34.1
43.1
0
10
20
30
40
50
60
0% 25% 50% 100%
Co
mp
ress
ive
Stre
ngt
h (
MP
a)
Recycled Coarse Aggregate, %
0.5% BMF
39
33.736.9
34
0
10
20
30
40
50
60
0% 25% 50% 100%
Co
mp
ress
ive
Stre
ngt
h (
MP
a)
Recycled Coarse Aggregate, %
1% BMF
38.641
37
0
10
20
30
40
50
60
0% 25% 50%
Co
mp
ress
ive
Stre
ngt
h(M
Pa)
Recycled Coarse Aggregate, %
1.5% BMF
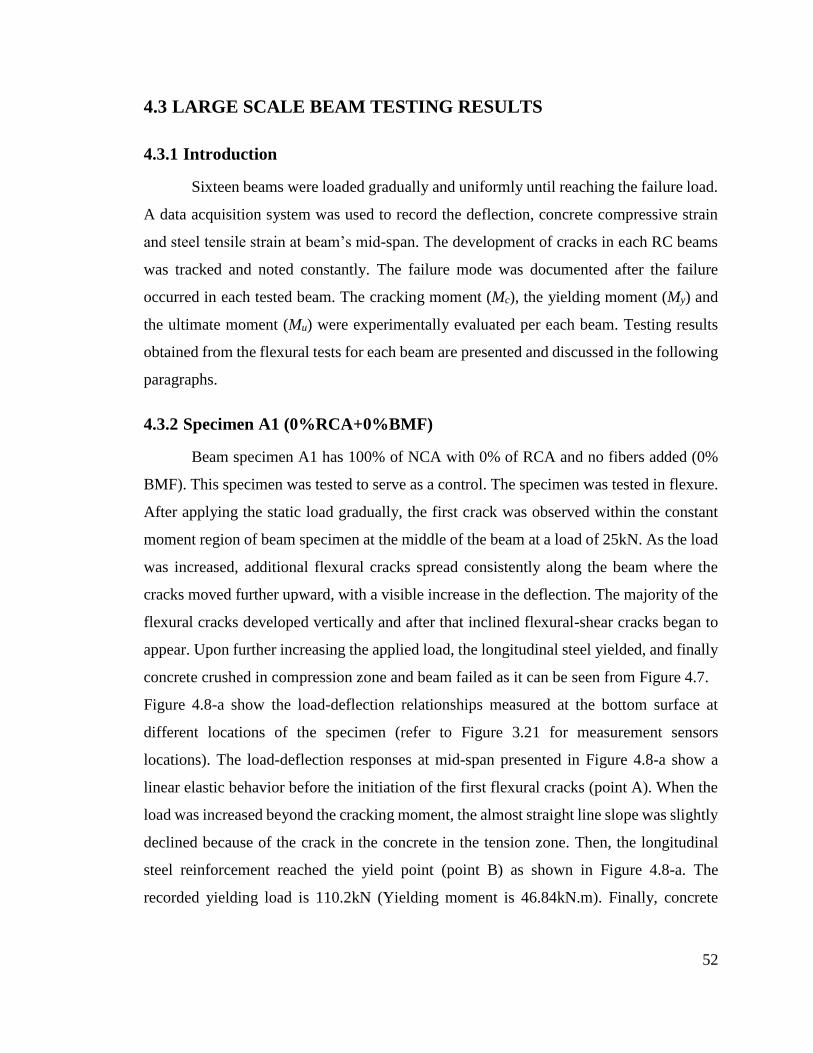
52
4.3 LARGE SCALE BEAM TESTING RESULTS
4.3.1 Introduction
Sixteen beams were loaded gradually and uniformly until reaching the failure load.
A data acquisition system was used to record the deflection, concrete compressive strain
and steel tensile strain at beam’s mid-span. The development of cracks in each RC beams
was tracked and noted constantly. The failure mode was documented after the failure
occurred in each tested beam. The cracking moment (Mc), the yielding moment (My) and
the ultimate moment (Mu) were experimentally evaluated per each beam. Testing results
obtained from the flexural tests for each beam are presented and discussed in the following
paragraphs.
4.3.2 Specimen A1 (0%RCA+0%BMF)
Beam specimen A1 has 100% of NCA with 0% of RCA and no fibers added (0%
BMF). This specimen was tested to serve as a control. The specimen was tested in flexure.
After applying the static load gradually, the first crack was observed within the constant
moment region of beam specimen at the middle of the beam at a load of 25kN. As the load
was increased, additional flexural cracks spread consistently along the beam where the
cracks moved further upward, with a visible increase in the deflection. The majority of the
flexural cracks developed vertically and after that inclined flexural-shear cracks began to
appear. Upon further increasing the applied load, the longitudinal steel yielded, and finally
concrete crushed in compression zone and beam failed as it can be seen from Figure 4.7.
Figure 4.8-a show the load-deflection relationships measured at the bottom surface at
different locations of the specimen (refer to Figure 3.21 for measurement sensors
locations). The load-deflection responses at mid-span presented in Figure 4.8-a show a
linear elastic behavior before the initiation of the first flexural cracks (point A). When the
load was increased beyond the cracking moment, the almost straight line slope was slightly
declined because of the crack in the concrete in the tension zone. Then, the longitudinal
steel reinforcement reached the yield point (point B) as shown in Figure 4.8-a. The
recorded yielding load is 110.2kN (Yielding moment is 46.84kN.m). Finally, concrete

53
crushed in the in compression zone with ultimate load of 113.05kN, and maximum mid-
span deflection of 35 mm.
Figure 4.8-b shows the load-concrete compressive strain relationship measured at top
surface at mid-span of the specimen. The recorded maximum compressive strain was
0.00283.
A deformed shape of the bottom surface of the specimen is shown in Figure 4.9. In this
Figure, the vertical axis represents the vertical downward deflection; therefore, the actual
deformed shapes should be up-side-down. It can be observed in Figure 4.9 that the largest
deflection was observed at the mid-span of the beam.
Figure 4.7 Cracking Pattern of Beam A1
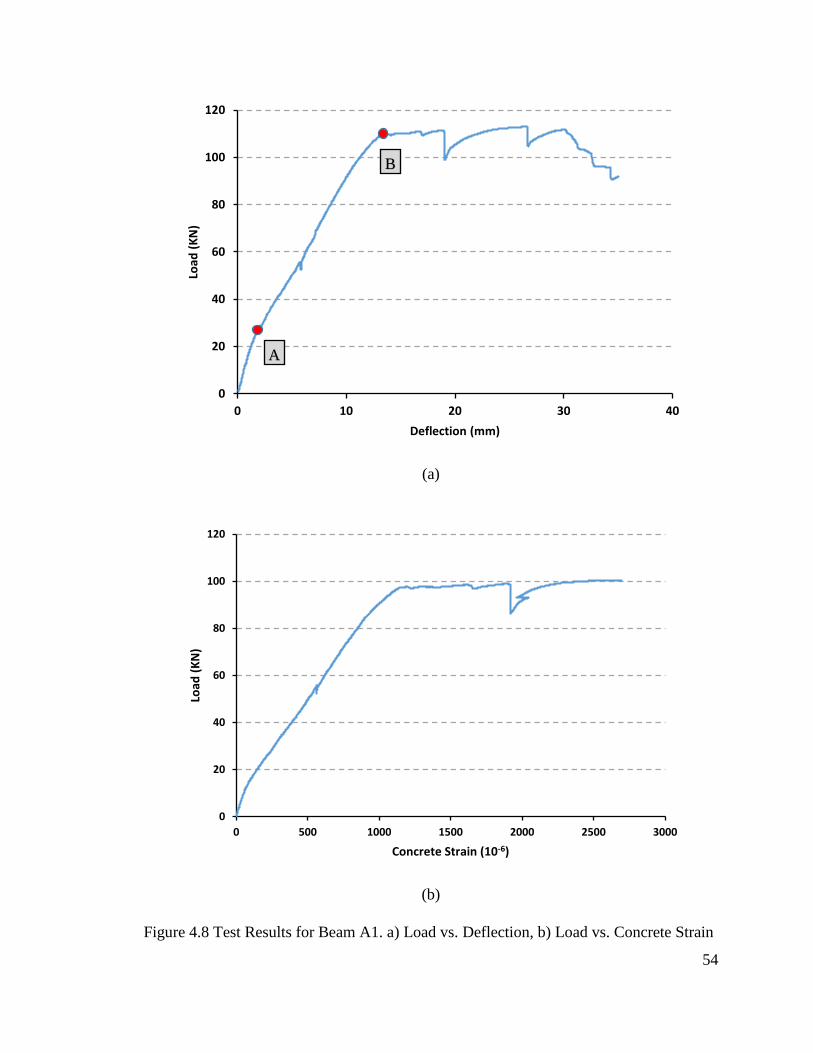
54
(a)
(b)
Figure 4.8 Test Results for Beam A1. a) Load vs. Deflection, b) Load vs. Concrete Strain
0
20
40
60
80
100
120
0 10 20 30 40
Load
(K
N)
Deflection (mm)
A
B
0
20
40
60
80
100
120
0 500 1000 1500 2000 2500 3000
Load
(K
N)
Concrete Strain (10-6)
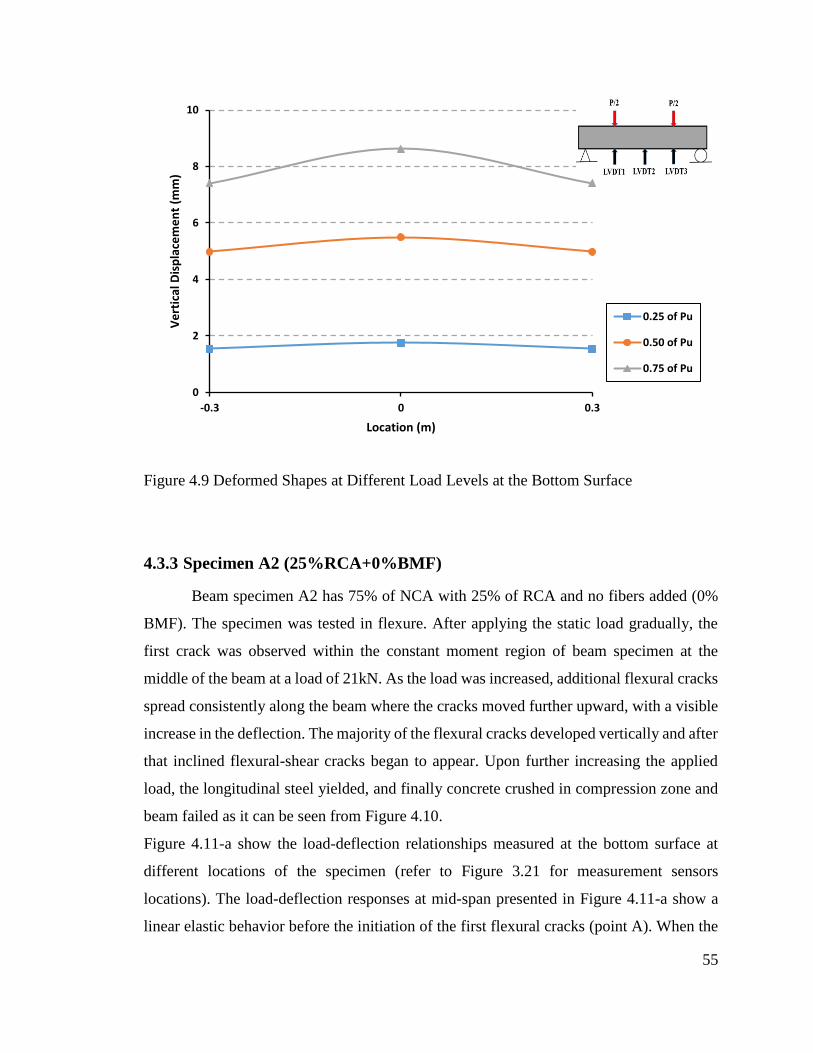
55
Figure 4.9 Deformed Shapes at Different Load Levels at the Bottom Surface
4.3.3 Specimen A2 (25%RCA+0%BMF)
Beam specimen A2 has 75% of NCA with 25% of RCA and no fibers added (0%
BMF). The specimen was tested in flexure. After applying the static load gradually, the
first crack was observed within the constant moment region of beam specimen at the
middle of the beam at a load of 21kN. As the load was increased, additional flexural cracks
spread consistently along the beam where the cracks moved further upward, with a visible
increase in the deflection. The majority of the flexural cracks developed vertically and after
that inclined flexural-shear cracks began to appear. Upon further increasing the applied
load, the longitudinal steel yielded, and finally concrete crushed in compression zone and
beam failed as it can be seen from Figure 4.10.
Figure 4.11-a show the load-deflection relationships measured at the bottom surface at
different locations of the specimen (refer to Figure 3.21 for measurement sensors
locations). The load-deflection responses at mid-span presented in Figure 4.11-a show a
linear elastic behavior before the initiation of the first flexural cracks (point A). When the
0
2
4
6
8
10
-0.3 0 0.3
Ve
rtic
al D
isp
lace
me
nt
(mm
)
Location (m)
0.25 of Pu
0.50 of Pu
0.75 of Pu
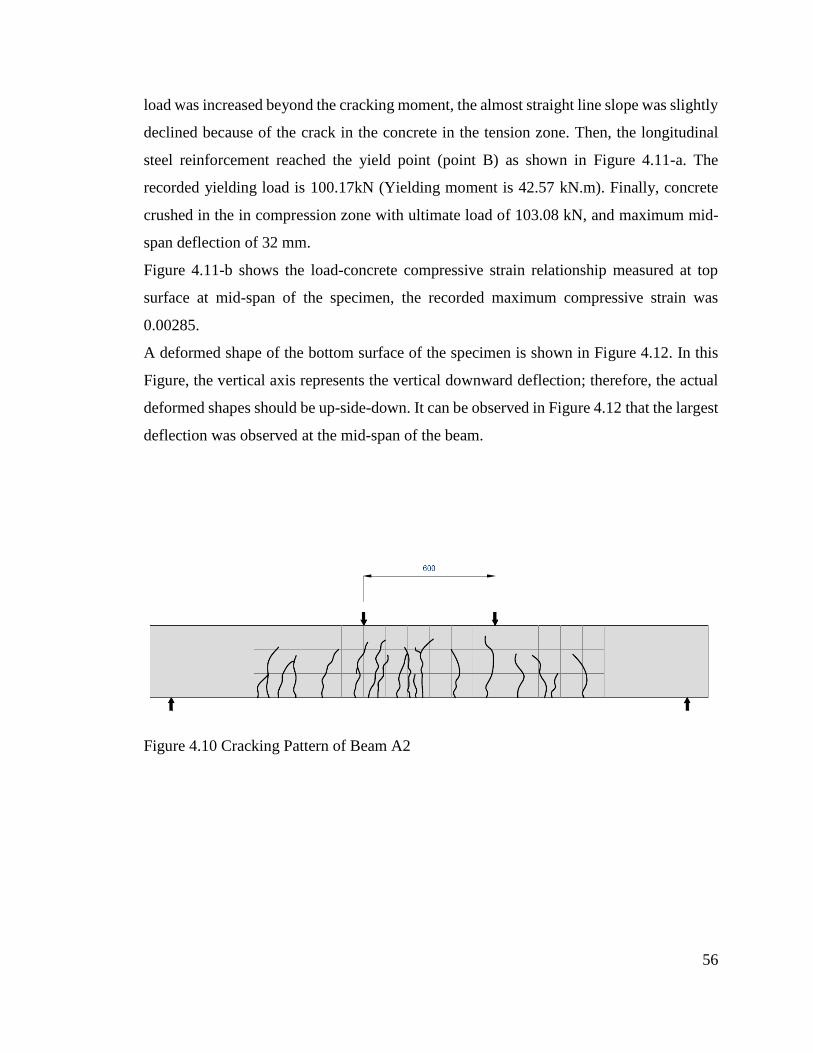
56
load was increased beyond the cracking moment, the almost straight line slope was slightly
declined because of the crack in the concrete in the tension zone. Then, the longitudinal
steel reinforcement reached the yield point (point B) as shown in Figure 4.11-a. The
recorded yielding load is 100.17kN (Yielding moment is 42.57 kN.m). Finally, concrete
crushed in the in compression zone with ultimate load of 103.08 kN, and maximum mid-
span deflection of 32 mm.
Figure 4.11-b shows the load-concrete compressive strain relationship measured at top
surface at mid-span of the specimen, the recorded maximum compressive strain was
0.00285.
A deformed shape of the bottom surface of the specimen is shown in Figure 4.12. In this
Figure, the vertical axis represents the vertical downward deflection; therefore, the actual
deformed shapes should be up-side-down. It can be observed in Figure 4.12 that the largest
deflection was observed at the mid-span of the beam.
Figure 4.10 Cracking Pattern of Beam A2
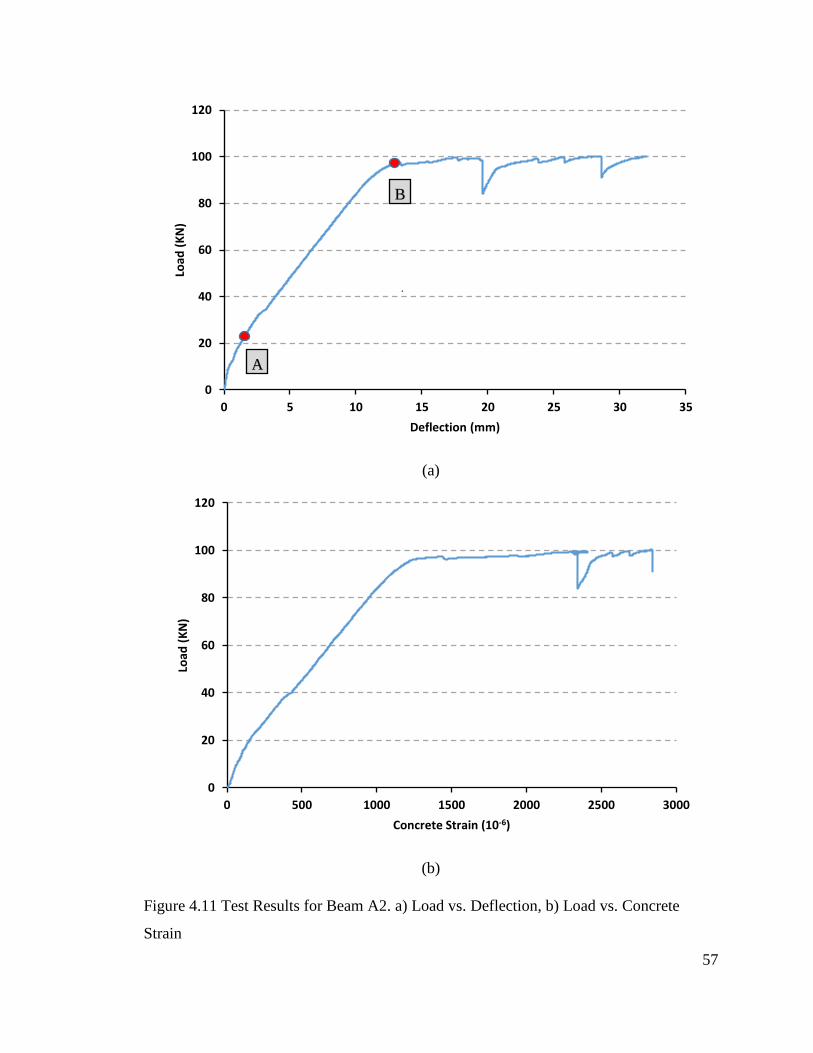
57
(a)
(b)
Figure 4.11 Test Results for Beam A2. a) Load vs. Deflection, b) Load vs. Concrete
Strain
0
20
40
60
80
100
120
0 5 10 15 20 25 30 35
Load
(K
N)
Deflection (mm)
A
B
0
20
40
60
80
100
120
0 500 1000 1500 2000 2500 3000
Load
(K
N)
Concrete Strain (10-6)
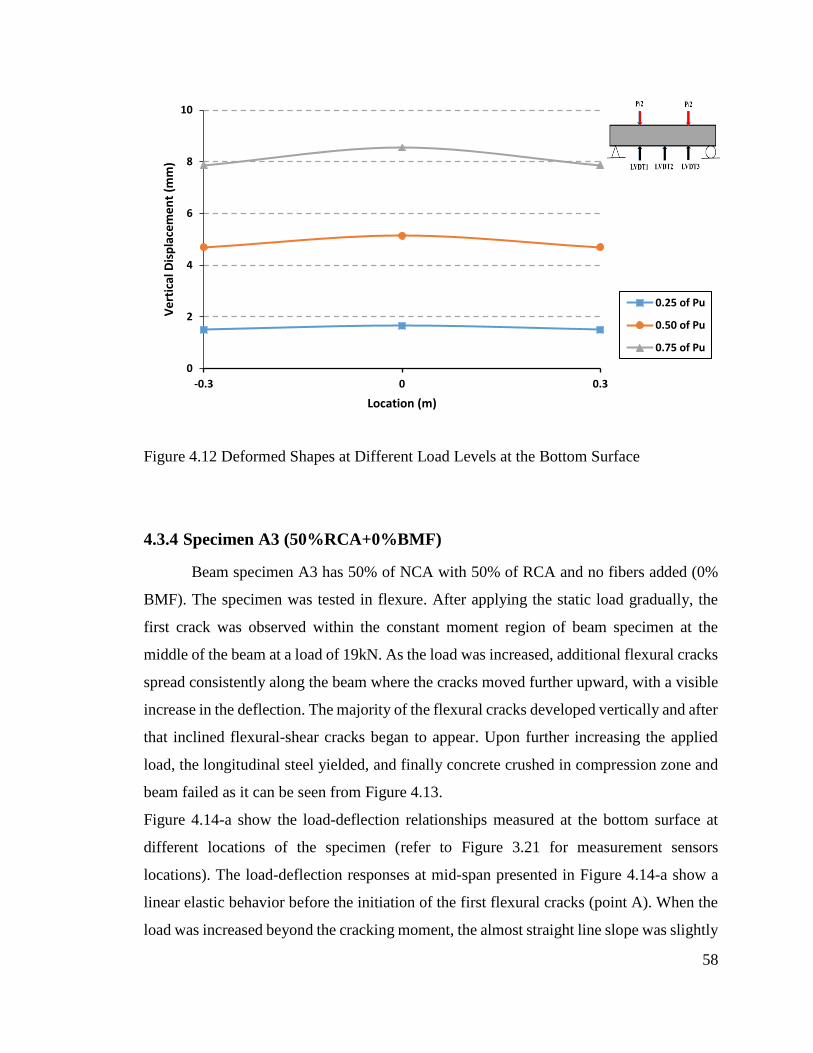
58
Figure 4.12 Deformed Shapes at Different Load Levels at the Bottom Surface
4.3.4 Specimen A3 (50%RCA+0%BMF)
Beam specimen A3 has 50% of NCA with 50% of RCA and no fibers added (0%
BMF). The specimen was tested in flexure. After applying the static load gradually, the
first crack was observed within the constant moment region of beam specimen at the
middle of the beam at a load of 19kN. As the load was increased, additional flexural cracks
spread consistently along the beam where the cracks moved further upward, with a visible
increase in the deflection. The majority of the flexural cracks developed vertically and after
that inclined flexural-shear cracks began to appear. Upon further increasing the applied
load, the longitudinal steel yielded, and finally concrete crushed in compression zone and
beam failed as it can be seen from Figure 4.13.
Figure 4.14-a show the load-deflection relationships measured at the bottom surface at
different locations of the specimen (refer to Figure 3.21 for measurement sensors
locations). The load-deflection responses at mid-span presented in Figure 4.14-a show a
linear elastic behavior before the initiation of the first flexural cracks (point A). When the
load was increased beyond the cracking moment, the almost straight line slope was slightly
0
2
4
6
8
10
-0.3 0 0.3
Ve
rtic
al D
isp
lace
me
nt
(mm
)
Location (m)
0.25 of Pu
0.50 of Pu
0.75 of Pu
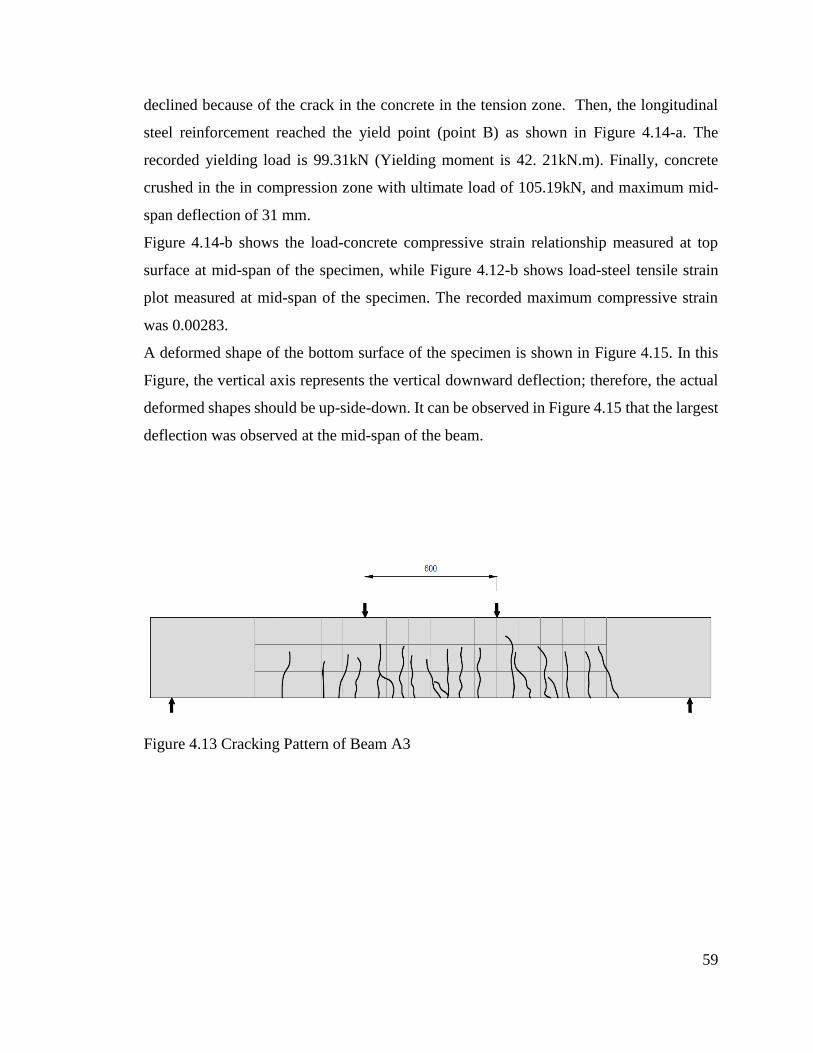
59
declined because of the crack in the concrete in the tension zone. Then, the longitudinal
steel reinforcement reached the yield point (point B) as shown in Figure 4.14-a. The
recorded yielding load is 99.31kN (Yielding moment is 42. 21kN.m). Finally, concrete
crushed in the in compression zone with ultimate load of 105.19kN, and maximum mid-
span deflection of 31 mm.
Figure 4.14-b shows the load-concrete compressive strain relationship measured at top
surface at mid-span of the specimen, while Figure 4.12-b shows load-steel tensile strain
plot measured at mid-span of the specimen. The recorded maximum compressive strain
was 0.00283.
A deformed shape of the bottom surface of the specimen is shown in Figure 4.15. In this
Figure, the vertical axis represents the vertical downward deflection; therefore, the actual
deformed shapes should be up-side-down. It can be observed in Figure 4.15 that the largest
deflection was observed at the mid-span of the beam.
Figure 4.13 Cracking Pattern of Beam A3
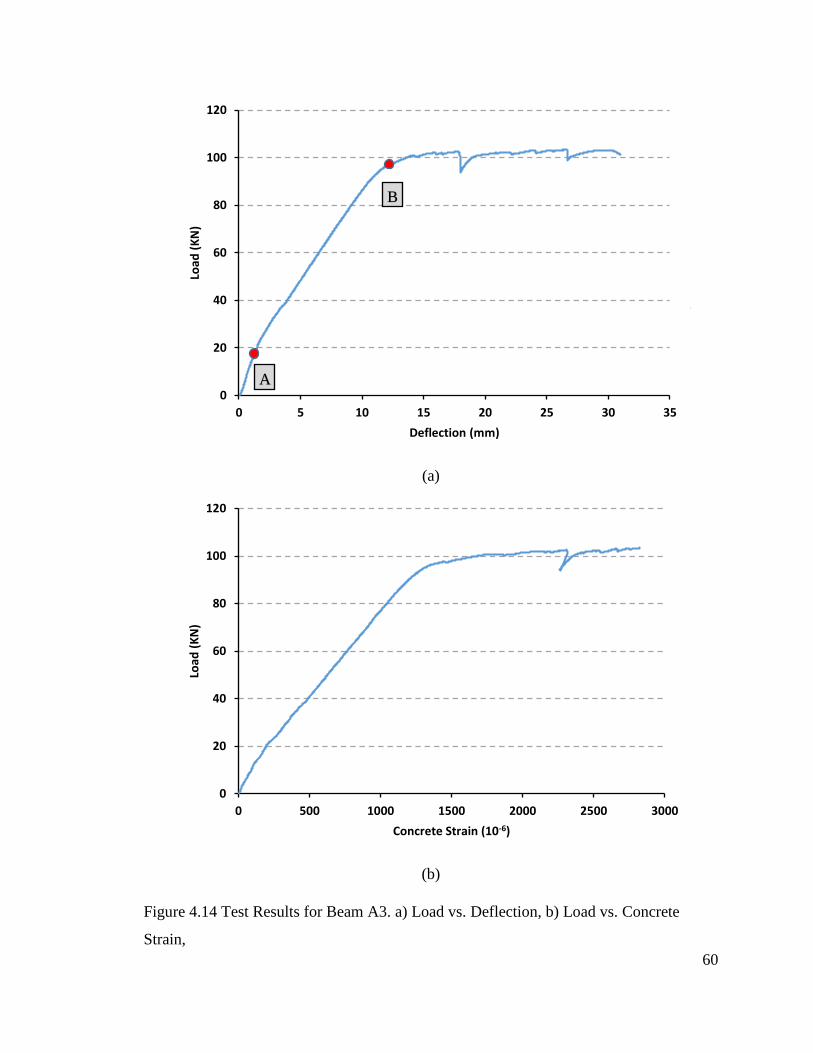
60
(a)
(b)
Figure 4.14 Test Results for Beam A3. a) Load vs. Deflection, b) Load vs. Concrete
Strain,
0
20
40
60
80
100
120
0 5 10 15 20 25 30 35
Load
(K
N)
Deflection (mm)
A
B
0
20
40
60
80
100
120
0 500 1000 1500 2000 2500 3000
Load
(K
N)
Concrete Strain (10-6)
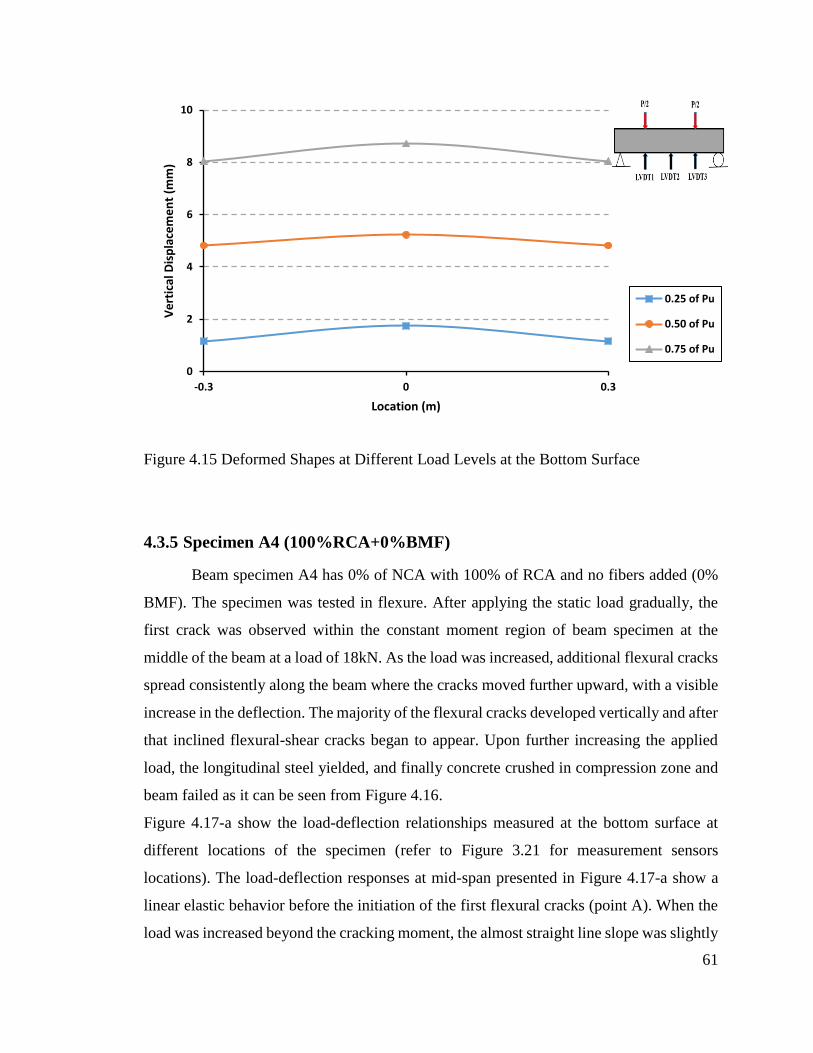
61
Figure 4.15 Deformed Shapes at Different Load Levels at the Bottom Surface
4.3.5 Specimen A4 (100%RCA+0%BMF)
Beam specimen A4 has 0% of NCA with 100% of RCA and no fibers added (0%
BMF). The specimen was tested in flexure. After applying the static load gradually, the
first crack was observed within the constant moment region of beam specimen at the
middle of the beam at a load of 18kN. As the load was increased, additional flexural cracks
spread consistently along the beam where the cracks moved further upward, with a visible
increase in the deflection. The majority of the flexural cracks developed vertically and after
that inclined flexural-shear cracks began to appear. Upon further increasing the applied
load, the longitudinal steel yielded, and finally concrete crushed in compression zone and
beam failed as it can be seen from Figure 4.16.
Figure 4.17-a show the load-deflection relationships measured at the bottom surface at
different locations of the specimen (refer to Figure 3.21 for measurement sensors
locations). The load-deflection responses at mid-span presented in Figure 4.17-a show a
linear elastic behavior before the initiation of the first flexural cracks (point A). When the
load was increased beyond the cracking moment, the almost straight line slope was slightly
0
2
4
6
8
10
-0.3 0 0.3
Ve
rtic
al D
isp
lace
me
nt
(mm
)
Location (m)
0.25 of Pu
0.50 of Pu
0.75 of Pu
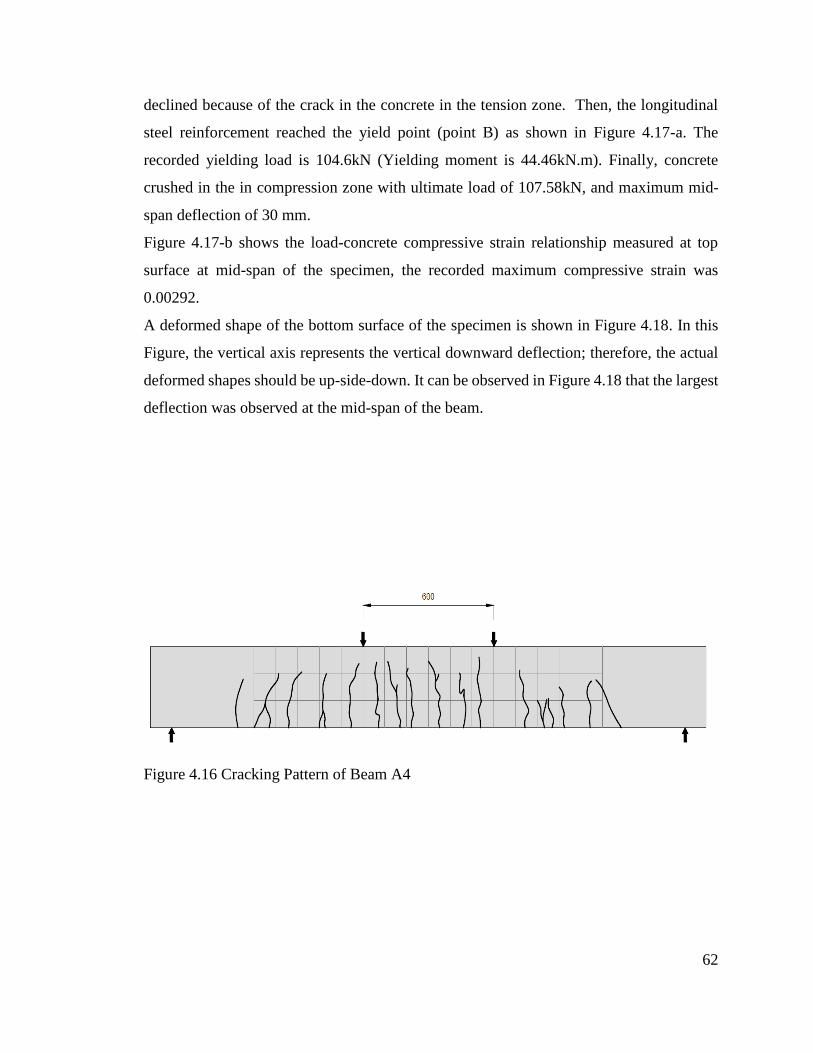
62
declined because of the crack in the concrete in the tension zone. Then, the longitudinal
steel reinforcement reached the yield point (point B) as shown in Figure 4.17-a. The
recorded yielding load is 104.6kN (Yielding moment is 44.46kN.m). Finally, concrete
crushed in the in compression zone with ultimate load of 107.58kN, and maximum mid-
span deflection of 30 mm.
Figure 4.17-b shows the load-concrete compressive strain relationship measured at top
surface at mid-span of the specimen, the recorded maximum compressive strain was
0.00292.
A deformed shape of the bottom surface of the specimen is shown in Figure 4.18. In this
Figure, the vertical axis represents the vertical downward deflection; therefore, the actual
deformed shapes should be up-side-down. It can be observed in Figure 4.18 that the largest
deflection was observed at the mid-span of the beam.
Figure 4.16 Cracking Pattern of Beam A4
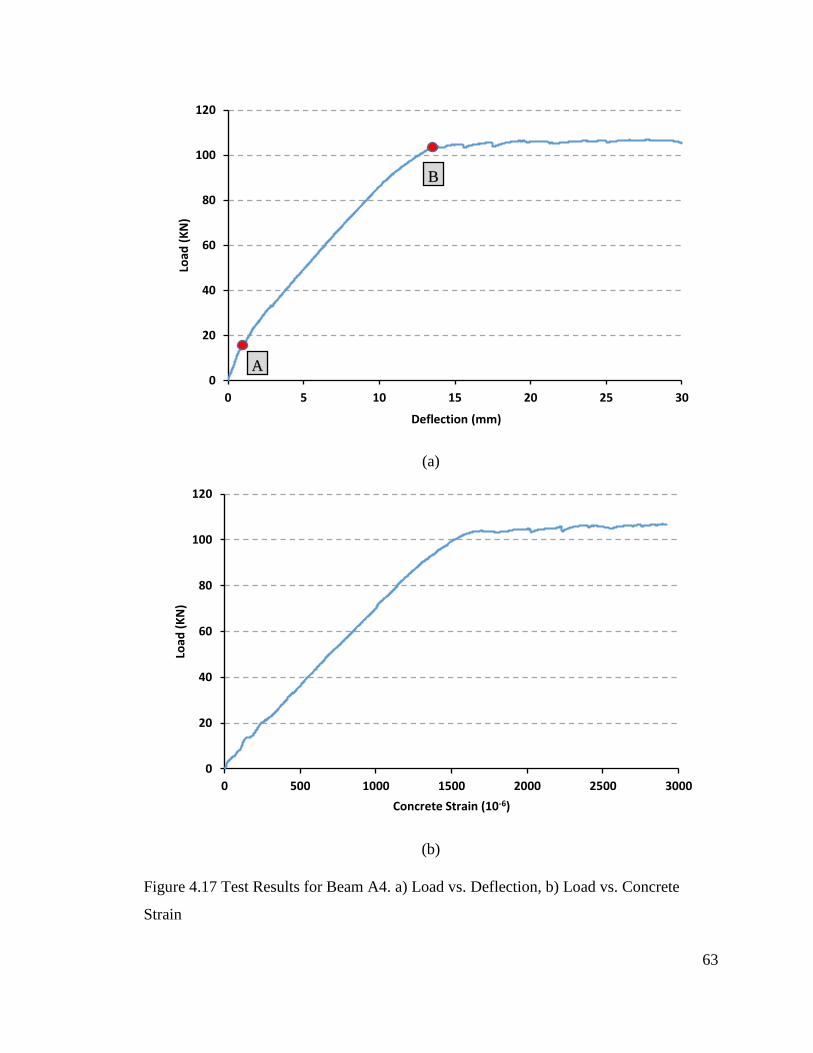
63
(a)
(b)
Figure 4.17 Test Results for Beam A4. a) Load vs. Deflection, b) Load vs. Concrete
Strain
0
20
40
60
80
100
120
0 5 10 15 20 25 30
Load
(K
N)
Deflection (mm)
B
A
0
20
40
60
80
100
120
0 500 1000 1500 2000 2500 3000
Load
(K
N)
Concrete Strain (10-6)
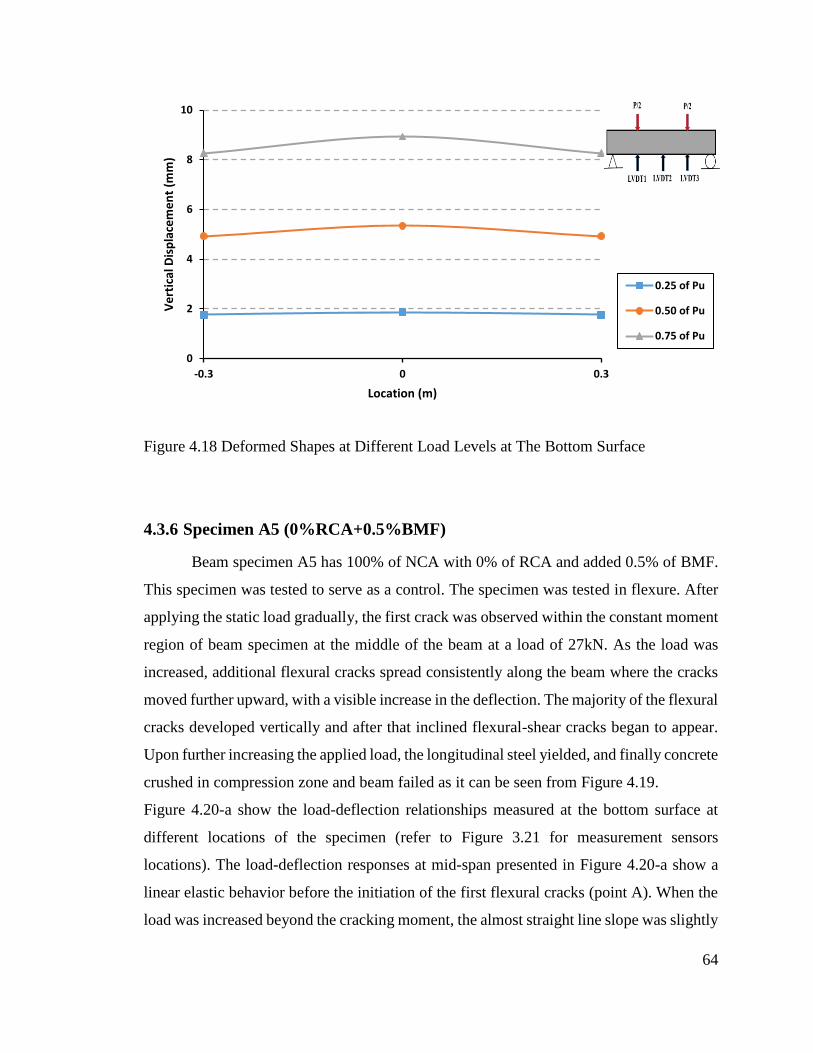
64
Figure 4.18 Deformed Shapes at Different Load Levels at The Bottom Surface
4.3.6 Specimen A5 (0%RCA+0.5%BMF)
Beam specimen A5 has 100% of NCA with 0% of RCA and added 0.5% of BMF.
This specimen was tested to serve as a control. The specimen was tested in flexure. After
applying the static load gradually, the first crack was observed within the constant moment
region of beam specimen at the middle of the beam at a load of 27kN. As the load was
increased, additional flexural cracks spread consistently along the beam where the cracks
moved further upward, with a visible increase in the deflection. The majority of the flexural
cracks developed vertically and after that inclined flexural-shear cracks began to appear.
Upon further increasing the applied load, the longitudinal steel yielded, and finally concrete
crushed in compression zone and beam failed as it can be seen from Figure 4.19.
Figure 4.20-a show the load-deflection relationships measured at the bottom surface at
different locations of the specimen (refer to Figure 3.21 for measurement sensors
locations). The load-deflection responses at mid-span presented in Figure 4.20-a show a
linear elastic behavior before the initiation of the first flexural cracks (point A). When the
load was increased beyond the cracking moment, the almost straight line slope was slightly
0
2
4
6
8
10
-0.3 0 0.3
Ve
rtic
al D
isp
lace
me
nt
(mm
)
Location (m)
0.25 of Pu
0.50 of Pu
0.75 of Pu
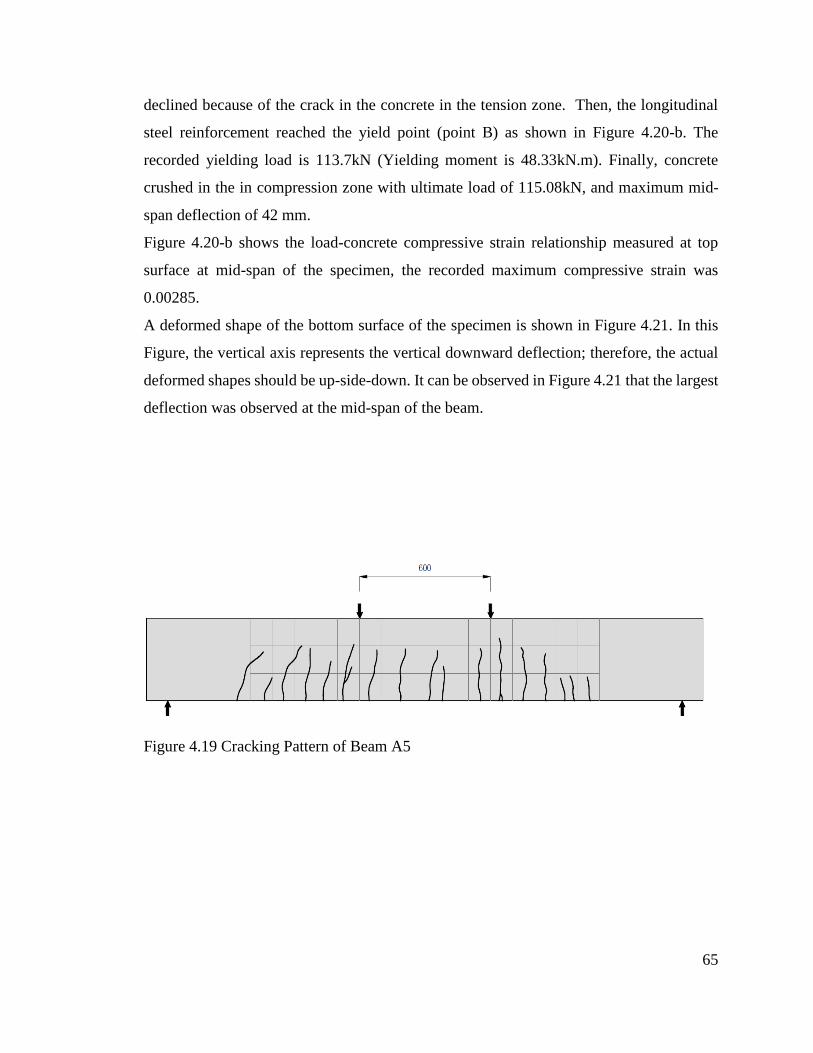
65
declined because of the crack in the concrete in the tension zone. Then, the longitudinal
steel reinforcement reached the yield point (point B) as shown in Figure 4.20-b. The
recorded yielding load is 113.7kN (Yielding moment is 48.33kN.m). Finally, concrete
crushed in the in compression zone with ultimate load of 115.08kN, and maximum mid-
span deflection of 42 mm.
Figure 4.20-b shows the load-concrete compressive strain relationship measured at top
surface at mid-span of the specimen, the recorded maximum compressive strain was
0.00285.
A deformed shape of the bottom surface of the specimen is shown in Figure 4.21. In this
Figure, the vertical axis represents the vertical downward deflection; therefore, the actual
deformed shapes should be up-side-down. It can be observed in Figure 4.21 that the largest
deflection was observed at the mid-span of the beam.
Figure 4.19 Cracking Pattern of Beam A5
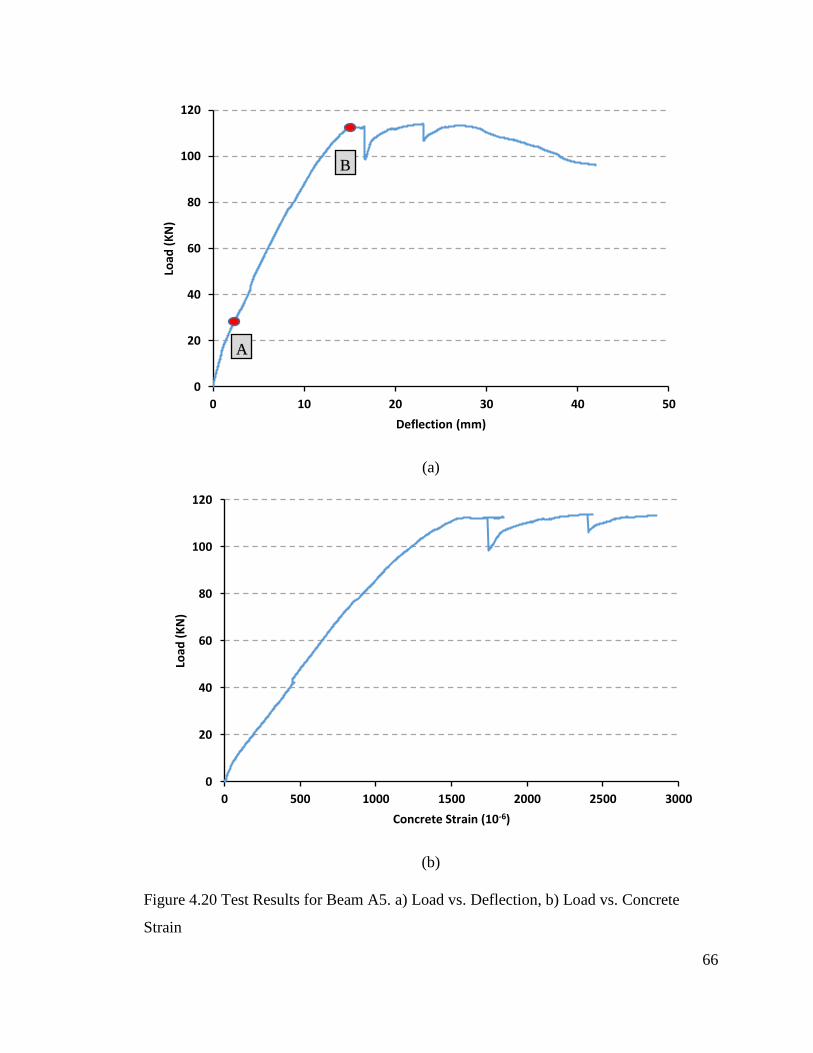
66
(a)
(b)
Figure 4.20 Test Results for Beam A5. a) Load vs. Deflection, b) Load vs. Concrete
Strain
0
20
40
60
80
100
120
0 10 20 30 40 50
Load
(K
N)
Deflection (mm)
B
A
0
20
40
60
80
100
120
0 500 1000 1500 2000 2500 3000
Load
(K
N)
Concrete Strain (10-6)
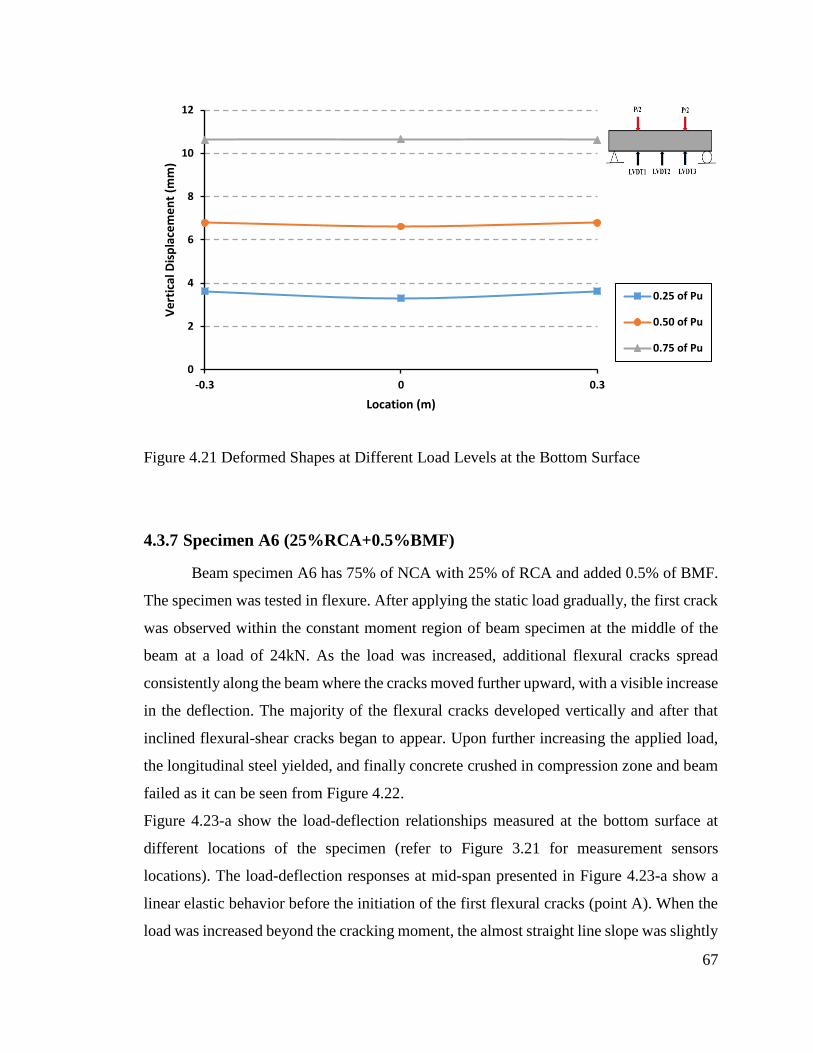
67
Figure 4.21 Deformed Shapes at Different Load Levels at the Bottom Surface
4.3.7 Specimen A6 (25%RCA+0.5%BMF)
Beam specimen A6 has 75% of NCA with 25% of RCA and added 0.5% of BMF.
The specimen was tested in flexure. After applying the static load gradually, the first crack
was observed within the constant moment region of beam specimen at the middle of the
beam at a load of 24kN. As the load was increased, additional flexural cracks spread
consistently along the beam where the cracks moved further upward, with a visible increase
in the deflection. The majority of the flexural cracks developed vertically and after that
inclined flexural-shear cracks began to appear. Upon further increasing the applied load,
the longitudinal steel yielded, and finally concrete crushed in compression zone and beam
failed as it can be seen from Figure 4.22.
Figure 4.23-a show the load-deflection relationships measured at the bottom surface at
different locations of the specimen (refer to Figure 3.21 for measurement sensors
locations). The load-deflection responses at mid-span presented in Figure 4.23-a show a
linear elastic behavior before the initiation of the first flexural cracks (point A). When the
load was increased beyond the cracking moment, the almost straight line slope was slightly
0
2
4
6
8
10
12
-0.3 0 0.3
Ve
rtic
al D
isp
lace
me
nt
(mm
)
Location (m)
0.25 of Pu
0.50 of Pu
0.75 of Pu
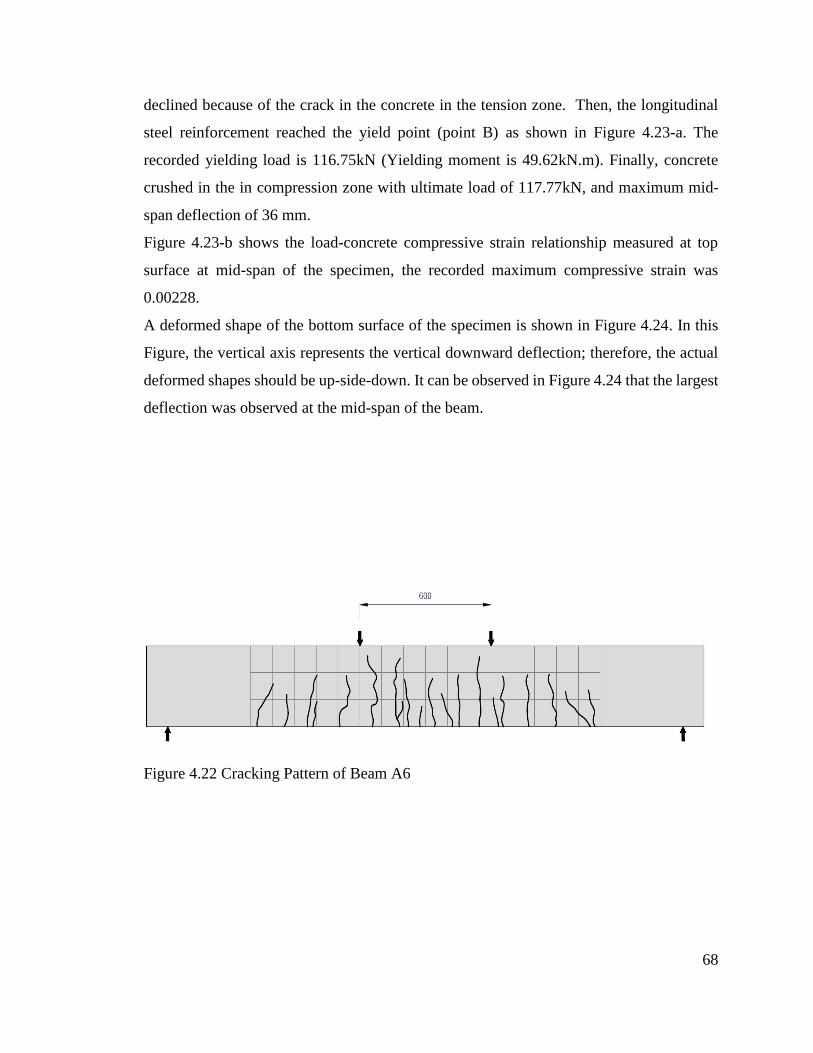
68
declined because of the crack in the concrete in the tension zone. Then, the longitudinal
steel reinforcement reached the yield point (point B) as shown in Figure 4.23-a. The
recorded yielding load is 116.75kN (Yielding moment is 49.62kN.m). Finally, concrete
crushed in the in compression zone with ultimate load of 117.77kN, and maximum mid-
span deflection of 36 mm.
Figure 4.23-b shows the load-concrete compressive strain relationship measured at top
surface at mid-span of the specimen, the recorded maximum compressive strain was
0.00228.
A deformed shape of the bottom surface of the specimen is shown in Figure 4.24. In this
Figure, the vertical axis represents the vertical downward deflection; therefore, the actual
deformed shapes should be up-side-down. It can be observed in Figure 4.24 that the largest
deflection was observed at the mid-span of the beam.
Figure 4.22 Cracking Pattern of Beam A6
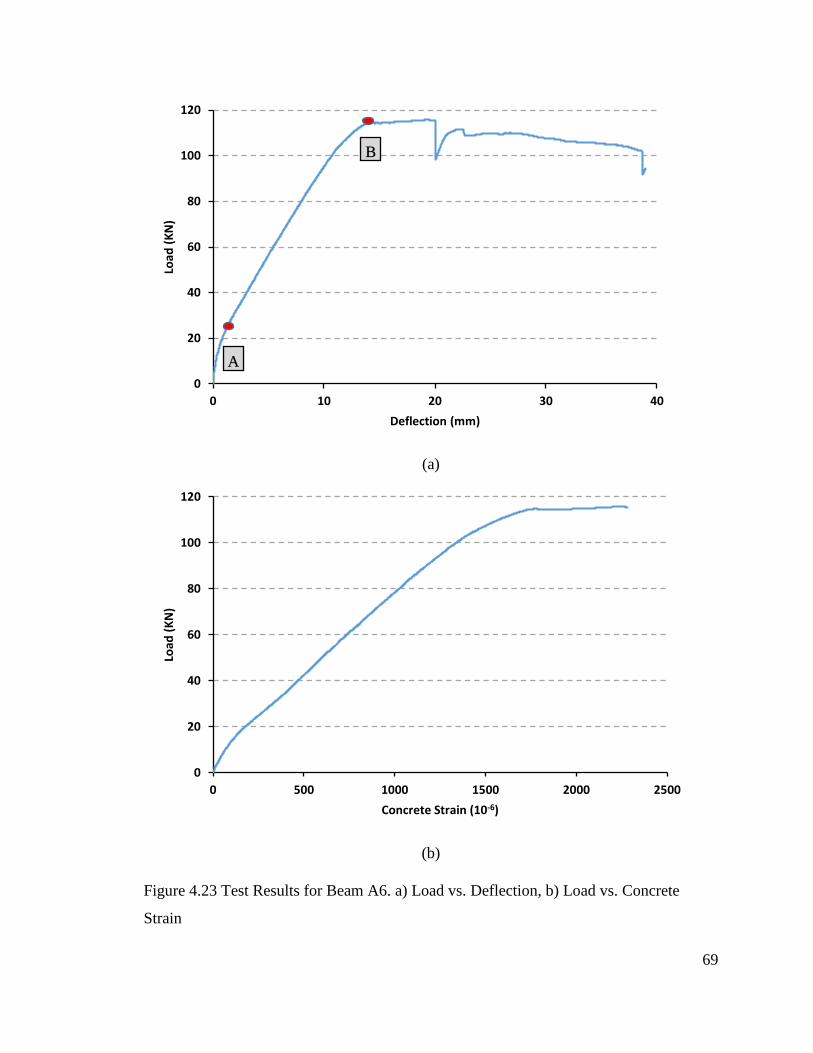
69
(a)
(b)
Figure 4.23 Test Results for Beam A6. a) Load vs. Deflection, b) Load vs. Concrete
Strain
0
20
40
60
80
100
120
0 10 20 30 40
Load
(K
N)
Deflection (mm)
A
B
0
20
40
60
80
100
120
0 500 1000 1500 2000 2500
Load
(K
N)
Concrete Strain (10-6)

70
Figure 4.24 Deformed Shapes at Different Load Levels at the Bottom Surface
4.3.8 Specimen A7 (50%RCA+0.5%BMF)
Beam specimen A7 has 50% of NCA with 50% of RCA and added 0.5% of BMF.
After applying the static load gradually, the first crack was observed within the constant
moment region of beam specimen at the middle of the beam at a load of 22kN. As the load
was increased, additional flexural cracks spread consistently along the beam where the
cracks moved further upward, with a visible increase in the deflection. The majority of the
flexural cracks developed vertically and after that inclined flexural-shear cracks began to
appear. Upon further increasing the applied load, the longitudinal steel yielded, and finally
concrete crushed in compression zone and beam failed as it can be seen from Figure 4.25.
Figure 4.26-a show the load-deflection relationships measured at the bottom surface at
different locations of the specimen (refer to Figure 3.21 for measurement sensors
locations). The load-deflection responses at mid-span presented in Figure 4.26-a show a
linear elastic behavior before the initiation of the first flexural cracks (point A). When the
load was increased beyond the cracking moment, the almost straight line slope was slightly
declined because of the crack in the concrete in the tension zone. Then, the longitudinal
0
2
4
6
8
10
-0.3 0 0.3
Ve
rtic
al D
isp
lace
me
nt
(mm
)
Location (m)
0.25 of pu
0.50 of Pu
0.75 of Pu
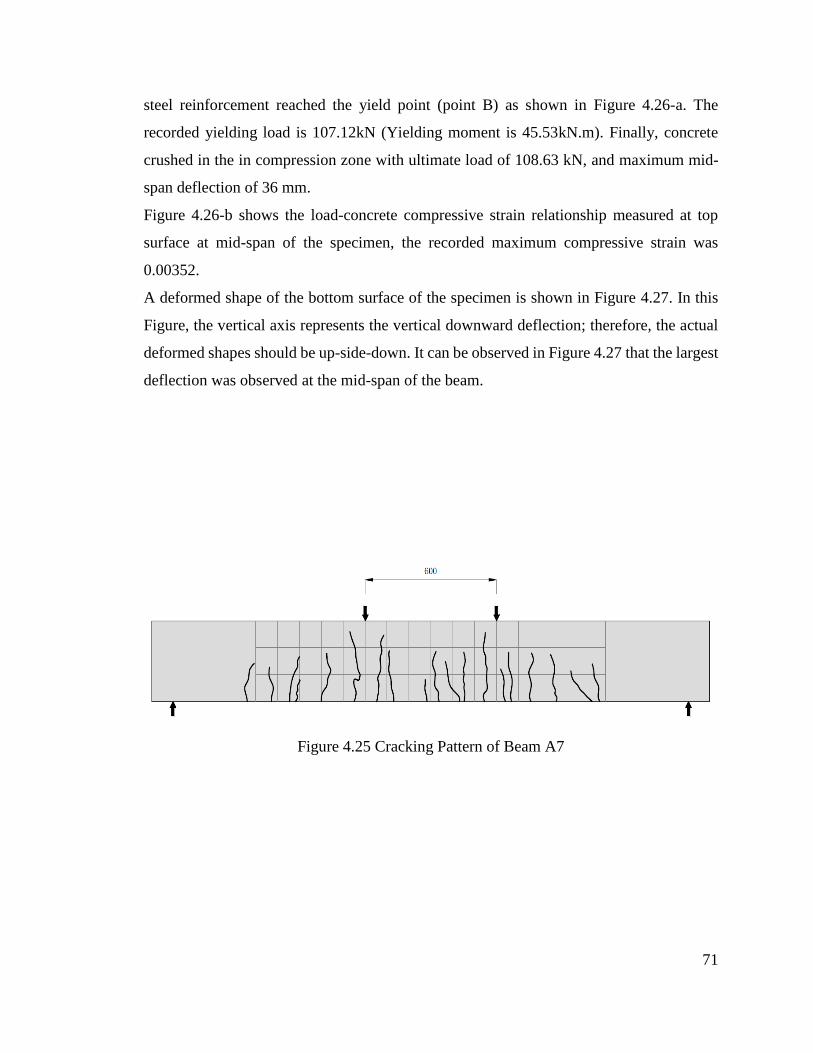
71
steel reinforcement reached the yield point (point B) as shown in Figure 4.26-a. The
recorded yielding load is 107.12kN (Yielding moment is 45.53kN.m). Finally, concrete
crushed in the in compression zone with ultimate load of 108.63 kN, and maximum mid-
span deflection of 36 mm.
Figure 4.26-b shows the load-concrete compressive strain relationship measured at top
surface at mid-span of the specimen, the recorded maximum compressive strain was
0.00352.
A deformed shape of the bottom surface of the specimen is shown in Figure 4.27. In this
Figure, the vertical axis represents the vertical downward deflection; therefore, the actual
deformed shapes should be up-side-down. It can be observed in Figure 4.27 that the largest
deflection was observed at the mid-span of the beam.
Figure 4.25 Cracking Pattern of Beam A7
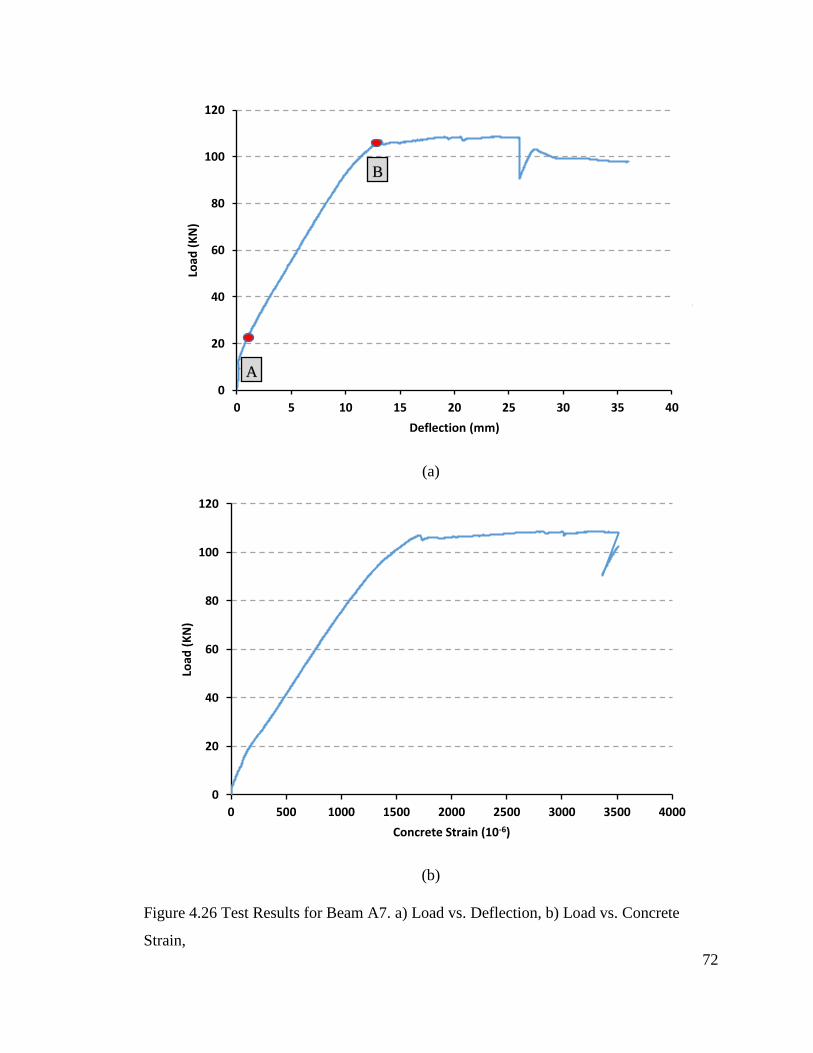
72
(a)
(b)
Figure 4.26 Test Results for Beam A7. a) Load vs. Deflection, b) Load vs. Concrete
Strain,
0
20
40
60
80
100
120
0 5 10 15 20 25 30 35 40
Load
(K
N)
Deflection (mm)
A
B
0
20
40
60
80
100
120
0 500 1000 1500 2000 2500 3000 3500 4000
Load
(K
N)
Concrete Strain (10-6)
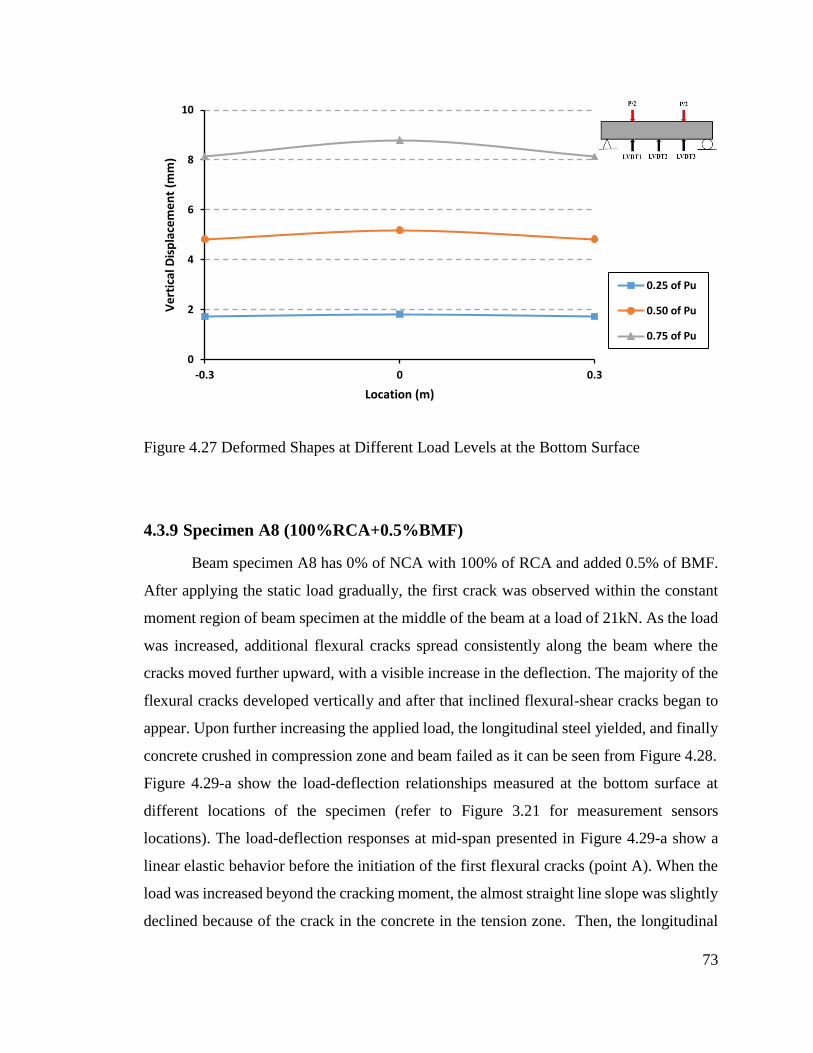
73
Figure 4.27 Deformed Shapes at Different Load Levels at the Bottom Surface
4.3.9 Specimen A8 (100%RCA+0.5%BMF)
Beam specimen A8 has 0% of NCA with 100% of RCA and added 0.5% of BMF.
After applying the static load gradually, the first crack was observed within the constant
moment region of beam specimen at the middle of the beam at a load of 21kN. As the load
was increased, additional flexural cracks spread consistently along the beam where the
cracks moved further upward, with a visible increase in the deflection. The majority of the
flexural cracks developed vertically and after that inclined flexural-shear cracks began to
appear. Upon further increasing the applied load, the longitudinal steel yielded, and finally
concrete crushed in compression zone and beam failed as it can be seen from Figure 4.28.
Figure 4.29-a show the load-deflection relationships measured at the bottom surface at
different locations of the specimen (refer to Figure 3.21 for measurement sensors
locations). The load-deflection responses at mid-span presented in Figure 4.29-a show a
linear elastic behavior before the initiation of the first flexural cracks (point A). When the
load was increased beyond the cracking moment, the almost straight line slope was slightly
declined because of the crack in the concrete in the tension zone. Then, the longitudinal
0
2
4
6
8
10
-0.3 0 0.3
Ve
rtic
al D
isp
lace
me
nt
(mm
)
Location (m)
0.25 of Pu
0.50 of Pu
0.75 of Pu
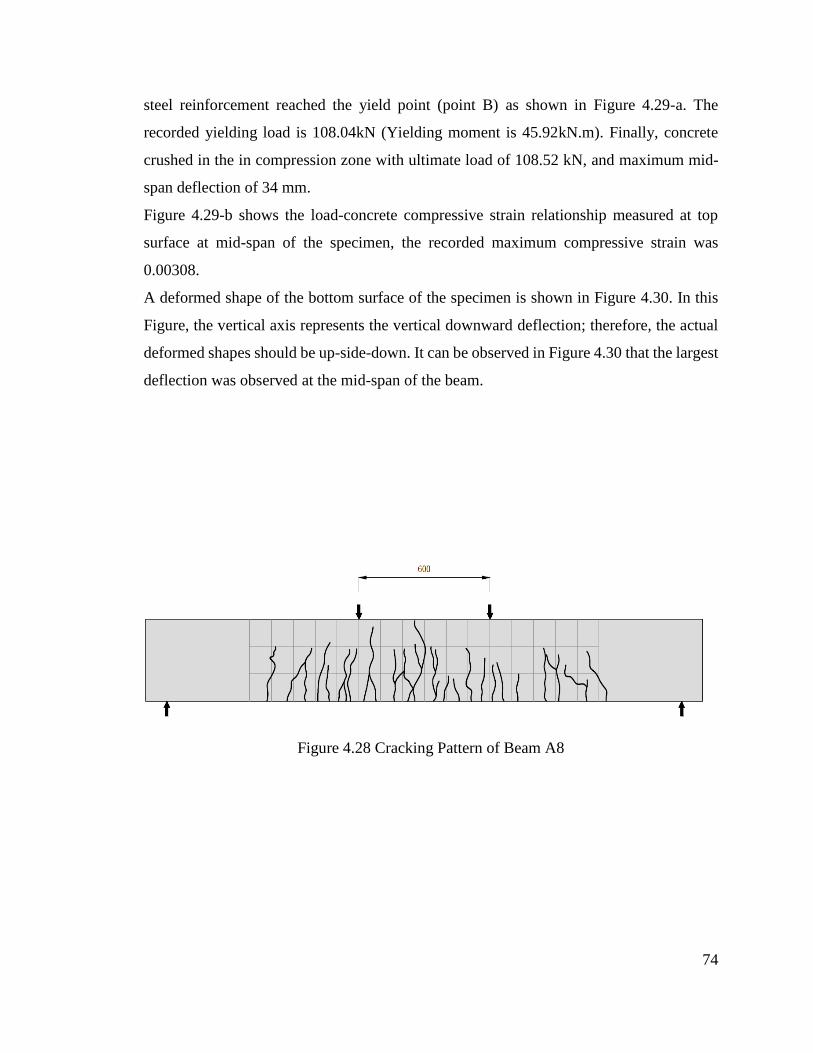
74
steel reinforcement reached the yield point (point B) as shown in Figure 4.29-a. The
recorded yielding load is 108.04kN (Yielding moment is 45.92kN.m). Finally, concrete
crushed in the in compression zone with ultimate load of 108.52 kN, and maximum mid-
span deflection of 34 mm.
Figure 4.29-b shows the load-concrete compressive strain relationship measured at top
surface at mid-span of the specimen, the recorded maximum compressive strain was
0.00308.
A deformed shape of the bottom surface of the specimen is shown in Figure 4.30. In this
Figure, the vertical axis represents the vertical downward deflection; therefore, the actual
deformed shapes should be up-side-down. It can be observed in Figure 4.30 that the largest
deflection was observed at the mid-span of the beam.
Figure 4.28 Cracking Pattern of Beam A8
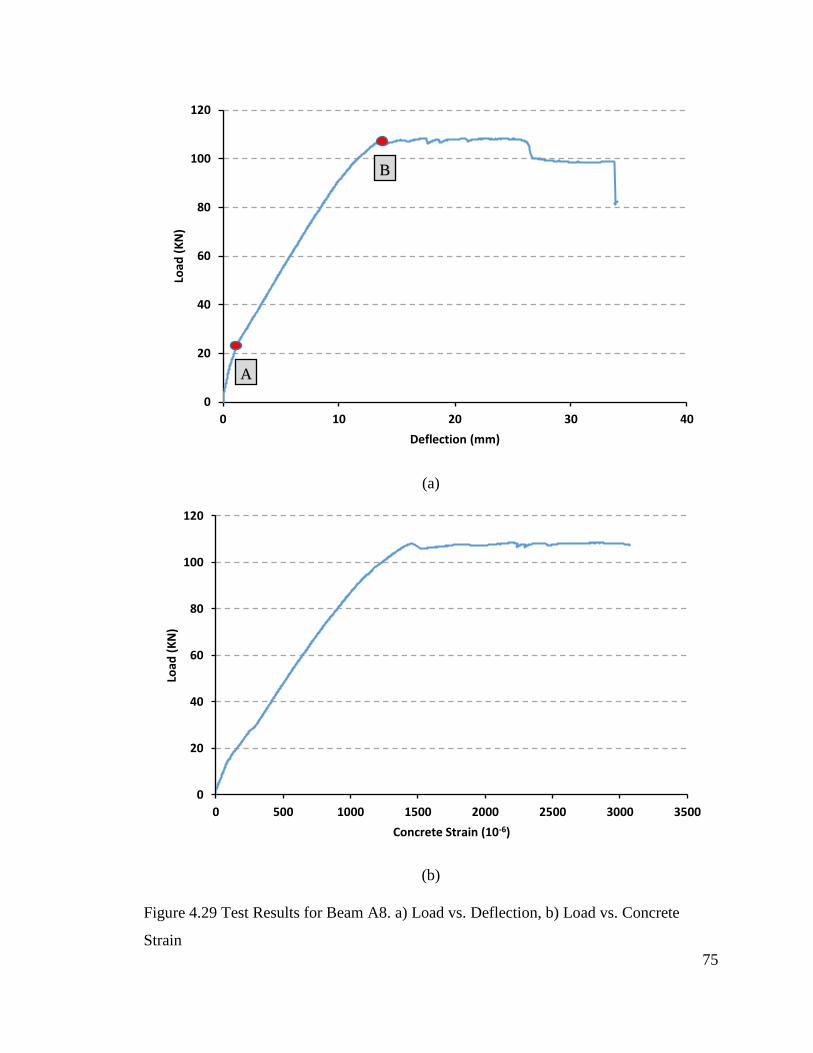
75
(a)
(b)
Figure 4.29 Test Results for Beam A8. a) Load vs. Deflection, b) Load vs. Concrete
Strain
0
20
40
60
80
100
120
0 10 20 30 40
Load
(K
N)
Deflection (mm)
A
B
0
20
40
60
80
100
120
0 500 1000 1500 2000 2500 3000 3500
Load
(K
N)
Concrete Strain (10-6)
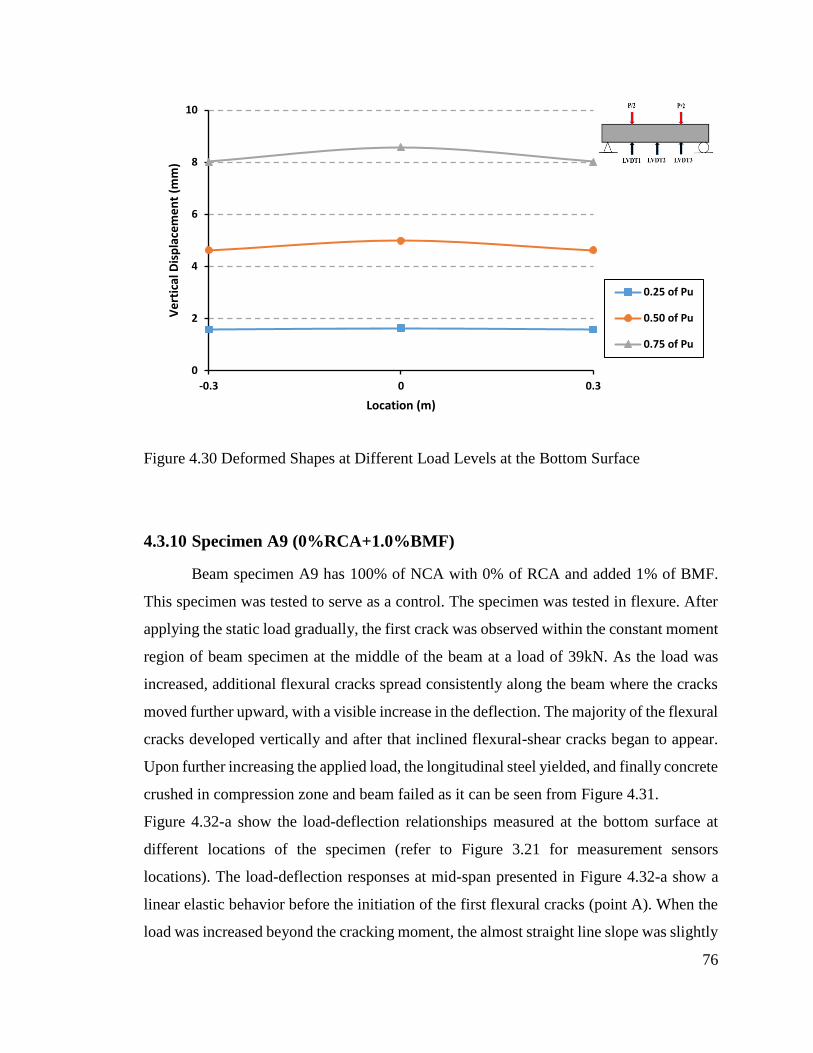
76
Figure 4.30 Deformed Shapes at Different Load Levels at the Bottom Surface
4.3.10 Specimen A9 (0%RCA+1.0%BMF)
Beam specimen A9 has 100% of NCA with 0% of RCA and added 1% of BMF.
This specimen was tested to serve as a control. The specimen was tested in flexure. After
applying the static load gradually, the first crack was observed within the constant moment
region of beam specimen at the middle of the beam at a load of 39kN. As the load was
increased, additional flexural cracks spread consistently along the beam where the cracks
moved further upward, with a visible increase in the deflection. The majority of the flexural
cracks developed vertically and after that inclined flexural-shear cracks began to appear.
Upon further increasing the applied load, the longitudinal steel yielded, and finally concrete
crushed in compression zone and beam failed as it can be seen from Figure 4.31.
Figure 4.32-a show the load-deflection relationships measured at the bottom surface at
different locations of the specimen (refer to Figure 3.21 for measurement sensors
locations). The load-deflection responses at mid-span presented in Figure 4.32-a show a
linear elastic behavior before the initiation of the first flexural cracks (point A). When the
load was increased beyond the cracking moment, the almost straight line slope was slightly
0
2
4
6
8
10
-0.3 0 0.3
Ve
rtic
al D
isp
lace
me
nt
(mm
)
Location (m)
0.25 of Pu
0.50 of Pu
0.75 of Pu
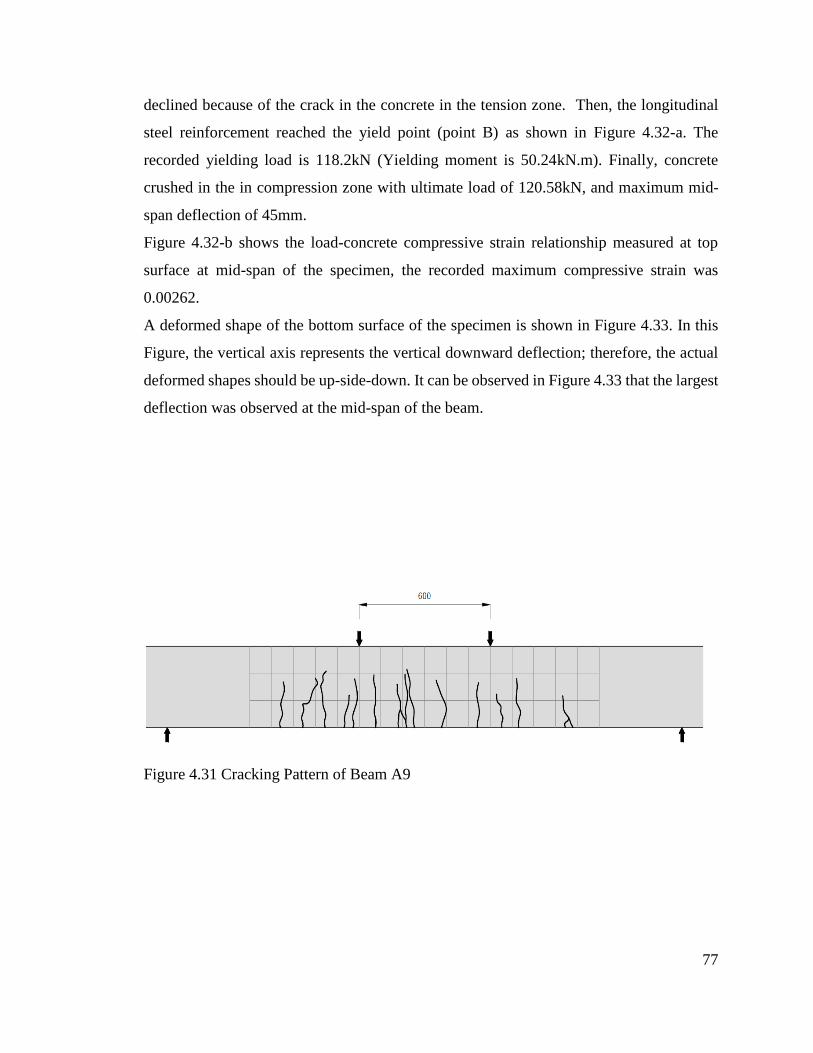
77
declined because of the crack in the concrete in the tension zone. Then, the longitudinal
steel reinforcement reached the yield point (point B) as shown in Figure 4.32-a. The
recorded yielding load is 118.2kN (Yielding moment is 50.24kN.m). Finally, concrete
crushed in the in compression zone with ultimate load of 120.58kN, and maximum mid-
span deflection of 45mm.
Figure 4.32-b shows the load-concrete compressive strain relationship measured at top
surface at mid-span of the specimen, the recorded maximum compressive strain was
0.00262.
A deformed shape of the bottom surface of the specimen is shown in Figure 4.33. In this
Figure, the vertical axis represents the vertical downward deflection; therefore, the actual
deformed shapes should be up-side-down. It can be observed in Figure 4.33 that the largest
deflection was observed at the mid-span of the beam.
Figure 4.31 Cracking Pattern of Beam A9
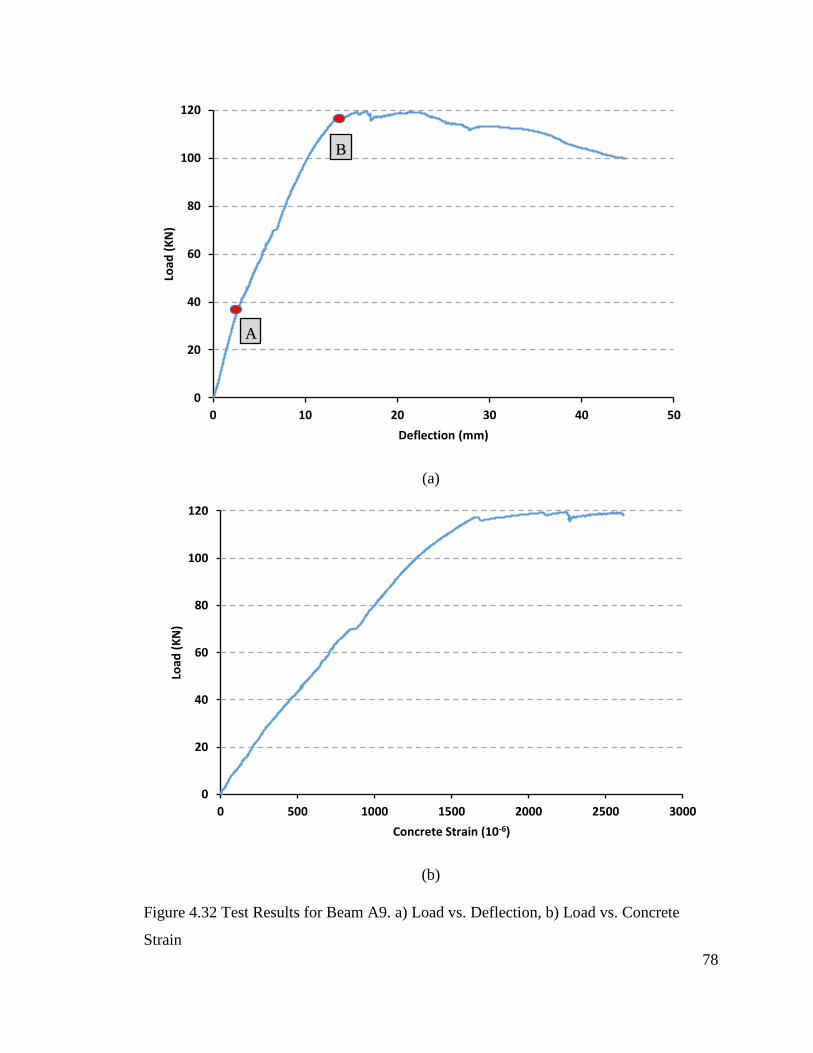
78
(a)
(b)
Figure 4.32 Test Results for Beam A9. a) Load vs. Deflection, b) Load vs. Concrete
Strain
0
20
40
60
80
100
120
0 10 20 30 40 50
Load
(K
N)
Deflection (mm)
B
A
0
20
40
60
80
100
120
0 500 1000 1500 2000 2500 3000
Load
(K
N)
Concrete Strain (10-6)
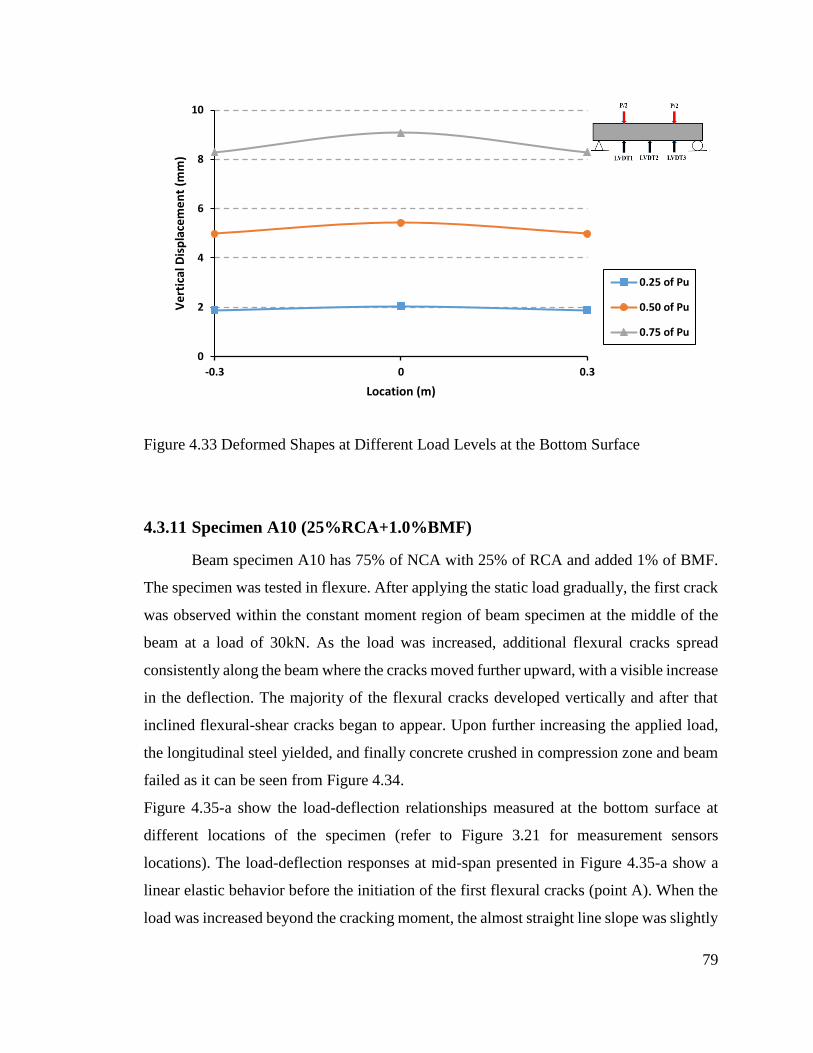
79
Figure 4.33 Deformed Shapes at Different Load Levels at the Bottom Surface
4.3.11 Specimen A10 (25%RCA+1.0%BMF)
Beam specimen A10 has 75% of NCA with 25% of RCA and added 1% of BMF.
The specimen was tested in flexure. After applying the static load gradually, the first crack
was observed within the constant moment region of beam specimen at the middle of the
beam at a load of 30kN. As the load was increased, additional flexural cracks spread
consistently along the beam where the cracks moved further upward, with a visible increase
in the deflection. The majority of the flexural cracks developed vertically and after that
inclined flexural-shear cracks began to appear. Upon further increasing the applied load,
the longitudinal steel yielded, and finally concrete crushed in compression zone and beam
failed as it can be seen from Figure 4.34.
Figure 4.35-a show the load-deflection relationships measured at the bottom surface at
different locations of the specimen (refer to Figure 3.21 for measurement sensors
locations). The load-deflection responses at mid-span presented in Figure 4.35-a show a
linear elastic behavior before the initiation of the first flexural cracks (point A). When the
load was increased beyond the cracking moment, the almost straight line slope was slightly
0
2
4
6
8
10
-0.3 0 0.3
Ve
rtic
al D
isp
lace
me
nt
(mm
)
Location (m)
0.25 of Pu
0.50 of Pu
0.75 of Pu

80
declined because of the crack in the concrete in the tension zone. Then, the longitudinal
steel reinforcement reached the yield point (point B) as shown in Figure 4.35-a. The
recorded yielding load is 103.1kN (Yielding moment is 43.82kN.m). Finally, concrete
crushed in the in compression zone with ultimate load of 105.75kN, and maximum mid-
span deflection of 45 mm.
Figure 4.35-b shows the load-concrete compressive strain relationship measured at top
surface at mid-span of the specimen, the recorded maximum compressive strain was
0.00374.
A deformed shape of the bottom surface of the specimen is shown in Figure 4.36. In this
Figure, the vertical axis represents the vertical downward deflection; therefore, the actual
deformed shapes should be up-side-down. It can be observed in Figure 4.36 that the
deflection was largest at the mid-span of the beam.
Figure 4.34 Cracking Pattern of Beam A10
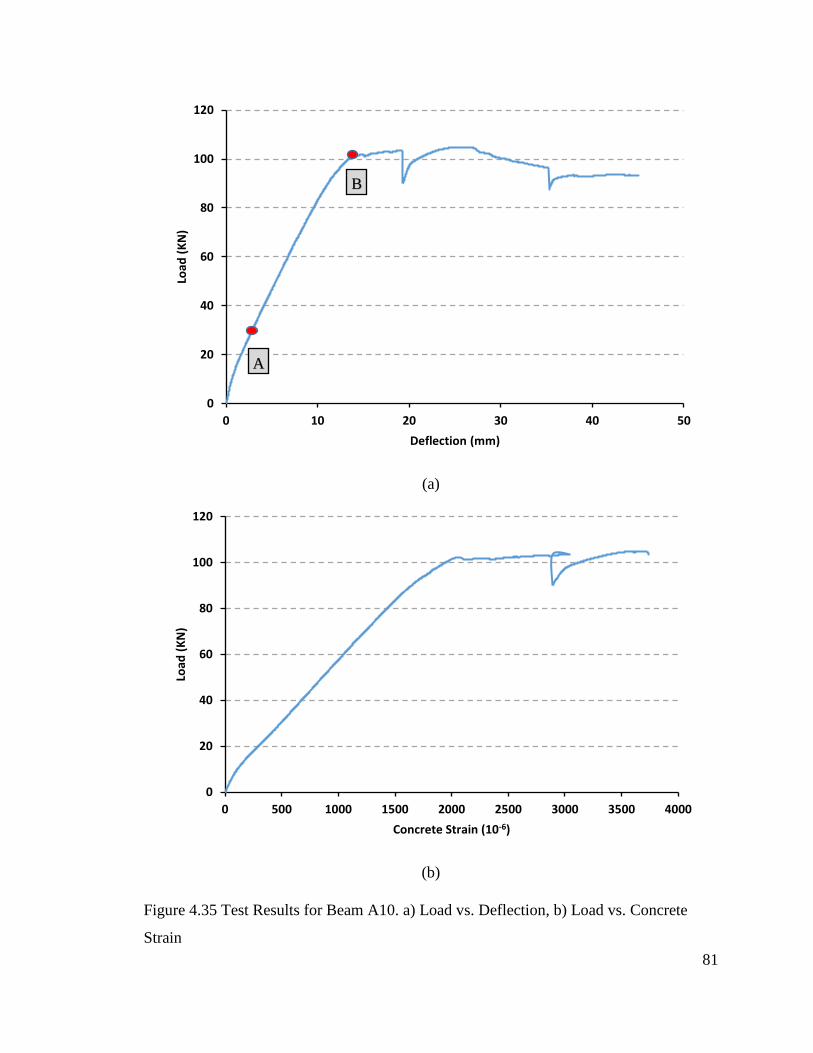
81
(a)
(b)
Figure 4.35 Test Results for Beam A10. a) Load vs. Deflection, b) Load vs. Concrete
Strain
0
20
40
60
80
100
120
0 10 20 30 40 50
Load
(K
N)
Deflection (mm)
B
A
0
20
40
60
80
100
120
0 500 1000 1500 2000 2500 3000 3500 4000
Load
(K
N)
Concrete Strain (10-6)

82
Figure 4.36 Deformed Shapes at Different Load Levels at the Bottom Surface
4.3.12 Specimen A11 (50%RCA+1.0%BMF)
Beam specimen A11 has 50% of NCA with 50% of RCA and added 1% of BMF.
The specimen was tested in flexure. After applying the static load gradually, the first crack
was observed within the constant moment region of beam specimen at the middle of the
beam at a load of 28kN. As the load was increased, additional flexural cracks spread
consistently along the beam where the cracks moved further upward, with a visible increase
in the deflection. The majority of the flexural cracks developed vertically and after that
inclined flexural-shear cracks began to appear. Upon further increasing the applied load,
the longitudinal steel yielded, and finally concrete crushed in compression zone and beam
failed as it can be seen from Figure 4.37.
Figure 4.38-a show the load-deflection relationships measured at the bottom surface at
different locations of the specimen (refer to Figure 3.21 for measurement sensors
locations). The load-deflection responses at mid-span presented in Figure 4.38-a show a
linear elastic behavior before the initiation of the first flexural cracks (point A). When the
load was increased beyond the cracking moment, the almost straight line slope was slightly
0
2
4
6
8
10
-0.3 0 0.3
Ve
rtic
al D
isp
lace
me
nt
(mm
)
Location (m)
0.25 of Pu
0.50 of Pu
0.75 of Pu
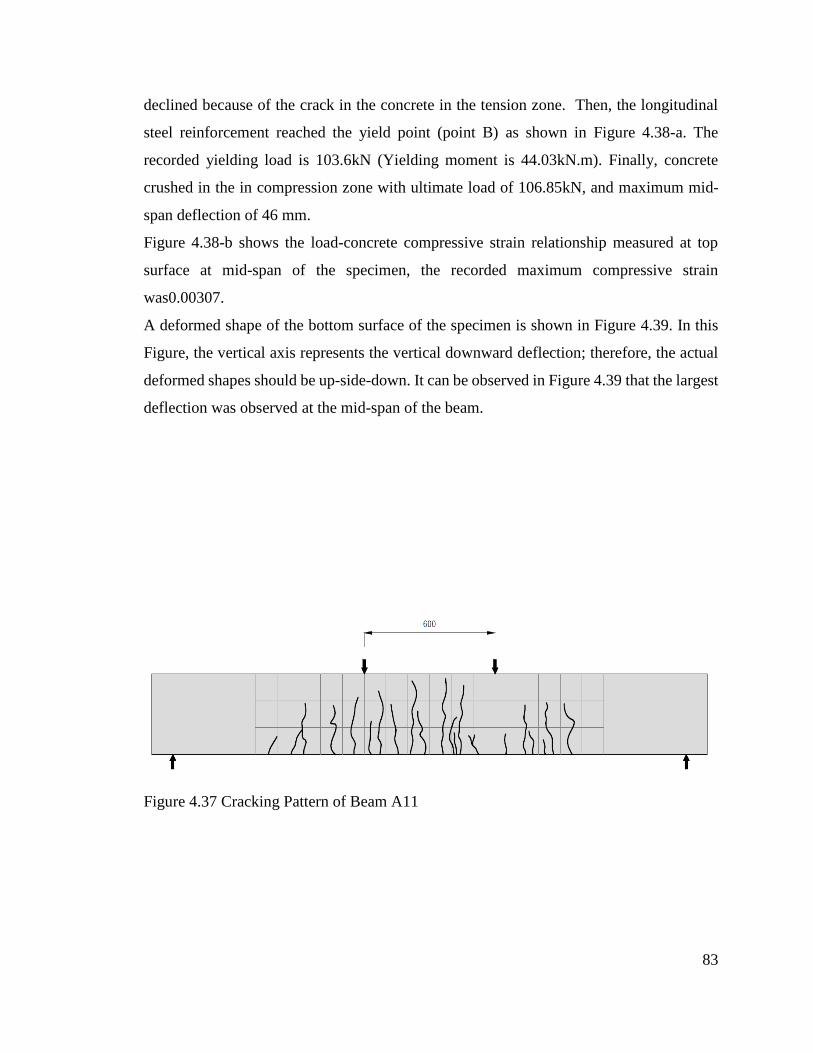
83
declined because of the crack in the concrete in the tension zone. Then, the longitudinal
steel reinforcement reached the yield point (point B) as shown in Figure 4.38-a. The
recorded yielding load is 103.6kN (Yielding moment is 44.03kN.m). Finally, concrete
crushed in the in compression zone with ultimate load of 106.85kN, and maximum mid-
span deflection of 46 mm.
Figure 4.38-b shows the load-concrete compressive strain relationship measured at top
surface at mid-span of the specimen, the recorded maximum compressive strain
was0.00307.
A deformed shape of the bottom surface of the specimen is shown in Figure 4.39. In this
Figure, the vertical axis represents the vertical downward deflection; therefore, the actual
deformed shapes should be up-side-down. It can be observed in Figure 4.39 that the largest
deflection was observed at the mid-span of the beam.
Figure 4.37 Cracking Pattern of Beam A11

84
(a)
(b)
Figure 4.38 Test Results for Beam A11. a) Load vs. Deflection, b) Load vs. Concrete
Strain
0
20
40
60
80
100
120
0 10 20 30 40 50
Load
(K
N)
Deflection (mm)
B
A
0
20
40
60
80
100
120
0 500 1000 1500 2000 2500 3000 3500
Load
(K
N)
Concrete Strain (10-6)
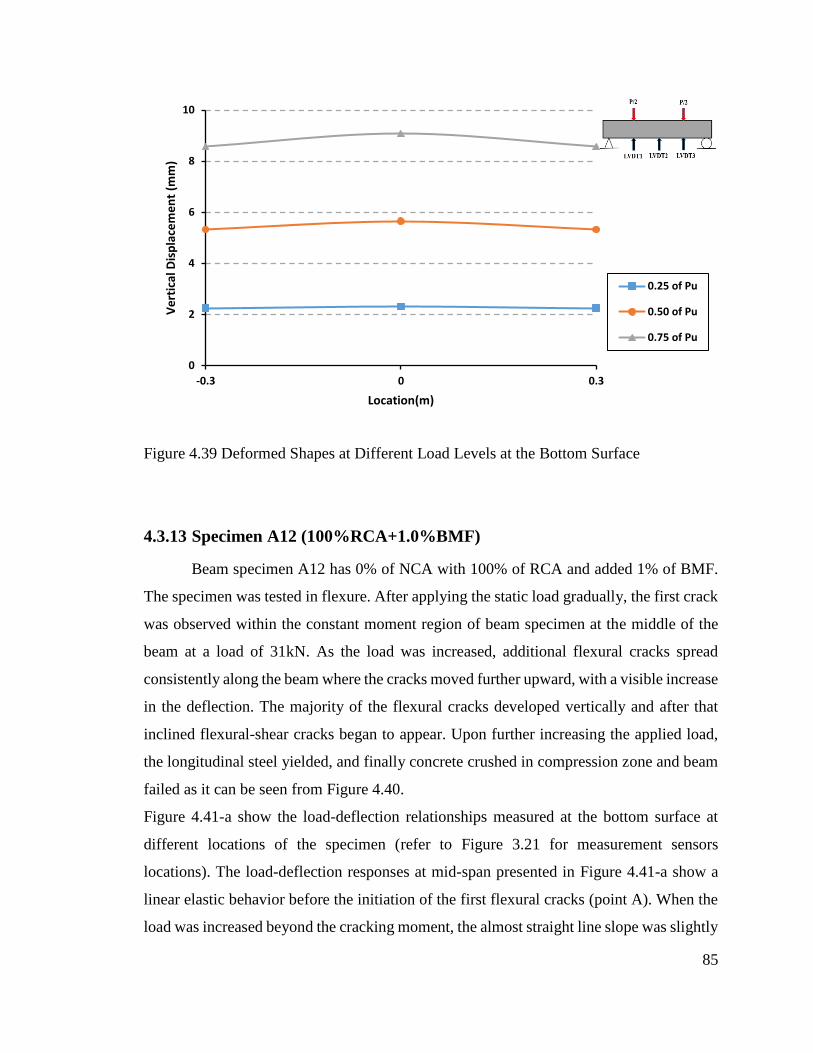
85
Figure 4.39 Deformed Shapes at Different Load Levels at the Bottom Surface
4.3.13 Specimen A12 (100%RCA+1.0%BMF)
Beam specimen A12 has 0% of NCA with 100% of RCA and added 1% of BMF.
The specimen was tested in flexure. After applying the static load gradually, the first crack
was observed within the constant moment region of beam specimen at the middle of the
beam at a load of 31kN. As the load was increased, additional flexural cracks spread
consistently along the beam where the cracks moved further upward, with a visible increase
in the deflection. The majority of the flexural cracks developed vertically and after that
inclined flexural-shear cracks began to appear. Upon further increasing the applied load,
the longitudinal steel yielded, and finally concrete crushed in compression zone and beam
failed as it can be seen from Figure 4.40.
Figure 4.41-a show the load-deflection relationships measured at the bottom surface at
different locations of the specimen (refer to Figure 3.21 for measurement sensors
locations). The load-deflection responses at mid-span presented in Figure 4.41-a show a
linear elastic behavior before the initiation of the first flexural cracks (point A). When the
load was increased beyond the cracking moment, the almost straight line slope was slightly
0
2
4
6
8
10
-0.3 0 0.3
Ve
rtic
al D
isp
lace
me
nt
(mm
)
Location(m)
0.25 of Pu
0.50 of Pu
0.75 of Pu
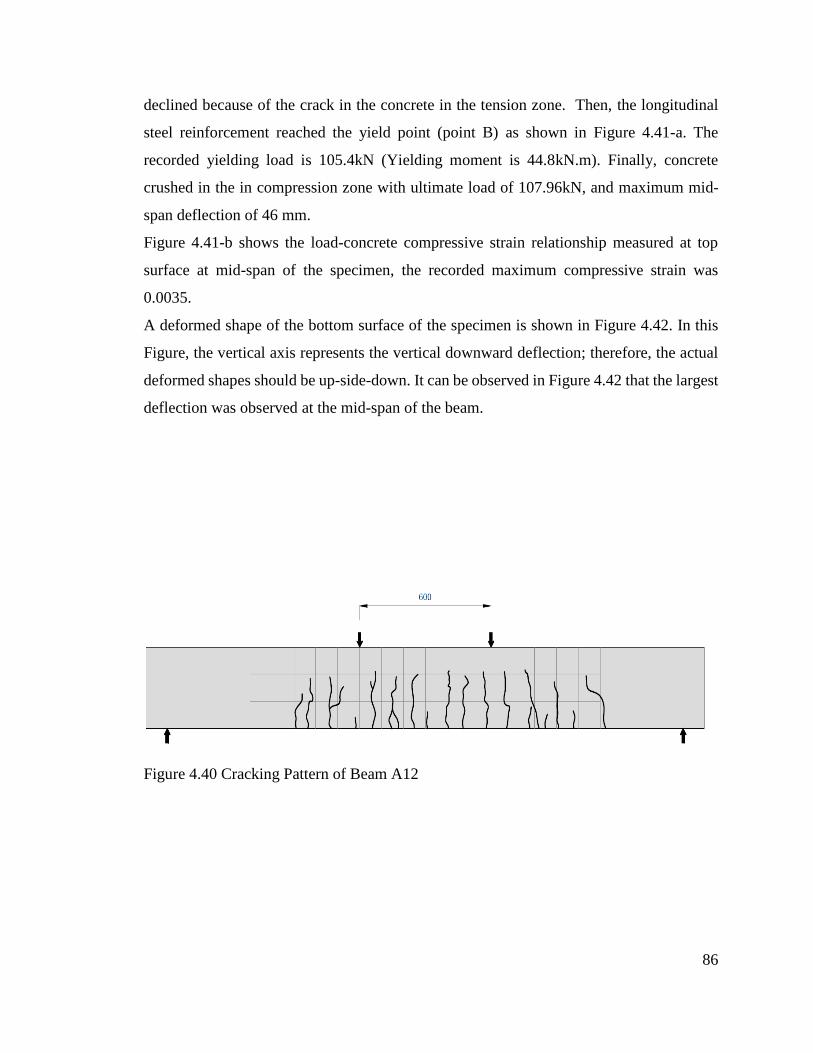
86
declined because of the crack in the concrete in the tension zone. Then, the longitudinal
steel reinforcement reached the yield point (point B) as shown in Figure 4.41-a. The
recorded yielding load is 105.4kN (Yielding moment is 44.8kN.m). Finally, concrete
crushed in the in compression zone with ultimate load of 107.96kN, and maximum mid-
span deflection of 46 mm.
Figure 4.41-b shows the load-concrete compressive strain relationship measured at top
surface at mid-span of the specimen, the recorded maximum compressive strain was
0.0035.
A deformed shape of the bottom surface of the specimen is shown in Figure 4.42. In this
Figure, the vertical axis represents the vertical downward deflection; therefore, the actual
deformed shapes should be up-side-down. It can be observed in Figure 4.42 that the largest
deflection was observed at the mid-span of the beam.
Figure 4.40 Cracking Pattern of Beam A12
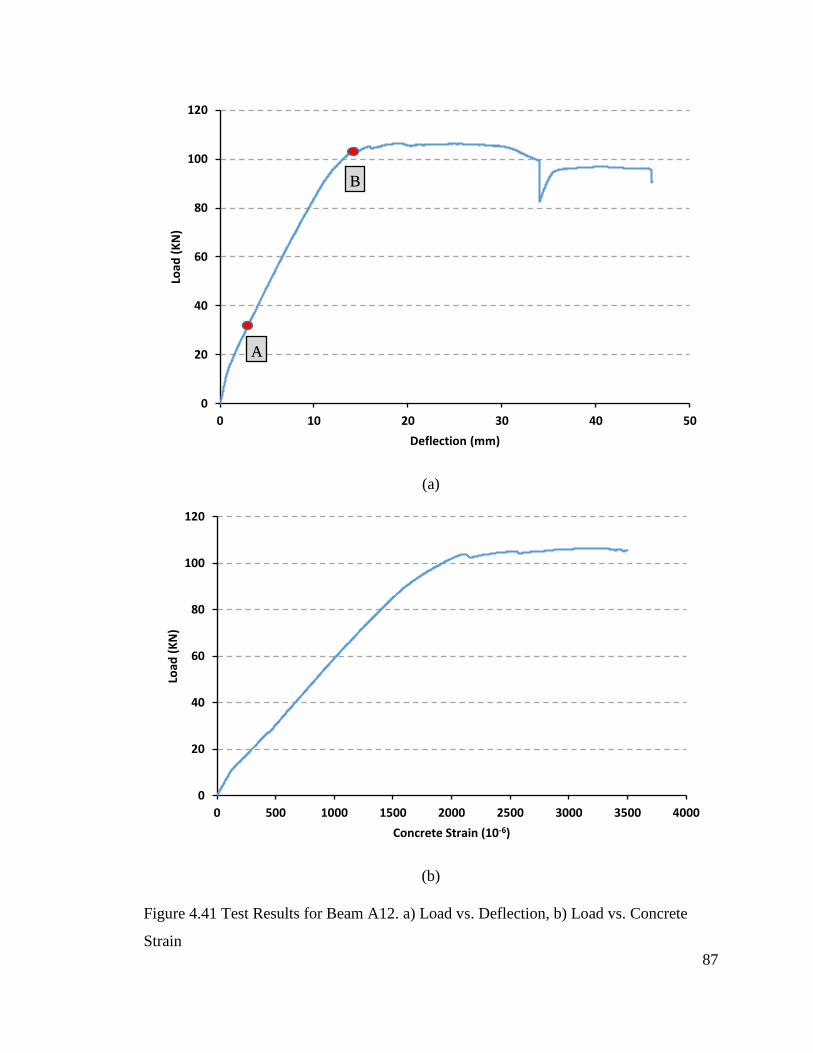
87
(a)
(b)
Figure 4.41 Test Results for Beam A12. a) Load vs. Deflection, b) Load vs. Concrete
Strain
0
20
40
60
80
100
120
0 10 20 30 40 50
Load
(K
N)
Deflection (mm)
B
A
0
20
40
60
80
100
120
0 500 1000 1500 2000 2500 3000 3500 4000
Load
(K
N)
Concrete Strain (10-6)

88
Figure 4.42 Deformed Shapes at Different Load Levels at the Bottom Surface
4.3.14 Specimen A14 (25%RCA+1.5%BMF)
Beam specimen A1 has 75% of NCA with 25% of RCA and added 1.5% of BMF.
The specimen was tested in flexure. After applying the static load gradually, the first crack
was observed within the constant moment region of beam specimen at the middle of the
beam at a load of 31kN. As the load was increased, additional flexural cracks spread
consistently along the beam where the cracks moved further upward, with a visible increase
in the deflection. The majority of the flexural cracks developed vertically and after that
inclined flexural-shear cracks began to appear. Upon further increasing the applied load,
the longitudinal steel yielded, and finally concrete crushed in compression zone and beam
failed as it can be seen from Figure 4.46.
Figure 4.47-a show the load-deflection relationships measured at the bottom surface at
different locations of the specimen (refer to Figure 3.21 for measurement sensors
locations). The load-deflection responses at mid-span presented in Figure 4.47-a show a
linear elastic behavior before the initiation of the first flexural cracks (point A). When the
0
2
4
6
8
10
-0.3 0 0.3
Ve
rtic
al D
isp
lace
me
nt
(mm
)
Location (m)
0.25 of Pu
0.50 of Pu
0.75 of Pu
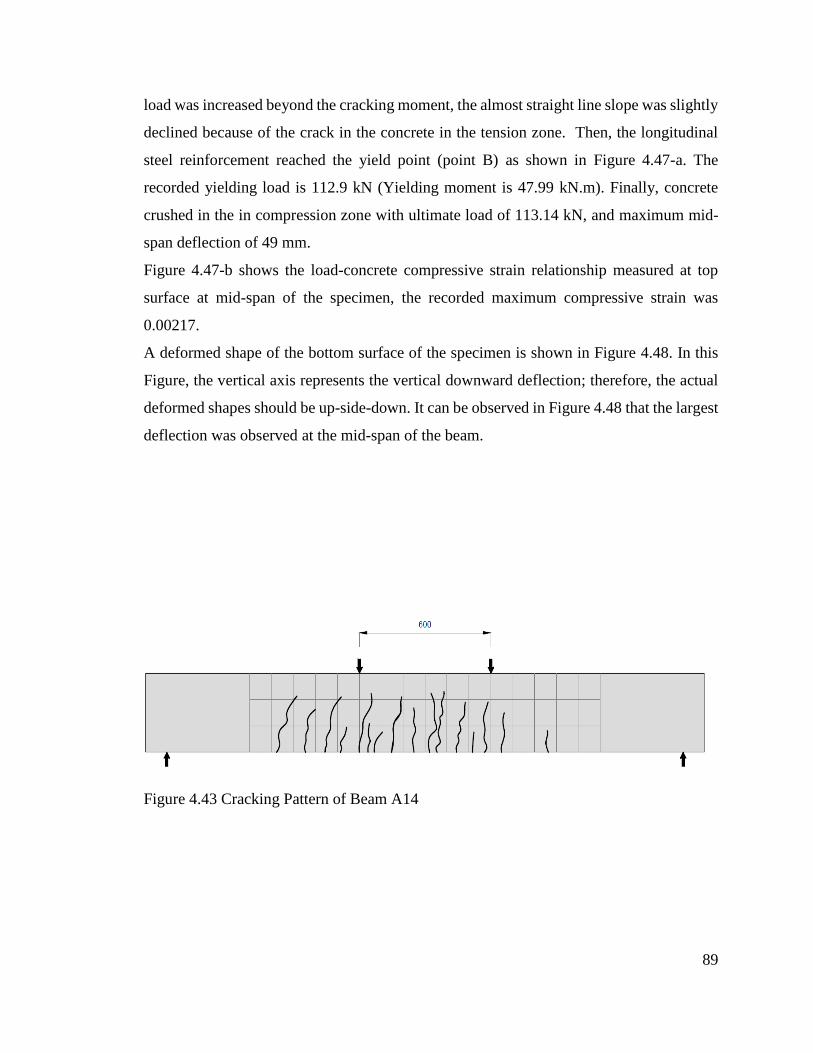
89
load was increased beyond the cracking moment, the almost straight line slope was slightly
declined because of the crack in the concrete in the tension zone. Then, the longitudinal
steel reinforcement reached the yield point (point B) as shown in Figure 4.47-a. The
recorded yielding load is 112.9 kN (Yielding moment is 47.99 kN.m). Finally, concrete
crushed in the in compression zone with ultimate load of 113.14 kN, and maximum mid-
span deflection of 49 mm.
Figure 4.47-b shows the load-concrete compressive strain relationship measured at top
surface at mid-span of the specimen, the recorded maximum compressive strain was
0.00217.
A deformed shape of the bottom surface of the specimen is shown in Figure 4.48. In this
Figure, the vertical axis represents the vertical downward deflection; therefore, the actual
deformed shapes should be up-side-down. It can be observed in Figure 4.48 that the largest
deflection was observed at the mid-span of the beam.
Figure 4.43 Cracking Pattern of Beam A14
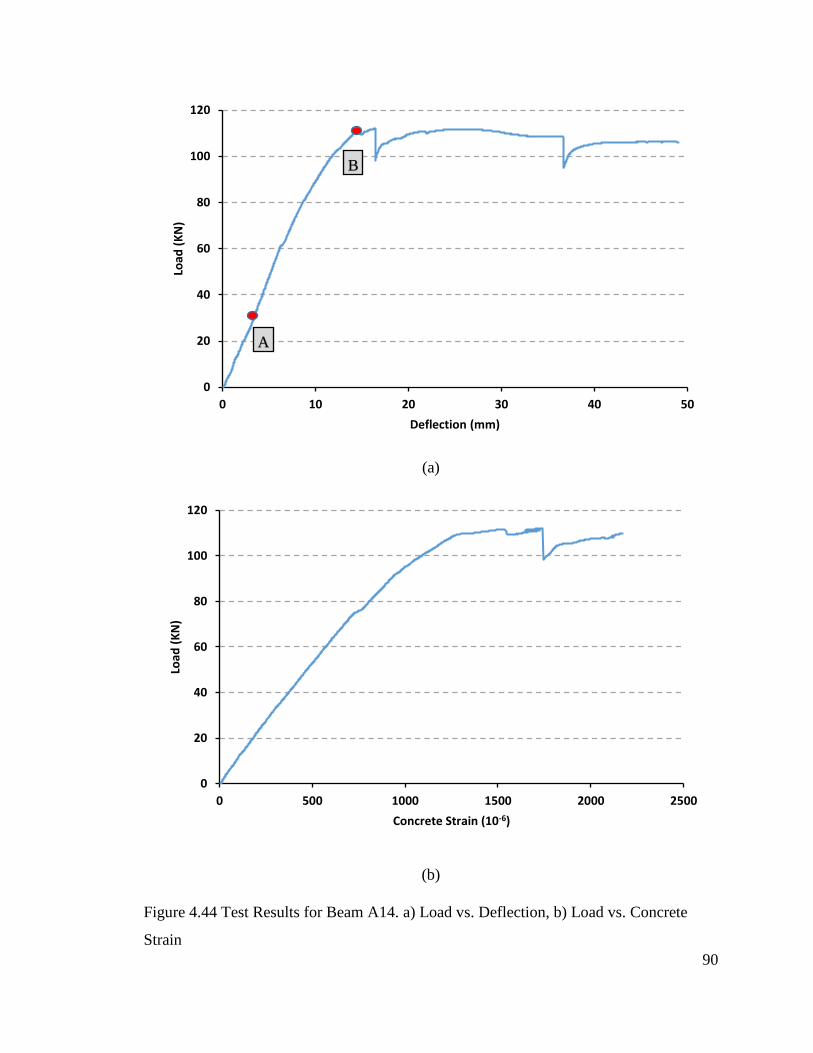
90
(a)
(b)
Figure 4.44 Test Results for Beam A14. a) Load vs. Deflection, b) Load vs. Concrete
Strain
0
20
40
60
80
100
120
0 10 20 30 40 50
Load
(K
N)
Deflection (mm)
B
A
0
20
40
60
80
100
120
0 500 1000 1500 2000 2500
Load
(K
N)
Concrete Strain (10-6)
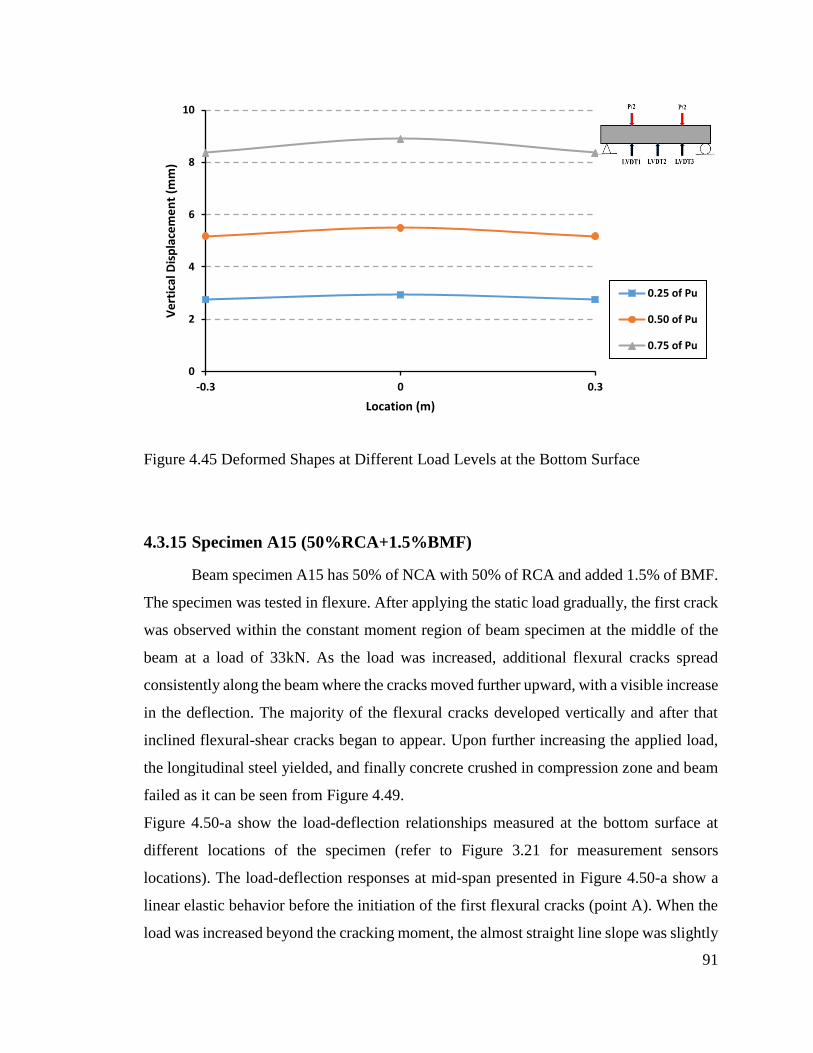
91
Figure 4.45 Deformed Shapes at Different Load Levels at the Bottom Surface
4.3.15 Specimen A15 (50%RCA+1.5%BMF)
Beam specimen A15 has 50% of NCA with 50% of RCA and added 1.5% of BMF.
The specimen was tested in flexure. After applying the static load gradually, the first crack
was observed within the constant moment region of beam specimen at the middle of the
beam at a load of 33kN. As the load was increased, additional flexural cracks spread
consistently along the beam where the cracks moved further upward, with a visible increase
in the deflection. The majority of the flexural cracks developed vertically and after that
inclined flexural-shear cracks began to appear. Upon further increasing the applied load,
the longitudinal steel yielded, and finally concrete crushed in compression zone and beam
failed as it can be seen from Figure 4.49.
Figure 4.50-a show the load-deflection relationships measured at the bottom surface at
different locations of the specimen (refer to Figure 3.21 for measurement sensors
locations). The load-deflection responses at mid-span presented in Figure 4.50-a show a
linear elastic behavior before the initiation of the first flexural cracks (point A). When the
load was increased beyond the cracking moment, the almost straight line slope was slightly
0
2
4
6
8
10
-0.3 0 0.3
Ve
rtic
al D
isp
lace
me
nt
(mm
)
Location (m)
0.25 of Pu
0.50 of Pu
0.75 of Pu
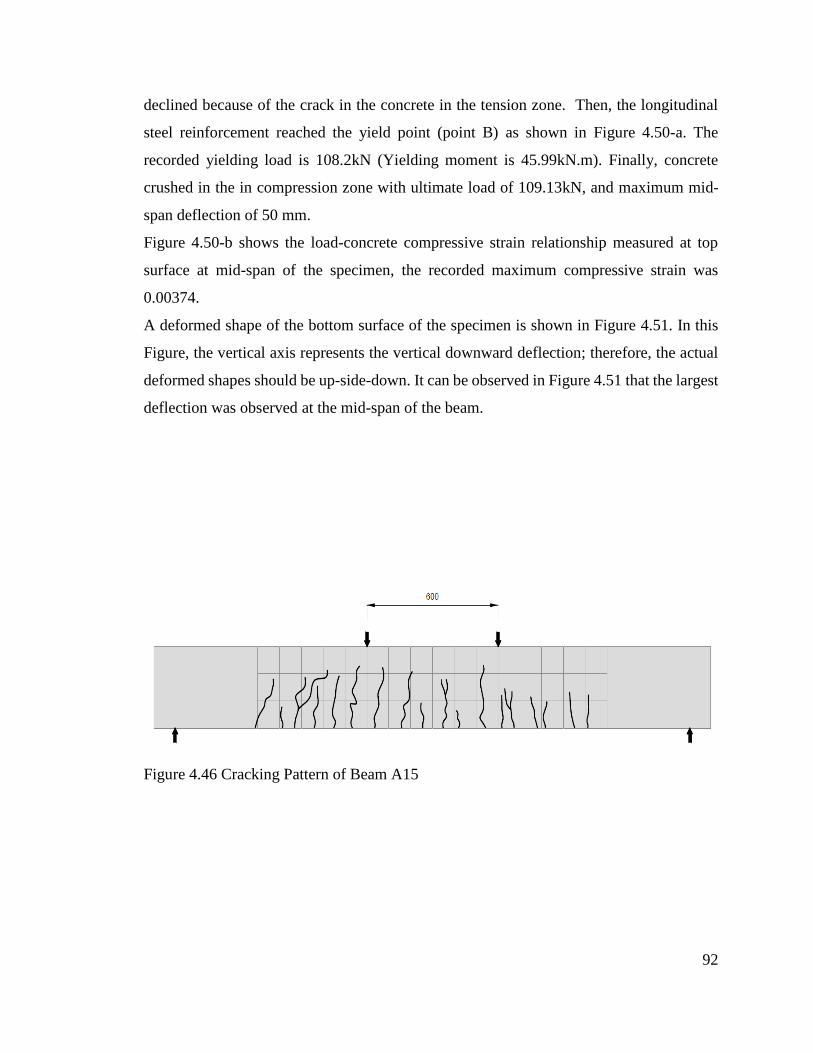
92
declined because of the crack in the concrete in the tension zone. Then, the longitudinal
steel reinforcement reached the yield point (point B) as shown in Figure 4.50-a. The
recorded yielding load is 108.2kN (Yielding moment is 45.99kN.m). Finally, concrete
crushed in the in compression zone with ultimate load of 109.13kN, and maximum mid-
span deflection of 50 mm.
Figure 4.50-b shows the load-concrete compressive strain relationship measured at top
surface at mid-span of the specimen, the recorded maximum compressive strain was
0.00374.
A deformed shape of the bottom surface of the specimen is shown in Figure 4.51. In this
Figure, the vertical axis represents the vertical downward deflection; therefore, the actual
deformed shapes should be up-side-down. It can be observed in Figure 4.51 that the largest
deflection was observed at the mid-span of the beam.
Figure 4.46 Cracking Pattern of Beam A15

93
(a)
(b)
Figure 4.47 Test Results for Beam A15. a) Load vs. Deflection, b) Load vs. Concrete
Strain
0
20
40
60
80
100
120
0 10 20 30 40 50
Load
(K
N)
Deflection (mm)
A
B
0
20
40
60
80
100
120
0 500 1000 1500 2000 2500 3000 3500 4000
Load
(K
N)
Concrete Strain (10-6)
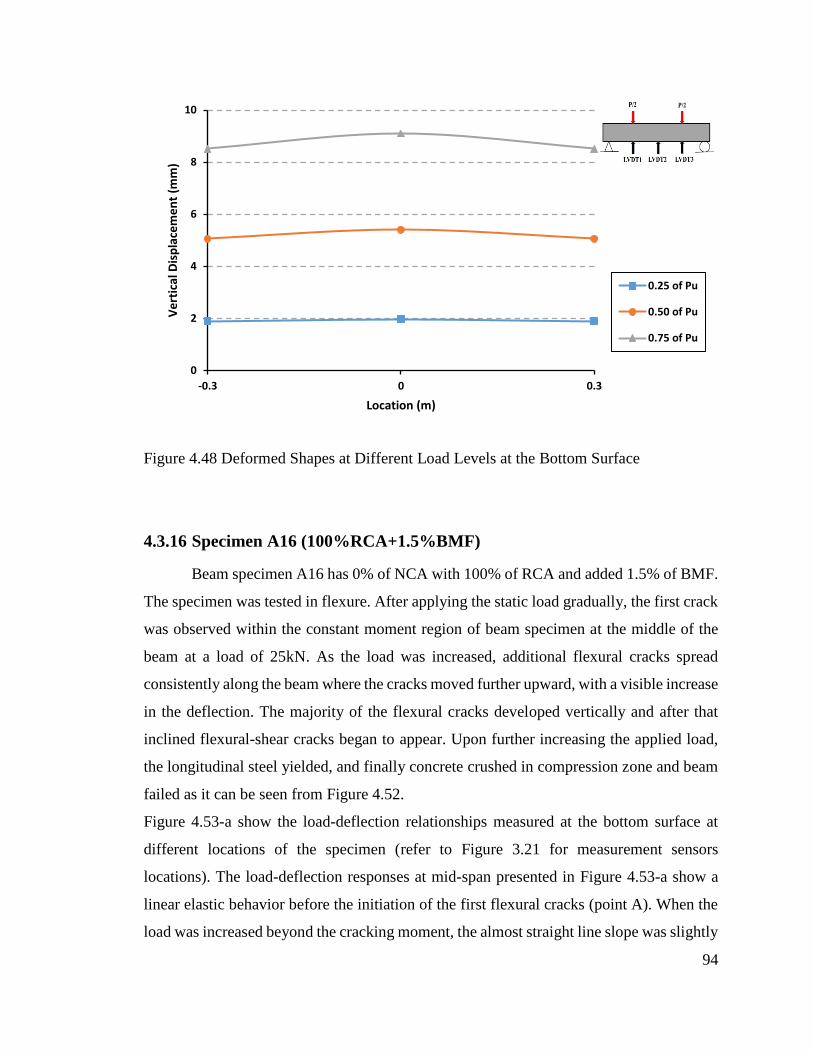
94
Figure 4.48 Deformed Shapes at Different Load Levels at the Bottom Surface
4.3.16 Specimen A16 (100%RCA+1.5%BMF)
Beam specimen A16 has 0% of NCA with 100% of RCA and added 1.5% of BMF.
The specimen was tested in flexure. After applying the static load gradually, the first crack
was observed within the constant moment region of beam specimen at the middle of the
beam at a load of 25kN. As the load was increased, additional flexural cracks spread
consistently along the beam where the cracks moved further upward, with a visible increase
in the deflection. The majority of the flexural cracks developed vertically and after that
inclined flexural-shear cracks began to appear. Upon further increasing the applied load,
the longitudinal steel yielded, and finally concrete crushed in compression zone and beam
failed as it can be seen from Figure 4.52.
Figure 4.53-a show the load-deflection relationships measured at the bottom surface at
different locations of the specimen (refer to Figure 3.21 for measurement sensors
locations). The load-deflection responses at mid-span presented in Figure 4.53-a show a
linear elastic behavior before the initiation of the first flexural cracks (point A). When the
load was increased beyond the cracking moment, the almost straight line slope was slightly
0
2
4
6
8
10
-0.3 0 0.3
Ve
rtic
al D
isp
lace
me
nt
(mm
)
Location (m)
0.25 of Pu
0.50 of Pu
0.75 of Pu

95
declined because of the crack in the concrete in the tension zone. Then, the longitudinal
steel reinforcement reached the yield point (point B) as shown in Figure 4.53-a. The
recorded yielding load is 114kN (Yielding moment is 48.3kN.m). Finally, concrete crushed
in the in compression zone with ultimate load of 116.05 kN, and maximum mid-span
deflection of 54 mm.
Figure 4.53-b shows the load-concrete compressive strain relationship measured at top
surface at mid-span of the specimen, the recorded maximum compressive strain was
0.00372.
A deformed shape of the bottom surface of the specimen is shown in Figure 4.54. In this
Figure, the vertical axis represents the vertical downward deflection; therefore, the actual
deformed shapes should be up-side-down. It can be observed in Figure 4.54 that the largest
deflection was observed at the mid-span of the beam.
Figure 4.49 Cracking Pattern of Beam A16
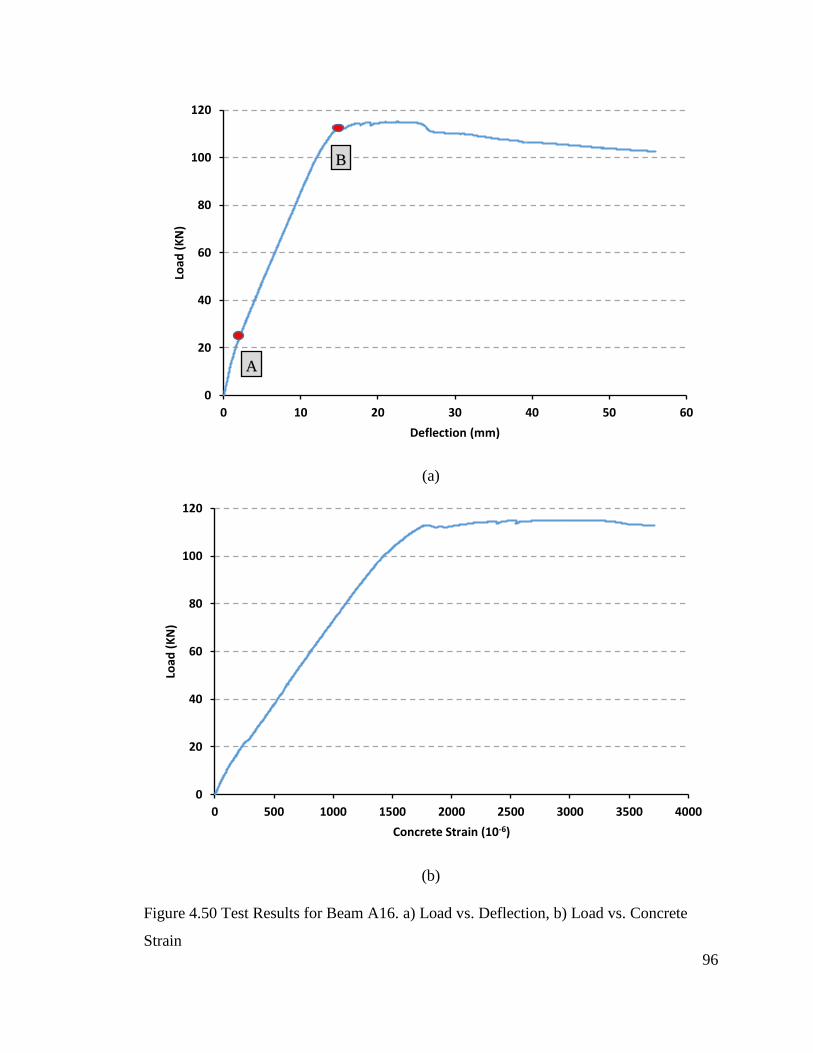
96
(a)
(b)
Figure 4.50 Test Results for Beam A16. a) Load vs. Deflection, b) Load vs. Concrete
Strain
0
20
40
60
80
100
120
0 10 20 30 40 50 60
Load
(K
N)
Deflection (mm)
A
B
0
20
40
60
80
100
120
0 500 1000 1500 2000 2500 3000 3500 4000
Load
(K
N)
Concrete Strain (10-6)
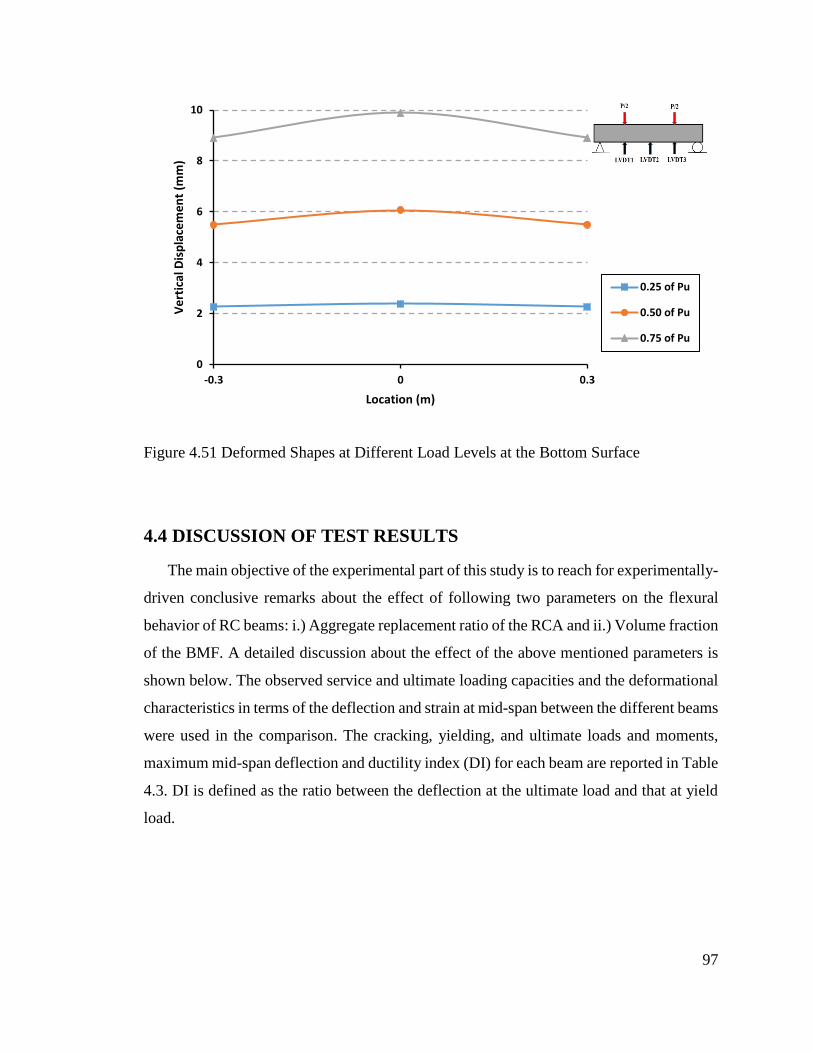
97
Figure 4.51 Deformed Shapes at Different Load Levels at the Bottom Surface
4.4 DISCUSSION OF TEST RESULTS
The main objective of the experimental part of this study is to reach for experimentally-
driven conclusive remarks about the effect of following two parameters on the flexural
behavior of RC beams: i.) Aggregate replacement ratio of the RCA and ii.) Volume fraction
of the BMF. A detailed discussion about the effect of the above mentioned parameters is
shown below. The observed service and ultimate loading capacities and the deformational
characteristics in terms of the deflection and strain at mid-span between the different beams
were used in the comparison. The cracking, yielding, and ultimate loads and moments,
maximum mid-span deflection and ductility index (DI) for each beam are reported in Table
4.3. DI is defined as the ratio between the deflection at the ultimate load and that at yield
load.
0
2
4
6
8
10
-0.3 0 0.3
Ve
rtic
al D
isp
lace
me
nt
(mm
)
Location (m)
0.25 of Pu
0.50 of Pu
0.75 of Pu
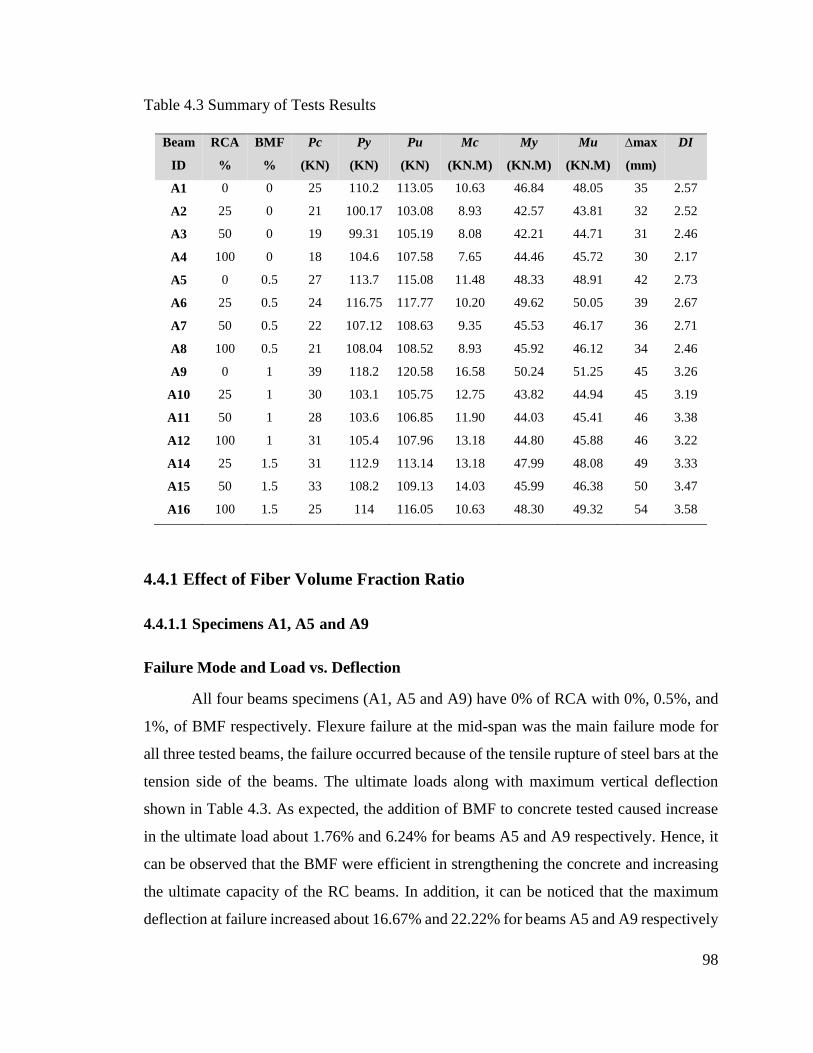
98
Table 4.3 Summary of Tests Results
Beam
ID
RCA
%
BMF
%
Pc
(KN)
Py
(KN)
Pu
(KN)
Mc
(KN.M)
My
(KN.M)
Mu
(KN.M)
∆max
(mm)
DI
A1 0 0 25 110.2 113.05 10.63 46.84 48.05 35 2.57
A2 25 0 21 100.17 103.08 8.93 42.57 43.81 32 2.52
A3 50 0 19 99.31 105.19 8.08 42.21 44.71 31 2.46
A4 100 0 18 104.6 107.58 7.65 44.46 45.72 30 2.17
A5 0 0.5 27 113.7 115.08 11.48 48.33 48.91 42 2.73
A6 25 0.5 24 116.75 117.77 10.20 49.62 50.05 39 2.67
A7 50 0.5 22 107.12 108.63 9.35 45.53 46.17 36 2.71
A8 100 0.5 21 108.04 108.52 8.93 45.92 46.12 34 2.46
A9 0 1 39 118.2 120.58 16.58 50.24 51.25 45 3.26
A10 25 1 30 103.1 105.75 12.75 43.82 44.94 45 3.19
A11 50 1 28 103.6 106.85 11.90 44.03 45.41 46 3.38
A12 100 1 31 105.4 107.96 13.18 44.80 45.88 46 3.22
A14 25 1.5 31 112.9 113.14 13.18 47.99 48.08 49 3.33
A15 50 1.5 33 108.2 109.13 14.03 45.99 46.38 50 3.47
A16 100 1.5 25 114 116.05 10.63 48.30 49.32 54 3.58
4.4.1 Effect of Fiber Volume Fraction Ratio
4.4.1.1 Specimens A1, A5 and A9
Failure Mode and Load vs. Deflection
All four beams specimens (A1, A5 and A9) have 0% of RCA with 0%, 0.5%, and
1%, of BMF respectively. Flexure failure at the mid-span was the main failure mode for
all three tested beams, the failure occurred because of the tensile rupture of steel bars at the
tension side of the beams. The ultimate loads along with maximum vertical deflection
shown in Table 4.3. As expected, the addition of BMF to concrete tested caused increase
in the ultimate load about 1.76% and 6.24% for beams A5 and A9 respectively. Hence, it
can be observed that the BMF were efficient in strengthening the concrete and increasing
the ultimate capacity of the RC beams. In addition, it can be noticed that the maximum
deflection at failure increased about 16.67% and 22.22% for beams A5 and A9 respectively

99
comparing with control beam A1. The largest maximum deflection at failure was observed
in beam A9.
As BMF volume fraction increased, beams presented larger deflection before failure. The
reason can be due to the effects of BMF and high bonding between BMF and concrete
matrix. It can be concluded that the beams with BMF were stiffer than the control beam.
In addition, the energy absorption and the ability to transfer the tensile forces under flexural
loading were greatly enhanced by using BMF.
Figure 4.52 Load vs. Deflection for Specimens A1, A5 and A9
0
20
40
60
80
100
120
0 10 20 30 40 50
Load
(K
N)
Deflection (mm)
A1
A5
A9

100
Crack Pattern
Figure 4.56 illustrate the crack propagation and crack spacing at various loading
stages from first crack up to failure for beams A5 and A9 and their corresponding control
beam A1 photographically. The first flexural crack in beam specimen A1 was noticed at
the mid-span at load of 25kN, while the first crack in the specimens A5 and A9 were
noticed at 27kN and 39kN respectively. In general, the RC beams made with BMF
experienced slightly larger crack spacing, and exhibited a less number of flexural cracks as
shown in Table 4.4. This is a clear indication that increasing the BMF content in concrete
mix resulted in the redistribution of the tensile stresses. Unfortunately, due to the presence
of technical issues with the crack transducers, crack widths measurements were not
accurate, and were ignored. Though, visual observations showed significant difference
among the crack widths of the 4 different beams.
Figure 4.53 Crack Pattern in Test Beams A1, A5 and A9
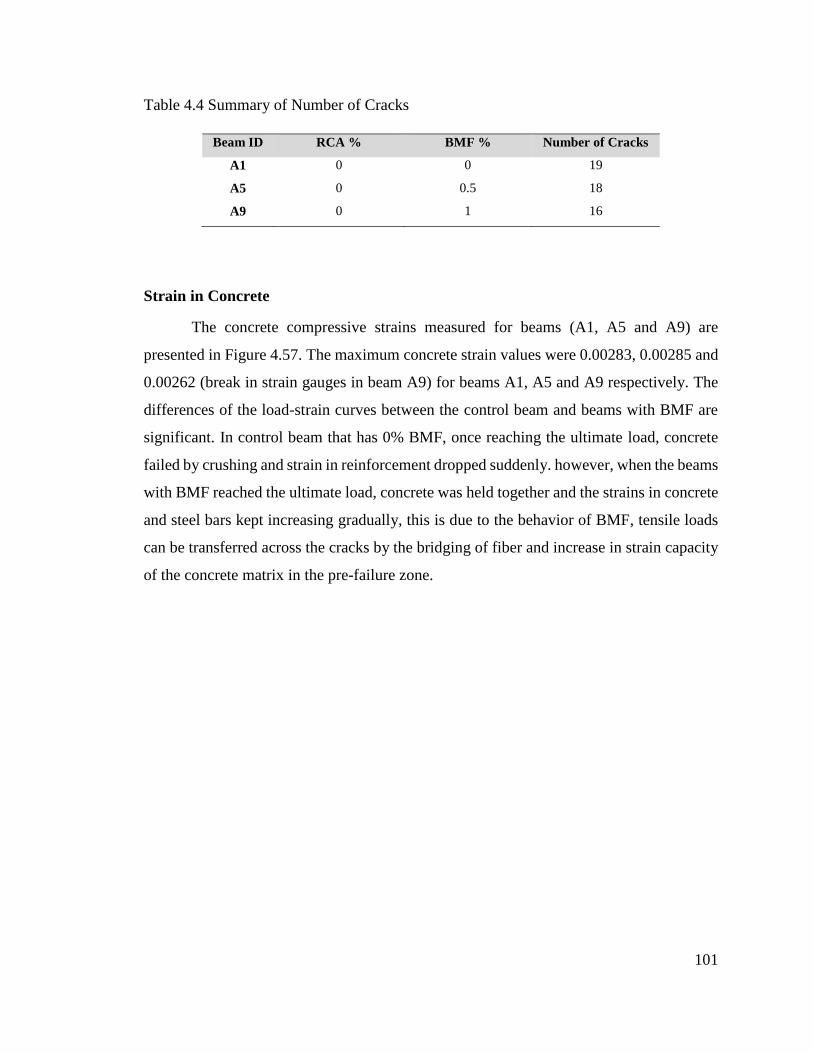
101
Table 4.4 Summary of Number of Cracks
Beam ID RCA % BMF % Number of Cracks
A1 0 0 19
A5 0 0.5 18
A9 0 1 16
Strain in Concrete
The concrete compressive strains measured for beams (A1, A5 and A9) are
presented in Figure 4.57. The maximum concrete strain values were 0.00283, 0.00285 and
0.00262 (break in strain gauges in beam A9) for beams A1, A5 and A9 respectively. The
differences of the load-strain curves between the control beam and beams with BMF are
significant. In control beam that has 0% BMF, once reaching the ultimate load, concrete
failed by crushing and strain in reinforcement dropped suddenly. however, when the beams
with BMF reached the ultimate load, concrete was held together and the strains in concrete
and steel bars kept increasing gradually, this is due to the behavior of BMF, tensile loads
can be transferred across the cracks by the bridging of fiber and increase in strain capacity
of the concrete matrix in the pre-failure zone.
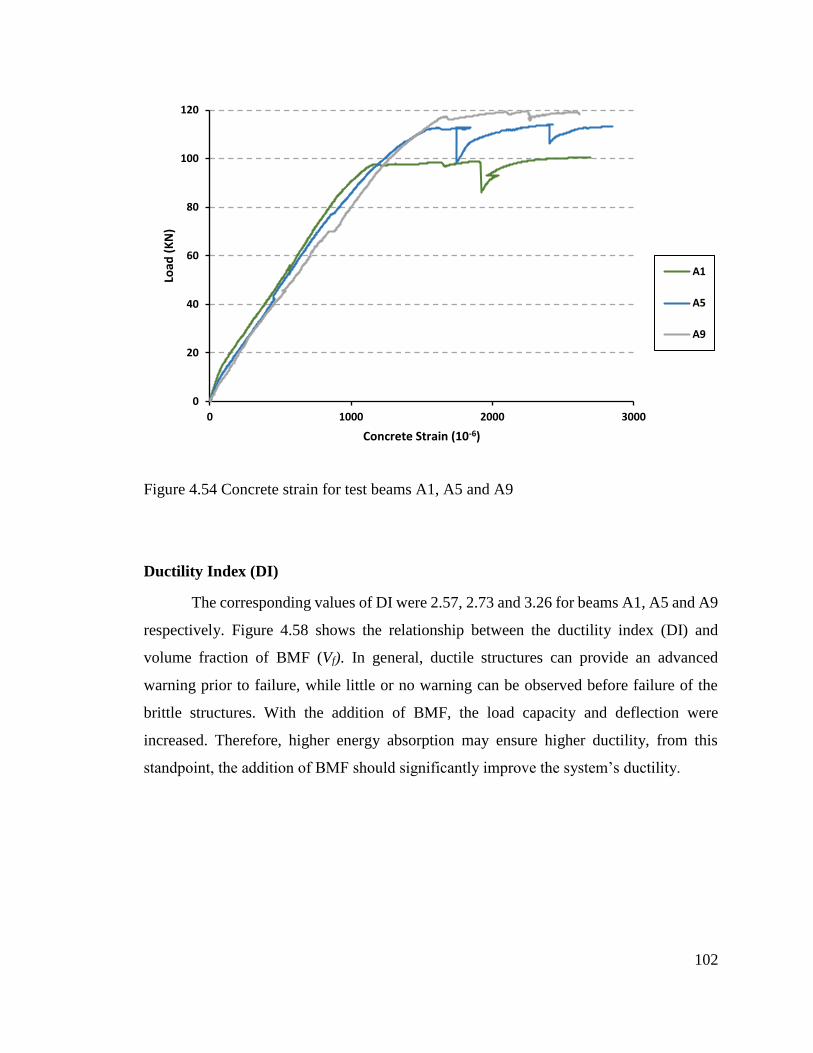
102
Figure 4.54 Concrete strain for test beams A1, A5 and A9
Ductility Index (DI)
The corresponding values of DI were 2.57, 2.73 and 3.26 for beams A1, A5 and A9
respectively. Figure 4.58 shows the relationship between the ductility index (DI) and
volume fraction of BMF (Vf). In general, ductile structures can provide an advanced
warning prior to failure, while little or no warning can be observed before failure of the
brittle structures. With the addition of BMF, the load capacity and deflection were
increased. Therefore, higher energy absorption may ensure higher ductility, from this
standpoint, the addition of BMF should significantly improve the system’s ductility.
0
20
40
60
80
100
120
0 1000 2000 3000
Load
(K
N)
Concrete Strain (10-6)
A1
A5
A9
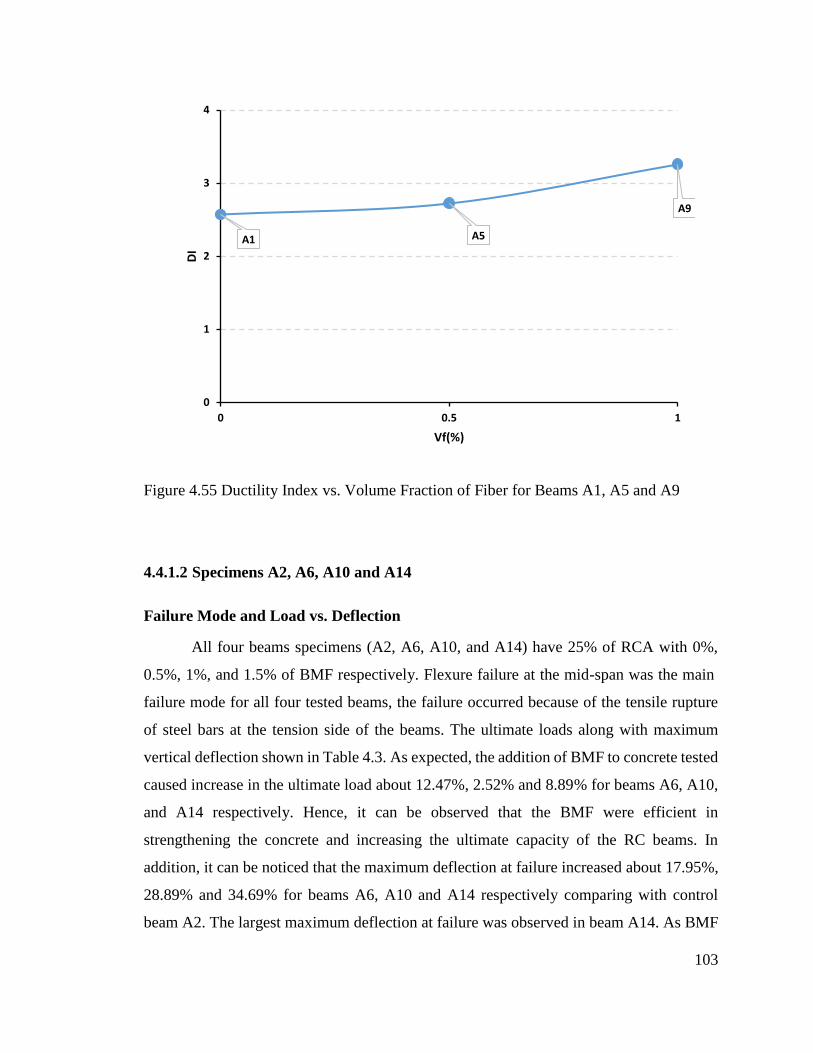
103
Figure 4.55 Ductility Index vs. Volume Fraction of Fiber for Beams A1, A5 and A9
4.4.1.2 Specimens A2, A6, A10 and A14
Failure Mode and Load vs. Deflection
All four beams specimens (A2, A6, A10, and A14) have 25% of RCA with 0%,
0.5%, 1%, and 1.5% of BMF respectively. Flexure failure at the mid-span was the main
failure mode for all four tested beams, the failure occurred because of the tensile rupture
of steel bars at the tension side of the beams. The ultimate loads along with maximum
vertical deflection shown in Table 4.3. As expected, the addition of BMF to concrete tested
caused increase in the ultimate load about 12.47%, 2.52% and 8.89% for beams A6, A10,
and A14 respectively. Hence, it can be observed that the BMF were efficient in
strengthening the concrete and increasing the ultimate capacity of the RC beams. In
addition, it can be noticed that the maximum deflection at failure increased about 17.95%,
28.89% and 34.69% for beams A6, A10 and A14 respectively comparing with control
beam A2. The largest maximum deflection at failure was observed in beam A14. As BMF
A1 A5
A9
0
1
2
3
4
0 0.5 1
DI
Vf(%)
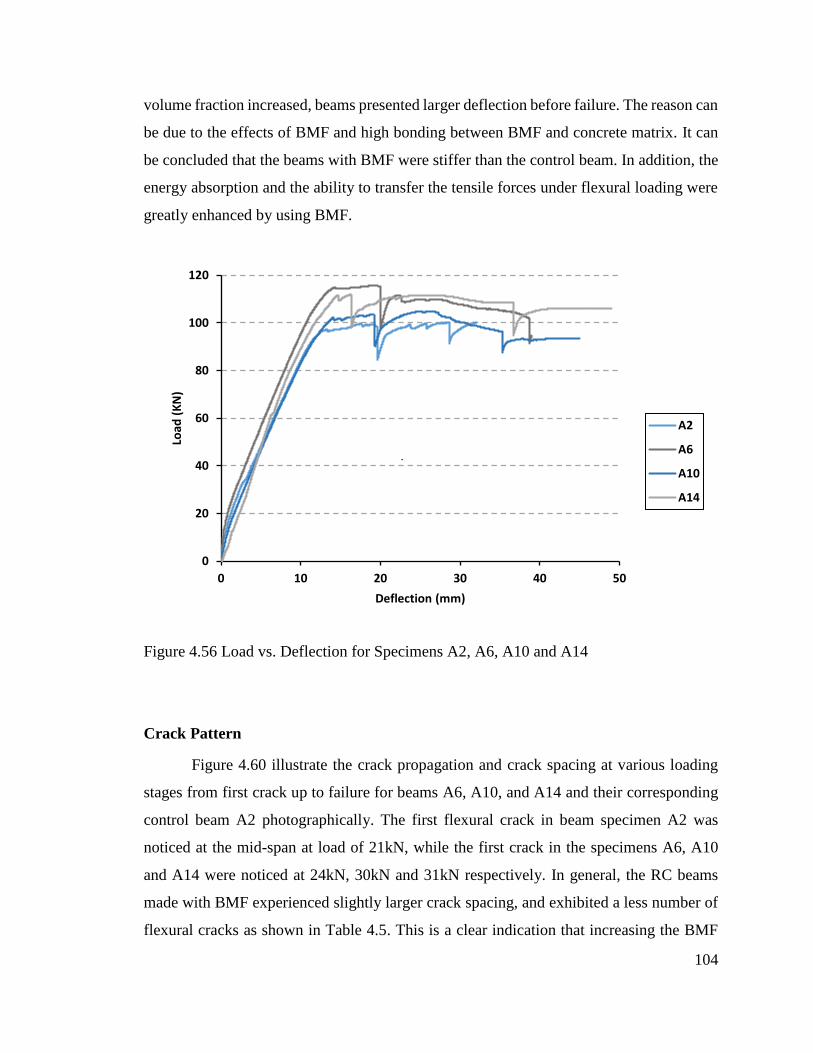
104
volume fraction increased, beams presented larger deflection before failure. The reason can
be due to the effects of BMF and high bonding between BMF and concrete matrix. It can
be concluded that the beams with BMF were stiffer than the control beam. In addition, the
energy absorption and the ability to transfer the tensile forces under flexural loading were
greatly enhanced by using BMF.
Figure 4.56 Load vs. Deflection for Specimens A2, A6, A10 and A14
Crack Pattern
Figure 4.60 illustrate the crack propagation and crack spacing at various loading
stages from first crack up to failure for beams A6, A10, and A14 and their corresponding
control beam A2 photographically. The first flexural crack in beam specimen A2 was
noticed at the mid-span at load of 21kN, while the first crack in the specimens A6, A10
and A14 were noticed at 24kN, 30kN and 31kN respectively. In general, the RC beams
made with BMF experienced slightly larger crack spacing, and exhibited a less number of
flexural cracks as shown in Table 4.5. This is a clear indication that increasing the BMF
0
20
40
60
80
100
120
0 10 20 30 40 50
Load
(K
N)
Deflection (mm)
A2
A6
A10
A14
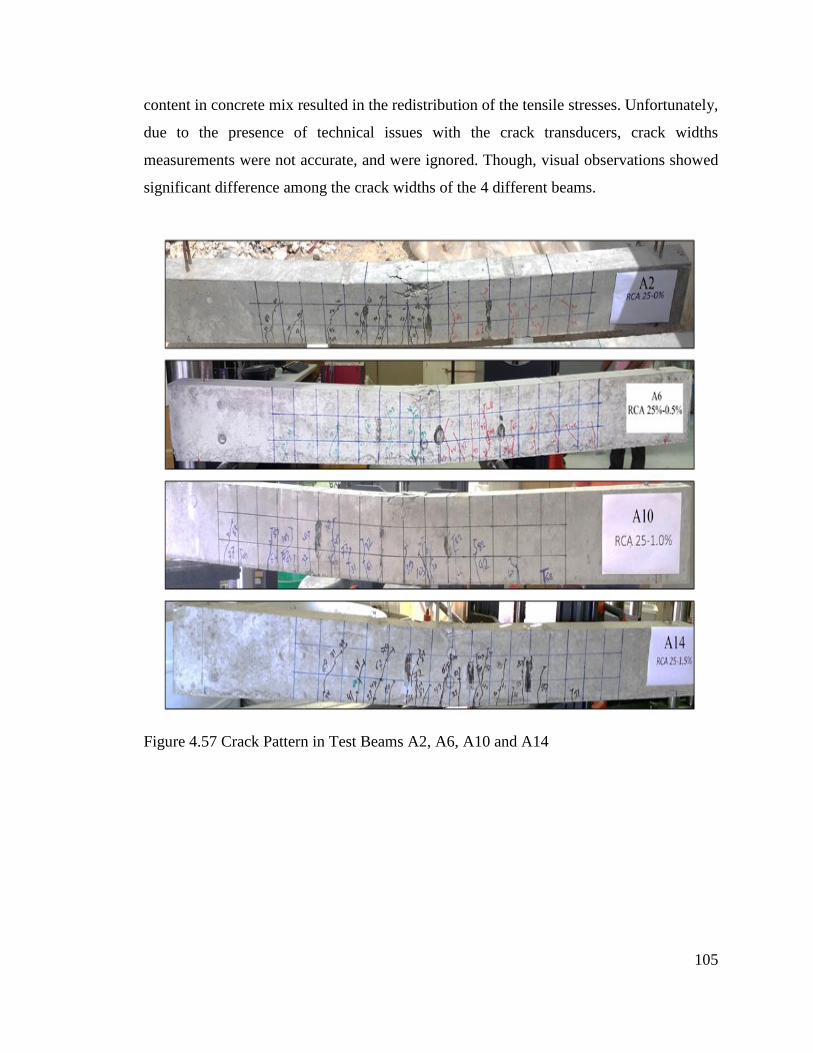
105
content in concrete mix resulted in the redistribution of the tensile stresses. Unfortunately,
due to the presence of technical issues with the crack transducers, crack widths
measurements were not accurate, and were ignored. Though, visual observations showed
significant difference among the crack widths of the 4 different beams.
Figure 4.57 Crack Pattern in Test Beams A2, A6, A10 and A14
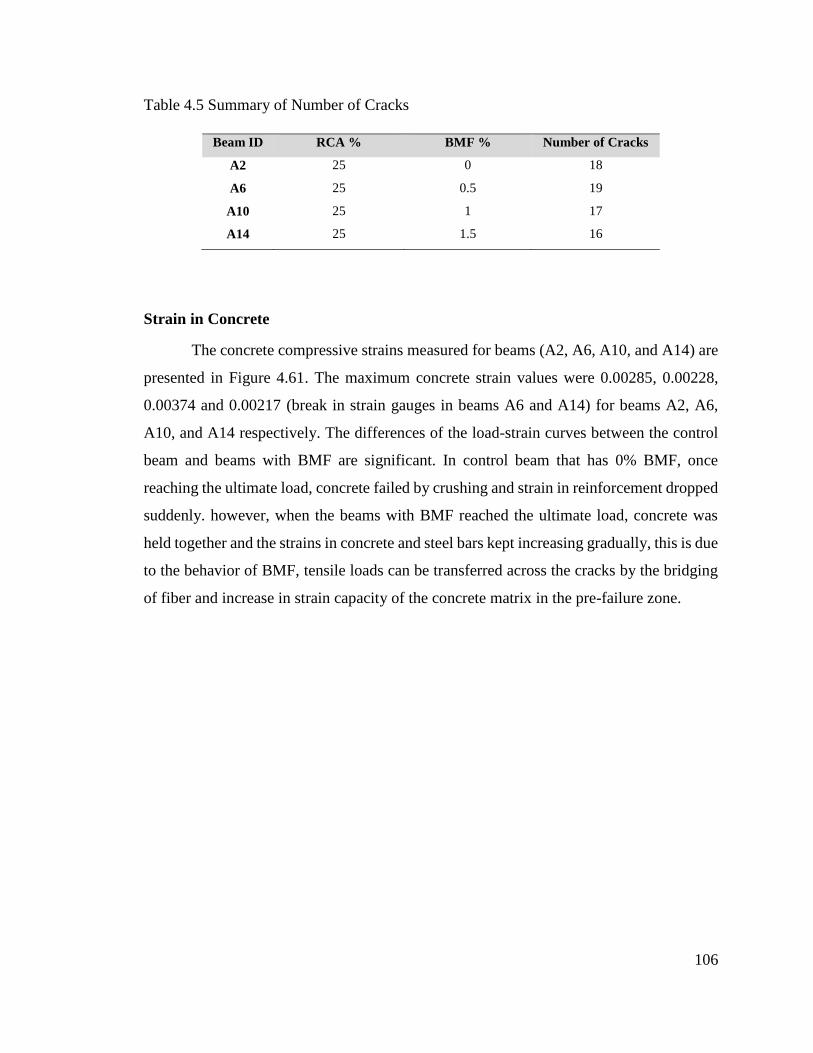
106
Table 4.5 Summary of Number of Cracks
Beam ID RCA % BMF % Number of Cracks
A2 25 0 18
A6 25 0.5 19
A10 25 1 17
A14 25 1.5 16
Strain in Concrete
The concrete compressive strains measured for beams (A2, A6, A10, and A14) are
presented in Figure 4.61. The maximum concrete strain values were 0.00285, 0.00228,
0.00374 and 0.00217 (break in strain gauges in beams A6 and A14) for beams A2, A6,
A10, and A14 respectively. The differences of the load-strain curves between the control
beam and beams with BMF are significant. In control beam that has 0% BMF, once
reaching the ultimate load, concrete failed by crushing and strain in reinforcement dropped
suddenly. however, when the beams with BMF reached the ultimate load, concrete was
held together and the strains in concrete and steel bars kept increasing gradually, this is due
to the behavior of BMF, tensile loads can be transferred across the cracks by the bridging
of fiber and increase in strain capacity of the concrete matrix in the pre-failure zone.
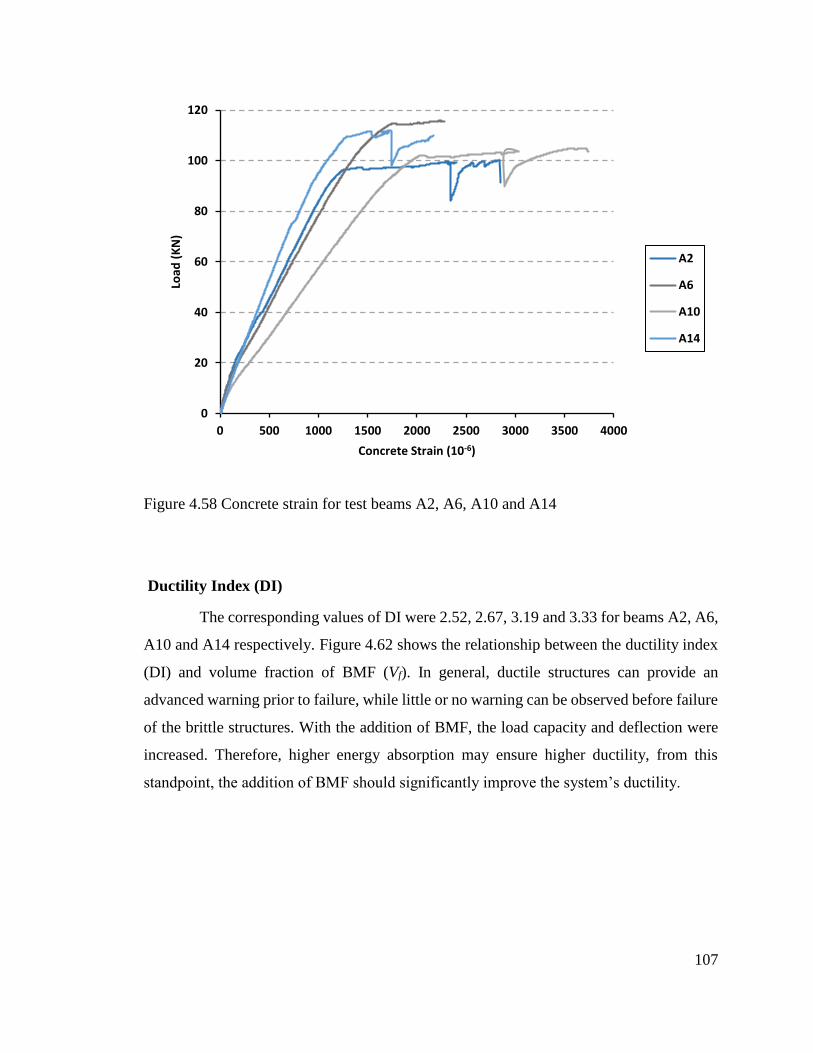
107
Figure 4.58 Concrete strain for test beams A2, A6, A10 and A14
Ductility Index (DI)
The corresponding values of DI were 2.52, 2.67, 3.19 and 3.33 for beams A2, A6,
A10 and A14 respectively. Figure 4.62 shows the relationship between the ductility index
(DI) and volume fraction of BMF (Vf). In general, ductile structures can provide an
advanced warning prior to failure, while little or no warning can be observed before failure
of the brittle structures. With the addition of BMF, the load capacity and deflection were
increased. Therefore, higher energy absorption may ensure higher ductility, from this
standpoint, the addition of BMF should significantly improve the system’s ductility.
0
20
40
60
80
100
120
0 500 1000 1500 2000 2500 3000 3500 4000
Load
(K
N)
Concrete Strain (10-6)
A2
A6
A10
A14
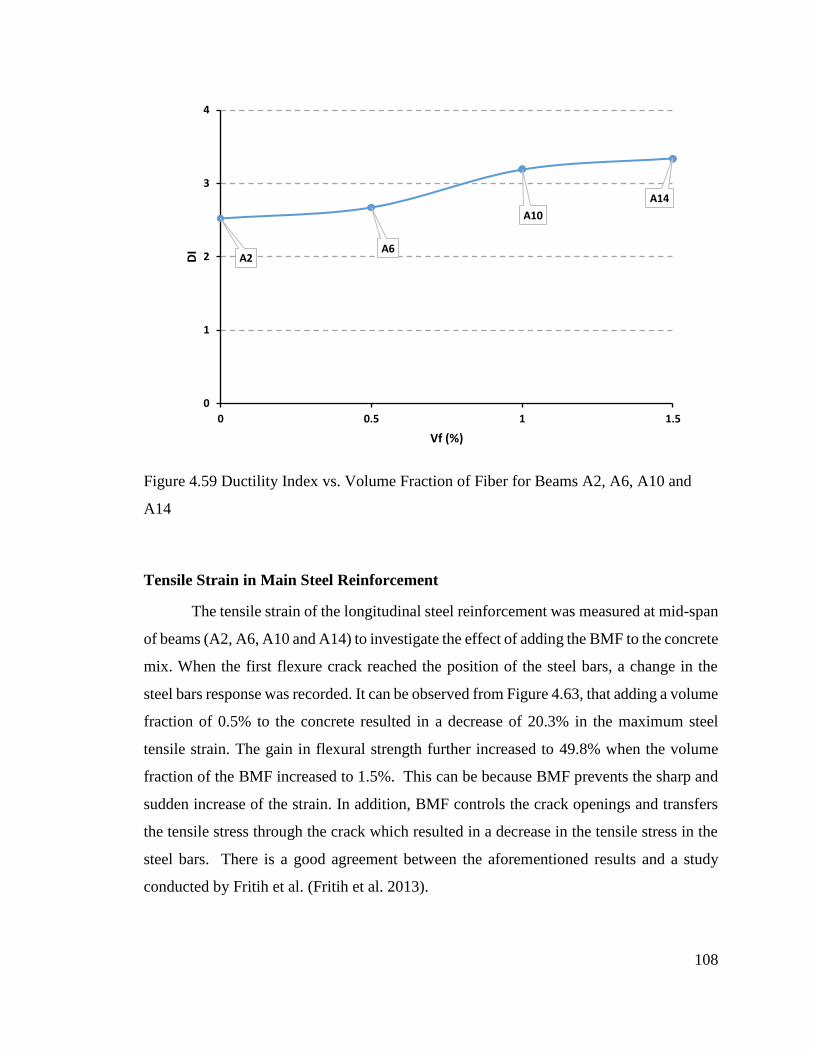
108
Figure 4.59 Ductility Index vs. Volume Fraction of Fiber for Beams A2, A6, A10 and
A14
Tensile Strain in Main Steel Reinforcement
The tensile strain of the longitudinal steel reinforcement was measured at mid-span
of beams (A2, A6, A10 and A14) to investigate the effect of adding the BMF to the concrete
mix. When the first flexure crack reached the position of the steel bars, a change in the
steel bars response was recorded. It can be observed from Figure 4.63, that adding a volume
fraction of 0.5% to the concrete resulted in a decrease of 20.3% in the maximum steel
tensile strain. The gain in flexural strength further increased to 49.8% when the volume
fraction of the BMF increased to 1.5%. This can be because BMF prevents the sharp and
sudden increase of the strain. In addition, BMF controls the crack openings and transfers
the tensile stress through the crack which resulted in a decrease in the tensile stress in the
steel bars. There is a good agreement between the aforementioned results and a study
conducted by Fritih et al. (Fritih et al. 2013).
A2A6
A10
A14
0
1
2
3
4
0 0.5 1 1.5
DI
Vf (%)
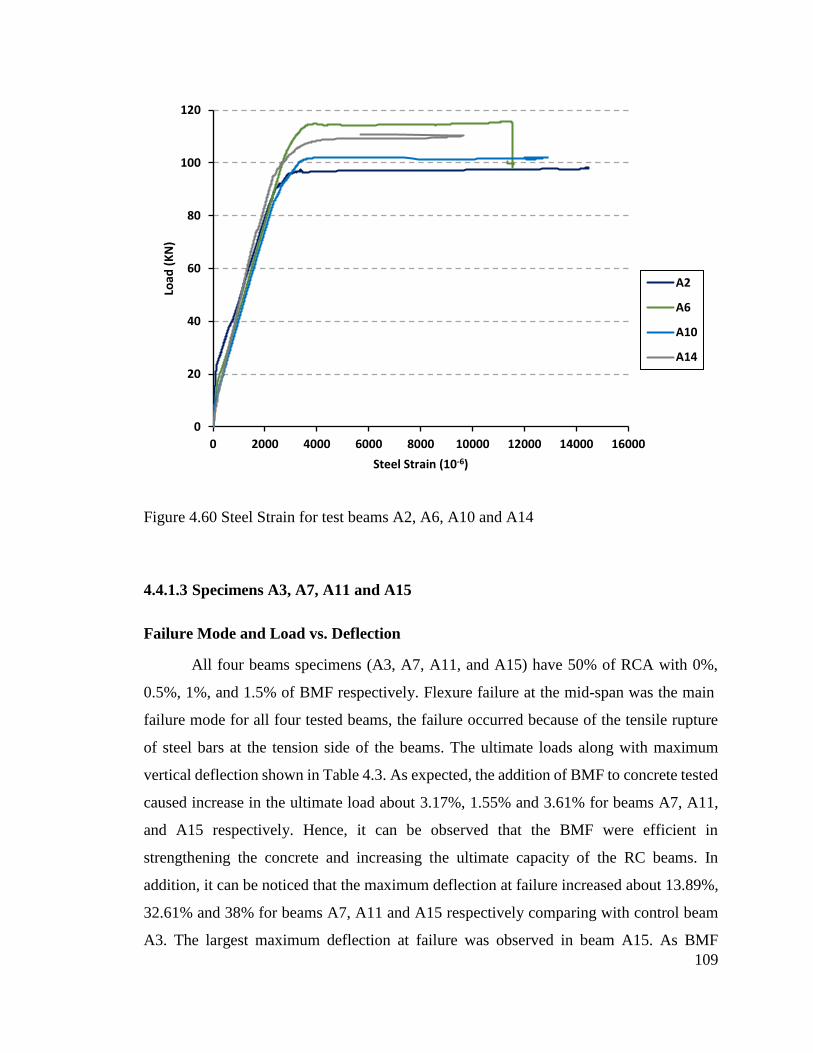
109
Figure 4.60 Steel Strain for test beams A2, A6, A10 and A14
4.4.1.3 Specimens A3, A7, A11 and A15
Failure Mode and Load vs. Deflection
All four beams specimens (A3, A7, A11, and A15) have 50% of RCA with 0%,
0.5%, 1%, and 1.5% of BMF respectively. Flexure failure at the mid-span was the main
failure mode for all four tested beams, the failure occurred because of the tensile rupture
of steel bars at the tension side of the beams. The ultimate loads along with maximum
vertical deflection shown in Table 4.3. As expected, the addition of BMF to concrete tested
caused increase in the ultimate load about 3.17%, 1.55% and 3.61% for beams A7, A11,
and A15 respectively. Hence, it can be observed that the BMF were efficient in
strengthening the concrete and increasing the ultimate capacity of the RC beams. In
addition, it can be noticed that the maximum deflection at failure increased about 13.89%,
32.61% and 38% for beams A7, A11 and A15 respectively comparing with control beam
A3. The largest maximum deflection at failure was observed in beam A15. As BMF
0
20
40
60
80
100
120
0 2000 4000 6000 8000 10000 12000 14000 16000
Load
(K
N)
Steel Strain (10-6)
A2
A6
A10
A14
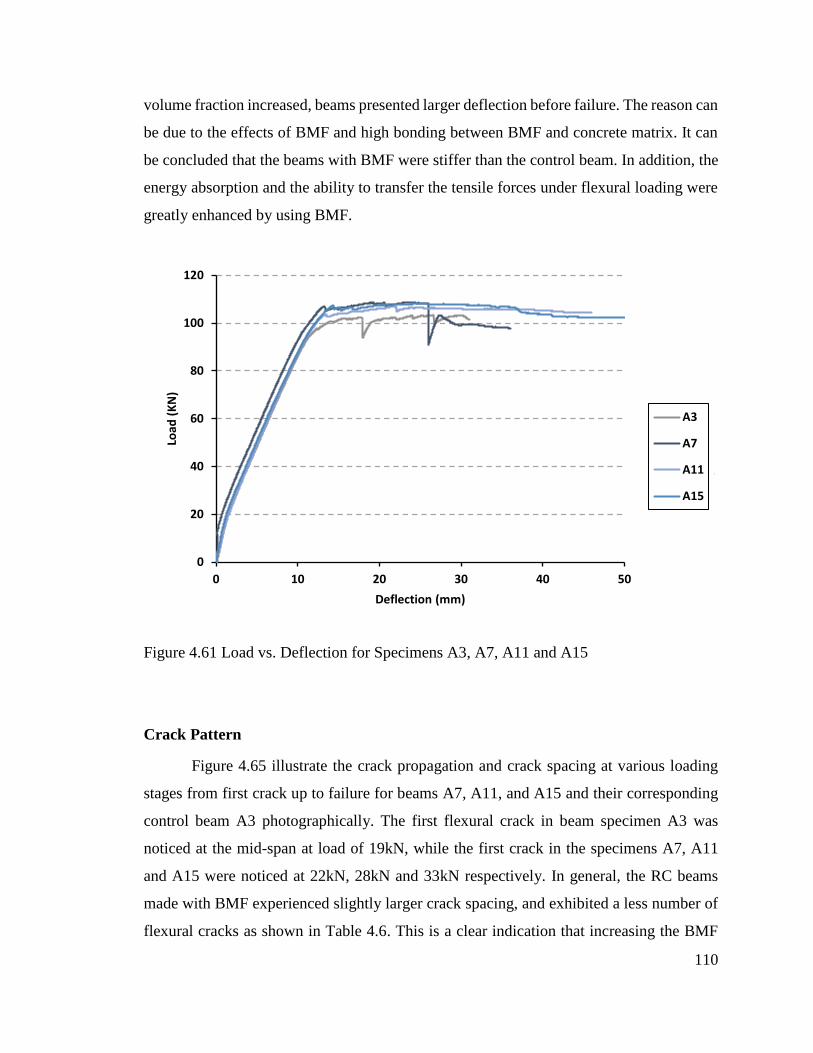
110
volume fraction increased, beams presented larger deflection before failure. The reason can
be due to the effects of BMF and high bonding between BMF and concrete matrix. It can
be concluded that the beams with BMF were stiffer than the control beam. In addition, the
energy absorption and the ability to transfer the tensile forces under flexural loading were
greatly enhanced by using BMF.
Figure 4.61 Load vs. Deflection for Specimens A3, A7, A11 and A15
Crack Pattern
Figure 4.65 illustrate the crack propagation and crack spacing at various loading
stages from first crack up to failure for beams A7, A11, and A15 and their corresponding
control beam A3 photographically. The first flexural crack in beam specimen A3 was
noticed at the mid-span at load of 19kN, while the first crack in the specimens A7, A11
and A15 were noticed at 22kN, 28kN and 33kN respectively. In general, the RC beams
made with BMF experienced slightly larger crack spacing, and exhibited a less number of
flexural cracks as shown in Table 4.6. This is a clear indication that increasing the BMF
0
20
40
60
80
100
120
0 10 20 30 40 50
Load
(K
N)
Deflection (mm)
A3
A7
A11
A15
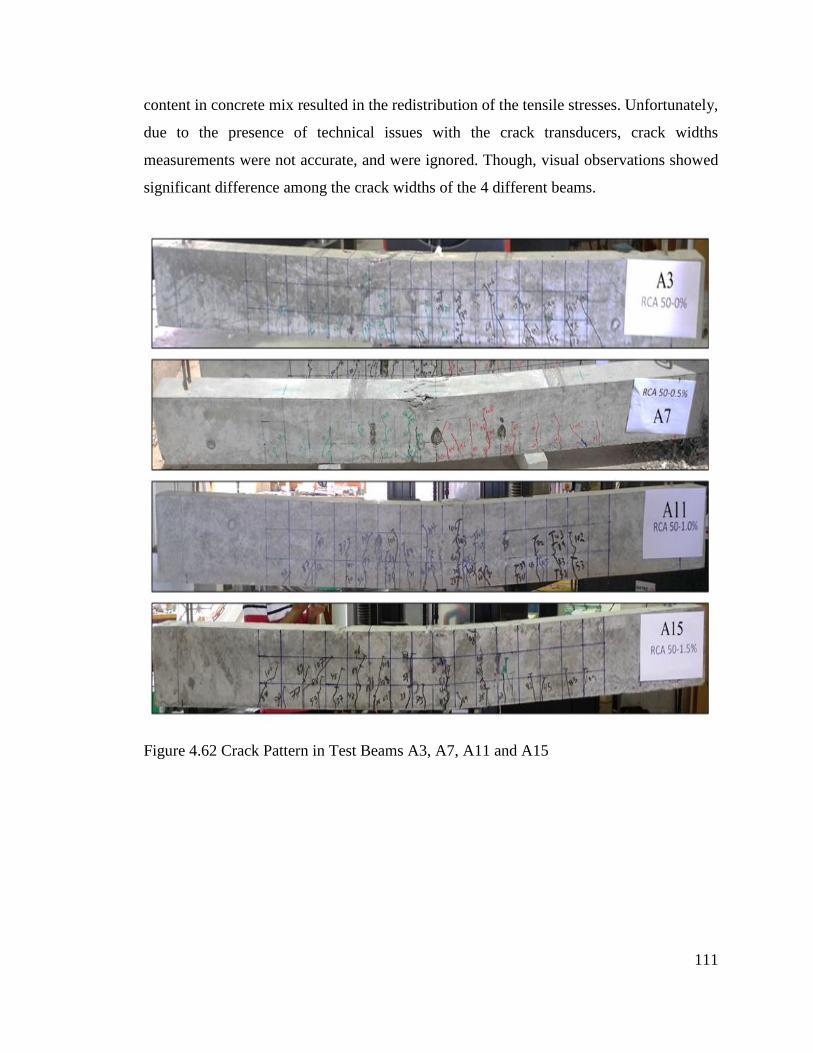
111
content in concrete mix resulted in the redistribution of the tensile stresses. Unfortunately,
due to the presence of technical issues with the crack transducers, crack widths
measurements were not accurate, and were ignored. Though, visual observations showed
significant difference among the crack widths of the 4 different beams.
Figure 4.62 Crack Pattern in Test Beams A3, A7, A11 and A15
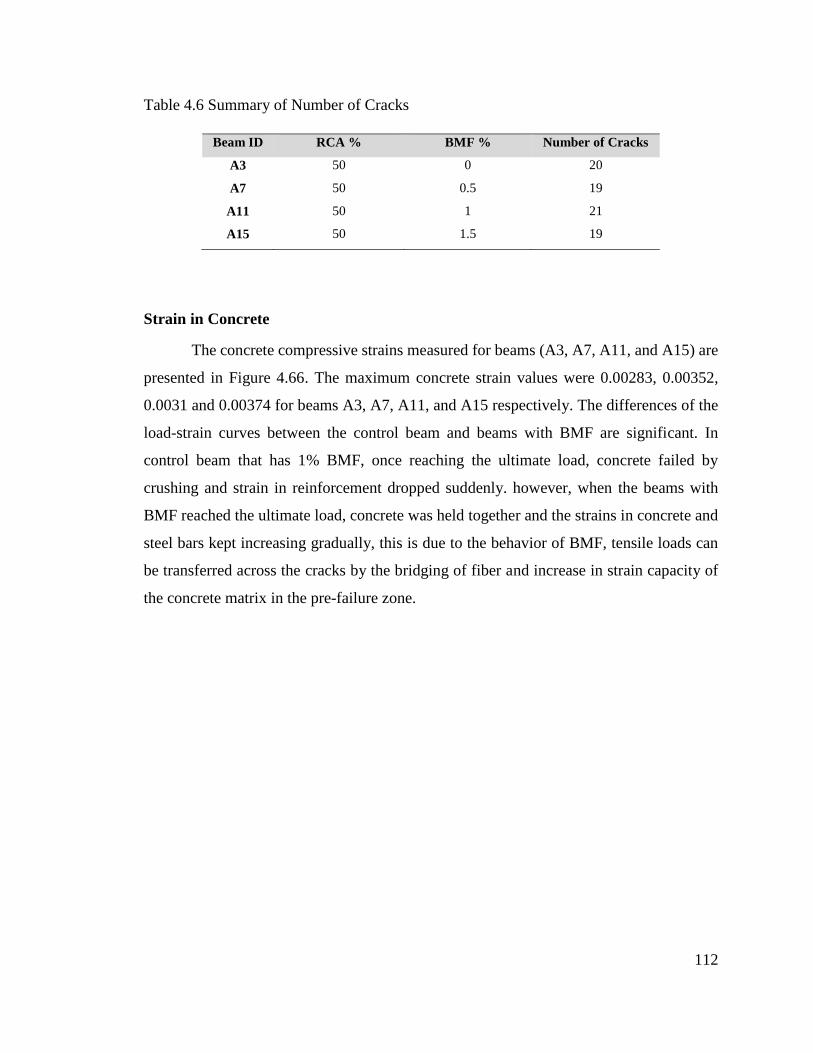
112
Table 4.6 Summary of Number of Cracks
Beam ID RCA % BMF % Number of Cracks
A3 50 0 20
A7 50 0.5 19
A11 50 1 21
A15 50 1.5 19
Strain in Concrete
The concrete compressive strains measured for beams (A3, A7, A11, and A15) are
presented in Figure 4.66. The maximum concrete strain values were 0.00283, 0.00352,
0.0031 and 0.00374 for beams A3, A7, A11, and A15 respectively. The differences of the
load-strain curves between the control beam and beams with BMF are significant. In
control beam that has 1% BMF, once reaching the ultimate load, concrete failed by
crushing and strain in reinforcement dropped suddenly. however, when the beams with
BMF reached the ultimate load, concrete was held together and the strains in concrete and
steel bars kept increasing gradually, this is due to the behavior of BMF, tensile loads can
be transferred across the cracks by the bridging of fiber and increase in strain capacity of
the concrete matrix in the pre-failure zone.
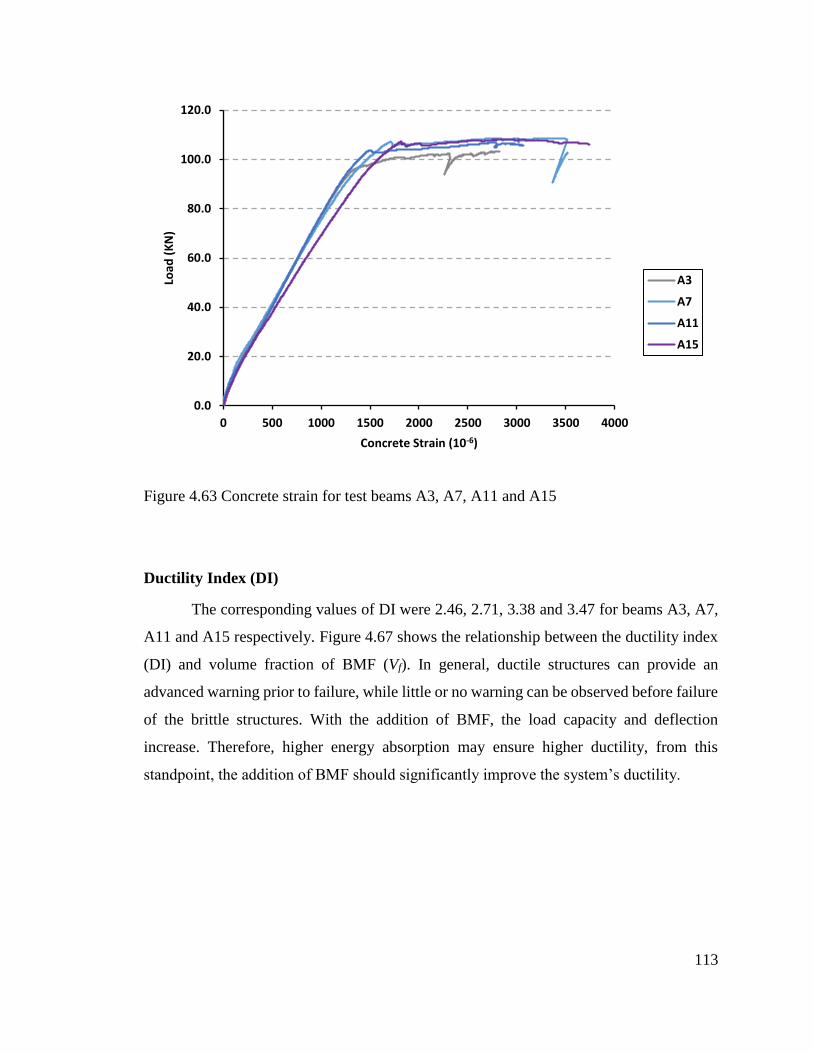
113
Figure 4.63 Concrete strain for test beams A3, A7, A11 and A15
Ductility Index (DI)
The corresponding values of DI were 2.46, 2.71, 3.38 and 3.47 for beams A3, A7,
A11 and A15 respectively. Figure 4.67 shows the relationship between the ductility index
(DI) and volume fraction of BMF (Vf). In general, ductile structures can provide an
advanced warning prior to failure, while little or no warning can be observed before failure
of the brittle structures. With the addition of BMF, the load capacity and deflection
increase. Therefore, higher energy absorption may ensure higher ductility, from this
standpoint, the addition of BMF should significantly improve the system’s ductility.
0.0
20.0
40.0
60.0
80.0
100.0
120.0
0 500 1000 1500 2000 2500 3000 3500 4000
Load
(K
N)
Concrete Strain (10-6)
A3
A7
A11
A15
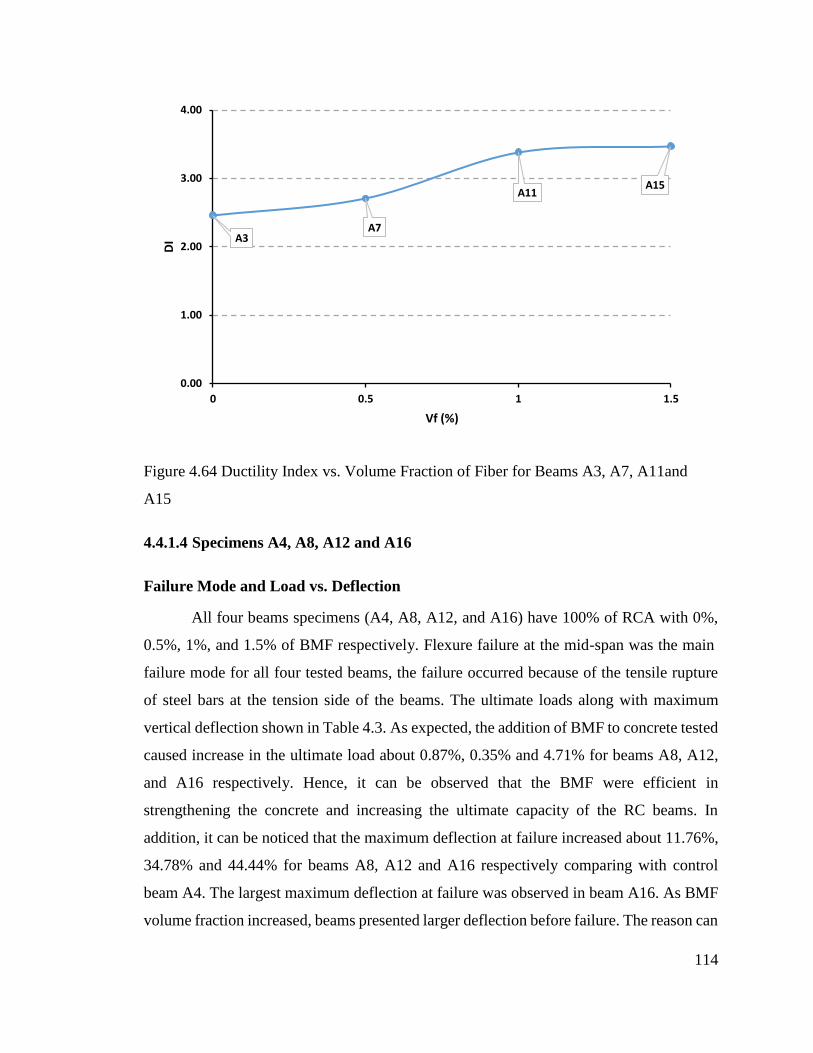
114
Figure 4.64 Ductility Index vs. Volume Fraction of Fiber for Beams A3, A7, A11and
A15
4.4.1.4 Specimens A4, A8, A12 and A16
Failure Mode and Load vs. Deflection
All four beams specimens (A4, A8, A12, and A16) have 100% of RCA with 0%,
0.5%, 1%, and 1.5% of BMF respectively. Flexure failure at the mid-span was the main
failure mode for all four tested beams, the failure occurred because of the tensile rupture
of steel bars at the tension side of the beams. The ultimate loads along with maximum
vertical deflection shown in Table 4.3. As expected, the addition of BMF to concrete tested
caused increase in the ultimate load about 0.87%, 0.35% and 4.71% for beams A8, A12,
and A16 respectively. Hence, it can be observed that the BMF were efficient in
strengthening the concrete and increasing the ultimate capacity of the RC beams. In
addition, it can be noticed that the maximum deflection at failure increased about 11.76%,
34.78% and 44.44% for beams A8, A12 and A16 respectively comparing with control
beam A4. The largest maximum deflection at failure was observed in beam A16. As BMF
volume fraction increased, beams presented larger deflection before failure. The reason can
A3A7
A11A15
0.00
1.00
2.00
3.00
4.00
0 0.5 1 1.5
DI
Vf (%)

115
be due to the effects of BMF and high bonding between BMF and concrete matrix. It can
be concluded that the beams with BMF were stiffer than the control beam. In addition, the
energy absorption and the ability to transfer the tensile forces under flexural loading were
greatly enhanced by using BMF.
Figure 4.65 Load Vs. Deflection for Specimens A4, A9, A12 and A16
Crack Pattern
Figure 4.69 illustrate the crack propagation and crack spacing at various loading
stages from first crack up to failure for beams A8, A12, and A16 and their corresponding
control beam A4 photographically. The first flexural crack in beam specimen A4 was
noticed at the mid-span at load of 18kN, while the first crack in the specimens A8, A12
and A16 were noticed at 21kN, 31kN and 25kN respectively. In general, the RC beams
made with BMF experienced slightly larger crack spacing, and exhibited a less number of
flexural cracks as shown in Table 4.7. This is a clear indication that increasing the BMF
0
20
40
60
80
100
120
0 10 20 30 40 50 60
Load
(K
N)
Deflection (mm)
A4
A8
A12
A16
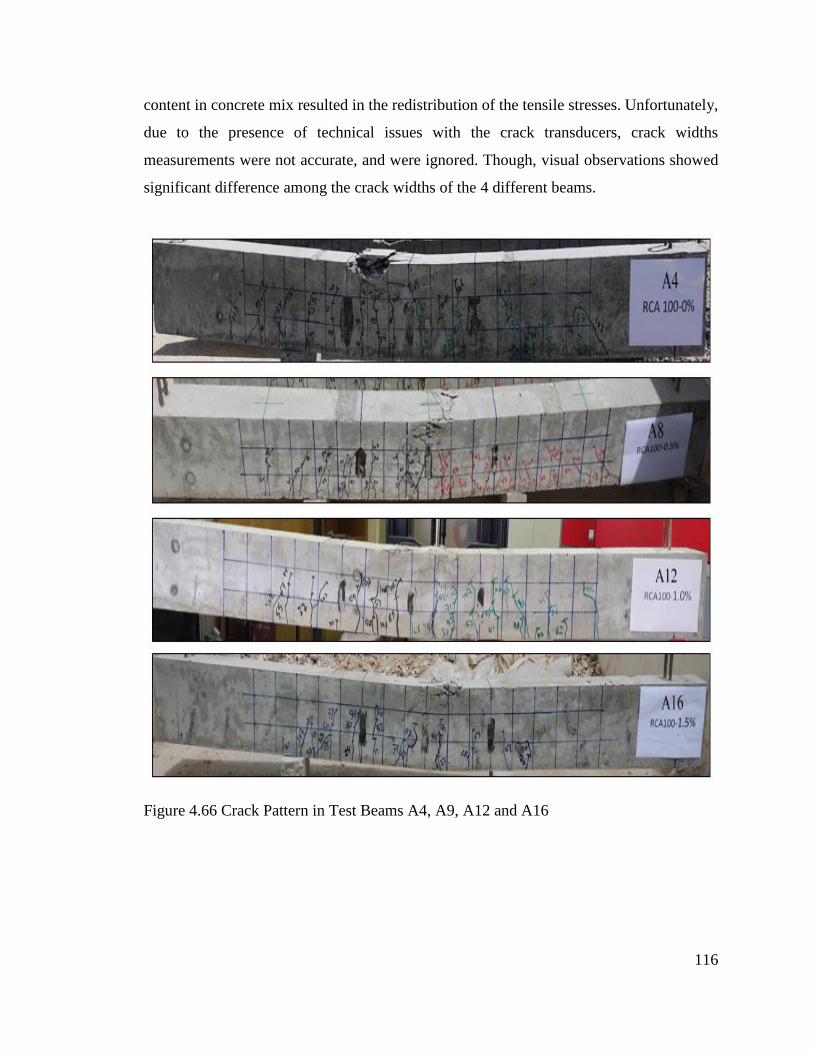
116
content in concrete mix resulted in the redistribution of the tensile stresses. Unfortunately,
due to the presence of technical issues with the crack transducers, crack widths
measurements were not accurate, and were ignored. Though, visual observations showed
significant difference among the crack widths of the 4 different beams.
Figure 4.66 Crack Pattern in Test Beams A4, A9, A12 and A16

117
Table 4.7 Summary of Number of Cracks
Beam ID RCA % BMF % Number of Cracks
A4 100 0 20
A8 100 0.5 16
A12 100 1 19
A16 100 1.5 14
Strain in Concrete
The concrete compressive strains measured for beams (A4, A8, A12, and A16) are
presented in Figure 4.70. The maximum concrete strain values were 0.00292, 0.00308,
0.0035 and 0.00372 for beams A4, A8, A12, and A16 respectively. The differences of the
load-strain curves between the control beam and beams with BMF are significant. In
control beam that has 1.5% BMF, once reaching the ultimate load, concrete failed by
crushing and strain in reinforcement dropped suddenly. however, when the beams with
BMF reached the ultimate load, concrete was held together and the strains in concrete and
steel bars kept increasing gradually, this is due to the behavior of BMF, tensile loads can
be transferred across the cracks by the bridging of fiber and increase in strain capacity of
the concrete matrix in the pre-failure zone.
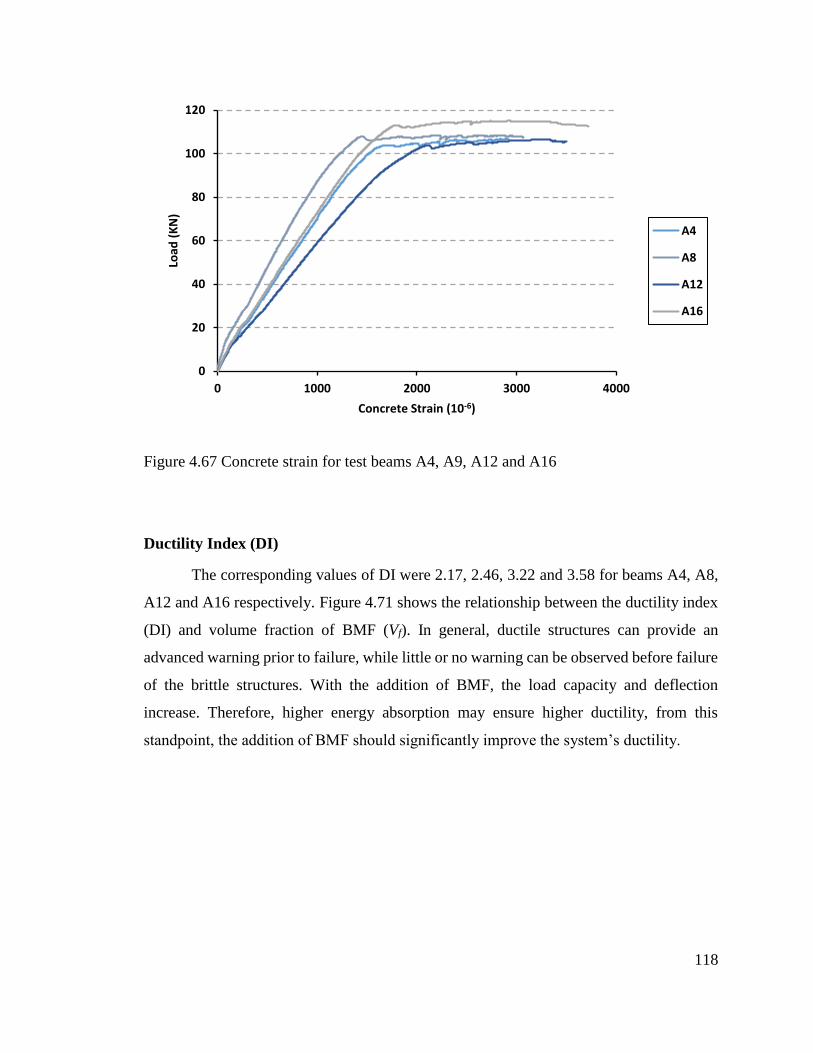
118
Figure 4.67 Concrete strain for test beams A4, A9, A12 and A16
Ductility Index (DI)
The corresponding values of DI were 2.17, 2.46, 3.22 and 3.58 for beams A4, A8,
A12 and A16 respectively. Figure 4.71 shows the relationship between the ductility index
(DI) and volume fraction of BMF (Vf). In general, ductile structures can provide an
advanced warning prior to failure, while little or no warning can be observed before failure
of the brittle structures. With the addition of BMF, the load capacity and deflection
increase. Therefore, higher energy absorption may ensure higher ductility, from this
standpoint, the addition of BMF should significantly improve the system’s ductility.
0
20
40
60
80
100
120
0 1000 2000 3000 4000
Load
(K
N)
Concrete Strain (10-6)
A4
A8
A12
A16
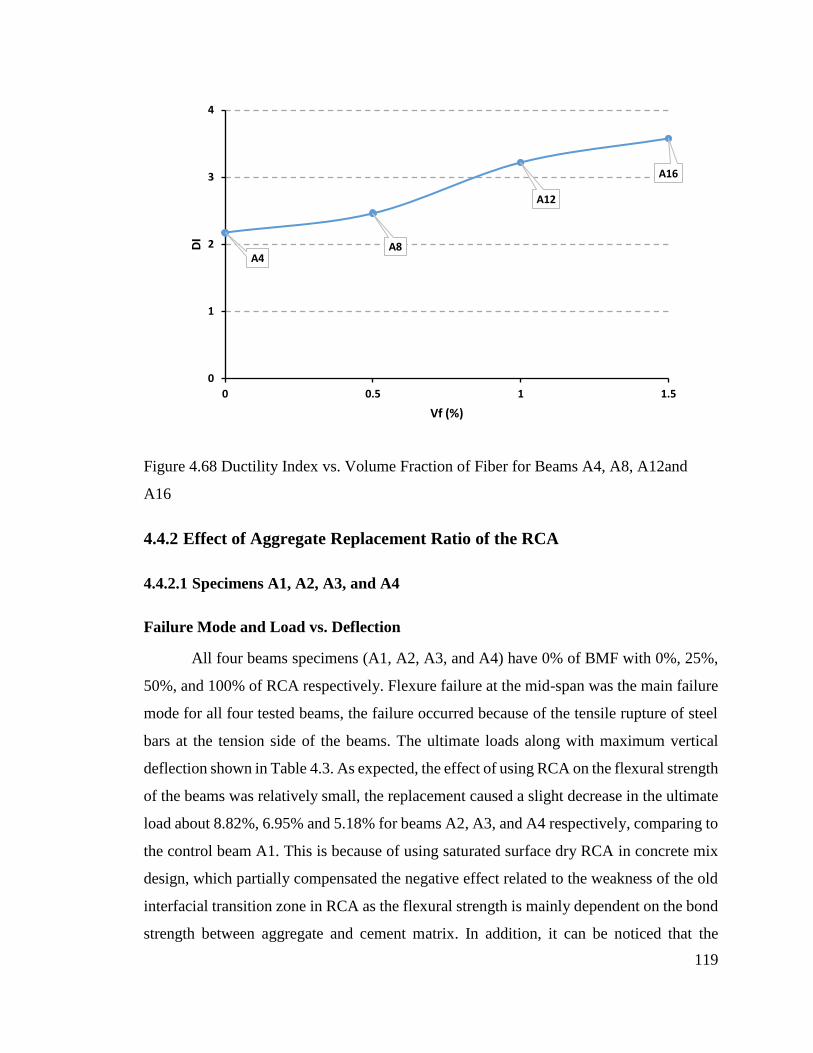
119
Figure 4.68 Ductility Index vs. Volume Fraction of Fiber for Beams A4, A8, A12and
A16
4.4.2 Effect of Aggregate Replacement Ratio of the RCA
4.4.2.1 Specimens A1, A2, A3, and A4
Failure Mode and Load vs. Deflection
All four beams specimens (A1, A2, A3, and A4) have 0% of BMF with 0%, 25%,
50%, and 100% of RCA respectively. Flexure failure at the mid-span was the main failure
mode for all four tested beams, the failure occurred because of the tensile rupture of steel
bars at the tension side of the beams. The ultimate loads along with maximum vertical
deflection shown in Table 4.3. As expected, the effect of using RCA on the flexural strength
of the beams was relatively small, the replacement caused a slight decrease in the ultimate
load about 8.82%, 6.95% and 5.18% for beams A2, A3, and A4 respectively, comparing to
the control beam A1. This is because of using saturated surface dry RCA in concrete mix
design, which partially compensated the negative effect related to the weakness of the old
interfacial transition zone in RCA as the flexural strength is mainly dependent on the bond
strength between aggregate and cement matrix. In addition, it can be noticed that the
A4A8
A12
A16
0
1
2
3
4
0 0.5 1 1.5
DI
Vf (%)
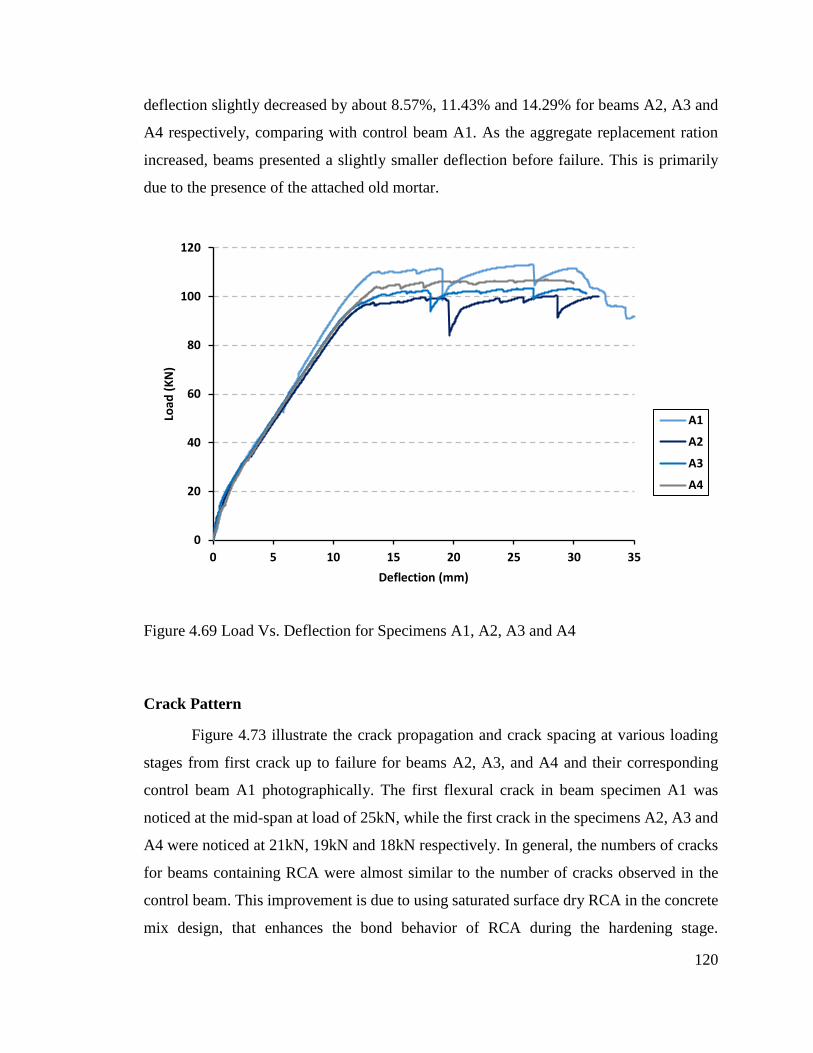
120
deflection slightly decreased by about 8.57%, 11.43% and 14.29% for beams A2, A3 and
A4 respectively, comparing with control beam A1. As the aggregate replacement ration
increased, beams presented a slightly smaller deflection before failure. This is primarily
due to the presence of the attached old mortar.
Figure 4.69 Load Vs. Deflection for Specimens A1, A2, A3 and A4
Crack Pattern
Figure 4.73 illustrate the crack propagation and crack spacing at various loading
stages from first crack up to failure for beams A2, A3, and A4 and their corresponding
control beam A1 photographically. The first flexural crack in beam specimen A1 was
noticed at the mid-span at load of 25kN, while the first crack in the specimens A2, A3 and
A4 were noticed at 21kN, 19kN and 18kN respectively. In general, the numbers of cracks
for beams containing RCA were almost similar to the number of cracks observed in the
control beam. This improvement is due to using saturated surface dry RCA in the concrete
mix design, that enhances the bond behavior of RCA during the hardening stage.
0
20
40
60
80
100
120
0 5 10 15 20 25 30 35
Load
(K
N)
Deflection (mm)
A1
A2
A3
A4
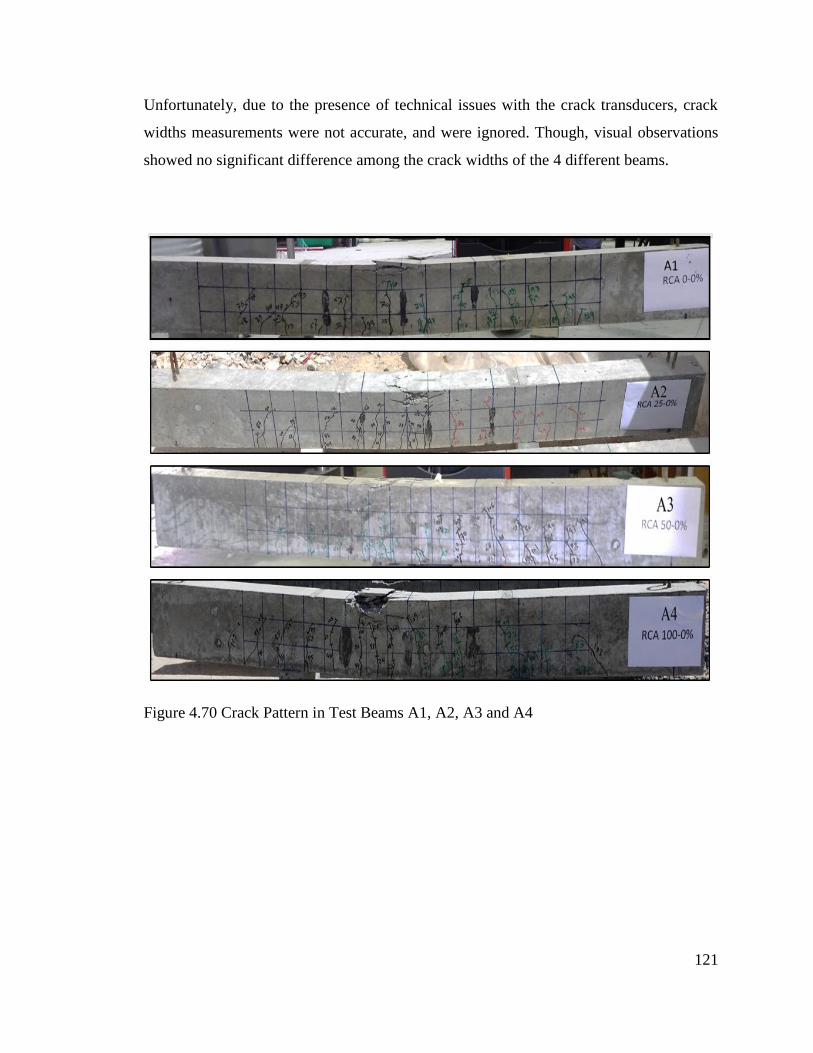
121
Unfortunately, due to the presence of technical issues with the crack transducers, crack
widths measurements were not accurate, and were ignored. Though, visual observations
showed no significant difference among the crack widths of the 4 different beams.
Figure 4.70 Crack Pattern in Test Beams A1, A2, A3 and A4

122
Table 4.8 Summary of Number of Cracks
Beam ID RCA % BMF % Number of Cracks
A1 0 0 19
A2 25 0 18
A3 50 0 20
A4 100 0 20
Strain in Concrete
The concrete compressive strains measured for beams (A1, A2, A3, and A4) are
presented in Figure 4.74. The maximum concrete strain values were 0.00282, 0.00284
,0.00283 and 0.00292 for beams A1, A2, A3, and A4 respectively. The load-strain curves
for each replacement ratio of RCA beams seem to follow a similar trend to the control
beam that has 0% RCA. In general, the RCA follow same behavior of NCA. This is due to
concrete mix design that enhanced by using saturated surface dry RCA.
Figure 4.71 Concrete strain for test beams A1, A2, A3 and A4
0
20
40
60
80
100
120
0 500 1000 1500 2000 2500 3000 3500
Load
(K
N)
Concrete Strain (10-6)
A1
A2
A3
A4
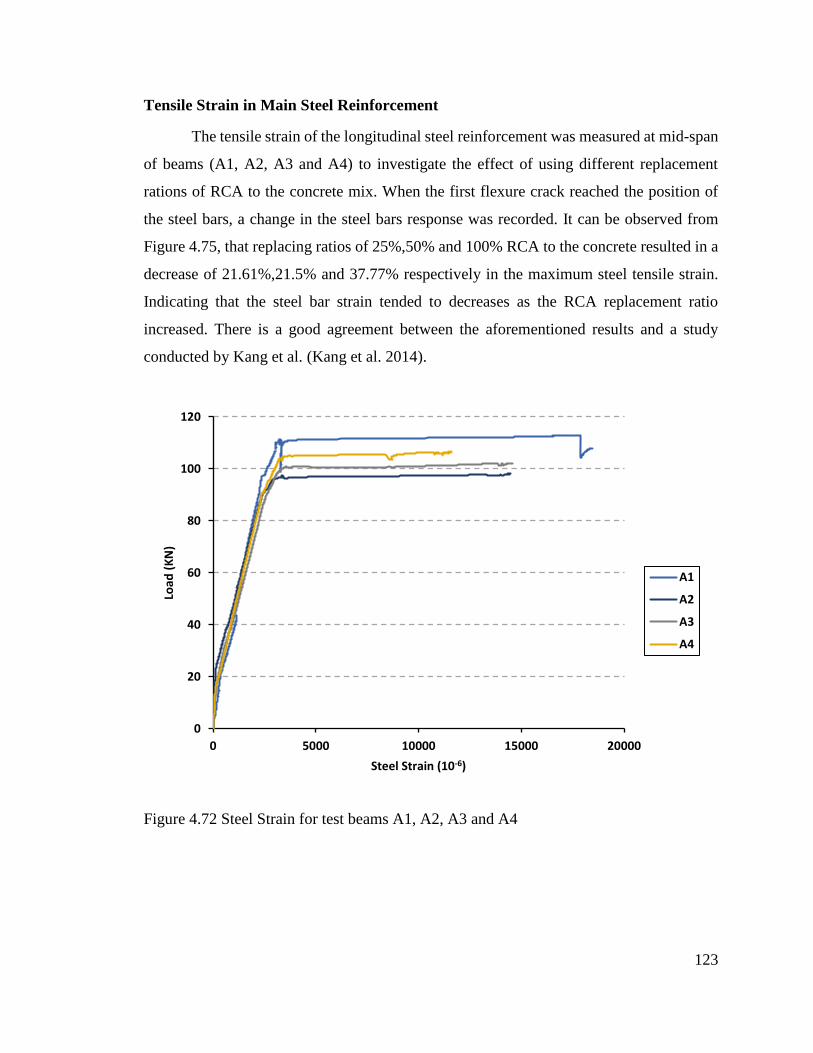
123
Tensile Strain in Main Steel Reinforcement
The tensile strain of the longitudinal steel reinforcement was measured at mid-span
of beams (A1, A2, A3 and A4) to investigate the effect of using different replacement
rations of RCA to the concrete mix. When the first flexure crack reached the position of
the steel bars, a change in the steel bars response was recorded. It can be observed from
Figure 4.75, that replacing ratios of 25%,50% and 100% RCA to the concrete resulted in a
decrease of 21.61%,21.5% and 37.77% respectively in the maximum steel tensile strain.
Indicating that the steel bar strain tended to decreases as the RCA replacement ratio
increased. There is a good agreement between the aforementioned results and a study
conducted by Kang et al. (Kang et al. 2014).
Figure 4.72 Steel Strain for test beams A1, A2, A3 and A4
0
20
40
60
80
100
120
0 5000 10000 15000 20000
Load
(K
N)
Steel Strain (10-6)
A1
A2
A3
A4

124
Ductility Index (DI)
The corresponding values of DI were 2.57, 2.52, 2.46 and 2.17 for beams A1, A2,
A3 and A4 respectively. Figure 4.76 shows the relationship between the ductility index
(DI) and replacement ratio of RCA (RCA %). It can be noticed that the concrete beams
made with saturated surface dry RCA normally have slightly lower ductility performance
compared with the control beam. This is primarily due to the presence of the attached old
mortar.
Figure 4.73 Ductility Index vs. Replacement Ratio of RCA for Specimens A1, A2, A3
and A4
A1A2 A3
A4
0
1
2
3
0 25 50 75 100
DI
RCA %
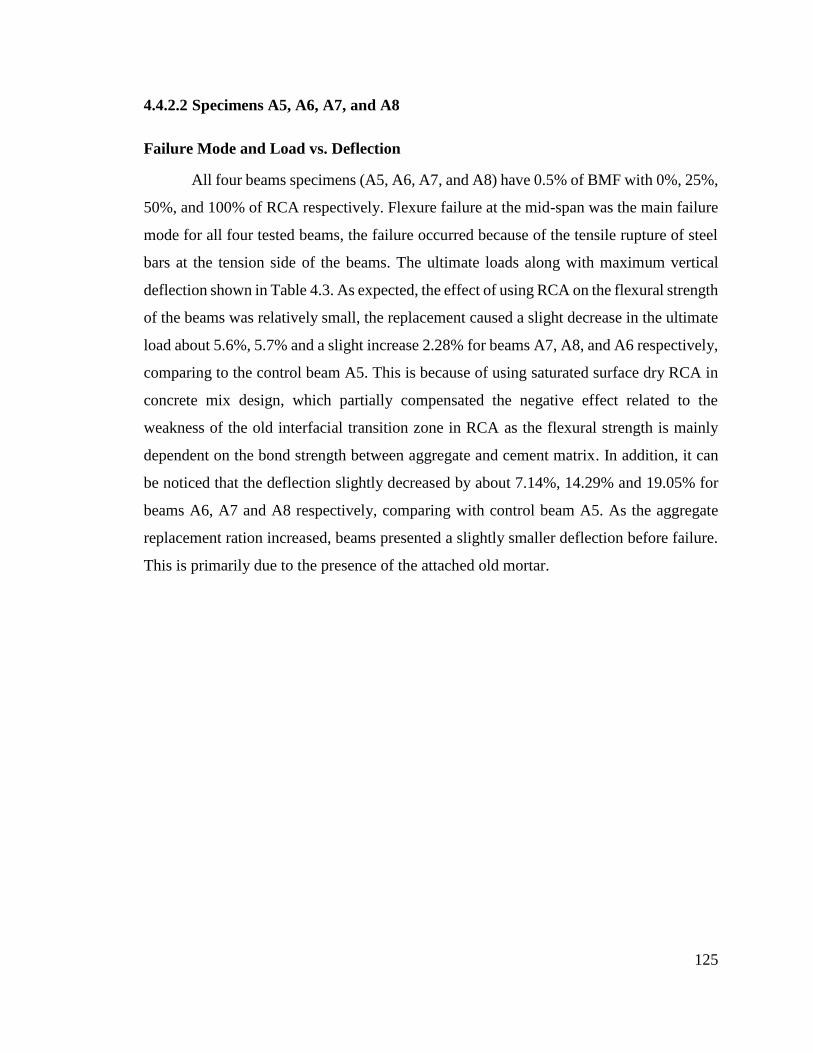
125
4.4.2.2 Specimens A5, A6, A7, and A8
Failure Mode and Load vs. Deflection
All four beams specimens (A5, A6, A7, and A8) have 0.5% of BMF with 0%, 25%,
50%, and 100% of RCA respectively. Flexure failure at the mid-span was the main failure
mode for all four tested beams, the failure occurred because of the tensile rupture of steel
bars at the tension side of the beams. The ultimate loads along with maximum vertical
deflection shown in Table 4.3. As expected, the effect of using RCA on the flexural strength
of the beams was relatively small, the replacement caused a slight decrease in the ultimate
load about 5.6%, 5.7% and a slight increase 2.28% for beams A7, A8, and A6 respectively,
comparing to the control beam A5. This is because of using saturated surface dry RCA in
concrete mix design, which partially compensated the negative effect related to the
weakness of the old interfacial transition zone in RCA as the flexural strength is mainly
dependent on the bond strength between aggregate and cement matrix. In addition, it can
be noticed that the deflection slightly decreased by about 7.14%, 14.29% and 19.05% for
beams A6, A7 and A8 respectively, comparing with control beam A5. As the aggregate
replacement ration increased, beams presented a slightly smaller deflection before failure.
This is primarily due to the presence of the attached old mortar.

126
Figure 4.74 Load Vs. Deflection for Specimens A5, A6, A7 and A8
Crack Pattern
Figure 4.78 illustrate the crack propagation and crack spacing at various loading
stages from first crack up to failure for beams A6, A7, and A8 and their corresponding
control beam A5 photographically. The first flexural crack in beam specimen A5 was
noticed at the mid-span at load of 27kN, while the first crack in the specimens A6, A7 and
A8 were noticed at 24kN, 22kN and 21kN respectively. In general, the numbers of cracks
for beams containing RCA were almost similar to the number of cracks observed in the
control beam. This improvement is due to using saturated surface dry RCA in the concrete
mix design, that enhances the bond behavior of RCA during the hardening stage.
Unfortunately, due to the presence of technical issues with the crack transducers, crack
widths measurements were not accurate, and were ignored. Though, visual observations
showed no significant difference among the crack widths of the 4 different beams.
0
20
40
60
80
100
120
0 5 10 15 20 25 30 35 40 45
Load
(K
N)
Deflection (mm)
A5
A6
A7
A8
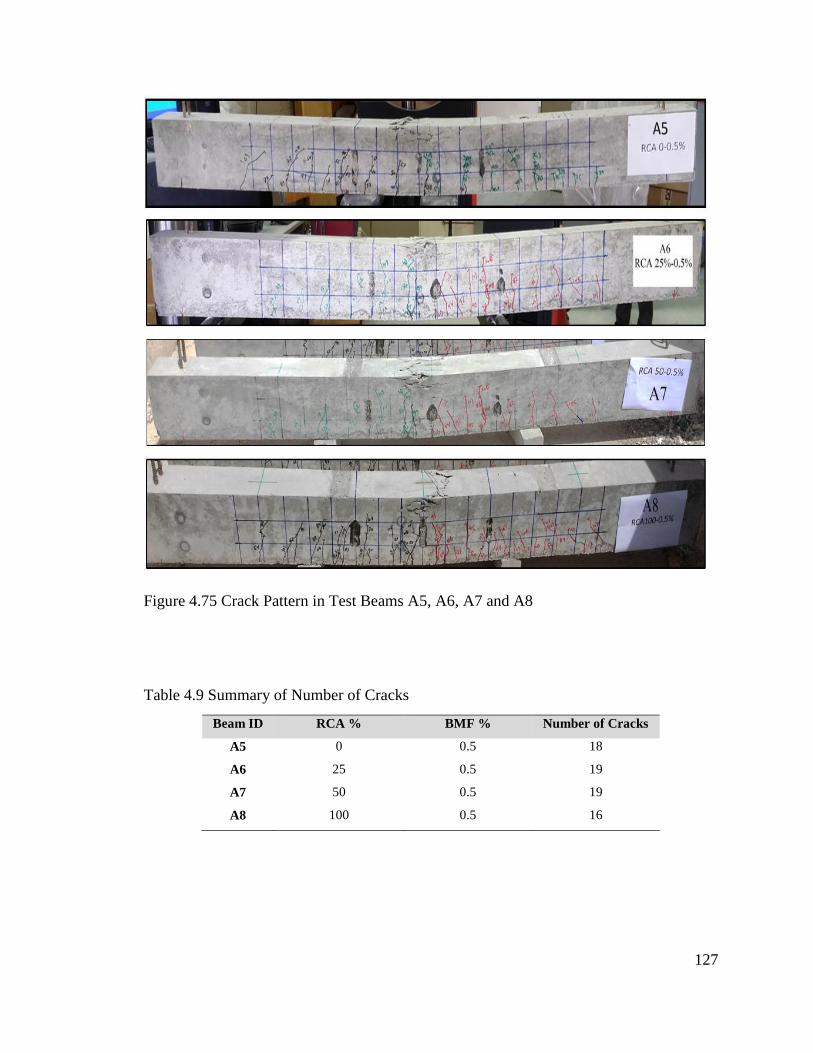
127
Figure 4.75 Crack Pattern in Test Beams A5, A6, A7 and A8
Table 4.9 Summary of Number of Cracks
Beam ID RCA % BMF % Number of Cracks
A5 0 0.5 18
A6 25 0.5 19
A7 50 0.5 19
A8 100 0.5 16
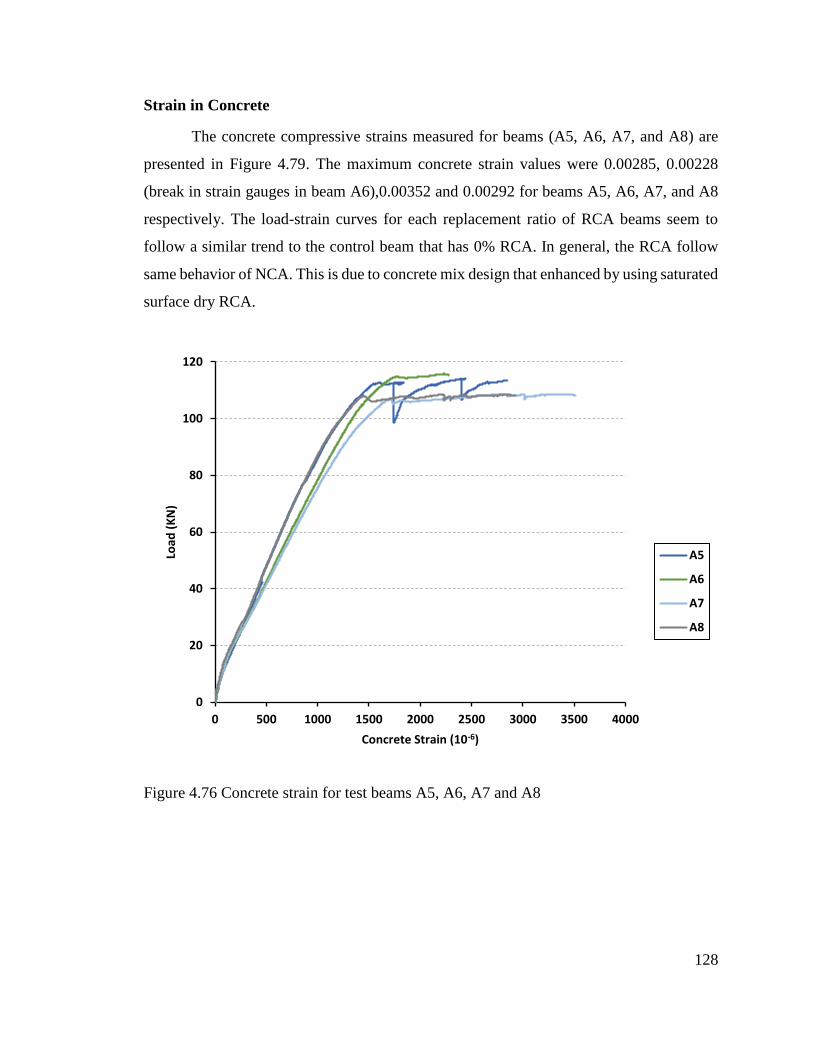
128
Strain in Concrete
The concrete compressive strains measured for beams (A5, A6, A7, and A8) are
presented in Figure 4.79. The maximum concrete strain values were 0.00285, 0.00228
(break in strain gauges in beam A6),0.00352 and 0.00292 for beams A5, A6, A7, and A8
respectively. The load-strain curves for each replacement ratio of RCA beams seem to
follow a similar trend to the control beam that has 0% RCA. In general, the RCA follow
same behavior of NCA. This is due to concrete mix design that enhanced by using saturated
surface dry RCA.
Figure 4.76 Concrete strain for test beams A5, A6, A7 and A8
0
20
40
60
80
100
120
0 500 1000 1500 2000 2500 3000 3500 4000
Load
(K
N)
Concrete Strain (10-6)
A5
A6
A7
A8

129
Ductility Index (DI)
The corresponding values of DI were 2.73, 2.67, 2.71 and 2.46 for beams A5, A6,
A7 and A8 respectively. Figure 4.80 shows the relationship between the ductility index
(DI) and replacement ratio of RCA (RCA %). It can be noticed that the concrete beams
made with saturated surface dry RCA normally have slightly lower ductility performance
compared with the control beam. This is primarily due to the presence of the attached old
mortar.
Figure 4.77 Ductility Index vs. Replacement Ratio of RCA for Specimens A5, A6, A7
and A8
A5 A6 A7
A8
0
1
2
3
0 25 50 75 100
DI
RCA %
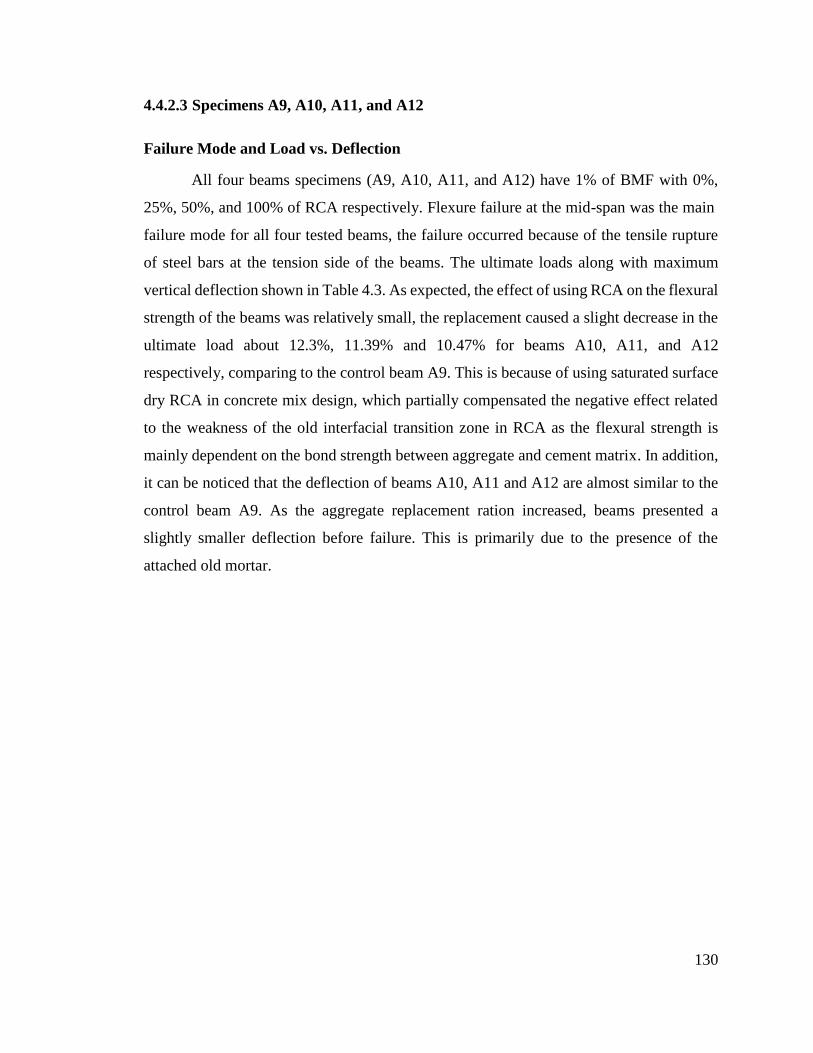
130
4.4.2.3 Specimens A9, A10, A11, and A12
Failure Mode and Load vs. Deflection
All four beams specimens (A9, A10, A11, and A12) have 1% of BMF with 0%,
25%, 50%, and 100% of RCA respectively. Flexure failure at the mid-span was the main
failure mode for all four tested beams, the failure occurred because of the tensile rupture
of steel bars at the tension side of the beams. The ultimate loads along with maximum
vertical deflection shown in Table 4.3. As expected, the effect of using RCA on the flexural
strength of the beams was relatively small, the replacement caused a slight decrease in the
ultimate load about 12.3%, 11.39% and 10.47% for beams A10, A11, and A12
respectively, comparing to the control beam A9. This is because of using saturated surface
dry RCA in concrete mix design, which partially compensated the negative effect related
to the weakness of the old interfacial transition zone in RCA as the flexural strength is
mainly dependent on the bond strength between aggregate and cement matrix. In addition,
it can be noticed that the deflection of beams A10, A11 and A12 are almost similar to the
control beam A9. As the aggregate replacement ration increased, beams presented a
slightly smaller deflection before failure. This is primarily due to the presence of the
attached old mortar.
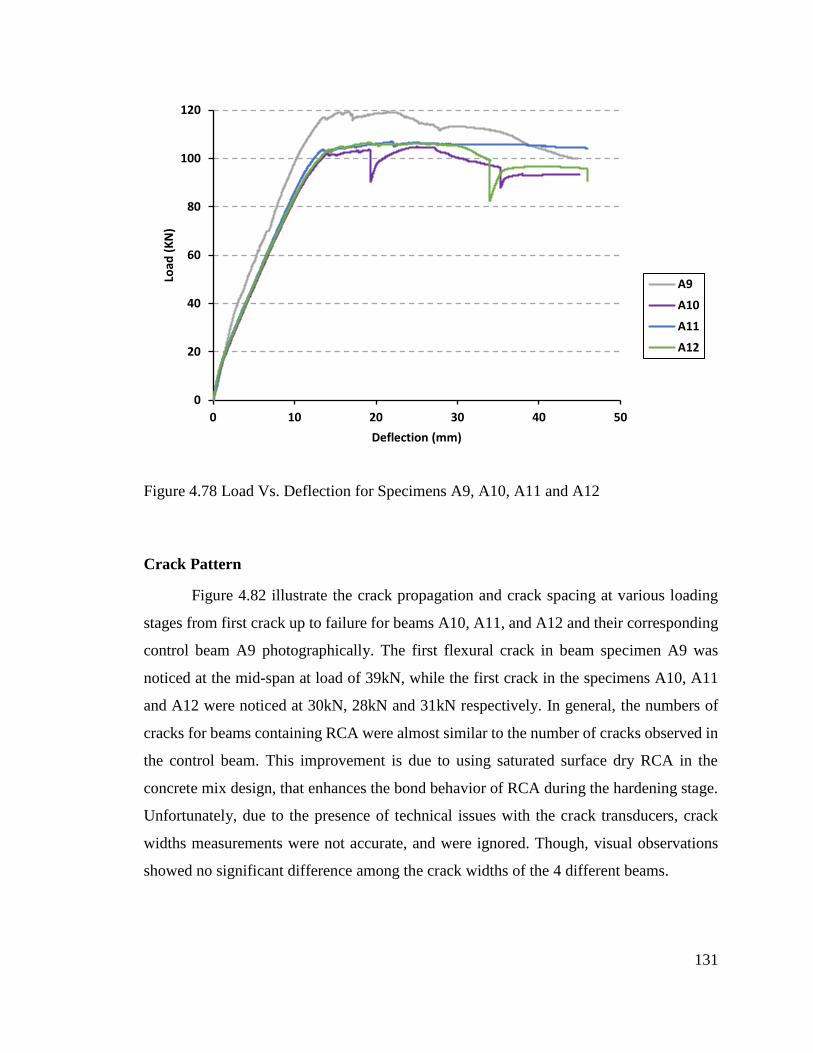
131
Figure 4.78 Load Vs. Deflection for Specimens A9, A10, A11 and A12
Crack Pattern
Figure 4.82 illustrate the crack propagation and crack spacing at various loading
stages from first crack up to failure for beams A10, A11, and A12 and their corresponding
control beam A9 photographically. The first flexural crack in beam specimen A9 was
noticed at the mid-span at load of 39kN, while the first crack in the specimens A10, A11
and A12 were noticed at 30kN, 28kN and 31kN respectively. In general, the numbers of
cracks for beams containing RCA were almost similar to the number of cracks observed in
the control beam. This improvement is due to using saturated surface dry RCA in the
concrete mix design, that enhances the bond behavior of RCA during the hardening stage.
Unfortunately, due to the presence of technical issues with the crack transducers, crack
widths measurements were not accurate, and were ignored. Though, visual observations
showed no significant difference among the crack widths of the 4 different beams.
0
20
40
60
80
100
120
0 10 20 30 40 50
Load
(K
N)
Deflection (mm)
A9
A10
A11
A12

132
Figure 4.79 Crack Pattern in Test Beams A9, A10, A11 and A12
Table 4.10 Summary of Number of Cracks
Beam ID RCA % BMF % Number of Cracks
A9 0 1 16
A10 25 1 17
A11 50 1 21
A12 100 1 19

133
Strain in Concrete
The concrete compressive strains measured for beams (A9, A10, A11, and A12)
are presented in Figure 4.83. The maximum concrete strain values were 0.00262 (break in
strain gauges in beam A9), 0.00374 ,0.0031 and 0.0035 for beams A9, A10, A11, and A12
respectively. The load-strain curves for each replacement ratio of RCA beams seem to
follow a similar trend to the control beam that has 0% RCA. In general, the RCA follow
same behavior of NCA. This is due to concrete mix design that enhanced by using saturated
surface dry RCA.
Figure 4.80 Concrete strain for test beams A9, A10, A11 and A12
0
20
40
60
80
100
120
0 500 1000 1500 2000 2500 3000 3500 4000
Load
(K
N)
Concrete Strain (10-6)
A9
A10
A11
A12
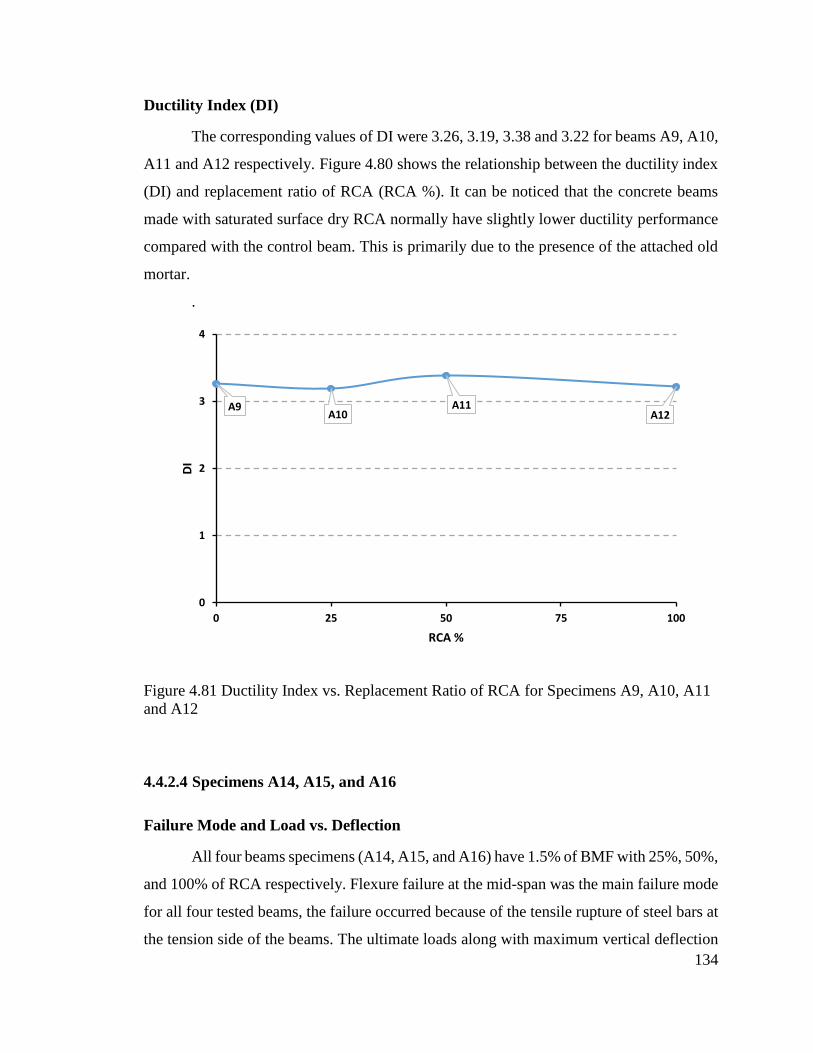
134
Ductility Index (DI)
The corresponding values of DI were 3.26, 3.19, 3.38 and 3.22 for beams A9, A10,
A11 and A12 respectively. Figure 4.80 shows the relationship between the ductility index
(DI) and replacement ratio of RCA (RCA %). It can be noticed that the concrete beams
made with saturated surface dry RCA normally have slightly lower ductility performance
compared with the control beam. This is primarily due to the presence of the attached old
mortar.
.
Figure 4.81 Ductility Index vs. Replacement Ratio of RCA for Specimens A9, A10, A11
and A12
4.4.2.4 Specimens A14, A15, and A16
Failure Mode and Load vs. Deflection
All four beams specimens (A14, A15, and A16) have 1.5% of BMF with 25%, 50%,
and 100% of RCA respectively. Flexure failure at the mid-span was the main failure mode
for all four tested beams, the failure occurred because of the tensile rupture of steel bars at
the tension side of the beams. The ultimate loads along with maximum vertical deflection
A9A10
A11A12
0
1
2
3
4
0 25 50 75 100
DI
RCA %
135
shown in Table 4.3. As expected, the effect of using RCA on the flexural strength of the
beams was relatively small. This is because of using saturated surface dry RCA in concrete
mix design, which partially compensated the negative effect related to the weakness of the
old interfacial transition zone in RCA as the flexural strength is mainly dependent on the
bond strength between aggregate and cement matrix. In addition, it can be noticed that the
deflection slightly increased by about 2.04%, and 9.26% for beams A15, A16 respectively
comparing with beam A14. As the aggregate replacement ration increased, beams
presented a slightly smaller deflection before failure. This is primarily due to the presence
of the attached old mortar.
Figure 4.82 Load Vs. Deflection for Specimens A14, A15 and A16
0
20
40
60
80
100
120
0 10 20 30 40 50 60
Load
(K
N)
Deflection (mm)
A14
A15
A16
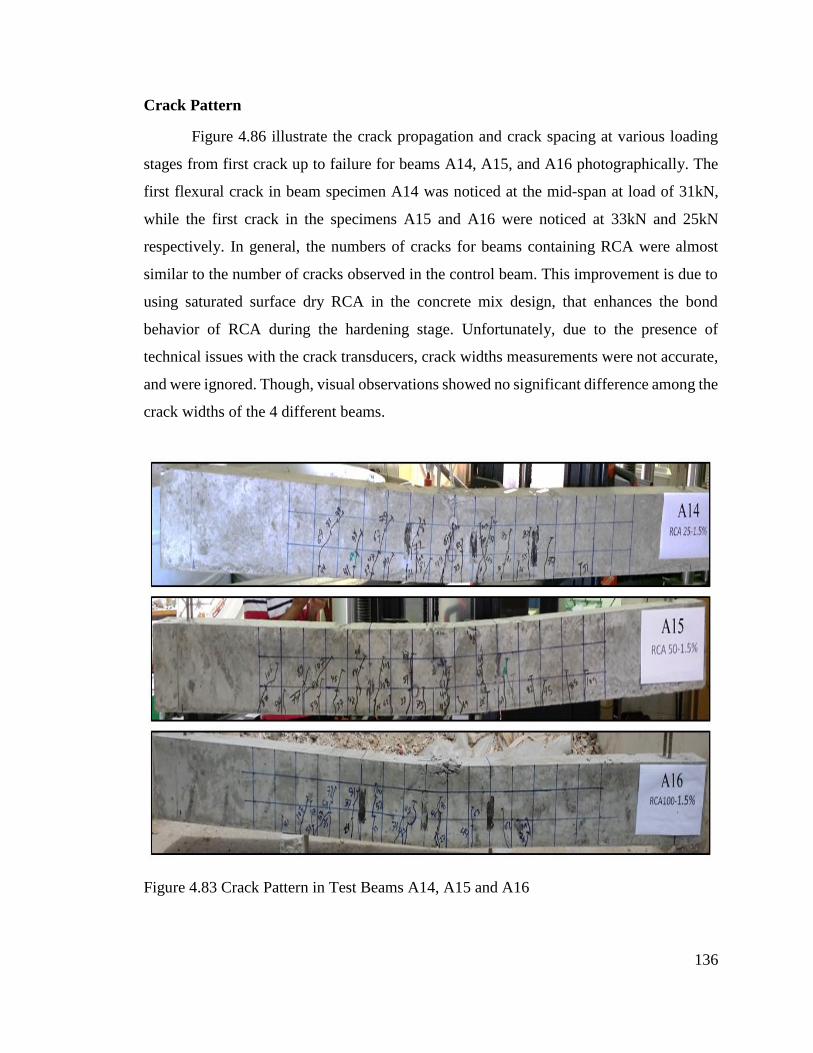
136
Crack Pattern
Figure 4.86 illustrate the crack propagation and crack spacing at various loading
stages from first crack up to failure for beams A14, A15, and A16 photographically. The
first flexural crack in beam specimen A14 was noticed at the mid-span at load of 31kN,
while the first crack in the specimens A15 and A16 were noticed at 33kN and 25kN
respectively. In general, the numbers of cracks for beams containing RCA were almost
similar to the number of cracks observed in the control beam. This improvement is due to
using saturated surface dry RCA in the concrete mix design, that enhances the bond
behavior of RCA during the hardening stage. Unfortunately, due to the presence of
technical issues with the crack transducers, crack widths measurements were not accurate,
and were ignored. Though, visual observations showed no significant difference among the
crack widths of the 4 different beams.
Figure 4.83 Crack Pattern in Test Beams A14, A15 and A16
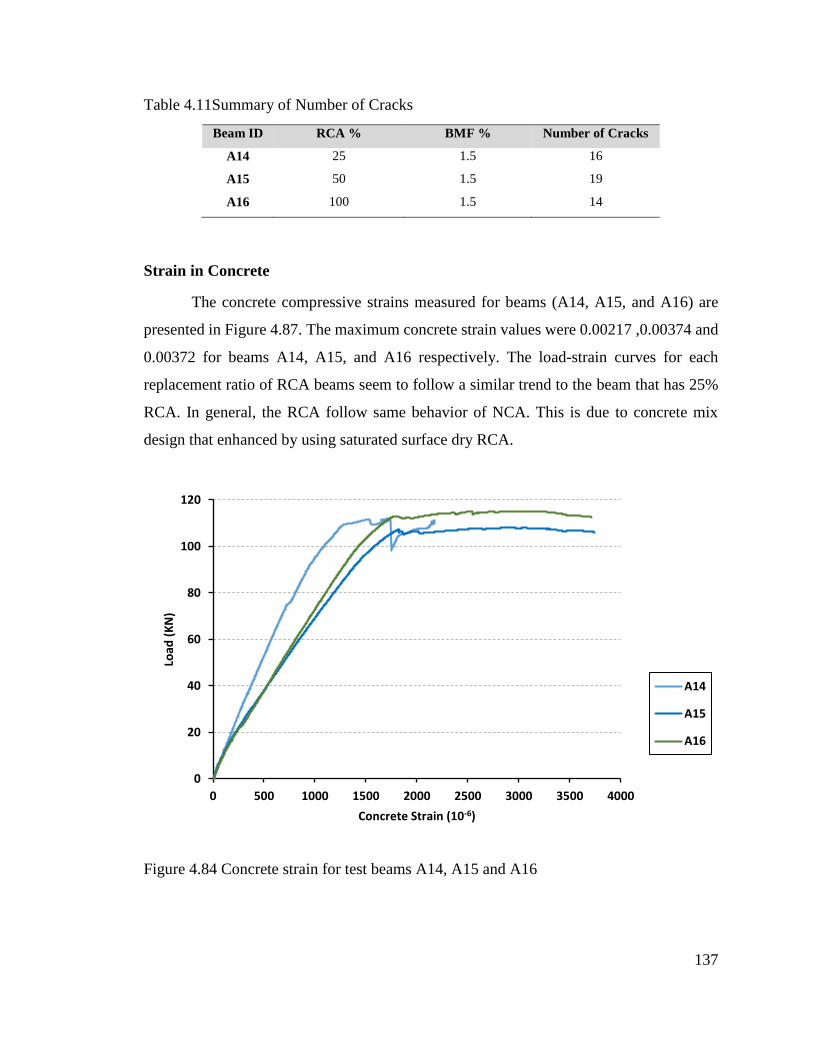
137
Table 4.11Summary of Number of Cracks
Beam ID RCA % BMF % Number of Cracks
A14 25 1.5 16
A15 50 1.5 19
A16 100 1.5 14
Strain in Concrete
The concrete compressive strains measured for beams (A14, A15, and A16) are
presented in Figure 4.87. The maximum concrete strain values were 0.00217 ,0.00374 and
0.00372 for beams A14, A15, and A16 respectively. The load-strain curves for each
replacement ratio of RCA beams seem to follow a similar trend to the beam that has 25%
RCA. In general, the RCA follow same behavior of NCA. This is due to concrete mix
design that enhanced by using saturated surface dry RCA.
Figure 4.84 Concrete strain for test beams A14, A15 and A16
0
20
40
60
80
100
120
0 500 1000 1500 2000 2500 3000 3500 4000
Load
(K
N)
Concrete Strain (10-6)
A14
A15
A16
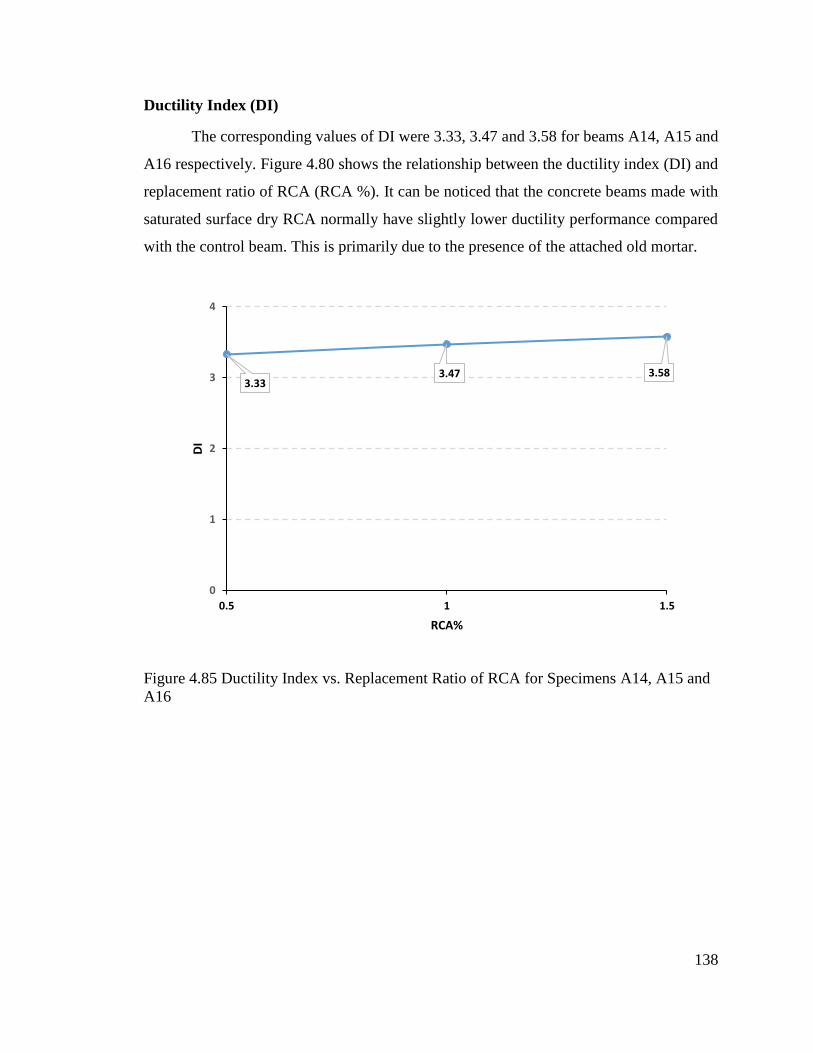
138
Ductility Index (DI)
The corresponding values of DI were 3.33, 3.47 and 3.58 for beams A14, A15 and
A16 respectively. Figure 4.80 shows the relationship between the ductility index (DI) and
replacement ratio of RCA (RCA %). It can be noticed that the concrete beams made with
saturated surface dry RCA normally have slightly lower ductility performance compared
with the control beam. This is primarily due to the presence of the attached old mortar.
Figure 4.85 Ductility Index vs. Replacement Ratio of RCA for Specimens A14, A15 and
A16
3.333.47 3.58
0
1
2
3
4
0.5 1 1.5
DI
RCA%

139
CHAPTER 5
THEORETICAL DEFLECTION AND FLEXURAL CALCULATIONS
Currently, there are no specific provisions in any national or international
guidelines for the design or calculating the flexural strength and the deflection of the FRC
beams made with RCA. In this chapter, a critical comparison study was carried out between
the experimental findings of this research and the analytical formulations based on the
existing code-based analytical models. In addition, an improved code-based analytical
model for evaluating the deflection of the FRC beams made with RCA was proposed. The
values of the cracking moment, the flexural strength, and the mid-span deflection were
analytically calculated and compared with the experimentally observed values, as follows:
1. Predicting the cracking moment (Mcr), ultimate moment (Mu) and moment of inertia
of gross section (Ie).by the recommended equations of (ACI 318 2014) for beams
without BMF and (ACI 544.4R-88) for beams with BMF, the obtain results are
compared with the corresponding experimental results for all RC beams.
2. Predicting the instantaneous deflection (∆i) for RC beams without BMF at 40% of
their ultimate load (Pu) by using the recommended equations of (ACI 318 2014),
and the obtain results are compared with the corresponding experimental results.
3. Evaluating the applicability of the recommended equations that proposed by (Tan
et al 1994) for calculating the moment of inertia of cracked section and
instantaneous deflection (∆i) of RC beams with BMF at 40% of their ultimate load
(Pu). and the obtain results are compared with the corresponding experimental
results.
The following sections present step-by-step formulations adopted for calculating the
instantaneous deflection and ultimate flexural strength for all types of RC beams.

140
5.1 FLEXURAL CALCULATIONS
5.1.1 Prediction of the Cracking Moment (Mcr)
The cracking moment (Mcr) was calculated based on ACI 318-14 code (ACI 318 2014).
Table 5.1 presents the predicted and experimentally evaluated cracking moments of the
tested beams. The cracking moment (Mcr) was predicted as follow:
- Use modulus of rupture (fr) obtained from experimental testing results, as shown
in chapter four.
- Determine the gross moment of inertia (Ig) by using the equation (5-1):
𝐼𝑔 =𝑏 ℎ3
12 5-1
- Determine the centroidal axis for uncracked section (yt)
- Determine the cracking moment (Mcr) by using the equation (5-2)
𝑀𝑐𝑟 =𝑓𝑟𝐼𝑔
𝑦𝑡 5-2
Where b is the width of beam, h is the height of beam. The experimental cracking moment
was calculated using the observed cracking load based on visual inspection during the test.
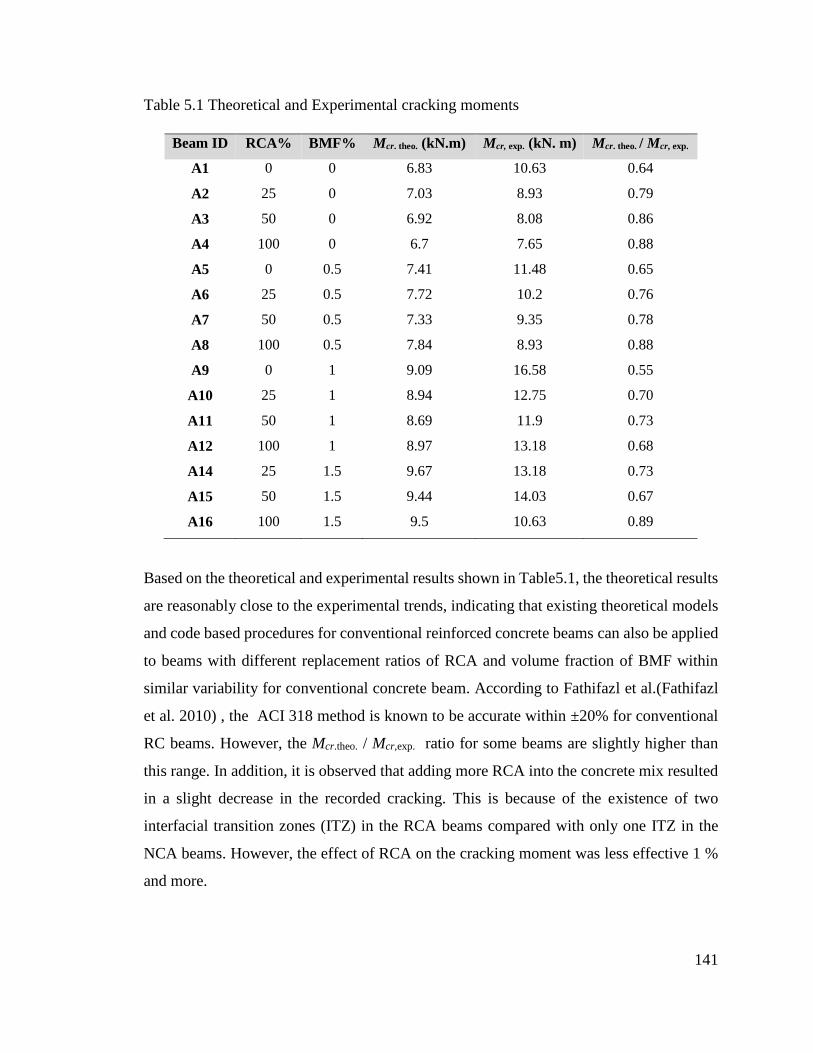
141
Table 5.1 Theoretical and Experimental cracking moments
Beam ID RCA% BMF% Mcr. theo. (kN.m) Mcr, exp. (kN. m) Mcr. theo. / Mcr, exp.
A1 0 0 6.83 10.63 0.64
A2 25 0 7.03 8.93 0.79
A3 50 0 6.92 8.08 0.86
A4 100 0 6.7 7.65 0.88
A5 0 0.5 7.41 11.48 0.65
A6 25 0.5 7.72 10.2 0.76
A7 50 0.5 7.33 9.35 0.78
A8 100 0.5 7.84 8.93 0.88
A9 0 1 9.09 16.58 0.55
A10 25 1 8.94 12.75 0.70
A11 50 1 8.69 11.9 0.73
A12 100 1 8.97 13.18 0.68
A14 25 1.5 9.67 13.18 0.73
A15 50 1.5 9.44 14.03 0.67
A16 100 1.5 9.5 10.63 0.89
Based on the theoretical and experimental results shown in Table5.1, the theoretical results
are reasonably close to the experimental trends, indicating that existing theoretical models
and code based procedures for conventional reinforced concrete beams can also be applied
to beams with different replacement ratios of RCA and volume fraction of BMF within
similar variability for conventional concrete beam. According to Fathifazl et al.(Fathifazl
et al. 2010) , the ACI 318 method is known to be accurate within ±20% for conventional
RC beams. However, the Mcr.theo. / Mcr,exp. ratio for some beams are slightly higher than
this range. In addition, it is observed that adding more RCA into the concrete mix resulted
in a slight decrease in the recorded cracking. This is because of the existence of two
interfacial transition zones (ITZ) in the RCA beams compared with only one ITZ in the
NCA beams. However, the effect of RCA on the cracking moment was less effective 1 %
and more.

142
5.1.2 Prediction of the ultimate moment (Mu)
In this section, the ultimate flexural strength of beams specimens with and without
BMF was calculated using the code-based equations of (ACI 544.4R-88) and (ACI 318
2014) respectively. The stress and strain distribution of RC beam with BMF is shown in
Figure5.1.
Figure 5.1Stress and Strain for RC beam with BMF
The calculation was carried out to determine the effect of volume fraction of fiber on the
ultimate flexural strength using the following equations (ACI 544.4R-88):
𝑀𝑛 = 𝐴𝑠 𝑓𝑦 (𝑑 −𝑎
2) + 𝜎𝑡 𝑏(ℎ − 𝑒) (
ℎ
2+
𝑒
2−
𝑎
2) 5-3
𝑎 = 𝜎𝑡 𝑏 (ℎ−𝑒)+𝐴𝑠 𝑓𝑦
0.85 𝑓𝑐 𝑏 5-4
𝑒 = [𝜀𝑓 + 0.003] 𝑐0.003⁄ 5-5
𝜎𝑡 = 0.00772 𝑙𝑑𝑓 𝑉𝑓𝐹𝑏𝑒
⁄ 5-6
The ultimate flexural strength for beams without BMF was calculated as follow (ACI 318
2014):
𝑎 =𝐴𝑠𝑓𝑦
0.85 𝑓𝑐𝑏 5-7
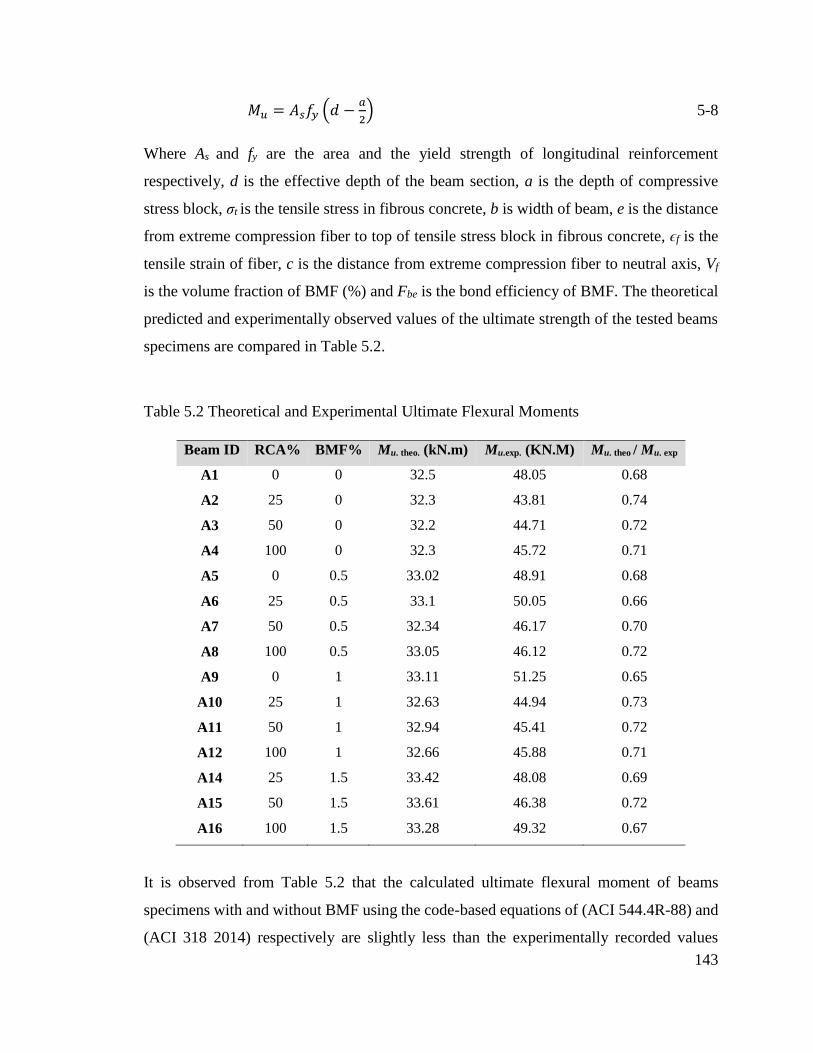
143
𝑀𝑢 = 𝐴𝑠𝑓𝑦 (𝑑 −𝑎
2) 5-8
Where As and fy are the area and the yield strength of longitudinal reinforcement
respectively, d is the effective depth of the beam section, a is the depth of compressive
stress block, σt is the tensile stress in fibrous concrete, b is width of beam, e is the distance
from extreme compression fiber to top of tensile stress block in fibrous concrete, ϵf is the
tensile strain of fiber, c is the distance from extreme compression fiber to neutral axis, Vf
is the volume fraction of BMF (%) and Fbe is the bond efficiency of BMF. The theoretical
predicted and experimentally observed values of the ultimate strength of the tested beams
specimens are compared in Table 5.2.
Table 5.2 Theoretical and Experimental Ultimate Flexural Moments
Beam ID RCA% BMF% Mu. theo. (kN.m) Mu.exp. (KN.M) Mu. theo / Mu. exp
A1 0 0 32.5 48.05 0.68
A2 25 0 32.3 43.81 0.74
A3 50 0 32.2 44.71 0.72
A4 100 0 32.3 45.72 0.71
A5 0 0.5 33.02 48.91 0.68
A6 25 0.5 33.1 50.05 0.66
A7 50 0.5 32.34 46.17 0.70
A8 100 0.5 33.05 46.12 0.72
A9 0 1 33.11 51.25 0.65
A10 25 1 32.63 44.94 0.73
A11 50 1 32.94 45.41 0.72
A12 100 1 32.66 45.88 0.71
A14 25 1.5 33.42 48.08 0.69
A15 50 1.5 33.61 46.38 0.72
A16 100 1.5 33.28 49.32 0.67
It is observed from Table 5.2 that the calculated ultimate flexural moment of beams
specimens with and without BMF using the code-based equations of (ACI 544.4R-88) and
(ACI 318 2014) respectively are slightly less than the experimentally recorded values
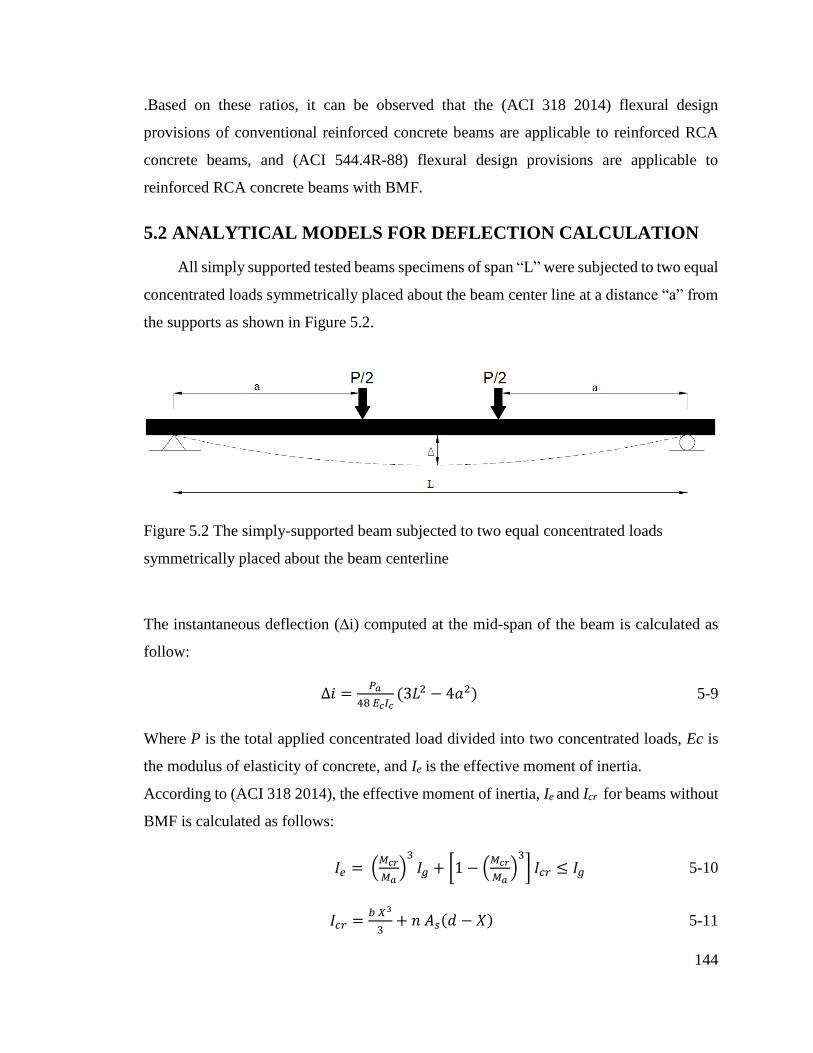
144
.Based on these ratios, it can be observed that the (ACI 318 2014) flexural design
provisions of conventional reinforced concrete beams are applicable to reinforced RCA
concrete beams, and (ACI 544.4R-88) flexural design provisions are applicable to
reinforced RCA concrete beams with BMF.
5.2 ANALYTICAL MODELS FOR DEFLECTION CALCULATION
All simply supported tested beams specimens of span “L” were subjected to two equal
concentrated loads symmetrically placed about the beam center line at a distance “a” from
the supports as shown in Figure 5.2.
Figure 5.2 The simply-supported beam subjected to two equal concentrated loads
symmetrically placed about the beam centerline
The instantaneous deflection (∆i) computed at the mid-span of the beam is calculated as
follow:
∆𝑖 =𝑃𝑎
48 𝐸𝑐𝐼𝑐(3𝐿2 − 4𝑎2) 5-9
Where P is the total applied concentrated load divided into two concentrated loads, Ec is
the modulus of elasticity of concrete, and Ie is the effective moment of inertia.
According to (ACI 318 2014), the effective moment of inertia, Ie and Icr for beams without
BMF is calculated as follows:
𝐼𝑒 = (𝑀𝑐𝑟
𝑀𝑎)
3
𝐼𝑔 + [1 − (𝑀𝑐𝑟
𝑀𝑎)
3
] 𝐼𝑐𝑟 ≤ 𝐼𝑔 5-10
𝐼𝑐𝑟 =𝑏 𝑋3
3+ 𝑛 𝐴𝑠(𝑑 − 𝑋) 5-11

145
Where Mcr is cracking moment, Ma is the applied moment, Icr is the moment of inertia of
the cracked transformed section, and Ig is the moment of inertia of the uncracked section,
b is the beam width, X is the distance from compression surface of the beam to the natural
axis, n is the modular ratio, As is the area of the steel, and d is the effective depth of beam.
According to (Tan et al 1994) the effective moment of inertia, Ie can be calculated using
equation (5.10). However, the moment of inertia of the transformed cracked section Icr for
beams with BMF is determined as follows:
𝐼𝑐𝑟 =𝑏𝑋3
3+ 𝑛 𝐴𝑠(𝑑 − 𝑋)2 + 𝑛𝑓𝐴𝑓
(ℎ−𝑋)2
3+ (𝑛𝑓 − 1)𝐴′𝑓
𝑋3
3 5-12
Where nf = Ef / Ecf, Af and A’f are the area of BMF in tensile and compression zones
respectively. Af and A’f are calculated as follow:
𝐴𝑓 = Ƞ𝑙Ƞ′0𝑉𝑓𝑏(ℎ − 𝑋) 5-13
𝐴′𝑓 = Ƞ𝑙Ƞ0𝑉𝑓𝑏𝑋 5-14
Where Ƞ𝑙 is the length efficiency factor, Ƞ0 and Ƞ′0 are the orientation factor before and
after cracking of the composite material respectively, and 𝑉𝑓 is the fiber volume fraction of
BMF.
The theoretical mid-span deflection results at service load (40 % of ultimate load) for the
16 tested beams in this project are compared with the experimentally measured values
using the LVDTs in Table 5.3 and Figure 5.3.
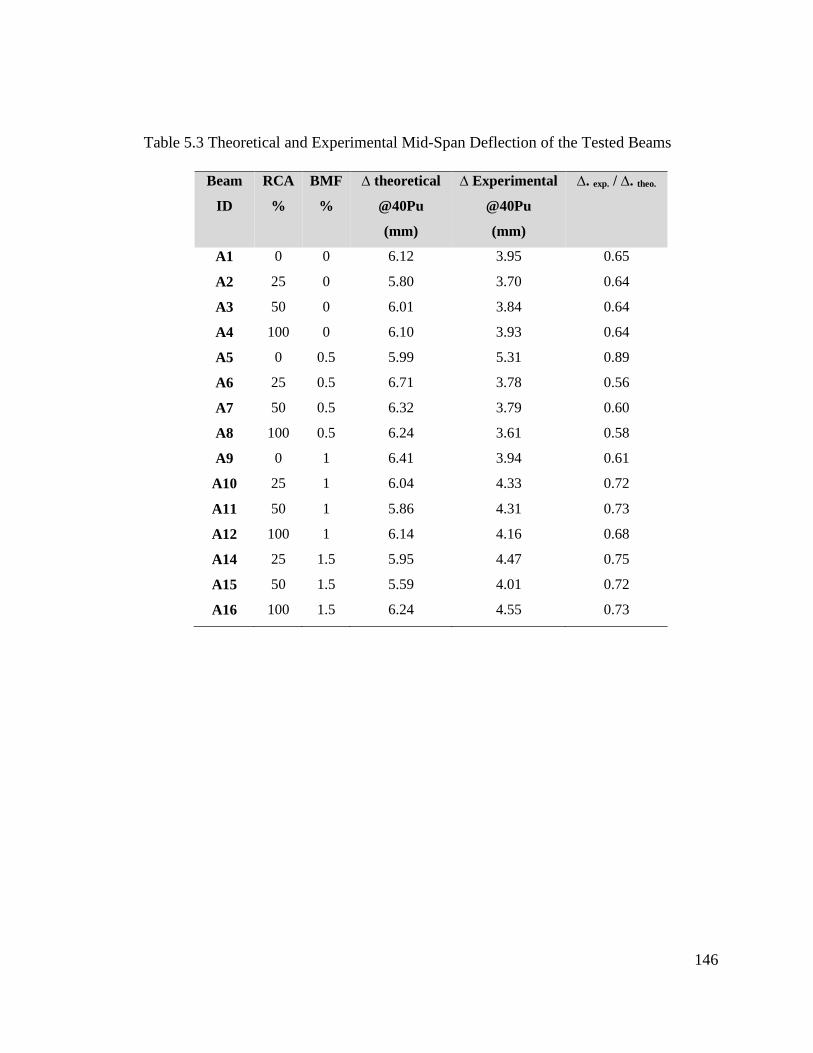
146
Table 5.3 Theoretical and Experimental Mid-Span Deflection of the Tested Beams
Beam
ID
RCA
%
BMF
%
∆ theoretical
@40Pu
(mm)
∆ Experimental
@40Pu
(mm)
∆. exp. / ∆. theo.
A1 0 0 6.12 3.95 0.65
A2 25 0 5.80 3.70 0.64
A3 50 0 6.01 3.84 0.64
A4 100 0 6.10 3.93 0.64
A5 0 0.5 5.99 5.31 0.89
A6 25 0.5 6.71 3.78 0.56
A7 50 0.5 6.32 3.79 0.60
A8 100 0.5 6.24 3.61 0.58
A9 0 1 6.41 3.94 0.61
A10 25 1 6.04 4.33 0.72
A11 50 1 5.86 4.31 0.73
A12 100 1 6.14 4.16 0.68
A14 25 1.5 5.95 4.47 0.75
A15 50 1.5 5.59 4.01 0.72
A16 100 1.5 6.24 4.55 0.73
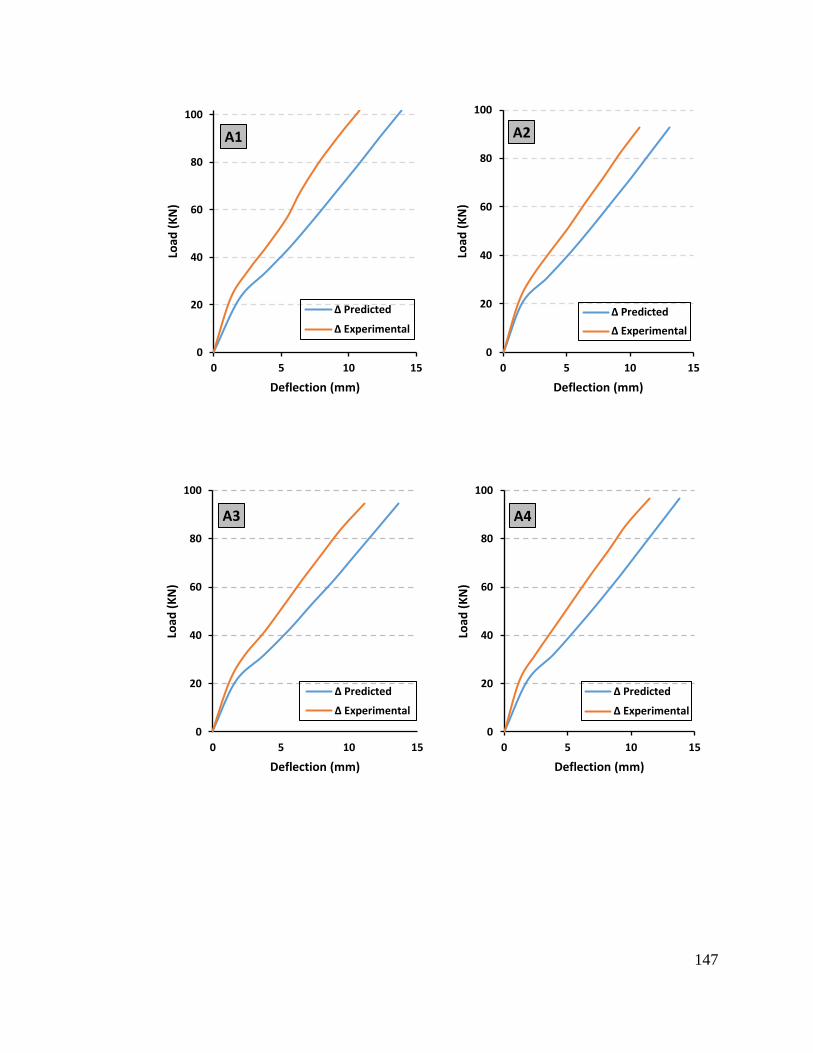
147
0
20
40
60
80
100
0 5 10 15
Load
(K
N)
Deflection (mm)
A1
∆ Predicted
∆ Experimental
0
20
40
60
80
100
0 5 10 15
Load
(K
N)
Deflection (mm)
A2
∆ Predicted
∆ Experimental
0
20
40
60
80
100
0 5 10 15
Load
(K
N)
Deflection (mm)
A3
∆ Predicted
∆ Experimental
0
20
40
60
80
100
0 5 10 15
Load
(K
N)
Deflection (mm)
A4
∆ Predicted
∆ Experimental

148
0
20
40
60
80
100
0 5 10 15
Load
(K
N)
Deflection (mm)
A5
∆ Predicted
∆ Experimental
0
20
40
60
80
100
120
0 5 10 15
Load
(K
N)
Deflection (mm)
A6
∆ Predicted
∆ Experimental
0
20
40
60
80
100
0 5 10 15
Load
(K
N)
Deflection (mm)
A7
∆ Predicted
∆ Experimental
0
20
40
60
80
100
0 5 10 15
Load
(K
N)
Deflection (mm)
A8
∆ Predicted
∆ Experimental
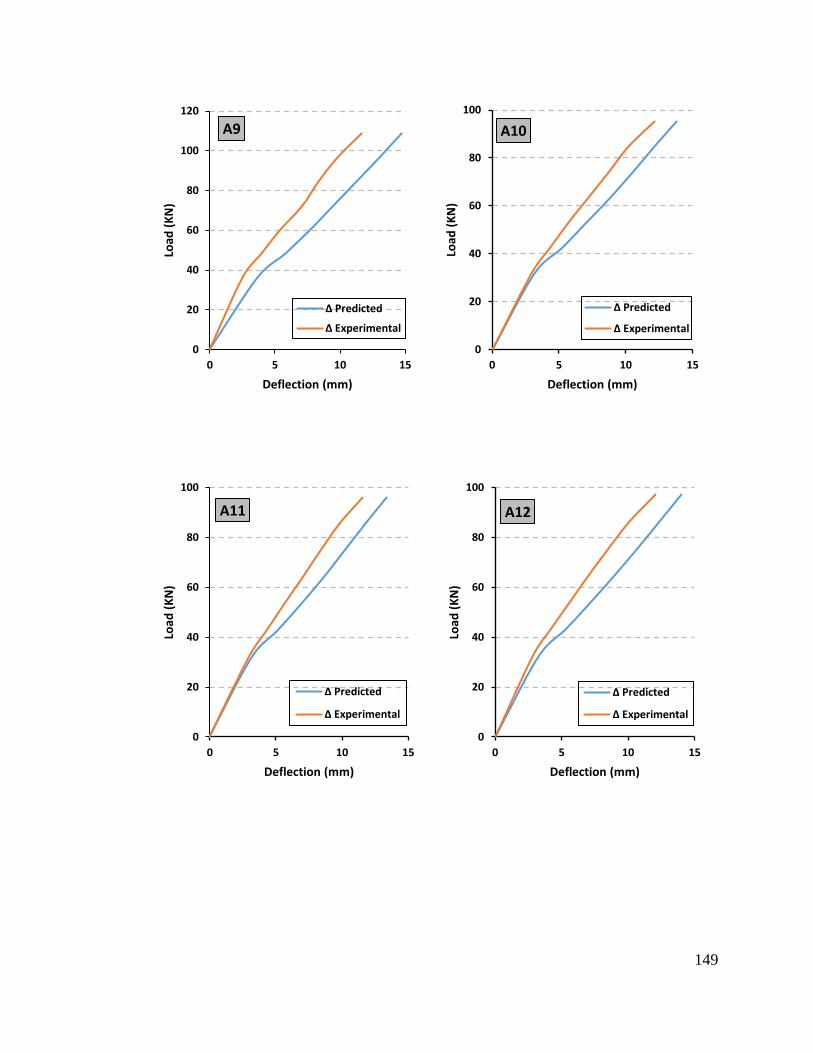
149
0
20
40
60
80
100
120
0 5 10 15
Load
(K
N)
Deflection (mm)
A9
∆ Predicted
∆ Experimental
0
20
40
60
80
100
0 5 10 15
Load
(K
N)
Deflection (mm)
A10
∆ Predicted
∆ Experimental
0
20
40
60
80
100
0 5 10 15
Load
(K
N)
Deflection (mm)
A11
∆ Predicted
∆ Experimental
0
20
40
60
80
100
0 5 10 15
Load
(K
N)
Deflection (mm)
A12
∆ Predicted
∆ Experimental
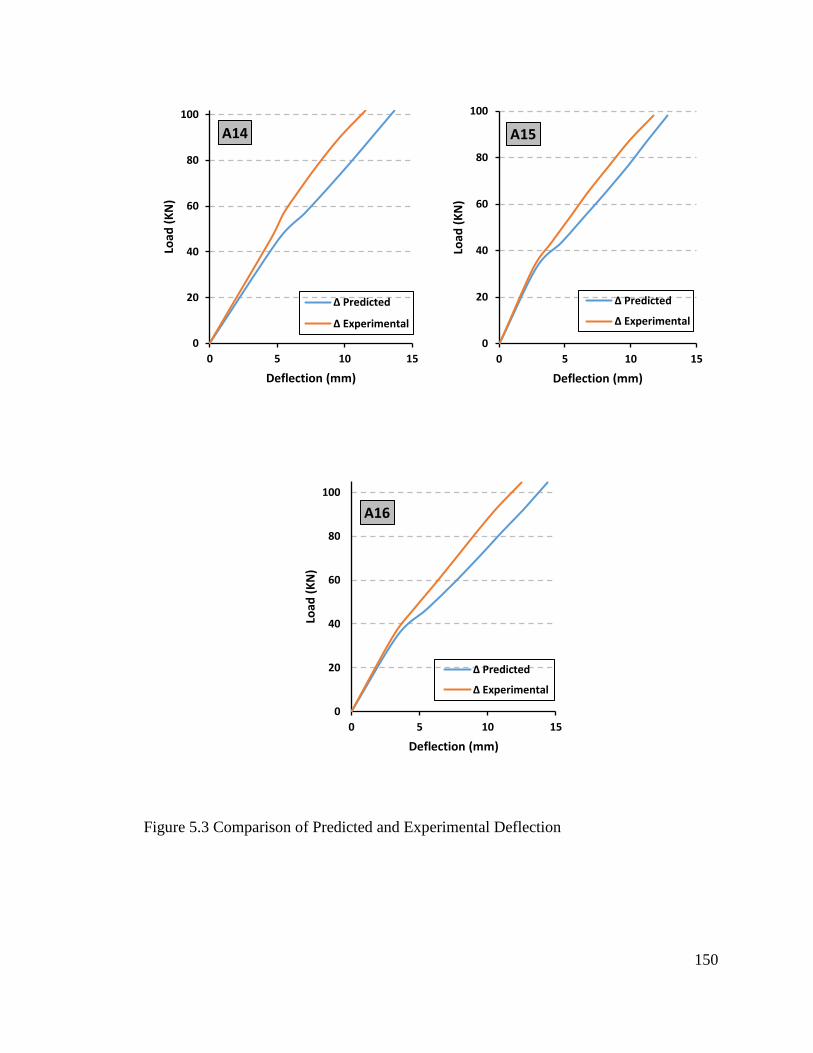
150
Figure 5.3 Comparison of Predicted and Experimental Deflection
0
20
40
60
80
100
0 5 10 15
Load
(K
N)
Deflection (mm)
A14
∆ Predicted
∆ Experimental
0
20
40
60
80
100
0 5 10 15
Load
(K
N)
Deflection (mm)
A15
∆ Predicted
∆ Experimental
0
20
40
60
80
100
0 5 10 15
Load
(K
N)
Deflection (mm)
A16
∆ Predicted
∆ Experimental
151
The immediate mid-span deflection of reinforced RCA concrete beams at 40% of their
corresponding ultimate load were predicted based on (ACI 318 2014), and the immediate
mid-span deflection of reinforced RCA concrete beams with BMF were predicted based
on proposed method by (Tan et al 1994). According to Table 5.3, there is no major
difference observed between the ∆.exp./∆.theo. values of conventional reinforced concrete
beam and RCA concrete beams with or without BMF. This verifies the applicability of
both deflection calculations methods to reinforced RCA concrete beams with or without
BMF.
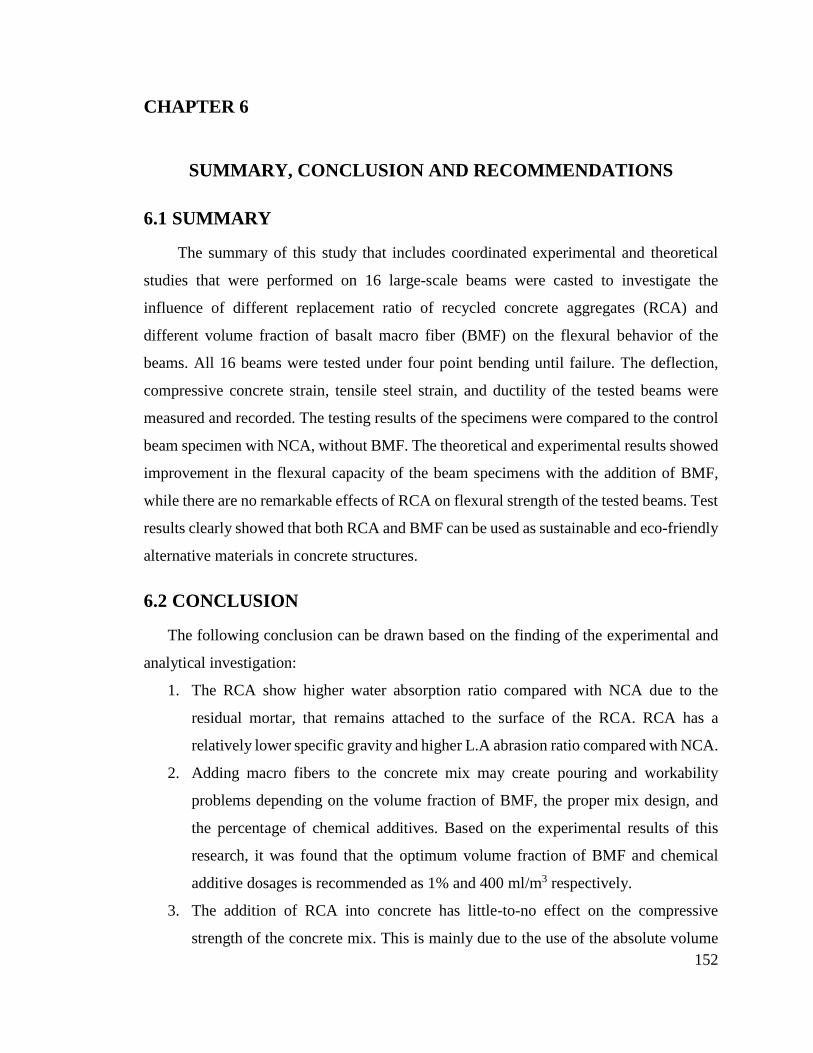
152
CHAPTER 6
SUMMARY, CONCLUSION AND RECOMMENDATIONS
6.1 SUMMARY
The summary of this study that includes coordinated experimental and theoretical
studies that were performed on 16 large-scale beams were casted to investigate the
influence of different replacement ratio of recycled concrete aggregates (RCA) and
different volume fraction of basalt macro fiber (BMF) on the flexural behavior of the
beams. All 16 beams were tested under four point bending until failure. The deflection,
compressive concrete strain, tensile steel strain, and ductility of the tested beams were
measured and recorded. The testing results of the specimens were compared to the control
beam specimen with NCA, without BMF. The theoretical and experimental results showed
improvement in the flexural capacity of the beam specimens with the addition of BMF,
while there are no remarkable effects of RCA on flexural strength of the tested beams. Test
results clearly showed that both RCA and BMF can be used as sustainable and eco-friendly
alternative materials in concrete structures.
6.2 CONCLUSION
The following conclusion can be drawn based on the finding of the experimental and
analytical investigation:
1. The RCA show higher water absorption ratio compared with NCA due to the
residual mortar, that remains attached to the surface of the RCA. RCA has a
relatively lower specific gravity and higher L.A abrasion ratio compared with NCA.
2. Adding macro fibers to the concrete mix may create pouring and workability
problems depending on the volume fraction of BMF, the proper mix design, and
the percentage of chemical additives. Based on the experimental results of this
research, it was found that the optimum volume fraction of BMF and chemical
additive dosages is recommended as 1% and 400 ml/m3 respectively.
3. The addition of RCA into concrete has little-to-no effect on the compressive
strength of the concrete mix. This is mainly due to the use of the absolute volume
153
concrete mixture method with saturated surface dry RCA, which imposed the
largest positive effect on the concrete compressive strength.
4. The addition of different volume of BMF into concrete has little-to-no effect on the
compressive strength of the concrete mix. That is because there is no clear
correlation between the two parameters.
5. It was observed that the addition of BMF resulted in an increase in the flexural
tensile strength of the concrete mix. BMF acts as a proactive reinforcement that
provides the immediate tensile load carrying capacity when micro cracks develop
in concrete.
6. The addition of RCA into concrete has little effect on the flexural tensile strength
of the concrete mix. This is because the negative effect related to the weakness of
the old interfacial transition zone in RCA as the flexural strength is mainly
dependent on the bond strength between aggregate and cement matrix.
7. There is an improvement in ductility of the beams with BMF, with same
replacement ratio of RCA as compared to concrete beams without fibers. The
improvement on the ductility of the concrete with the addition of BMF is
encouraging, particularly for the large-scale beams, due to the impact it can have
on the overall serviceability limit states of fiber reinforced concrete structures. The
observed high compressive strain in concrete indicated that the beams with BMF
are ductile enough to allow moment redistribution in beam.
8. The beams with BMF showed higher cracking and ultimate moment capacity
compared to the beams without BMF. The ultimate load values were slightly greater
for beams with BMF than the companion beams without BMF for all replacement
ratios of RCA.
9. In terms of crack pattern, the beams with BMF experienced a lower number of
cracks, because the BMF redistribute the tensile stress in RC beam.
10. The evaluation of the strain in the longitudinal reinforcement shows that, by
controlling the crack opening fibers make a tensile mechanical contribution that
induces relaxation in steel bars.
154
11. The mid-span deflections of reinforced RCA concrete beams with BMF showed
higher deflection, than the control beam without BMF, and the effect of RCA has
been reduced by using BMF and there is no effect by adding 1% and more of BMF.
12. The theoretical calculation values of cracking moment (Mcr) and ultimate flexural
moment (Mu) based on the code-based equations are reasonably close to the
experimental results for all beams.
13. The theoretical calculation values of instantaneous deflection (∆i) based on the
code-based equations and proposed equations are satisfactory, and give accurate
prediction over the range of variables and tested parameters.
6.3 RECOMMENDATIONS
The results of this research project show that it is possible to use recycled concrete
aggregates produced from construction and demolition wastes in constructing structural
concrete elements. However, the quality of the concrete made with RCA depends on the
material properties and the quality of the demolished structures. In order to overcome this
obstacle, it is recommended to use MBF in order to improve the concrete mechanical
properties. BMF reduces the micro-cracks and provides ductility to concrete which
improve concrete durability and help structural members to function after cracks. It also
increases the bond between RCA and concrete matrix. This research project will inspire
the acceptance of using of fiber reinforced concrete with recycled concrete aggregates.
6.4 FUTURE WORK
Overall, further research work is still required in order to understand and quantify the
effects of using different types of fibers on the behavior of concrete made with RCA.
Additional research work is essential to study the durability and long term performance of
concrete with RCA and BMF in a service environment. In addition, the shear behavior of
Basalt FRC beams with RCA is necessary. Replacement of fine aggregates with recycled
fine aggregates was not included in the scope of this study, and it is important to be
explored in a future research work. Research studies to evaluate the effects of using self-
155
compacting concrete(SCC) with RCA and BMF could also be performed. Further research
is needed on the influence of elevated temperature on the strength of basalt FRC beams.
156
REFERENCES
Abbas, A. et al., 2007. Environmental benefits of green concrete. 2006 IEEE EIC Climate
Change Technology Conference, EICCCC 2006.
Abdulla, N.A., 2012. Effect of Recycled Coarse Aggregate Type on Concrete. Asce,
150(Astm), pp.1–9.
ACI 315-99, 1999. Details and Detailing of Concrete Reinforcement Reported by ACI
Committee 315, Farmington Hills,MI.
ACI 318M-14, 2014. Building Code Requirements for Structural Concrete, Farmington
Hills,MI.
ACI Comite 544, 2002. State of the Art Report on Fiber Reinforced Concrete Reported
(ACI 544.1R-96 Reapproved 2002). ACI Structural Journal, 96(Reapproved), p.66.
Al-Ansary, M. & Iyengar, S.R., 2013. Physiochemical characterization of coarse
aggregates in Qatar for construction industry. International Journal of Sustainable
Built Environment, 2(1), pp.27–40.
Anil, P., Len, M. & Sudeep, A., 2013. Basalt Frp Minibar Reinforced Concrete. In pp. 51–
52.
Arezoumandi, M. et al., 2015. An experimental study on flexural strength of reinforced
concrete beams with 100% recycled concrete aggregate. Engineering Structures, 88,
pp.154–162.
ASTM C127, 2015. Standard Test Method for Relative Density (Specific Gravity) and
Absorption of Coarse Aggregate, American Society for Testing and Materials,West
Conshohocken,PA,USA.
ASTM C131, 2015. Standard Test Method for Resistance to Degradation of Small-Size
Coarse Aggregate by Abrasion and Impact in the Los Angeles Machine, American
Society for Testing and Materials,West Conshohocken,PA,USA.
ASTM C136, 2015. Standard Test Method for Sieve Analysis of Fine and Coarse
Aggregates 1, American Society for Testing and Materials,West
Conshohocken,PA,USA.
ASTM C150, 2007. Standard Specification for Portland Cement, American Society for
Testing and Materials,West Conshohocken,PA,USA.
157
ASTM C192, 2016. Standard Practice for Making and Curing Concrete Test Specimens
in the Laboratory, American Society for Testing and Materials,West
Conshohocken,PA,USA.
ASTM C39, 2016. Standard Test Method for Compressive Strength of Cylindrical
Concrete Specimens, American Society for Testing and Materials,West
Conshohocken,PA,USA.
ASTM C78, 2010. Standard Test Method for Flexural Strength of Concrete ( Using Simple
Beam with Third-Point Loading ) 1, American Society for Testing and Materials,West
Conshohocken,PA,USA.
Bajaj, S., 2012. Effect of Corrosion on Physical and Mechanical Properties of Reinforced
Concrete (Theses).
Banibayat, P. & Patnaik, A., 2014. Variability of mechanical properties of basalt fiber
reinforced polymer bars manufactured by wet-layup method. Materials and Design,
56, pp.898–906.
Byung, B. & Oh, H., 1993. FLEXURAL ANALYSIS O F REINFORCED CONCRETE
by volume . The various properties were measured during the tests in order to explore
the mechanical characteristics of fiber-reinforced concrete beams . Size effects were
not investigated nor considered in develo. , 118(10), pp.2821–2835.
Çakir, O., 2014. Experimental analysis of properties of recycled coarse aggregate (RCA)
concrete with mineral additives. Construction and Building Materials, 68, pp.17–25.
Choi, W.-C. & Yun, H.-D., 2013. Long-term deflection and flexural behavior of reinforced
concrete beams with recycled aggregate. Materials & Design, 51, pp.742–750.
Das, W., 2005. Der Einfluss von Basaltfasern auf aus- gewählte physische und
mechanische Eigenschaften von Zementmörtel The impact of basaltic fibre on
selected physi- cal and mechanical properties of cement mortar. , pp.28–33.
Dias, D.P. & Thaumaturgo, C., 2005. Fracture toughness of geopolymeric concretes
reinforced with basalt fibers. Cement and Concrete Composites, 27(1), pp.49–54.
Dilbas, H., Şimşek, M. & Çakır, Ö., 2014. An investigation on mechanical and physical
properties of recycled aggregate concrete (RAC) with and without silica fume.
Construction and Building Materials, 61(March 2006), pp.50–59.
Dong, J.F., Wang, Q.Y. & Guan, Z.W., 2017. Material properties of basalt fibre reinforced

158
concrete made with recycled earthquake waste. Construction and Building Materials,
130, pp.241–251.
Emmanuelle Landais, 2008. Construction waste “needs attention” | GulfNews.com. Gulf
News.
Fathifazl, G. et al., 2010. Flexural Performance of Steel-Reinforced Recycled Concrete
Beams. , (106).
Fritih, Y. et al., 2013. Flexural and shear behavior of steel fiber reinforced SCC beams.
KSCE Journal of Civil Engineering, 17(6), pp.1383–1393.
Grdic, Z.J. et al., 2010. Properties of self-compacting concrete prepared with coarse
recycled concrete aggregate. Construction and Building Materials, 24(7), pp.1129–
1133.
Güneyisi, E. et al., 2014. Effect of surface treatment methods on the properties of self-
compacting concrete with recycled aggregates. Construction and Building Materials,
64, pp.172–183.
High, C. et al., 2015. Use of basalt fibers for concrete structures. Construction and Building
Materials, 96, pp.37–46.
Holschemacher, K., Mueller, T. & Ribakov, Y., 2010. Effect of steel fibres on mechanical
properties of high-strength concrete. Materials and Design, 31(5), pp.2604–2615.
Huda, S.B. & Alam, M.S., 2014. Mechanical behavior of three generations of 100%
repeated recycled coarse aggregate concrete. Construction and Building Materials,
65, pp.574–582.
Jiang, C. et al., 2014. Experimental study on the mechanical properties and microstructure
of chopped basalt fibre reinforced concrete. Materials & Design, 58, pp.187–193.
Kang, T.H.-K. et al., 2014. Flexural Testing of Reinforced Concrete Beams with Recycled
Concrete Aggregates (with Appendix). Structural Journal, 111(3), pp.607–616.
Katz, A., 2004. Treatments for the Improvement of Recycled Aggregate. Journal of
Materials in Civil Engineering, 16(6), pp.597–603.
Katzer, J. & Domski, J., 2012. Quality and mechanical properties of engineered steel fibres
used as reinforcement for concrete. Construction and Building Materials, 34, pp.243–
248.
Kiang-Hwee Tan, P. Paramasivam, & K.-C.T., 1994. Creep and Shrinkage Deflections of
159
RC Beams With Steel Fibers. , 6(4), pp.474–494.
Knaack, A.M. & Kurama, Y.C., 2014. Behavior of Reinforced Concrete Beams with
Recycled Concrete Coarse Aggregates. ASCE Journal of Structural Engineering,
141(Special Issue: Sustainable Building Structures), pp.1–12.
Kou, S.C. & Poon, C.S., 2009. Properties of self-compacting concrete prepared with coarse
and fine recycled concrete aggregates. Cement and Concrete Composites, 31(9),
pp.622–627.
Kutalmıs Recep Akça a, Özgür Çakır b, M. _Ipek a, 2015. Properties of fiber reinforced
concrete using recycled aggregates. European Conference of Chemical Engineering,
98, pp.620–630.
Liang, Y.-C. et al., 2013. Development of Processing Methods to Improve Strength of
Concrete with 100% Recycled Coarse Aggregate. Journal of Materials in Civil
Engineering, 27(5), p.130801045339002.
McNeil, K. & Kang, T.H.K., 2013. Recycled Concrete Aggregates: A Review.
International Journal of Concrete Structures and Materials, 7(1), pp.61–69.
Mertol, H.C., Baran, E. & Bello, H.J., 2015. Flexural behavior of lightly and heavily
reinforced steel fiber concrete beams. Construction and Building Materials, 98,
pp.185–193.
Mohammadi, Y. et al., 2009. Impact resistance of steel fibrous concrete containing fibres
of mixed aspect ratio. Construction and Building Materials, 23(1), pp.183–189.
Panda, K.C. & Bal, P.K., 2013. Properties of self compacting concrete using recycled
coarse aggregate. Procedia Engineering, 51(NUiCONE 2012), pp.159–164.
Pereira-De-Oliveira, L.A. et al., 2014. Permeability properties of self-Compacting concrete
with coarse recycled aggregates. Construction and Building Materials, 51, pp.113–
120.
Poon, C.S. & Chan, D., 2007. The use of recycled aggregate in concrete in Hong Kong.
Resources, Conservation and Recycling, 50(3), pp.293–305.
Project, I., 1997. Basalt Fiber Composite Reinforcement for Concrete, Madison,
Wisconsin.
Purushothaman, R., Amirthavalli, R.R. & Karan, L., 2000. Influence of Treatment Methods
on the Strength and Performance Characteristics of Recycled Aggregate Concrete.
160
Journal of Materials in Civil Engineering, 27(5).
Qatar 2022 bidding committee official website, 2011. Qatar 2022. Available at:
www.qatar2022bid.com.
Qatar Customs, 2010. Qatar Customs Database. Available at:
http://www.qsa.gov.qa/Eng/%0ALatestPublications.htm.
Qatar Steel, 2016. Product Specification - Deformed Bars. Available at:
http://www.qatarsteel.com.qa/Products/Specification/SitePages/bars.aspx.
QCS, 2014. Qatar Construction Specifications, State of Qatar.
ReforceTech, 2016. Chopped Basalt Fiber, Republic of Ireland.
Shah, S.P. et al., 1999. Design Considerations for Steel Fiber Reinforced Concrete. ,
88(Reapproved).
Silva, R. V., De Brito, J. & Dhir, R.K., 2014. Properties and composition of recycled
aggregates from construction and demolition waste suitable for concrete production.
Construction and Building Materials, 65, pp.201–217.
Subramanian, N. & Engineer, C., 2010. Sustainability of RCC Structures. , 1(September),
pp.1–6.
Sudeep Adhikari, 2013. MECHANICAL AND STRUCTURAL CHARACTERIZATION OF
MINI-BAR REINFORCED CONCRETE BEAMS A Dissertation Presented to The
Graduate Faculty of The University of Akron In Partial Fulfillment of the
Requirements for the Degree Doctor of Philosophy Sudeep Adhikari.
Tumadhir, M., 2013. Thermal and Mechanical Properties of Basalt Fibre Reinforced
Concrete. , 7(4), pp.712–715.
Urbanski, M., Lapko, A. & Garbacz, A., 2013. Investigation on concrete beams reinforced
with basalt rebars as an effective alternative of conventional R/C structures. Procedia
Engineering, 57, pp.1183–1191. Available at:
http://dx.doi.org/10.1016/j.proeng.2013.04.149.
Zhang, W.T. & Ingham, J.M., 2010. Using Recycled Concrete Aggregates in New Zealand
Ready-Mix Concrete Production. Journal of Materials in Civil Engineering, 22(5),
pp.443–450.