pulset ube cryocooler anaysis
DESCRIPTION
pulset ube cryocooler anaysisTRANSCRIPT

Phase Shift Characteristics of
Oscillating Flow in Pulse Tube
Regenerators
H. L. Chen1,2
, L. W. Yang1
, J. H. Cai1
, and
J. T. Liang1
1
Technical Institute of Physics and Chemistry of CAS
Beijing, 100080, China
2
Graduate University of Chinese Academy of Sciences
Beijing, 100080, China
ABSTRACT
Experiments are performed to measure the dynamic velocities and pressures of regenerators
under different conditions to better understand the regenerator phase relation. A method is devel-
oped to investigate the phase characteristic and resistance coefficient of oscillating regenerators.
The main oscillating phase shifts are shown and discussed.
INTRODUCTION
The most distinct characteristics of high frequency oscillating regenerators are phase relations
between parameters. The phase angle could reflect the cooling performance, so to predict phase
shift in oscillating flow is crucially important for the optimum design of pulse tube cryocoolers.
Most previous researches focus on the oscillating friction factor, while several researches pay atten-
tion on phase shift. For example, F. Kuriyama et al.1 set up a numerical model for pulse tube cryo-
coolers (PTC) and analyze the phase by phasor diagrams, Hofman2
measured and analyzed the
volume flow rates at the hot end of the regenerator and the hot end of the pulse tube, Ju et al.3
measured the phase shift of pressure and velocity at both ends of the regenerator at 50 Hz, and
Sungry et al.4
used a new parameter to depict the phase shift between the instantaneous pressure
drop and the velocity at the inlet of the regenerator.
This paper centers on the phase angle relations in a PTC.
EXPERIMENTAL SYSTEM
Figure 1 shows the experimental apparatus5
used for dynamic measuring. The apparatus re-
sembles a real cryocooler but operates at room temperature. It could measure the dynamic pressure
and velocity at both ends of the tested regenerators. A linear compressor (swept volume: 2 cc) is
used to generate oscillating pressure (30-60 Hz). The experiment is operated at an average pressure
of 2 MPa.
There is a stabilizing section between the compressor and the regenerator to make the flow
more stable and several pieces of wire screens are arranged before and after the sensors for the
411Cryocoolers 14, edited by S.D. Miller and R.G. Ross, Jr.©¶International Cryocooler Conference, Inc., Boulder, CO, 2007

uniformity of velocity. A reservoir is connected to the pulse tube by an adjustable needle orifice
valve.
The lengths of regenerators are 40 mm, 50 mm, 70 mm and 80 mm, respectively. They are
packed with stainless-steel plainly woven wire screens mesh no. 400.
A fine hot wire (DANTEC, Model 90N10) anemometer and a piezoelectric pressure transducer
(KISTLER, Type 601A) is arranged at each end of the regenerator to measure the dynamic pressure
and the instantaneous oscillating velocity through the regenerator, respectively, as shown in Figure
1.
In order to get the system characteristics, various conditions such as different opening of ori-
fice (20, 30, 40, 50, 60), different input power (4 W, 9 W, 16 W) and different frequency (30 Hz,
40 Hz, 50 Hz, 60 Hz, et al. are changed for testing. The input power is limited by 16 W in this
experiment because the measured velocity curve becomes unstable at higher input power.
In this paper, instantaneous pressure and velocity at the inlet of a regenerator, or other ele-
ments, are denoted by P1
and U1, and those at the outlet denoted by P
2 and U
2, respectively. The
phase shift is denoted by (U1,U
2), (U
1,P
2), (U
1,P
1).
Figure 2 shows a typical group of measured velocity and pressure waves at the inlet (U1,P
1) and
outlet (U2,P
2) of a regenerator. The waves clearly show the different amplitude and the phase shift.
The phase angle of each parameter is processed by a Fast Fourier Transform (FFT), the same as
other work.1
One should notice that, since the wave of velocity is not exactly sinusoidal and not very smooth,
the phase result processed by FFT is not very accurate. So the error of the phase up to several
degrees is possible.
Figure 1. Experiment apparatus for testing the regenerators
Figure 2. Typical experimental curves
REGENERATOR MODELING AND PERFORMANCE INVESTIGATION412
EXPERIMENTAL RESULTS AND ANALYSIS
Phase Shift of Pure Resistance Element
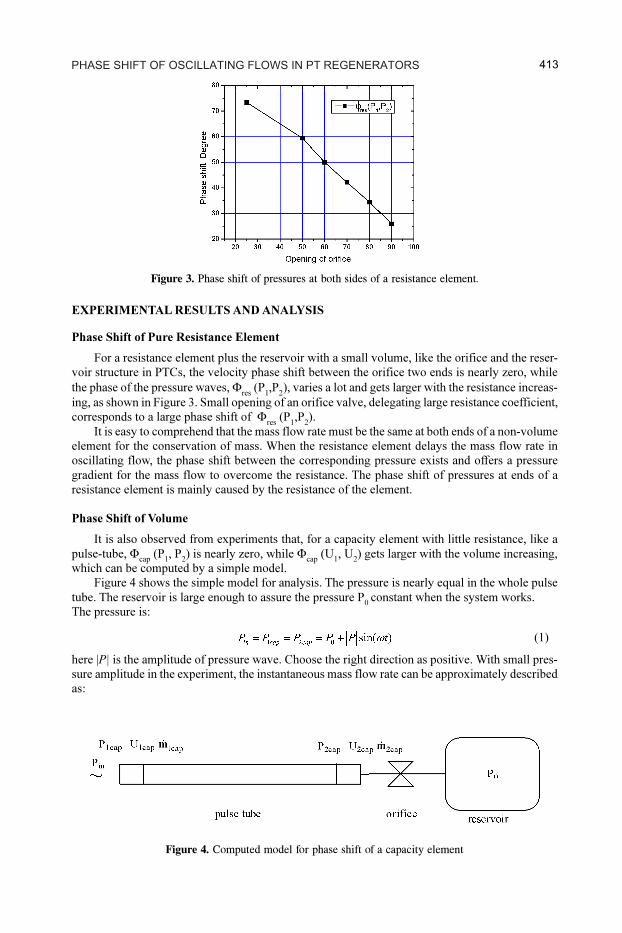
For a resistance element plus the reservoir with a small volume, like the orifice and the reser-
voir structure in PTCs, the velocity phase shift between the orifice two ends is nearly zero, while
the phase of the pressure waves, res
(P1,P
2), varies a lot and gets larger with the resistance increas-
ing, as shown in Figure 3. Small opening of an orifice valve, delegating large resistance coefficient,
corresponds to a large phase shift of res
(P1,P
2).
It is easy to comprehend that the mass flow rate must be the same at both ends of a non-volume
element for the conservation of mass. When the resistance element delays the mass flow rate in
oscillating flow, the phase shift between the corresponding pressure exists and offers a pressure
gradient for the mass flow to overcome the resistance. The phase shift of pressures at ends of a
resistance element is mainly caused by the resistance of the element.
Phase Shift of Volume
It is also observed from experiments that, for a capacity element with little resistance, like a
pulse-tube, cap
(P1, P
2) is nearly zero, while
cap (U
1, U
2) gets larger with the volume increasing,
which can be computed by a simple model.
Figure 4 shows the simple model for analysis. The pressure is nearly equal in the whole pulse
tube. The reservoir is large enough to assure the pressure P0
constant when the system works.
The pressure is:
(1)
here |P| is the amplitude of pressure wave. Choose the right direction as positive. With small pres-
sure amplitude in the experiment, the instantaneous mass flow rate can be approximately described
as:
Figure 3. Phase shift of pressures at both sides of a resistance element.
Figure 4. Computed model for phase shift of a capacity element
PHASE SHIFT OF OSCILLATING FLOWS IN PT REGENERATORS 413

(2)
where C is the coefficient defined, corresponding to the opening of orifice.
The mass conservation equation for the pulse tube is
(3)
The expression for the mass in the tube is:
(4)
Then, from equation (2), (3), and (4)
(5)
(6)
where = cap
(m1,P
1) is the phase shift between mË
1cap
and P1cap
•cap
(m1,P
1) is the most important
phase angle at cold end tip in Radebaugh’s enthalpy flow theory6 that decides the cooling perfor-
mance of the cryocooler. Since |P| has the small amplitude, density could be neglected and the
phase in mË is almost same in U. The resistance of the hot end, Co,
is directly related to the phase
angle. The phase cap
(U1, P
1)= will be 90
0 when C
o
=0 and cap
(U1,P
1)= will be 0 when C
o
is
infinite. Compared with the experimental results, as shown in Figure 5, the simple model is reliable.
The resistance coefficient is gained from experiments as its definition. The phase shift between the
velocities at the ends of a capacity element is mainly be caused by the capacity of the element.
Phase Shift of Regenerators
The regenerator is a complex element that contains both resistance and capacity elements.
General experimental results demonstrate that it can be studied by cap
(P1,P
2) and
reg(U
1,U
2) for
resistance and capacity characteristics, respectively, under different conditions. The phase shift
reg(U
2,P
2) at the cold end of the regenerator has no relationship with the regenerator, but is af-
fected by the situation behind. Some graphs representing some of the many experiments are shown
in Figure 6~9. In each graph, only one parameter is changed.
Figure 6 shows the situation when the orifice valve is opened up. reg
(U2,P
2) diminishes evi-
dently, while reg
(P1,P
2) and
reg(U
1,U
2) does not change much. A different resistance at the end of
Figure 5. Computed data comparing to experimental data
REGENERATOR MODELING AND PERFORMANCE INVESTIGATION414

Figure 6. Phase shift depending on orifice opening
Figure 7. Phase shift depending on input power
Figure 8. Phase shift depending on frequency
PHASE SHIFT OF OSCILLATING FLOWS IN PT REGENERATORS 415
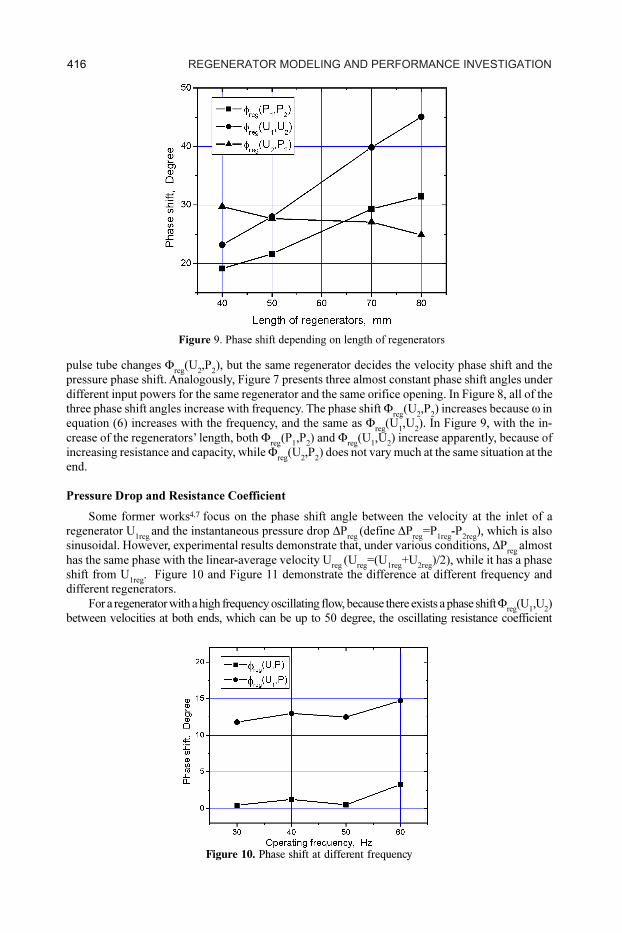
Figure 9. Phase shift depending on length of regenerators
Figure 10. Phase shift at different frequency
pulse tube changes reg
(U2,P
2), but the same regenerator decides the velocity phase shift and the
pressure phase shift. Analogously, Figure 7 presents three almost constant phase shift angles under
different input powers for the same regenerator and the same orifice opening. In Figure 8, all of the
three phase shift angles increase with frequency. The phase shift reg
(U2,P
2) increases because in
equation (6) increases with the frequency, and the same as reg
(U1,U
2). In Figure 9, with the in-
crease of the regenerators’ length, both reg
(P1,P
2) and
reg(U
1,U
2) increase apparently, because of
increasing resistance and capacity, while reg
(U2,P
2) does not vary much at the same situation at the
end.
Pressure Drop and Resistance Coefficient
Some former works4,7
focus on the phase shift angle between the velocity at the inlet of a
regenerator U1reg
and the instantaneous pressure drop Preg
(define Preg
=P1reg
-P2reg
), which is also
sinusoidal. However, experimental results demonstrate that, under various conditions, Preg
almost
has the same phase with the linear-average velocity Ureg
(Ureg
=(U1reg
+U2reg
)/2), while it has a phase
shift from U1reg
. Figure 10 and Figure 11 demonstrate the difference at different frequency and
different regenerators.
For a regenerator with a high frequency oscillating flow, because there exists a phase shift reg
(U1,U
2)
between velocities at both ends, which can be up to 50 degree, the oscillating resistance coefficient
REGENERATOR MODELING AND PERFORMANCE INVESTIGATION416

Figure 11. Phase shift of different regenerators
shouldn’t be calculated by U1, only. The velocity of gas at each tiny section inside the regenerator is
different at any instantaneous time, corresponding to a different tiny pressure drop. The total oscillating
pressure drop should be the integral result of each part, different from steady flow. If the resistance
coefficient is calculated by U1reg
and Preg
, it will vary with time because of the phase shift and it will be
a different value under different experimental conditions. The amplitude of U2reg
is around half or even
less than that of U1reg
, so it’s not correct to use U1reg
to delegate the velocity of a regenerator. Though the
entrance effect and the nonlinear effect must exist to a certain extent, using Ureg
and Preg
to investigate
the resistance of a regenerator is commonly available.
CONCLUSION
Phase shifts of pressures and velocities at both ends of an oscillating flow regenerator are
separately determined by the resistance and the capacity character of the regenerator. To investigate
the oscillating resistance coefficient of regenerators, the instantaneous velocities at both ends should
be considered to determine the pressure drop.
ACKNOWLEDGMENTS
Financial support for this effort was provided by the National Natural Science Foundation of
China (Grant No. 50206025).
REFERENCES
1. Kuriyama, F., and Radebaugh, R., “Analysis of mass and energy flow rates in an orifice pulse-tube
refrigerator,” Cryogenics, Volume 39, Issue: 1 (January 1999), pp. 85-92.
2. Hofmann, A., and Pan, H., “Phase shifting in pulse tube refrigerators,” Cryogenics, Volume 39, Issue 6
(June 1999), pp. 529-537.
3. Ju, Y., Jiang, Y., and Zhou, Y., “Experimental study of the oscillating flow characteristics for a regen-
erator in a pulse tube cryocooler,” Cryogenics, Volume 38, Issue: 6 (June 1998), pp 649-656.
4. Choi, S., Nam, K., and Jeong, S., “Investigation on the pressure drop characteristics of cryocooler
regenerators under oscillating flow and pulsating pressure conditions,” Cryogenics, Volume 44, Is-
sue: 3 (March 2004), pp. 203-210.
5. X.L. Wang, et al., “Experimental flow characteristics study of a high frequency pulse tube regenera-
tor,” Proceeding of Twentieth International Cryogenic Engineering Conference (ICEC20) ,
Springer (2004), pp. 439-444.
PHASE SHIFT OF OSCILLATING FLOWS IN PT REGENERATORS 417

6. Radebaugh, R., Chowdhury, K., and Zimmerman, J., “Optimization of a Pulse Tube Refrigerator,”
Proceedings of the International Cryocooler Conference, AFWAL/FDSG (1988), Wright-Patterson
AFB, OH.
7. Nam, K., and Jeong, S., “Measurement of cryogenic regenerator characteristics under oscillating flow
and pulsating pressure” Cryogenics, Volume 43, Issues: 10-11 (October - November 2003), pp 575-
581.
REGENERATOR MODELING AND PERFORMANCE INVESTIGATION418