project management and swot anaysis
TRANSCRIPT
URBAN DESIGN:
METHOD AND TECHNIQUES

This Page Intentionally Left Blank
URBAN DESIGN:METHOD AND TECHNIQUES
Cliff Moughtin, Rafael Cuesta,Christine Sarris and Paola Signoretta
OXFORD AUCKLAND BOSTON JOHANNESBURG MELBOURNE NEW DELHI
Architectural PressAn imprint of Butterworth-Heinemann Linacre House, Jordan Hill, Oxford OX2 8DP225 Wildwood Avenue, Woburn, MA 01801-2041A division of Reed Educational and Professional Publishing Ltd
A member of the Reed Elsevier plc group
First published 1999
© Cliff Moughtin, Rafael Cuesta, Christine Sarris and Paola Signoretta 1999
All rights reserved. No part of this publication may be reproduced in any material form (including photocopying or storing in any medium by electronic means and whether or not transiently or incidentally to some other use of this publication) without the written permission of the copyright holder except in accordance with the provisions of the Copyright,Designs and Patents Act 1988 or under the terms of a licence issued by the Copyright Licensing Agency Ltd, 90 Tottenham Court Road, London, England W1P 9HE. Applications for the copyright holder’s written permission to reproduce any part of this publication should be addressedto the publishers
British Library Cataloguing in Publication DataUrban design: method and techniques
1. City planningI. Moughtin, J. C.711.4
ISBN 0 7506 4102 9
Library of Congress Cataloguing in Publication DataUrban design: method and techniques/Cliff Moughtin .. [et al.].
p. cm.ISBN 0 7506 4102 91. City planning. I. Moughtin, Cliff.NA9031.U69 99–24321711'.4–dc21 CIP
Composition by Scribe Design, Gillingham, KentPrinted in Great Britain
v
CONTENTS
Preface ........................................................................................................... vii
Notes on the authors .................................................................................... ix
Acknowledgements ....................................................................................... x
1 Definitions ............................................................................................... 1
2 Negotiating the programme ................................................................... 15
3 Survey techniques ................................................................................... 27
4 Analysis .................................................................................................... 67
5 Generating alternatives ........................................................................... 87
6 Project evaluation ................................................................................... 139
7 Presentation ............................................................................................. 151
8 Project management ................................................................................. 171
9 Conclusion .............................................................................................. 185
Figure sources ................................................................................................ 189
Index ............................................................................................................. 191
INTRODUCTION
It is unproductive to try to define a rigid dividingline between survey and analysis. The collection ofparticular pieces of information implies the use ofa preconceived analytical framework. The accumula-tion of facts without purpose is wasteful and canonly confuse the outcome. Even the drawing of asimple sketch presupposes that a particular viewhas a relevance for the problem under investigation.Furthermore, it presupposes that the elements inthat view which are emphasized in the drawing alsohave some bearing on the task. If this is not thecase, then why make that particular sketch?Similarly, the collection of social or economic datacannot be all-inclusive. Only those sets of informa-tion of immediate use should be stored ready foranalysis. A useful principle to follow in surveydesign is to keep it brief, at least initially. It isalways possible to extend the search as the analysisilluminates the problem definition. In reality theremay be no clear distinction between survey andanalysis. But, for the sake of convenience, theanalytical stage of the design process can bedeemed to begin when thought is given to thestrengths and weaknesses of the project site, the
opportunities presented by the project and thepotential threats to the area which any interventionmay have to counter. This chapter begins with anoutline of the considerations involved in making aforecast of the future and the use of such a forecastas a design tool. The chapter then examines thetechniques for assessing the constraints on develop-ment and for assessing the possibilities of interven-tion. The central part of the chapter is focused onSWOT analysis; applying to urban design thetechniques for discovering the Strengths andWeaknesses of a project; the Opportunities fordevelopment; and the Threats which may disruptimplementation. The chapter ends with two casestudies. The first is The Lace Market in Nottinghamand the second is the New Campus for theUniversity of Nottingham.
TREND, FORECAST AND SCENARIO
Planning in Britain after the 1947 Town andCountry Planning Act, to some extent depended forits method on the analysis of trends and from thosetrends, making predictions about the future. Theplan was then based upon those predictions. It was
4ANALYSIS
6 7
found from experience that predictions andforecasts about the future can be wildly out whenbased on such calculations. The story of the chang-ing forecasts of national population in Britain duringthe post-1947 period is a salutary lesson for those inthe business of forecasting the future and also forthose relying on those predictions for plan making.The other major difficulty with the forecast is that itcan become a self-fulfilling prophecy. For example,the prediction of fast-rising car ownership and usagein the 1960s provided the rationale for Governmentpolicies. These policies gave priority to road-build-ing programmes to the detriment of pursuing vigor-ous investment in public transport. The extra roadmiles built on the strength of Government policystimulated demand for the use of those same roads.With that stimulus in demand, came the inevitableincrease in car ownership and the use of the car,even for short journeys. The forecast for the growthin car ownership was therefore shown to be true,or to some extent to be a ‘self-fulfilling prophecy’.This analysis of the growth in car ownership inBritain over the last forty years may have beenoverstated, nevertheless there is some truth in thebelief that this prediction, particularly about carusage, has some of the characteristics of a circularargument where the forecast reinforces the trend.Trends in the changing patterns of lifestyle areevident, even under the most superficial of examina-tions. An analysis of these trends may stimulateideas about the nature of the problem being investi-gated and also actions which may be necessary tomodify a trend leading to an undesirable outcome.The apparent trends in changing lifestyles, however,are no more than an indication of what mighthappen in the future. And only if the conditionsgoverning these trends remain the same. If trendsare viewed in this light, then there is little dangerthat they may evolve into a forecast leading to anauthoritative prediction of future conditions. Theonly certainty about a prediction is that it is morelikely to be misleading than to give an accuratepicture of the future.
The ways in which some factors governing every-day activity and current lifestyle are changing maycritically affect development, or the designer’s viewof development, potential in the project area. Itmay, therefore, be appropriate to analyse sucheconomic, social and cultural factors. For mostdevelopment projects, forming an understanding ofthe dynamics of population change is standardprocedure. A knowledge of what might happen tothe target population is fundamental for many urbandesign projects. This study may be a simple attemptto gauge the rate of growth or decline of popula-tion, or it may aim to discover which sections ofthe population, in terms of age, sex, race or socio-economic group, are growing or declining and atwhat rate.
Population studies are the starting point fordetermining the land requirements and for theallocation of space for competing activities or landuses. A knowledge of present population is neces-sary in order to make some prediction for thefuture. The most basic information is the size ofthe present population. This may not be asstraightforward as it sounds. The resident popula-tion may be supplemented by tourists and a dailycommuting population. For some projects thisvisiting population may be extremely important. Itis often essential to have some knowledge of thebreakdown of the population in terms of age, sex,race and socio-economic group. From this informa-tion the specific needs of the community forservices and facilities can be gauged. It may, if theproject area is large enough, be necessary toexamine the physical distribution of the variousgroups which comprise the population. The physi-cal distribution of the population gives someindication of the location of facilities. An assess-ment of the population can be made by conduct-ing a specially designed survey. This is bothexpensive and time consuming. It is more usual touse the Registrar General’s Census of Population,adjusted to allow for assumed changes betweencensus dates.
U R B A N D E S I G N : M E T H O D A N D T E C H N I Q U E S
6 8
Predicting future population is based upon anexamination of existing trends. It is important toknow if there are any signs of change in the factorsgoverning population size. For example, it is usefulto know the birth, death, marriage, and fertilityrates, together with the levels of migration. Theunderlying tendencies in the population should beexamined to see if there is a trend in the popula-tion towards ageing, or a trend towards a greaternumber of working females, or towards more butsmaller households. The designer would want toknow the tendency towards the physical distribu-tion of changes. Knowledge of the existing popula-tion, together with any trends and tendencies whichcan be discovered, together form the basis offorecasting future population.
Forecasting population is a speculative business.Demographers are extremely guarded aboutattempting to forecast the future particularly ofsmall districts of the city. The smaller the area ofstudy, the less reliable are the forecasts. If it isdecided to engage in this hazardous enterprise thenthere are a number of techniques for makingpopulation forecasts. The most basic is a continua-tion of the recent past into the future by extendinga straight line graph based on the assumption thatcurrent trends will persist. A popular technique forforecasting future population is the Cohort SurvivalMethod.1 This technique adjusts census figures inforward steps, by age and sex groups, year on year,until the date of the project completion.Adjustments are made to the figures for changes inbirth, death, fertility, in- and out-migration: ‘Inessence what it does is to trace a particular agegroup, for example 0–4 years through theirestimated life cycle making deductions for projecteddeaths based upon life tables, and amendments fornet migration. The next 0–4 age group is calculatedby reference to the fertility rate of the number of‘survivors’ remaining in preceding groups orcohorts’.2
There may be other areas, as well as population,for which projection may prove useful. For
example, further information about population andits changing patterns of employment, income andexpenditure may throw light on possible demandfor housing or other goods. The rates at which thehousing stock is declining in numbers and quality ofmaintenance or the changes in patterns of owner-ship, or, indeed the general changes in land-usepatterns may be of significance to the project. Thenature of the project and its goals will determinethe factors to be investigated and which particulartrends, when analysed, will prove useful for thedevelopment of the project.
The analysis of trends becomes a more usefuldesign tool when comparisons can be madebetween the study area and the city, its region, orthe nation as a whole. A knowledge of populationtrends in the study area may be essential for designpurposes but when those local trends are comparedwith those in the larger community the significanceof local change may be highlighted. This compara-tive element in trend analysis applies equally toemployment, housing conditions or car ownershippatterns. All trend analyses should embody acomparative element.
A more imaginative technique than trend analysisfor assessing future possibilities is scenario design.Using this technique the designer constructs pos-sible futures imagining the major factors which mayaffect the way people live. Major events such as asea change in political attitudes; an oil crisis; astock market crash; joining or not joining theEURO; and many other possible future events canbe built into a series of different scenarios. Thesescenarios can be fed back into the forecasts, whichin turn result in a set of different trends for anytopic analysed. The trends can then be presentedgraphically. It is usual to present three trends andtheir resulting forecast for each topic; one wherethe assumptions are favourable, one where they areunfavourable and the third somewhere between theextremes. Scenario building is, above all else, a toolof the imagination and therefore most useful for thedesigner seeking ideas.
A N A L Y S I S
6 9

CONSTRAINTS AND POSSIBILITIES
Two useful analytical tools are constraints and possi-bilities mapping. The constraints and possibilitiesmaps focus mainly upon the physical factors whichaffect development. The constraints map containsinformation, for example, on the location anddesign of any approved projects such as roadwidening, sites with planning approvals, land use orbuilding height restrictions, buildings designated asof historic interest, together with any importantfeatures of the land or its servicing. The constraintsmap can have a debilitating effect upon design ifeach constraint is not challenged in terms of itscurrent importance and also examined in the lightof any possible waivers or methods of circumvent-ing the effects of the constraint. The possibilitiesmap includes items such as areas ripe for develop-ment, possible linkages with adjacent areas in thecity, features which are special to the area, groupsof buildings of outstanding architectural significancewhich, with a change of use, would bring distinc-tion to the quarter, positions where developmentwould enhance the appearance of the built environ-ment and areas where landscape intervention wouldbe advantageous.
SIEVE MAPPING
Analysing constraints and possibilities can beexpressed graphically as a series of sieve maps.Mapping a number of constraints as transparentoverlays to an ordnance survey map of the projectarea eliminates those areas which, for one reason oranother, present difficulties for development. Thetechnique, when combined with the power of thecomputer using Geographic Information Systems(GIS) technology, can combine many layers ofphysical and socio-economic data, so affordingcomplex analyses which relate population studies tothe environment occupied by the community. The
use of large-scale three-dimensional computermodels is becoming more common in urbanplanning and design. In addition to the use of thecomputer model for design, it is being developed toact as the core of an urban information system.Systems are being developed for linking objects in athree-dimensional model with other kinds of infor-mation, including text and photographs, records ofa building’s history, social statistics, data aboutenergy use and digital material for sound and video.Computer models are beginning to appear in which‘The visualisation capacities of the CAD model andthe analytical power of the geographic informationsystem can be brought together to provide newkinds of tools for urban design’.3
STRENGTHS, WEAKNESSES,OPPORTUNITIES AND THREATS
SWOT (strengths, weaknesses, opportunities,threats) analysis is a useful technique for the collec-tion and structuring of data. SWOT analysis has itsorigins in business management where strengthsand weaknesses refer to the internal workings ofthe organization while opportunities and threats areexternal to it.4 This clear distinction between inter-nal and external conditions is more difficult to applywhen assessing the potential of a part of the physi-cal world such a city district. The analysis in strictmanagement terms could be applied to an organiza-tion contemplating a particular intervention in theworld of real estate but not necessarily in quite thesame way for the potential of the real estate itself.Many of the threats facing an inner city area or theopportunities it presents could be considered to beinternal to the physical structure being investigated.For example, a continued loss of population in theinner city could be seen as a threat to regenerationbut in many ways it is inherent to the inner city.Clearly there is overlap between all four analyticalcategories. A weakness, for example, can be viewedin a more positive light as an opportunity, while in
U R B A N D E S I G N : M E T H O D A N D T E C H N I Q U E S
7 0
some instances a strength in one area when viewedfrom a different perspective can appear as thesource of a weakness. Nevertheless, the structureimposed by the listing and categorizing of aspectsand qualities of the project site under these fourbroad headings does assist in formulating possiblestrategies for intervention. The completion of theanalysis can also form the basis for questioning theassumptions underlying project goals and objectives.The SWOT analysis can, therefore, assist in theclearer definition of the design brief and point theway to design solutions.
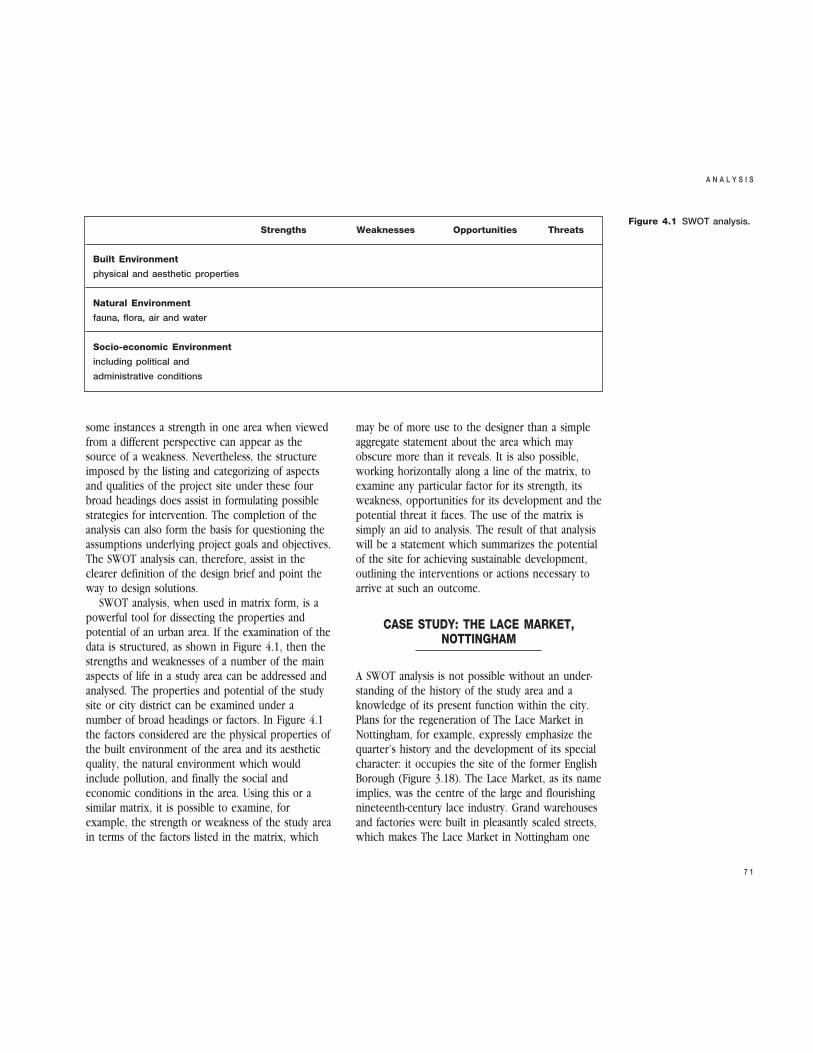
SWOT analysis, when used in matrix form, is apowerful tool for dissecting the properties andpotential of an urban area. If the examination of thedata is structured, as shown in Figure 4.1, then thestrengths and weaknesses of a number of the mainaspects of life in a study area can be addressed andanalysed. The properties and potential of the studysite or city district can be examined under anumber of broad headings or factors. In Figure 4.1the factors considered are the physical properties ofthe built environment of the area and its aestheticquality, the natural environment which wouldinclude pollution, and finally the social andeconomic conditions in the area. Using this or asimilar matrix, it is possible to examine, forexample, the strength or weakness of the study areain terms of the factors listed in the matrix, which
may be of more use to the designer than a simpleaggregate statement about the area which mayobscure more than it reveals. It is also possible,working horizontally along a line of the matrix, toexamine any particular factor for its strength, itsweakness, opportunities for its development and thepotential threat it faces. The use of the matrix issimply an aid to analysis. The result of that analysiswill be a statement which summarizes the potentialof the site for achieving sustainable development,outlining the interventions or actions necessary toarrive at such an outcome.
CASE STUDY: THE LACE MARKET,NOTTINGHAM
A SWOT analysis is not possible without an under-standing of the history of the study area and aknowledge of its present function within the city.Plans for the regeneration of The Lace Market inNottingham, for example, expressly emphasize thequarter’s history and the development of its specialcharacter: it occupies the site of the former EnglishBorough (Figure 3.18). The Lace Market, as its nameimplies, was the centre of the large and flourishingnineteenth-century lace industry. Grand warehousesand factories were built in pleasantly scaled streets,which makes The Lace Market in Nottingham one
A N A L Y S I S
7 1
Figure 4.1 SWOT analysis.Strengths Weaknesses Opportunities Threats
Built Environment
physical and aesthetic properties
Natural Environment
fauna, flora, air and water
Socio-economic Environment
including political and
administrative conditions

of the finest collections of nineteenth-century com-mercial architecture possibly in Europe (Figures 4.2to 4.5). In the twentieth century, the lace industrywent into decline. Many of the fine buildings werenot properly maintained, became run down andwere sub divided as workrooms for small clothing
and textile firms. The rents such properties couldcommand were low, so exacerbating the problemsof maintenance. Following the destruction of somebuildings during the Second World War, furtherbuildings were demolished in the 1950s and 1960s.The road schemes in The Lace Market and its
U R B A N D E S I G N : M E T H O D A N D T E C H N I Q U E S
7 2
Figure 4.2 Stoney Street,
The Lace Market,
Nottingham.
Figure 4.3 Stoney Street,
The Lace Market,
Nottingham.
4.2 4.3
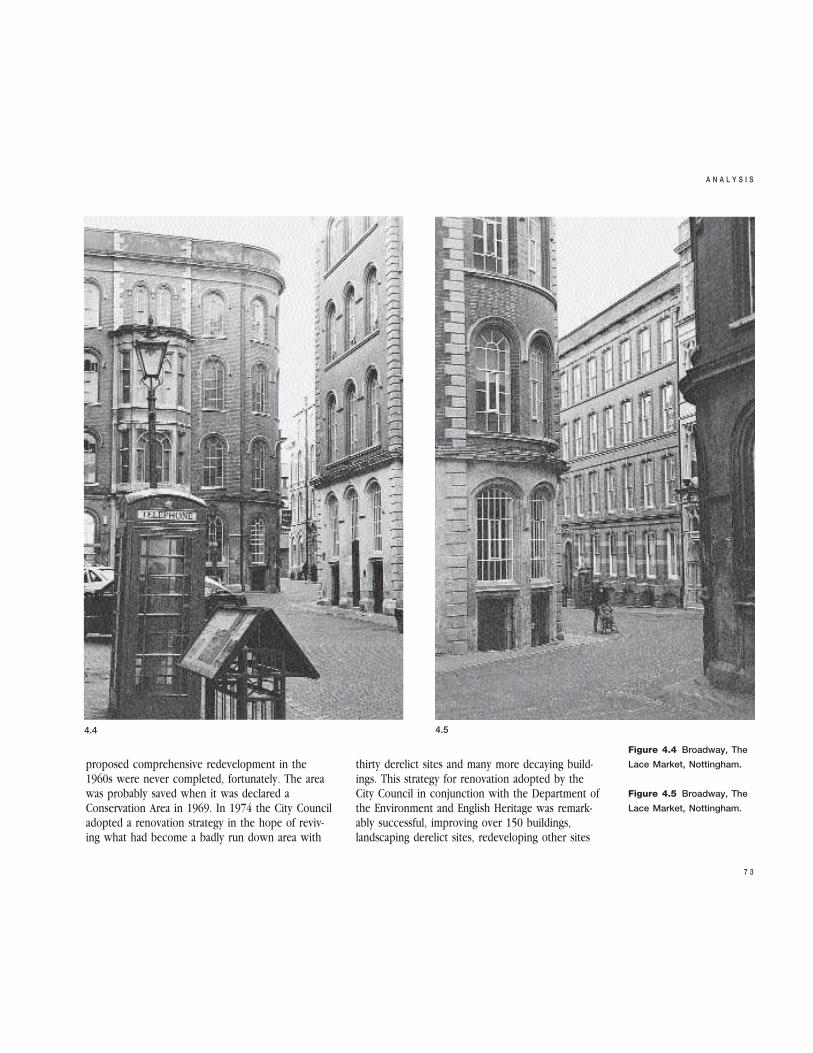
proposed comprehensive redevelopment in the1960s were never completed, fortunately. The areawas probably saved when it was declared aConservation Area in 1969. In 1974 the City Counciladopted a renovation strategy in the hope of reviv-ing what had become a badly run down area with
thirty derelict sites and many more decaying build-ings. This strategy for renovation adopted by theCity Council in conjunction with the Department ofthe Environment and English Heritage was remark-ably successful, improving over 150 buildings,landscaping derelict sites, redeveloping other sites
A N A L Y S I S
7 3
Figure 4.4 Broadway, The
Lace Market, Nottingham.
Figure 4.5 Broadway, The
Lace Market, Nottingham.
4.4 4.5
for housing, converting the Unitarian Chapel onHigh Pavement to a Lace Hall as a focus for touristsin the area and generally changing the fortunes ofthe area.
In 1988 the City Council, the Department of theEnvironment and Nottingham DevelopmentEnterprise appointed Conran Roche to carry out astudy of The Lace Market which led to the adoptionby the City Council of a new approach to theplanning of the area. The unique history of the site,with its roots in Saxon times and a wealth of fineurban architecture, formed the backcloth to thestudy. Of particular importance was its long associa-tion with the lace industry. This led to a keyproposal in the planning strategy to develop thequarter as ‘a centre for fashion, clothing and textileindustry, particularly for small and medium-sizedcompanies who need a City Centre location’.5 Thetextile industry, while giving to the quarter itsspecial character, in terms of large-scale manufac-ture is a function in decline. In 1989, 5500 peoplewere working in The Lace Market in 250 firms. Inaddition to the clothing and textile firms there wereother light manufacturing industries with associatedoffices and warehousing; retailing along CarltonStreet, Goose Gate and Hockley; together withoffices which at that time occupied 18 per cent ofthe total floorspace. A small but significant popula-tion of 500 people lived in the area, some in adesign award-winning group of town apartments. Inthe area there was also the beginnings of a leisureindustry with a small live theatre, cinema and anumber of restaurants. Based on his understandingof the situation in Lace Market in 1989, Rochesuggested six key principles for the regeneration ofthis city quarter.6
The first principle of the regeneration strategywas to ensure the survival of small textile com-panies in their present location within The LaceMarket. For this purpose Roche suggested thatPlumptre Street should be the focus of aprogramme of property acquisition and refurbish-ment for use as workshops. Two-hundred square
feet of floorspace was to be let at affordable rents.In addition, it was proposed that a Grade Two-listedschool house should be developed as a TextileExperience Centre. The second strand in the strat-egy was to revive the Adams Building and create anew focus for a New Lace Market. The AdamsBuilding is the most grand of the industrial buildingsin the area. It was designed by T.C. Hine in theItalianate Style and built in 1885. It is the focalpoint of The Lace Market. It was to be rehabilitatedand converted for retail use on the ground floor.There was to be a 120-room hotel and 30 000square feet of residential apartments on the upperfloors. A small public square was to be sited next tothe Adams building on a dilapidated car park. Thepublic square was to be enclosed on the west, withthe new four-storey Lace Market Building acting as agateway into the quarter. The third strand in theregeneration strategy was to create a major exten-sion to the Broadmarsh Centre with direct linkswith The Lace Market, along a retail route throughWeekday Cross. The remaining principles of thestrategy were to maintain the present mix of landuses; to meet essential car parking requirementswithin each site and to build multi-storey car parksadjacent to the Ring Road; and finally to create TheLace Market as an Historic Urban Park.
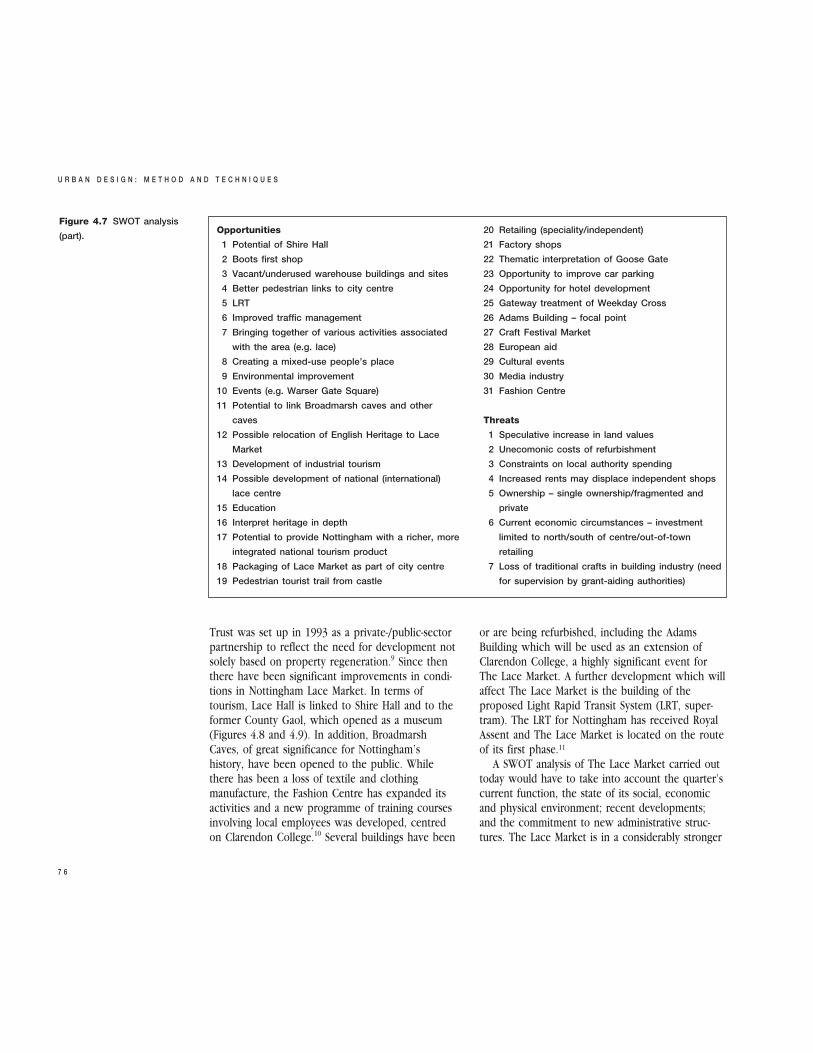
The Lace Market Development Company waslaunched in 1989 to stimulate the regeneration ofThe Lace Market. The Lace Market DevelopmentCompany, together with Nottingham City Counciland Nottingham Tourism Development ActionProgramme, commissioned a further report byconsultants Tibbalds, Karski, Colbourne andWilliams. The report by Tibbalds and his colleaguesrecommended the declaration of The Lace Market asa National Heritage Area.7 Figure 4.6 illustrates thedesign strategy proposed in the report which isbased in part on a SWOT analysis. The summary ofthe SWOT analysis identified twenty-six items underthe headings Strengths, thirty-two Weaknesses,thirty-one Opportunities and seven Threats.Figure 4.7 shows the opportunities and threats
U R B A N D E S I G N : M E T H O D A N D T E C H N I Q U E S
7 4
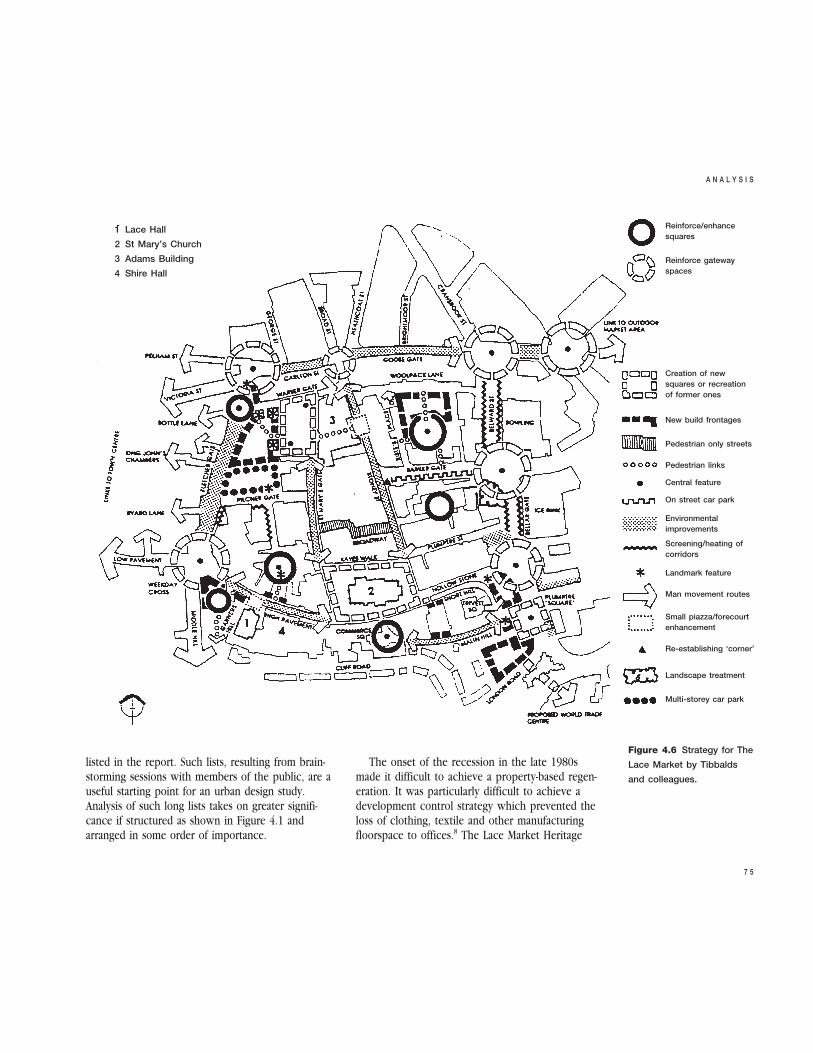
listed in the report. Such lists, resulting from brain-storming sessions with members of the public, are auseful starting point for an urban design study.Analysis of such long lists takes on greater signifi-cance if structured as shown in Figure 4.1 andarranged in some order of importance.
The onset of the recession in the late 1980smade it difficult to achieve a property-based regen-eration. It was particularly difficult to achieve adevelopment control strategy which prevented theloss of clothing, textile and other manufacturingfloorspace to offices.8 The Lace Market Heritage
A N A L Y S I S
7 5
Figure 4.6 Strategy for The
Lace Market by Tibbalds
and colleagues.
1 Lace Hall
2 St Mary’s Church
3 Adams Building
4 Shire Hall
Reinforce/enhance
squares
Reinforce gateway
spaces
Creation of new
squares or recreation
of former ones
New build frontages
Pedestrian only streets
Pedestrian links
Central feature
On street car park
Environmental
improvements
Screening/heating of
corridors
Landmark feature
Man movement routes
Small piazza/forecourt
enhancement
Re-establishing ‘corner’
Landscape treatment
Multi-storey car park
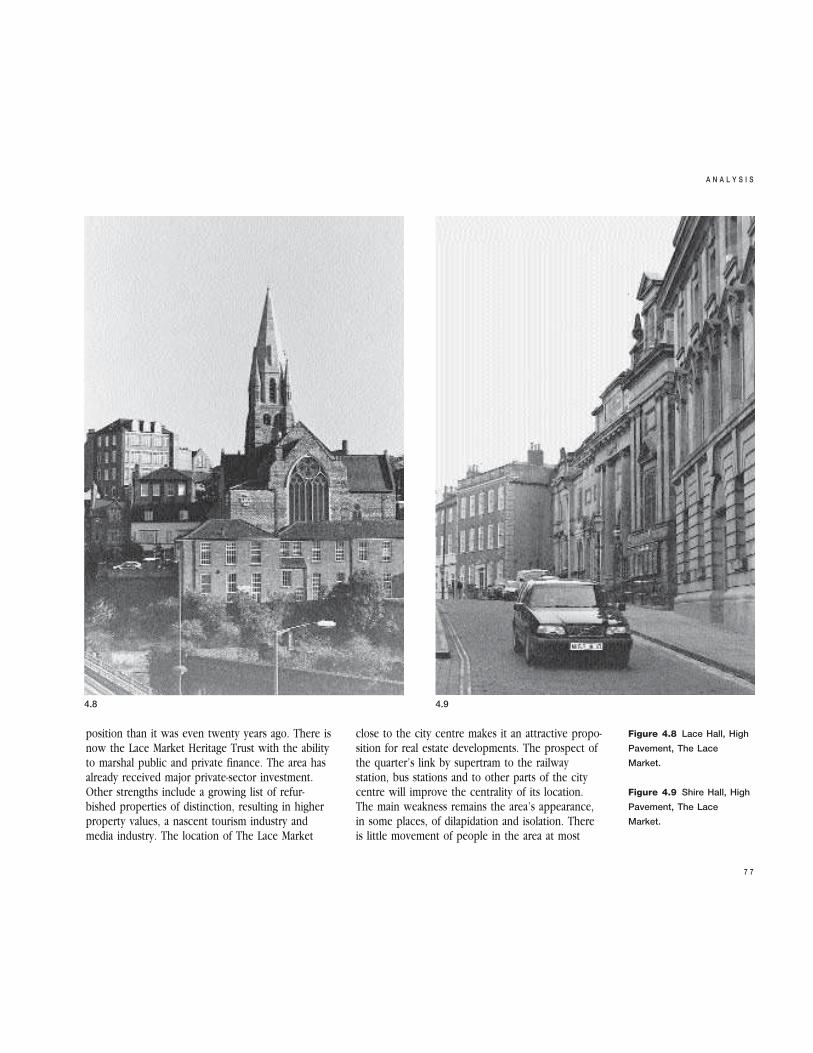
Trust was set up in 1993 as a private-/public-sectorpartnership to reflect the need for development notsolely based on property regeneration.9 Since thenthere have been significant improvements in condi-tions in Nottingham Lace Market. In terms oftourism, Lace Hall is linked to Shire Hall and to theformer County Gaol, which opened as a museum(Figures 4.8 and 4.9). In addition, BroadmarshCaves, of great significance for Nottingham’shistory, have been opened to the public. Whilethere has been a loss of textile and clothingmanufacture, the Fashion Centre has expanded itsactivities and a new programme of training coursesinvolving local employees was developed, centredon Clarendon College.10 Several buildings have been
or are being refurbished, including the AdamsBuilding which will be used as an extension ofClarendon College, a highly significant event forThe Lace Market. A further development which willaffect The Lace Market is the building of theproposed Light Rapid Transit System (LRT, super-tram). The LRT for Nottingham has received RoyalAssent and The Lace Market is located on the routeof its first phase.11
A SWOT analysis of The Lace Market carried outtoday would have to take into account the quarter’scurrent function, the state of its social, economicand physical environment; recent developments;and the commitment to new administrative struc-tures. The Lace Market is in a considerably stronger
U R B A N D E S I G N : M E T H O D A N D T E C H N I Q U E S
7 6
Figure 4.7 SWOT analysis
(part).Opportunities
1 Potential of Shire Hall
2 Boots first shop
3 Vacant/underused warehouse buildings and sites
4 Better pedestrian links to city centre
5 LRT
6 Improved traffic management
7 Bringing together of various activities associated
with the area (e.g. lace)
8 Creating a mixed-use people’s place
9 Environmental improvement
10 Events (e.g. Warser Gate Square)
11 Potential to link Broadmarsh caves and other
caves
12 Possible relocation of English Heritage to Lace
Market
13 Development of industrial tourism
14 Possible development of national (international)
lace centre
15 Education
16 Interpret heritage in depth
17 Potential to provide Nottingham with a richer, more
integrated national tourism product
18 Packaging of Lace Market as part of city centre
19 Pedestrian tourist trail from castle
20 Retailing (speciality/independent)
21 Factory shops
22 Thematic interpretation of Goose Gate
23 Opportunity to improve car parking
24 Opportunity for hotel development
25 Gateway treatment of Weekday Cross
26 Adams Building – focal point
27 Craft Festival Market
28 European aid
29 Cultural events
30 Media industry
31 Fashion Centre
Threats
1 Speculative increase in land values
2 Unecomonic costs of refurbishment
3 Constraints on local authority spending
4 Increased rents may displace independent shops
5 Ownership – single ownership/fragmented and
private
6 Current economic circumstances – investment
limited to north/south of centre/out-of-town
retailing
7 Loss of traditional crafts in building industry (need
for supervision by grant-aiding authorities)
position than it was even twenty years ago. There isnow the Lace Market Heritage Trust with the abilityto marshal public and private finance. The area hasalready received major private-sector investment.Other strengths include a growing list of refur-bished properties of distinction, resulting in higherproperty values, a nascent tourism industry andmedia industry. The location of The Lace Market
close to the city centre makes it an attractive propo-sition for real estate developments. The prospect ofthe quarter’s link by supertram to the railwaystation, bus stations and to other parts of the citycentre will improve the centrality of its location.The main weakness remains the area’s appearance,in some places, of dilapidation and isolation. Thereis little movement of people in the area at most
A N A L Y S I S
7 7
Figure 4.8 Lace Hall, High
Pavement, The Lace
Market.
Figure 4.9 Shire Hall, High
Pavement, The Lace
Market.
4.8 4.9
times of the day; it can give the impression, whichis not the case, that it has been abandoned and leftto disintegrate, like a deserted town. This isolationgives the area a bad reputation and attracts fewpedestrians, particularly in the evenings. Thereseems little connection between The Lace Marketand the city centre across Fletcher Gate from
Weekday Cross to Carlton Street. Service access intothe area for industry is weak and conflicts with theneed to pedestrianize more of the area. There arefew land uses in the heart of The Lace Marketwhich attract heavy flows of pedestrian trafficwhich would help to make the quarter a saferplace. There are still few ground-floor land uses
U R B A N D E S I G N : M E T H O D A N D T E C H N I Q U E S
7 8
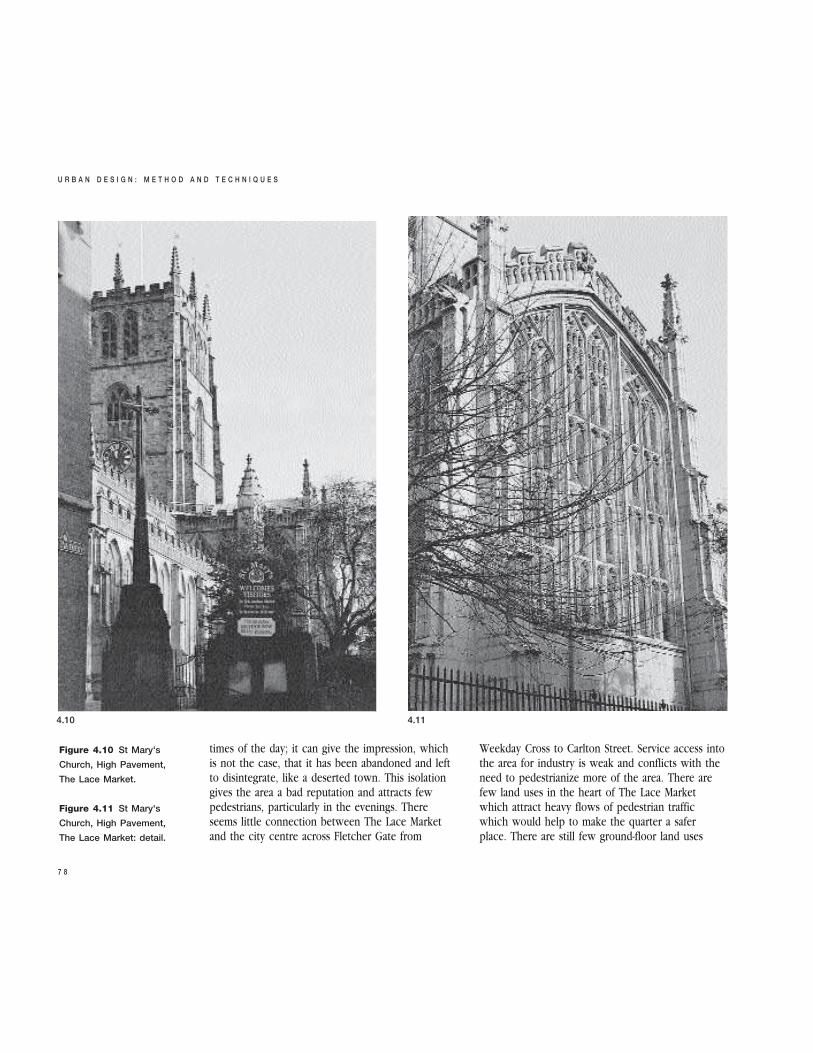
Figure 4.10 St Mary's
Church, High Pavement,
The Lace Market.
Figure 4.11 St Mary's
Church, High Pavement,
The Lace Market: detail.
4.10 4.11
which generate activities opening out onto thestreet. Despite recent developments, there are fewvisitor attractions and no inviting public squares.For pedestrian street traffic to increase significantlythese deficiencies in urban structure will need to beaddressed. Many of the weaknesses of a place,however, may present other opportunities if theyare seen in a more positive light. Seeing only theproblems faced by a city quarter can be so negativethat it may inhibit the search for innovativesolutions.
The Lace Market has the opportunity to buildupon the successes of the last twenty years. Thereis a great opportunity to develop further the touristpotential of this part of Nottingham. It is the site ofmany nationally important archaeological, historicand townscape elements. These elements must befully developed and linked if the area is to attractsignificant numbers of visitors. The area does havethe potential to form an Historic Urban Theme Park(Figures 4.8 to 4.11). In addition to its long historyand the area’s association with the lace industry,The Lace Market also could be developed as amedia centre because of its two existing theatres. Italready has a street which attracts a fashionableclientele because of the specialized character of itsethnic shops, chic boutiques and restaurants. Theseattractions need very little to weld them into aviable all-year-round centre for visitors: it doesmean establishing a critical mass in terms of thedensity and numbers of activities associated withtourism. The Adams Building, once occupied byClarendon College, will introduce into the area awhole new dynamic. The additional student popula-tion will generate pressures for further develop-ments and presents an opportunity to bring backlife and vitality to The Lace Market. The ‘threats’facing The Lace Market should not be used as anexcuse to inhibit development. They too can beseen as an opportunity to make arrangements anddevelop strategies which avoid the effects ofeconomic forces which may prove detrimental tothe developmental goals. In the case of The Lace
A N A L Y S I S
7 9
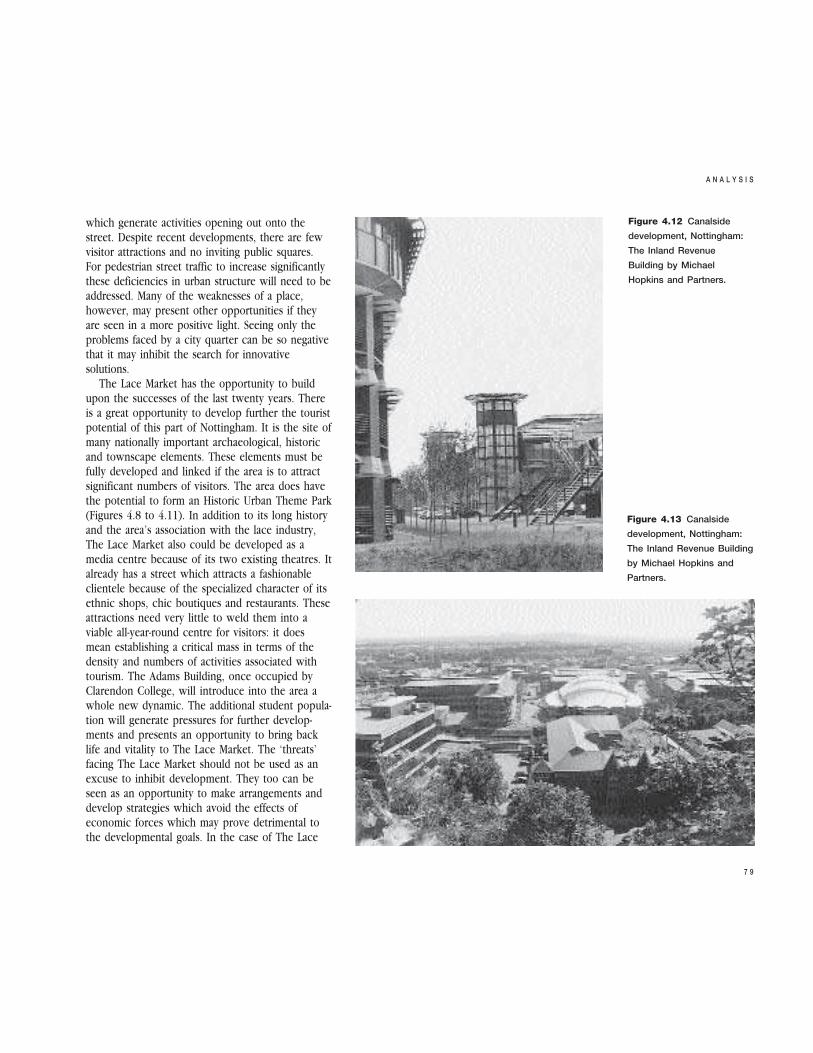
Figure 4.12 Canalside
development, Nottingham:
The Inland Revenue
Building by Michael
Hopkins and Partners.
Figure 4.13 Canalside
development, Nottingham:
The Inland Revenue Building
by Michael Hopkins and
Partners.
Market there is a danger that the very success ofthe scheme and the increase in property prices andrentals could damage the fragile basis of the textileindustry. The improvement to the environment andthe rehabilitation of the many fine buildings in TheLace Market will increase the pressure for floor-space for offices, restaurants, clubs and possiblyresidential accommodation. New users moving intothe area will generate higher rents which will placeadditional pressures upon textile companies whichpresently enjoy low rents. Such companies may bedisplaced and unable to find alternative accommo-dation in The Lace Market. Because of the loss ofjobs the area would lose its character. The veryheart of The Lace Market could be torn out of thequarter as this process of gentrification proceeds.Other ‘threats’ which are faced by The Lace Marketinclude stagnation caused by the area’s incapacityto compete with large-scale developments in thecity to the north and south of the site. Prestigiousdevelopments are being pursued on the sites of theold warehouses along the canal to the southeast of
the city centre. These sites are unencumbered byexisting buildings, having been largely cleared andthe ground prepared for modern purpose-designeddevelopments, more suited to the needs of thetwenty-first century than the fine, but constrained,envelopes of the nineteenth-century buildings ofThe Lace Market (Figures 4.12 to 4.17). To thenorth of the city centre the large 1960s VictoriaShopping Centre is being expanded with some up-market shopping which offers strong competitionto any possible retail developments in The LaceMarket.
NEW CAMPUS FOR THE UNIVERSITY OFNOTTINGHAM
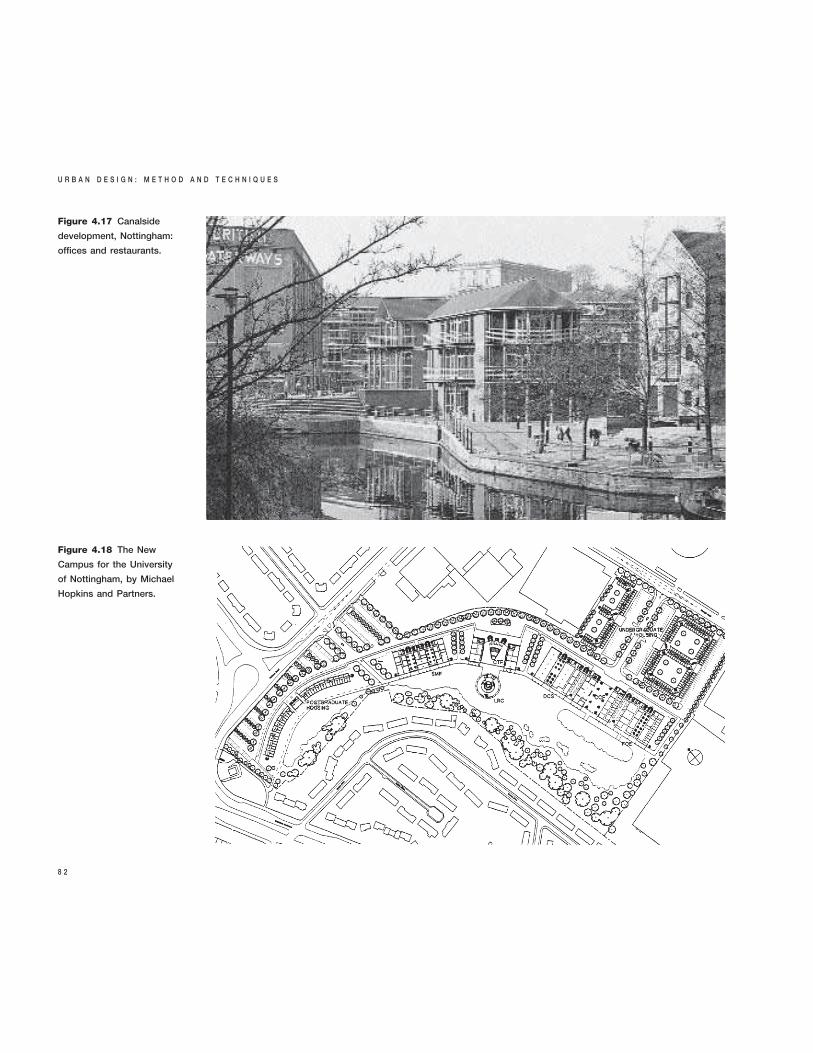
Extensive survey and imaginative analysis do notnecessarily result, of themselves, in fine urbandesign. Without a broad concept or unifying ideathe result can only be pedestrian. The University ofNottingham is engaged in building an extension ona new campus. After an architectural competition,the University of Nottingham engaged MichaelHopkins and Partners to design a new university ofremarkable quality. This particular case study isused as a reminder that great city building resultsfrom inspiration and imagination and not frommethod alone. Method is to facilitate and stimulatethe imagination. The case study is also used to illus-trate how small components of the total problemcan be analysed.
The project goal for the new campus is to regen-erate a redundant site in Nottingham and to trans-form it into a distinctive, attractive and environmen-tally friendly setting for the University’s muchneeded expansion of teaching, research and livingaccommodation (Figures 4.18 and 4.19). There are anumber of reasons for the £40 million developmentwhich is to be completed by 1999.12 The Universityof Nottingham is the most sought-after university byprospective undergraduate students. It is also aleading UK university with an international
U R B A N D E S I G N : M E T H O D A N D T E C H N I Q U E S
8 0
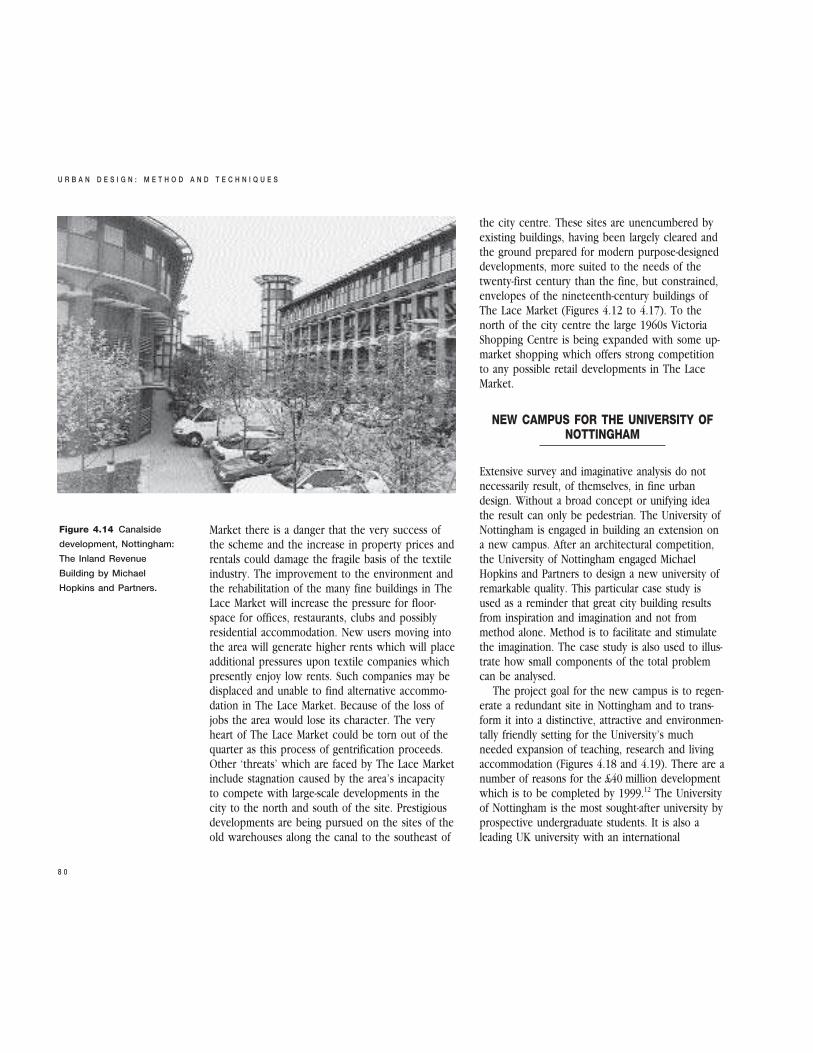
Figure 4.14 Canalside
development, Nottingham:
The Inland Revenue
Building by Michael
Hopkins and Partners.
A N A L Y S I S
8 1
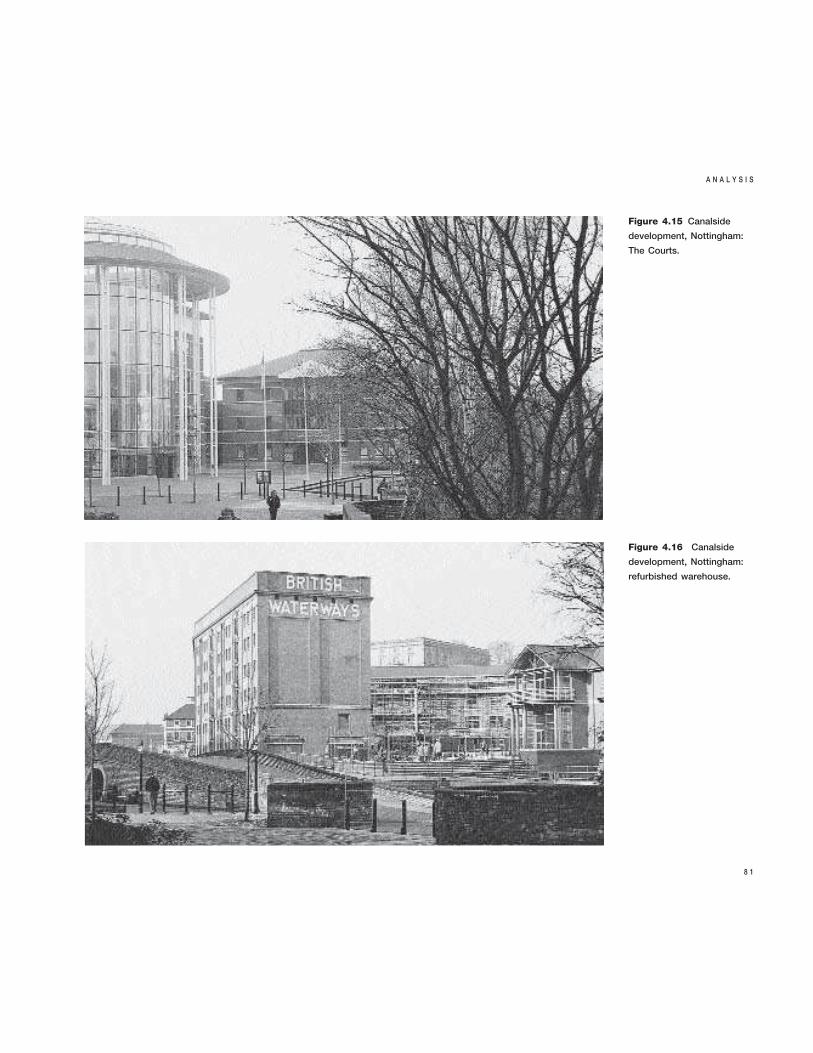
Figure 4.15 Canalside
development, Nottingham:
The Courts.
Figure 4.16 Canalside
development, Nottingham:
refurbished warehouse.
U R B A N D E S I G N : M E T H O D A N D T E C H N I Q U E S
8 2
Figure 4.17 Canalside
development, Nottingham:
offices and restaurants.
Figure 4.18 The New
Campus for the University
of Nottingham, by Michael
Hopkins and Partners.

reputation in top quality research as well as teach-ing. It is therefore anticipated that future expansionof research, teaching and ‘technology transfer activi-ties’ will lead to pressure on the University Estateand the need for additional space. Perhaps the mostinteresting reason given for the development of the
new campus is the desire to protect ‘the treasuredenvironment of the University Park Campusrenowned and popular for the beauty and space ofits landscape’. Fundamental to the project is therealization that an environment can only support orsustain a limited development before its quality is
A N A L Y S I S
8 3
Figure 4.19 The New
Campus for the University
of Nottingham, by Michael
Hopkins and Partners:
axonometric.
diminished. Environmental carrying capacity, herelinked to the attraction of the main campus forprospective students, is a concept central to sustain-able development.
The master plan for the new campus reflectssome of the most distinctive qualities of UniversityPark, the main university campus. The central idea
for the regeneration of the site is the creation of agreen lung, making it one of the many parks forwhich Nottingham is known and of which the cityis justly proud. The site at Wollaton Road is smallwhen compared with the existing campus. It islocated between industrial landscape and suburbia.The concept is linear development following the
U R B A N D E S I G N : M E T H O D A N D T E C H N I Q U E S
8 4
4.20 4.21 4.22
4.23 4.24
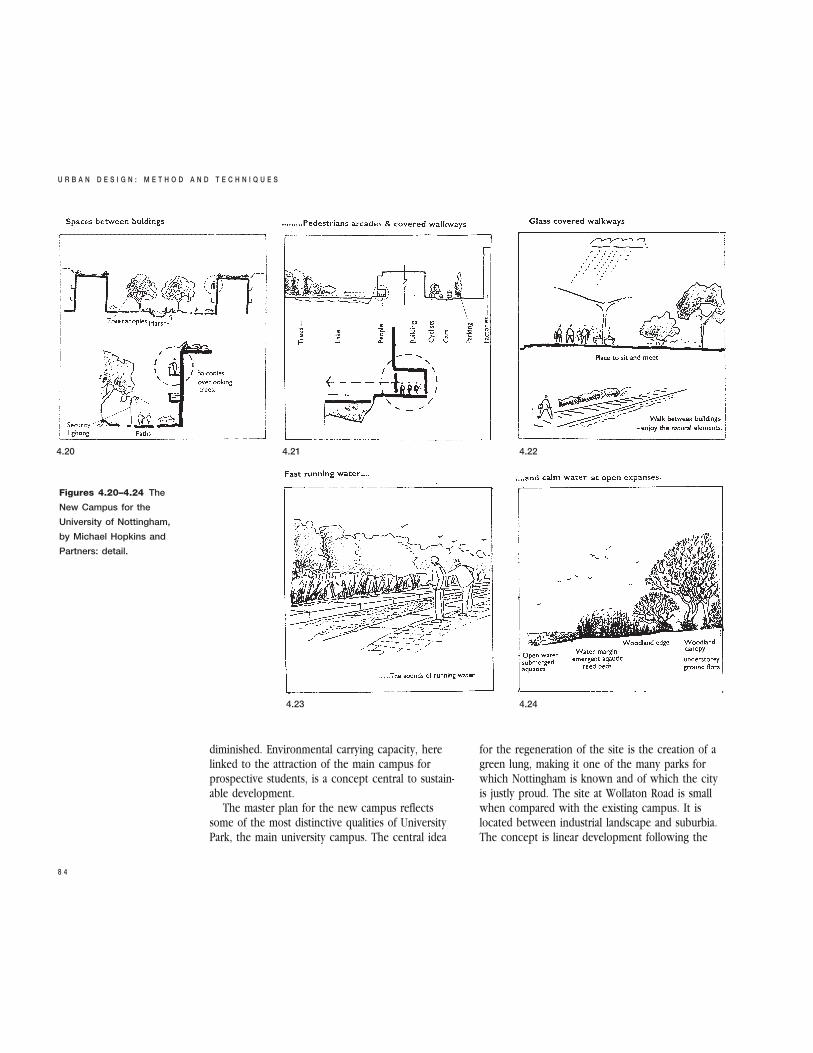
Figures 4.20–4.24 The
New Campus for the
University of Nottingham,
by Michael Hopkins and
Partners: detail.
main lines of the site. Efficiency is derived by segre-gating the movement of cars and pedestrians.Vehicular traffic, including buses, use one spineroute running the length of the site and pedestriansthe other main route. There are two main entrypoints into the site: both roads are lined with treesand are modelled on the Nottingham boulevardswhich are such a distinctive feature of the roadsystem developed in the city during last century andthe early parts of this century. The design for thenew campus places great emphasis on the quality ofthe environment. Existing woodland on the westernedge of the site is retained and enhanced as aconservation area for plants and wildlife. A man-made lake is a feature of the proposed develop-ment.13 On one side of the lake is the existingwoodland which serves as a buffer between theuniversity and the residential area. On the otherside, to the east of the lake, is the main walkwaylinking all the new buildings. The width and depthof the lake will vary, which will encourage theestablishment of a variety of wildlife. There is anenvironmental strategy for the buildings, the aim ofwhich is to deliver the optimum sustainableconstruction and energy performance. The buildingsare designed with climate-modifying façades, anefficient ventilation system and atria with extensiveplanting. The various departments are arranged indistinct buildings along the spine. The buildings areset in parkland following the landscape tradition ofthe main university campus. Visual and physicallinks are established by the sharing of commonspaces which form internal piazzas where peoplecan meet and socialize.
The illustrations for the new campus include aseries of informative thumb nail sketches. They illus-trate the solution to a number of the designproblems in the new campus (Figures 4.20 to 4.24).This method of analysing and expressing ideas forsolving key parts of the total problem is a mostuseful analytical technique during problem explor-ation: thumb nail sketches are also worth manythousand words of explanation.
CONCLUSION
The New Campus for the University of Nottinghamis the result of an International Competition won byMichael Hopkins and Partners. The New Campus islikely to prove a benchmark for architectural qualityand it may also prove to be an exciting regenera-tion of a run-down area of Nottingham. It is, aboveall else, a fine example of urban design whichshould serve as a model both of method and ofideas for city development during the twenty-firstcentury. Its inclusion in this particular place in thebook is to emphasize that the design idea is asimportant as the method. Good design does notnecessarily follow the application of sound method.Ideas may result from a flash of inspiration andwhen it does, the idea should be grasped, devel-oped and accepted with gratitude. The designer,however, cannot wait for inspiration. He or shefollows a method which is likely to stimulate thegeneration of ideas. This chapter has examined therole of forecasting, constraints and possibilitiesmapping and SWOT analysis, while the next chapterwill explore some of the techniques for generatingalternative design concepts.
REFERENCES
1 More complex matrix techniques of forecasting for use in
modelling can be found in McLoughlin, J.B. (1969) Urban
and Regional Planning: A Systems Approach, London:
Faber and Faber, and in Field, B. and MacGregor, B. (1987)
Forecasting Techniques for Urban and Regional Planning,
London: Hutchinson.
2 Ratcliffe, J. (1974) An Introduction to Town and Country
Planning, London: Hutchinson.
3 Day, A. (1994) New tools for urban design, Urban Design
Quarterly, No. 51, pp. 20–23.
4 Bevan, O.A. (1991) Marketing and Property People,
London: Macmillan.
A N A L Y S I S
8 5

5 Nottingham City Planning Department (1989) Nottingham
Lace Market, Development Strategy, Nottingham:
Nottingham City Council.
6 Roche, Conran (1989) Nottingham Lace Market: The
Vision, Report One, and Detailed Proposals and Impacts,
Report Two, Nottingham: Conran Roche.
7 Tibbalds, F., Karski, Colbourne, Williams in association with
Touchstone (1991) National Heritage Area Study:
Nottingham Lace Market, Nottingham: Nottingham City
Council.
8 Nottingham Evening Post, 8 August 1991.
9 Nottingham Evening Post, 3 July 1996.
10 Nottingham Evening Post, 30 December 1996.
11 Greater Nottingham Light Rapid Transit Act, 1994.
12 The University of Nottingham (12 November 1996) New
Campus Fact Sheet, Nottingham: The University of
Nottingham.
13 Fawcett, P. (12 November 1996) The New Campus: An
Architectural Appreciation, Nottingham: The University of
Nottingham.
U R B A N D E S I G N : M E T H O D A N D T E C H N I Q U E S
8 6
INTRODUCTION
This chapter returns to the theme of structuring thedesign process to ensure a successful outcome, butit approaches the subject from a slightly differentview point. The material for this chapter is derivedfrom business studies but, where appropriate, thoseideas have been adapted and applied to the builtenvironment. This chapter focuses on the basicconcepts of project management. The practices andtechniques that can assist in transforming ideas intoreal undertakings are discussed, together with anassessment of the software currently available. Ofkey importance is the difference between the tradi-tional approach to project management and themodel advocated here which focuses not only onthe intrinsic management process but on the exter-nal factors which affect the development, manage-ment and implementation of any project.
DEVELOPMENT OF PROJECT MANAGEMENT
Managing projects is an activity which dates back tothe early history of man. Great projects, such as the
pyramids, the building of ancient cities, theplanning of the Great Wall of China and otherwonders of the ancient world, required carefulplanning and implementation. Project managementthen was used as a powerful way of controllingcommunities and to coerce them towards a clearlyestablished goal. The ancient projects involvedenormous numbers of people, with extremely highratios of labourers to managers. Ancient megastruc-tures such as the Mayan Ceremonial Centres withtheir majestic temples were built with the involve-ment of the whole community, guided by the visionof secular and sacred authorities. The length of timetaken to build these great structures covered severalgenerations. The focus on the ultimate goal,however, was never lost.
The building of ancient cities required propermanagement in order to achieve complex anddetailed specifications. How, for example, did theIncas erect so accurately the massive walls ofMachu Picchu? How were the gigantic Hindutemples at Angkor built in such close conjunctionto its complex of waterways? All these undertakingsrequired detailed specifications of the work to becarried out, the material to be used, as well asguarantees and methods of organizing the
8PROJECT MANAGEMENT
1 7 1
distribution of tasks. Clearly, these projects wereprocured with great consciousness of the impor-tance of time, cost and quality which are thecornerstones of project management.
There are numerous examples of the achieve-ments of project management throughout history;the Medieval cathedrals representing the dominanceof faith over territories, the architecture of theeighteenth century representing classic perfection,or the great triumphs of urban planning in the latenineteenth century representing the steady increaseof engineering sophistication. It was, however, thegreat wars in the twentieth century which gavenew impetus to the development of scientific waysof organizing and undertaking complex operations.New project planning techniques emerged as wellas new approaches to general management. HenryGantt’s bar chart used for production scheduling atthe Frankfort arsenal in 1917 became an essentialtool for project management and it is still widelyused in an essentially unaltered form. Critical pathanalysis developed by Wright in 1918 to show therelationships between activities is another exampleof a technique which plays an essential role inmodern management.1
Although many of the early codifications of prin-ciples and practices were developed in the first halfof the twentieth century, project management in itsmodern form extends back only thirty to forty years.The project management processes and techniquesused in the Manhattan Atom Bomb project(1940–1945), became the model for the managementof later projects such as the Polaris Missiles(1955–1960) and the Apollo Moon Programme(1960–1970). The evolution of project managementand its new role as a defined professional disciplinein its own right is now universally apparent as newroads or bridges open, as major buildings rise, asnew computer systems come on line or as spectacu-lar shopping centres and urban projects unfold. Theuse of its principles and practices can assist in theelimination of the need to rely on luck to attain asuccessful outcome for a project.
PROJECT MANAGEMENT TECHNIQUES ANDPRACTICES
The Code of Practice for Project Management of theChartered Institute of Building2 defines projectmanagement as:
the overall planning, co-ordination and control of aproject from inception to completion aimed atmeeting a Client’s requirements in order toproduce a functionally and financially viable projectthat will be completed on time within authorisedcost and to the required quality standards.
In other words, a ‘project’ is a process of creating aspecific result; a means to an end. Project manage-ment deals with the co-ordination and integration ofthe process. A project can be further defined as anon-routine activity; a separate undertaking havingtime, cost, quality constraints and objectives. Aproject usually involves multiple disciplines in newand complex activities with clear start and enddates. It involves greater risks than operationswhich are simply ‘business as usual’ and canbecome an agent of change.
Paralleling the method outlined in previouschapters for urban design, the life cycle of aspecific undertaking in project management termscan be subdivided into four major stages, namely:‘Project Definition Stage’, ‘Project Planning Stage’,‘Project Implementation Stage’ and ‘Project ClosureStage’ (Figure 8.1). These stages and the activitiesthat take place at each stage are described below.
PROJECT DEFINITION STAGEMost projects emerge from a strategic objective orinvestment aim established by an individual or anorganization. In project management terms theindividual or the organization responsible for formu-lating the preliminary project concepts is referred toas the client or project sponsor. The client isresponsible for defining the business requirements;justifying funding; setting success criteria; reviewing
U R B A N D E S I G N : M E T H O D A N D T E C H N I Q U E S
1 7 2
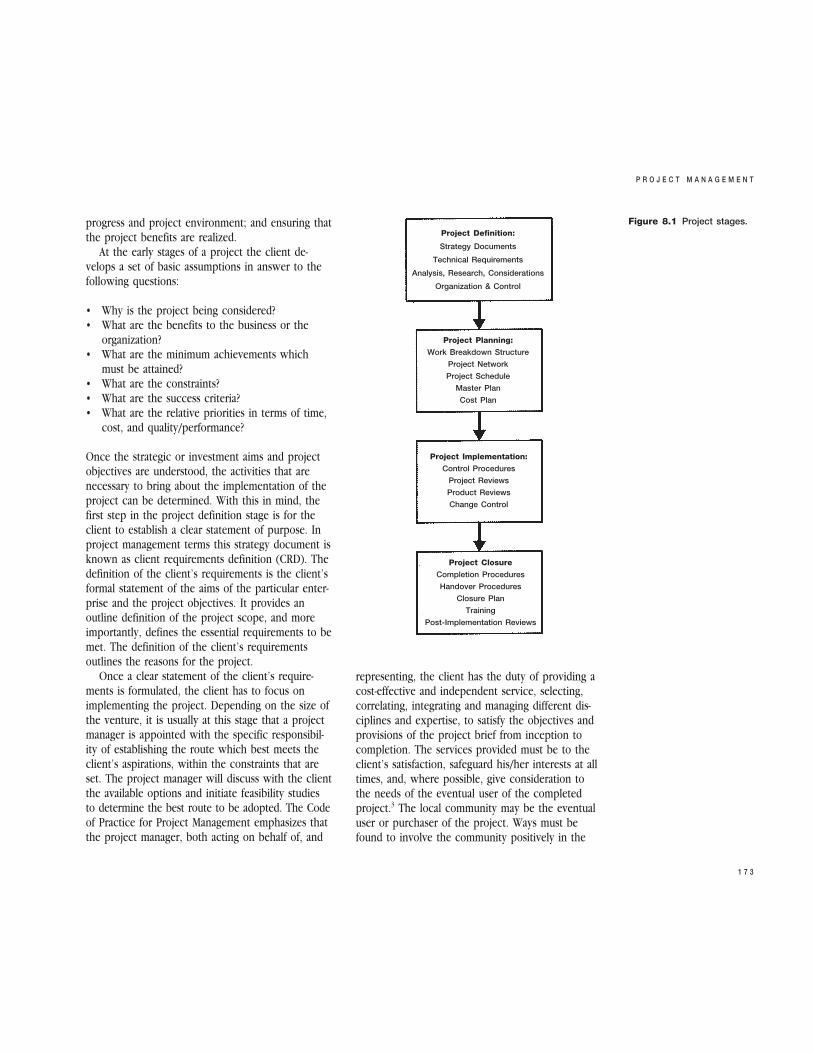
progress and project environment; and ensuring thatthe project benefits are realized.
At the early stages of a project the client de-velops a set of basic assumptions in answer to thefollowing questions:
• Why is the project being considered?• What are the benefits to the business or the
organization?• What are the minimum achievements which
must be attained?• What are the constraints?• What are the success criteria?• What are the relative priorities in terms of time,
cost, and quality/performance?
Once the strategic or investment aims and projectobjectives are understood, the activities that arenecessary to bring about the implementation of theproject can be determined. With this in mind, thefirst step in the project definition stage is for theclient to establish a clear statement of purpose. Inproject management terms this strategy document isknown as client requirements definition (CRD). Thedefinition of the client’s requirements is the client’sformal statement of the aims of the particular enter-prise and the project objectives. It provides anoutline definition of the project scope, and moreimportantly, defines the essential requirements to bemet. The definition of the client’s requirementsoutlines the reasons for the project.
Once a clear statement of the client’s require-ments is formulated, the client has to focus onimplementing the project. Depending on the size ofthe venture, it is usually at this stage that a projectmanager is appointed with the specific responsibil-ity of establishing the route which best meets theclient’s aspirations, within the constraints that areset. The project manager will discuss with the clientthe available options and initiate feasibility studiesto determine the best route to be adopted. The Codeof Practice for Project Management emphasizes thatthe project manager, both acting on behalf of, and
representing, the client has the duty of providing acost-effective and independent service, selecting,correlating, integrating and managing different dis-ciplines and expertise, to satisfy the objectives andprovisions of the project brief from inception tocompletion. The services provided must be to theclient’s satisfaction, safeguard his/her interests at alltimes, and, where possible, give consideration tothe needs of the eventual user of the completedproject.3 The local community may be the eventualuser or purchaser of the project. Ways must befound to involve the community positively in the
P R O J E C T M A N A G E M E N T
1 7 3
Figure 8.1 Project stages.
Project Definition:
Strategy Documents
Technical Requirements
Analysis, Research, Considerations
Organization & Control
Project Planning:
Work Breakdown Structure
Project Network
Project Schedule
Master Plan
Cost Plan
Project Closure
Completion Procedures
Handover Procedures
Closure Plan
Training
Post-Implementation Reviews
Project Implementation:
Control Procedures
Project Reviews
Product Reviews
Change Control
development of a project, particularly if they arelikely to be the users. This issue was discussed inearlier chapters.
In the field of urban design the project managermay, of course, be the person leading the designwork, although much will depend on the nature ofthe project or the client’s available expertise andinterests. The project manager, who may be
educated in any of a number of disciplines, has thecontinuous duty of exercising control over projecttime, cost and performance. To achieve suchcontrol it is important to produce a project brief,referred to in project management terms as theProject Requirements Definition (PRD) document.
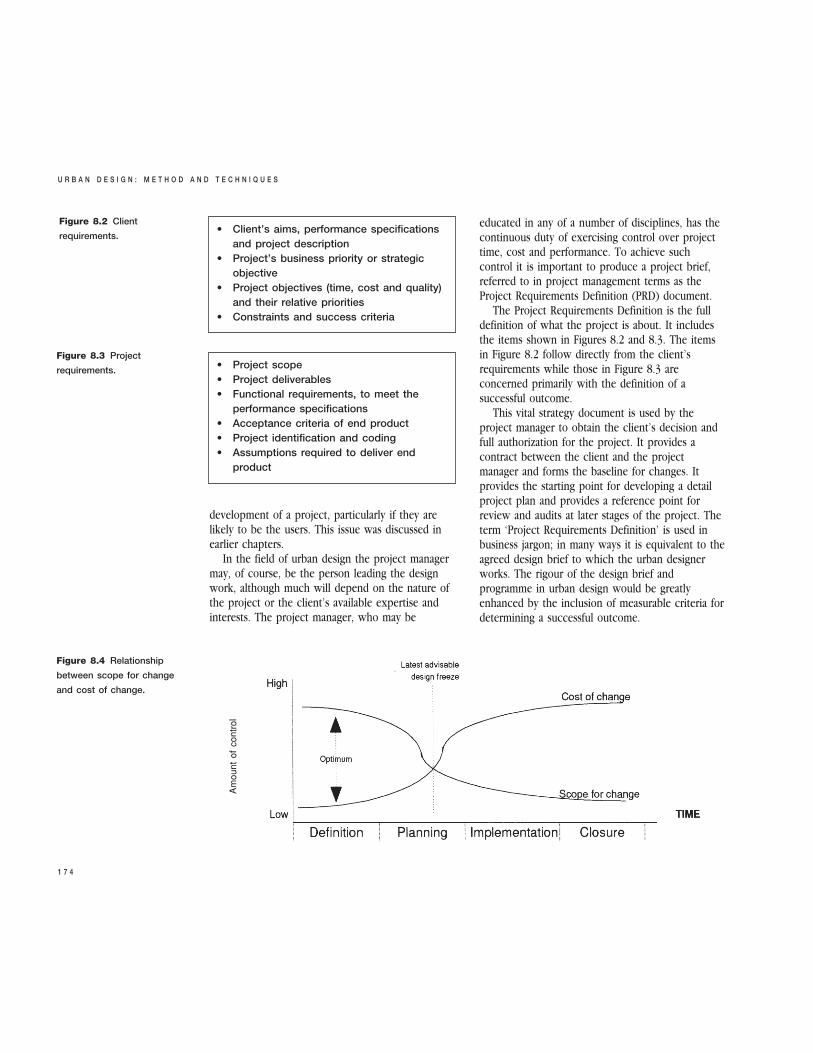
The Project Requirements Definition is the fulldefinition of what the project is about. It includesthe items shown in Figures 8.2 and 8.3. The itemsin Figure 8.2 follow directly from the client’srequirements while those in Figure 8.3 areconcerned primarily with the definition of asuccessful outcome.
This vital strategy document is used by theproject manager to obtain the client’s decision andfull authorization for the project. It provides acontract between the client and the projectmanager and forms the baseline for changes. Itprovides the starting point for developing a detailproject plan and provides a reference point forreview and audits at later stages of the project. Theterm ‘Project Requirements Definition’ is used inbusiness jargon; in many ways it is equivalent to theagreed design brief to which the urban designerworks. The rigour of the design brief andprogramme in urban design would be greatlyenhanced by the inclusion of measurable criteria fordetermining a successful outcome.
U R B A N D E S I G N : M E T H O D A N D T E C H N I Q U E S
1 7 4
Figure 8.2 Client
requirements.• Client’s aims, performance specifications
and project description
• Project’s business priority or strategic
objective
• Project objectives (time, cost and quality)
and their relative priorities
• Constraints and success criteria
• Project scope
• Project deliverables
• Functional requirements, to meet the
performance specifications
• Acceptance criteria of end product
• Project identification and coding
• Assumptions required to deliver end
product
Figure 8.3 Project
requirements.
Figure 8.4 Relationship
between scope for change
and cost of change.
Amount of control
As project development progresses, the controlover project outcome decreases and the cost ofsaving time, or removing errors, increases. Thevalue of early definition and the relationshipbetween scope for change and the cost of change,set against the timescale of a project, is describedgraphically in Figure 8.4.
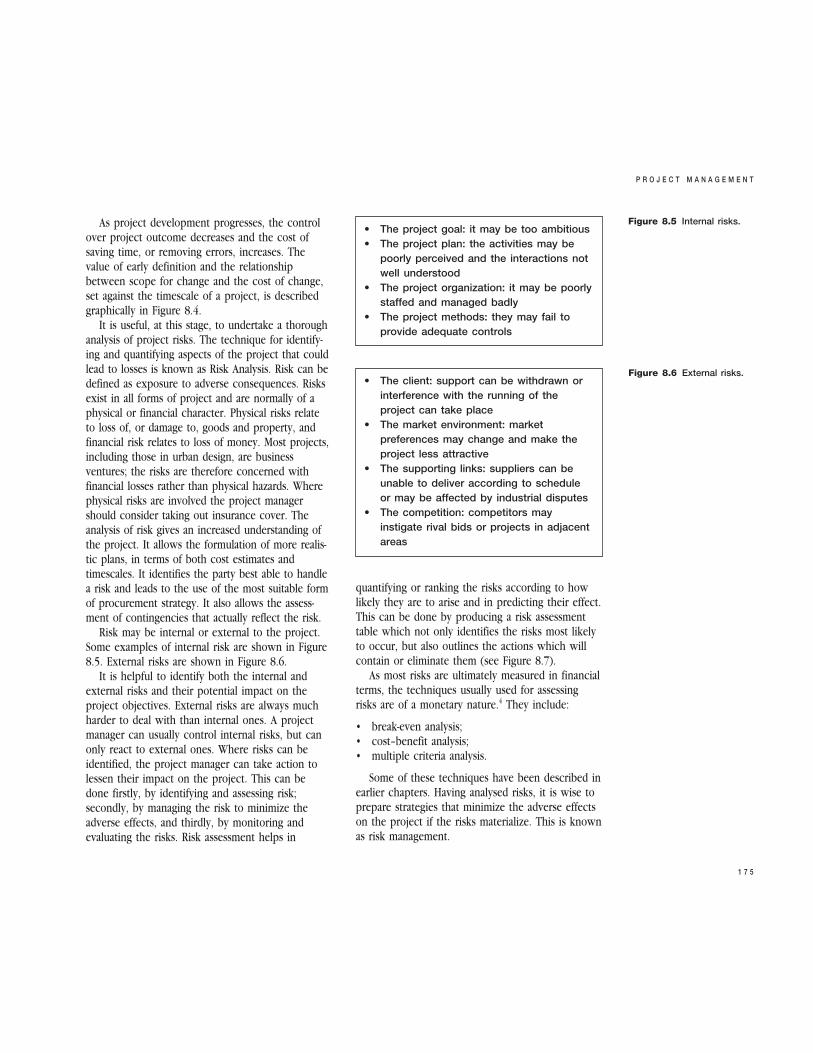
It is useful, at this stage, to undertake a thoroughanalysis of project risks. The technique for identify-ing and quantifying aspects of the project that couldlead to losses is known as Risk Analysis. Risk can bedefined as exposure to adverse consequences. Risksexist in all forms of project and are normally of aphysical or financial character. Physical risks relateto loss of, or damage to, goods and property, andfinancial risk relates to loss of money. Most projects,including those in urban design, are businessventures; the risks are therefore concerned withfinancial losses rather than physical hazards. Wherephysical risks are involved the project managershould consider taking out insurance cover. Theanalysis of risk gives an increased understanding ofthe project. It allows the formulation of more realis-tic plans, in terms of both cost estimates andtimescales. It identifies the party best able to handlea risk and leads to the use of the most suitable formof procurement strategy. It also allows the assess-ment of contingencies that actually reflect the risk.
Risk may be internal or external to the project.Some examples of internal risk are shown in Figure8.5. External risks are shown in Figure 8.6.
It is helpful to identify both the internal andexternal risks and their potential impact on theproject objectives. External risks are always muchharder to deal with than internal ones. A projectmanager can usually control internal risks, but canonly react to external ones. Where risks can beidentified, the project manager can take action tolessen their impact on the project. This can bedone firstly, by identifying and assessing risk;secondly, by managing the risk to minimize theadverse effects, and thirdly, by monitoring andevaluating the risks. Risk assessment helps in
quantifying or ranking the risks according to howlikely they are to arise and in predicting their effect.This can be done by producing a risk assessmenttable which not only identifies the risks most likelyto occur, but also outlines the actions which willcontain or eliminate them (see Figure 8.7).
As most risks are ultimately measured in financialterms, the techniques usually used for assessingrisks are of a monetary nature.4 They include:
• break-even analysis;• cost–benefit analysis;• multiple criteria analysis.
Some of these techniques have been described inearlier chapters. Having analysed risks, it is wise toprepare strategies that minimize the adverse effectson the project if the risks materialize. This is knownas risk management.
P R O J E C T M A N A G E M E N T
1 7 5
Figure 8.5 Internal risks.
Figure 8.6 External risks.
• The project goal: it may be too ambitious
• The project plan: the activities may be
poorly perceived and the interactions not
well understood
• The project organization: it may be poorly
staffed and managed badly
• The project methods: they may fail to
provide adequate controls
• The client: support can be withdrawn or
interference with the running of the
project can take place
• The market environment: market
preferences may change and make the
project less attractive
• The supporting links: suppliers can be
unable to deliver according to schedule
or may be affected by industrial disputes
• The competition: competitors may
instigate rival bids or projects in adjacent
areas
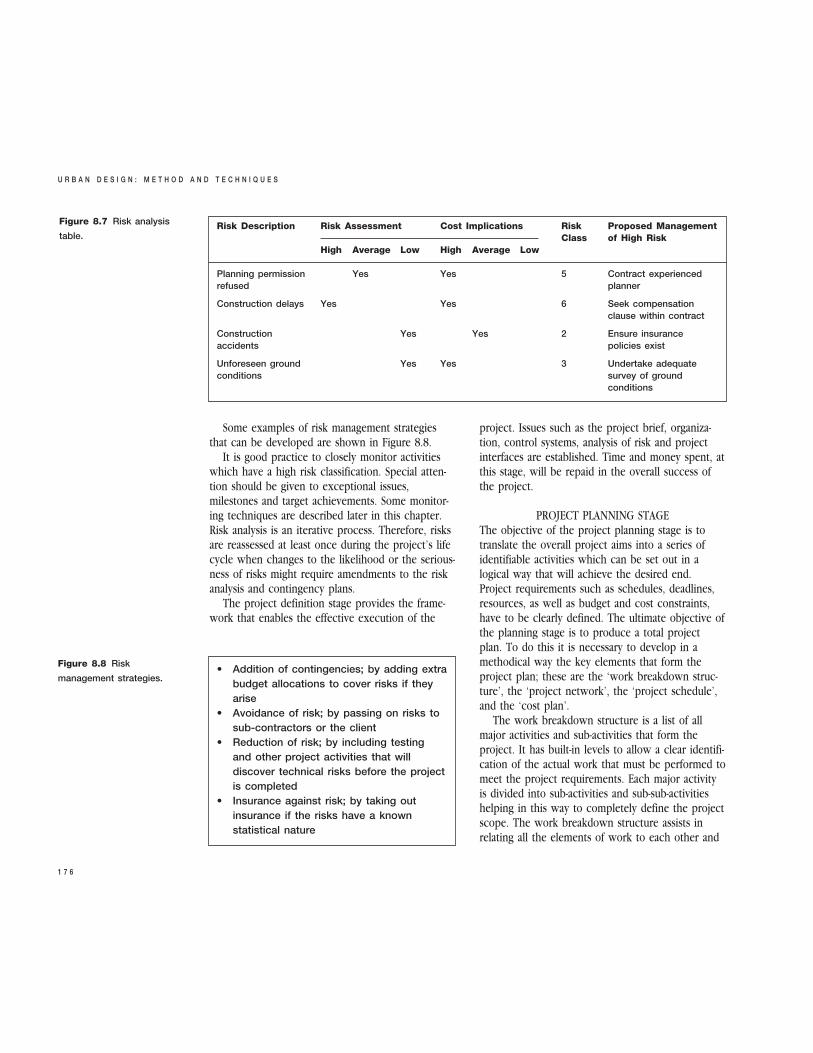
Some examples of risk management strategiesthat can be developed are shown in Figure 8.8.
It is good practice to closely monitor activitieswhich have a high risk classification. Special atten-tion should be given to exceptional issues,milestones and target achievements. Some monitor-ing techniques are described later in this chapter.Risk analysis is an iterative process. Therefore, risksare reassessed at least once during the project’s lifecycle when changes to the likelihood or the serious-ness of risks might require amendments to the riskanalysis and contingency plans.
The project definition stage provides the frame-work that enables the effective execution of the
project. Issues such as the project brief, organiza-tion, control systems, analysis of risk and projectinterfaces are established. Time and money spent, atthis stage, will be repaid in the overall success ofthe project.
PROJECT PLANNING STAGEThe objective of the project planning stage is totranslate the overall project aims into a series ofidentifiable activities which can be set out in alogical way that will achieve the desired end.Project requirements such as schedules, deadlines,resources, as well as budget and cost constraints,have to be clearly defined. The ultimate objective ofthe planning stage is to produce a total projectplan. To do this it is necessary to develop in amethodical way the key elements that form theproject plan; these are the ‘work breakdown struc-ture’, the ‘project network’, the ‘project schedule’,and the ‘cost plan’.
The work breakdown structure is a list of allmajor activities and sub-activities that form theproject. It has built-in levels to allow a clear identifi-cation of the actual work that must be performed tomeet the project requirements. Each major activityis divided into sub-activities and sub-sub-activitieshelping in this way to completely define the projectscope. The work breakdown structure assists inrelating all the elements of work to each other and
U R B A N D E S I G N : M E T H O D A N D T E C H N I Q U E S
1 7 6
Figure 8.7 Risk analysis
table.
Figure 8.8 Risk
management strategies.• Addition of contingencies; by adding extra
budget allocations to cover risks if they
arise
• Avoidance of risk; by passing on risks to
sub-contractors or the client
• Reduction of risk; by including testing
and other project activities that will
discover technical risks before the project
is completed
• Insurance against risk; by taking out
insurance if the risks have a known
statistical nature
Risk Description Risk Assessment Cost Implications Risk Proposed Management
Class of High Risk
High Average Low High Average Low
Planning permission Yes Yes 5 Contract experienced
refused planner
Construction delays Yes Yes 6 Seek compensation
clause within contract
Construction Yes Yes 2 Ensure insurance
accidents policies exist
Unforeseen ground Yes Yes 3 Undertake adequate
conditions survey of ground
conditions
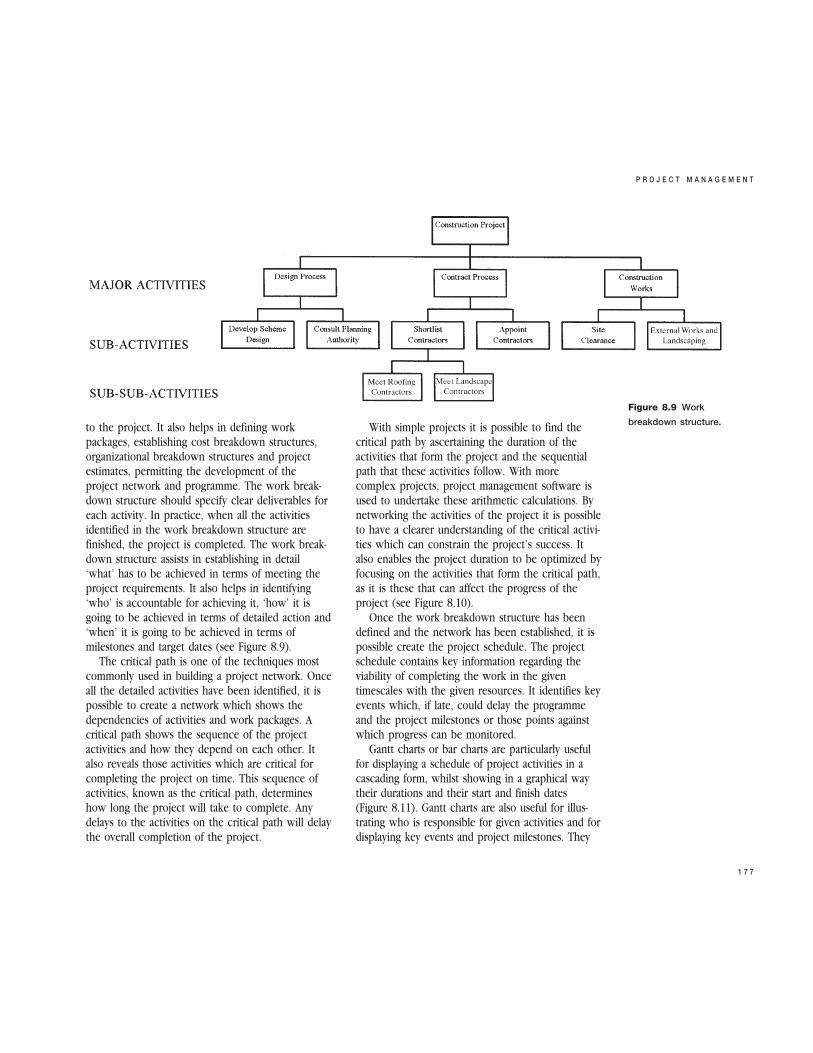
to the project. It also helps in defining workpackages, establishing cost breakdown structures,organizational breakdown structures and projectestimates, permitting the development of theproject network and programme. The work break-down structure should specify clear deliverables foreach activity. In practice, when all the activitiesidentified in the work breakdown structure arefinished, the project is completed. The work break-down structure assists in establishing in detail‘what’ has to be achieved in terms of meeting theproject requirements. It also helps in identifying‘who’ is accountable for achieving it, ‘how’ it isgoing to be achieved in terms of detailed action and‘when’ it is going to be achieved in terms ofmilestones and target dates (see Figure 8.9).
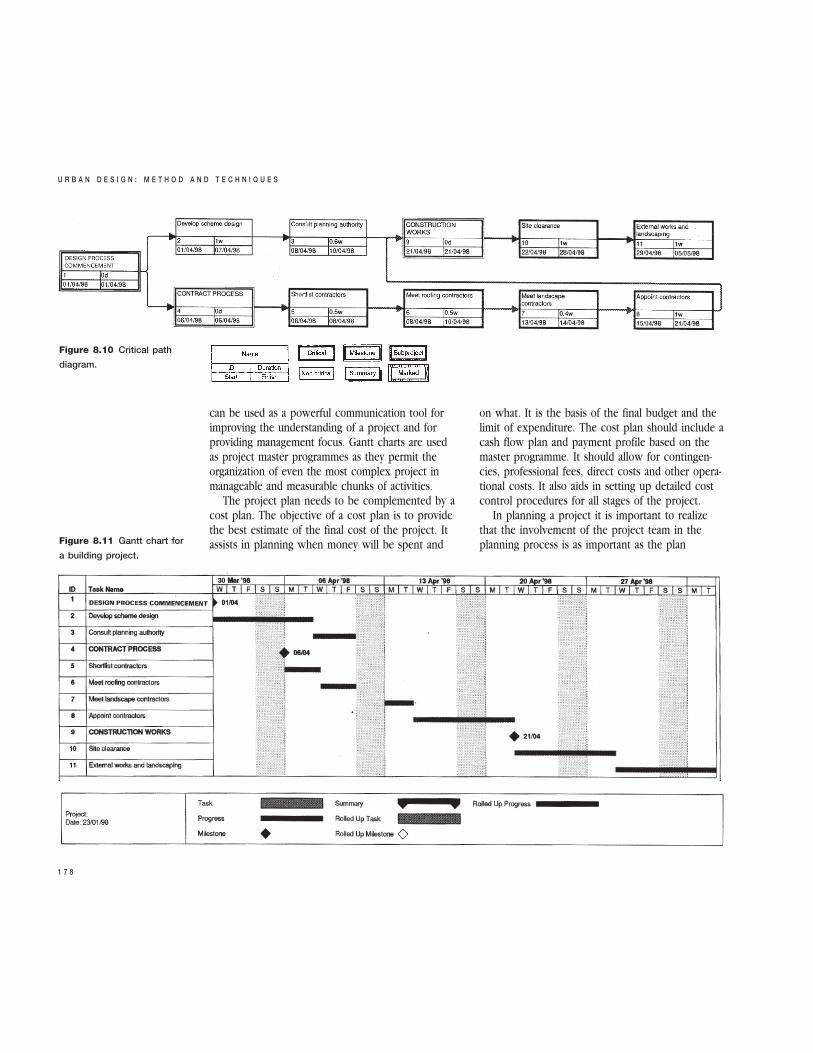
The critical path is one of the techniques mostcommonly used in building a project network. Onceall the detailed activities have been identified, it ispossible to create a network which shows thedependencies of activities and work packages. Acritical path shows the sequence of the projectactivities and how they depend on each other. Italso reveals those activities which are critical forcompleting the project on time. This sequence ofactivities, known as the critical path, determineshow long the project will take to complete. Anydelays to the activities on the critical path will delaythe overall completion of the project.
With simple projects it is possible to find thecritical path by ascertaining the duration of theactivities that form the project and the sequentialpath that these activities follow. With morecomplex projects, project management software isused to undertake these arithmetic calculations. Bynetworking the activities of the project it is possibleto have a clearer understanding of the critical activi-ties which can constrain the project’s success. Italso enables the project duration to be optimized byfocusing on the activities that form the critical path,as it is these that can affect the progress of theproject (see Figure 8.10).
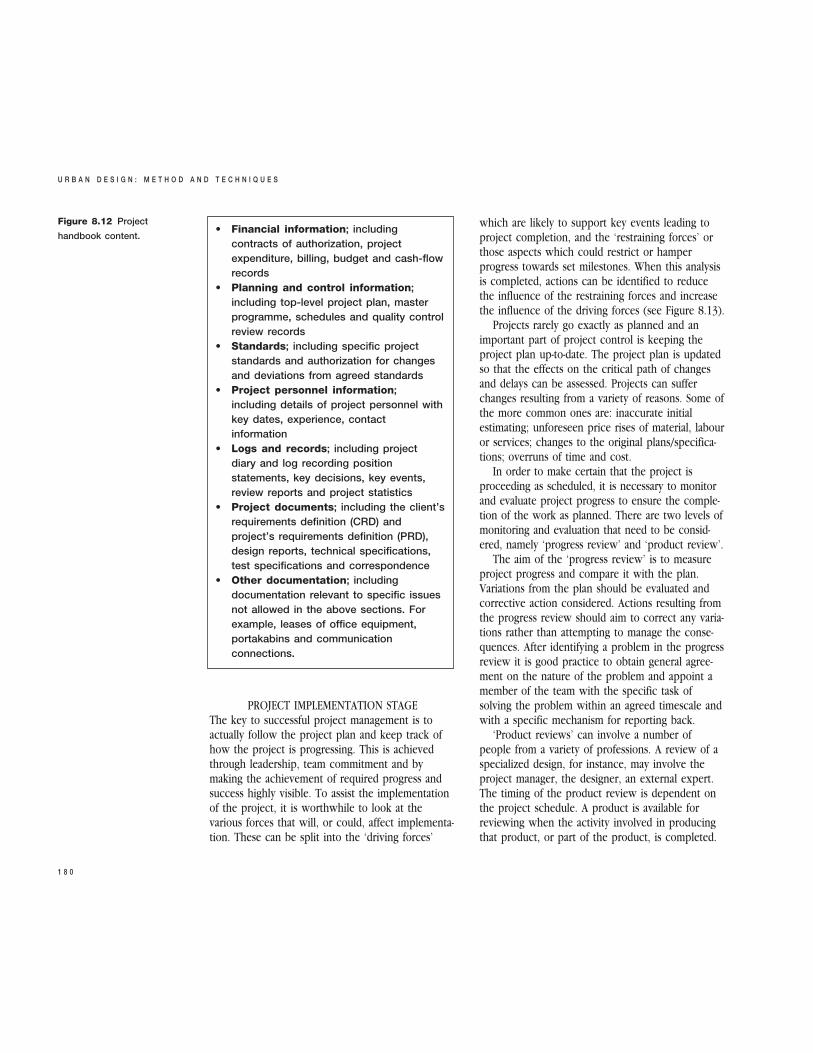
Once the work breakdown structure has beendefined and the network has been established, it ispossible create the project schedule. The projectschedule contains key information regarding theviability of completing the work in the giventimescales with the given resources. It identifies keyevents which, if late, could delay the programmeand the project milestones or those points againstwhich progress can be monitored.
Gantt charts or bar charts are particularly usefulfor displaying a schedule of project activities in acascading form, whilst showing in a graphical waytheir durations and their start and finish dates(Figure 8.11). Gantt charts are also useful for illus-trating who is responsible for given activities and fordisplaying key events and project milestones. They
P R O J E C T M A N A G E M E N T
1 7 7
Figure 8.9 Work
breakdown structure.
can be used as a powerful communication tool forimproving the understanding of a project and forproviding management focus. Gantt charts are usedas project master programmes as they permit theorganization of even the most complex project inmanageable and measurable chunks of activities.
The project plan needs to be complemented by acost plan. The objective of a cost plan is to providethe best estimate of the final cost of the project. Itassists in planning when money will be spent and
on what. It is the basis of the final budget and thelimit of expenditure. The cost plan should include acash flow plan and payment profile based on themaster programme. It should allow for contingen-cies, professional fees, direct costs and other opera-tional costs. It also aids in setting up detailed costcontrol procedures for all stages of the project.
In planning a project it is important to realizethat the involvement of the project team in theplanning process is as important as the plan
U R B A N D E S I G N : M E T H O D A N D T E C H N I Q U E S
1 7 8
Figure 8.10 Critical path
diagram.
Figure 8.11 Gantt chart for
a building project.

produced. John Harvey-Jones, recollecting theexperiences of a UK firm and a Japanese firm eachcharged with the responsibility of constructingchemical facilities for ICI of similar size andcomplexity, recounts that the UK firm’s construc-tion had reached the roof at eaves level before theJapanese team began site construction work. Yet,the Japanese team handed over a fully operationalplant before the UK team finished. While the UKteam was busily building the Japanese were stillplanning. A possible explanation of what washappening can be related to the planning system of‘Ringi’ used by the Japanese.5 In this system, aproposal is passed around the responsible team,each member of the team being free to amend anypart of the proposal. Every time the proposal isamended it is recirculated around the whole team,with each still able to amend in each iteration. Theproposal is not finally adopted until every memberof the team is able to subscribe fully to theproposal. When it is finally adopted, each iscommitted fully to its implementation.
Whatever implementation system is used, it isclear that effective teams lead to successful projects.Although project management is strongly associatedwith control systems, project management is alsoabout integrating a group of people, gaining theircommitment and motivating them towards clearlyestablished goals. The project team, on the otherhand, should be geared towards supporting theproject manager in carrying out his/her responsibili-ties. For a project team to function properly, it isnecessary that the project team concept is conveyedto all concerned. Clearly defined and measurableproject objectives, as well as clearly identified rolesand responsibilities of each team member, providethe formula for a successful team.
Team members are often unaware of how theircontributions affect the project and on manyoccasions team members tend to become defensiveand keep to themselves any problems they mayhave with the project. They then solve their ownproblems in an independent way. This can be
avoided by conveying a common understanding ofthe project and ensuring that the team members areaware of the inter-relationship between all tasks andactivities. The use of the work breakdown structure,the project network and critical path as communica-tions tools can illuminate everyone’s contribution tothe project objectives. It is wise to promoteteamwork by involving the project team in problemsolving and brainstorming, undertaking social activi-ties, encouraging feedback within the team, carryingout regular performance reviews of all teammembers and developing the team through team-building exercises. The promotion of a workingenvironment which encourages an interchange ofideas and shared responsibility will ultimatelybenefit the project.
It is recognized above that setting clear objec-tives is the first step in ensuring that the projectteam operates as an effective and focused unit.Objectives should therefore be realistic, challenging,worthwhile, agreed and written down. The acronymSMART is used to describe an approach to objectivesetting. It is used to ensure that objectives areproperly set. SMART stands for: specific, measur-able, achievable, relevant (to the project objective),and timed (with clear timescales and deadlines). Ahigh level of commitment is best achieved when allmembers of the team are involved in the setting ofclear and measurable objectives.
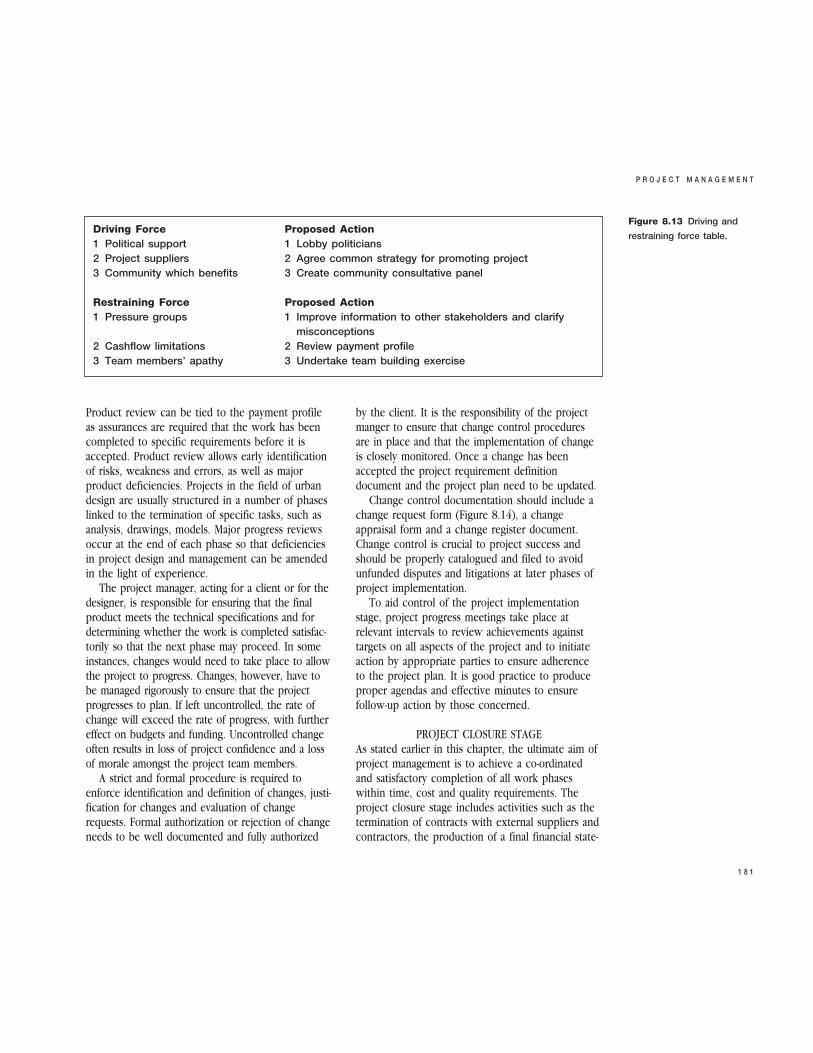
To ensure that all the details concerning theproject and key documentation are kept together itis normal practice to create a project handbook.The project handbook provides a central point ofreference for up-to-date project documentation andshould be accessible to any person authorized bythe project manager. All details concerning theproject should be maintained in the projecthandbook, properly organized into relevant sections.Some of the sections that a project handbookshould include are shown in Figure 8.12. Theproject handbook should be established at thebeginning of every project and should be kept up-to-date throughout a project’s life cycle.6
P R O J E C T M A N A G E M E N T
1 7 9
PROJECT IMPLEMENTATION STAGEThe key to successful project management is toactually follow the project plan and keep track ofhow the project is progressing. This is achievedthrough leadership, team commitment and bymaking the achievement of required progress andsuccess highly visible. To assist the implementationof the project, it is worthwhile to look at thevarious forces that will, or could, affect implementa-tion. These can be split into the ‘driving forces’
which are likely to support key events leading toproject completion, and the ‘restraining forces’ orthose aspects which could restrict or hamperprogress towards set milestones. When this analysisis completed, actions can be identified to reducethe influence of the restraining forces and increasethe influence of the driving forces (see Figure 8.13).
Projects rarely go exactly as planned and animportant part of project control is keeping theproject plan up-to-date. The project plan is updatedso that the effects on the critical path of changesand delays can be assessed. Projects can sufferchanges resulting from a variety of reasons. Some ofthe more common ones are: inaccurate initialestimating; unforeseen price rises of material, labouror services; changes to the original plans/specifica-tions; overruns of time and cost.
In order to make certain that the project isproceeding as scheduled, it is necessary to monitorand evaluate project progress to ensure the comple-tion of the work as planned. There are two levels ofmonitoring and evaluation that need to be consid-ered, namely ‘progress review’ and ‘product review’.
The aim of the ‘progress review’ is to measureproject progress and compare it with the plan.Variations from the plan should be evaluated andcorrective action considered. Actions resulting fromthe progress review should aim to correct any varia-tions rather than attempting to manage the conse-quences. After identifying a problem in the progressreview it is good practice to obtain general agree-ment on the nature of the problem and appoint amember of the team with the specific task ofsolving the problem within an agreed timescale andwith a specific mechanism for reporting back.
‘Product reviews’ can involve a number ofpeople from a variety of professions. A review of aspecialized design, for instance, may involve theproject manager, the designer, an external expert.The timing of the product review is dependent onthe project schedule. A product is available forreviewing when the activity involved in producingthat product, or part of the product, is completed.
U R B A N D E S I G N : M E T H O D A N D T E C H N I Q U E S
1 8 0
Figure 8.12 Project
handbook content.• Financial information; including
contracts of authorization, project
expenditure, billing, budget and cash-flow
records
• Planning and control information;
including top-level project plan, master
programme, schedules and quality control
review records
• Standards; including specific project
standards and authorization for changes
and deviations from agreed standards
• Project personnel information;
including details of project personnel with
key dates, experience, contact
information
• Logs and records; including project
diary and log recording position
statements, key decisions, key events,
review reports and project statistics
• Project documents; including the client’s
requirements definition (CRD) and
project’s requirements definition (PRD),
design reports, technical specifications,
test specifications and correspondence
• Other documentation; including
documentation relevant to specific issues
not allowed in the above sections. For
example, leases of office equipment,
portakabins and communication
connections.
Product review can be tied to the payment profileas assurances are required that the work has beencompleted to specific requirements before it isaccepted. Product review allows early identificationof risks, weakness and errors, as well as majorproduct deficiencies. Projects in the field of urbandesign are usually structured in a number of phaseslinked to the termination of specific tasks, such asanalysis, drawings, models. Major progress reviewsoccur at the end of each phase so that deficienciesin project design and management can be amendedin the light of experience.
The project manager, acting for a client or for thedesigner, is responsible for ensuring that the finalproduct meets the technical specifications and fordetermining whether the work is completed satisfac-torily so that the next phase may proceed. In someinstances, changes would need to take place to allowthe project to progress. Changes, however, have tobe managed rigorously to ensure that the projectprogresses to plan. If left uncontrolled, the rate ofchange will exceed the rate of progress, with furthereffect on budgets and funding. Uncontrolled changeoften results in loss of project confidence and a lossof morale amongst the project team members.
A strict and formal procedure is required toenforce identification and definition of changes, justi-fication for changes and evaluation of changerequests. Formal authorization or rejection of changeneeds to be well documented and fully authorized
by the client. It is the responsibility of the projectmanger to ensure that change control proceduresare in place and that the implementation of changeis closely monitored. Once a change has beenaccepted the project requirement definitiondocument and the project plan need to be updated.
Change control documentation should include achange request form (Figure 8.14), a changeappraisal form and a change register document.Change control is crucial to project success andshould be properly catalogued and filed to avoidunfunded disputes and litigations at later phases ofproject implementation.
To aid control of the project implementationstage, project progress meetings take place atrelevant intervals to review achievements againsttargets on all aspects of the project and to initiateaction by appropriate parties to ensure adherenceto the project plan. It is good practice to produceproper agendas and effective minutes to ensurefollow-up action by those concerned.
PROJECT CLOSURE STAGEAs stated earlier in this chapter, the ultimate aim ofproject management is to achieve a co-ordinatedand satisfactory completion of all work phaseswithin time, cost and quality requirements. Theproject closure stage includes activities such as thetermination of contracts with external suppliers andcontractors, the production of a final financial state-
P R O J E C T M A N A G E M E N T
1 8 1
Figure 8.13 Driving and
restraining force table.Driving Force Proposed Action
1 Political support 1 Lobby politicians
2 Project suppliers 2 Agree common strategy for promoting project
3 Community which benefits 3 Create community consultative panel
Restraining Force Proposed Action
1 Pressure groups 1 Improve information to other stakeholders and clarify
misconceptions
2 Cashflow limitations 2 Review payment profile
3 Team members’ apathy 3 Undertake team building exercise

U R B A N D E S I G N : M E T H O D A N D T E C H N I Q U E S
1 8 2
Figure 8.14 Change order
form.
Change Order Form
Project ID: Date:
Client Authorization: Dated:
Master plan and cost plan amended on:
Change implemented on:
Authority for change: Discretionary/Non-discretionary:
Client ID: Distribution list
Project Name::
Description of change:
“What”:
Requested by:
“Who”:
Cost and time implications:
Change to be paid by:
Recommended action:
Reasons for change:
“Why”:
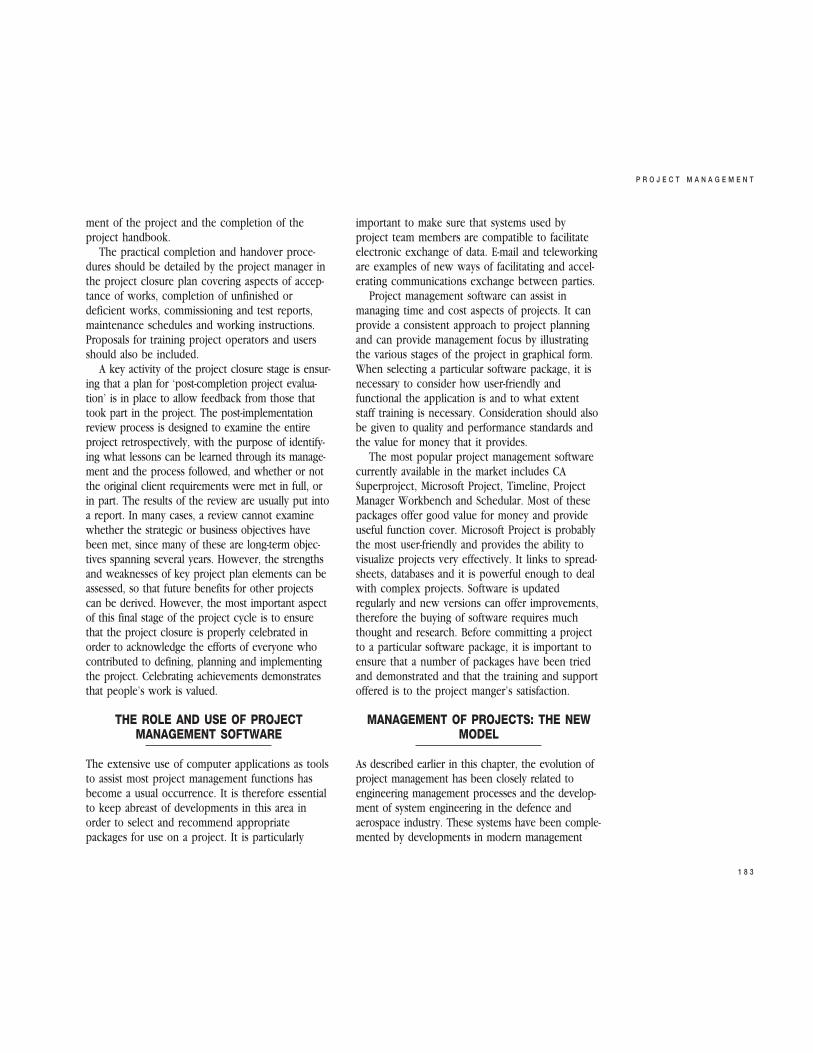
ment of the project and the completion of theproject handbook.
The practical completion and handover proce-dures should be detailed by the project manager inthe project closure plan covering aspects of accep-tance of works, completion of unfinished ordeficient works, commissioning and test reports,maintenance schedules and working instructions.Proposals for training project operators and usersshould also be included.
A key activity of the project closure stage is ensur-ing that a plan for ‘post-completion project evalua-tion’ is in place to allow feedback from those thattook part in the project. The post-implementationreview process is designed to examine the entireproject retrospectively, with the purpose of identify-ing what lessons can be learned through its manage-ment and the process followed, and whether or notthe original client requirements were met in full, orin part. The results of the review are usually put intoa report. In many cases, a review cannot examinewhether the strategic or business objectives havebeen met, since many of these are long-term objec-tives spanning several years. However, the strengthsand weaknesses of key project plan elements can beassessed, so that future benefits for other projectscan be derived. However, the most important aspectof this final stage of the project cycle is to ensurethat the project closure is properly celebrated inorder to acknowledge the efforts of everyone whocontributed to defining, planning and implementingthe project. Celebrating achievements demonstratesthat people’s work is valued.
THE ROLE AND USE OF PROJECTMANAGEMENT SOFTWARE
The extensive use of computer applications as toolsto assist most project management functions hasbecome a usual occurrence. It is therefore essentialto keep abreast of developments in this area inorder to select and recommend appropriatepackages for use on a project. It is particularly
important to make sure that systems used byproject team members are compatible to facilitateelectronic exchange of data. E-mail and teleworkingare examples of new ways of facilitating and accel-erating communications exchange between parties.
Project management software can assist inmanaging time and cost aspects of projects. It canprovide a consistent approach to project planningand can provide management focus by illustratingthe various stages of the project in graphical form.When selecting a particular software package, it isnecessary to consider how user-friendly andfunctional the application is and to what extentstaff training is necessary. Consideration should alsobe given to quality and performance standards andthe value for money that it provides.
The most popular project management softwarecurrently available in the market includes CASuperproject, Microsoft Project, Timeline, ProjectManager Workbench and Schedular. Most of thesepackages offer good value for money and provideuseful function cover. Microsoft Project is probablythe most user-friendly and provides the ability tovisualize projects very effectively. It links to spread-sheets, databases and it is powerful enough to dealwith complex projects. Software is updatedregularly and new versions can offer improvements,therefore the buying of software requires muchthought and research. Before committing a projectto a particular software package, it is important toensure that a number of packages have been triedand demonstrated and that the training and supportoffered is to the project manger’s satisfaction.
MANAGEMENT OF PROJECTS: THE NEWMODEL
As described earlier in this chapter, the evolution ofproject management has been closely related toengineering management processes and the develop-ment of system engineering in the defence andaerospace industry. These systems have been comple-mented by developments in modern management
P R O J E C T M A N A G E M E N T
1 8 3
theory, particularly in organizational design and teambuilding. Quantum leaps in computer technology andthe simplification of its use for all professions havealso benefited the general running of projects.Notwithstanding these great advances, the conceptsand techniques of project management described inthis chapter are often not sufficient for the overalltask of managing projects successfully. The successfulaccomplishment of projects may well require detailedattention to other factors not addressed by the tradi-tional project management approach.7 The manage-ment of political forces; the timing of decisions,which is something quite different from the theoryand practice of project scheduling; the role of effec-tive negotiation; consultation processes, environmen-tal issues; sustainability strategies are subjectsfrequently ignored by some pragmatic projectmanagement professionals. The new model currentlyemerging for the successful management of projectswhich may be more appropriate for urban design,focuses on broader areas which go beyond the morenarrowly defined areas of ‘project management’. Thechange of emphasis from ‘project management’towards ‘management of projects’ requires thisemergent professional discipline to address not onlythe traditional core project management topics suchas scheduling, cost control, work breakdown struc-tures and team building, but also the new dimensionsof the subject such as strategy, politics, ethics,standards and the environment. Ultimately, these arethe variables which enable a project to happen.
CONCLUSION
This chapter has examined some of the issuesinvolved in the implementation of projects. Projectmanagement methods and techniques can comple-ment the gentler aspects of design method discussedin this book, such as generating ideas, co-operation,participation, environmental protection and conserva-tion in general. Implementation, of its nature, oftenrequires a brusque approach overriding objections
once goals have been agreed. This rather aggressivemanner of working originated from war-time experi-ences. Martial terminology, reflecting a militaryorigin, was transposed into business managementculture which appears as: attacking the problem, thethrust of strategy, marshalling resources, the target,aim and even bullet points. Implementation cannotbe neatly separated from the stages prior to theconstruction gangs entering the site. This chapteraccepts this wider view of implementation and hastherefore examined the subject through the eyes ofthe project manager. The dilemma facing the urbandesigner is how to achieve a productive marriagebetween the creative nature of the design processand the harsher realities of making a project happenwithin the constraints of market value, profit marginand value for money. Aiming at the right target,which in this book is defined as sustainable develop-ment, is more sensible than pursuing a misguidedobjective, however effective the strategy.Nevertheless, the hard-headed techniques of theproject manager are needed to ensure delivery of thecommunity’s environmental objectives.
REFERENCES
1 Urwick, L. and Brech, E. (1970) The Making of Scientific
Management, New York: Pitman.
2 Chartered Institute of Building (1996) The Code of Practice
for Project Management, London: CIOB and AW Longman Ltd.
3 Ibid.
4 Brigadier, G. and Winpenny, J. (1987) Planning
Development Projects, London: HMSO.
5 Bevan, O. (1991) Marketing and Property People, London:
Macmillan.
6 Morris, P. (1994) The Management of Projects, London:
Thomas Telford.
7 Nottinghamshire County Council (1993) Project
Management Framework Document, Nottingham:
Nottinghamshire County Council.
U R B A N D E S I G N : M E T H O D A N D T E C H N I Q U E S
1 8 4