preliminary 2008 second quarter results - iis windows...
TRANSCRIPT

Preliminary 2008 Second Quarter Results

Forward Looking Statements
1
In this presentation and in related comments by our management, our use of the words “expect,” “anticipate,” “estimate,” “goal,” “target,” “believe,” “improve,”“intend,” “potential,” “continue,” “designed,” “opportunity,” “risk,” “may,” “would,”“could,” “should,” “project,” “projected,” “positioned” or similar expressions is intended to identify forward-looking statements that represent our current judgment about possible future events. We believe these judgments are reasonable, but these statements are not guarantees of any events or financial results, and our actual results may differ materially due to a variety of important factors. The most recent reports on SEC Forms 10-K, 10-Q and 8-K filed by us or GMAC provide information about these and other factors, which may be revised or supplemented in future reports to the SEC on those forms.
Unless specifically required by law, we assume no obligation to update or revise these forward-looking statements to reflect new events or circumstances.

Second Quarter Operational Highlights
2
• Global market share of 12.3%, down 0.9 p.p. vs. Q2 2007 due to weak North American industry and weaker share
– Share up 0.3 p.p. outside GMNA on gains in every region
• Global automotive revenue down sharply, more than explained by GMNA decline due to industry volume/mix
• GMNA continues to demonstrate strong cost performance driven by improvements in manufacturing productivity
• Special attrition program executed in the U.S., positioning GMNA for continued manufacturing cost performance
• Labor agreement negotiated with the CAW and work stoppages related to American Axle and local agreement negotiations resolved

Liquidity Planning Assumptions
3
• As announced July 15, for liquidity planning purposes GM has developed actions based on conservative U.S. industry assumptions:
• Plan designed to emphasize aggressive operating actions that can be implemented quickly without reliance on capital markets
– Asset sales and debt financing elements also incorporated to balance plan
• Actions projected to improve liquidity thru 2009 by ~$15B vs. prior plan
Key GMNA Liquidity Planning Assumptions 2007 2008E 2009E
U.S. Light Industry* (Millions Units) 16.2 14.0 14.0
GM U.S. Share (% of Total Industry) 23.5% ~21% ~21%
Average Oil Price ($/Bbl) $72 $120-140 $130-150
Industry Large PU/Utility Mix 17.2% 12.7% 12.3%
* Note: U.S. Light Industry excludes ~300K units per year of medium- and heavy-duty trucks

Liquidity Plan Improvements
4
Cumulative Cash Impact Through YE 2009
GMNA Structural Cost ~$2.5B
Salaried Employment & OPEB Savings ~$1.5B
Capital Expenditure Reductions ~$1.5B
Working Capital Improvements ~$2.0B
UAW VEBA Payment Deferrals ~$1.7B
Dividend Suspension ~$0.8B
Total Operating/Other Actions ~$10B
Asset Sales ~$2-4B
Capital Markets Activities ~$2-3B
Total Asset/Financing Actions ~$5B
Total Liquidity Plan Actions ~$15B

Balanced Set of Operational Actions
5
• Steady cadence of aggressive operating, product and liquidity actions announced over last 60 days in response to weakening U.S. industry conditions
Capacity/Structural Cost
– Production cessation at four truck plants
– Shift reductions at two additional truck plants
– Salaried headcount reductions and compensation actions
– Elimination of post-65 salaried retiree healthcare
– Reduction in sales, marketing and overhead expenses
Cash Flow/Liquidity
– Reduced or retimed capex spending
– Aggressive inventory reduction initiatives
– Deferral of certain UAW VEBA contributions
– Suspension of dividend
Product/Powertrains
– Shifts added at two key car plants
– New global Chevrolet small car announced
– Next generation Aveo announced
– New high-efficiency 4-cylinder for U.S.
– Production funding for Chevrolet Volt
– Strategic review of Hummer brand
Second Quarter Financial Highlights
6
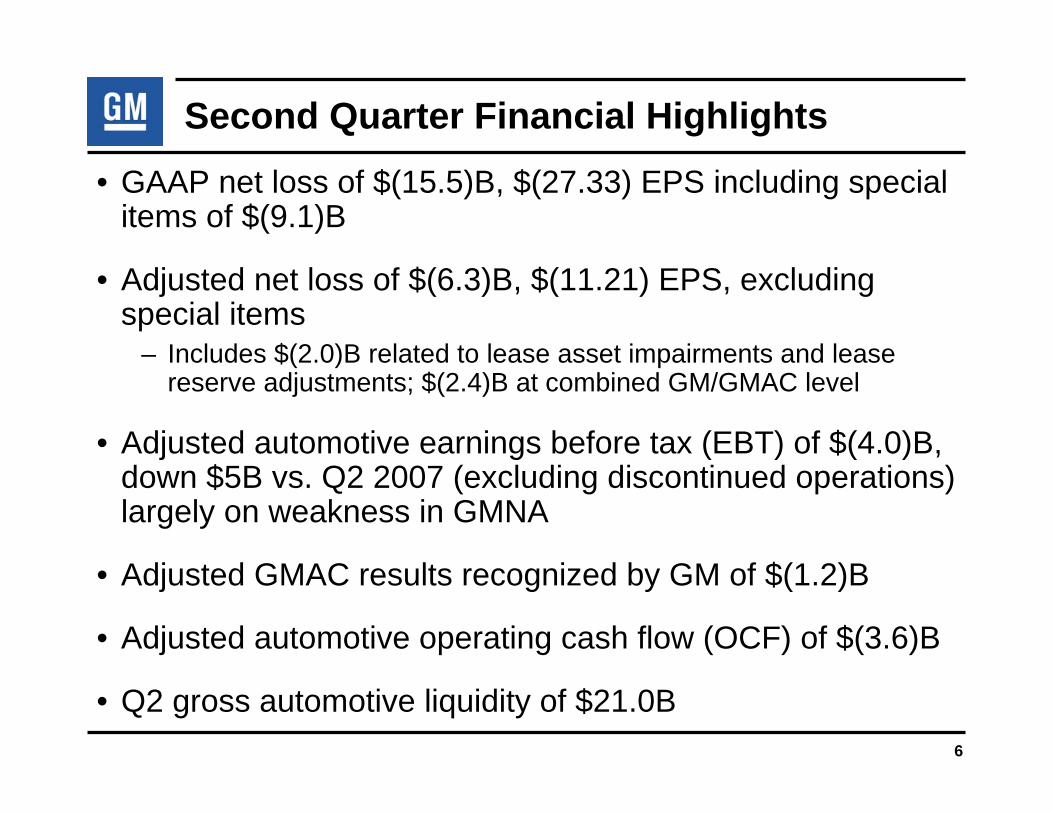
• GAAP net loss of $(15.5)B, $(27.33) EPS including special items of $(9.1)B
• Adjusted net loss of $(6.3)B, $(11.21) EPS, excluding special items
– Includes $(2.0)B related to lease asset impairments and lease reserve adjustments; $(2.4)B at combined GM/GMAC level
• Adjusted automotive earnings before tax (EBT) of $(4.0)B, down $5B vs. Q2 2007 (excluding discontinued operations) largely on weakness in GMNA
• Adjusted GMAC results recognized by GM of $(1.2)B
• Adjusted automotive operating cash flow (OCF) of $(3.6)B
• Q2 gross automotive liquidity of $21.0B

Second Quarter Adjusted Results
7Refer to Supplemental Charts for reconciliation to GAAP figures
($ Millions) 2007 20082008 F/(U)
2007
GMNA 92$ (4,435)$ (4,527)$ GME 345 99 (246)GMLAAM 296 445 149GMAP 294 (65) (359)Auto Eliminations - (14) (14) Total Auto Earnings Before Tax 1,027 (3,970) (4,997)
GMAC Earnings 154 (1,217) (1,371)Corp. Other Earnings Before tax 82 (851) (933) Total Earnings Before Tax/(Loss) 1,263 (6,038) (7,301)
Taxes 41 (308) (349) Total Net Income/(Loss) from Cont. Ops. 1,304 (6,346) (7,650)
Discontinued Ops. - Allison Transmission 107 - (107) Total GM Net Income/(Loss) 1,411 (6,346) (7,757)
EPS from Cont. Ops 2.30$ (11.21)$ (13.51)$ EPS from Disc. Ops 0.19 - (0.19)$ Total EPS (Basic) 2.49$ (11.21)$ (13.70)$ Total EPS (Diluted) 2.48$ (11.21)$ (13.69)$
Worldwide Production (000) 2,410 2,224 (186)Global Market Share 13.2% 12.3% (0.9) p.p.

$ Millions EPS
Adjusted Net Income / (Loss) (6,346) (11.21)$ Pre-Tax AdjustmentsGMNA Special Attrition Program (3,277) GMNA restructuring related (1,097) CAW contract related (340) American Axle related (197) GMAC investment impairment (1,334) Delphi (2,753) All Other (127)
Total Adjustments (9,125)
GAAP Net Income / (Loss) (15,471) (27.33)$
Second Quarter Adjustments to Income
8
Exclusion of special items useful for:• Management to measure operations• Comparisons between reporting periods• Investors to measure and assess company’s core performance
GMNA Special Attrition Program
9
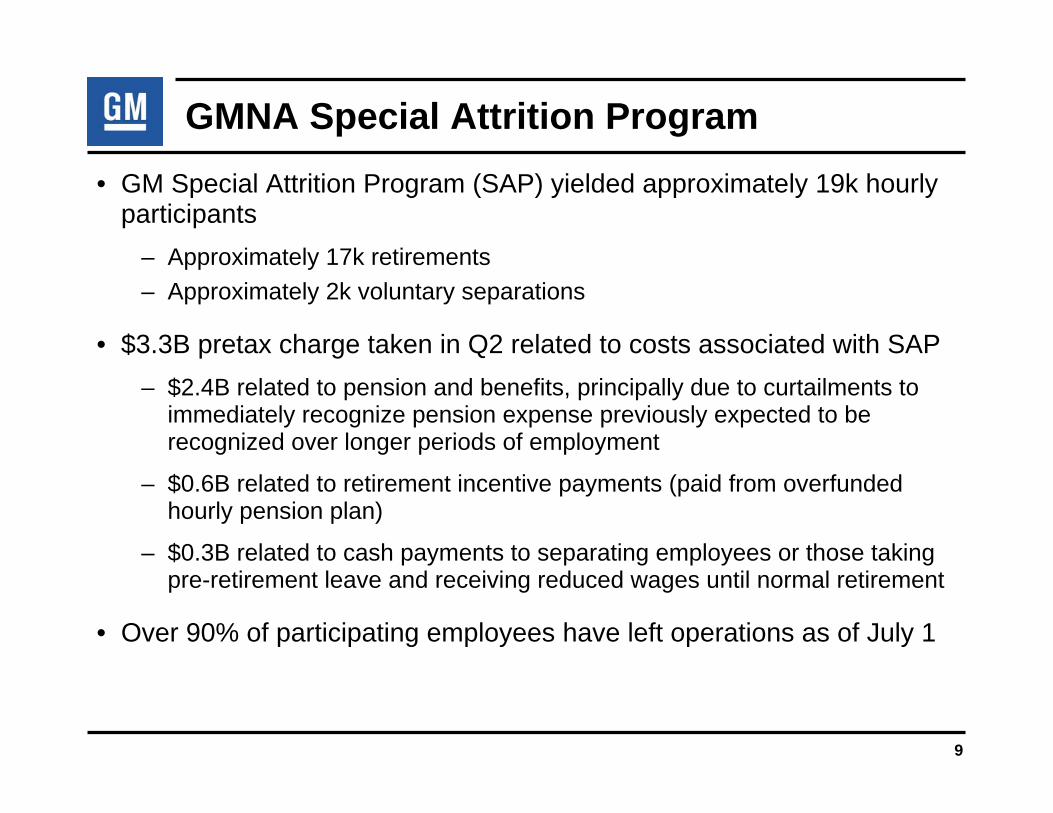
• GM Special Attrition Program (SAP) yielded approximately 19k hourly participants
– Approximately 17k retirements– Approximately 2k voluntary separations
• $3.3B pretax charge taken in Q2 related to costs associated with SAP– $2.4B related to pension and benefits, principally due to curtailments to
immediately recognize pension expense previously expected to be recognized over longer periods of employment
– $0.6B related to retirement incentive payments (paid from overfunded hourly pension plan)
– $0.3B related to cash payments to separating employees or those taking pre-retirement leave and receiving reduced wages until normal retirement
• Over 90% of participating employees have left operations as of July 1

GMNA Restructuring Related
10
• Significant GMNA capacity actions announced in Q2 to better align manufacturing footprint with rapidly evolving U.S. industry conditions
– April: Announced shift reductions at four fullsize truck plants in the U.S. and Canada
– May: Announced production cessation at Windsor Transmission plant
– June: Announced production cessation at four fullsize truck plants, including two previously planned for shift reductions only
• $1.1B pretax charge taken in Q2 to reflect estimated wage and benefit costs associated with employees impacted by these capacity actions
– Includes curtailments of related Canadian pension plans
– Reflects estimated adjustments for employees participating in SAP and thus comprehended in charges taken for that program

CAW Contract Related
11
• 2008 Canadian Auto Workers labor agreement ratified in May
• Associated pretax charge of $340 million taken in Q2 principally due to immediate recognition of unamortized prior service cost related to pension benefit increases from prior contracts
• Consistent with 2007 UAW Labor Agreement, determined that life of contract a preferable period of economic benefit for amortizing pension benefit increases, versus average remaining service life
– As a result, majority of remaining unamortized prior service cost from prior contract expensed in Q2

GMAC Impairment
12
• U.S. GAAP states that a loss in value of an investment that is other than temporary should be recognized
• In Q1, GM recorded impairments against its GMAC investment basedon market conditions and pricing prevailing at that time
– Common and preferred interests impaired by $1.3B and $0.1B, respectively
• GM conducted further analysis in Q2 to determine if further impairments required based on current fair value estimates
– Factors considered includes continued deterioration in mortgage and consumer credit markets and a more challenging North American automotive financing environment
• As a result, GM recorded Q2 impairment charges totaling $1.3B against common and preferred equity interests in GMAC
– Common equity impaired $0.7B; carrying value reduced to $3.5B– Preferred equity impaired $0.6B; carrying value reduced to $0.3B

Delphi Related Items
13
• GM recorded Q2 adjustment of $2.8B to Delphi reserve, primarily due to updated estimates related to Delphi’s ongoing reorganization
– Reflects higher expected obligations (e.g. net pension liabilities) and additional uncertainty around nature, value, and timing of GM recoveries
– Total of $11B in net Delphi-related charges taken to date
• Factors resulting in this incremental charge were fully comprehended in liquidity plan announced on July 15

Cash Impact of Special Items
14
Cash Impact$ Billions Non-Cash 2008/09 Post 2009
GMNA SAP 3.0 0.3 --
GMNA Restructuring 0.2 0.3 0.6
CAW Contract Related 0.3 -- --
American Axle Related -- 0.2 --
GMAC Impairment 1.3 -- --
Delphi Related 1.6 0.1 1.1
All Other 0.0 0.1 --
Total Special Items $6.4 $1.0 $1.7
Cash Impacts Reflected in July 15 Liquidity Plan

Lease Residual Impacts
15
• Deteriorating U.S. industry conditions, particularly vehicle mix, driving overall decline in used / off-lease vehicle residuals
• Deteriorating residuals can directly impact GM in three ways– Residual Support / Risk Sharing: Affects incentive accruals, adjusted
each quarter for changes from estimates recorded at vehicle sale to dealer for anticipated future changes in incentive payments, including amounts associated with retail leases
– Lease Asset Carve-out Portfolio: Lease assets retained as part of GMAC sale subject to residual impairment
– GMAC Ownership: 49% of any impairment GMAC takes against its lease assets recognized by GM in equity income/loss
• GM has taken active steps to reduce future exposure by reducing overall lease penetration and use of short-term contracts
– Leases overall currently ~10% of retail sales, with 2-year contracts reduced to only 10% of lease portfolio

Lease Impairments / Reserve Adjustments
16
GMNA (reserve adjustments) $(1.6)B
GM FIO (lease asset impairments) $(0.1)B
GMAC (lease asset impairment) $(0.3)B
Total GM Impact (EBT) $(2.0)B
Memo: GM/GMAC group impact (EBT) $(2.4)BGM/GMAC group impairments only $(0.8)B
Note: All impacts are included in Q2 adjusted earnings

GMNA Second Quarter Adjusted Results
17
($ Millions) 2007 20082008 F/(U)
2007
Revenue $29,663 $19,820 ($9,843)Earnings Before Tax/(Loss) 92 (4,435) (4,527)Earnings Before Tax Margin 0.3% (22.4)% (22.7) p.p.
North America:- Production Volume (000) 1,142 834 (308)- GM Total Deliveries (000) 1,200 964 (236)- Market Share 22.7% 20.2% (2.5) p.p.
United States: - Industry SAAR (Mil.) 16.4 14.5 (1.9)- Market Share 22.8% 20.4% (2.4) p.p.- Retail/Fleet Mix - % Fleet 26.7% 23.4% 3.3 p.p.- Dealer Inventory (000) 1,055 788 267
2007 excludes results from Allison Transmission, recorded as Discontinued Operations

19,138 19,83519,417
19,425
20,189
21,48721,375
17,940
19,34819,160
$16,000
$17,000
$18,000
$19,000
$20,000
$21,000
$22,000
$23,000
CY '03 CY '04 CY '05 CY '06 CY '07 Q2 '04 Q2 '05 Q2 '06 Q2 '07 Q2 '08
GMNA Vehicle Revenue Per Unit
Calendar Year Second Quarter
Net RevenueGross Revenue lessSales Incentives
Vehicle revenue per unit excludes items such as daily rental accounting impact, Service Parts, OnStar, other outside sales
18Adjusted to remove Allison. Refer to Supplemental Charts for reconciliation to GAAP figures
MemoQ1 ’08 $21,575Q4 ’07 $21,915
Excluding lease related
reserve adjustments:
$19,700
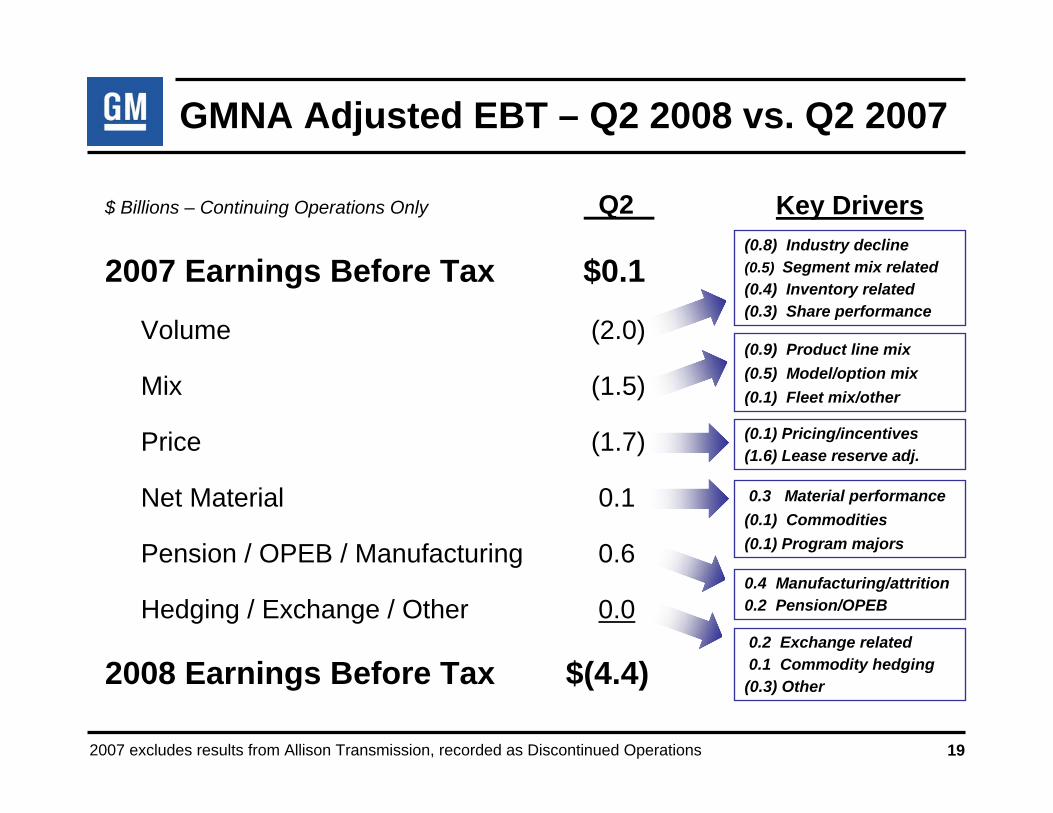
GMNA Adjusted EBT – Q2 2008 vs. Q2 2007
$ Billions – Continuing Operations Only Q2
2007 Earnings Before Tax $0.1
Volume (2.0)
Mix (1.5)
Price (1.7)
Net Material 0.1
Pension / OPEB / Manufacturing 0.6
Hedging / Exchange / Other 0.0
2008 Earnings Before Tax $(4.4)
192007 excludes results from Allison Transmission, recorded as Discontinued Operations
(0.8) Industry decline(0.5) Segment mix related(0.4) Inventory related (0.3) Share performance
0.2 Exchange related0.1 Commodity hedging
(0.3) Other
0.4 Manufacturing/attrition0.2 Pension/OPEB
(0.9) Product line mix(0.5) Model/option mix(0.1) Fleet mix/other
0.3 Material performance(0.1) Commodities(0.1) Program majors
Key Drivers
(0.1) Pricing/incentives(1.6) Lease reserve adj.

GMNA Adjusted EBT – YTD 2008 vs. YTD 2007
$ Billions – Continuing Operations Only YTD
2007 Earnings Before Tax $(0.2)
Volume (3.1)
Mix (1.6)
Price (2.2)
Net Material 0.3
Pension / OPEB / Manufacturing 1.1
Hedging / Exchange / Other 0.7
2008 Earnings Before Tax $(5.0)
202007 excludes results from Allison Transmission, recorded as Discontinued Operations
0.7 Commodity hedging0.3 Exchange related
(0.3) Other
0.8 Manufacturing/attrition0.3 Pension/OPEB
(1.1) Product line mix(0.4) Model/option mix(0.1) Fleet mix/other
0.7 Material performance(0.1) Commodities(0.3) Program majors
Key Drivers(1.3) Industry decline(0.9) Inventory related (0.7) Segment mix related (0.2) Share performance
(0.6) Pricing/incentives(1.6) Lease reserve adj.

Overview of Other Regions
• Automotive revenue outside GMNA up 10% vs. Q2 2007 on unit sales records once again in all overseas regions– 55% of global auto revenue generated in GME / GMLAAM / GMAP– 65% of unit sales generated outside the U.S.
• $0.5B of adjusted EBT generated in other regions, despite non-operational challenges in GMAP and GME– GME remained profitable, but EBT down vs. Q2 2007 due to
currency exchange headwinds– GMAP loss result of one-time adjustments related to hedge
accounting
• GMLAAM continues to deliver very strong results, with revenue up 18% and automotive EBT up 50% vs. Q2 2007
21

Emerging Markets Growth Trends
22
Industry IndustryGrowth GM Share GM Share Growth Outlook
H1 2008 H1 2008 vs. H1 2007 2007 - 2012
Brazil 30% 20.4% 0.3 p.p. 54%
Russia 35% 11.3% 1.8 p.p. 103%
India 11% 3.1% 0.5 p.p. 80%
China 17% 11.9% (0.4) p.p. 67%
Total Emerging* 17% 11.7% 0.0 p.p. 53%
• GM unit sales outside GMNA up 10% in Q2 largely on strength in key emerging markets in GMLAAM and GMAP
• Chevrolet brand a key global growth driver, supporting strong gains in Russia and in GME overall despite slowdown in Western Europe
* Total of 47 markets, including BRIC

GME Second Quarter Adjusted Results
23
($ Millions) 2007 20082008 F/(U)
2007
Revenue $9,512 $10,579 $1,067 Earnings Before Tax/(Loss) 345 99 (246)Earnings Before Tax Margin 3.6% 0.9% (2.7) p.p.
Total Europe:- Production Volume (000) 464 495 31 - Industry SAAR (Mil.) 22.7 22.8 0.1 - GM Total Deliveries (000) 575 590 15 - Market Share 9.4% 9.4% 0.0 p.p.
Germany: - Industry SAAR (Mil.) 3.5 3.5 0.0 - Market Share 9.2% 9.2% (0.0) p.p.
UK:- Industry SAAR (Mil.) 2.8 2.7 (0.1)- Market Share 15.9% 16.0% 0.1 p.p.- Memo: EUR/GBP exchange 0.68 0.79
Russia:- Industry SAAR (Mil.) 2.5 3.4 0.9 - Market Share 9.7% 10.7% 1.0 p.p.

GME Adjusted EBT – Q2 2008 vs. Q2 2007
$ Billions – Continuing Operations Only Q2 YTD
2007 Earnings Before Tax $0.3 $0.4
Exchange (0.2) (0.3)
Volume / Mix / Price (0.1) (0.1)
Cost Factors 0.1 0.3
2008 Earnings Before Tax $0.1 $0.3
242007 excludes results from Allison Transmission, recorded as Discontinued Operations

GMLAAM Second Quarter Adjusted Results
25
($ Millions) 2007 20082008 F/(U)
2007
Revenue $4,333 $5,109 $776 Earnings Before Tax/(Loss) 296 445 149 Earnings Before Tax Margin 6.8% 8.7% 1.9 p.p.
Total LAAM:- Production Volume (000) 233 276 43 - Industry SAAR (Mil.) 7.1 8.2 1.1 - GM Total Deliveries (000) 294 346 52 - Market Share 16.8% 17.5% 0.7 p.p.
Brazil: - Industry SAAR (Mil.) 2.4 3.1 0.7 - Market Share 20.1% 20.0% (0.1) p.p.
Argentina:- Industry SAAR (Mil.) 0.6 0.6 0.0 - Market Share 16.1% 15.3% (0.8) p.p.
ANDEAN Markets- Industry SAAR (Mil.) 1.0 0.9 (0.1)- Market Share 30.7% 31.3% 0.6 p.p.

GMLAAM Key Second Quarter Profit Drivers
26
• GM able to drive continued strong revenue and profit growth in LAAM based on its strong position against very strong industry dynamics
• GM unit sales up 18% on strong growth across all key market areas– South America up 16%– Africa up 34%– Middle East up 12%
• All-time quarterly sales records set in Brazil, Chile, Egypt and for the Africa Regional Marketing Organization (Nigeria, Tunisia)– Q2 sales records set in Argentina, Ecuador and the Middle East
• Revenue up 18% overall, driven by strong volume, mix and pricing– Exceptional revenue growth in Brazil, Argentina, Chile and Ecuador
• Adjusted earnings growth up 50% as region levered revenue growthby carefully controlling structural cost base

GMAP Second Quarter Adjusted Results
27
($ Millions) 2007 20082008 F/(U)
2007
Revenue $5,287 $5,158 $(129)Pre-Tax Income/(Loss) 296 (261) (557)
China JVs Equity Income 122 104 (18)Minority Interest (124) 92 216
Earnings Before Tax/(Loss) 294 (65) (359)Earnings Before Tax Margin 5.6% (1.3)% (6.8) p.p.
Total Asia Pacific:- Industry SAAR (Mil.) 20.5 22.1 1.6 - GM Total Deliveries (000) 338 387 49 - Market Share 6.7% 7.0% 0.3 p.p.
China: - Industry SAAR (Mil.) 8.3 9.4 1.1 - Market Share 10.7% 11.3% 0.6 p.p.
Australia:- Industry SAAR (Mil.) 1.0 1.1 0.1 - Market Share 14.5% 12.2% (2.3) p.p.
GM-DAT: - Production (Complete Build Units) 258 247 (11)
* Reflects $(285) million impact of hedging related adjustments
*

GMAC Second Quarter Overview
28
• On a standalone basis, GMAC reported $(2.5)B net loss, a deterioration of $(2.8)B vs. Q2 2007
• North America Auto Finance negatively impacted by weak auto industry conditions and deteriorating used vehicle residual values
– GMAC recorded an impairment of $0.7B against operating lease assets in Q2 due to sharply lower remarketing proceeds, primarily related to SUVs in the U.S.
• International Auto Finance and Insurance business continue to perform well, with both reporting higher net income than the year ago period
• ResCap continued to experience significant losses related to weak housing market conditions
• Earnings before tax as realized by GM was a loss of $1.2B– Includes 49% of lease asset impairment taken by GMAC North American
Auto Finance

GMAC Second Quarter Business Line Results
29
($ Millions) 2007 20082008 F/(U)
2007
Global Automotive Finance 395$ (717)$ (1,112)$ Insurance 131 135 4 Other* 21 (40) (61) Sub-Total Net Income/(Loss) 547$ (622)$ (1,169)$
ResCap (254) (1,860) (1,606) Total Net Income/(Loss) 293$ (2,482)$ (2,775)$
* Includes GMAC Commercial Finance and equity interest in Capmark

GM Liquidity Position
30
• Liquidity position of $21.0B at June 30, 2008– Includes $0.5B of readily-available VEBA assets – Represents decrease of $(2.9)B from prior quarter
• Reflects negative adjusted automotive OCF driven primarily by lower Q2 production in GMNA, including impact of American Axle strike
• Additionally had access to about $5B of undrawn, committed U.S. credit facilities at June 30, 2008
– Total available liquidity of approximately $26B at the end of Q2– Have subsequently provided notice to draw $1B under secured
revolver
• Net liquidity of $(19.5)B, $(3.3)B lower than prior quarter resulting primarily from lower Q2 2008 cash balance
– Debt balance in Q2 2008 at $40.5B, slightly higher than prior quarter
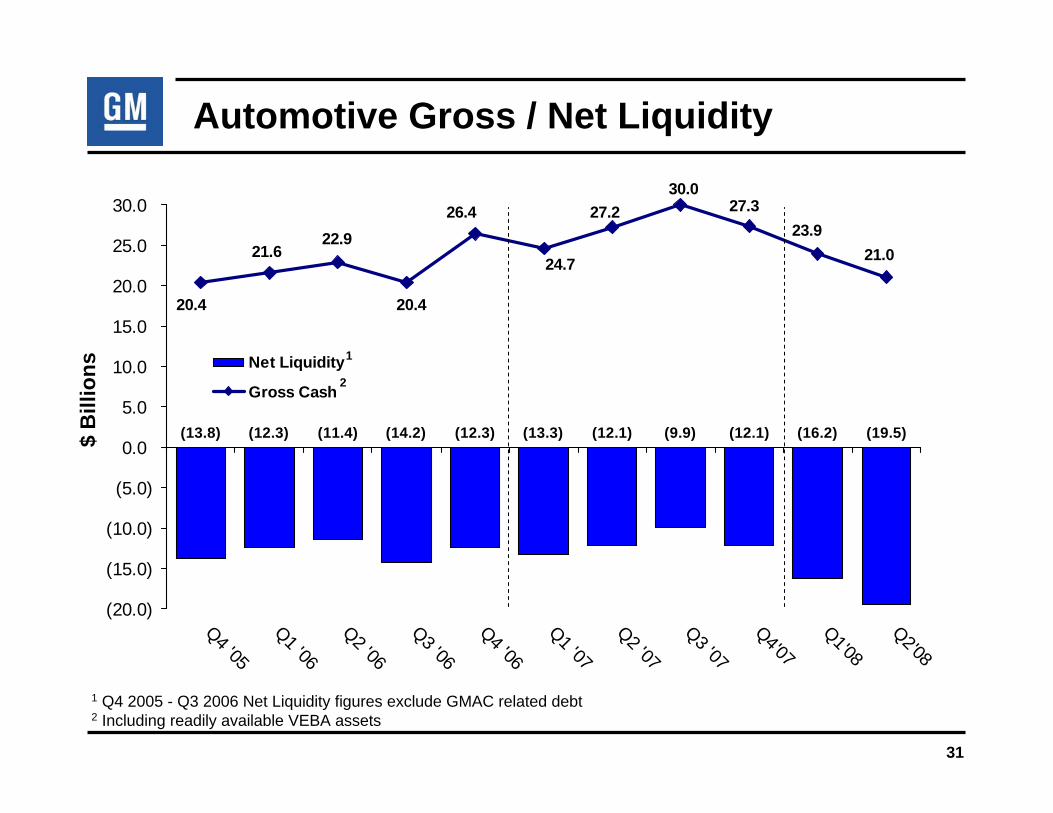
Automotive Gross / Net Liquidity
31
1 Q4 2005 - Q3 2006 Net Liquidity figures exclude GMAC related debt2 Including readily available VEBA assets
(13.8) (12.3) (11.4) (14.2) (12.3) (13.3) (12.1) (9.9) (12.1) (16.2) (19.5)
22.921.6
20.4 20.4
26.4
24.7
23.9
30.027.2 27.3
21.0
(20.0)
(15.0)
(10.0)
(5.0)
0.0
5.0
10.0
15.0
20.0
25.0
30.0
Q4 '05
Q1 '06
Q2 '06
Q3 '06
Q4 '06
Q1 '07
Q2 '07
Q3 '07
Q4'07
Q1'08
Q2'08
Net Liquidity
Gross Cash
1
$ B
illio
ns
2

GM Credit Facility Profile
32
• Q2 credit facilities utilization increased primarily due to draws on lease asset carve-out facility and securitization programs
– U.S. committed facility availability of $5.0B at June 30
As of June 30, 2008 ($ Billions)
Facility Total UnusedSecured revolver with syndicate of banks 4.5 4.4Other U.S. committed 2.3 0.6Sub-Total: Committed (U.S.) 6.8 5.0Other committed (includes JVs) 2.1 1.7Uncommitted lines of credit 1.9 0.8Total 10.8 7.5
Q2 2008

Debt Maturity Profile
33
Note: Excludes IT VEBA obligations - $4.0B note due 2010; $1.7B note due 2010; $4.4B Series U Convertible due 2012
0.0
1.0
2.0
3.0
4.0
2H 2008 2009 2010 2011 2012
$ B
illio
ns
US Term Debt Convertible Debt
Capital Leases Overseas / Other Debt
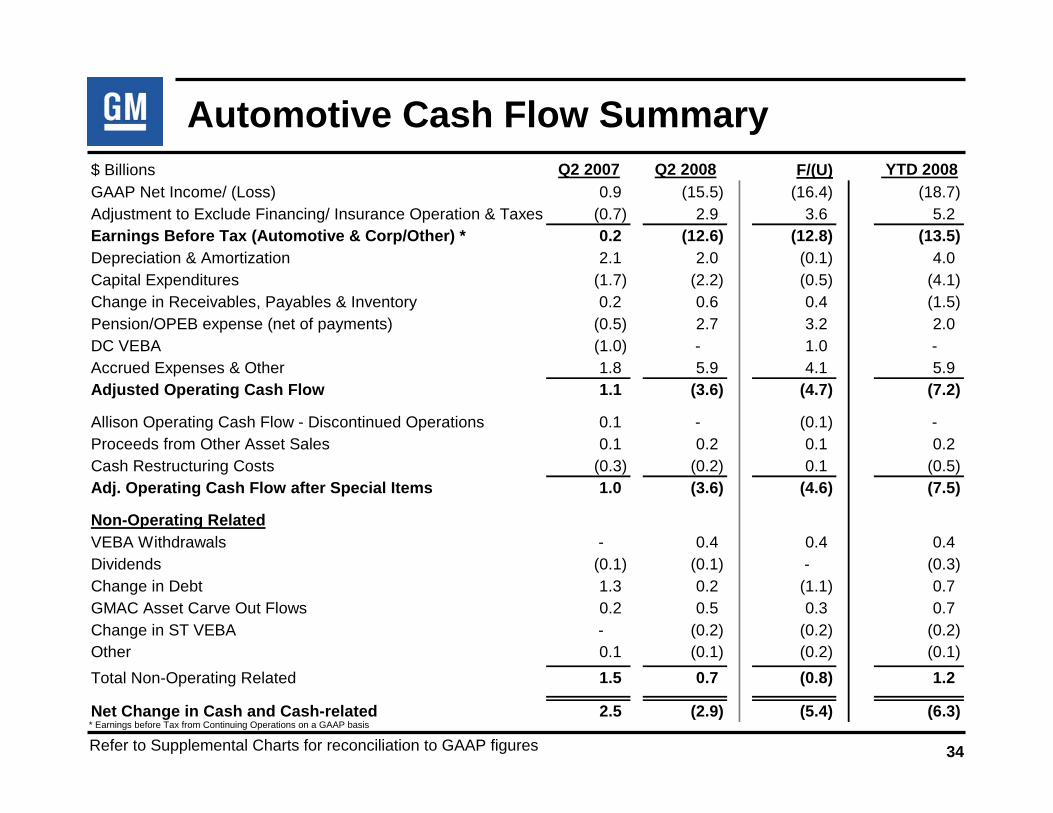
Automotive Cash Flow Summary
Refer to Supplemental Charts for reconciliation to GAAP figures 34
* Earnings before Tax from Continuing Operations on a GAAP basis
$ Billions Q2 2007 Q2 2008 F/(U) YTD 2008GAAP Net Income/ (Loss) 0.9 (15.5) (16.4) (18.7) Adjustment to Exclude Financing/ Insurance Operation & Taxes (0.7) 2.9 3.6 5.2 Earnings Before Tax (Automotive & Corp/Other) * 0.2 (12.6) (12.8) (13.5) Depreciation & Amortization 2.1 2.0 (0.1) 4.0 Capital Expenditures (1.7) (2.2) (0.5) (4.1) Change in Receivables, Payables & Inventory 0.2 0.6 0.4 (1.5) Pension/OPEB expense (net of payments) (0.5) 2.7 3.2 2.0 DC VEBA (1.0) - 1.0 - Accrued Expenses & Other 1.8 5.9 4.1 5.9 Adjusted Operating Cash Flow 1.1 (3.6) (4.7) (7.2)
Allison Operating Cash Flow - Discontinued Operations 0.1 - (0.1) - Proceeds from Other Asset Sales 0.1 0.2 0.1 0.2 Cash Restructuring Costs (0.3) (0.2) 0.1 (0.5) Adj. Operating Cash Flow after Special Items 1.0 (3.6) (4.6) (7.5)
Non-Operating RelatedVEBA Withdrawals - 0.4 0.4 0.4 Dividends (0.1) (0.1) - (0.3) Change in Debt 1.3 0.2 (1.1) 0.7 GMAC Asset Carve Out Flows 0.2 0.5 0.3 0.7 Change in ST VEBA - (0.2) (0.2) (0.2) Other 0.1 (0.1) (0.2) (0.1) Total Non-Operating Related 1.5 0.7 (0.8) 1.2
Net Change in Cash and Cash-related 2.5 (2.9) (5.4) (6.3)

• Year-to-year Q2 variance in Pension/OPEB expense net of payments mainly driven by special attrition program (SAP) charge
Pension/OPEB and Accrued Expenses
35
• Accrued Expenses and Other reflects timing of cash flows vs. accruals– Year over year variance driven by announced charges and reserve adjustments
($ Billions) Q2 2007 Q2 2008 F/(U)US Pension Expense/ (Income) (0.3) (0.3) --GMNA SAP Pension Expense/ (Income) -- 3.1 3.1CAW Settlement -- 0.3 0.3US OPEB Expense 0.5 0.4 (0.1)US OPEB Cash Payments (0.9) (0.9) 0.0Other Pension/ OPEB Adjustments/ (Payments) 0.2 0.1 (0.1)
Net Pension/ OPEB Expense/ (Payments) (0.5) 2.7 3.2
($ Billions) Q2'07 Q2'08 F/(U)
Delphi Charge 0.6 2.8 2.2GMNA Restructuring Charges -- 0.9 0.9GMNA SAP (non-pension/ OPEB charges) -- 0.3 0.3American Axle Settlement -- 0.2 0.2GME/ GMAP Restructuring -- 0.2 0.2Subtotal Special Charges 0.6 4.4 3.8
Net Tax Refunds/ (Payments) 0.1 -- (0.1)Net Interest Accruals/ (Payments) 0.3 0.3 --Net Sales Allowances/ GMNA Lease Reserve Adjustment 0.6 1.3 0.7Net P & W Accruals/ (Payments) 0.3 0.0 (0.3)Other (0.1) (0.1) --Accrued Expenses & Other 1.8 5.9 4.1
Global Cash Management
36
• Current global month-end cash requirement of between $11B and $14B, considering:
– Global supplier payments– Some overseas cash not readily accessible (for example cash at joint
ventures)– Variability of cash flow
• Further seasonal factors such as July shut down can be met through secured revolver
Working Capital / Inventory Plan
37
• As stated on July 15, targeting ~$2B of working capital improvements in North America and Europe from planned YE 2008 levels, primarily related to inventory
• GMNA inventories expected to be improved by ~$1.5B– Productive material reductions estimated at almost $1B, driven in large
part by reducing raw material inventories, optimizing in-line safety stocks, and volume-related impact of capacity actions and market factors
– Other significant driver is finished goods inventory in U.S. and Mexico, largely accounted for through reduction of company-owned vehicle fleets and optimization of distribution systems for imported vehicles
– Additional reductions in service parts and non-productive material
• GME inventories expected to be improved by ~$0.5B through similar actions

Summary
38
• Number one management priority is strengthening liquidity and managing business for cash flow
• Liquidity plan announced on July 15 contemplated the weak Q2 results and challenging U.S. environment
– Will leverage SAP to reduce manufacturing costs and facilitate planned capacity actions
– Moving to quickly implement salaried headcount actions and otherstructural cost reductions in GMNA
– Opportunity to significantly improve capital efficiency via globally managing capex and reducing inventories
• Continued growth outside GMNA provides confidence in our strategy of managing business globally and our position in emerging markets

North American Leasing Outlook• Industry conditions driving up risks and costs associated with leasing
– Significant industry volume decline and mix shift are impacting used vehicle residual values, in some cases dramatically (e.g. SUV’s)
• GM has already taken steps to reduce percentage of our business that is retail leasing, with emphasis on curtailing highest risk areas such as short-term leases– Leases approximately 18% of total retail sales CYTD 2008– Since CY 2006, 24/27 month leases have declined 12.9 p.p. to 13.2% of
GM’s total leases CYTD 2008
• GMAC announced it will exit incentivized leasing in Canada on Aug 1
• GMAC is implementing other initiatives to reduce risk of its lease portfolio, including reducing volume of new lease originations in U.S.
• GM will continue to offer leasing options, though likely more narrowly targeted to certain products and segments– Incentive programs being designed to encourage purchase vs. lease
39

Looking Ahead
• Continued volume/mix pressures in U.S. market– 2008 total industry outlook updated to mid 14 million unit range,
which implies H2 SAAR of about 14 million units total
• Structural cost savings in GMNA related to SAP
• Continued strength in emerging markets, including Central/Eastern Europe and Russia
• Key product launches continue– Chevrolet Traverse in North America
– Opel Insignia in Europe
• Structural cost and cash flow benefits of liquidity plan
40
Supplemental Charts
The following supplemental charts are provided to reconcile adjusted financial data comprehended in the primary chart set with GAAP-based data (per GM’s financial statements) and/or provide
clarification with regard to definition of non-GAAP terminology
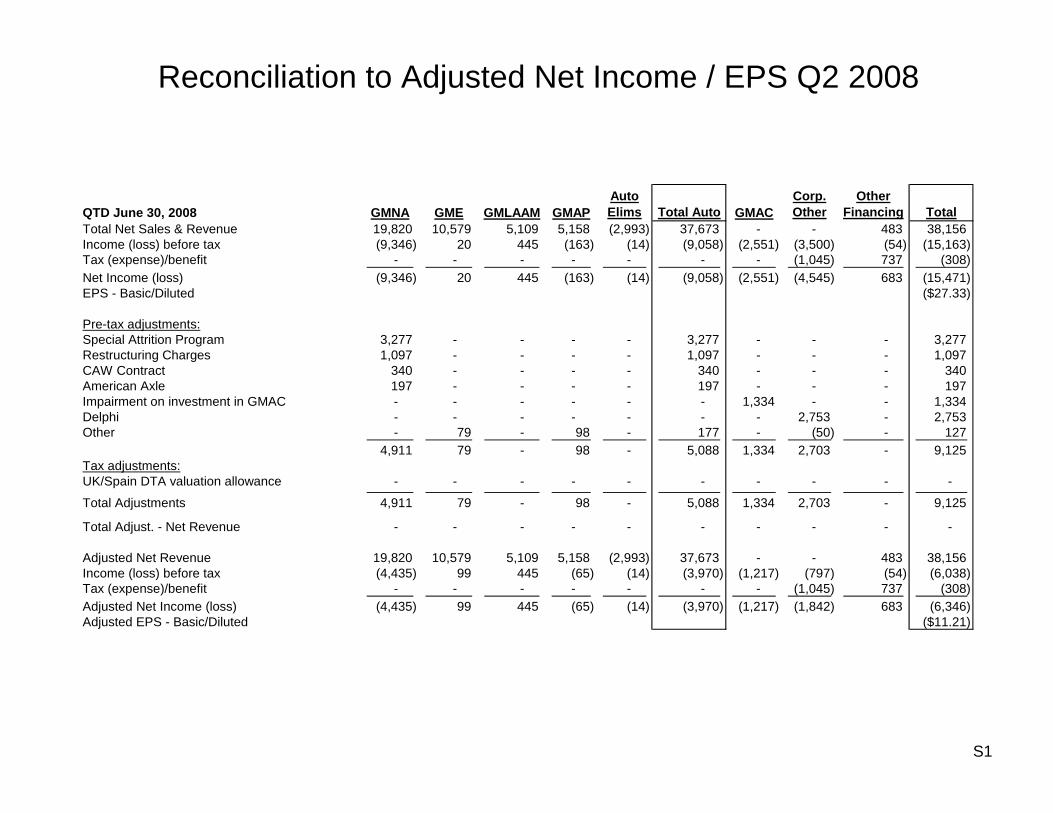
Reconciliation to Adjusted Net Income / EPS Q2 2008
S1
QTD June 30, 2008 GMNA GME GMLAAM GMAPAutoElims Total Auto GMAC
Corp.Other
OtherFinancing Total
Total Net Sales & Revenue 19,820 10,579 5,109 5,158 (2,993) 37,673 - - 483 38,156 Income (loss) before tax (9,346) 20 445 (163) (14) (9,058) (2,551) (3,500) (54) (15,163) Tax (expense)/benefit - - - - - - - (1,045) 737 (308) Net Income (loss) (9,346) 20 445 (163) (14) (9,058) (2,551) (4,545) 683 (15,471) EPS - Basic/Diluted ($27.33)
Pre-tax adjustments:Special Attrition Program 3,277 - - - - 3,277 - - - 3,277 Restructuring Charges 1,097 - - - - 1,097 - - - 1,097 CAW Contract 340 - - - - 340 - - - 340 American Axle 197 - - - - 197 - - - 197 Impairment on investment in GMAC - - - - - - 1,334 - - 1,334 Delphi - - - - - - - 2,753 - 2,753 Other - 79 - 98 - 177 - (50) - 127
4,911 79 - 98 - 5,088 1,334 2,703 - 9,125 Tax adjustments:UK/Spain DTA valuation allowance - - - - - - - - - - Total Adjustments 4,911 79 - 98 - 5,088 1,334 2,703 - 9,125
Total Adjust. - Net Revenue - - - - - - - - - -
Adjusted Net Revenue 19,820 10,579 5,109 5,158 (2,993) 37,673 - - 483 38,156 Income (loss) before tax (4,435) 99 445 (65) (14) (3,970) (1,217) (797) (54) (6,038) Tax (expense)/benefit - - - - - - - (1,045) 737 (308) Adjusted Net Income (loss) (4,435) 99 445 (65) (14) (3,970) (1,217) (1,842) 683 (6,346) Adjusted EPS - Basic/Diluted ($11.21)

Reconciliation to Adjusted Net Income / EPS Q2 2007
S2
QTD June 30, 2007 GMNA GME GMLAAM GMAPAutoElims Total Auto GMAC
Corp.Other
OtherFinancing Total
Total Net Sales & Revenue 29,663 9,512 4,333 5,287 (3,012) 45,783 - - 894 46,677 Income (loss) before tax (88) 315 296 280 - 803 154 (579) 86 464 Tax (expense)/benefit - - - - - - - 364 (44) 320 Net income (loss) from Cont. Ops. (88) 315 296 280 - 803 154 (215) 42 784 Net income for Disc. Ops. 107 - - - - 107 - - - 107
Net Income (loss) 19 315 296 280 - 910 154 (215) 42 891 EPS - Basic $1.57EPS - Diluted $1.56
Pre-tax adjustments:Asset Impairments 95 - - 5 - 100 - - - 100 Plant Closure (6) - - - - (6) - - - (6) Special Attrition Program (6) - - - - (6) - - - (6) Restructuring Charges 97 30 - 9 - 136 - - - 136 Delphi - - - - - - - 575 - 575 Other - - - - - - - - - -
180 30 - 14 - 224 - 575 - 799 Tax adjustments:Tax on or tax related regional special items (63) (11) - (4) - (78) (201) (279)
Total Adjustments 117 19 - 10 - 146 - 374 - 520
Total Adjust. - Net Revenue - - - - - - - - - -
Adjusted Net Revenue 29,663 9,512 4,333 5,287 (3,012) 45,783 - - 894 46,677 Income (loss) before tax 92 345 296 294 - 1,027 154 (4) 86 1,263 Tax (expense)/benefit (63) (11) - (4) - (78) - 163 (44) 41 Net income (loss) for Cont. Ops. 29 334 296 290 - 949 154 159 42 1,304 Net income for Disc. Ops. 107 - - - - 107 - - - 107
Adjusted Net Income (loss) 136 334 296 290 - 1,056 154 159 42 1,411 Adjusted EPS - Basic $2.49Adjusted EPS - Diluted $2.48

Reconciliation of GMNA Revenue Per UnitSecond Quarter
S3
a). For GAAP reporting purposes, sales to other GM regions are eliminated whereas they are retained for managerial vehicle analysisb). Includes SPO parts, Powertrain engines, MSP, and Onstar service outside sales- excluded from managerial vehicle analysisc). Includes Daily Rental Income, and GM Credit Card Income- excluded from managerial vehicle analysis
* Excludes revenue from Allison Transmission, classified as discontinued operations
Revenue Revenue Revenue Revenue Revenue Revenue$ (Millions) Per Unit $ (Millions) Per Unit $ (Millions) Per Unit
GAAP 31,233 21,600$ 29,114 22,296$ 30,936 23,652$
add/(less): Allied Sales 200 a (593) a (974) aless: Non Vehicle Sales (2,978) b (2,778) b (3,481) bless: Other Income Items (782) c (480) c (537) c
Managerial 27,673 19,138$ 25,263 19,348$ 25,944 19,835$
Revenue Revenue Revenue Revenue$ (Millions) Per Unit $ (Millions) Per Unit
GAAP 29,663 24,719$ 19,820 22,170$
add/(less): Allied Sales (329) a (458) aless: Non Vehicle Sales (3,197) b (2,831) bless: Other Income Items (487) c (493) c
Managerial 25,650 21,375$ 16,038 17,940
2008 Q2* 2007 Q2
* 2006 Q22005 Q22004 Q2

Reconciliation of GMNA Revenue Per UnitCalendar Year
S4
a). For GAAP reporting purposes, sales to other GM regions are eliminated whereas they are retained for managerial vehicle analysisb). Includes SPO parts, Powertrain engines, MSP, and Onstar service outside sales- excluded from managerial vehicle analysisc). Includes Daily Rental Income, and GM Credit Card Income- excluded from managerial vehicle analysis
Note: Excludes revenue from Allison Transmission, classified as discontinued operations
Revenue Revenue Revenue Revenue Revenue Revenue$ (Millions) Per Unit $ (Millions) Per Unit $ (Millions) Per Unit
GAAP 120,566 21,537$ 119,071 21,736$ 111,376 21,838$
add/(less): Allied Sales (1,270) a (925) a (827) aless: Non Vehicle Sales (10,063) b (9,175) b (9,246) bless: Other Income Items (1,973) c (2,607) c (2,236) c
Managerial 107,260 19,160$ 106,364 19,417$ 99,067 19,425$
Revenue Revenue Revenue Revenue$ (Millions) Per Unit $ (Millions) Per Unit
GAAP 116,653 23,671$ 112,448 25,061$
add/(less): Allied Sales (1,674) a (1,343) aless: Non Vehicle Sales (13,487) b (12,764) bless: Other Income Items (2,003) c (1,929) c
Managerial 99,489 20,189$ 96,412 21,487
CY '03 CY '04 CY '05
CY '06 CY '07

Reconciliation of Automotive & Corp/Other Cash FlowSecond Quarter and CYTD
S5
General Motors CorporationAutomotive and Corp/OtherGAAP to Managerial Cash Flow reconciliation
$ BillionsQ2 2008 CYTD 2008 Q2 2007 CYTD 2007
Net Cash Provided By Operating Activities (GAAP) * (1.0) (3.1) 2.1 3.0
Reclassifications to/ (from) U.S. GAAP- Expenditures for PPE & Special Tools (2.2) (4.1) (1.7) (2.9) - VEBA Withdrawls (0.4) (0.4) - - - Cash Restructuring Costs 0.2 0.5 0.3 0.8 - Delphi - Cash Restructuring Costs - - - 0.3 - Other (0.2) (0.1) 0.4 0.2
Total Reconciling Items (2.6) (4.1) (1.0) (1.6)
Adjusted Operating Cash Flow before Special Items (3.6) (7.2) 1.1 1.4
* Operating Cash Flow from Continuing Operations