2014 investor day - iis windows servermedia.corporate-ir.net/media_files/irol/25/251376/sout… ·...
TRANSCRIPT

2014 Investor Day
December 8, 2014

2014 Investor Day
This presentation contains forward-looking statements and information. Forward-looking statements include, without limitation, any statement that may project, indicate or imply future results, events, performance or achievements, and may contain the words “expect,” “intend,” “plan,” “anticipate,” “estimate,” “believe,” “will be,” “will continue,” “will likely result” and similar expressions, or future conditional verbs such as “may,” “will,” “should,” “would” and “could.” In addition, any statement concerning future financial performance (including future revenues, earnings or growth rates), ongoing business strategies or prospects, and possible actions taken by us, our subsidiaries or our affiliates, are also forward-looking statements. These forward-looking statements involve external risks and uncertainties, including, but not limited to, those described under the section entitled “Risk Factors” included in our 2013 Annual Report on Form 10-K (as updated by our Quarterly Reports on Form 10-Q).
Forward-looking statements are based on current expectations and projections about future events and are inherently subject to a variety of risks and uncertainties, many of which are beyond the control of our management team. All forward-looking statements in this presentation and in any other written or oral forward-looking statements attributable to us, or to persons acting on our behalf, are expressly qualified in their entirety by these risks and uncertainties. These risks and uncertainties include, among others:
the volatility of natural gas, crude oil and NGL prices and the price and demand of products derived from these commodities; competitive conditions in our industry and the extent and success of producers increasing production or replacing declining production and our success in obtaining new sources of supply; industry conditions and supply of pipelines, processing and fractionation capacity relative to available natural gas from producers; our dependence upon a relatively limited number of customers for a significant portion of our revenues; actions taken, inactions or non-performance by third parties, including suppliers, contractors, operators, processors, transporters and customers; our ability to effectively recover NGLs at a rate equal to or greater than our contracted rates with customers; our ability to produce and market NGLs at the anticipated differential to NGL index pricing; our access to markets enabling us to match pricing indices for purchases and sales of natural gas and NGLs; our ability to complete projects within budget and on schedule, including but not limited to, timely receipt of necessary government approvals and permits, our ability to control the costs of
construction and other factors that may impact projects; our ability to consummate acquisitions, successfully integrate the acquired businesses and realize anticipated cost savings and other synergies from any acquisitions, including in respect of our
acquisition of the TexStar rich gas system assets; our ability to manage over time changing exposure to commodity price risk; the effectiveness of our hedging activities or our decisions not to undertake hedging activities; our access to financing and ability to remain in compliance with our financing covenants; our ability to generate sufficient operating cash flow to fund our quarterly distributions; changes in general economic conditions; the effects of downtime associated with our assets or the assets of third parties interconnected with our systems; operating hazards, fires, natural disasters, weather-related delays, casualty losses and other matters beyond our control; the failure of our processing and fractionation plants to perform as expected, including outages for unscheduled maintenance or repair; the effects of laws and governmental regulations and policies; the effects of existing and future litigation; and other financial, operational and legal risks and uncertainties detailed from time to time in our filings with the U.S. Securities and Exchange Commission.
Developments in any of these areas could cause actual results to differ materially from those anticipated or projected, affect our ability to maintain distribution levels and/or access necessary financial markets, or cause a significant reduction in the market price of our common units.
The foregoing list of risks and uncertainties may not contain all of the risks and uncertainties that could affect us. In addition, in light of these risks and uncertainties, the matters referred to in the forward-looking statements contained in this presentation may not, in fact, occur. Accordingly, undue reliance should not be placed on these statements. We undertake no obligation to publicly update or revise any forward-looking statements as a result of new information, future events or otherwise, except as otherwise required by law.
Cautionary Statements
1
2014 Investor Day
We believe that Adjusted EBITDA is a widely accepted financial indicator of our operational performance and our ability to incur and service debt, fund capital expenditures and make distributions.
We define Adjusted EBITDA as net income/loss, plus interest expense, income tax expense, depreciation and amortization expense, equity in losses of joint venture investments, certain non-cash charges (such as non-cash unit-based compensation, impairments, loss on extinguishment of debt and unrealized losses on derivative contracts), major litigation costs net of recoveries, transaction-related costs, revenue deferral adjustment, loss on sale of assets and selected charges that are unusual or non-recurring; less interest income, income tax benefit, unrealized gains on derivative contracts, equity in earnings of joint venture investments and selected gains that are unusual or non-recurring.
Adjusted EBITDA is used as a supplemental measure by our management and by external users of our financial statements, such as investors, commercial banks, research analysts and others, to assess:
• the financial performance of our assets without regard to financing methods, capital structure or historical cost basis;• the ability of our assets to generate cash sufficient to support our indebtedness and make future cash distributions;• operating performance and return on capital as compared to those of other companies in the midstream energy sector, without regard
to financing or capital structure; and• the attractiveness of capital projects and acquisitions and the overall rates of return on investment opportunities.
Adjusted EBITDA is not a financial measure presented in accordance with GAAP. We believe that the presentation of this non-GAAP financial measure provides useful information to investors in assessing our financial condition, results of operations and cash flows from operations. Net income/loss is the GAAP measure most directly comparable to Adjusted EBITDA, and a reconciliation of Adjusted EBITDA to net income/loss is included in this presentation. Adjusted EBITDA should not be considered an alternative to net income, operating cash flow or any other measure of financial performance presented in accordance with GAAP. Non-GAAP financial measures have important limitations as an analytical tool because each excludes some but not all items that affect the most directly comparable GAAP financial measure. You should not consider Adjusted EBITDA in isolation or as a substitute for analysis of our results as reported under GAAP. Because Adjusted EBITDA may be defined differently by other companies in our industry, our definition of this non-GAAP financial measure may not be comparable to similarly titled measures of other companies, thereby diminishing its utility.
Non-GAAP Financial Measures
2

2014 Investor Day
Overview David BieglerChairman
Operations and StrategyJohn BonnPresident and Chief Executive Officer
Financial Overview and Outlook
Michael AndersonSVP and Chief Financial Officer
Presenters
3
2014 Investor Day
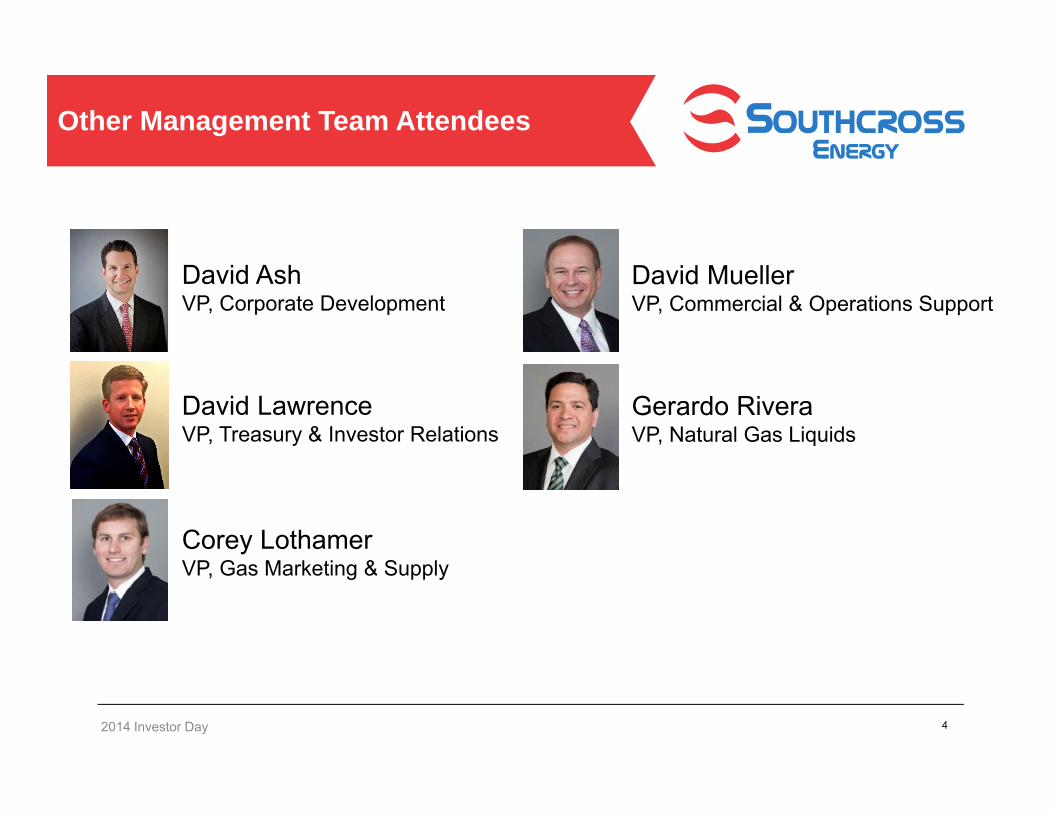
David AshVP, Corporate Development
David LawrenceVP, Treasury & Investor Relations
Corey LothamerVP, Gas Marketing & Supply
Other Management Team Attendees
4
Need David Ash Picture
David MuellerVP, Commercial & Operations Support
Gerardo Rivera VP, Natural Gas Liquids
2014 Investor Day 5
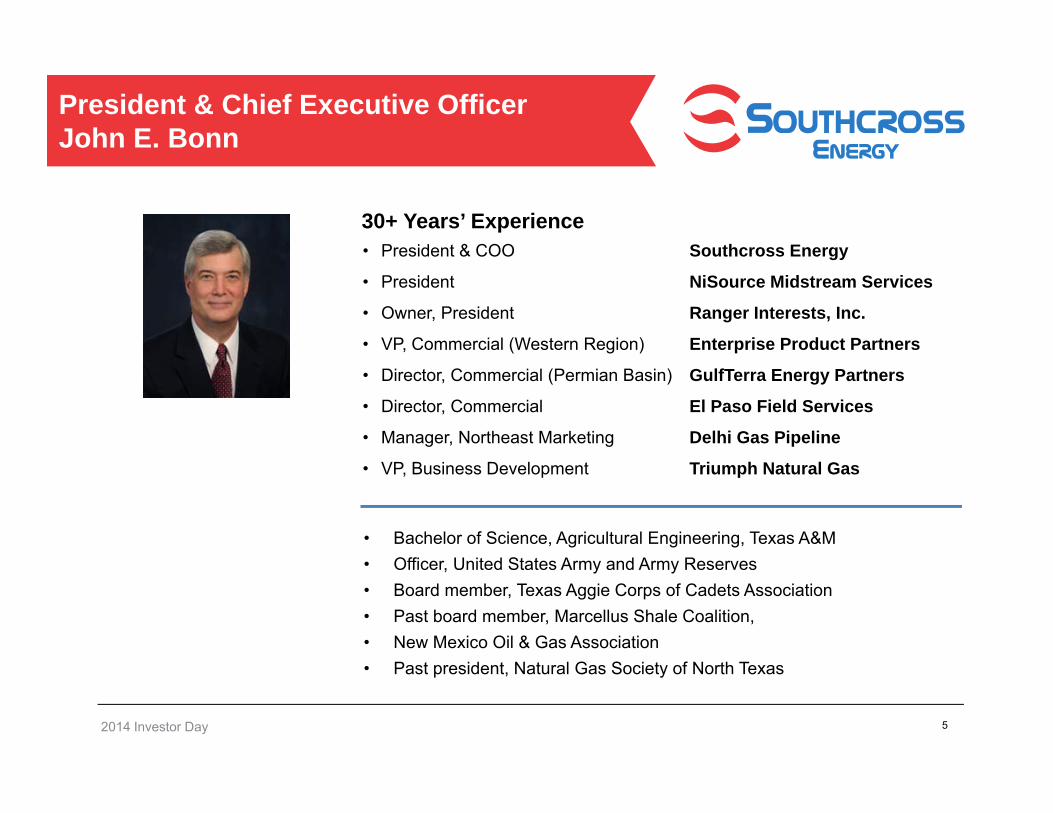
30+ Years’ Experience• President & COO Southcross Energy
• President NiSource Midstream Services
• Owner, President Ranger Interests, Inc.
• VP, Commercial (Western Region) Enterprise Product Partners
• Director, Commercial (Permian Basin) GulfTerra Energy Partners
• Director, Commercial El Paso Field Services
• Manager, Northeast Marketing Delhi Gas Pipeline
• VP, Business Development Triumph Natural Gas
President & Chief Executive Officer John E. Bonn
• Bachelor of Science, Agricultural Engineering, Texas A&M• Officer, United States Army and Army Reserves• Board member, Texas Aggie Corps of Cadets Association• Past board member, Marcellus Shale Coalition,• New Mexico Oil & Gas Association• Past president, Natural Gas Society of North Texas
2014 Investor Day
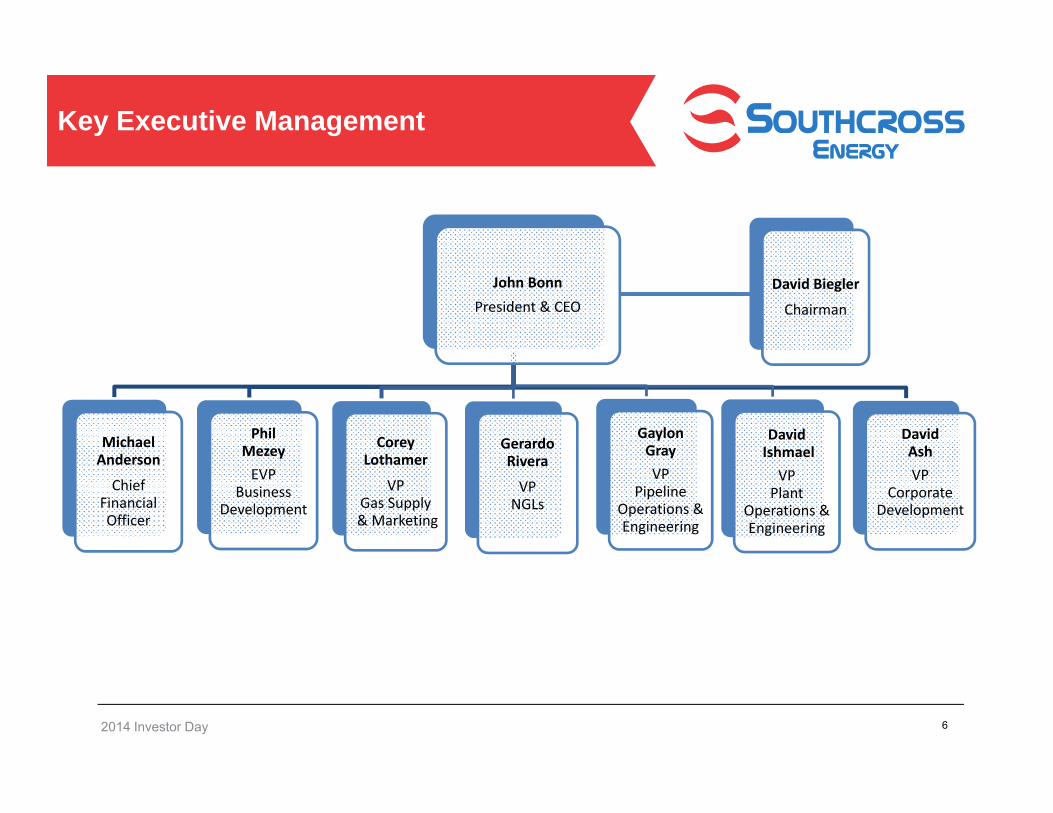
Key Executive Management
6
John BonnPresident & CEO
Corey Lothamer
VPGas Supply& Marketing
Gerardo Rivera
VPNGLs
Gaylon GrayVP
Pipeline Operations & Engineering
DavidIshmaelVPPlant
Operations & Engineering
Michael Anderson
Chief Financial Officer
Phil MezeyEVP
Business Development
David AshVP
Corporate Development
David Biegler
Chairman
2014 Investor Day
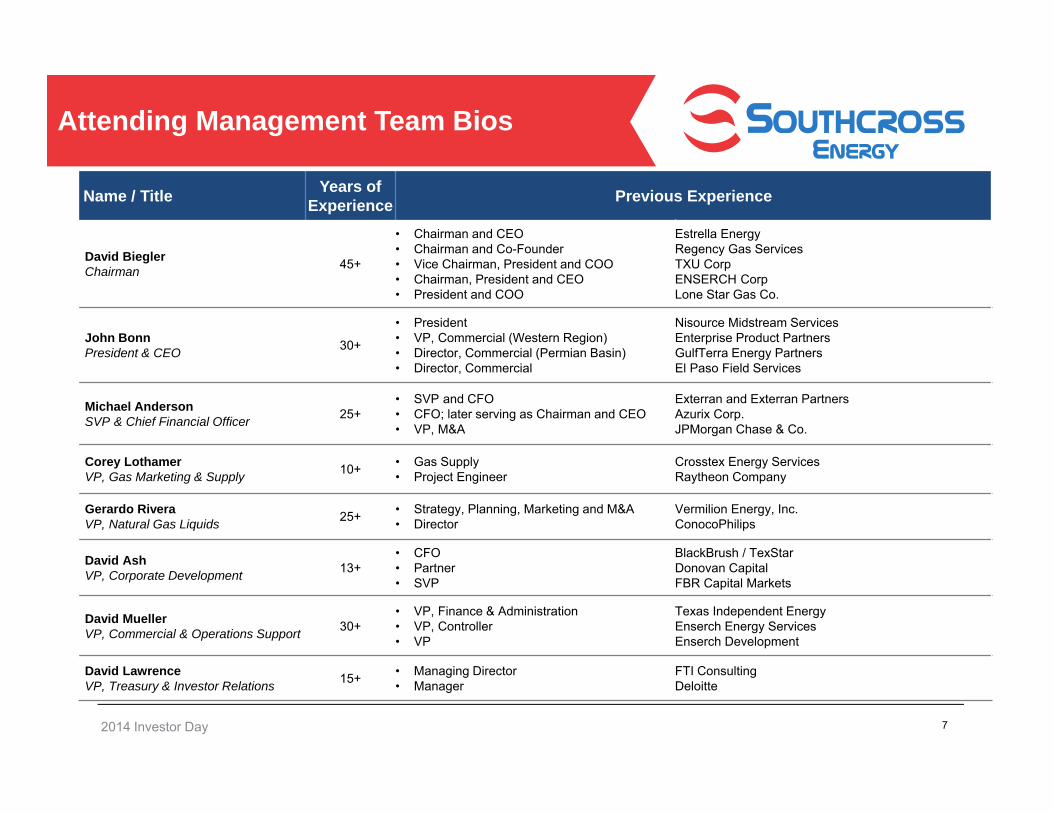
Attending Management Team Bios
7
Name / Title Years of Experience Previous Experience
David BieglerChairman 45+
• Chairman and CEO• Chairman and Co-Founder• Vice Chairman, President and COO• Chairman, President and CEO• President and COO
Estrella EnergyRegency Gas ServicesTXU CorpENSERCH CorpLone Star Gas Co.
John BonnPresident & CEO 30+
• President• VP, Commercial (Western Region)• Director, Commercial (Permian Basin)• Director, Commercial
Nisource Midstream ServicesEnterprise Product PartnersGulfTerra Energy PartnersEl Paso Field Services
Michael AndersonSVP & Chief Financial Officer 25+
• SVP and CFO• CFO; later serving as Chairman and CEO• VP, M&A
Exterran and Exterran PartnersAzurix Corp.JPMorgan Chase & Co.
Corey LothamerVP, Gas Marketing & Supply 10+ • Gas Supply
• Project EngineerCrosstex Energy ServicesRaytheon Company
Gerardo Rivera VP, Natural Gas Liquids 25+ • Strategy, Planning, Marketing and M&A
• DirectorVermilion Energy, Inc.ConocoPhilips
David AshVP, Corporate Development 13+
• CFO • Partner • SVP
BlackBrush / TexStarDonovan Capital FBR Capital Markets
David MuellerVP, Commercial & Operations Support 30+
• VP, Finance & Administration • VP, Controller • VP
Texas Independent EnergyEnserch Energy ServicesEnserch Development
David LawrenceVP, Treasury & Investor Relations 15+ • Managing Director
• ManagerFTI ConsultingDeloitte

Overview – David Biegler
2014 Investor Day
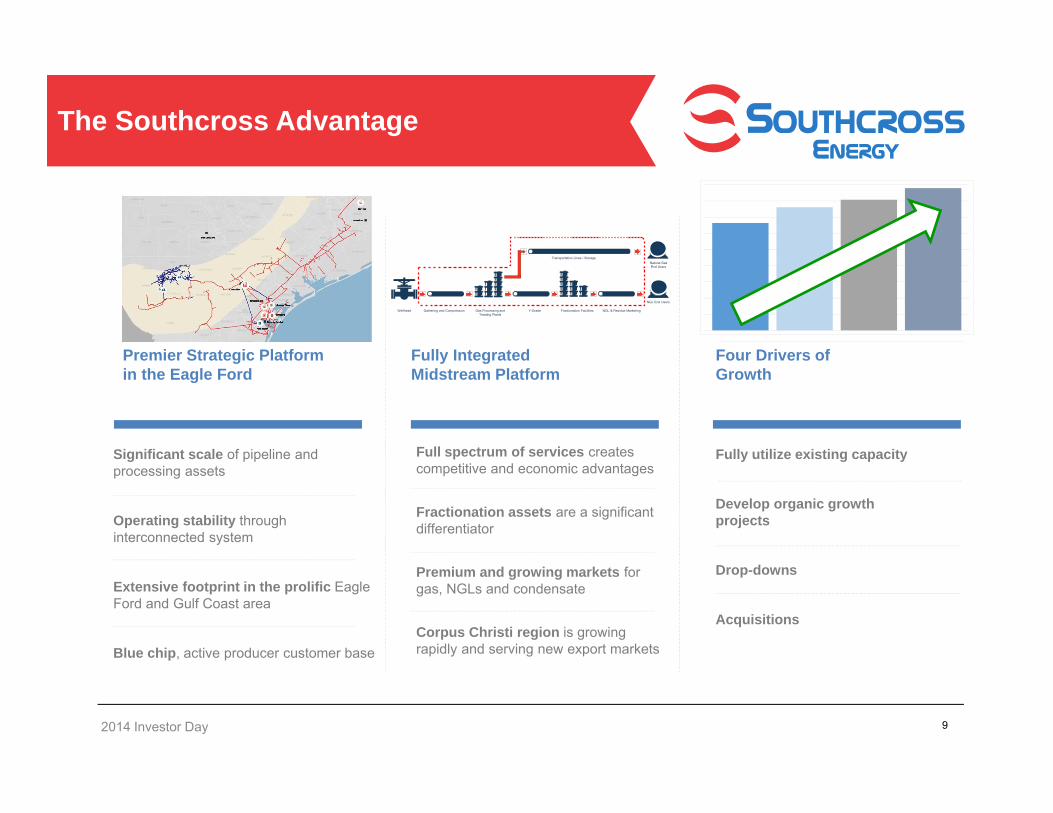
The Southcross Advantage
9
Significant scale of pipeline and processing assets
Operating stability through interconnected system
Extensive footprint in the prolific Eagle Ford and Gulf Coast area
Blue chip, active producer customer base
Full spectrum of services creates competitive and economic advantages
Fractionation assets are a significant differentiator
Premium and growing markets for gas, NGLs and condensate
Corpus Christi region is growing rapidly and serving new export markets
Fully utilize existing capacity
Develop organic growth projects
Drop-downs
Acquisitions
Premier Strategic Platform in the Eagle Ford
Fully Integrated Midstream Platform
Four Drivers of Growth
Wellhead Gathering and Compression Gas Processing andTreating Plants
Y-Grade Fractionation Facilities
Natural GasEnd Users
Transportation Lines / Storage
NGL End Users
NGL & Residue Marketing

2014 Investor Day
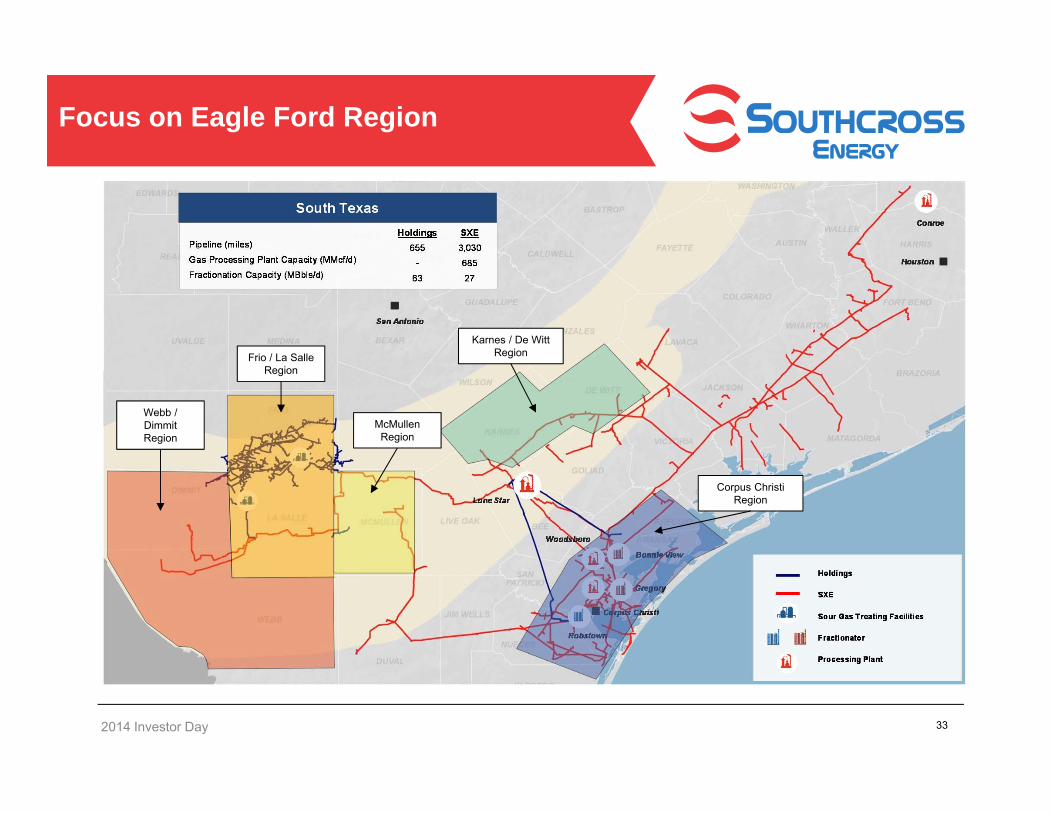
Pipeline (miles)Gas Processing Capacity (MMcf/d)Fractionation Capacity (MBbls/d)
Holdings655
-63
SXE3,03068527
South Texas Assets
Premier Strategic Footprint with Scale to Succeed in the Eagle Ford
Holdings
SXE
Sour Gas Treating Facility
Fractionator
Processing Plant
10
Corpus Christi
San Antonio
Houston
Conroe
Lone Star
Woodsboro
Bonnie View
Gregory
Robstown

2014 Investor Day
2013Bee Line
2013Kenedy Line
2013McMullen Lateral
2013Bonnie View Plant
2013Lone Star Plant
History of Growth
11
2012MoncoAcquisition
2012McMullen Pipeline
2012Woodsboro Plant
2012‐2014Lancaster System
2012T2 Pipeline
2014Onyx Acquisition2014Onyx Acquisition
2014McMullen LateralMcMullen Gathering Acquisition
2014Webb Pipeline
2014Valley Wells
Holdings
SXE
Sour Gas Treating Facilities
Fractionator
Processing Plant
2011Tennessee Pipeline
2015NGL System
2015Robstown Fractionator
2012T2 Pipeline
2014 Investor Day
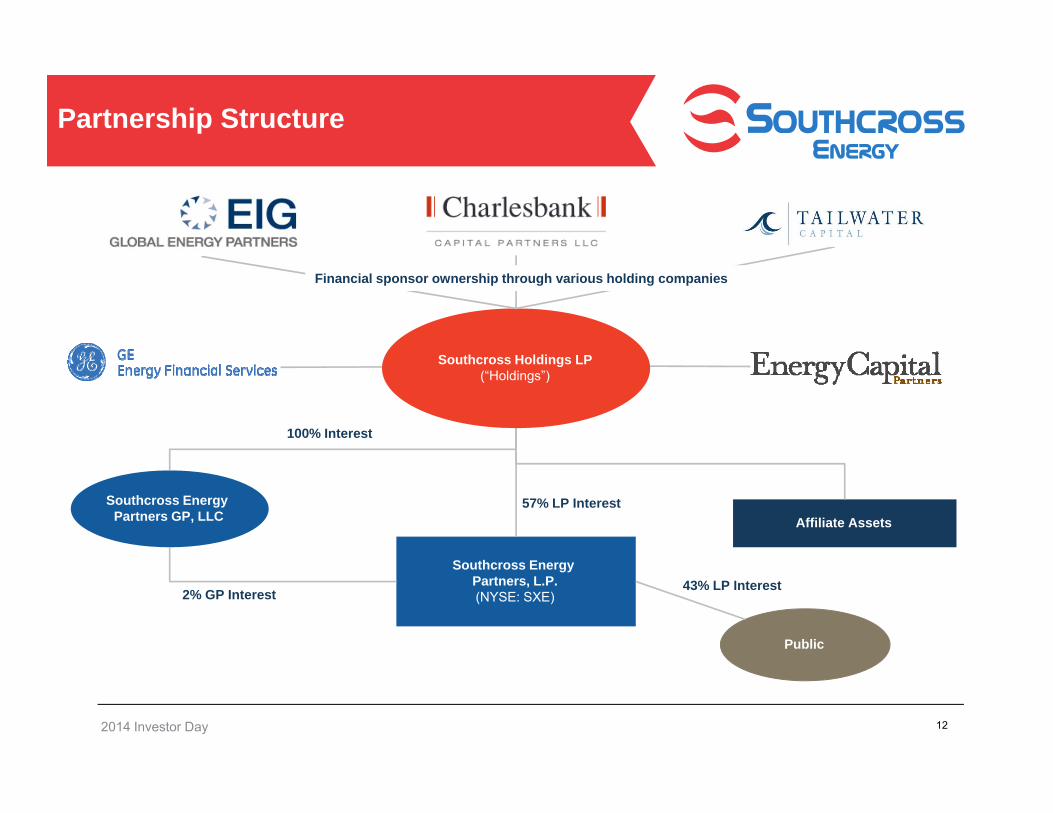
Partnership Structure
Southcross Holdings LP(“Holdings”)
Southcross Energy Partners, L.P.(NYSE: SXE)
Affiliate Assets
Public
43% LP Interest2% GP Interest
57% LP InterestSouthcross Energy Partners GP, LLC
Financial sponsor ownership through various holding companies
12
100% Interest
2014 Investor Day 13
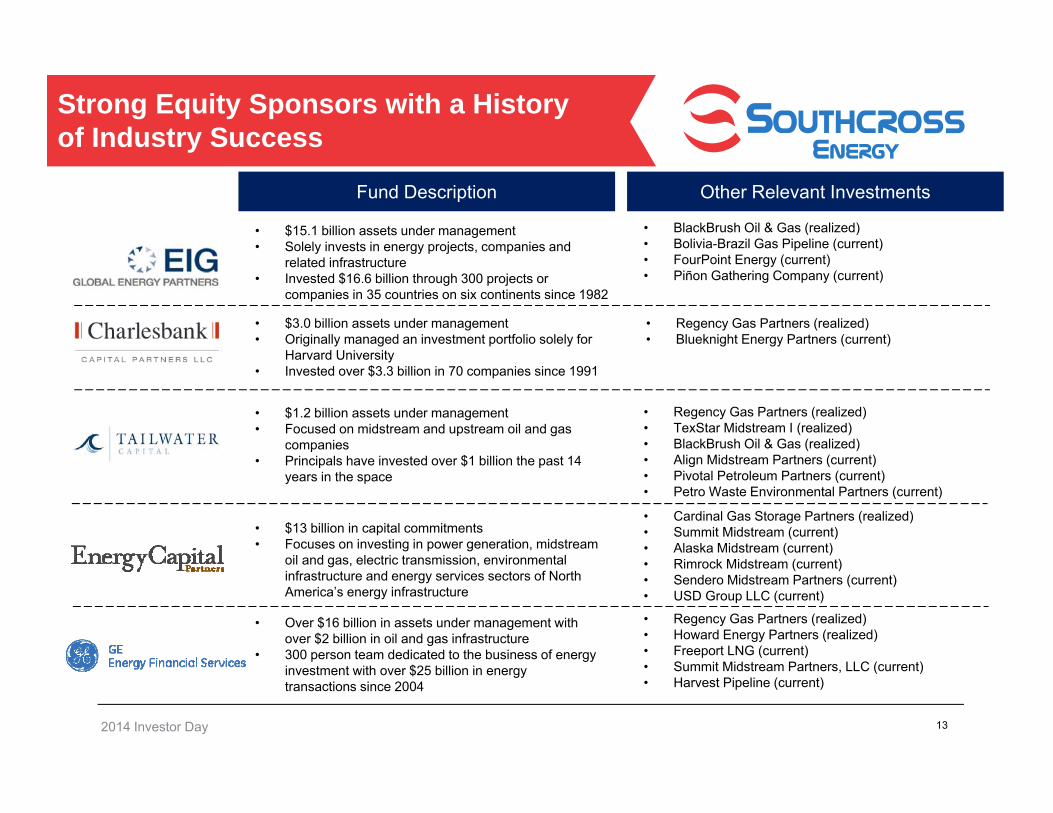
Strong Equity Sponsors with a History of Industry Success
Request for Proposal Summary Proposed Contract and Deal TermsFund Description Other Relevant Investments
• $3.0 billion assets under management• Originally managed an investment portfolio solely for
Harvard University• Invested over $3.3 billion in 70 companies since 1991
• Regency Gas Partners (realized)• Blueknight Energy Partners (current)
• $15.1 billion assets under management• Solely invests in energy projects, companies and
related infrastructure• Invested $16.6 billion through 300 projects or
companies in 35 countries on six continents since 1982
• BlackBrush Oil & Gas (realized)• Bolivia-Brazil Gas Pipeline (current)• FourPoint Energy (current)• Piñon Gathering Company (current)
• $1.2 billion assets under management• Focused on midstream and upstream oil and gas
companies• Principals have invested over $1 billion the past 14
years in the space
• Regency Gas Partners (realized)• TexStar Midstream I (realized)• BlackBrush Oil & Gas (realized)• Align Midstream Partners (current)• Pivotal Petroleum Partners (current)• Petro Waste Environmental Partners (current)
• $13 billion in capital commitments • Focuses on investing in power generation, midstream
oil and gas, electric transmission, environmental infrastructure and energy services sectors of North America’s energy infrastructure
• Cardinal Gas Storage Partners (realized)• Summit Midstream (current)• Alaska Midstream (current)• Rimrock Midstream (current)• Sendero Midstream Partners (current)• USD Group LLC (current)
• Over $16 billion in assets under management with over $2 billion in oil and gas infrastructure
• 300 person team dedicated to the business of energy investment with over $25 billion in energy transactions since 2004
• Regency Gas Partners (realized)• Howard Energy Partners (realized)• Freeport LNG (current)• Summit Midstream Partners, LLC (current)• Harvest Pipeline (current)

U.S. Energy Highlights
14
Source: U.S. Energy Information AdministrationNote: Petroleum production includes crude oil, natural gas liquids, condensates, refinery processing gain, and other liquids, including biofuels; barrels per day oil equivalent were calculated using a conversion factor of 1 barrel oil equivalent=5.55 million British thermal units (Btu)
The U.S. is the largest petroleum and natural gas-producing country in the world
2008 2014E
Petroleum
Natural Gas
United StatesRussia
Saudi Arabia
The U.S. is expected to produce more than 25 MMBOE in 2014, over 40% growth in 6 years
Mill
ion
Bar
rels
per
Day
of O
il Eq
uiva
lent
2014 Investor Day
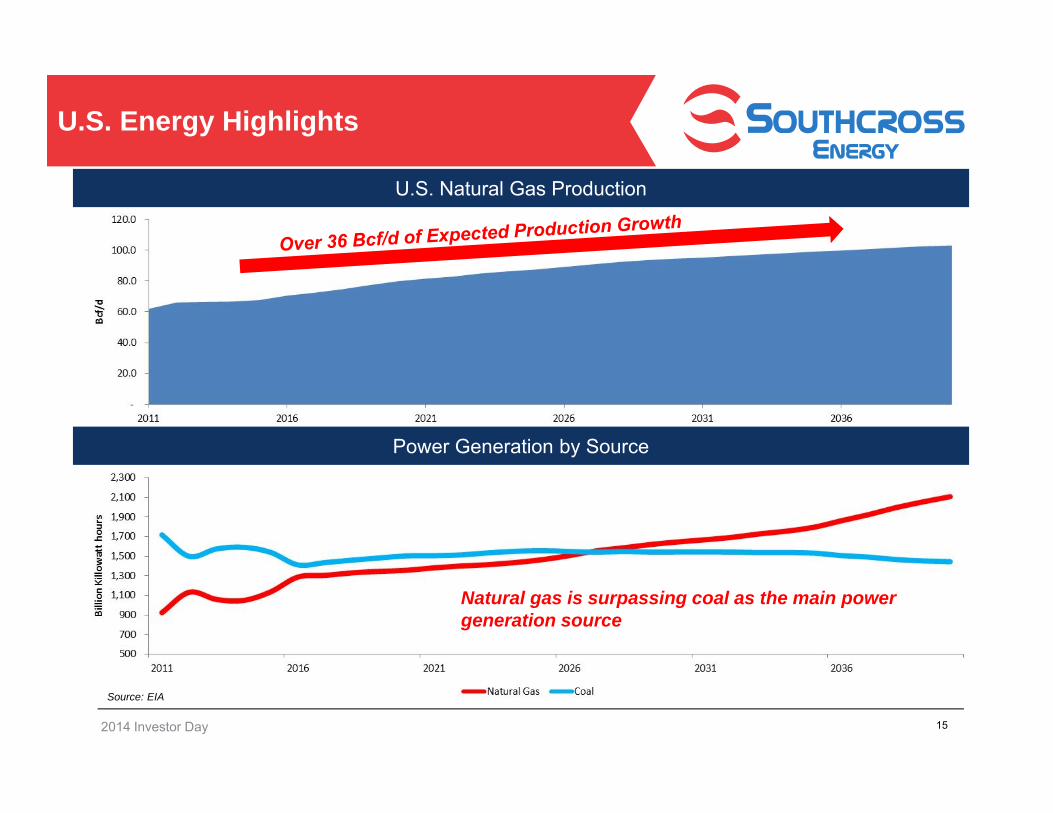
U.S. Energy Highlights
15
Source: EIA
Power Generation by Source
U.S. Natural Gas Production
Natural gas is surpassing coal as the main power generation source
2014 Investor Day
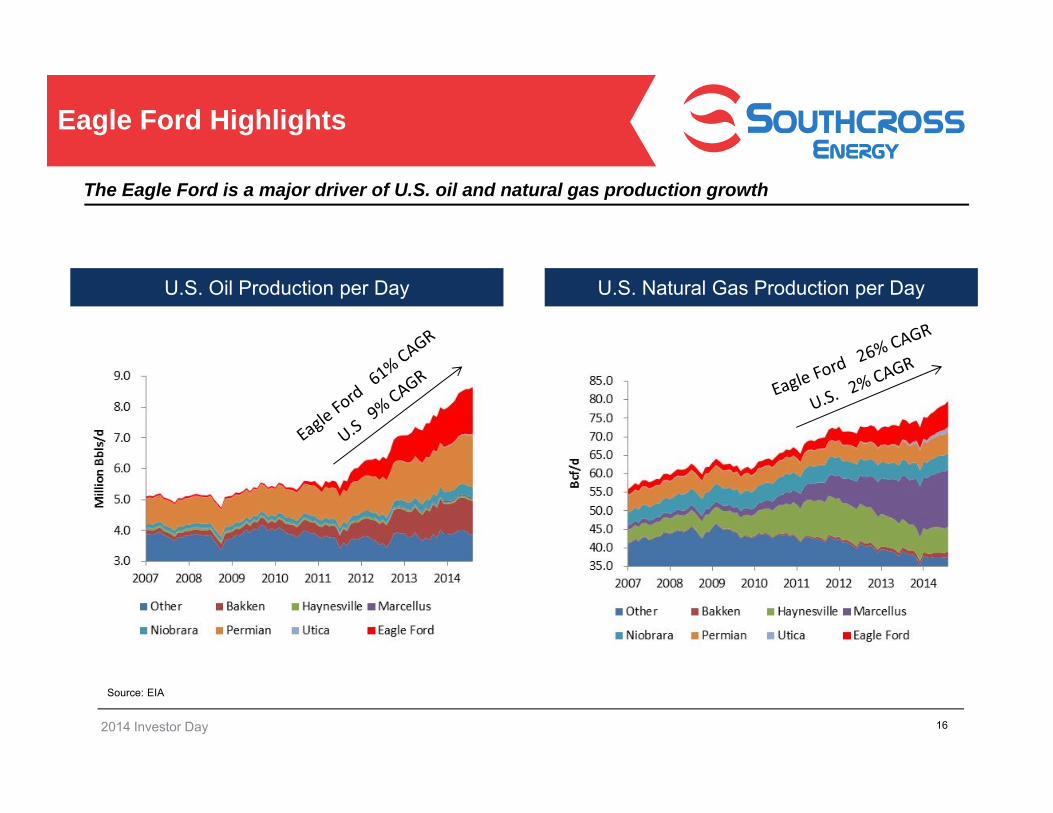
Eagle Ford Highlights
16
Source: EIA
The Eagle Ford is a major driver of U.S. oil and natural gas production growth
U.S. Oil Production per Day U.S. Natural Gas Production per Day
2014 Investor Day
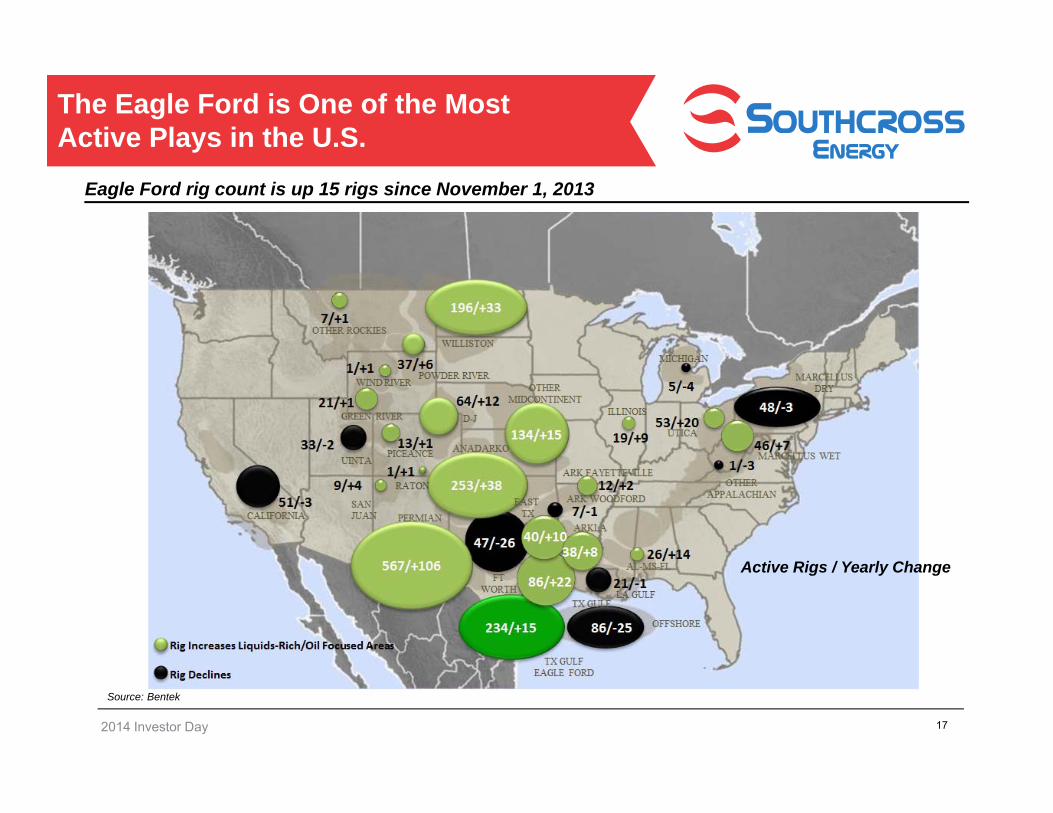
The Eagle Ford is One of the Most Active Plays in the U.S.
17
Source: Bentek
Eagle Ford rig count is up 15 rigs since November 1, 2013
Active Rigs / Yearly Change
2014 Investor Day
Request for Proposal Summary Proposed Contract and Deal Terms
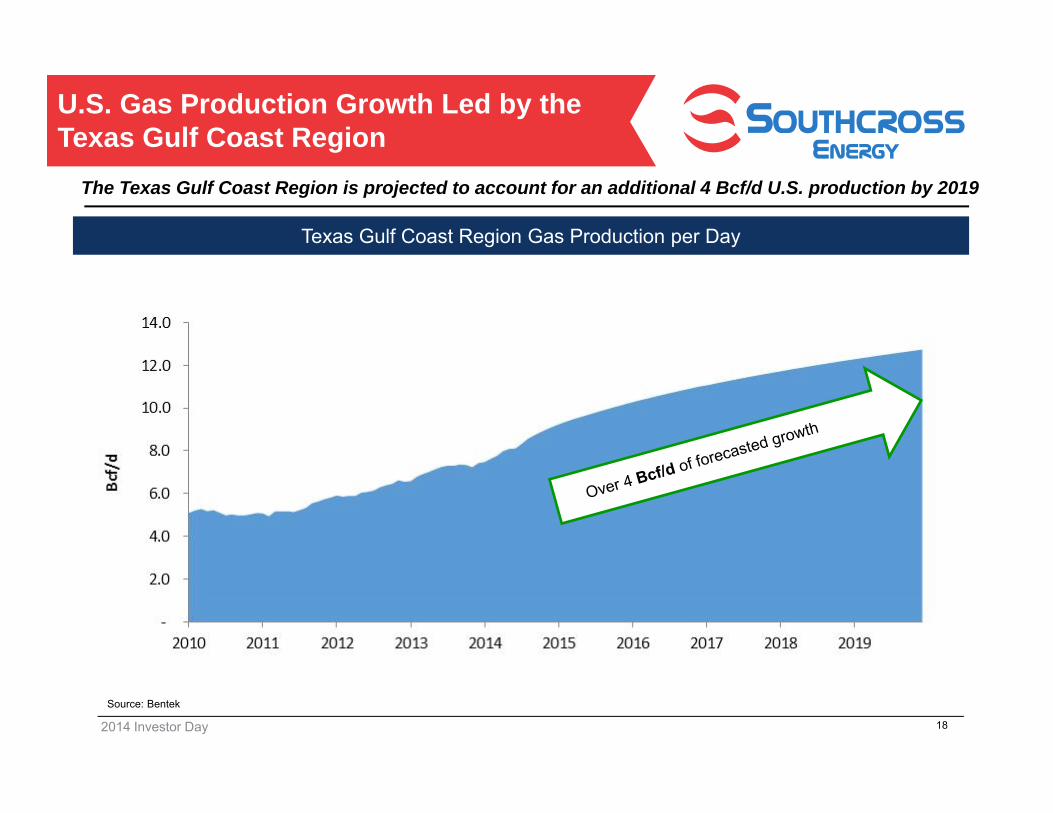
U.S. Gas Production Growth Led by the Texas Gulf Coast Region
18
The Texas Gulf Coast Region is projected to account for an additional 4 Bcf/d U.S. production by 2019
Source: Bentek
Texas Gulf Coast Region Gas Production per Day
2014 Investor Day

Request for Proposal Summary Proposed Contract and Deal Terms
Texas Gulf Coast Production Expected to Exceed Processing Capacity
19
(1) Bentek Eagle Ford and Texas Gulf Coast production estimatesNote: Excludes plant retirements.
Texas Gulf Coast Region is forecasted to need an additional 2.0 to 4.5 bcf/d of processing capacity by 2019
Potential 4.5 Bcf/d Shortfall in Cryo
Capacity
2014 Investor Day
Request for Proposal Summary Proposed Contract and Deal Terms
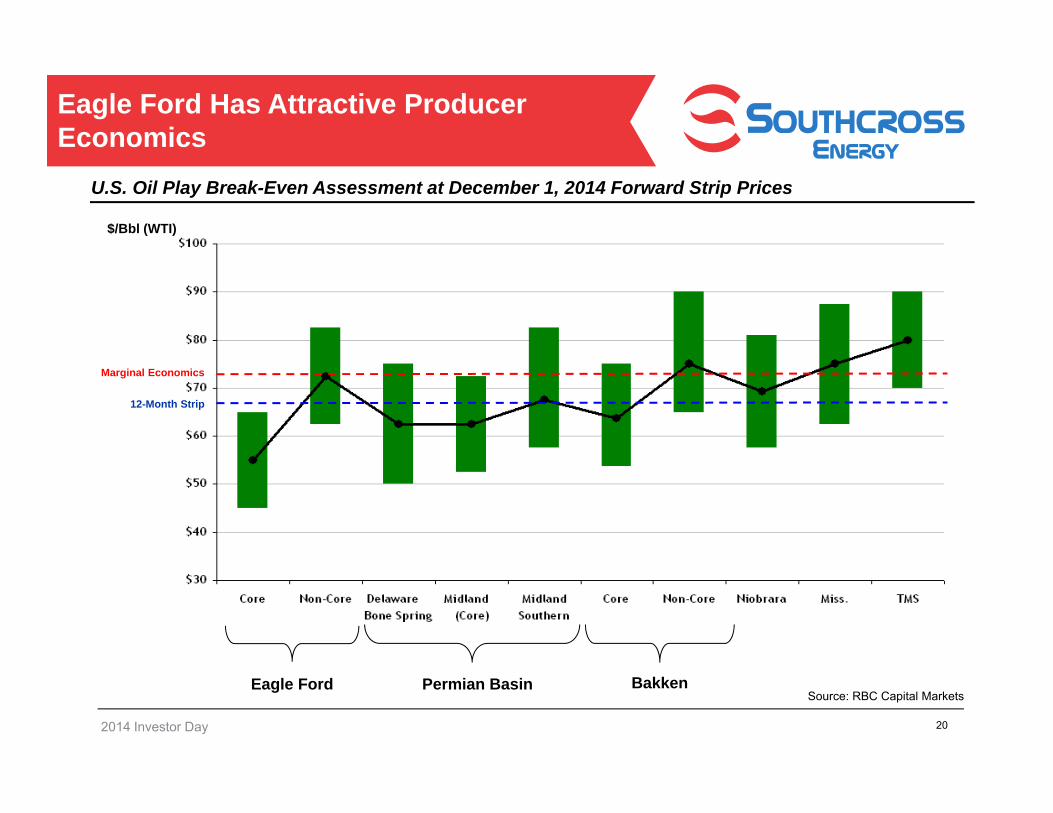
Eagle Ford Has Attractive Producer Economics
20
U.S. Oil Play Break-Even Assessment at December 1, 2014 Forward Strip Prices
Eagle Ford Permian Basin Bakken
Marginal Economics
12-Month Strip
$/Bbl (WTI)
Source: RBC Capital Markets
2014 Investor Day

2014 Investor Day
Volumetric Growth
Most Eagle Ford drilling since 2011 would have been economic under today’s lower oil prices
Eagle Ford Breakeven Price at 10% IRR
Note: All Horizontal wells drilled since 2011; assumes $7.5MM D&C in East Eagle Ford and $6.8MM D&C in West Eagle Ford and $4/MMBtu natural gas price. Breakeven cost estimated at 10% IRR.Source: BTU Analytics, LLC, Data as of November 1, 2014
Basin Total
21
Percentage of Wells by Operator with a Greater than 10% IRR
2014 Investor Day
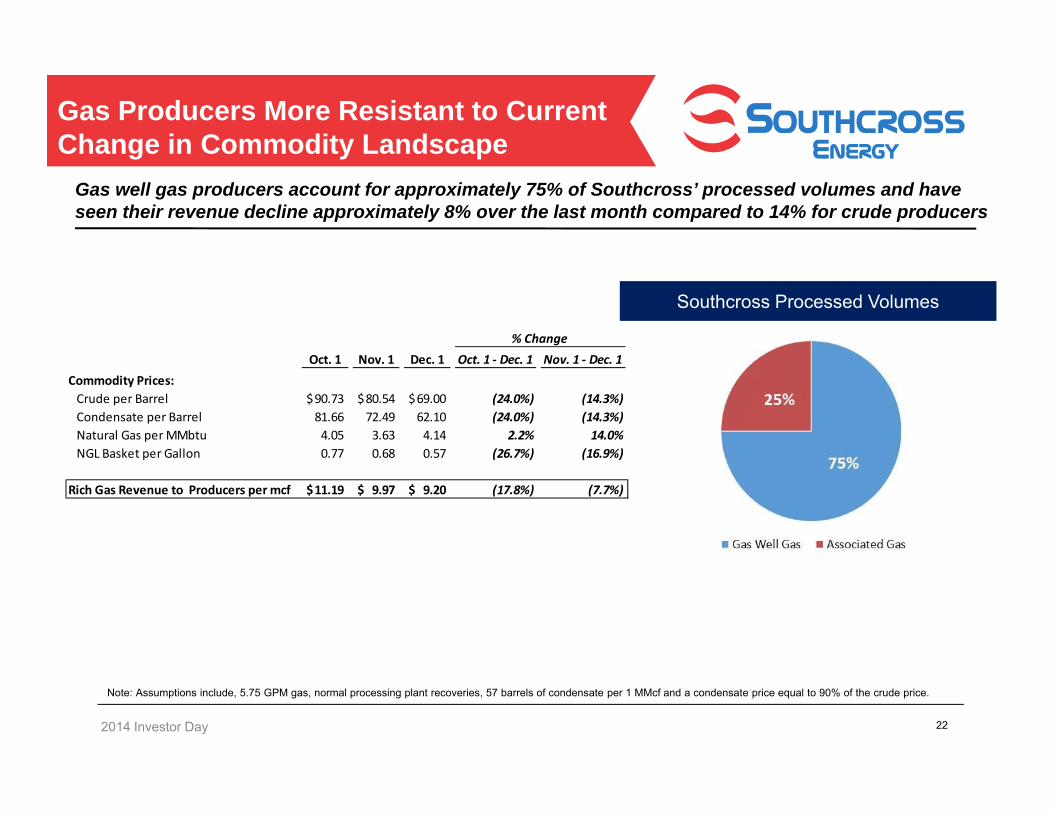
Gas Producers More Resistant to Current Change in Commodity Landscape
22
Gas well gas producers account for approximately 75% of Southcross’ processed volumes and have seen their revenue decline approximately 8% over the last month compared to 14% for crude producers
Southcross Processed Volumes
Note: Assumptions include, 5.75 GPM gas, normal processing plant recoveries, 57 barrels of condensate per 1 MMcf and a condensate price equal to 90% of the crude price.
% ChangeOct. 1 Nov. 1 Dec. 1 Oct. 1 ‐ Dec. 1 Nov. 1 ‐ Dec. 1
Commodity Prices:Crude per Barrel 90.73$ 80.54$ 69.00$ (24.0%) (14.3%)Condensate per Barrel 81.66 72.49 62.10 (24.0%) (14.3%)Natural Gas per MMbtu 4.05 3.63 4.14 2.2% 14.0%NGL Basket per Gallon 0.77 0.68 0.57 (26.7%) (16.9%)
Rich Gas Revenue to Producers per mcf 11.19$ 9.97$ 9.20$ (17.8%) (7.7%)

Operations and Strategy – John Bonn
2014 Investor Day
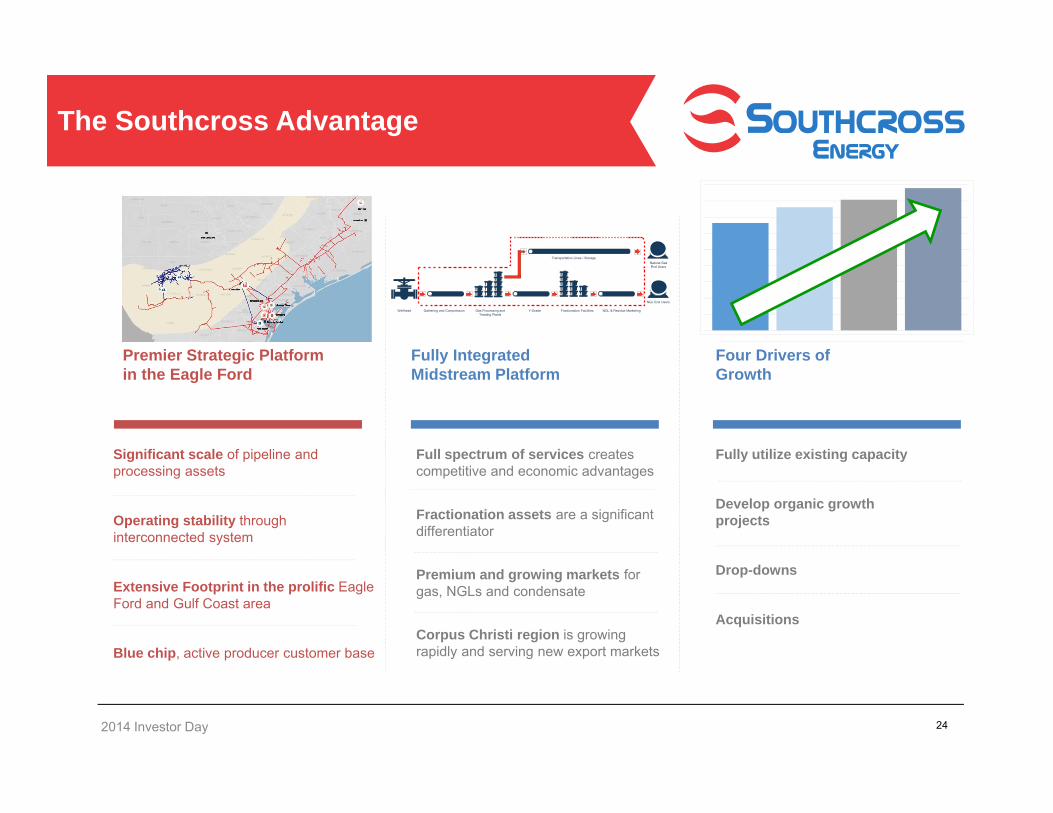
The Southcross Advantage
24
Significant scale of pipeline and processing assets
Operating stability through interconnected system
Extensive Footprint in the prolific Eagle Ford and Gulf Coast area
Blue chip, active producer customer base
Full spectrum of services creates competitive and economic advantages
Fractionation assets are a significant differentiator
Premium and growing markets for gas, NGLs and condensate
Corpus Christi region is growing rapidly and serving new export markets
Fully utilize existing capacity
Develop organic growth projects
Drop-downs
Acquisitions
Premier Strategic Platform in the Eagle Ford
Fully Integrated Midstream Platform
Four Drivers of Growth
Wellhead Gathering and Compression Gas Processing andTreating Plants
Y-Grade Fractionation Facilities
Natural GasEnd Users
Transportation Lines / Storage
NGL End Users
NGL & Residue Marketing
2014 Investor Day
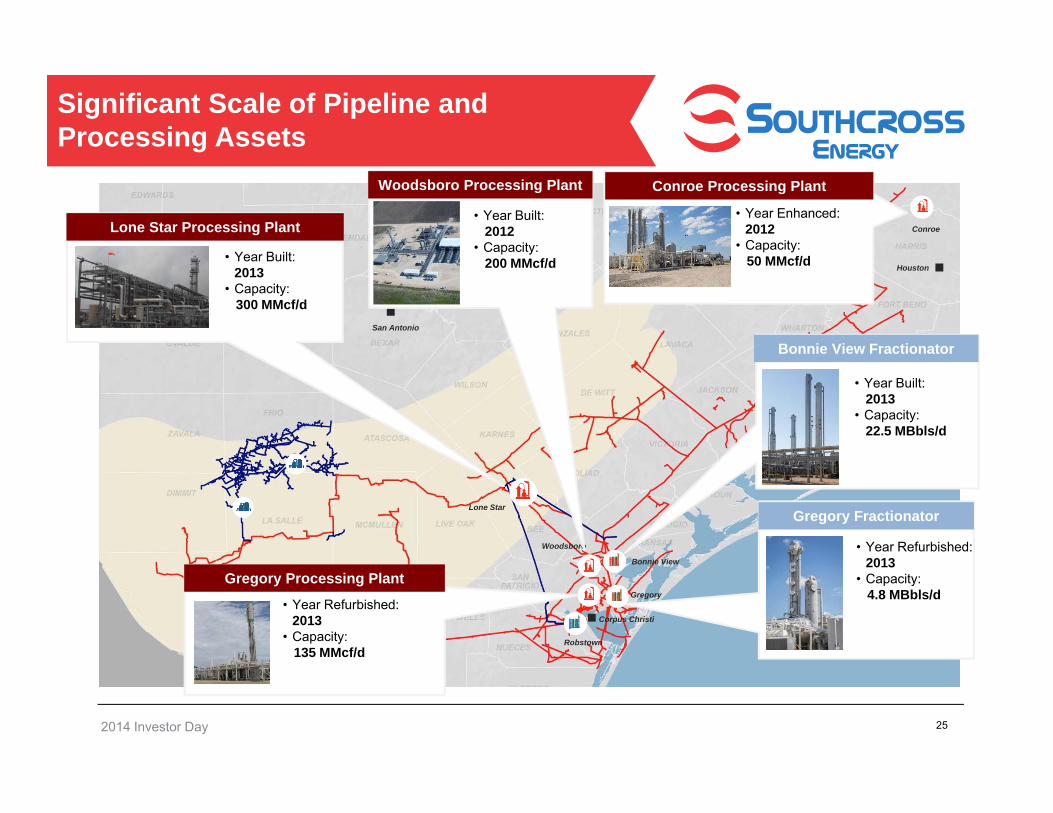
Significant Scale of Pipeline and Processing Assets
Corpus Christi
San Antonio
Houston
Conroe
Lone Star
Woodsboro
Bonnie View
Gregory
Robstown
o
• Year Built: 2012
• Capacity: 200 MMcf/d
Woodsboro Processing Plant
o
Lone Star Processing Plant
• Year Built: 2013
• Capacity: 300 MMcf/d
o
• Year Enhanced: 2012
• Capacity: 50 MMcf/d
Conroe Processing Plant
• Year Refurbished: 2013
• Capacity: 135 MMcf/d
Gregory Processing Plant
o
Bonnie View Fractionator
• Year Built: 2013
• Capacity: 22.5 MBbls/d
o
• Year Refurbished: 2013
• Capacity: 4.8 MBbls/d
Gregory Fractionator
25
2014 Investor Day
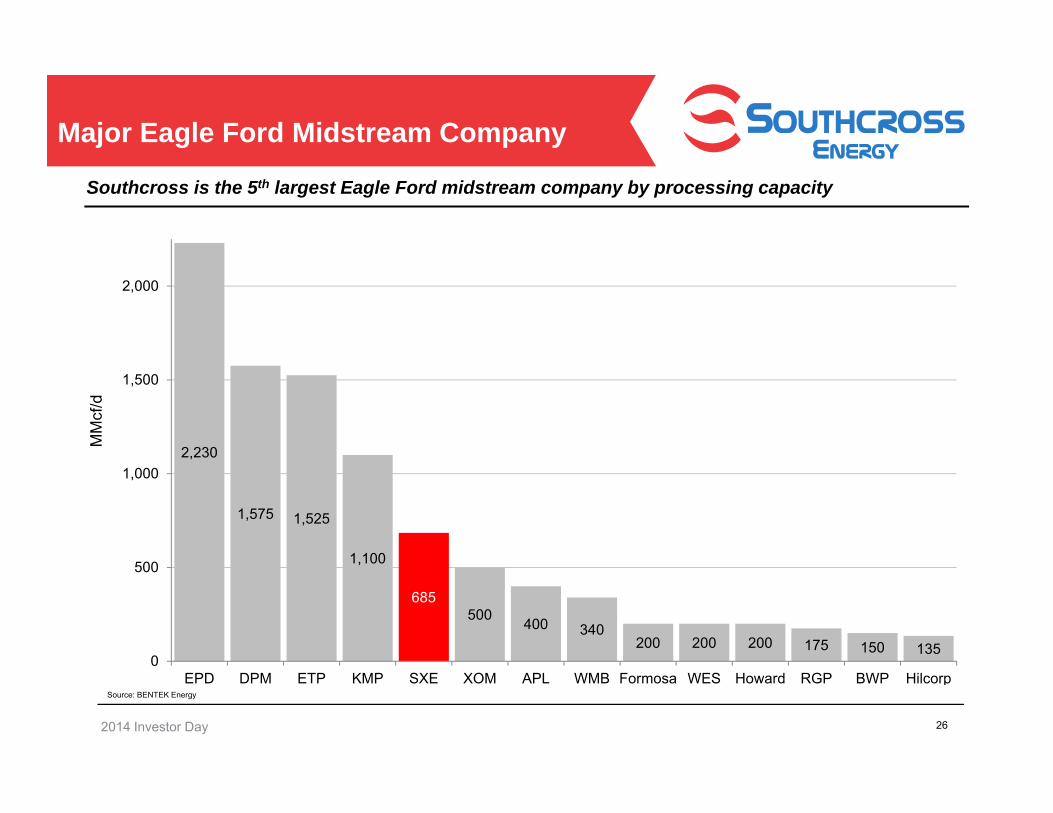
Source: BENTEK Energy
Major Eagle Ford Midstream Company
26
MM
cf/d
2,230
1,575 1,525
1,100
685500 400 340
200 200 200 175 150 1350
500
1,000
1,500
2,000
EPD DPM ETP KMP SXE XOM APL WMB Formosa WES Howard RGP BWP Hilcorp
Southcross is the 5th largest Eagle Ford midstream company by processing capacity
2014 Investor Day
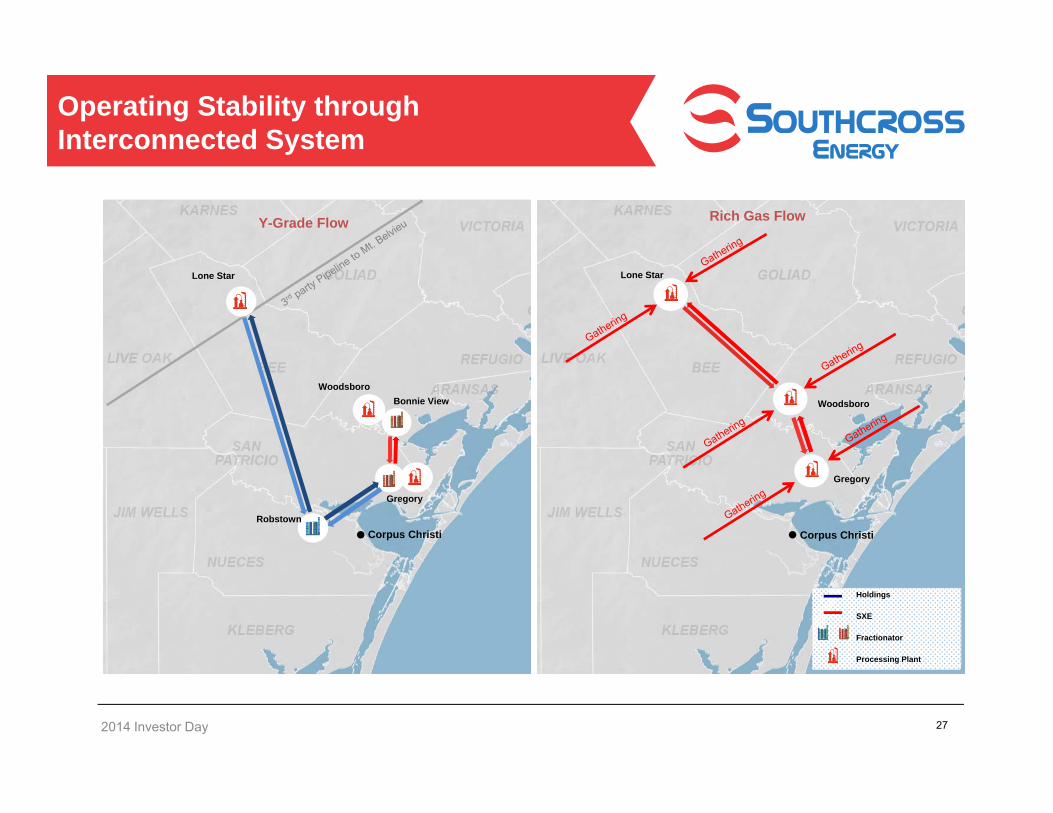
Operating Stability through Interconnected System
27
Gregory
RobstownCorpus Christi
Bonnie View Woodsboro
Gregory
Corpus Christi
Lone Star
Y-Grade Flow
Lone Star
Woodsboro
Rich Gas Flow
Holdings
SXE
Fractionator
Processing Plant
2014 Investor Day
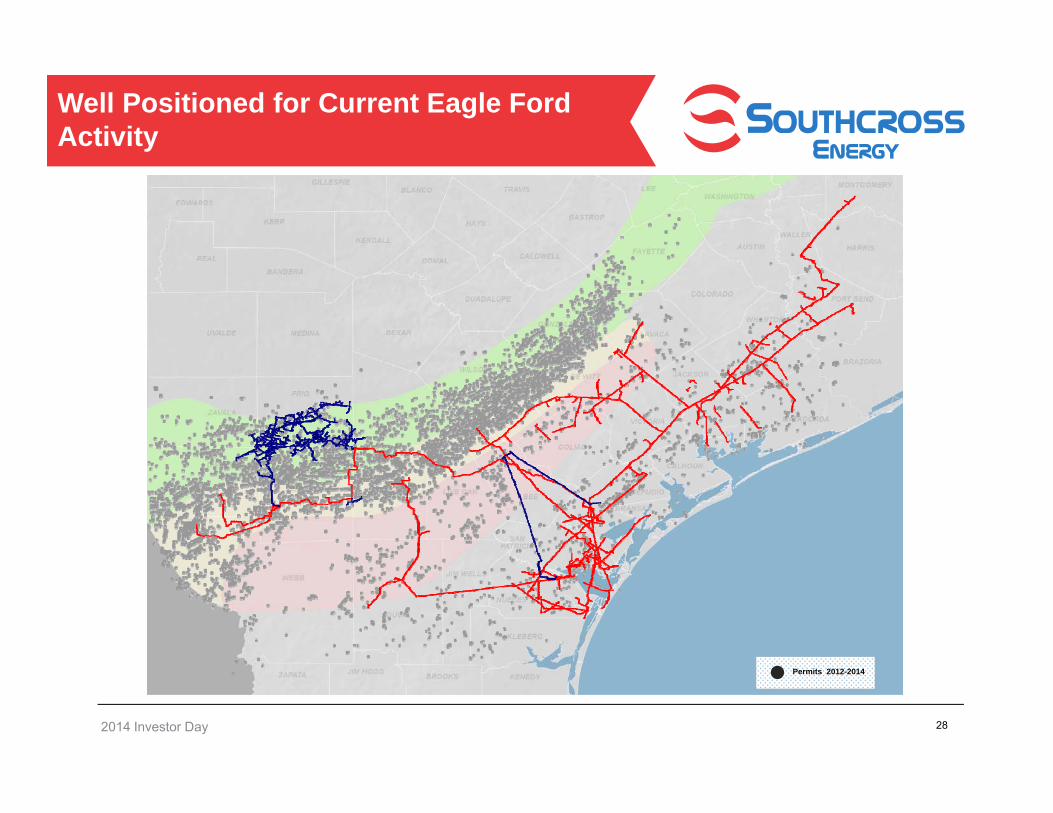
Well Positioned for Current Eagle Ford Activity
28
Permits 2012-2014
Request for Proposal Summary Proposed Contract and Deal Terms
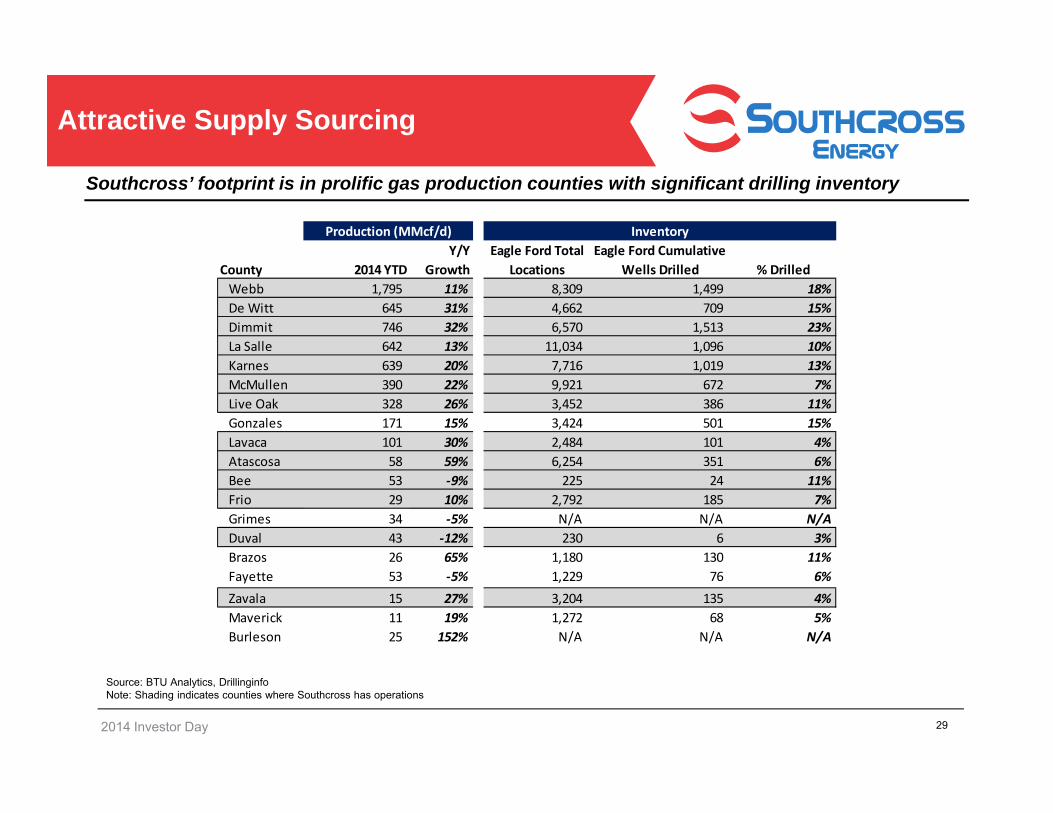
Attractive Supply Sourcing
29
Southcross’ footprint is in prolific gas production counties with significant drilling inventory
Source: BTU Analytics, DrillinginfoNote: Shading indicates counties where Southcross has operations
Production (MMcf/d) InventoryY/Y Eagle Ford Total Eagle Ford Cumulative
County 2014 YTD Growth Locations Wells Drilled % DrilledWebb 1,795 11% 8,309 1,499 18%De Witt 645 31% 4,662 709 15%Dimmit 746 32% 6,570 1,513 23%La Salle 642 13% 11,034 1,096 10%Karnes 639 20% 7,716 1,019 13%McMullen 390 22% 9,921 672 7%Live Oak 328 26% 3,452 386 11%Gonzales 171 15% 3,424 501 15%Lavaca 101 30% 2,484 101 4%Atascosa 58 59% 6,254 351 6%Bee 53 ‐9% 225 24 11%Frio 29 10% 2,792 185 7%Grimes 34 ‐5% N/A N/A N/ADuval 43 ‐12% 230 6 3%Brazos 26 65% 1,180 130 11%Fayette 53 ‐5% 1,229 76 6%Zavala 15 27% 3,204 135 4%Maverick 11 19% 1,272 68 5%Burleson 25 152% N/A N/A N/A
2014 Investor Day

Request for Proposal Summary Proposed Contract and Deal Terms
Lengthy Gas Supply Inventory in Eagle Ford
30
The major producing Eagle Ford counties have a weighted average inventory of 13 years
Source: BTU Analytics, Drillinginfo.Note: Production data listed is 2014 YTD average; years of inventory equals drilling locations divided by current pace of drilling.
746MMcf/d
1,795MMcf/d
642MMcf/d
639MMcf/d
645MMcf/d
390MMcf/d
171MMcf/d
328MMcf/d
58MMcf/d
29MMcf/d
2014 Investor Day

2014 Investor Day 31
Blue Chip Customer and Contract Base
Minimum Volume
Commitments44%
Acreage Dedications
39%
Captive Volumes
14%
Commodity Exposure
23%
Minimum volume commitments, acreage dedications and captive volumes should provide a solid and growing base of gas supply(1)
(1) Data from processed gas volumes for the Q4 guidance range.
Other3%

2014 Investor Day
‐
50
100
150
200
250
300
350
400
450
500
Q1 Q2 Q3 Q4 Q1 Q2 Q3 Q4 Q1 Q2 Q3 Q4 Q1 Q2 Q3 Oct.
Rapid Growth of Southcross Processed Gas Volumes
32
Average Processed Gas Volumes (MMBtu/d)
29% Organic CAGR (excluding acquisition)
38% compound annual growth rate in average daily processed gas volumes since 2011
2011 2012 2013 2014
2014 Investor Day
Focus on Eagle Ford Region
33
Karnes / De Witt RegionFrio / La Salle
Region
Webb / Dimmit Region
McMullen Region
Corpus Christi Region
2014 Investor Day
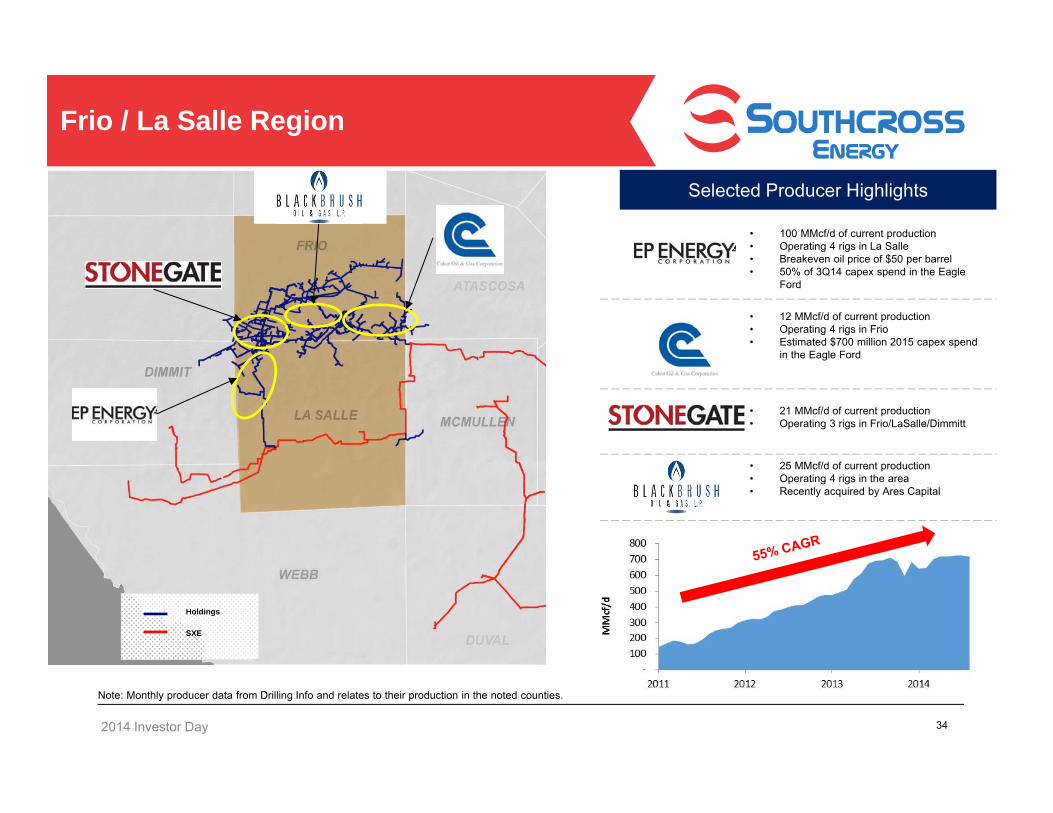
Frio / La Salle Region
34
Selected Producer Highlights
• 100 MMcf/d of current production• Operating 4 rigs in La Salle • Breakeven oil price of $50 per barrel• 50% of 3Q14 capex spend in the Eagle
Ford
• 12 MMcf/d of current production• Operating 4 rigs in Frio• Estimated $700 million 2015 capex spend
in the Eagle Ford
Holdings
SXE
• 21 MMcf/d of current production• Operating 3 rigs in Frio/LaSalle/Dimmitt
• 25 MMcf/d of current production• Operating 4 rigs in the area• Recently acquired by Ares Capital
Note: Monthly producer data from Drilling Info and relates to their production in the noted counties.
2014 Investor Day
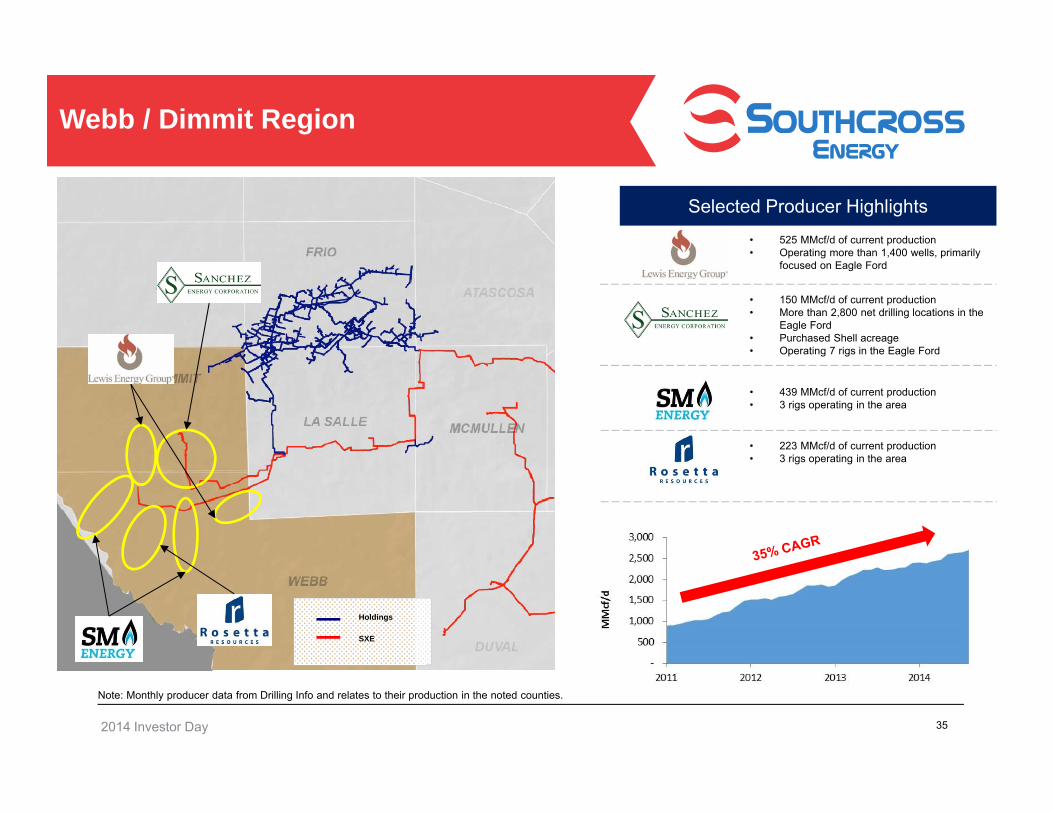
Webb / Dimmit Region
35
Selected Producer Highlights• 525 MMcf/d of current production• Operating more than 1,400 wells, primarily
focused on Eagle Ford
• 150 MMcf/d of current production• More than 2,800 net drilling locations in the
Eagle Ford• Purchased Shell acreage• Operating 7 rigs in the Eagle Ford
• 439 MMcf/d of current production• 3 rigs operating in the area
• 223 MMcf/d of current production• 3 rigs operating in the area
Holdings
SXE
Note: Monthly producer data from Drilling Info and relates to their production in the noted counties.
2014 Investor Day
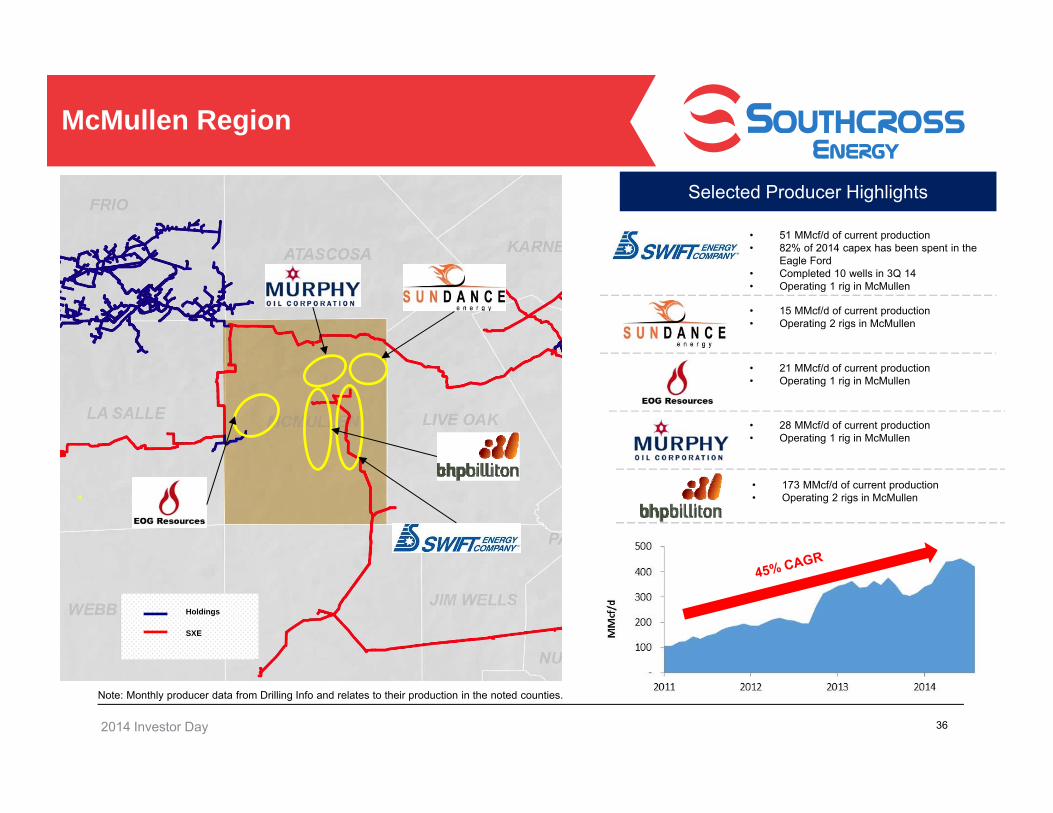
McMullen Region
36
Selected Producer Highlights
• 51 MMcf/d of current production• 82% of 2014 capex has been spent in the
Eagle Ford• Completed 10 wells in 3Q 14• Operating 1 rig in McMullen
• 15 MMcf/d of current production• Operating 2 rigs in McMullen
• 21 MMcf/d of current production• Operating 1 rig in McMullen
• 28 MMcf/d of current production• Operating 1 rig in McMullen
Holdings
SXE
• 173 MMcf/d of current production• Operating 2 rigs in McMullen
Note: Monthly producer data from Drilling Info and relates to their production in the noted counties.
2014 Investor Day
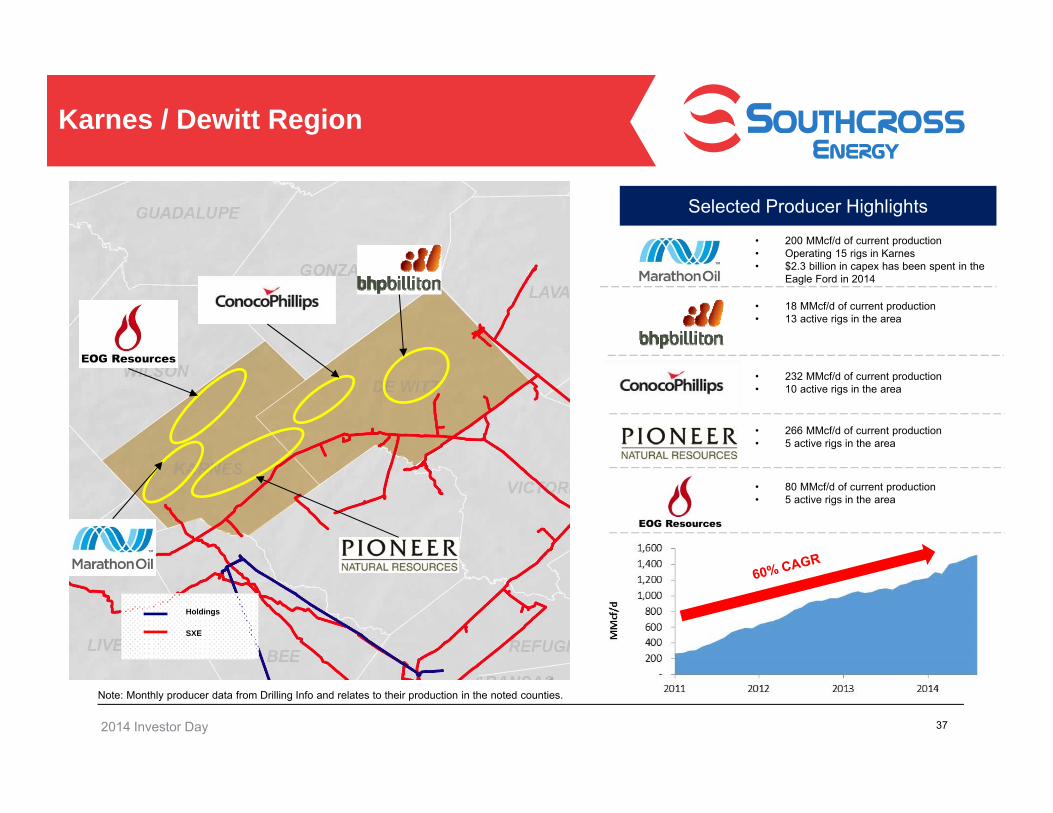
Karnes / Dewitt Region
37
Selected Producer Highlights
• 200 MMcf/d of current production• Operating 15 rigs in Karnes• $2.3 billion in capex has been spent in the
Eagle Ford in 2014
• 18 MMcf/d of current production• 13 active rigs in the area
• 232 MMcf/d of current production• 10 active rigs in the area
• 266 MMcf/d of current production• 5 active rigs in the area
Holdings
SXE
• 80 MMcf/d of current production• 5 active rigs in the area
Note: Monthly producer data from Drilling Info and relates to their production in the noted counties.
2014 Investor Day
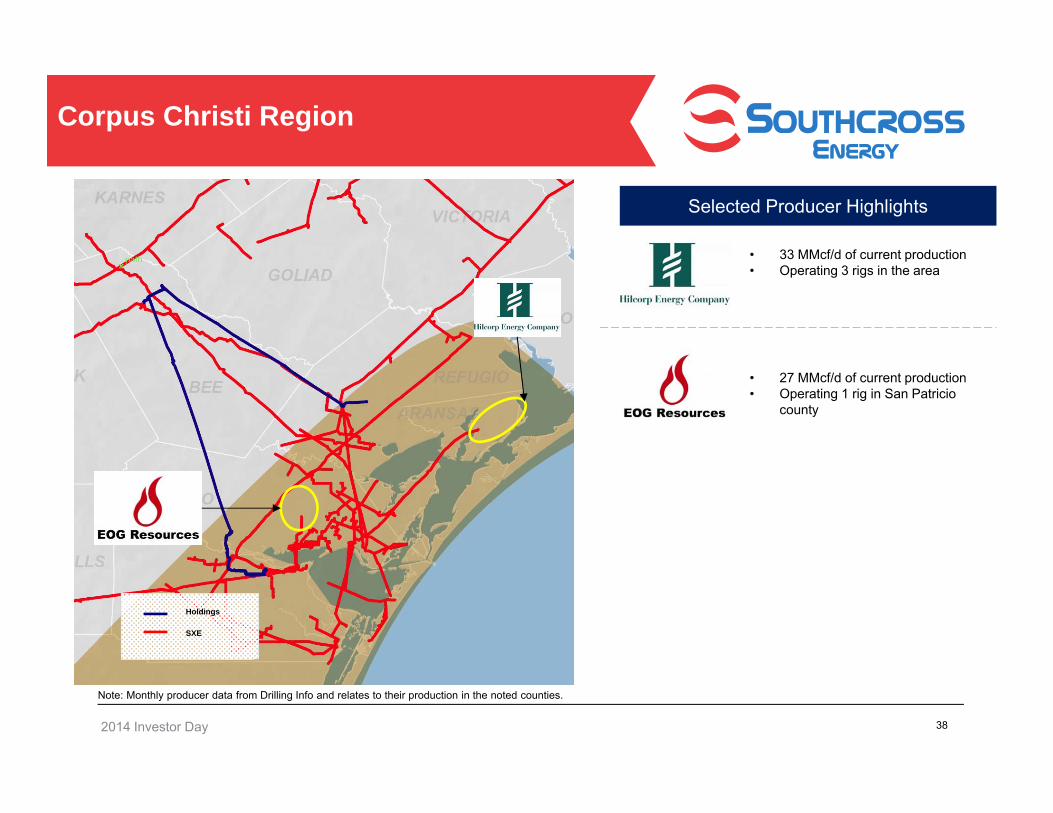
Corpus Christi Region
38
Selected Producer Highlights
• 33 MMcf/d of current production• Operating 3 rigs in the area
• 27 MMcf/d of current production• Operating 1 rig in San Patricio
county
Holdings
SXE
Note: Monthly producer data from Drilling Info and relates to their production in the noted counties.
2014 Investor Day
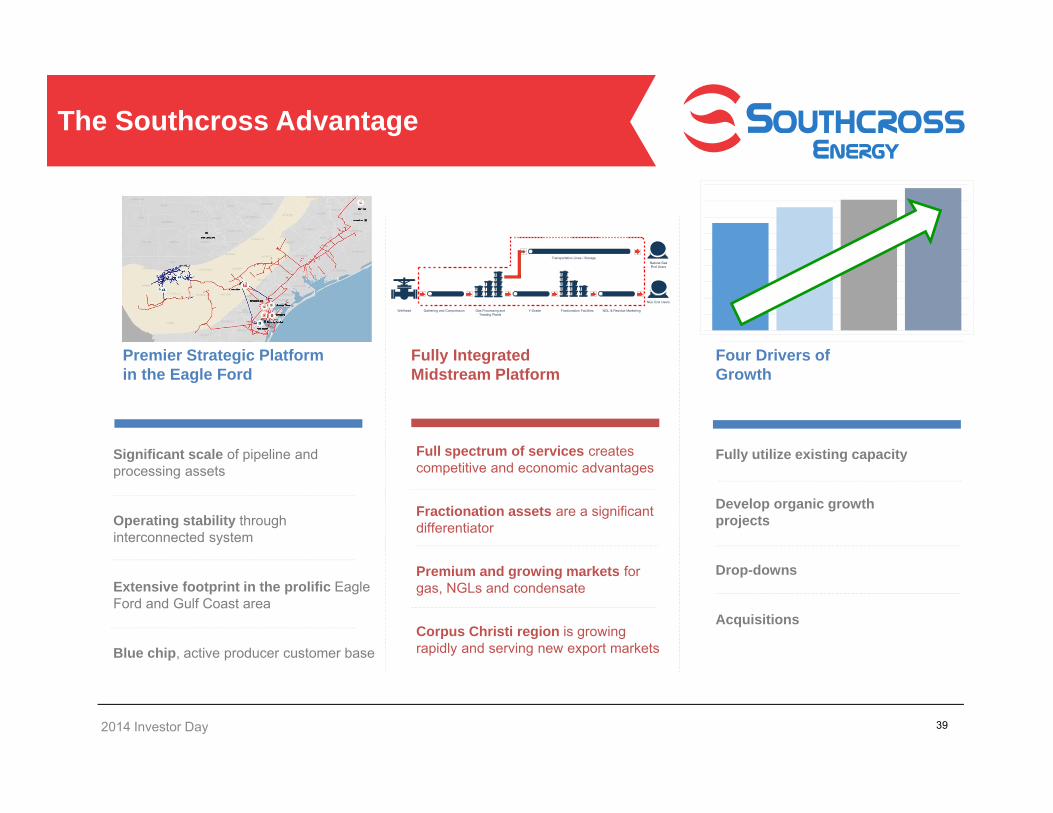
The Southcross Advantage
39
Significant scale of pipeline and processing assets
Operating stability through interconnected system
Extensive footprint in the prolific Eagle Ford and Gulf Coast area
Blue chip, active producer customer base
Full spectrum of services creates competitive and economic advantages
Fractionation assets are a significant differentiator
Premium and growing markets for gas, NGLs and condensate
Corpus Christi region is growing rapidly and serving new export markets
Fully utilize existing capacity
Develop organic growth projects
Drop-downs
Acquisitions
Premier Strategic Platform in the Eagle Ford
Fully Integrated Midstream Platform
Four Drivers of Growth
Wellhead Gathering and Compression Gas Processing andTreating Plants
Y-Grade Fractionation Facilities
Natural GasEnd Users
Transportation Lines / Storage
NGL End Users
NGL & Residue Marketing
2014 Investor Day
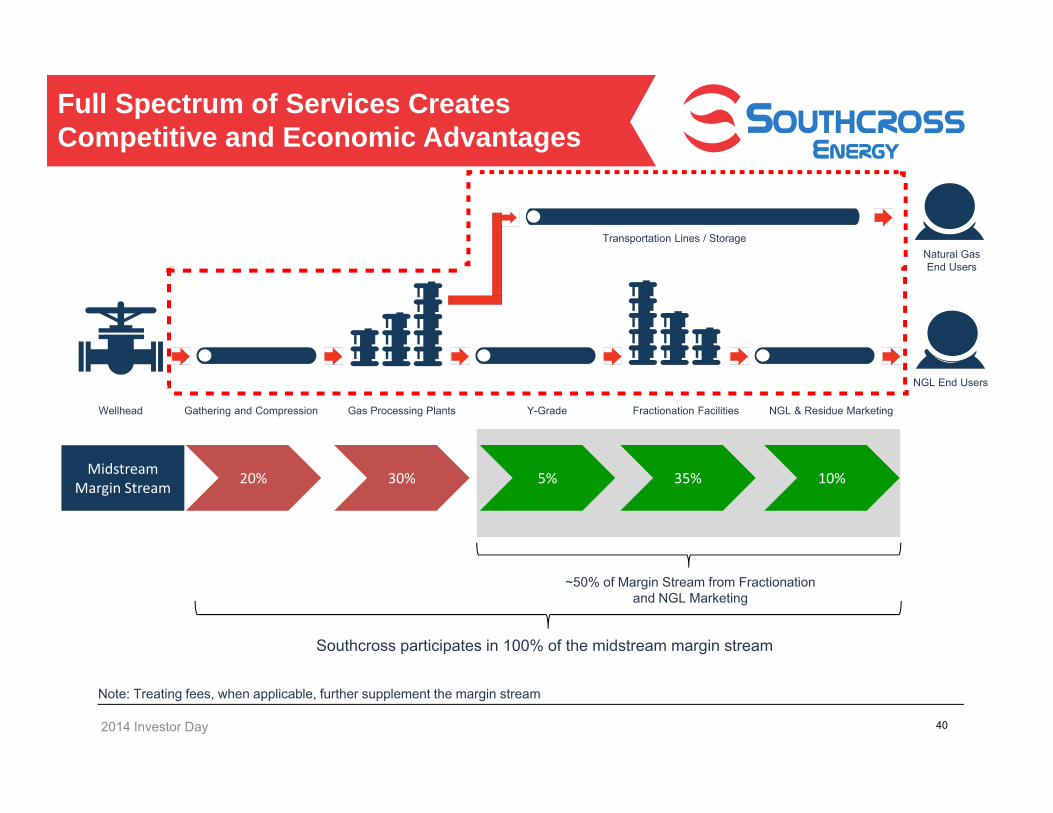
Full Spectrum of Services Creates Competitive and Economic Advantages
40
Wellhead Gathering and Compression Gas Processing Plants Y-Grade Fractionation Facilities
Natural GasEnd Users
Transportation Lines / Storage
NGL End Users
NGL & Residue Marketing
20% 30% 5% 35% 10%Midstream Margin Stream
Southcross participates in 100% of the midstream margin stream
~50% of Margin Stream from Fractionation and NGL Marketing
Note: Treating fees, when applicable, further supplement the margin stream

2014 Investor Day
Fractionation Assets Create a Significant Service and Margin Advantage
• Fractionation increases the full value service offering enabling Southcross to achieve higher margins and be more competitive winning new gas supply
• Wellhead to end-use NGL marketing provides convenience to producers by avoiding the need to negotiate multiple long term transportation and fractionation agreements and provides a secure off-take for NGLs
• The location of Southcross’ fractionators in Corpus Christi enables producers to avoid bottlenecks at Mt. Belvieu, reduces transport costs and provides direct access to end-use markets and key export facilities
Bonnie View & Gregory27,300 Bbls/d
Robstown63,000 Bbls/d
41
Fractionation Capacity
Request for Proposal Summary Proposed Contract and Deal Terms
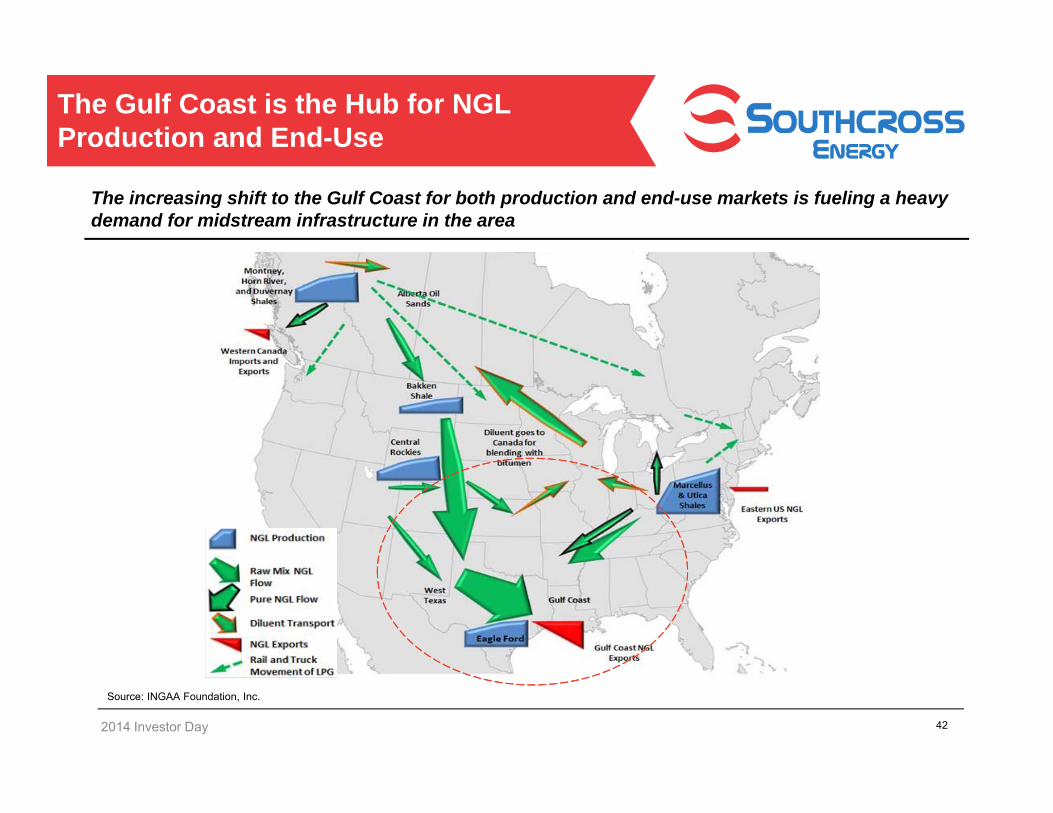
The Gulf Coast is the Hub for NGL Production and End-Use
42
The increasing shift to the Gulf Coast for both production and end-use markets is fueling a heavy demand for midstream infrastructure in the area
Source: INGAA Foundation, Inc.
2014 Investor Day
2014 Investor Day
-
0.2
0.4
0.6
0.8
1.0
1.2
1.4
1.6
1.8
Jan-09 Jan-10 Jan-11 Jan-12 Jan-13 Jan-14
Avg. Weekly Production Avg. Weekly Exports
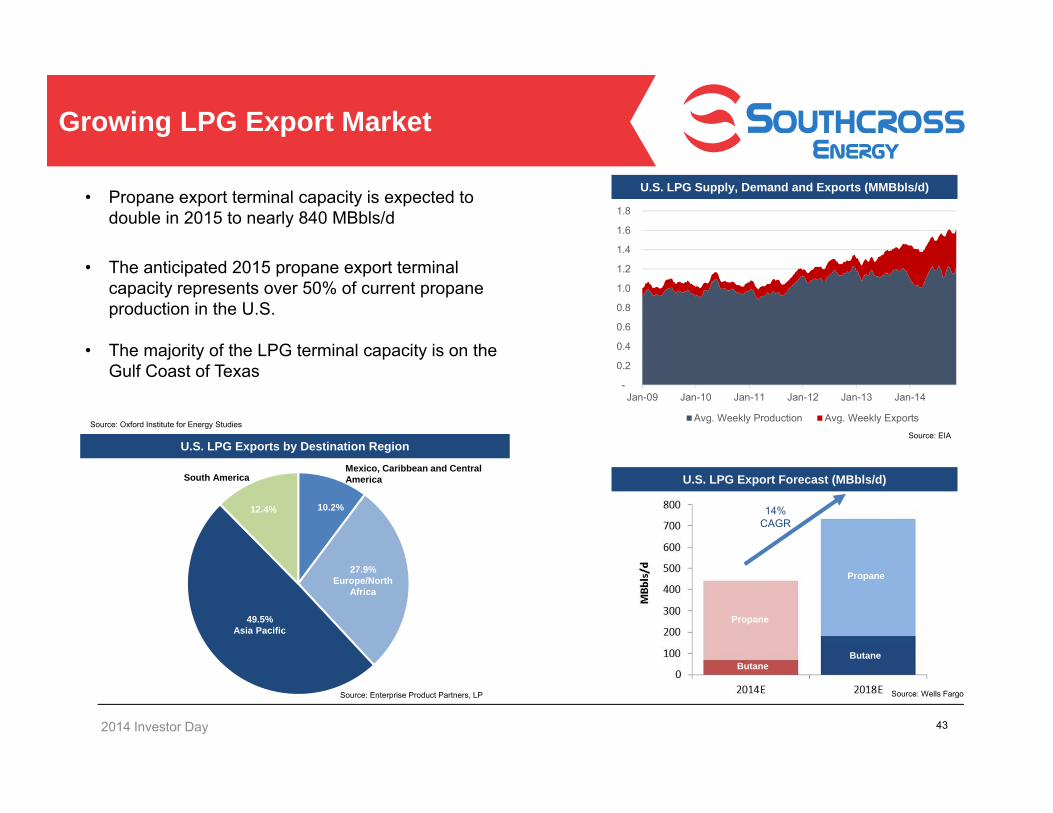
Growing LPG Export Market
43
• Propane export terminal capacity is expected to double in 2015 to nearly 840 MBbls/d
• The anticipated 2015 propane export terminal capacity represents over 50% of current propane production in the U.S.
• The majority of the LPG terminal capacity is on the Gulf Coast of Texas
Source: EIASource: Oxford Institute for Energy Studies
49.5% Asia Pacific
27.9% Europe/North
Africa
10.2%12.4%
South AmericaMexico, Caribbean and Central America
U.S. LPG Exports by Destination Region
Source: Enterprise Product Partners, LP
U.S. LPG Supply, Demand and Exports (MMBbls/d)
U.S. LPG Export Forecast (MBbls/d)
Propane
Propane
ButaneButane
14% CAGR
Source: Wells Fargo
Source: Oxford Institute for Energy Studies
Request for Proposal Summary Proposed Contract and Deal Terms
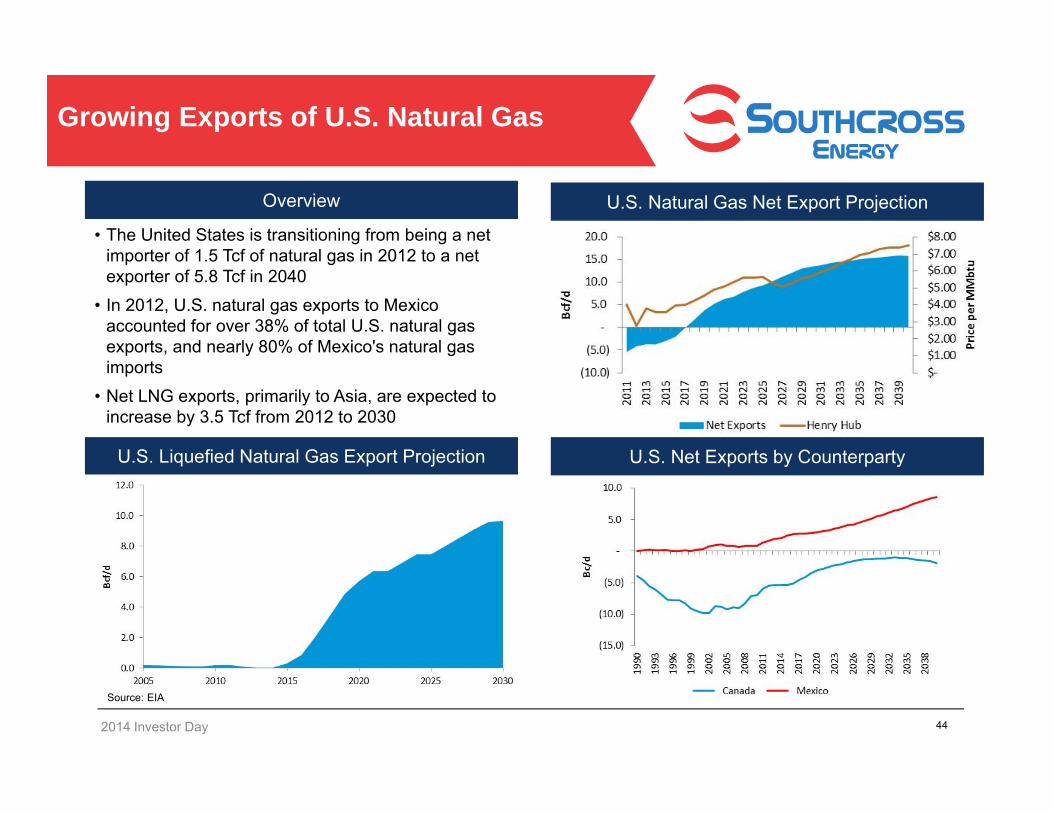
Growing Exports of U.S. Natural Gas
44
Source: EIA
• The United States is transitioning from being a net importer of 1.5 Tcf of natural gas in 2012 to a net exporter of 5.8 Tcf in 2040
• In 2012, U.S. natural gas exports to Mexico accounted for over 38% of total U.S. natural gas exports, and nearly 80% of Mexico's natural gas imports
• Net LNG exports, primarily to Asia, are expected to increase by 3.5 Tcf from 2012 to 2030
U.S. Liquefied Natural Gas Export Projection U.S. Net Exports by Counterparty
Overview U.S. Natural Gas Net Export Projection
2014 Investor Day
2014 Investor Day
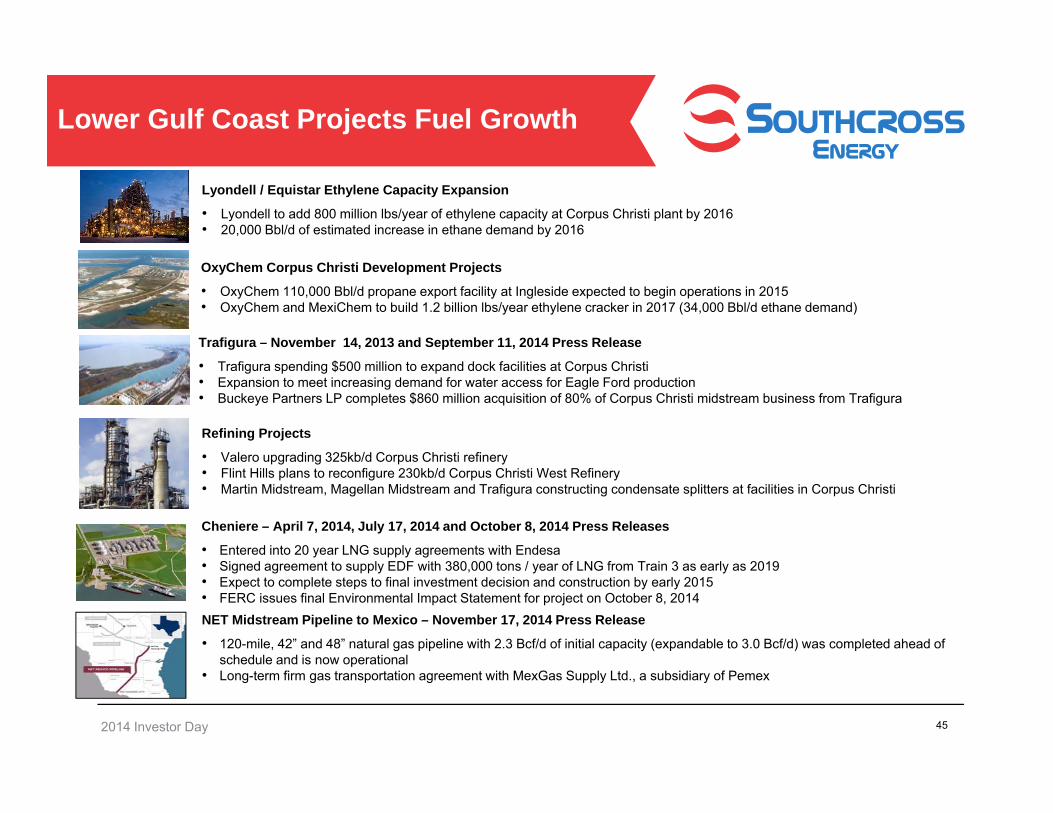
Refining Projects
• Valero upgrading 325kb/d Corpus Christi refinery• Flint Hills plans to reconfigure 230kb/d Corpus Christi West Refinery• Martin Midstream, Magellan Midstream and Trafigura constructing condensate splitters at facilities in Corpus Christi
Lyondell / Equistar Ethylene Capacity Expansion
• Lyondell to add 800 million lbs/year of ethylene capacity at Corpus Christi plant by 2016• 20,000 Bbl/d of estimated increase in ethane demand by 2016
Cheniere – April 7, 2014, July 17, 2014 and October 8, 2014 Press Releases
• Entered into 20 year LNG supply agreements with Endesa• Signed agreement to supply EDF with 380,000 tons / year of LNG from Train 3 as early as 2019• Expect to complete steps to final investment decision and construction by early 2015• FERC issues final Environmental Impact Statement for project on October 8, 2014
Trafigura – November 14, 2013 and September 11, 2014 Press Release
• Trafigura spending $500 million to expand dock facilities at Corpus Christi• Expansion to meet increasing demand for water access for Eagle Ford production• Buckeye Partners LP completes $860 million acquisition of 80% of Corpus Christi midstream business from Trafigura
NET Midstream Pipeline to Mexico – November 17, 2014 Press Release
• 120-mile, 42” and 48” natural gas pipeline with 2.3 Bcf/d of initial capacity (expandable to 3.0 Bcf/d) was completed ahead of schedule and is now operational
• Long-term firm gas transportation agreement with MexGas Supply Ltd., a subsidiary of Pemex
45
Lower Gulf Coast Projects Fuel Growth
OxyChem Corpus Christi Development Projects
• OxyChem 110,000 Bbl/d propane export facility at Ingleside expected to begin operations in 2015• OxyChem and MexiChem to build 1.2 billion lbs/year ethylene cracker in 2017 (34,000 Bbl/d ethane demand)
2014 Investor Day
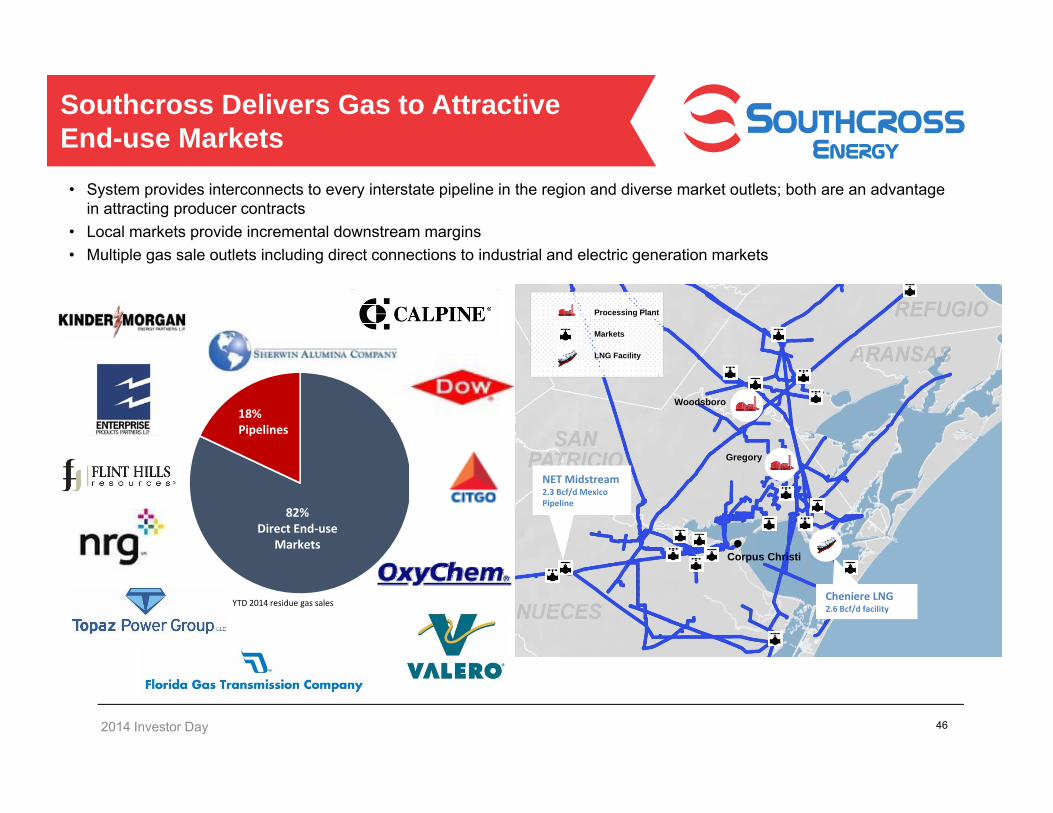
• System provides interconnects to every interstate pipeline in the region and diverse market outlets; both are an advantage in attracting producer contracts
• Local markets provide incremental downstream margins• Multiple gas sale outlets including direct connections to industrial and electric generation markets
Southcross Delivers Gas to Attractive End-use Markets
46
YTD 2014 residue gas sales
82% Direct End‐use
Markets
18% Pipelines
Corpus Christi
Woodsboro
Gregory
NET Midstream2.3 Bcf/d Mexico Pipeline
Cheniere LNG 2.6 Bcf/d facility
Processing Plant
Markets
LNG Facility
2014 Investor Day
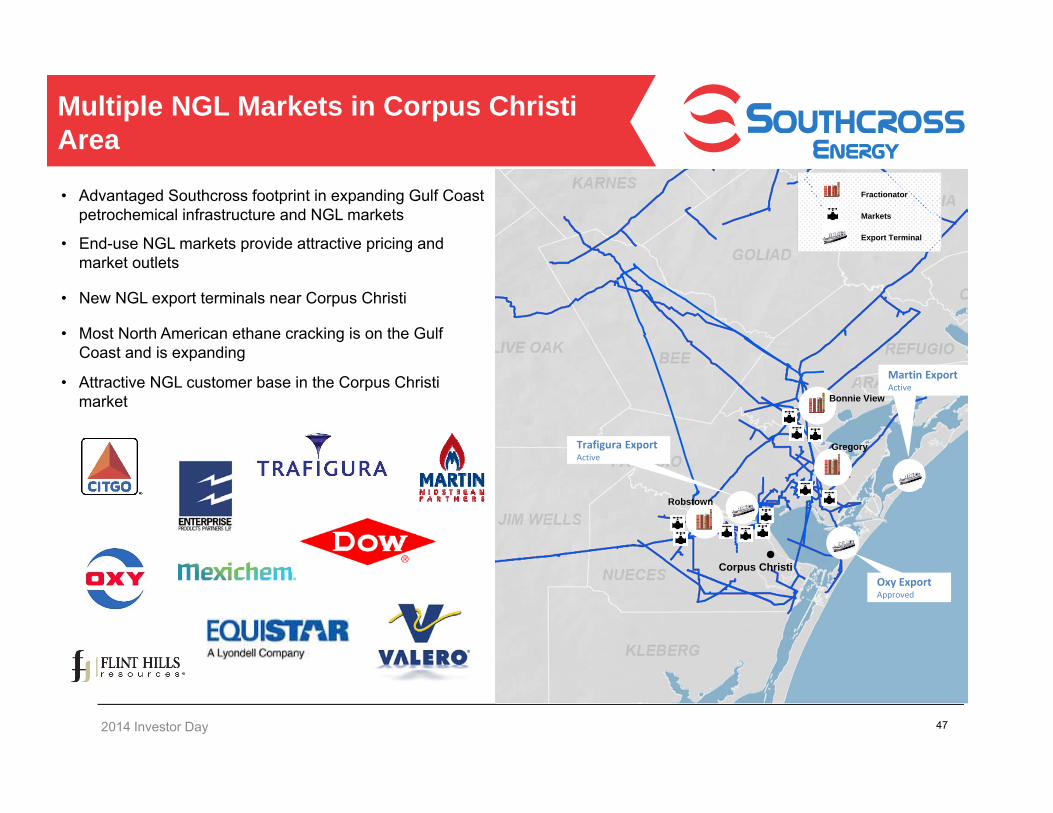
Multiple NGL Markets in Corpus Christi Area
47
Corpus Christi
Fractionator
Markets
Export Terminal
Bonnie View
GregoryTrafigura ExportActive
Oxy ExportApproved
Martin ExportActive
Robstown
• Advantaged Southcross footprint in expanding Gulf Coast petrochemical infrastructure and NGL markets
• End-use NGL markets provide attractive pricing and market outlets
• New NGL export terminals near Corpus Christi
• Most North American ethane cracking is on the Gulf Coast and is expanding
• Attractive NGL customer base in the Corpus Christi market
2014 Investor Day
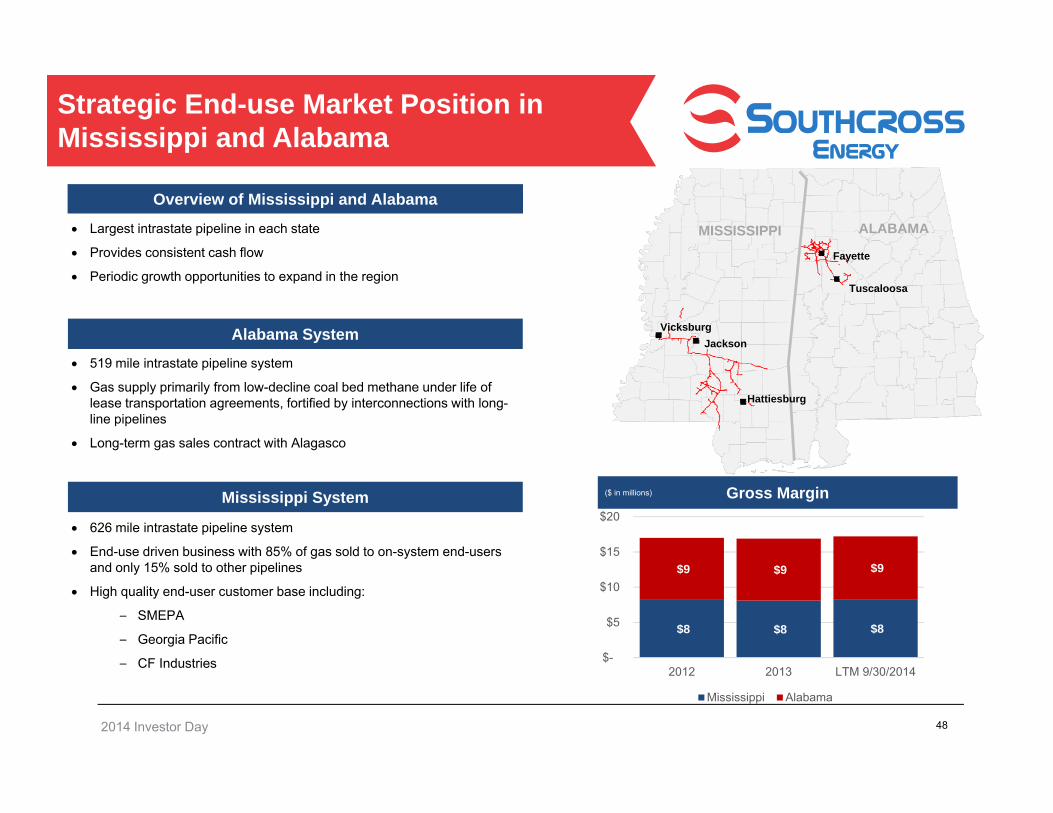
Strategic End-use Market Position in Mississippi and Alabama
48
Gross Margin
($ in millions)
$8 $8 $8
$9 $9 $9
$-
$5
$10
$15
$20
2012 2013 LTM 9/30/2014
Mississippi Alabama
($ in millions)Mississippi System
626 mile intrastate pipeline system
End-use driven business with 85% of gas sold to on-system end-users and only 15% sold to other pipelines
High quality end-user customer base including:
– SMEPA
– Georgia Pacific
– CF Industries
Alabama System
519 mile intrastate pipeline system
Gas supply primarily from low-decline coal bed methane under life of lease transportation agreements, fortified by interconnections with long-line pipelines
Long-term gas sales contract with Alagasco
Overview of Mississippi and Alabama
Largest intrastate pipeline in each state
Provides consistent cash flow
Periodic growth opportunities to expand in the region
VicksburgJackson
MISSISSIPPIFayette
Tuscaloosa
ALABAMA
Hattiesburg
2014 Investor Day
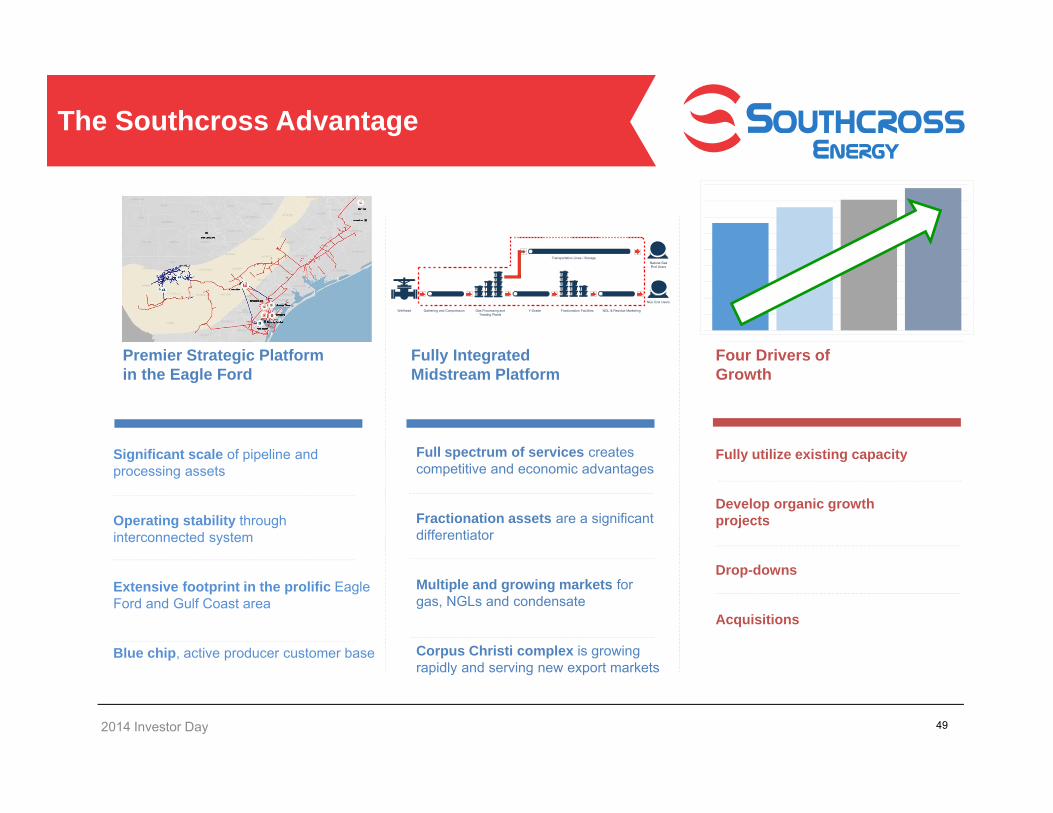
The Southcross Advantage
49
Significant scale of pipeline and processing assets
Operating stability through interconnected system
Extensive footprint in the prolific Eagle Ford and Gulf Coast area
Blue chip, active producer customer base
Full spectrum of services creates competitive and economic advantages
Fractionation assets are a significant differentiator
Multiple and growing markets for gas, NGLs and condensate
Corpus Christi complex is growing rapidly and serving new export markets
Fully utilize existing capacity
Develop organic growth projects
Drop-downs
Acquisitions
Premier Strategic Platform in the Eagle Ford
Fully Integrated Midstream Platform
Four Drivers of Growth
Wellhead Gathering and Compression Gas Processing andTreating Plants
Y-Grade Fractionation Facilities
Natural GasEnd Users
Transportation Lines / Storage
NGL End Users
NGL & Residue Marketing
2014 Investor Day
0
50
100
150
200
250
300
350
400
450
500
550
600
650
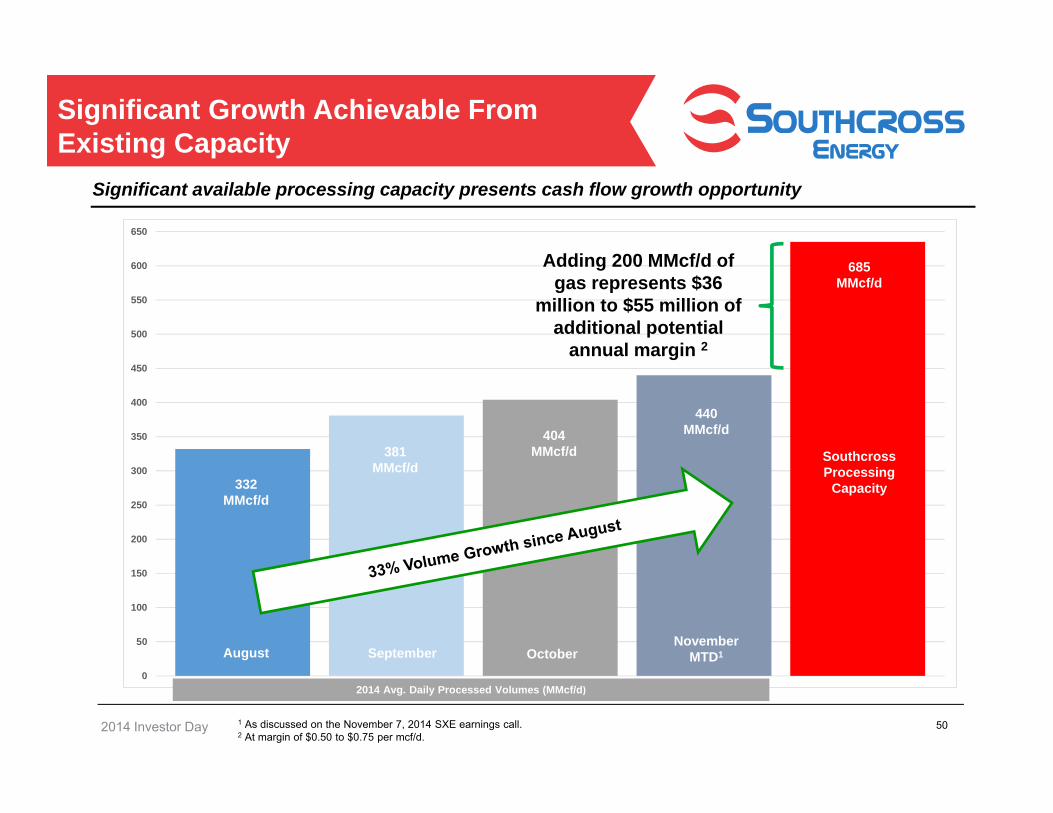
Significant Growth Achievable From Existing Capacity
50
332 MMcf/d
381 MMcf/d
404 MMcf/d
440 MMcf/d
August September OctoberNovember
MTD1
Southcross Processing
Capacity
685 MMcf/d
1 As discussed on the November 7, 2014 SXE earnings call.2 At margin of $0.50 to $0.75 per mcf/d.
Significant available processing capacity presents cash flow growth opportunity
Adding 200 MMcf/d of gas represents $36
million to $55 million of additional potential
annual margin 2
2014 Avg. Daily Processed Volumes (MMcf/d)
2014 Investor Day
‐
10
20
30
40
50
60
70
80
90
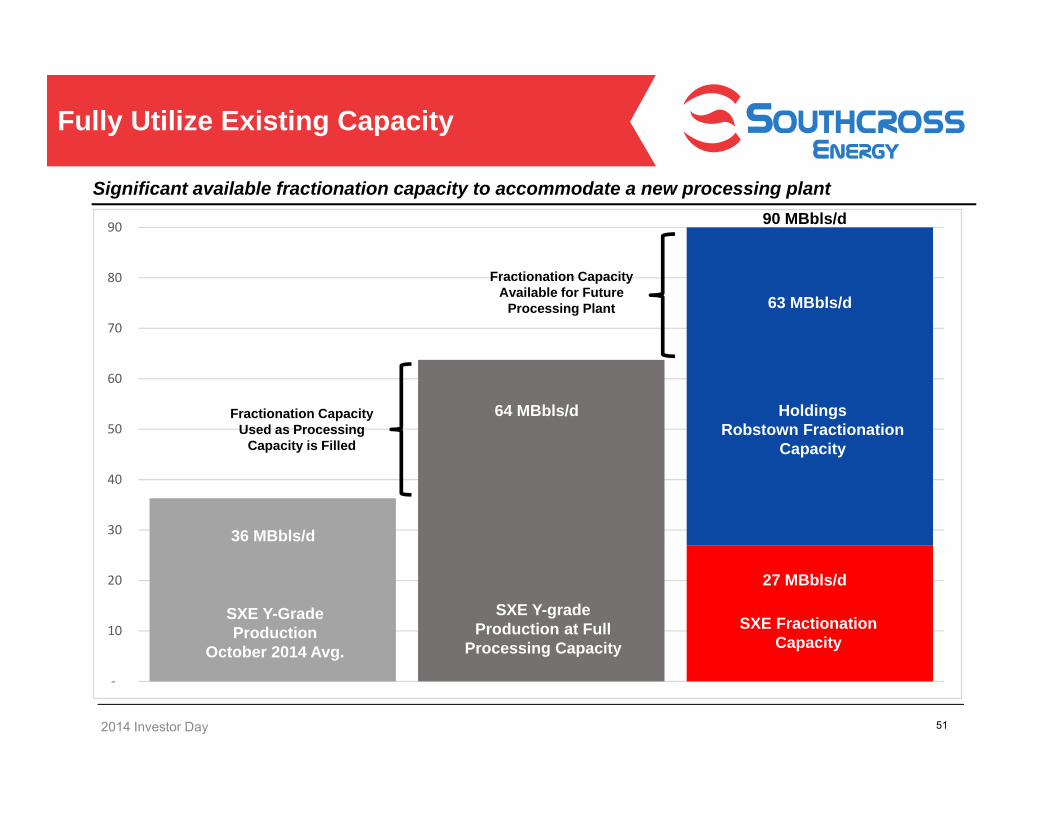
Fully Utilize Existing Capacity
51
SXE Y-Grade Production
October 2014 Avg.
36 MBbls/d
SXE Y-grade Production at Full
Processing Capacity
64 MBbls/d
SXE Fractionation Capacity
27 MBbls/d
63 MBbls/d
Holdings Robstown Fractionation
Capacity
90 MBbls/d
Significant available fractionation capacity to accommodate a new processing plant
Fractionation Capacity Used as Processing
Capacity is Filled
Fractionation Capacity Available for Future
Processing Plant
2014 Investor Day
• Business Development team is focused on:
o Full utilization of existing asset processing and fractionation facilities
o Adding to rich gas network to accelerate growth
o Optimization of extensive pipeline and asset base in South Texas
• Currently pursuing projects including:
o Repurposing pipelines for higher value uses of crude and condensate transports
o Exploiting NGL position to add NGL pipeline transportation services
o Serving new gas and NGL export opportunities
Develop Organic Growth Projects
52
The Southcross business development team has been enhanced through the TexStar combination and possesses experienced and talented professionals
2014 Investor Day
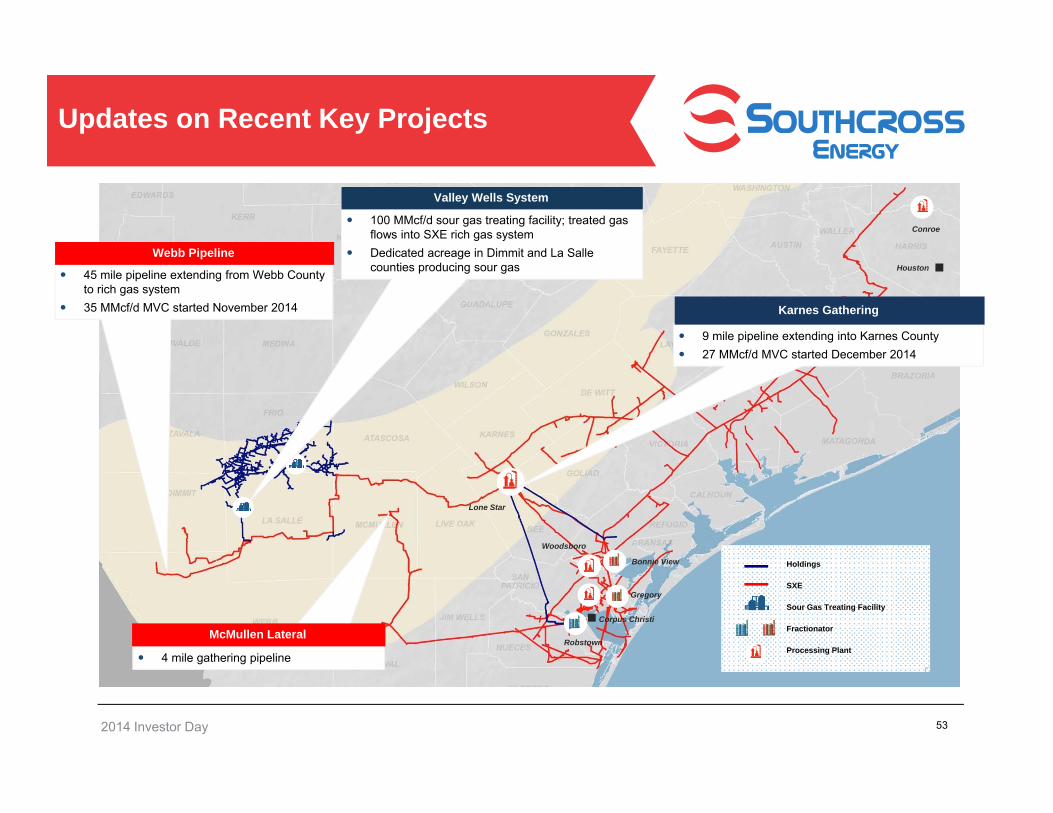
Updates on Recent Key Projects
53
Corpus Christi
San Antonio
Houston
Conroe
Lone Star
Woodsboro
Bonnie View
Gregory
Robstown
45 mile pipeline extending from Webb County to rich gas system
35 MMcf/d MVC started November 2014
Webb Pipeline
100 MMcf/d sour gas treating facility; treated gas flows into SXE rich gas system
Dedicated acreage in Dimmit and La Salle counties producing sour gas
Valley Wells System
4 mile gathering pipeline
McMullen Lateral
9 mile pipeline extending into Karnes County 27 MMcf/d MVC started December 2014
Karnes Gathering
Holdings
SXE
Sour Gas Treating Facility
Fractionator
Processing Plant
2014 Investor Day
Growth Through Acquisitions
54
Near-Term
• Near-term focus is on opportunities to enhance our position in the Eagle Ford
– Primarily targeting bolt-on acquisitions and other opportunities to enhance our capacity and volumes in South Texas
– Expect consolidation to continue
Long-Term
• Long-term focus includes opportunities beyond existing operating areas
Summary of Acquisitions
• Crosstex Pipelines and Plants (2009)
• Enterprise Alabama (2011)
• Tennessee Pipeline Assets (2011)
• Monco Pipeline System (2012)
• Valero Pipeline (2012)
• Tierra Pipelines (2013)
• Onyx Pipelines (2014)
• TexStar Rich Gas System (2014)
• McMullen Gathering System (2014)
2014 Investor Day
Overview
• Well in excess of $1 billion of asset value expected to be dropped down to SXE over time• Timing and size of each drop-down based upon maturity of asset and capital market conditions• Expect to drop down assets that have achieved some maturity of cash flow • Expect to fund drop-downs with prudent mix of debt and equity
• Holdings is incentivized to drop down assets to SXE and grow distributions• Holdings owns approximately 57% of the SXE LP interests and 100% of the GP interests
• Drop-down outlook:• Expect to complete at least one drop-down during 2015• Expect to drop down assets through a greater number of transactions in smaller asset
packages
Drop-Down Opportunities
55
2014 Investor Day
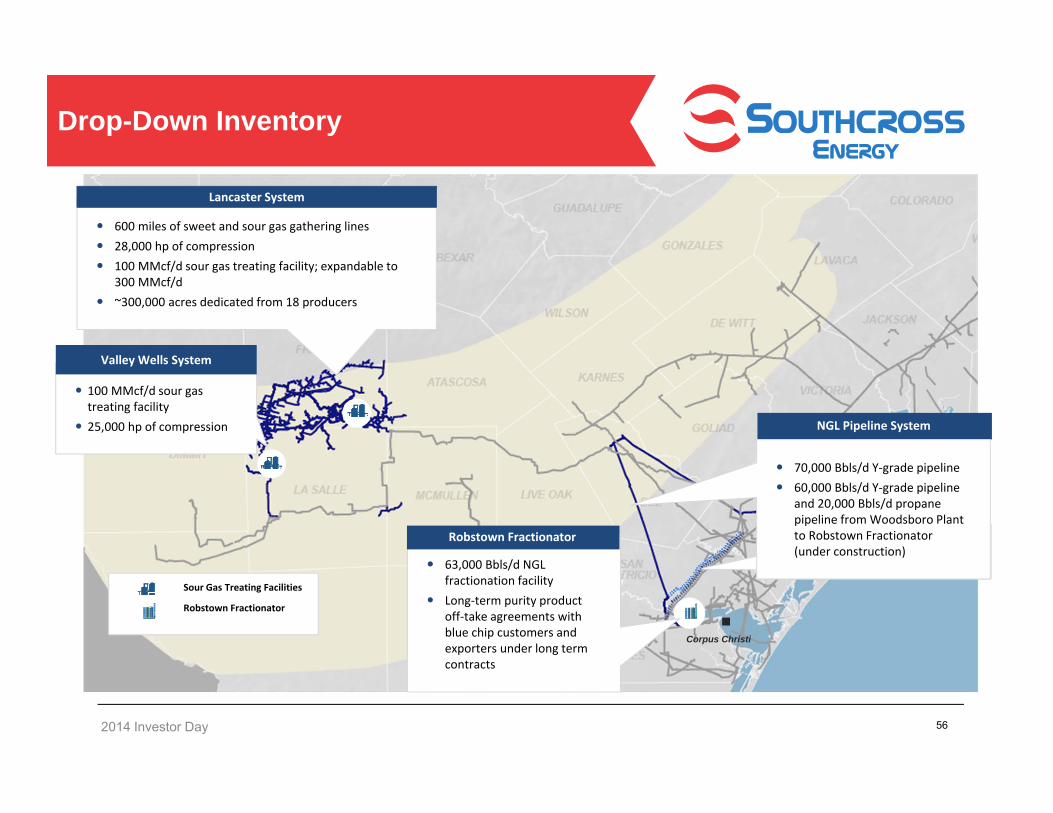
600 miles of sweet and sour gas gathering lines 28,000 hp of compression 100 MMcf/d sour gas treating facility; expandable to
300 MMcf/d ~300,000 acres dedicated from 18 producers
Lancaster System
NGL Pipeline System
100 MMcf/d sour gas treating facility
25,000 hp of compression
Valley Wells System
Drop-Down Inventory
56
Sour Gas Treating Facilities
Robstown Fractionator
63,000 Bbls/d NGL fractionation facility
Long‐term purity product off‐take agreements with blue chip customers and exporters under long term contracts
Robstown Fractionator
Corpus Christi
70,000 Bbls/d Y‐grade pipeline 60,000 Bbls/d Y‐grade pipeline
and 20,000 Bbls/d propane pipeline from Woodsboro Plant to Robstown Fractionator (under construction)
2014 Investor Day
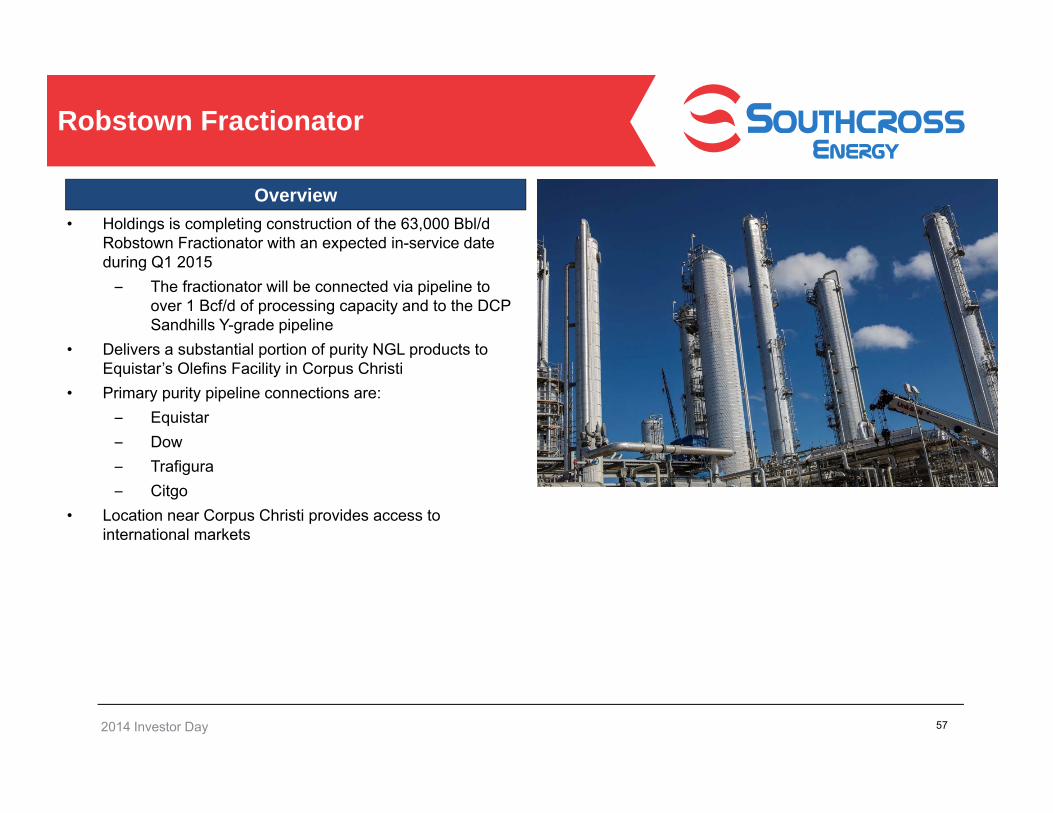
Overview• Holdings is completing construction of the 63,000 Bbl/d
Robstown Fractionator with an expected in-service date during Q1 2015– The fractionator will be connected via pipeline to
over 1 Bcf/d of processing capacity and to the DCP Sandhills Y-grade pipeline
• Delivers a substantial portion of purity NGL products to Equistar’s Olefins Facility in Corpus Christi
• Primary purity pipeline connections are:– Equistar – Dow– Trafigura– Citgo
• Location near Corpus Christi provides access to international markets
Robstown Fractionator
57

2014 Investor Day
Overview• 56 mile 70,000 Bbls/d 12” Y-grade pipeline extending from
the Lone Star Plant to the Robstown Fractionator in Corpus Christi
• 49 mile 12” pipeline extending from Pettus to Refugio County
• Currently constructing two additional pipelines:– 37 mile 20,000 Bbls/d 6” propane pipeline to
connect Bonnie View to Robstown and Trafigura– 27 mile 60,000 Bbls/d 10” Y-grade pipeline to
connect Woodsboro to Robstown and DCP Sandhills
• The NGL Pipeline System connects Y-grade from the Lone Star, Woodsboro and Gregory processing plants to multiple outlets including:– Robstown Fractionator – Bonnie View Fractionator– Gregory Fractionator – Multiple Mont Belvieu fractionators via DCP
Sandhills Pipeline
NGL Pipeline System Map
Lone Star to Robstown Y‐Grade Pipeline
Lone Star to Refugio Y‐Grade or Residue Gas Pipeline
Y-grade Line under constructionPropane Line under constructionNGL SystemFractionatorProcessing Plant
NGL Pipeline System
58
Woodsboro
Bonnie View
Gregory
Lone Star
Robstown
Woodsboro to Robstown Y‐grade and propane pipelines

2014 Investor Day
Overview Gathering and Treating Systems• Holdings currently owns two sour gas gathering systems
and two sour gas treating plants
– Lancaster System
– Valley Wells System
• At Lancaster, Holdings owns and operates an acid gas injection well, providing a unique disposal service and meaningful competitive advantage with up to 300 MMcf/d of inlet treating capacity
– Valley Wells is able to send its recovered H2S back to Lancaster via pipeline for injection
• Sour gas treating plants are a key strategic advantage
– Limited amount of sour gas gathering and treating service available in the area
– Producer activity is driven by oil wells
– Increasing sour gas production trends
Sour Gas Gathering and Treating
59
Sour Gas Treating Facility
2014 Investor Day
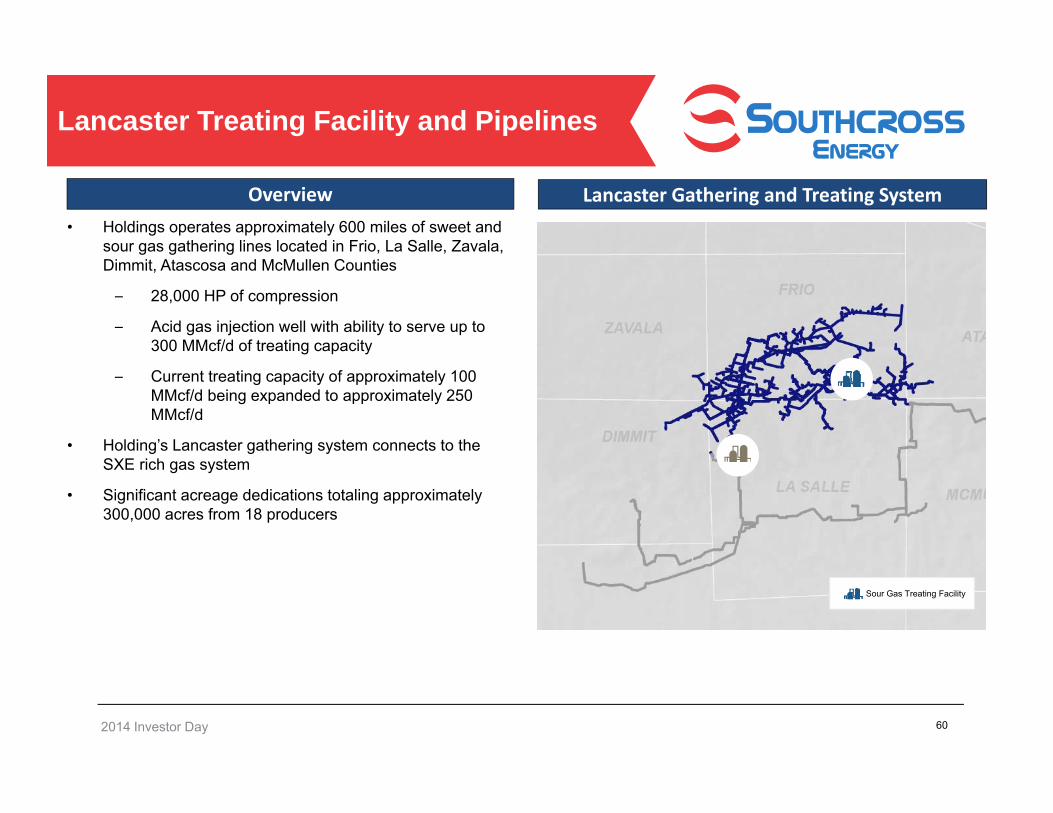
Overview Lancaster Gathering and Treating System• Holdings operates approximately 600 miles of sweet and
sour gas gathering lines located in Frio, La Salle, Zavala, Dimmit, Atascosa and McMullen Counties
– 28,000 HP of compression
– Acid gas injection well with ability to serve up to 300 MMcf/d of treating capacity
– Current treating capacity of approximately 100 MMcf/d being expanded to approximately 250 MMcf/d
• Holding’s Lancaster gathering system connects to the SXE rich gas system
• Significant acreage dedications totaling approximately 300,000 acres from 18 producers
Lancaster Treating Facility and Pipelines
60
Sour Gas Treating Facility
2014 Investor Day
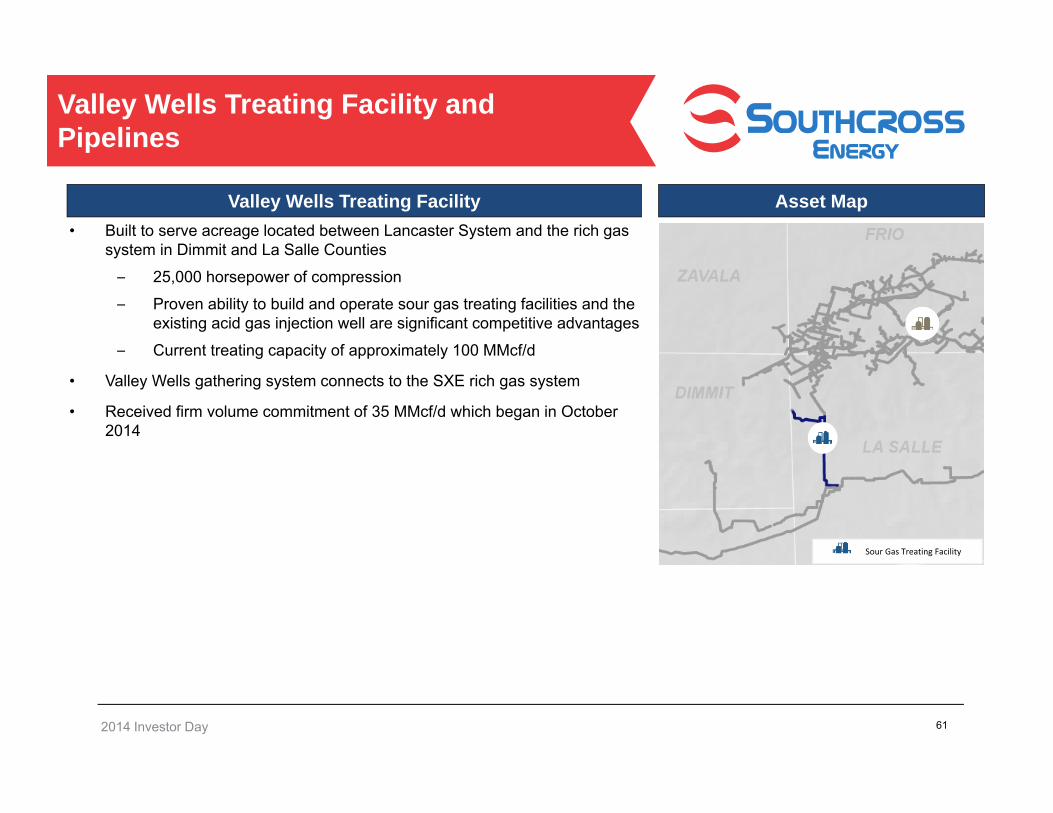
Valley Wells Treating Facility• Built to serve acreage located between Lancaster System and the rich gas
system in Dimmit and La Salle Counties
– 25,000 horsepower of compression
– Proven ability to build and operate sour gas treating facilities and the existing acid gas injection well are significant competitive advantages
– Current treating capacity of approximately 100 MMcf/d
• Valley Wells gathering system connects to the SXE rich gas system
• Received firm volume commitment of 35 MMcf/d which began in October 2014
Asset Map
Valley Wells Treating Facility and Pipelines
61
Sour Gas Treating Facility
2014 Investor Day
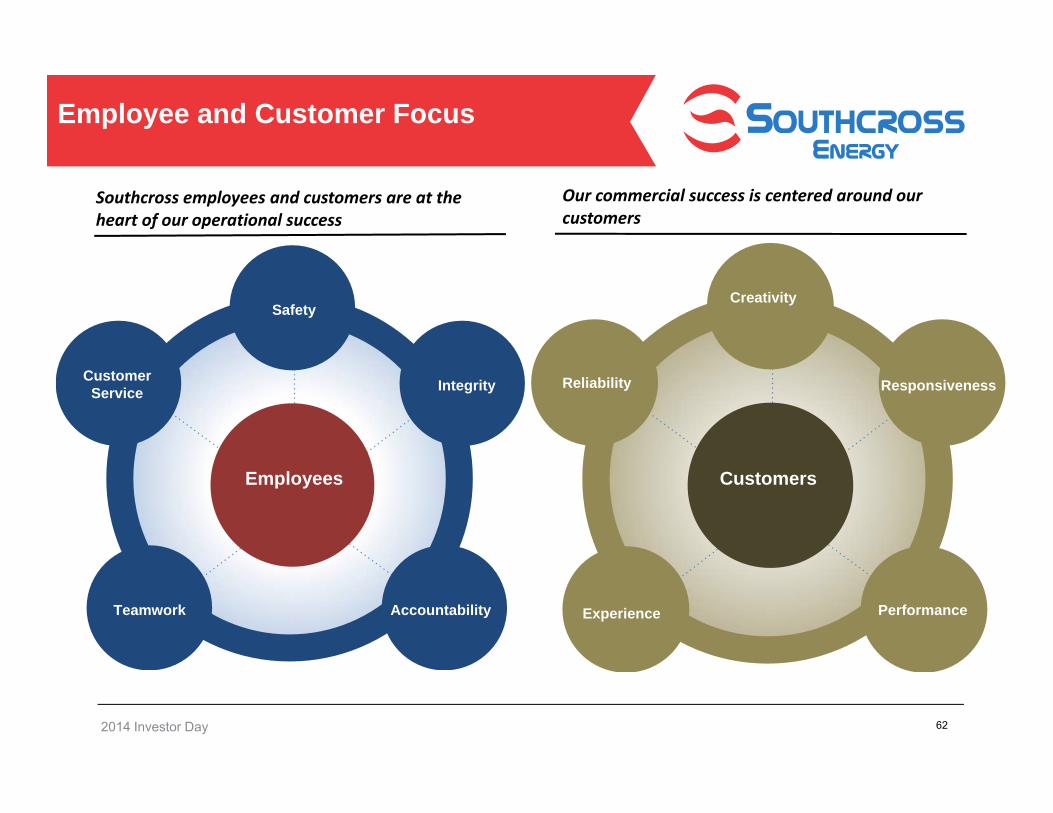
Employee and Customer Focus
62
Our commercial success is centered around our customers
Southcross employees and customers are at the heart of our operational success
Creativity
Responsiveness
Accountability
CustomerService
Safety
Reliability
Experience PerformanceTeamwork
Integrity
Employees Customers

2014 Investor Day
Fill Capacity
Organic Projects
Drop-downs
Acquisitions
Growth Strategy
63
SXE Holdings
• Fully utilize processing capacity in 12 to 18 months
• Optimization of asset base• Potential new processing plant
in 2016
• Expect drop-down transaction in 2015
• Focus on bolt-on assets in existing markets
• Fill fractionator with system volumes and potential third party volumes; add sour gas to treating and gathering system
• Larger projects with significant development time and ramp
• Recycle capital from drop-downs to further growth
• Focus on larger and/or less developed acquisitions in existing markets; potentially move to other areas later

Financial Overview & Outlook – Michael Anderson
2014 Investor Day
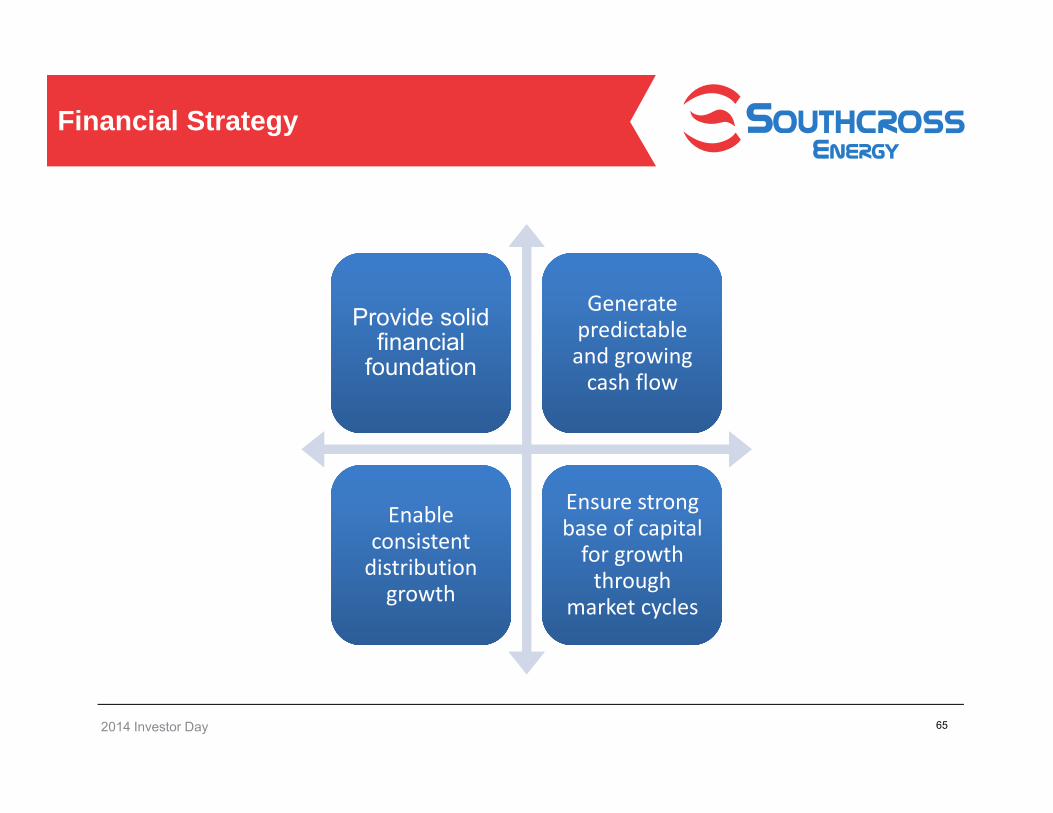
Financial Strategy
65
Provide solid financial
foundation
Provide solid financial
foundation
Generate predictable and growing cash flow
Generate predictable and growing cash flow
Enable consistent distribution growth
Enable consistent distribution growth
Ensure strong base of capital for growth through
market cycles
Ensure strong base of capital for growth through
market cycles
2014 Investor Day
• Attractive credit facilities with long-dated maturities– Corporate family credit rating of B1 / B– $450 million term loan B facility
• August 2021 maturity; borrowing rate of LIBOR plus 4.25% (1.00% LIBOR floor)– $200 million revolving credit facility
• August 2019 maturity; current borrowing rate of LIBOR plus 3.25%– Existing debt balance is over 50% hedged
• Expect near term de-leveraging – Benefits from expected cash flow growth related to recent projects and acquisitions– Limited required growth capital expenditures in 2015– Adjusted EBITDA growth expected from filling existing processing capacity
• Access to capital for growth– Recently implemented ATM equity program– Expect to fund drop-downs with prudent debt/equity mix– Flexibility through Holding’s asset and capital base
Provide Solid Financial Foundation
66
Targeting 3.0x to 4.0x leverage ratio and 1.1x to 1.2x distribution coverage with prudent use of equity to fund growth

2014 Investor Day
• Attractive contract mix with large base of minimum volume commitment contracts and producer customers driven by attractive Eagle Ford economics
• Gross operating margin1 is becoming increasingly fixed fee oriented
• Anticipate ability to grow Adjusted EBITDA without significant growth capital– Filling 200 MMcf/d of current processing space can generate meaningful
incremental Adjusted EBITDA:
• $36 million at $0.50 per mcf/d• $55 million at $0.75 per mcf/d• $73 million at $1.00 per mcf/d
• Access to potential drop-down assets at Holdings that are already integrated with South Texas asset base
Generate Predictable and Growing Cash Flow
67
1 We define gross operating margin as the sum of revenues less the cost of natural gas and NGLs sold.
2014 Investor Day
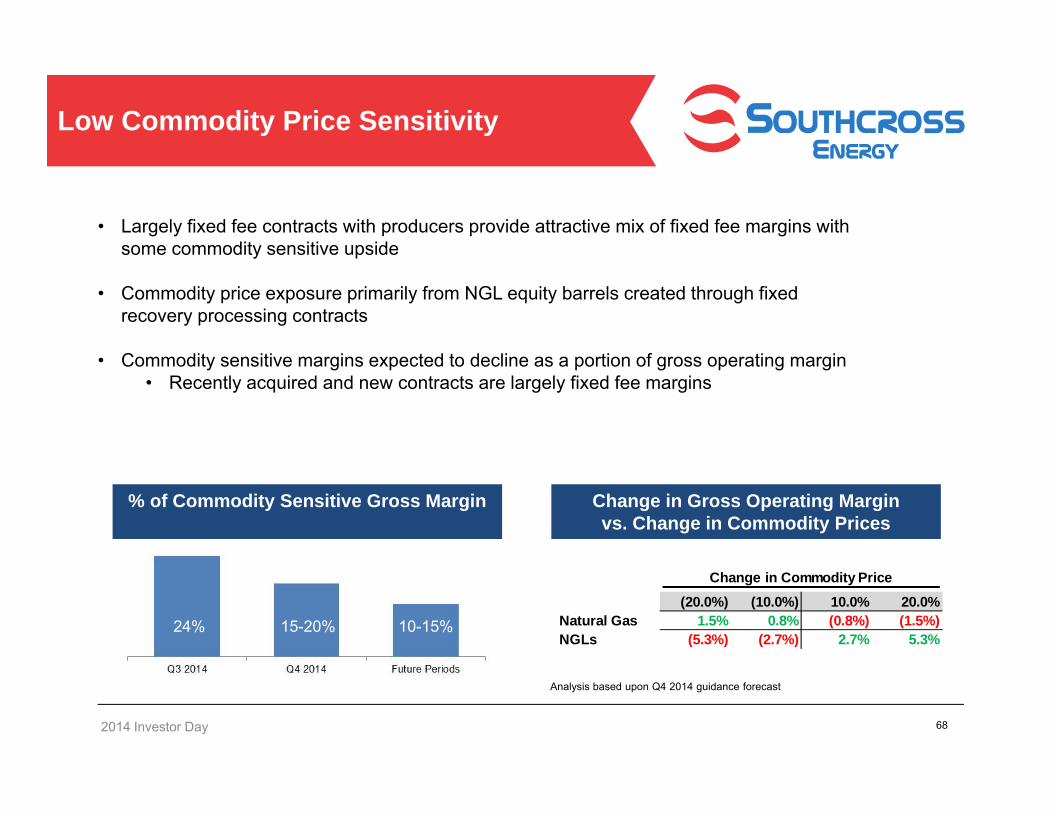
• Largely fixed fee contracts with producers provide attractive mix of fixed fee margins with some commodity sensitive upside
• Commodity price exposure primarily from NGL equity barrels created through fixed recovery processing contracts
• Commodity sensitive margins expected to decline as a portion of gross operating margin• Recently acquired and new contracts are largely fixed fee margins
Low Commodity Price Sensitivity
68
Analysis based upon Q4 2014 guidance forecast
Change in Commodity Price(20.0%) (10.0%) 10.0% 20.0%
Natural Gas 1.5% 0.8% (0.8%) (1.5%)NGLs (5.3%) (2.7%) 2.7% 5.3%
Change in Gross Operating Margin vs. Change in Commodity Prices
% of Commodity Sensitive Gross Margin
24% 15-20% 10-15%

2014 Investor Day
• Expected near-term path to 1.0x distribution coverage– Recent new minimum volume commitment contracts are expected to add
$7 million to $8 million in full quarter Adjusted EBITDA – Existing base of strong producer customers is expected to continue to
grow production at current commodity price levels
• Existing commitment from Holdings to forgo subordinated unit distributions while coverage is less than 1.0x provides support for common units
• Expect to fill processing plant capacity within 12 to 18 months– Potential to start-up new processing plant in 2016
• Supplement organic growth through expected drop-downs
Enable Consistent Distribution Growth
69
Expect to achieve at least 1.0x coverage of
common units in Q1 2015
Expect to grow distributions in
2015
Expect further growth
through filling asset capacity & completing drop‐downs
2014 Investor Day
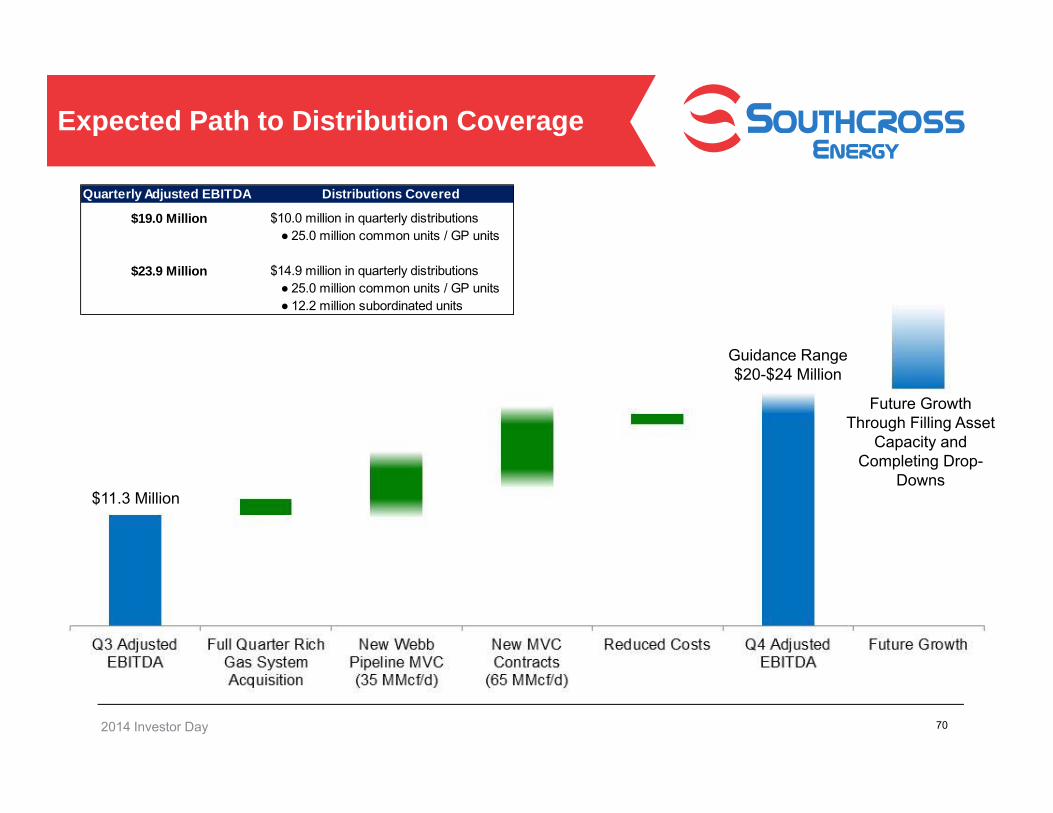
Expected Path to Distribution Coverage
70
$11.3 Million
Guidance Range$20-$24 Million
Future Growth Through Filling Asset
Capacity and Completing Drop-
Downs
Quarterly Adjusted EBITDA Distributions Covered
$19.0 Million $10.0 million in quarterly distributions● 25.0 million common units / GP units
$23.9 Million $14.9 million in quarterly distributions● 25.0 million common units / GP units● 12.2 million subordinated units
2014 Investor Day
Holdings Asset Composition• 29.2 million SXE common / Class B Convertible PIK units
• Market value of approximately $440 million at $15 per unit• 100% of SXE General Partner units• Operating assets with estimated value well in excess of $1 billion
Holdings Capital Available for Growth• Approximately $100 million in cash• $50 million from unfunded revolving credit facility• Additional capital from unfunded preferred equity commitment• Future potential investments from strong base of private equity investors
Holdings Profile
71
Holdings provides an ideal platform for potential growth through existing assets and an enviable cadre of private equity energy investors

2014 Investor Day
Compelling Valuation
72
Attractive Yield vs. Gathering / Processing
Peers
Large Base of Potential Drop‐Down Assets vs. Current Adjusted
EBITDA
Potential Distribution
Growth Heavily Discounted in Current Market
Price
2014 Investor Day
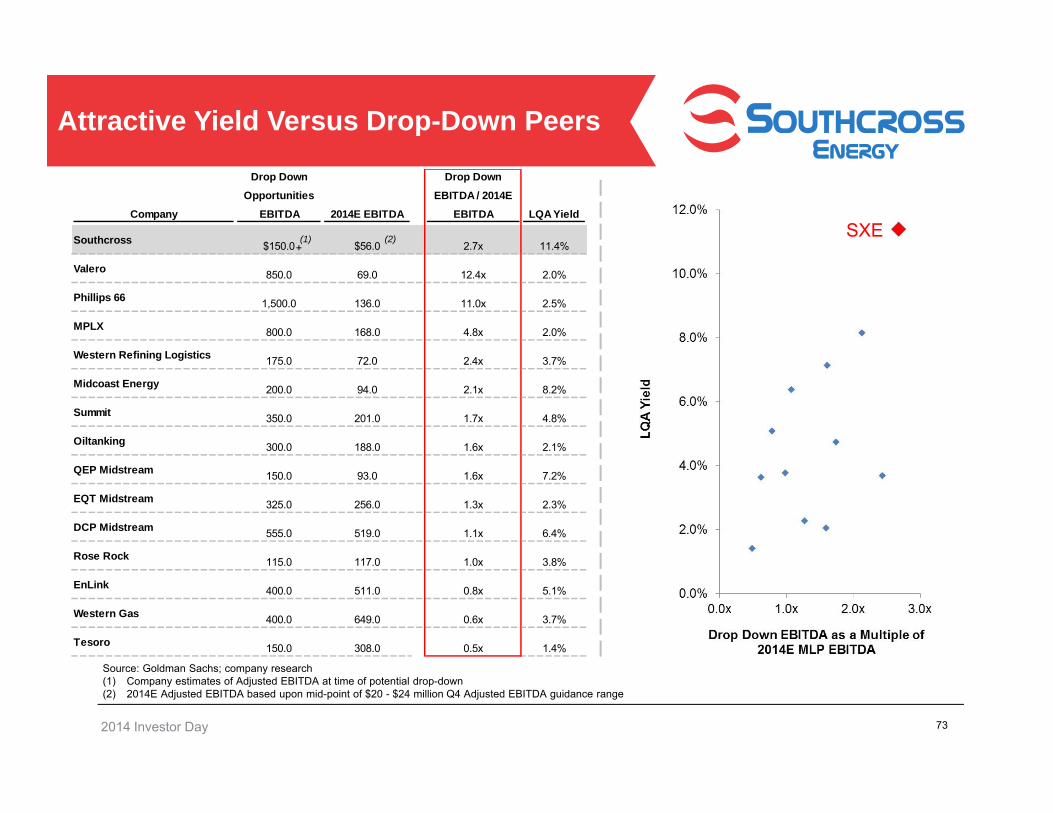
Company
Drop Down Opportunities
EBITDA 2014E EBITDA
Drop DownEBITDA / 2014E
EBITDA LQA Yield
Southcross $150.0 $56.0 2.7x 11.4%
Valero 850.0 69.0 12.4x 2.0%
Phillips 66 1,500.0 136.0 11.0x 2.5%
MPLX 800.0 168.0 4.8x 2.0%
Western Refining Logistics 175.0 72.0 2.4x 3.7%
Midcoast Energy 200.0 94.0 2.1x 8.2%
Summit 350.0 201.0 1.7x 4.8%
Oiltanking 300.0 188.0 1.6x 2.1%
QEP Midstream 150.0 93.0 1.6x 7.2%
EQT Midstream 325.0 256.0 1.3x 2.3%
DCP Midstream 555.0 519.0 1.1x 6.4%
Rose Rock 115.0 117.0 1.0x 3.8%
EnLink 400.0 511.0 0.8x 5.1%
Western Gas 400.0 649.0 0.6x 3.7%
Tesoro 150.0 308.0 0.5x 1.4%
Attractive Yield Versus Drop-Down Peers
73
(1) (2)
Source: Goldman Sachs; company research(1) Company estimates of Adjusted EBITDA at time of potential drop-down(2) 2014E Adjusted EBITDA based upon mid-point of $20 - $24 million Q4 Adjusted EBITDA guidance range
SXE+
2014 Investor Day
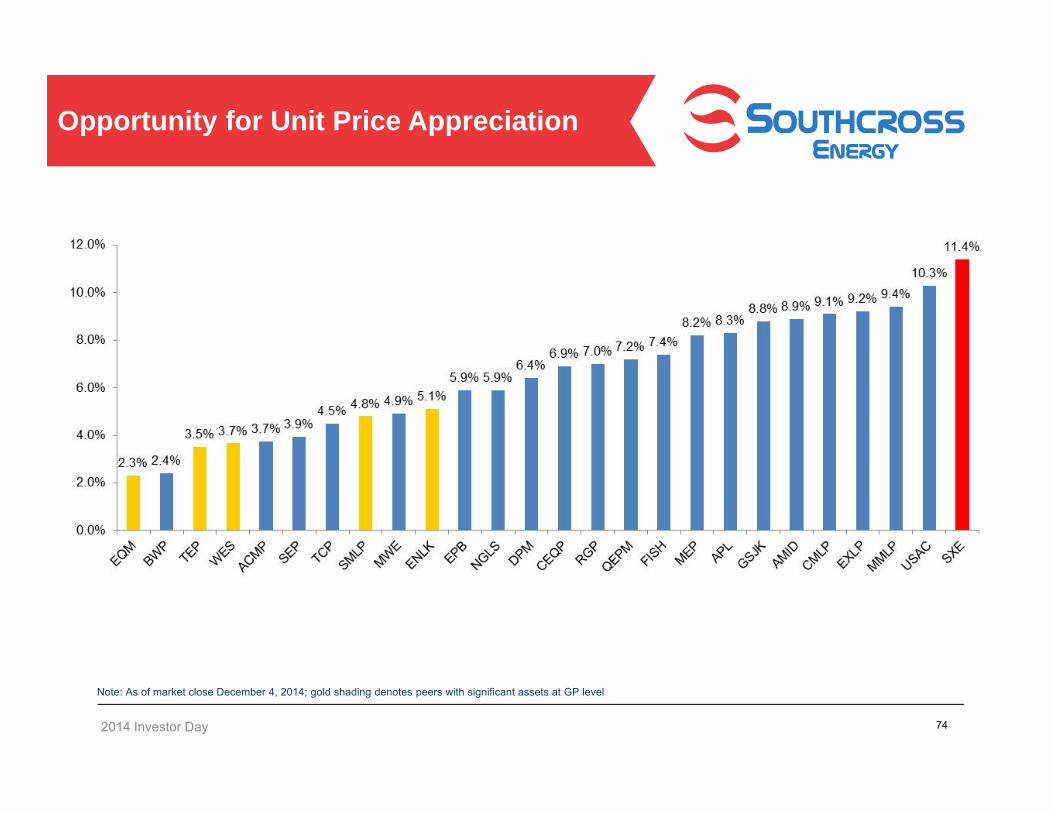
Note: As of market close December 4, 2014; gold shading denotes peers with significant assets at GP level
Opportunity for Unit Price Appreciation
74

Summary – David Biegler

2014 Investor Day
The Southcross Advantage
76
Significant scale of pipeline and processing assets
Operating stability through interconnected system
Extensive footprint in the prolific Eagle Ford and Gulf Coast areas
Blue chip, active producer customer base
Full spectrum of services creates competitive and economic advantages
Fractionation assets are a significant differentiator
Premium and growing markets for gas, NGLs and condensate
Corpus Christi region is growing rapidly and serves new export markets
Fully utilize existing capacity
Develop organic growth projects
Drop-downs
Acquisitions
Premier Strategic Platform in the Eagle Ford
Fully Integrated Midstream Platform
Four Drivers of Growth
Wellhead Gathering and Compression Gas Processing andTreating Plants
Y-Grade Fractionation Facilities
Natural GasEnd Users
Transportation Lines / Storage
NGL End Users
NGL & Residue Marketing
Appendix
2014 Investor Day 78
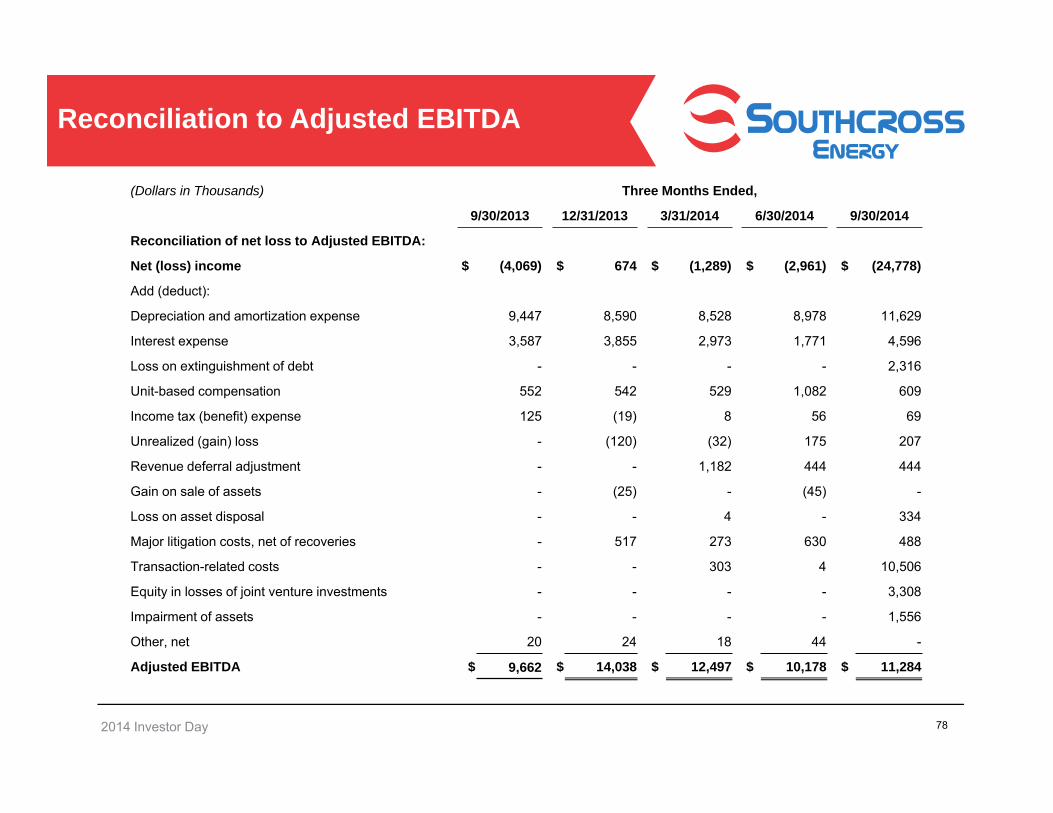
Reconciliation to Adjusted EBITDA
(Dollars in Thousands) Three Months Ended,
9/30/2013 12/31/2013 3/31/2014 6/30/2014 9/30/2014
Reconciliation of net loss to Adjusted EBITDA:
Net (loss) income $ (4,069) $ 674 $ (1,289) $ (2,961) $ (24,778)
Add (deduct):
Depreciation and amortization expense 9,447 8,590 8,528 8,978 11,629
Interest expense 3,587 3,855 2,973 1,771 4,596
Loss on extinguishment of debt - - - - 2,316
Unit-based compensation 552 542 529 1,082 609
Income tax (benefit) expense 125 (19) 8 56 69
Unrealized (gain) loss - (120) (32) 175 207
Revenue deferral adjustment - - 1,182 444 444
Gain on sale of assets - (25) - (45) -
Loss on asset disposal - - 4 - 334
Major litigation costs, net of recoveries - 517 273 630 488
Transaction-related costs - - 303 4 10,506
Equity in losses of joint venture investments - - - - 3,308
Impairment of assets - - - - 1,556
Other, net 20 24 18 44 -
Adjusted EBITDA $ 9,662 $ 14,038 $ 12,497 $ 10,178 $ 11,284