a world in motion - iis windows...
TRANSCRIPT

a world in motion a world in motion2008 annual report
a w
orl
d in
mo
tio
n20
08
ann
ual
rep
ort
A world in motion
Credicorp LtdClaredon House 2 Church Street Hamilton, Bermudawww.credicorpnet.com
Banco de Crédito BCPAtlantic Security Holding CorporationPacífico Grupo AseguradorPrima AFP

a world in motionannual report 2008
A world in motion

Contents
Letter from the Chairman
Economic EnvironmentThe economy in figuresMain economic and financial indicators
Corporate StrategyA world in motion…Building on our strengthsSustainability on targetIntegrated individual strategiesA pending task
Financial ResultsMain management indicatorsA graphic view of financial resultsBusiness lines
The banking businessThe insurance businessThe asset management business
Credicorp grows with at the pace of its subsidiaries Market value and stock structure
Corporate Governance and Social ResponsibilityBanco de Crédito BCPBanco de Crédito BCP BoliviaPacífico Grupo Asegurador
4
121415
1820212124 29
303233383844475052
54566060
contents 2

Financial Statements 2008
Risk Ratings
Board of Directors, Senior Management and Audit Committee
Contacts
62
162
163
164
a world in motion3

dionisio romero seminario Chairman of the Board

Letter from the Chairman

letter from the chairman 6
Letter from the ChairmanDear shareholders, Once again, on behalf of Credicorp’s Board of Directors, which I have the honor to chair, I submit the annual report on the corporation’s activities during 2008 for your consideration.
ResuLts
In the first place, I would like to refer to the international financial crisis which was evident since 2007 but reached its massive dimension only in 2008’s second half. It was certainly not expected to be as severe and significant as it has been. This event has in part conditioned the performance of our company, as I will comment below. Despite an atmosphere of crisis and uncertainty, Credicorp’s results were satisfactory. Net earnings reached US$ 357.7 million, 2.0% higher than earnings in 2007. This is a good result, once we take into account we faced exceptional charges worth US$ 93.2 million, of which US$ 49.7 million correspond to the impairment of unrealized losses of our investment portfolio resulting from the general drop in the market value of secu-rities, and US$ 43.5 million for provisioning against potential losses and contingencies related to the alleged fraud, which I will discuss below.
The banking business was our main earnings contributor. For the insurance business, 2008 was, once again, a difficult year as a consequence of high claims and losses from the invest-ment portfolio. Third party fund management, an activity we prioritize now, has started to make a positive contribution to our corporation’s bottom line, in particular through pen-sion fund management.
DiviDenDs anD CapitaLization
At its February 27th meeting, the Board of Directors agreed to distribute a cash dividend of US$ 1.50 per share, an amount similar to last year’s and which represents 33% of profits made.

a world in motion7
This year, the company’s non-distributed benefits will reach 67%, because of the capitaliza-tion needs in our most important subsidiaries. Last December, it was decided to make a capital contribution to Pacifico Peruano Suiza and Atlantic Security Bank to further strengthen these organizations in view of last year’s equity loss, mainly resulting from the drop in market valuations of our investment portfolios.
In addition, BCP also increased its operating capital through ratained earnings worth US$ 180.6 million, in order to support the strong asset growth during this year. subsiDiaRies
I will summarize now the results and activities of our most important subsidiaries.
Banco de Crédito BCP
Once again, 2008 proved to be an exceptional year at BCP. Net consolidated earnings reached US$ 423.5 million, measured following international accounting principles. This represents a 28% increase over last year’s results and a return on average equity of 32.8%, the highest return in BCP’s history that we remember
Earnings in nuevos soles, calculated pursuant to local accounting principles, were likewise highly satisfactory, having reached S/. 1,334.5 million, 51% higher than in 2007.
Practically all revenue items contributed to BCP’s improved results. Net financial income increased 30%, commissions from bank services grew 20%, and among the other non fi-nancial revenues, commissions from exchange transactions increased a remarkable 83% year over year.
Higher net financial income is principally accounted for by more loans, which measured in average daily balances grew 36% compared to 2007. In this respect, it is worthwhile under-scoring that despite the accelerated growth of loans in recent years, which practically tri-pled between 2004 and 2008, this portfolio’s quality has also improved annually. Past due loans at year-end 2008 reached 0.8% of the total portfolio, while provisions reached 2.7 times the non-performing portfolio.
Loans increased in all market segments. However, Retail Banking loans to individual and small companies, performed remarkably well. This business unit expanded its portfolio in 43%, measured in average daily balances and has made the largest contribution to the bank’s growth in earnings, deposits and loans.

8
Such positive evolution of both results and operations was influenced by Peru’s dynamic economy. Gross Domestic Product continued to grow strongly, and expanded 9.8% in 2008.
Operating expenses also experienced significant growth last year, and were 12% higher than in 2007. Such behavior is accounted for by accelerated growth of our physical and technological infrastructure, in the last two years. In 2007 and 2008, we opened 97 branches, installed 251 automated tellers and started operations through 1,491 Agentes BCP, our branchless banking network. In addition, we invested US$ 61 million to improve technological support for our operations. Finally, in these two years we have hired 5,200 new employees, principally to meet the needs of our new branches. We are persuaded with these investments we are laying down the foundations for sustained growth, as Peruvian economy develops.
Banco de Crédito BCP Bolivia
Last year was also a year of exceptional results at our subsidiary in Bolivia. Its net earnings reached US$ 44.5 million, 65% higher than in 2007, or average return over equity of 53.4%. In recent years, this subsidiary has become a significant source of earnings for our corporation.
Exceptional growth of profits is accounted for by larger financial margins, significant in-creases in non-financial revenues, in particular commissions charged for the services we provide, and improved credit risk which did not required significant provisioning.
Improvements in financial markets are principally due to the growth of retail loans and treasury investments, rather than to an overall growth of loan portfolio, which remained almost unaltered.
Pacífico Peruano Suiza
The insurance activity experienced hardship in 2008. In consolidated terms, the insurance group generated a loss of US$ 15.9 million to Credicorp, despite a 32% increase in net premiums.
Poor performance is explained by high casualties in practically all lines of business, and losses experienced in investment portfolios after the overall reduction in securities’ valuations. Casualty rates for certain types of insurance even exceeded premiums charged, as in health care and general risk, where severe damage hurt corporate clients.
letter from the chairman

a world in motion9
The negative results, in addition to unrealized losses in the investment portfolio, deteriorated the company’s solvency by reducing operative capital. Accordingly, the Pacifico Peruano Suiza General Shareholders’ Meeting held in December increased the capital by S/. 55.1 million.
However, not all is bad news in the insurance activity. It should be underscored that the life insurance business managed by our Pacifico Vida subsidiary continued to grow strongly. Total premiums increased by 30% since 2007 yielding net profits worth US$ 9.0 million, despite US$ 2.1 million of impairment from unrealized losses of our investment portfolio.
Adjustments in risk underwriting and premiums charged in the high casualty lines were made throughout the year to improve results from operations. Improvements became evi-dent in the closing months of 2008.
Atlantic Security Holding Corporation
The Bernard Madoff Securities Inc. fund management alleged scam, a Ponzi scheme that shocked the international financial community in December and filled us with indigna-tion, has hurt thousands of persons and companies worldwide, including Atlantic Security Bank and some of its clients.
The severe international financial crisis has also had a negative impact on this subsidiary’s bottom line, in view of its high exposure to market risks created by the significant portion of assets it holds as securities, the prices of which have dropped significantly.
Net losses, in particular during the closing quarter reached US$ 59.4 million, accounted for, as I already mentioned, by exceptional US$ 69.5 million charges to cover unrealized losses stemming from the impairment of our investment portfolio’s loss in value and provisioning for potential losses and contingencies related to the abovementioned alleged scam. In addition to this negative bottom line, unrealized losses for US$ 46.7 million were experienced in the equity account, where at year end 2007, we had accomplished unrealized earnings totaling US$ 17.4 million.

10
To replenish lost wealth and improve the bank’s capital solvency, a decision was made in December to increase the bank’s capital through a cash contribution of US$ 20.0 million, and by providing a US$ 15.0 million subordinated loan.
Prima AFP
Pension funds also experienced a tough year in 2008, as the international financial crisis affected the funds’ value. The combined yield of the three types of funds managed by AFPs was negative by 20.4%.
In such difficult environment, our pension fund management company Prima AFP continued to strengthen its position by adjusting its processes and organization to give our members high quality services, and timely and transparent information, while it becomes a highly profitable business unit.
Prima AFP contributed US$ 11.2 million to Credicorp’s profits, compared to US$ 3.0 million a year earlier.
By year-end, our share of total funds under management reached 30.6%, ranking Prima AFP as the second largest fund management company. Moreover, Prima AFP experienced the smallest loss in yields from fund 2, which accounts for over three-fourths of all funds.
letter from the chairman

outLook
Uncertainty is the buzz word in the current international economic scenario. The present world crisis is the largest and most severe we have ever experienced. Although its impact is not yet fully felt in Peru, we must be aware that it will eventually slow down economic ac-tivity in Peru in 2009.
Still, we are convinced such hardship will not totally obliterate growth in Peru. Strong ex-ternal and fiscal accounts, significant foreign currency reserves, and the financial system’s high solvency ratios provide sufficient foundation to successfully cope with the challenges created by the international context.
Credicorp is also ready to successfully sail through these uncertain waters. For this voyage, it can safely rely on its strong equity, technical and professional capital position; the loyalty and trust of its clients, and talented employees deeply committed to their companies’ success. Business will continue to grow, albeit at a slower pace than during the recent, exceptional years. We should expect higher credit risk in the banking business, and, consequently, the need for larger provisioning.
At Atlantic Security Bank, we think all precautions have been taken to face the interna-tional financial turmoil and expect a recovery of results in 2009.
The insurance business should improve and pull itself out from the negative condition it reached in 2008. A number of measures have been put in place to reduce risk and restruc-ture premiums. On the other hand, in our pension fund management business we expect a year of growth in clients.
To conclude this report, on behalf of the Board of Directors I wish to thank our dear shareholders for their confidence in us; our more than two million clients for their loyalty; and all our employees for their contribution to developing our company.
Thank you.
Dionisio RoMeRo seMinaRioChairman of the Board
a world in motion11


Peru’s strong external and fiscal accounts, substantial foreign currency reserves and its financial system’s capital adequacy guarantee the nation can successfully cope with the adverse impacts of the world’s financial crisis
Economic Environment

economic environment 14
In 2008, the United States’ economy, and the world’s generally, slipped into recession. Growth was particularly week as some key areas, including the labor market, contracted at levels not seen in recent recessions. As uncertainty mounted about the crisis’ depth and duration, the main world governments enforced fiscal policies to prevent a generalized collapse. Thus, the United States
the economy in figures
economic environment
approved a US$ 700 billion package to rescue some key industries, including the financial and automobile sectors. Expectations of lower growth slowed down price increases in the main commodities during the first half. Likewise, inflation expectations weakened as revealed by lower price increase rates in some countries in the last months of 2008.
Indicators 2006 2007 2008
WORLD ECONOMy
World GDP (% real change)Inflation (% change)
5.13.4
5.25.0
3.45.9
PERUVIAN ECONOMyReal sector GDP (% real change)
PricesInflation (% change)Rate, end of period (S/. to US$)Exchange rate, period average (S/. to US$)
Fiscal sector (% GDP) Central Government revenuesCentral Government expendituresNon Financial Public Sector Results
Foreign sector (US$ million)ExportsImportsTrade balanceCentral Bank’s Foreign Currency Reserves
7.6
1.13.203.27
17.416.12.1
23,83014,8448,986
17,275
8.9
3.93.003.12
18.116.43.1
27,88219,5958,287
27,689
9.8
6.73.142.93
18.216.12.1
31,52928,4393,090
31,196
Source Central Bank (BCR), Statistics Institute (INEI)

a world in motion15
ECONOMIC ACTIVITy: DRIVEN By INVESTMENT
In 2008, Peru’s economy grew at 9.8% over a year before. Thus, Peru’s economy completed 10 years of uninterrupted growth at an average annual 5.1% rate (7.6% in the last 5 years). Industry by industry, the best performing sectors were construction, non-primary manufacturing and trade, while primary activities (agricultural, fisheries and mining) all grew below average. By type of expenditure, investment continued to drive growth, with government expending as the most powerful engine. In the foreign front exports slowed down in view of a slower world economy driven by the recession in the industrialized countries, while imports continued at a lively pace, responding to evolving domestic demand.
main economic and financial indicators
PRICES: INFLATION DRIVEN By FOOD PRICE INCREASES
For the second consecutive year, inflation in Metropolitan Lima exceeded BCR targets (6.7%, against a 2.0%, plus or minus 1.0%). This was mainly due to higher food prices, of both imported (because of increases of oil prices in the first half, and of food commodities including corn, soy beans, wheat and rice), as well as local produce, against the background of increasing demand and moderate growth of supplies. However, toward year-end, price rises did not slow down despite falling world food and oil quota-tions in the second half, while public service rates started to recover lost ground. In the provinces the impact of inflation was even higher, as food represents a larger share of con-sumers’ demand. In some cities, inflation exceeded 10%, driven by higher demand originating in greater purchasing power made possible by higher profit sharing distributions resulting from the high international prices for minerals (as in Moquegua or Cuzco).
GDP growth rate (% real change)
10%
Source BCR
2006
7.6%
8.9%
2008
9.8%
2007
6%
8%
2%
4%
0%
Inflation (% change)
Source BCR
2006
2007
2008
8%4%3%0% 2%1% 7%5% 6%
3.9%
1.1%
6.7%

economic environment 16
EXCHANGE RATE: GREATER UNCERTAINTy
Exchange rate volatility increased in 2008, compared to previous years, despite BCR’s permanent interventions in the exchange rate, prompted by greater uncertainty about the world’s economy. In addition, the dollar showed much greater instability in international markets. Two different be-havior patterns were observed in 2008. From January to May, the exchange rate was on a clear downward trend, pushed by higher local interest rates (to fight rising infla-tion) and lower international rates (in the struggle against weakening economies). As a consequence, the nuevo sol revalued by over 10%, if compared to closing rates at the end of May 2007. However, after May 2008, pressures towards a more expensive dollar increased worldwide, as the financial crises started weakening European and other industrial economies, and world inflation pressures yielded ground. Thus, by year end 2008 the exchange rate reached S/. 3.14 to the dollar, a rate 4.8% higher than a year earlier.
tRaDe baLanCe: LiveLieR iMpoRts
Although the trade balance is still positive by US$ 3,090 million, it has drifted away from its record levels of the first months in 2007. Exports reached US$ 31,529 million (+13.1% compared to 2007), while imports reached US$ 28,439 million (+45.1%). Non-traditional exports showed the greatest strength, driven by agricultural and chemical products. However, such liveliness was dampened by a loss of momentum in textiles sales. Strong imports’ increase responded not only to higher agricultural inputs’ prices (corn, soy bean, wheat, rice), but mostly to higher crude quotations. However, it must be recalled that capital goods’ inputs grew at a quick 57.6% as a response to growing investments.
Exchange rate (S/. per US$)
3.30
3.70
2006
3.12
20082007
3.00
3.20
3.10
2.80
2.90
3.20
3.27
3.00
3.14
End of periodSource BCR
Average
2.93
Trade balance (US$ billion)
2006
2007
2008
3520150 105 3025
27.919.6
8.3
23.814.8
9.0
Trade balanceImportsSource BCR
Exports
31.528.4
3.1

a world in motion17
FISCAL SECTOR: GOVERNMENT SURPLUS
The central government’s tax revenues grew 11.1%, to almost S/. 58 billion. This result was mainly a consequence of higher IGV (value added tax) collections from foreign sources resulting from faster imports. On the other hand, import duties fell 13.1%, as Peru’s trade becomes increasingly open and tariffs fall to mitigate domestic inflation. Also, the selective consumption tax fell 19.4%, as a result of lower fuel consumption (-39.8%). It is worthwhile underscoring that this year’s tax collections from income tax back payments fell close to 40%, revealing the end of the upwards rising trend in minerals. Although in recent times public expenditure has increased, mainly on capital investments, surging revenues have preserved the public sector’s surplus, which remained at slightly above 2% of GDP.
OUTLOOK FOR 2009
Despite greater international turbulence and creeping re-cession in most industrial countries, Peru’s economy may continue to grow in a lower rate. The strength of the crisis’ adverse effects will depend on the severity length and geo-graphical scope of the world’s crises.
In 2009, a relatively more relaxed monitoring policy will be expected to boost the real sector, due to decreasing prime rate, in order to may taper off growth. Inflationary pressures, particularly from abroad, are perceived as less intense. Foreign exchange volatility and US dollar increasing trend may continue, according to international crisis. This may gradually restore, as international markets recover their calm, possibly at end of the year. By year end the nuevo sol may appreciate slightly. This would partially respond to a weaker dollar worldwide, resulting from expansionary US fiscal and monetary policies. In Peru, ample rule for both types of policies may contribute to alleviate the impacts of the world crisis.
Non Financial Public Sector Results (% of GDP)
0%
Source BCR
2006
4%
3%
2%
1%
2.1%
2007
3.6%
3.1%
2008
2.1%


Corporate StrategyGreater interaction among Credicorp’s subsidiaries during the decision-making process will align the individual interests with Credicorp’s objectives

corporate strategy 20
Corporate strategyA strategy of greater integration, sharing skills, talent, intelligence and experience, to improve management.
A WORLD IN MOTION...
Credicorp’s strategy to tap synergies among its various organizational members, so that each of these companies will become a leader in their business, has preserved its essence.
Since its beginnings, Credicorp has moved steadily toward achieving these goals, having become on the way the leading financial group in all the fields where our organization is involved.
However, we do not live in a static environment… and 2008 has clearly shown how quickly and dramatically the world can change.
We live in a world in motion. Credicorp’s greatest challenge is to develop the ability to adapt to such changes without losing sight of the path it has set itself.
2008 will be recorded in the world’s financial history not just because of the largest global finan-cial crisis since the 1930s but also because of the mass consequences of such crisis in econo-mies around the world, and that we will continue to experience in the year we now start.
Credicorp is not immune to these events and although their direct effects were not significant, compared to their size, they have made us pay even closer attention to each of the strategic decisions that shape our business.

a world in motion21
BUILDING ON OUR STRENGTHS
The consequence of the strategic decisions review has been a stronger basic strategy that fo-cuses on identifying synergies to increase our efficiencies. This implies a greater integration that improves management of the various Group’s companies by sharing to an even greater extent, the talents, intelligence and experience that have always existed within our own organization.
In 2009, through even greater interaction in the decision making process we will seek to capitalize our synergies, where individual interests of the Group’s companies will be aligned with our or-ganization’s objectives, and decisions made to achieve the objectives of an individual company will take into account the capacities available throughout the entire organization.
SUSTAINABILITy AS A GOAL
The world crisis we are currently experiencing has once again demonstrated the need to build a business that will be sustainable over time.
The strength of our businesses has been built on the foundation of an organization with a long tradition, a deep-rooted culture of customer service, and true commitment to developing our country’s economy and markets.
At Credicorp we believe we must:
Focus on what we know how to do well:Traditional banking.Simple insurance.Responsible asset management.
Place our customer’s interests in the first place:Preserve our assets and invest them conservatively.Adapt our products to our customer’s needs.
Contribute to developing the country’s financial system:Increase bank penetration… become more accessible.Introduce insurance to the people and make it affordable.

alvaro correa
Chief Financial Officer

walter bayly
Chief Operating Officer

corporate strategy 24
inteGRateD inDiviDuaL stRateGies
BankingBanco de Crédito BCPBanco de Crédito BCP BoliviaAtlantic Security Bank - ASB
The main objective of our banking business strategy is to accomplish sustainable and highly profitable growth. Our strategy builds on our conviction we can accomplish such goal through greater bank penetration and by responding to our customer’s needs, while we increase effi-ciency and ensure profitable growth through deep, global and comprehensive risk manage-ment. This requires focusing on:
- Designing products that meet our customers’ needs. - Improving risk management and speed up risk assessment, by taking account of the four
types of risk, i.e. credit, market, operational and reputational risks.- Reviewing and streamlining our operative processes. - Reviewing and improving our distribution model.
Through these initiatives, we expect to accomplish the highest possible efficiencies, and to grow actively but profitably.
This strategy applies to the three entities, with some nuances. In BCP Bolivia, our strategy includes, in addition, an attitude of reconciliation with the interests of the Bolivian nation, and adapting the above initiatives to a less dynamic market.
ASB, on the other hand, and as a consequence of the severe crisis in the global financial system, must rise to the challenge of re-establishing our customers’ trust in investment mar-kets, as well as in our own asset management capabilities.
InsurancePacífico Peruano Suiza PPS
Although our insurance business’ results may not seem to evidence a successful strategy, now more than ever before we are convinced that the strategy we have set in motion is correct.
The first part of our strategy focuses on being more selective in our risk retention in the general corporate insurance segment, given the mismatch between insured levels and our ability to underwrite such risk.

Greater bank penetration…
Improvements in our distribution model…
Enhanced of our risk management…
Mass penetration of the insurance business…
More efficient administrative processes…
these are some of our initiatives for 2009
a world in motion25

ruben loaiza orlando cerrutti
General Manager Prima AFP General Manager Pacífico Vida

david saettone javier maggiolo
General Manager Pacífico Peruano Suiza Asset Management Manager

corporate strategy 28
Although putting this strategy fully in place will require time, we have already started to see positive effects.
At Pacifico, we also decided to focus on the retail business by developing products that will introduce customers to the advantages of insurance. The potential in this segment is huge, given the low penetration among the general public.
In addition to the key elements of the Pacifico strategy that we mentioned, the other initiatives described for the bank business that focus on growth, efficiency and risk management, apply equally to the entire Credicorp Group and, therefore, also to Pacifico, and reach into the life and health insurance business.
However, the principle of capitalizing synergies is perhaps even more important in the insur-ance business because there is significant potential to benefit from the distribution channels of the banking business to sell insurance products, which may lead to greater penetration and scope. Consequently, the efficient use of the BCP network is an essential component of Pa-cifico’s growth strategy, through greater integration and alignment of objectives among these two organizations. Such integration process will receive special attention in 2009.
Asset managementCredifondoPrima AFPAtlantic Security Holding Corporation - ASHC
A significant challenge rises in the asset management business, as it is the recovery of our customers’ confidence in the entire system, in markets and in our own ability to manage their assets.
All initiatives aimed at getting closer to our customers by designing appropriate products, further improving risk management and accomplishing higher process efficiencies, and others, are applied also in all fields of this particular business. However, the massive financial crisis has wrecked trust in the system and it is our task to rebuild it, both in the private pension funds system and in the funds managed by ASHC and BCP.
Our reconstruction job will be based on an extremely cautious, conservative and simple investment strategy.

a world in motion29
A PENDING TASK
The strategy for each business at Credicorp Group has been clearly defined, and the corresponding objectives have been set.
However, there is still a pending job, and that is to look beyond our own markets. At present, Peru offers outstanding opportunities to grow, and develop markets and products, because of very low bank penetration and even lower insurance penetration in this market, all of which provides enormous room for growth. Our efforts and energies have focused on this market, one of the highest growth mar-kets in Latin America. However, we are clear there will come a time when other growth opportunities appear beyond our own mar-kets, even if we are no there yet. There we have a pending task ahead.
MILLION NET PROFIT
357.7US$


Our strong equity foundation, our clients’ loyalty and confidence, and our human capital are the tools that helped us rise to the uncertainties we faced in 2008
Financial Results

financial results 32
Financial Resultsmain management indicators
2006 2007 2008
Profitability Net profit attributable to headquarters (US$ million)Net profit per share (US$ per share)Return on average equity1
Return on average assets2
Operating ratiosOperating expenses over total income 3,4
Operating expenses over average assets2
Balance Sheet (US$ million, end of period)AssetsNet loansDepositsNet shareholders’ equity5
Loan portfolio qualityyPast due loans over total loansProvisions over past due loans
Other informationNumber of shares, net6 (in million) Average price per share7 (in US$)Number of employees
230.32.89
18.5%2.0%
45.4%3.8%
12,8825,7378,8391,397
1.3%247.9%
79.832.7
15,213
350.74.40
22.9%2.3%
43.0%3.8%
17,7068,040
11,3511,676
0.7%346.6%
79.859.4
16,380
357.74.49
22.3%1.7%
41.7%3.5%
20,82110,32213,9501,689
0.8%270.7%
79.867.3
19,882
1 Average calculated based on the final balance of each month.2 Average calculated taking the final balance of each quarter.3 Operating expenses include personnel expenses (excluding complementary program of employees’ profit sharing), general expenses, depreciation and amortization. 4 Total revenues include net income from interests, income from commissions, earnings from exchange transactions and net premiums earned. Non recurrent revenues excluded.5 Net equity excluding minority interest.6 Treasury stock excluded. Total number of shares was 94.38 millions.7 Average yearly prices, adjusted for dividend distribution.

a world in motion33
a graphic view of financial results
2008 was signed by an international financial crisis regarded as one of the most severe ever because of its huge impact on global markets and the downfall of world renowned companies. Peru was not im-mune to such events and suffered from a declining stock market. However, from a structural stand-point, Peru was strongly positioned to face the crisis and managed to post one of the highest growth rates in Latin America and the world. Despite such hard-ship, Credicorp performed strongly and recorded net earnings reaching US$ 357.7 million after mi-nority interests.
The middle market was the most dynamic. Wholesale banking followed the increasingly dynamic pace of the economy’s business sector, which translated into signifi-cant loans’ growth and substantial expansion of the trans-actional business, through development of services de-signed to meet our clients’ financial needs. Retail banking accomplished unprecedented results, driven by higher loans and deposits of all types throughout the country. As part of the strategic plan to serve a greater segment of the population, our bank continued to expand its distri-bution channels, which provide the platform to reach its objectives of deeper bank penetration.
The pension fund business strengthened its market posi-tion as leader in contributions, which, combined with an ex-penditure containment policy, allowed Prima AFP to make a positive contribution to Credicorp’s financial bottom line. Such performance was accomplished despite the ongoing crisis, which has resulted in the drop in value of the assets under management.
Difficulties faced by the insurance business, due to the high casualty rates in some branches, led to a loss at the end of the period. However, 2008 was devoted to conclude the reengineering process of our business, in particular to focus on improving the business portfolio’s risk profile and creating products to cater the needs of our clients in the retail segment, where we expect to harvest positive results next year.
The private wealth management business, managed by our ASHC subsidiary is perhaps the line of business hardest hit by the international crisis, because of the greater exposure to the market turmoil of its international fund management business, both for third parties and us. It’s precisely in this business where the greatest portfolio value losses, measured at market prices, were recorded, thus impairing equity positions and annual results, as these losses are partially recognized in financial statements. Net losses, principally in the closing quarter, reached US$ 59.4 million, accounted for by exceptional charges totaling US$ 69.5 million to cover unrealized losses stemming from investment portfolio impairment and provisioning for potential losses and contingencies related to the presumed Madoff scam. In addition to such downside results, the equity account recorded unrealized losses for a total US$ 46.7 million.
Recognition of losses and extraordinary provisions reflect a conservative policy and has had severe negative impacts on Credicorp’s reported results, mitigating the major growth of revenues earned in the financial business.

resultados financieros 34
Despite deepening international financial turmoil and uncertainty, Credicorp accomplished satisfactory results. Net earnings after minority participations reached US$ 357.7 million, 2.0% higher than in 2007. This is a highly satisfactory profit, once we take into account exceptional charges for US$ 93.2 million, of which US$ 49.7 million were used to impair a deteriorated investment portfolio resulting from the overall stock price fall that hit Atlantic Security Bank hardest. The remaining US$ 43.5 million are a provision held by Atlantic Security Holding Corporation for potential losses and contingencies related to the presumed Madoff fraud. Such results demonstrate that the trend in earnings generation started in 2003 remains unchanged, and 2008 earnings was able to absorb the exceptionally heavy charges assumed this year as a consequence of the deep financial crisis the world is facing. Despite, this year’s drop in net earnings, annual average growth of 34.7% is still recorded in this period. Net earnings per share reached US$ 4.5, higher than last year’s US$ 4.4.
Finally, despite the strong impact of the international fi-nancial crisis, returns on average shareholders’ equity (ROE) reached 22.3%, close to 2007’s 22.9%.
Net profit and ROE
0
Source BCP - Finance Division
2003 2004 2005 2006 20082007
50
100
150
200
250
300
350
400
450 26%
22%
18%
14%
10%
6%
2%81
131182
351
3589.4%
13.6%
16.4%
18.5%
22.9% 22.3%
230
Net profit (US$ million) ROE

a world in motion35
Credicorp’s outstanding revenue performance, if we re-move the extraordinary charges for recognized losses as-sociated to impaired assets and provisioning for the Madoff scam, is accounted for by its revenue growth. Earnings from operations exceed last year by 33.7%. Credicorp’s results mainly reflect another year’s of significant operating income growth, following growth of net loans, including provisons, which increased 28.4%, driven by ongoing increases in do-mestic demand.
BCP’s bank business remains strong and profitable, and showed significant resilience to the onslaught of the international crisis. Performance in the asset management business through Prima AFP also contributed to positive results, while the income generation trend continued on an upward slope. However, Atlantic Security Holding Corporation’s private banking business suffered a stronger impact of the world financial crisis that impaired its
unrealized losses from assets’ market valuations affecting its revenues from asset management.
The insurance business likewise had a negative impact on Credicorp’s results because of high casualties recorded this year and restructuring of the insurance business’s risk portfolio, leading to lower corporate risk holdings and a greater emphasis on the mass retail insurance business.
Despite these last two facts, it is worthwhile underscoring the growth and the generation of revenues accomplished during such tough year worldwide.
Operating net income (US$ million)
0
Source BCP - Finance Division
2005 2006 20082007
100
200
300
400
500
600605
452
278316

financial results 36
By year-end 2008, total assets reached US$ 20,821 million, 19% higher than a year earlier, thanks mainly to the strong growth in deposits and funding sources, which supported the expansion of loans and alternative investments. However, the extraordinary 70.3% growth in cash and non-interest bearing deposits responded to the defense strategy adopted in view of the international crisis to enhance our liquidity, impacting the profitability of alternative investments Also contributing to a decline in asset returns is the BCR-mandated increase in reserve requirements in the course of the year and a more con-servative management of our currency exposure given the high volatility in the foreign exchange markets.
The impact of a deepening international financial crisis on Credicorp’s assets was also reflected in a small 5.4% drop in the value of investments available for sale, a re-sult of marking its portfolios down to market values and recognizing certain unrealized losses.
Altogether, this led to lower returns on average assets (ROAA), which dropped from 2.3% in 2007 to 1.7% in 2008.
To increase banking penetration, and also in an effort to develop synergies, Credicorp is developing a number of products and distribution channels that will allow it to op-erate more efficiently and effectively to meet its clients’ needs in all areas of its operations.
Thus, Credicorp now operates a distribution network serving its bank business through 3,411 customer access points, 31.7% larger than in 2007. Of this total, 3,073 are BCPs (including two foreign branches in Miami and Panama) and the remainders are operated by BCP Bolivia (338 access points).
PPS insurance company operates 21 offices and 7 ser-vice modules in third party facilities such as department stores. Likewise, it continues to develop its “Banca Se-guros”, which is the distribution of insurance services through the bank network, to open access to persons’ insurance business products for all our bank clients.
Finally, Prima AFP runs 15 customer care offices, 15% more than in 2007, and 16 points of sales where cus-tomer’s queries are addressed.
Assets and ROAA
0
Source BCP - Finance Division
2003 2004 2005 2006 20082007
2.5%
2.0%
1.5%
1.0%
0.5%
25,000
20,000
15,000
10,000
5,000
1.0%
1.5%
1.9%1.9%
2.3%
Total assets (US$ million) ROAA
Distribution channels - BCP(Units)
agentes bCpDec 06Dec 05
Source BCP - Finance Division
Dec 07 Dec 08
2,000
1,500
500
0
1,000
branches
218273
330
61
551
1,221
1,851
237
atM’s
550655
748
890
8,322 9,088
1.7%
11,03612,882
17,70620,821

a world in motion37
One of Credicorp’s strengths is its funding structure as it has contributed to a strong bottom-line despite the international crisis. Deposits are still Credicorp’s main source of funding, with 74% of total financing sources. Deposits reached a total US$ 13,950 million or 22.9% more than in 2007.
Debt with banks and correspondents increased only slightly, as high foreign currency liquidity in the local mar-ket prevented having to resort to additional funding.
Finally, net equity decreased only 1.1% compared to a year before, principally due to the unrealized investment losses caused by international circumstances that affected market valuations of investment portfolios.
Credicorp’s operative revenues increased 30.5% com-pared to 2007. This growth was mainly accomplished through 29.8% growth of revenue from interests, as a consequence of greater loans and 21.4% increase in commissions charged for bank services.
Operating expenses grew 3.7%, as a consequence of the need to hire more personnel to meet the strong growth of the BCP network. In turn, this resulted in 25.3% increase in salaries and worker benefits, excluding the effect of the provision for the SAR program and 30.2% increase in general administrative expenses.
Consequently, the efficiency indicator improved once again from 43.0% in 2007 to 41.7% in 2008, thus con-firming our organization’s sound management.
Equity and liabilities breakdown (US$ million)
Deposits
Source BCP - Finance Division
2005
2004
2003
2006
Due to banks, bonds and others
Net shareholders` equity
0 5,000 10,000 15,000 20,000 25,000
8,322
9,088
11,036
12,882
17,706
20,8212008
2007
Efficiency ratioOperating income (US$ million)
Operating expenses(US$ million)
Efficiency ratio
Source BCP - Finance Division
2006 2007 2008
2,0001,8001,6001,4001,200
800600400200
0
1,000
20052004
50.3%
42.9%45.4%
43.0%
41.7%
51%
48%
45%
42%
39%

financial results 38
business lines
THE BANKING BUSINESS
The main highlight in 2008’s banking business was the level of earnings at BCP, the main driver of Credicorp’s growth. BCP earnings totaled US$ 424 million, with returns on average equity reaching 32.8%.
However, the banking business’ results were also im-pacted by events related to the world crisis. The impact of the international crisis on Peru’s economy has been slow and mitigated, given Peru’s strong position, dynamic domestic economy and small reliance on world markets. However, we are not immune and market volatility has definitely had a cost.
Loan growth in 2008 was not significantly impacted by the crisis, but the impact on BCP’s returns appeared in several fronts: returns from BCP’s investments in liquid assets and loss in market value of investment portfolios. This cost has reduced expected results in the banking business. Nevertheless, the cost is still small in absolute terms and also when seen against the size and massive impact of the crisis worldwide.
Growth
By year-end 2008, Wholesale Banking loans –in average daily balances– evolved in parallel to the pace of the country’s business sector and remained on the upward trend started in earlier years, posting 36% growth year over year. This result was accomplished despite BCP’s high market share, built over time and typically an obstacle to further growth, dynamic competition and smaller financial intermediation resulting from strong growth of the local capital markets.
BCP’s strong performance in Wholesale Banking relies mostly on the corporate segment. Loans –in average daily balances– by Corporate Banking grew for the fifth year in a row, reaching a 41% year over year growth in 2008, above 2007 rates. Middle Market loans also continued rising at a strong pace, reaching 30% this year compared to a year before.
Nevertheless, as the portfolio reshuffles towards more dynamic and profitable segments, in 2008 retail banking loans accounted for 38% of all BCP loans, vis-à-vis 62% in the wholesale segment. As a consequence of a well-planned strategy focusing on accelerating the growth and development of retail banking and making the necessary investments, this segment earned profits worth US$ 169.4 million, and accounted for 40% of BCP earnings.
Although the market for products, including credit cards, consumer loans and mortgage loans, grew slightly more than in the year before (26.7%), the focus on individual clients allowed BCP’s retail banking to grow above the market average, and increase its market share to 25.7%. This was a consequence of continuity in its commercial strategy to provide differentiated products for each segment, create value through partnering, focusing on lower income consumers, and marketing aimed at maximizing each customer’s value.
Results have been even more significant in business banking. Our focus on training and advice for our clients gained additional relevance in 2008 and yielded ex-tremely positive results, with earnings 15% higher and a contribution closer to 40% of all retail banking results.
Without a doubt, 2008 was a year of unprecedented in-vestment in human capital and infrastructure and explosive growth in service channels, with 57 additional branches (24% more) to a total 330 branches across the nation and additional 142 tellers to our total of 890 automatic teller network; 630 Agentes BCP, our branchless banking network, were added this year reaching a total 1,851. More than 3,000 new employees were needed to serve this ex-panded network.

a world in motion39
BCP: Loans portfolio composition* (%)
Wholesale Banking
* Average daily balanceSource BCP - Finance Division
2006
2007
Retail Banking
2008
100%20% 40% 60% 80%0%
62.0%
63.0%
63.5%
38.0%
37.0%
36.5%
BCP and subsidiaries: Net profit and ROE
0
Source BCP - Finance Division
2006 20082007
50
100
150
200
250
300
350
400
450 34%
31%
30%
29%
28%
27%
26%
33%
32%
28.6%
31.7%
32.8%
248
332
424
Net profit (US$ million) ROE
BCP: Wholesale Banking portfolio* (US$ million)
Corporate Banking
* Average daily balanceSource BCP - Finance Division
2006
2007
Middle Market Banking
2008
6,0001,000 2,000 3,000 4,000 5,0000
3,376
+41%
+33%
+14% +22%
+34%
+31%
2,401
1,805
2,055
1,171
1,572

financial results 40
average daily balances loan portfolio
+ 36%
BCP: Retail Banking portfolio* (US$ million)
Mortgage
* Average daily balancesSource BCP - Finance Division
SME Consumption Credit Card
BCP: Evolution of customer service channels Monthly average transactions (thousands)
Teller transactions
Source BCP - Finance Division
Alternative channels Other
2006
2007
2008
40,0
00
35,0
00
30,0
00
25,0
00
20,0
00
15,0
00
10,0
00
5,00
00
8,763
8,003
15,437 5,597
12,022 4,679
9,836 20,047 6,490
+22%
+21%
+20%
2006
2007
2008
3,000 4,0003,500500 1,000 1,500 2,000 2,5000
1,260
995
803
1,127
733
509 200199
360 283
618 384
+43%
+39%
+29%

a world in motion41
As a result, the number of transactions increased at an even faster rate than they did last year, reaching 22% growth. Operations through alternative service channels, including automatic tellers, Internet banking, telephone banking and Agentes BCP, not only increased their share of total BCP transactions (55%) but grew faster than other channels (28%). Overall, in 2008 72% of operations (two percentage points more than a year before) were trans-acted through electronic channels and not at bank tellers.
Funding
Financial institutions worldwide rose to many chal-lenges in 2008. Credicorp’s banking business was not an exception.
At the beginning of 2008, BCP raised in the international banking market a US$ 410 million three-year syndicated loan at very attractive conditions despite the complicated lending environment. However, a decision was made not to go out again to international capital markets to search for funding, given the volatile and weak reaction of various players in the second half.
Despite gradually increasing interest rates, BCP negotiated the market’s most competitive rates to finance its loans without significant pressure. By requesting funding through short term foreign bank debt, BCP´s debt stock exceeded US$ 1 billion.
Nevertheless, as reserve requirements diminished toward year-end, BCP found itself in a highly liquid position, allowing it to serve its customers’ needs from its own funds.
Against this background, deposits reached US$ 14,235 in 2008, having grown 27.3% year over year. The largest increases were in demand deposits (+37%), followed by time deposits (+26%) and savings (+25%).
Risks
On the other hand, our portfolio’s exposure to foreign exchange credit risk, given the high volatility of foreign exchange rates, was followed very closely. Still, the strong quality of BCP’s portfolio led to relatively low levels of port-folio exposure to loan loss risk derived from debtors whose credit standing could be affected by exchange rate fluctua-tions during this period. By year-end 2008, the portfolio un-der exposure accounted for only 16.4% of total loans. Such sound risk management kept portfolio quality at around 0.8%, while the provisioning ratio fell in 2008 to 271.9%.
Margins
Financial margins deteriorated in the second half as a result of the financial crisis, giving rise to a decline of our net interest margin for 2008.
Net margins from the banking business itself, i.e. those arising from loans, remain strong, sound, and rising, re-flecting a dynamic and competitive domestic market. However, the margin from investments with our liquidity surplus was seriously impacted by market events. Our investments with liquid surpluses shifted strongly to-wards larger reserve deposits at BCR, same which earn minimum or no remuneration, and also to dollar depos-its yielding lower returns than alternative investments in nuevos soles. This change was a consequence of BCR’s monitoring policies, and in-house liquidity and exchange rate exposure policies at BCP.
Costs
Although operating expenses increased by 12%, the efficiency index reached 50.3%, below 2007’s 51.3%. Growth in net earnings from interests (30%) and net earnings from exchange transactions (83%) was mitigate by the increasing in operating expenses aforesaid

financial results 42
BCP and subsidiaries: Efficiency ratio
0
Source BCP - Finance Division
2006 20082007
1,400
1,200
1,000
800
600
400
200
53%
50%
49%
48%
52%
51%50.5%
51.3%
50.3%
Operating income(US$ million)
Operating expenses(US$ million)
Effiencyratio
BCP Bolivia: Net profit ROE
*Local AccountingSource BCP Bolivia
2006 20082007
30 32%35 34%
20 28%25 30%
15 26%
10 24%
5 22%
50 40%
40 36%45 38%
21.7%
14.1
35.6%
39.9%
44.5
27.0
Net profit (US$ million)
0 20%
ROE*
System BCP SystemBCPCoverage ratio: Loans quality:
BCP and subsidiaries: Loan quality and coverage ratio
Source BCP - Finance Division
360% 9%
320% 8%
280% 7%
200% 5%
240% 6%
120% 3%
160% 4%
40% 1%
80% 2%
2002 200820072006200520042003
0 0
a world in motion43
BCP Bolivia
Our banking business was also strengthened by BCP Bolivia’s strong performance, which was better than last year’s and above the Bolivian banking sys-tem as a whole, thanks to appropriate management last year.
On the upside, the macroeconomic environment had a fa-vourable impact on Bolivia’s financial industry, as reflected by increases in the banking sector’s portfolio and loans. BCP Bolivia reported net earnings of US$ 44.5 million, re-flecting 64.5% increase in the same period a year ago. ROE reached 39.9%, higher than in 2007 (35.6%) and twice higher than the system’s average (20.7%). Thus, BCP Bolivia has become one of the leading financial insti-tutions in Bolivia’s banking system.
Likewise, more loans and deposits resulted in a better financial margin, which reached US$ 52.5 million, 36% higher than in 2007, BCP Bolivia held a 13.1% market share for loans and 13.3% for deposits, ranking it third for loans and deposits in the Bolivian banking system.
In addition, such significant growth in BCP Bolivia’s opera-tions reflects our institution’s prudent portfolio manage-ment. The past due ratio reached 2.0% while provisioning totaled 230.6% (compared to 144.3% for the entire Bo-livian banking system).
As a consequence, BCP Bolivia now holds the healthiest and best provisioned portfolios in the system, which to-gether with strong international backing, places it as one of the leading organizations in the Bolivian national finan-cial system.
ASHC
ASB/ASHC’s private banking business was strongly impacted by market valuations of its asset manage-ment business and generated some losses related to ASB’s investment portfolio.
These losses were assessed on an extremely conserva-tive basis. A decision was made to impair and recognize as losses a portion of the securities in the ASB asset port-folio, which had been marked to market values.
Such impact is considerable for a slim margin business as it is private banking, but is absorbed easily by the overall banking business.

financial results 44
THE INSURANCE BUSINESS
Although the insurance business represents a smaller portion of Credicorp’s businesses, its impact on results and profitability indicators is significant.
During 2008, the insurance business recorded negative results due to a significant increase in claims in all three market segments: General Insurance (Property & Casualty), health insurance and life insurance. Additionally, due to the international crisis, the company recorded impairment provisions for US$ 11.3 million. Net results also absorbed a foreign currency translation loss of US$ 3.4 million, attributable to the Nuevo Sol’s devaluation against the American Dollar in 2008.
The insurance business recorded a net loss of US$ 15.0 million in comparison to the US$ 12.5 million net profit achieved in 2007. If consolidation adjustments are con-sidered, Grupo Pacífico’s contribution to Credicorp went from a positive contribution of US$ 9.4 million in 2007 to a loss of US$ 15.9 million in 2008.
Despite this year’s less than favorable results, the Pacífico Group’s businesses continue to successful apply a strategy aimed at reducing risk retention levels in their portfolios. This effort is directed at atomizing and diversifying the in-surance portfolio and transferring exposure to significant corporate risks to the international reinsurance market, thereby reducing the volatility of results and enhancing the ability to predict the same.
During 2008, premiums grew 25.8% to reach US$ 587.6 million at the end of the same period. This means that the Pacífico Group is one of the most important insurance groups in the region (measured by turnover).
Pacífico General Insurance
During 2008, General Insurance premiums performed positively, growing 23.5% in comparison to last year. Total yearly turnover US$ 296.8 million, US$ 56.4 million above the premiums obtained in 2007. Turnover in personal insurance lines- defined by PPS as Automobile Insurance, SOAT, Medical Assistance, Personal and Home Insurance- grew 45.1% in 2008. As such, over the last three years, the participation of personal insurance lines in the PPS insurance portfolio increased from 34.9% to 46.8%.
During 2008, claims totaled US$ 152.8 million- US$ 49.9 million more than those of the previous year- reporting Net Incurred Claims of 87.2% in comparison to 80.2% in 2007, when an earthquake hit the southern-central area of the country.
This increase in claims can be explained by an unusually adverse environment attributable primarily to increased economic activity in the country and an intense rainy sea-son in northern Peru during the fourth quarter of the year. In this scenario, the company processed five large claims in the Fire and Technical Insurance lines representing a total cost of US$ 11.9 million.
It is equally important to mention the extraordinary dy-namism in local new automobile imports, driven by sus-tained economic growth, despite an increase in vehicle theft. Accordingly, PPS has recorded reserves for US$ 8 million. In the Medical Assistance line, the company has experienced a significant increase in claims due to an in-crease in the costs of medical services and increases in actuarial reserve requirements.
Recorded financial income for the year was US$ 19.1 million, 33.8% lower than that obtained in 2007. This result has prompted the company to make impairment provisions for US$ 6.9 million, based on its conservative policy for recording investments and in accordance with international norms for financial information. Neverthe-less, PPS estimates that, given the quality of the assets in its portfolio, these investments will tend to recover.

a world in motion45
mentary Employment Life Insurance) showed a 29% in-crease over last year, attributable to the country’s economic growth, an increase in the number of businesses formalized and development in sectors such as mining and construc-tion. This business line’s performance places the company in second place in the market with a 27.4% share.
Mortgage/Credit Life Insurance has increased its pro-duction 102% in comparison to last year. Without a doubt, the dynamism of the company’s credit market contributed to this line’s good performance (credit cards and home loans), entitling it to a third place position in the market (33%). Although the Personal Accident seg-ment was not fundamental to the company’s yearly earn-ings (representing 5%), it has shown significant growth over last year’s figure (+33%).
Increasing distribution channels, both traditional and alternative ones such as department stores and public service companies, have been key elements in Pacifco Vida’s strategy.
In terms of investment management, despite an adverse international and local financial situation, the portfolio’s financial income continues its positive trend.
With regard to portfolio investment, by December 31, approximately 40% was invested in foreign instruments, 40% in instruments either issued or guaranteed by the Peruvian Government and approximately 20% in local financial institutions or private local companies. As such, more than 80% of the company’s investments correspond to instruments that fall into the International Investment Grade category.
Additionally, more than 96% of the portfolio’s investments are associated with fixed income instruments, which are invested until they reach maturity.
In terms of some of our products, the company’s invest-ment policy is focused on achieving an adequate currency, interest and cash flow matching to mitigate or eliminate associated reinvestment and liquidity risks.
In 2008, general and payroll expenses increased 1.6%. During this period, gross premiums grew 23.5% and net earned premiums 36.5%, which means that expenses represent 22.5% of net premiums earned in comparison to the 30.2% achieved last year. The company continued its efforts to rationalize expenses to achieve levels below 20% of the net earned premium and improve the company’s ability to compete with local and international insurers.
Due to an increase in claims and investment impairment in 2008, PPS recorded a net loss of US$ 19.6 million in its General Insurance business. For this reason, the company’s shareholders decided, in the month of December, to make a cash contribution equivalent to US$ 17.5 million.
Pacífico Vida
By December of 2008, the total premium volume was US$ 178.2 million, 30.4% more than in 2007, which allowed the company to maintain its posi-tion as market leader with a 27.6% share.
In the Individual Life Insurance line, a 31% increase in premiums is attributable to higher productivity and an increase in the sales force, an increase in the place-ment of new products such as Pacífico Ahorro Vida and Premium Life Max and improved service. Pacífico Vida maintained its position as market leader in the Individual Life Insurance segment, with a 32.8% market share as of December of 2008.
The increase (14%) in earnings for the Life Annuity line represents 22% of the company’s total accumulated pre-miums. In terms of market share, the company is in third place with 19.9% (to December of 2008).
At the end of the year, the retirement insurance segment demonstrated a 33% increase in accumulated income over figures for 2007 and once again, Pacífico Vida leads the market with a 31.7% share to December of 2008.
In terms of accumulated levels, the Group Life Insurance (Collective Life, Legal Life and Occupational and Comple-

financial results 46
Pacífico Salud EPS
In terms of the health maintenance business line, the inflation observed in medical service fees could not be immediately transferred to premiums due to the business’s structure, which only permits annual or mid-year adjustments. During this period, the company has been more conservative in its approach regarding IBNR reserves due to the business’s growth and higher claims, which have generated additional reserves for US$ 3.9 million.
Total turnover in 2008 grew 27.4% (US$ 116.5 million). The main contributor to this growth was the Regular Insur-ance product with US$ 102.8 million, followed by the Com-plementary Safety Insurance product with US$ 11.0 million and the Individual product line with US$ 2.7 million.
Total claims for 2008 were US$ 105.1 million, which trans-lated into Net Incurred Claims of 90.3% in comparison to 82.4% for last year.
At the end of 2008, the company recorded a US$ 4.6 million loss in comparison to US$ 2.7 million registered in 2007. Finally, although new companies entered the market in 2007, Pacífico Salud maintained its position as market leader with a 52.4% share.
In business lines that do not guarantee minimum returns, the investment policy focuses on achieving long-term profitability based on risk and each portfolio’s investment policy. It is important to mention that Fitch International, the international credit rating agency, has maintained Pa-cifico Vida’s International Investment Grade.
Administrative expenses have increased 33% in compari-son to last year due to the company’s significant growth in terms of personnel, operations and infrastructure.
The claims ratio in 2008 was 47.9% of the total value of premiums versus 45.3% in 2007. The 2008 results were lowers, in 43%, to the results reached in 2007, due primarily to higher claims in some business lines, a lower proportion of financial income, a larger adjustment for a decrease in market value, and to a lesser extent, in-creases in technical expenses.
By December of 2008, Pacífico Vida had obtained net profit before minority interests of US$ 14.5 million.
at premiums production
+ 25.8%
a world in motion47
THE ASSET MANAGEMENT BUSINESS
Credicorp’s asset management business evolved in a strongly deteriorating international market be-cause of the world financial turmoil, which has not only hurt the real sector in developed countries but also become one of the most severe crises in history, leading to exacerbated volatility in stock markets. In turn, this has led to a significant impairment of financial assets, reflected in the fall of the most important international indicators, including Dow Jones (Cy08 -33.8%), Nasdaq (Cy08 - 40.5%) and S&P (Cy08 - 38.5%).
In Peru, despite strong economic results in 2008 (GDP growth equaling 9.8% and 5.9% inflation), this crisis drove the behavior of the local stock market, leading to plummeting indexes and trading volumes at the Lima Stock Exchange (BVL is the Spanish acronym). BVL’s general index slipped 60% and the stock exchange traded US$ 4,963 million worth of stocks, or almost 48% lower than a year before.
Such economic and financial environment hurt the asset management business at all Credicorp companies.
BCP Asset Management
The value of assets managed by Credifondo, a BCP sub-sidiary and the leader of the local mutual funds market, fell a significant 35%, from US$ 4,332 million in 2007 to US$ 2,817 million this year. However, from the commer-cial management standpoint, Credifondo has preserved its leadership in its industry, with market share of 45.2% by volume and 41.6% by number of participants.
ASHC Asset Management
The financial crisis underway has had an even more signifi-cant impact in Atlantic Security Bank’s international mutual funds and financial consultancy market. Despite extremely conservative investment policies enforced by Atlantic Se-curity, the impact of this crisis translated into the need of provisioning for potential losses and contingencies related to the Madoff scam for a total US$ 43.5 million.
ASHC closed 2008 with a third party portfolio under management worth US$ 1,639.4 million, a 31.7% im-pairment loss compared to a year before. ASB’s clients totaled 3,657.
Prima AFP asset management
In 2008, the AFP system evolved in a stable commercial environment, tending to less intense competition. Prima AFP preserves its market leadership, accompanied by a stronger value proposal that provides quality information and services to its members.
Strong productivity in Prima AFP’s sales helped preserve its high quality client portfolio, accomplish growth goals for insurable monthly remuneration (RAM is the Spanish acro-nym), which is the main source of company revenues, and protect its already strong market share.
On the investment side, weaker international and local fi-nancial markets had a strong impact on the value of funds under management, resulting in a portfolio under manage-ment worth S/.15,275 million to December 2008. During this period, Prima AFP reached a 30.6% share of portfolio under management, below 2007’s 31.4%.

financial results 48
Prima AFP revenues for commissions totaled US$ 70.7 million, or 30.5% higher than in 2007. Its strong portfolio of contributing clients explains that increase, which remained stable throughout the year. Growth is also fuelled by an expanding labour market in Peru.
Payroll expenses totaled US$ 25.8 million, 14.5% more than in 2007. This is a consequence of lower commercial intensity (sales commissions’ expenses). Intensity would have been even greater had it not been for the larger deferred expenses in 2007, in compliance with IFRS.
Administrative expenses reached US$ 16.0 million, or 7.1% higher than in 2007, because of heavier personnel charges and, mainly, increased provisioning for bonuses. It is worthwhile underscoring Prima AFP’s operative ef-ficiencies are the second best in the local market, when computed as the rate of administrative expenses to num-ber of contribution payers. In 2009, Credicorp will continue strengthening its market position, for which it will take advantage of both the infra-structure built and in place since the beginning of Prima AFP operations, as well as the existing synergies with the other Group companies.
Returns at Prima AFP in the last 24 months, place it as the first or second ranking company for funds 2 and 3, and third for fund 1. In terms of risk-adjusted returns, Prima AFP ranked either first or second for fund 2, in line with its goal of managing investments with the lowest possible risk.
As regards contributions, Prima AFP accomplished a remarkable 32.7% market share to December 2008 that was, however, slightly below last year’s because of smaller voluntary contributions, a consequence of market turbulence. To further pursue its objective of improving quality of service to its members, a new branch opened in Chimbote (Ancash) thus widening its network of 15 branches and 16 customer care offices nationwide.
Likewise, Prima AFP also became a stronger commercial player by increasing the number of its contributors into the private pension system and the basis for computing revenues. Estimates based on Prima AFP revenues and its 1.5% management fee charged in 2008 reveal the re-munerations captured increased once again, giving Prima AFP the largest share of the local market (33.3%).
Also in 2008, Prima AFP recorded total revenues worth US$ 72.3 million and earnings reaching US$ 11.2 million (IFRS figures), thanks to an expanded revenue base and gradual reductions of its operative expenses, thus accom-plishing results above expectations.
share in contributions to afps’ system
33.3%

a world in motion49
Following an extremely conservative policy, we reviewed the values attributed to all the papers in that portfolio at year-end. A decision was then made to partially recognize their impairment, in compliance with our auditor’s most conservative standards. Most of these instruments have continued to perform according to investment terms, despite significant and protracted value decreases. Consequently, write-offs do not in any way reflect the papers’ failure to meet such terms, but rather valuation issues resulting from a massive depression in world markets. At ASHC, value loss reaches 7.2% of the total portfolio under management. At PPS, it reaches 0.9% of the total portfolio, while losses total 0.5% at all other Credicorp entities. The total impaired value in 2008 was US$ 56.3 million. It is worth underscoring that the peculiar characteristics of the investment instruments for which such impairments have been recognized lead to estimate that a significant portion of such value loss will most likely be recovered as markets recoup and/or such investments reach maturity.
Proprietary asset management - Credicorp
Third party asset management has become gradually a sig-nificant pillar of Credicorp’s consolidated businesses and a fundamental source of revenues because of the com-missions earned for that service. However, given the or-ganization’s activities, Credicorp still owns some portfolio that is managed in coordination with, and following risk and exposure guidelines fixed for the entire organization. Such portfolios are a natural consequence of our business and are not held for purposes of speculation, and are thus invested mainly in an extremely conservative way. Still, for purposes of diversification, small percentages of such funds have been invested in high quality structured instru-ments that, because of their very own nature, also imply a relatively higher risk-yield.
Those portfolios suffered in the closing months of this year a significant impairment as international securities markets plummeted and spreads increased, resulting in major valuation adjustments, even for AAA fixed income instruments at 2008 closing. Credicorp’s portfolios have totaled US$ 575.6 million at ASHC, US$ 803.7 at PPS and US$ 1,396.7 million in the other group company’s (excluding US$ 2,196.4 held as BCR deposit certificates held in BCP’s portfolio). All these are market value fig-ures at year-end since these securities are permanently marked to market, and as such they have direct impact on Credicorp’s equity.

Despite international hardship, Credicorp per-formed strongly and continued to grow steadily, thus accomplishing sound annual results. Out-standing results came from BCP, the main contribu-tor to Credicorp’s results, and Prima AFP.
Such outstanding results were mainly driven by the banking business. BCP’s contribution reached US$ 410.9 million in 2008, 27% increase year over year. Meanwhile, BCP Bolivia continued on its upward trend, and this year contributed US$ 42.9 million, 59% more than in 2007.
PPS faced a difficult environment, leading to year-end US$ 15.9 million losses. The casualty index increased considerably, from 75% to 90%, in 2008, thus affecting PPS’s results. In addition, also during this period, this organization underwent structural changes that made it harder for Pacifico to react to ongoing events. It is expected PPS will recover next year and contribute posi-tively to Credicorp as in prior years.
credicorp grows with its subsidiaries
In the pension fund business, Prima AFP continued to rise in the local market and accomplish significant market shares (30.6% in funds under managements, 33.3% in collections and 44.7% in voluntary contributions). This year, it contributed US$ 11.2 million, reflecting an extraordinary 269% growth over last year.
Finally, ASHC also faced a year of international financial hardship leading to a loss of US$ 50.4 million, a figure that reflects the severity of the market crisis. Its perfor-mance was affected principally in two fronts: i) recogni-tion of non-realized losses from impaired investments, which reached US$ 41.5 million, and ii) US$ 43.5 million provisioning for potential losses and contingencies relating to the Madoff scam.
Credicorp meanwhile provisioned income taxes on divi-dends to be earned from BCP and PPS, as well as other expenses and value losses of its minority investments.
Contribuciones 2006 2007 2008 2007/2006 2008/2007
BCP1 BCP BoliviaASHCPPS Grupo Crédito2 Prima AFP OthersCredicorp and others3
Credicorp Ltd.OthersTotal
238.9 13.9 15.7 14.5
(12.4) (20.7)
8.4 (26.4) (27.6)
1.2 230.3
322.5 27.0 20.5 9.4 7.7 3.0 4.6
(9.4) (10.9)
1.4 350.7
410.9 42.9
(50.4) (15.9)
18.3 11.2
7.1 (5.1) (7.5)
2.4 357.7
35% 95% 31%
-35% -162% -115% -45% -64% -61% 25% 52%
27% 59%
-345% -269% 138% 269% 53%
-46% -31% 69% 2%
1 Includes BCP Bolivia. 2 Includes Grupo Crédito, Servicorp. 3 Includes dividend taxes of BCP and PPS, and holding’s expenses.
Credicorp companies’ contribution to profit (US$ million)
financial results 50

It is clear from these contributions that the banking business continues to drive Credicorp’s growth, while the onslaught of the financial crisis has led to losses stemming from impaired portfolio investments. However, those losses were recognized following an extremely conservative policy and for that reason, and given the nature of our investments we still hold positive expectations that they will be at least partially recouped. Peru’s strong banking business has allowed Credicorp to continue increasing its earnings, despite digesting such high portfolio valuation losses and provisions, though at a significantly slower pace than last year, to a total of US$ 357.7 million, 2% growth. However, it is important to underscore that the operative bottom-line recorded earnings of US$ 605 million that represent an annual growth of 33.7%, significantly higher than 2007’s, when they only reached US$ 452.3 million.
a world in motion51
operating net income
at netprofit
+ 33.7%
+ 2.0%

financial results 52
market value and stock structure
In 2008, international financial turmoil impacted finan-cial markets and slowed down world growth. However, its impact in Peru has been reduced thanks to the coun-try’s strong economic fundamentals that have allowed Credicorp to remain on a sustained growth path.
This year Peru’s economy grew 9.8%, along a trend started in previous years that demonstrates the strength of the country’s economic fundamentals. High growth rates have prevailed despite the ongoing international meltdown. Nevertheless, Credicorp, despite its efficient dissemina-tion of information about its performance, strategy and accomplishments, still suffered the impact of the current financial market’s conditions that have resulted in negative returns at almost all stock exchanges around the world. Credicorp’s share quotation closed 2008 at US$ 49.96, reflecting a 34.5% loss, which however is still less steep than the -38.9% S&P 500 slide and the NYSE financial sector’s 44.9% average.
In the local scene, the Lima Stock Exchange General Index (IGBVL is the Spanish acronym) dropped 60% because of the heavy concentration of mining stock in the local index and the alignment of the Lima Stock Exchange with main international bourses where com-modity-linked securities saw their perceived value dete-riorate strongly. Likewise, the bank and financial com-pany sector’s stock value fell 29.4% in 2008.
Average daily traded volumes in 2008 reached 398,655 shares, 41.1% higher than last year’s average. At year-end 2008, our corporation’s stock capitalization reached US$ 3,985 million, due to a lower share quotation. In addition, earnings per share reached US$ 4.49, or 2.0% above 2007’s US$ 4.40.
In February 2008, our board agreed a cash distribution equivalent to 40.4% of reported earnings, for a total US$ 141.6 million. This distribution is 15.4% higher than in 2007. Finally, Credicorp’s share holding structure did not expe-rience any significant changes in 2008.

a world in motion53
Stock price evolution (US$)
90
Source Bloomberg
80
70
60
30
20
10
0
Dec
00
Dec
01
Dec
02
Dec
03
Dec
04
Dec
05
Dec
06
Dec
07
Dec
08
50
40
Stock capitalization (US$ million)
7,000
6,000
5,000
4,000
3,000
2,000
1,000
0
Source Bloomberg
20062005200420032002 2007 2008
6,086
3,985
3,265
1,716
1,077829677
Dividends
1.6 60%
55%
50%
45%
40%
35%
30%
1.4
1.2
1.0
0.8
0.6
0.4
0.2
0.0
Source BCP - Finance Division
20062005200420032002 2007 2008
1.51.5
1.3
1.1
0.8
0.40.3
US$ per share % of profit
39.6%
48.8%
48.2%
45.1%
44.4%
33.4%
56.5%


Corporate Governance and Social Responsibility Our corporate governance and social responsibility practices represent the foundation of our organization sustainability and reflect our interest in development of Peru and Peruvians

corporate governance and social responsibility 56
Corporate Governance and social Responsibility banco de crédito bcp
CORPORATE GOVERNANCE
Our almost 120 years of existence have persuaded us strong corporate governance is and will con-tinue to be a substantial component of corporate operations, to ensure an atmosphere of credibility ad transparency.
It is indispensable for BCP to enforce good corporate governance and social responsibility policies. To accomplish this objective, we have gathered our own guidelines in the corporate internal regulations and prepare an annual corporate Governance and Social Responsibility Report (www.viabcp.com).
Following our principles to ensure transparency and build confidence to create value, we decided to retain Pricewa-terhouseCoopers’s services to perform an independent and objective evaluation of the measure to which BCP en-forces its principles and sound corporate governance poli-cies. The results of this consultancy will allow us to identify areas ripe for improvement, in view of the 26 principles of good corporate governance disseminated by Peruvian or-ganizations, such as the National Insurance and Securities Commission – CONASEV- and the Lima Stock Exchange, and international practices adopted by organizations like the Andean Development Corporation (CAF is the Spanish acronym) and OECD.
Board and internal administration
To comply with our mandate and responsibilities, BCP’s Board of Directors includes several special committees that contribute to enhanced bank management.
- Audit Committee- Risk Management Committee- Credit Committee
- Operations Risk Committee- Assets and Liabilities Management Committee (ALCO)- Productivity Committee- IT Governance Committee
For ten years already, BCP has put in place asset laundering and terrorism financing prevention systems.
The Inspections Area’s mission is to manage crisis resulting from fraud crimes and adopt corrective actions to protect BCP’s assets.
To enhance prevention and control improvement initiatives by the Inspections Area, our organization retains dishon-esty and/or professional malpractice insurance policies.
Customer relations
We are aware of the importance of establishing good rela-tions with our customers, with the purpose of obtaining their loyalty.
To better recognize and measure our customers’ satisfac-tion, BCP conducts customer general satisfaction surveys for the various business segments or banking businesses; carries out customer loyalty surveys; compiles a perceived value indicator; evaluates general quality, and prepares a customer loyalty indicator.
In view of increasing and new types of fraud against the banking system, we continue expanding the scope of pre-vention initiatives that involve clients and help them be-come aware of security as a team effort.

a world in motion57
Moreover, BCP listens to customer complaints at both its front and back offices. These complaints are acknowledged through the Electronic Complaints and Requests System (FERS is the Spanish acronym).
Relationship with our shareholders
At BCP, we hold the principle that equitable treatment of all shareholders, including minority and foreign stock-holders, is fundamental to align their interests and those of the various areas of management.
Relations with our team
BCP’s most value asset includes its workers, to whom we give all our attention and support, so they can grow professionally and personally, in addition to other benefits and assistance. This fills us with deep satisfaction.
Relationship with our suppliers
Suppliers are a fundamental component of resource management at BCP. This leads us to choose not just the best suppliers but also to engage in ongoing feedback with them.

58
329,087 escolares registrados a nivel nacional10,537 docentes registrados a nivel nacional9’430,368 exámenes resueltos167’814,723 páginas vistasFigures as of December 28, 2008Source: Apoyo Virtual
Business Classroom (Aula Empresa)
The Aula Empresa program was launched by BCP, to-gether with Instituto Apoyo and Fe y Alegría schools to awake the entrepreneurial spirit of young Peruvians.
10 participating schools8 departments reached3,395 school children beneficiaries95,416 web page hitsFigures as of December 31, 2008 Source: Instituto Apoyo
Volleyball and Field and Track
For 20 years already, our bank has been involved in or-ganizing sports tournaments. These competions have be-come a cradle of Peruvian sports stars that have eventu-ally represented Peru in the international sports scene. 19,648 athletes from the provinces joined in 200813 host cities nationwideFrom 1988 to December 2008 Source: Comisión Organizadora “Semilleros del Perú”
Sports platforms
We have supported the building of alternative recreational areas where children and young people in Lima and pro-vincial underprivileged towns and districts can engage in various sports disciplines.
80 sports platforms230 multi-sports courtsFrom 1988 to December 2008
corporate governance and social responsibility
SOCIAL RESPONSIBILITy
As a good corporate citizen, BCP has directed its Cor-porate Social Responsibility Policy to accomplish quantifiable and sustainable objectives over time, for the benefit of the community at large. The four pillars on which we enforce BCP’s Social Responsibility Policy are as follows. Education and Sports, focusing on children and young people as the makers of their own destinies. Our Social Well Being Policy promotes solidarity with the most vulnerable members of our community. Cultural development helps to strengthen national identity and Business Development allows underscoring and recognizing the efforts of Peru’s firms and improving their competitiveness.
Our commitment is to work harder and through our hard work contribute to our community’s prosperity. Along that line, BCP has undertaken the initiatives described below:
Mathematics for all (Matemáticas para todos – MTT – are the Spanish name and acronym, respectively)
A program underway since 2002, in coordination with Apoyo Institute to increase numeric skills of students from 5th grade primary to senior high school.
596 schools participating in the MPT programMore than 450,000 school beneficiariesPresent in 20 regions across Peru.Figures as of December 31, 2008.Source: Instituto Apoyo.
Pilot 20 Card (Tarjeta Piloto20)
Piloto20 is Peru’s first educational card and was awarded the 2008 award given by the National Association of Advertising Announcers (ANDA) in the social responsibility excellence category.

BCP has continued developing social responsibility programs, expanding to more sectors of our society, in order to contribute to the sustainable development of our community
a world in motion59

60
banco de crédito bcp bolivia
pacífico grupo asegurador
corporate governance and social responsibility
Our principles of sound corporate governance are sustained by an organizational culture based on strong ethical and moral behaviour and organized around a policy of transparency.
To put into practice our social responsibility principles, we have organized 13 social programs focusing on our interest groups; i.e. our customers, clients and the community at large.
As provider of economic support for its policy holders in case of unexpected events and as a risk transfer tool, Pacifico Group pays special attention to its responsibilities not just towards its clients but towards the community at large, its suppliers, employers and stockholders.
In 2008, in line with these objective, it engaged in various initiatives to improve efficiencies in our community-support initiatives and enhance overall corporate responsibilities.
Since 2005, Pacifico has improved the quality of its infor-mation as required by Conasev Resolution No. 140-2005/EF, so investors will count on the best possible informa-
tion about the extent to which strong and sound corporate management practices are enforced in our company.
In the framework of its social responsibility activities for 2008, for the 21st consecutive year, Pacifico supported the school for children with different abilities operated by the Unámonos Association. It organized and raised funds through the sale of paintings submitted to the “Jaime Rey de Castro” painting contest and sale of Christmas cards at our customer service modules.
In addition, it organized the fourth “Pacífico de Oro” award for medical research and development 2008, to promote science research and development in Peru.
SIGNING OF THE UNITED NATIONS WORLD COMPACT
Adopting a business social responsibility-based man-agement model was part of the commitment we made to United Nations Organization’s World Com-pact. We adopted and included in our strategy and corporation, ten behavior and action principles in the field of human rights, labour, the environment and the struggle against corruption.

a world in motion61
Pacifico also provides strong assistance to Peru’s National Police, in particular the force’s Water Rescue Squad. Thanks to this support, 2,618 rescue operations were performed in Lima’s 98 beaches during the 2008 summer season.
In addition, our company aims at promoting coopera-tion and teamwork among its workers through corporate volunteer initiatives by Pacifico employees for underprivi-leged children. Noteworthy were in 2008, “Pacífico te cuida” health care campaign in Rosario and Capilla de Asia communities; school building in San Juan de Lurig-ancho and Ventanilla, and “Reading Forests” that ben-efited 3000 children from several schools in San Juan de Lurigancho district. These activities were carried out in cooperation with the “A roof for my country” initiative and the Foundation for Solidarity Development (Fundades), respectively.
Also in 2008, we improved our system to acknowledge fraud complaints. All Pacifico employees can report anonymously all types of inadequate behaviour concerning either transactions or failure to comply with our organizational code of ethics. We have also further trained our workers in issues concerning prevention of asset laundering and the importance of timely identification and reporting of suspect transactions. Likewise, for better fraud control and to ensure fair complaint processing for our customers, we set up a special research unit that supports major and complex complaints research and analysis. In addition, we will develop more sophisticated complaint fraud detection mechanisms.
During 2007, our company met the challenge of getting Sarbanes-Oxley Law certification referred to compliance with international standards for submission, dissemination and international controls of financial reporting. This year, we also successfully introduced International Financial Re-porting Standard N° 7, which addresses the relevance of
financial instruments’ reporting that properly reflects corpo-rate economic performance, as well as the nature, scope and management of the financial instruments’ risks to which the company may be exposed.
Against this background, in 2008 Pacífico gained recognition as the best personal and corporate insurance company, a distinction earned in the annual executive survey run by the Lima Chamber of Commerce.
By year’end 2008, the most recent opinion leaders Corporate Image Survey taken by Ipsos-Apoyo, places Pacífico Seguros as the best Peruvian insurance company. In addition, this sur-vey reported that in 2006 Pacifico had accomplished a 12% positive perception rating, a figure that increased to 51% in 2008. The results of this survey reflect the outcome of the new strategy put in place in Pacifico Seguros to become a modern and efficient company, in the pursuit of the objective of excellence in service and “commitment to truth”.
Finally, it is worth underscoring Pacifico has managed to retain its BBB- international rating for financial strength awarded by Fitch Ratings in 2007. This rating is equivalent to obtaining investment grade. Such recognition has placed Pacifico among a select group of Latin American insurance companies that awarded such rating.

Financial StatementsCredicorp’s audited financial results reflect the strong position of its finance, according to international account rules

a world in motion65
Contents
666870727476
Consolidated financial statements 2008
Credicorp Ltd. and Subsidiaries
Independent auditor’s reportConsolidated balance sheetsConsolidated statements of incomeConsolidated statements of changes in equityConsolidated statements of cash flowsNotes to the consolidated financial statements


68financial statements
Consolidated balance sheets
Assets Nota 2008 2007
US$(000) US$(000)
Cash and due from banksNon-interest bearingInterest bearing
41,057,4162,708,755
620,9182,452,947
3,766,171 3,073,865
InvestmentsTrading securitiesInvestments available-for-sale 5
36,0844,959,068
50,9955,228,641
4,995,152 5,279,636
Loans, netLoans, net of unearned incomeAllowance for loan losses
610,546,378(224,337)
8,250,819(211,319)
10,322,041 8,039,500
Financial assets designated at fair value through profit or lossPremiums and other policies receivableAccounts receivable from reinsurers and coinsurersProperty, furniture and equipment, netDue from customers on acceptancesSeized assets, netIntangible assets and goodwill, netOther assets
7889
1011
129,631111,561165,144329,458232,580
11,454246,957510,920
213,15385,495
116,141274,93535,90119,615
227,272340,385
Total assets 20,821,069 17,705,898
Consolidated balance sheets As of December 31, 2008 and 2007
The accompanying notes are an integral part of these consolidated balance sheets.

a world in motion69
Liabilities and equity Note 2008 2007
US$(000) US$(000)
Deposits and obligationsNon-interest bearingInterest bearing
123,213,529
10,736,9082,926,3088,424,406
13,950,437 11,350,714
Financial liabilities designated at fair value through profit or lossDue to banks and correspondentsBankers’ acceptances outstandingAccounts payable to reinsurers and coinsurersTechnical reserves, insurance claims reserves and reserves for unearned premiumsBorrowed fundsBonds and subordinated notes issuedOther liabilities
713(a)
814
13(b)1511
-1,179,991
232,58055,841
967,7701,150,716
785,230702,399
50,5611,453,261
35,90133,963
803,478870,404702,298590,045
Total liabilities 19,024,964 15,890,625
EquityCapital and reserves attributable to Credicorp’s equity holders:Capital stockTreasury stockCapital surplusReservesOther reservesRetained earnings
16
471,912(73,107)140,693815,387
(45,393)379,680
471,912(73,107)140,693587,218179,550369,743
1,689,172 1,676,009
Minority interest 106,933 139,264
Total equity 1,796,105 1,815,273
Total liabilities and equity 20,821,069 17,705,898
Consolidated balance sheets (continued) As of December 31, 2008 and 2007

70
Consolidated statements
Note 2008 2007 2006
US$(000) US$(000) US$(000)
Interest and dividend incomeInterest expense
2020
1,400,334(577,411)
1,065,974(432,000)
782,002(283,478)
Net interest and dividend income
Provision for loan losses, net of recoveries 6(d)
822,923
(48,760)
633,974
(28,439)
498,524
4,243
Net interest and dividend income after provision for loan losses 774,163 605,535 502,767
Other incomeBanking services commissionsNet gain on foreign exchange transactionsNet gain on sale of securitiesNet gain on financial assets and liabilities designated at fair value through profit or lossOther
21
7(b)24
394,247108,70951,936
-37,672
324,76161,77846,37665,08824,934
243,77841,63827,2813,521
22,676
Total other income 592,564 522,937 338,894
Insurance premiums and claimsNet premiums earnedNet claims incurred for life, property and casualty and health insurance contracts
2223
393,903(341,910)
297,272(238,600)
251,261(186,522)
Total premiums earned less claims 51,993 58,672 64,739
Other expensesSalaries and employees benefitsAdministrative expenses
Net loss on financial assets and liabilities designated at fair value through profit or lossDepreciation and amortizationProvision for seized assets Merger expensesImpairment loss on available-for-sale investmentsOther
7(b)9(a) y 10(a)
5(c)24
(365,201)(269,291)
(67,060)(57,369)(1,067)
-(60,435)
(101,876)
(409,037)(206,966)
-(51,013)(3,057)
-(5,017)
(71,999)
(303,332)(172,304)
-(50,317)(6,387)(5,706)
-(52,718)
Total other expenses (922,299) (747,089) (590,764)
Consolidated statements of income For the years ended December 31, 2008, 2007 and 2006
financial statements

a world in motion71
Note 2008 2007 2006
US$(000) US$(000) US$(000)
Income before translation result and income tax 496,421 440,055 315,636
Translation result Income tax 17(b)
(17,650)(109,508)
34,627(102,287)
15,216(83,587)
Net income 369,263 372,395 247,265
Attributable to:Equityholders of Credicorp Ltd.Minority interest
357,75611,507
350,73521,660
230,01317,252
369,263 372,395 247,265
Basic and diluted earnings per share for net income attributable to equity holders of Credicorp Ltd. (in United States dollars) 25 4.49 4.40 2.88
Consolidated statements of income (continued) For the years ended December 31, 2008, 2007 and 2006
The accompanying notes are an integral part of these consolidated financial statements.

72
Number of shares issued,
note 25
Attributable to Credicorp´s equity holders Attributable to Credicorp´s equity holders
Minority interest
Totalnet equity
Capitalstock
Treasurystock
Capitalsurplus Reserves
Otherreserves
Retained earnings Total
(In thousands of units) US$(000) US$(000) US$(000) US$(000) US$(000) US$(000) US$(000) US$(000) US$(000)
Balances as of January 1st, 2006
Changes in equity for 2006
Net unrealized gain from investments available-for-sale, note 5(c) and 16(c)
Transfer of net realized gain from investments available-for-sale to the income statement, net of realized loss, note 5(c) and 16(c)
Net gain on cash flow hedge, note 16(c)
94,382
-
-
-
471,912
-
-
-
(73,107)
-
-
-
140,693
-
-
-
269,527
-
-
-
83,302
69,411
(6,620)
1,316
298,113
-
-
-
1,190,440
69,411
(6,620)
1,316
101,515
20,728
(379)
-
1,291,955
90,139
(6,999)
1,316
Income for the year recognized directly in equity
Net income
-
-
-
-
-
-
-
-
-
-
64,107
-
-
230,013
64,107
230,013
20,349
17,252
84,456
247,265
Total recognized income for the period
Transfer of retained earnings to reserves, note 16(c)
Cash dividends, note 16(d)
Dividends of subsidiaries and other
-
-
-
-
-
-
-
-
-
-
-
-
-
-
-
-
-
210,375
-
-
64,107
-
-
-
230,013
(210,375)
(87,738)
-
294,120
-
(87,738)
-
37,601
-
-
(2,170)
331,721
-
(87,738)
(2,170)
Balances as of December 31, 2006 carried forward 94,382 471,912 (73,107) 140,693 479,902 147,409 230,013 1,396,822 136,946 1,533,768
Changes in equity for 2007
Net unrealized gain from investments available-for-sale, note 5(c) and 16(c)
Transfer of net realized gain from investments available-for-sale to the income statement, net of realized loss, note 5(c) and 16(c)
Net loss on cash flow hedge, note 16(c) and 11(b)(ii)
-
-
-
-
-
-
-
-
-
-
-
-
-
-
-
85,129
(12,617)
(40,371)
-
-
-
85,129
(12,617)
(40,371)
(426)
-
-
84,703
(12,617)
(40,371)
Income for the year recognized directly in equity
Net income
-
-
-
-
-
-
-
-
-
-
32,141
-
-
350,735
32,141
350,735
(426)
21,660
31,715
372,395
Total recognized income for the period
Transfer of retained earnings to reserves, note 16(c)
Cash dividends, note 16(d)
Dividends of subsidiaries and other
-
-
-
-
-
-
-
-
-
-
-
-
-
-
-
-
-
107,316
-
-
32,141
-
-
-
350,735
(107,316)
(103,690)
1
382,876
-
(103,690)
1
21,234
-
-
(18,916)
404,110
-
(103,690)
(18,915)
Balances as of December 31, 2007 carried forward 94,382 471,912 (73,107) 140,693 587,218 179,550 369,743 1,676,009 139,264 1,815,273
Changes in equity for 2008
Net unrealized loss from investments available-for-sale, note 5(c) and 16(c)
Transfer of net realized gain from investments available-for-sale to the income statement, net of realized loss and impairment, note 5(c) and 16(c)
Net loss on cash flow hedge, note 16(c) and 11(b)(ii)
-
-
-
-
-
-
-
-
-
-
-
-
-
-
-
(164,302)
20,048
(80,689)
-
-
-
(164,302)
20,048
(80,689)
(32,876)
-
(604)
(197,178)
20,048
(81,293)
Net loss for the year recognized directly in equity
Net income
-
-
-
-
-
-
-
-
-
-
(224,943)
-
-
357,756
(224,943)
357,756
(33,480)
11,507
(258,423)
369,263
Total recognized income for the period
Transfers of retained earnings to reserves, note 16(c)
Cash dividends, note 16(d)
Dividends of subsidiaries and other
-
-
-
-
-
-
-
-
-
-
-
-
-
-
-
-
-
228,169
-
-
(224,943)
-
-
-
357,756
(228,169)
(119,648)
(2)
132,813
-
(119,648)
(2)
(21,973)
-
-
(10,358)
110,840
-
(119,648)
(10,360)
Balances as of December 31, 2008 94,382 471,912 (73,107) 140,693 815,387 (45,393) 379,680 1,689,172 106,933 1,796,105
Consolidated statements of changes in equity For the years ended December 31, 2008, 2007 and 2006
The accompanying notes are an integral part of these consolidated financial statements.
financial statements

a world in motion73
Number of shares issued,
note 25
Attributable to Credicorp´s equity holders Attributable to Credicorp´s equity holders
Minority interest
Totalnet equity
Capitalstock
Treasurystock
Capitalsurplus Reserves
Otherreserves
Retained earnings Total
(In thousands of units) US$(000) US$(000) US$(000) US$(000) US$(000) US$(000) US$(000) US$(000) US$(000)
Balances as of January 1st, 2006
Changes in equity for 2006
Net unrealized gain from investments available-for-sale, note 5(c) and 16(c)
Transfer of net realized gain from investments available-for-sale to the income statement, net of realized loss, note 5(c) and 16(c)
Net gain on cash flow hedge, note 16(c)
94,382
-
-
-
471,912
-
-
-
(73,107)
-
-
-
140,693
-
-
-
269,527
-
-
-
83,302
69,411
(6,620)
1,316
298,113
-
-
-
1,190,440
69,411
(6,620)
1,316
101,515
20,728
(379)
-
1,291,955
90,139
(6,999)
1,316
Income for the year recognized directly in equity
Net income
-
-
-
-
-
-
-
-
-
-
64,107
-
-
230,013
64,107
230,013
20,349
17,252
84,456
247,265
Total recognized income for the period
Transfer of retained earnings to reserves, note 16(c)
Cash dividends, note 16(d)
Dividends of subsidiaries and other
-
-
-
-
-
-
-
-
-
-
-
-
-
-
-
-
-
210,375
-
-
64,107
-
-
-
230,013
(210,375)
(87,738)
-
294,120
-
(87,738)
-
37,601
-
-
(2,170)
331,721
-
(87,738)
(2,170)
Balances as of December 31, 2006 carried forward 94,382 471,912 (73,107) 140,693 479,902 147,409 230,013 1,396,822 136,946 1,533,768
Changes in equity for 2007
Net unrealized gain from investments available-for-sale, note 5(c) and 16(c)
Transfer of net realized gain from investments available-for-sale to the income statement, net of realized loss, note 5(c) and 16(c)
Net loss on cash flow hedge, note 16(c) and 11(b)(ii)
-
-
-
-
-
-
-
-
-
-
-
-
-
-
-
85,129
(12,617)
(40,371)
-
-
-
85,129
(12,617)
(40,371)
(426)
-
-
84,703
(12,617)
(40,371)
Income for the year recognized directly in equity
Net income
-
-
-
-
-
-
-
-
-
-
32,141
-
-
350,735
32,141
350,735
(426)
21,660
31,715
372,395
Total recognized income for the period
Transfer of retained earnings to reserves, note 16(c)
Cash dividends, note 16(d)
Dividends of subsidiaries and other
-
-
-
-
-
-
-
-
-
-
-
-
-
-
-
-
-
107,316
-
-
32,141
-
-
-
350,735
(107,316)
(103,690)
1
382,876
-
(103,690)
1
21,234
-
-
(18,916)
404,110
-
(103,690)
(18,915)
Balances as of December 31, 2007 carried forward 94,382 471,912 (73,107) 140,693 587,218 179,550 369,743 1,676,009 139,264 1,815,273
Changes in equity for 2008
Net unrealized loss from investments available-for-sale, note 5(c) and 16(c)
Transfer of net realized gain from investments available-for-sale to the income statement, net of realized loss and impairment, note 5(c) and 16(c)
Net loss on cash flow hedge, note 16(c) and 11(b)(ii)
-
-
-
-
-
-
-
-
-
-
-
-
-
-
-
(164,302)
20,048
(80,689)
-
-
-
(164,302)
20,048
(80,689)
(32,876)
-
(604)
(197,178)
20,048
(81,293)
Net loss for the year recognized directly in equity
Net income
-
-
-
-
-
-
-
-
-
-
(224,943)
-
-
357,756
(224,943)
357,756
(33,480)
11,507
(258,423)
369,263
Total recognized income for the period
Transfers of retained earnings to reserves, note 16(c)
Cash dividends, note 16(d)
Dividends of subsidiaries and other
-
-
-
-
-
-
-
-
-
-
-
-
-
-
-
-
-
228,169
-
-
(224,943)
-
-
-
357,756
(228,169)
(119,648)
(2)
132,813
-
(119,648)
(2)
(21,973)
-
-
(10,358)
110,840
-
(119,648)
(10,360)
Balances as of December 31, 2008 94,382 471,912 (73,107) 140,693 815,387 (45,393) 379,680 1,689,172 106,933 1,796,105
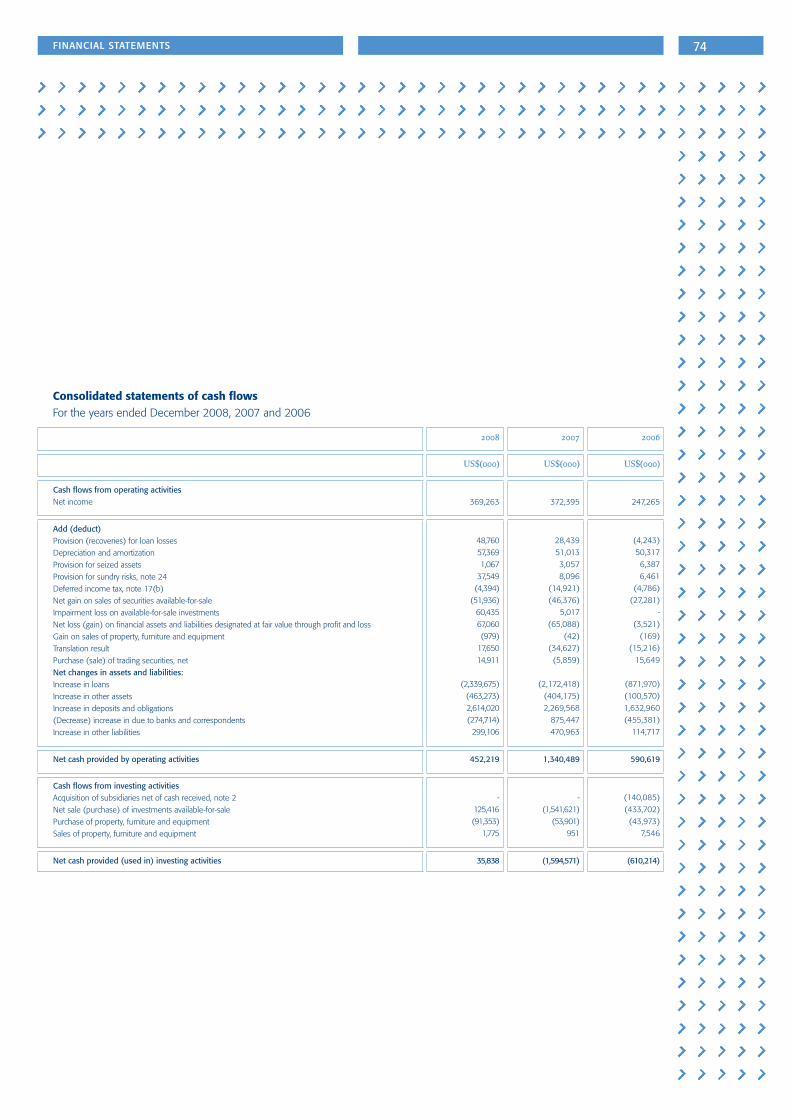
74
2008 2007 2006
US$(000) US$(000) US$(000)
Cash flows from operating activitiesNet income 369,263 372,395 247,265
Add (deduct)Provision (recoveries) for loan lossesDepreciation and amortizationProvision for seized assets Provision for sundry risks, note 24Deferred income tax, note 17(b)Net gain on sales of securities available-for-sale Impairment loss on available-for-sale investmentsNet loss (gain) on financial assets and liabilities designated at fair value through profit and lossGain on sales of property, furniture and equipmentTranslation resultPurchase (sale) of trading securities, netNet changes in assets and liabilities:Increase in loansIncrease in other assetsIncrease in deposits and obligations(Decrease) increase in due to banks and correspondentsIncrease in other liabilities
48,76057,3691,067
37,549(4,394)
(51,936)60,43567,060(979)
17,65014,911
(2,339,675)(463,273)2,614,020(274,714)
299,106
28,43951,0133,0578,096
(14,921)(46,376)
5,017(65,088)
(42)(34,627)(5,859)
(2,172,418)(404,175)2,269,568
875,447470,963
(4,243)50,3176,3876,461
(4,786)(27,281)
-(3,521)
(169)(15,216)
15,649
(871,970)(100,570)1,632,960(455,381)
114,717
Net cash provided by operating activities 452,219 1,340,489 590,619
Cash flows from investing activitiesAcquisition of subsidiaries net of cash received, note 2 Net sale (purchase) of investments available-for-salePurchase of property, furniture and equipmentSales of property, furniture and equipment
-125,416(91,353)
1,775
-(1,541,621)
(53,901)951
(140,085)(433,702)(43,973)
7,546
Net cash provided (used in) investing activities 35,838 (1,594,571) (610,214)
Consolidated statements of cash flows For the years ended December 2008, 2007 and 2006
financial statements

a world in motion75
The accompanying notes are an integral part of these consolidated financial statements.
2008 2007 2006
US$(000) US$(000) US$(000)
Cash flows from financing activitiesIssuance of bonds and subordinated debtRedemption of bonds and subordinated debtIncrease in borrowed fundsPayments of borrowed fundsCash dividends
257,509 (190,402)
300,000(19,688)
(119,648)
256,014(75,728)499,792
-(103,690)
167,247(91,925)
90,612-
(87,738)
Net cash provided by financing activities 227,771 576,388 78,196
Translation (loss) gain on cash and cash equivalents (23,522) 18,029 14,114
Net increase in cash and cash equivalents 692,306 340,335 72,715
Cash and cash equivalents at the beginning of the year 3,073,865 2,733,530 2,660,815
Cash and cash equivalents at the end of the year 3,766,171 3,073,865 2,733,530
Supplementary cash flows information:Cash paid during the year forInterestIncome tax
Cash received during the year forInterest
549,655124,754
1,378,633
415,15786,754
1,106,972
265,83896,284
810,266
Consolidated statements of cash flows (continued)
notes to the consolidated financial statements 76(continued)
1 operations
Credicorp Ltd. (hereinafter “Credicorp” or “the Group”) is a limited liability company incorporated in Bermuda in 1995 to act as a holding company and to coordinate the policies and administration of its subsidiaries. It is also engaged in investing activities.
Credicorp Ltd., through its banking and non-banking subsidiaries, provides a wide range of financial services and products throughout Peru and in certain international markets. Its major subsidiary is Banco de Crédito del Perú (hereinafter “BCP” or the “Bank”), a Peruvian universal bank. Credicorp’s address is Claredon House 2 Church Street Hamilton, Bermuda; likewise, administration offices of its representative in Peru are located in Calle Centenario Nº156, La Molina, Lima, Peru.
Credicorp is listed in Lima and New York stock exchanges.
The consolidated financial statements as of and for the year ended December 31, 2007 were approved in the General Shareholders’ Meeting dated on March, 28, 2008. The accompanying consolidated financial statements as of and for the year ended December 31, 2008, were approved by the Audit Committee and Management on February 25, 2009 and will be submitted for their approval at the Board of Directors and the General Shareholders’ Meeting that will occur within the period established by law; in Management’s opinion, they will be approved without modifications.
2 acquisition of afp unión vida s.a.
On August 24, 2006, Credicorp, through its subsidiary Prima AFP, acquired for approximately US$141.5 million AFP Unión Vida S.A. (a private pension fund management company operating in Peru) from Grupo Santander Perú S.A.
At the General Shareholder’s Meeting of Prima AFP, held on September 6, 2006, the merger with AFP Unión Vida S.A. was approved, with effective date December 1, 2006.
The acquisition of AFP Unión Vida S.A. was recorded using the purchase method, as required by IFRS 3, “Business Combinations”. Assets and liabilities were recorded at their estimated market values at the acquisition date, including the identified intangible assets acquired. Book value and fair values of the identified assets and liabilities at their acquisition date were as follows:
notes to the consolidated financial statementsas of December 31, 2008 and 2007

a world in motion77
On January 2007, the arbitration proceeding between Credicorp and Grupo Santander Peru S.A. ended; as a result Credicorp received a reimbursement of approximately US$4.5 million, which was recorded as a reduction of goodwill, note 10(b).
3 significant accounting policies
Significant accounting principles used in the preparation of Credicorp’s consolidated financial statements are set out below and were consis-tently applied to all of the years presented, unless otherwise stated.
(a) Basis of presentation and use of estimates
The consolidated financial statements were prepared in accordance with International Financial Reporting Standards (IFRS) as issued by the International Accounting Standards Board (IASB). The consolidated financial statements were prepared on a historical cost basis, except for available-for-sale investments, derivative financial instruments, the share based compensation and financial assets and financial liabilities des-ignated at fair value through profit or loss, which were measured at fair value. The consolidated financial statements are presented in United States dollar (US$), and all values are rounded to the nearest US$ thousand, except when otherwise indicated.
The preparation of the consolidated financial statements in conformity with IFRS requires Management to make estimates and assumptions that affect the reported amounts of assets, liabilities, revenues and expenses and the disclosure of significant events in notes to the consoli-dated financial statements.
Estimates and judgments are continually evaluated and are based on historical experience and other factors, including expectations of future events that are believed to be reasonable under the current circumstances. Actual results could differ from those estimates. The most sig-nificant estimates comprised in the accompanying consolidated financial statements are related to the computation of the allowance for loan losses, the measurement of financial instruments, the technical reserves for claims and premiums, the provision for seized assets and the valuation of derivatives. The accounting criteria used for each of these items are described in this note.
Book value of the entity acquired
Fair value recognition
Fair value of the entity acquired
US$(000) US$(000) US$(000)
Assets Cash and cash equivalentsRestricted mutual fund Client relationships, note 10(a)Other IntangiblesProperty, furniture and equipmentGoodwillOther assets
LiabilitiesTrade accounts payableOther accounts payableOther liabilities
1,42832,265
-3,4242,060
-5,605
4,6885,3527,433
--
88,3789,603
-49,047
-
--
32,824
1,42832,26588,37813,0272,060
49,0475,605
4,6885,352
40,257
Net acquired assets 27,309 114,204 141,513

notes to the consolidated financial statements 78(continued)
The accounting policies adopted are consistent with those of the previous year, except that the Group has adopted those new IFRS and revised IAS mandatory for years beginning on or after January 1, 2008. The adoption of the new and revised standards did not have a significant effect on the accompanying consolidated financial statements; therefore, it has not been necessary to amend the comparative figures. In summary:
- IAS 39, “Financial Instruments: Recognition and Measurement” and IFRS 7, “Financial Instruments: Disclosures” – “Reclassification of Financial Assets” (Amendment). This amendment allows reclassifications of certain financial instruments out of held for trading and available for sale categories since July 1, 2008. Due to the fact that Credicorp did not reclassify any of its financial instruments, this standard does not have any impact on the Group’s consolidated financial statements.
- IFRIC 11, IFRS 2 – “Group and Treasury Share Transactions”, this interpretation requirements arrangements whereby an employee is granted rights to an entity´s equity instruments to be accounted for as an equity-settled scheme, even if the entity buys the in-struments from another party, or the shareholders provide the equity instruments needed. The Group has no transactions to be considered under this interpretation.
- IFRIC 12, “Service Concession Arrangements”, this interpretation applies to service concession operators and explains how to account for the obligations undertaken and rights received in service concession arrangements. No member of the Group is an operator and, therefore, this interpretation has no impact on the Group. - IFRIC 14 - IAS 19, “The Limit on a Defined Benefit Asset, Minimum Funding Requirements and their Interaction”, addresses how to assess the limit, under IAS 19 “Employee Benefits”, on the amount of the surplus that can be recognized as an asset particularly when a minimum funding requirement exists. This standard does not have any impact on the Group’s consolidated financial state-ments.
(b) Consolidation
SubsidiariesSubsidiaries are all entities (including special purpose entities) in which the Group has the power to govern their financial and operating poli-cies. This situation is generally evidenced by controlling more than one half of the voting rights.
Subsidiaries are fully consolidated from the date on which effective control is transferred to the Group and are no longer consolidated from the date control ceases. The consolidated financial statements include the assets, liabilities, income and expenses of Credicorp and its Sub-sidiaries. Transactions between the Group’s entities, including balances, gains or losses are eliminated.
Acquisition of a subsidiary is recorded using the purchase method of accounting. The cost of an acquisition is measured as the fair value of the assets received, equity instruments issued and liabilities incurred or assumed at the date of acquisition, plus directly attributable cost. The excess of the cost of acquisition over the fair value of the Group’s share of the identifiable net assets and intangible assets acquired is recorded as goodwill.
Assets in custody or managed by the Group, such as investment funds and private pension funds (AFP funds), are not part of the consolidated financial statement of the Group, note 3(z).
Net equity and net income attributable to the minority interest are shown separately on the consolidated balance sheets and the consolidated statements of income, respectively. AssociatesAn associate is an entity over which the Group has significant influence but not control. Investments in these entities represent shareholding between 20 and 50 percent of the voting rights; and are recognized initially at cost and then are accounted for by the “equity method”. The Group does not have significant investments in associates; therefore, they are included in the caption “Other assets” in the consolidated bal-ance sheets; gains resulting from the use of the equity method of accounting are included in the caption “Other income” of the consolidated income statement.

a world in motion79
Minority interestTransactions with minority interests are treated as transactions with third parties. Disposals of minority interests result in gains or losses which are recorded in the consolidated income statement. Purchases from minority interests result in goodwill, which is the difference between any consideration paid and the carrying value of the subsidiary’s net assets.
As of December 31, 2008 and 2007, the following entities comprise the Group (individual financial statements data is presented in accor-dance with IFRS and before eliminations for consolidation purposes, except for the elimination of Credicorp´s treasury stock and its related dividends):
i Banco de Crédito (BCP) is a universal bank incorporated in Peru in 1889. Its activities are supervised by the Superintendence of Banking, Insurance and AFP (the Peruvian banking, insurance and AFP authority, hereafter the SBS for its Spanish acronym). During 2008 and 2007, Credicorp acquired 0.08 percent and 0.09 percent of BCP shares, respectively, owned by minority interest.
ii Atlantic Security Holding Corporation (ASHC) is incorporated in the Cayman Islands; its main activity is to invest in capital stock. Its most significant subsidiary is Atlantic Security Bank (ASB), which is incorporated in the Cayman Islands, began operations on December 1981, and operates through branches and offices in Grand Cayman and the Republic of Panama; its main activity is private and institutional banking services and trustee administration.
iii El Pacífico Peruano-Suiza Compañía de Seguros y Reaseguros (PPS) is incorporated in Peru, provides property, casualty, life, health and personal insurance. Its main subsidiaries are El Pacífico Vida Compañía de Seguros y Reaseguros S.A. and Pacífico S.A. Entidad Prestadora de Salud (EPS), holding 61.99 percent and 100.00 percent, respectively, of their capital stock. PPS and its subsidiaries activities are supervised by the SBS.
iv Grupo Crédito S.A. is incorporated in Peru, its main activity is to invest in listed and not listed securities in Peru. Its main subsidiary is Prima AFP, a private pension fund administrator incorporated on March, 2005, whose activities are supervised by the SBS. As of December 31, 2008, Prima AFP total assets, liabilities and net income amounted to US$225.6, US$96.3, and U$11.2 million, respectively (US$246.4 million, US$116.8 million and US$3.0 million, respectively, as of December 31, 2007).
v CCR Inc., is a special purposes entity incorporated in Bahamas in 2001, whose main activity is to manage certain loans granted to BCP by foreign financial entities, note 13(b). These loans are collateralized by transactions performed by BCP. As of December 31, 2008 and 2007, the negative equity is generated by unrealized losses of cash flow hedge derivatives, as it is explained in note 16(c) and 11(b)(ii).
vi Credicorp Securities Inc., is incorporated in the United States of America and began operations on January, 2003; it provides securities brokerage services mainly to retail customers in Latin America.
Entity Percentage of participation (direct
and indirect) Assets Liabilities Equity Net income (loss)
2008 2007 2008 2007 2008 2007 2008 2007 2008 2007
% % US$(000) US$(000) US$(000) US$(000) US$(000) US$(000) US$(000) US$(000)
Banco de Crédito del Perú and Subsidiaries (i)
Atlantic Security Holding Corporation and Subsidiaries (ii)
El Pacífico Peruano-Suiza Compañía de Seguros y Reaseguros and Subsidiaries (iii)
Grupo Crédito S.A. and Subsidiaries (iv)
CCR Inc. (v)
Credicorp Securities Inc. (vi)
97.41
100.00
75.74
100.00
99.99
99.99
97.33
100.00
75.74
100.00
99.99
99.99
18,514,133
1,453,915
1,307,547
335,854
1,152,336
2,851
15,171,338
1,738,697
1,197,943
389,577
879,997
2,047
17,112,683
1,360,471
1,155,405
101,748
1,247,465
470
14,038,774
1,401,237
932,765
125,089
917,655
215
1,401,450
93,444
152,142
234,106
(95,129)
2,381
1,132,564
337,460
265,178
264,488
(37,658)
1,832
423,529
(50,395)
(20,994)
18,271
138
549
331,652
20,537
21,979
7,662
(4)
347

notes to the consolidated financial statements 80(continued)
(c) Foreign currency translation
The Group considers that its functional and presentation currency is the United States Dollar (U.S. Dollar or US$), because it reflects the eco-nomic substance of the underlying events and circumstances relevant to the Group; insofar as its main operations and/or transactions in the different countries where the Group operates; such as: loans granted, financing obtained, sale of insurance premiums, interest income and expense, and that an important percentage of wages and purchases are established and settled in U.S. Dollars.
Financial statements of each of Credicorp’s subsidiaries are measured using the currency of the country in which each entity operates and are translated into U.S. Dollars (functional and presentation currency) as follows:
- Monetary assets and liabilities are translated at the free market exchange rate at the date of the consolidated balance sheet.
- Non-monetary accounts are translated at the free market exchange rate prevailing at the transaction date.
- Income and expenses, except for those related to non-monetary assets which are translated at the free market exchange rate prevailing at the transaction date, are translated monthly at the average monthly exchange rate.
All resulting translation differences are recognized in the consolidated income statement.
(d) Income and expense recognition from banking activities
Interest income and expense for all interest-bearing financial instruments, including those related to financial instruments classified as held for trading or designated at fair value through profit or loss, are recognized within “Interest and dividend income” and “Interest expense” in the consolidated income statement using the effective interest rate, which is the rate that discounts estimated future cash payments or receipts through the expected life of the financial instrument or a shorter period, where appropriate, to the net carrying amount of the financial asset or financial liability.
Interest income is suspended when collection of loans become doubtful, i.e. when loans are overdue more than 90 days or when the bor-rower or securities’ issuer defaults, if earlier than 90 days; such income is excluded from interest income until collected. Uncollected income on such loans is reversed against income. When Management determines that the debtor’s financial condition has improved, the recording of interest thereon is reestablished on an accrual basis. Interest income includes coupons earned on fixed income investment and trading securities and the accrued discount and premium on financial instruments. Dividends are recognized as income when they are declared.
Fees and commission income are recognized on an accrual basis when earned. Contingent credit fees for loans that are likely to be drawn down and other credit related fees are deferred (together with any direct incremental costs) and recognized as an adjustment to the effective interest rate on the loan.
All other revenues and expenses are recognized on an accrual basis.

a world in motion81
(e) Insurance activities
Product classification:Insurance contracts are those contracts when the Group (the insurer) has accepted significant insurance risk from another party (the poli-cyholders) by agreeing to compensate the policyholders if a specified uncertain future event (the insured event) adversely affects the poli-cyholders. This definition also includes reinsurance contracts that the Group holds. As a general guideline, the Group determines whether it has significant insurance risk, by comparing benefits paid with benefits payable if the insured event did not occur. Insurance contracts can also transfer financial risk.
Once a contract has been classified as an insurance contract, it remains an insurance contract for the remainder of its lifetime, even if the insurance risk reduces significantly during this period, unless all rights and obligations are extinguished or expire. Investment contracts can however be reclassified as insurance contracts after inception if insurance risk becomes significant.
Reinsurance:The Group cedes insurance risk in the normal course of business for all of its businesses. Reinsurance assets represent balances due from reinsurance companies. Amounts recoverable from reinsurers are estimated in a manner consistent with the outstanding claims provision or settled claims associated with the reinsurer’s policies and are in accordance with the related reinsurance contract.
Reinsurance assets are reviewed for impairment at each reporting date or more frequently when an indication of impairment arises during the reporting year. Impairment occurs when there is objective evidence as a result of an event that occurred after initial recognition of the reinsurance asset that the Group may not receive all outstanding amounts due under the terms of the contract and the event has a reliably measureable impact on the amounts that the Group will receive from the reinsurer. The impairment loss is recorded in the consolidated income statement.
Gains or losses on buying reinsurance are recognized in the consolidated income statement immediately at the date of purchase and are not amortized.
Ceded reinsurance arrangements do not relieve the Group from its obligations to policyholders.
The Group also assumes reinsurance risk in the normal course of business for non-life insurance contracts when applicable. Premiums and claims on assumed reinsurance are recognized as revenue or expenses in the same manner as they would be if the reinsurance were con-sidered direct business, taking into account the product classification of the reinsured business.
Reinsurance liabilities represent balances due to reinsurance companies. Amounts payable are estimated in a manner consistent with the related reinsurance contract.
Premiums and claims are presented on a gross basis for both ceded and assumed reinsurance.Reinsurance assets or liabilities are derecognized when the contractual rights are extinguished or expire or when the contract is transferred to another party.
Reinsurance contracts that do not transfer significant insurance risk are accounted for directly through the consolidated balance sheet. These are deposit assets or financial liabilities that are recognized based on the consideration paid or received less any explicit identified premiums or fees to be retained by the reinsured. Investment income on these contracts is accounted for using the effective interest rate method when accrued.
Deferred acquisition costs (DAC):Those direct and indirect costs incurred during the financial period arising from the writing or renewing of insurance contracts, are deferred to the extent that these costs are recoverable out of future premiums. All other acquisition costs are recognized as an expense when incurred.

notes to the consolidated financial statements 82(continued)
Subsequent to initial recognition, these costs are amortized on a straight line basis based on the term of expected future premiums, which typically varies between 5 and 11 years for life insurance contracts and is normally 1 year for non-life insurance contracts. Amortization is recorded in the consolidated income statement.
Changes in the expected useful life or the expected pattern of consumption of future economic benefits embodied in the asset are accounted for by changing the amortization period and are treated as a change in an accounting estimate.
An impairment review is performed at each reporting date or more frequently when an indication of impairment arises. When the recoverable amounts is less than the carrying value an impairment loss is recognized in the consolidated income statement. DAC is also considered in the liability adequacy test for each reporting period.
DAC are derecognized when the related contracts are either settled or disposed of.
Reinsurance commissions:Commissions receivable on outwards reinsurance contracts are deferred and amortized on a straight line basis over the term of the expected premiums payable.
Insurance contract liabilities:i Life insurance contracts liabilitiesLife insurance liabilities are recognized when contracts are entered into and premiums are charged. These liabilities are measured by using the net premium method. The liability is determined as the sum of the discounted value of the expected future benefits, claims handling and policy administration expenses, policyholder options and guarantees and investment income from assets backing such liabilities, which are directly related to the contract, less the discounted value of the expected theoretical premiums that would be required to meet the future cash outflows based on the valuation assumptions used. The liability is either based on current assumptions or calculated using the assumptions established at the time the contract was issued, in which case a margin for risk and adverse deviation is generally included. A separate reserve for longevity may be established and included in the measurement of the liability. Furthermore, the liability for life insurance contracts comprises the provision for unearned premiums and unexpired risks, as well as for claims outstanding, which includes an estimate of the incurred claims that have not yet been reported to the Group. Adjustments to the liabilities at each reporting date are recorded in the consolidated income statement. Profits originated from margins of adverse deviations on run-off contracts, are recognized in the consolidated income statement over the life of the contract, whereas losses are fully recognized in the consolidated income statement during the first year of run-off. The liability is derecognized when the contract expires, is discharged or is cancelled.
At each reporting date, an assessment is made of whether the recognized life insurance liabilities are adequate, net of related DAC, by using an existing liability adequacy test as laid out under IFRS 4.
ii Non-life insurance (which comprises general insurance and healthcare) contract liabilitiesNon-life insurance contract liabilities are recognized when contracts are entered into and premiums are charged. These liabilities are known as the outstanding claims provision, which are based on the estimated ultimate cost of all claims incurred but not settled at the consolidated balance sheet date, whether reported or not, together with related claims handling costs and reduction for the expected value of salvage and other recoveries. Delays can be experienced in the notification and settlement of certain types of claims, therefore the ultimate cost of these cannot be known with certainty at the consolidated balance sheet date. Incurred but non-reported claims (hereafter “IBNR”) are estimated and included in the provision (liabilities). IBNR reserves as of December 31, 2008 and 2007, were determined on the basis of the Bornhuetter - Ferguson methodology – BF (a generally accepted actuarial method), which considers a statistical analysis of the recorded loss history, the use of projection methods and, when appropriate, qualitative factors that reflect present conditions or trends that could affect historical data. No provision for equalization or catastrophe reserves is recognized. The liabilities are derecognized when the contract expires, is discharged or is cancelled.
The provision for unearned premiums represents premiums received for risks that have not yet expired. Generally the reserve is released over the term of the contract and is recognized as premium income.

a world in motion83
At each reporting date the Group reviews its unexpired risk and a liability adequacy test is performed as laid out under IFRS 4 to determine whether there is any overall excess of expected claims and DAC over unearned premiums. This calculation uses current estimates of future contractual cash flows after taking account of the investment return expected to arise on assets relating to the relevant nonlife insurance technical provisions. If these estimates show that the carrying amount of the unearned premiums (less related deferred acquisition costs) is inadequate the deficiency is recognized in the consolidated income statement by setting up a provision for liability adequacy. Income recognitioni Gross premiumsGross recurring premiums on life contracts are recognized as revenue when payable by the policyholder. For single premium business rev-enue is recognized on the date on which the policy is effective.
Gross general insurance written premiums comprise the total premiums receivable for the whole period of cover provided by contracts en-tered into during the accounting period and are recognized on the date on which the policy incepts. Premiums include any adjustments arising in the accounting period for premiums receivable in respect of business written in prior accounting periods.
Unearned premiums are those proportions of premiums written in a year that relate to periods of risk after the consolidated balance sheet date. Unearned premiums are calculated on a daily pro rata basis. The proportion attributable to subsequent periods is deferred as a provision for unearned premiums.
ii Reinsurance premiumsGross reinsurance premiums on life contracts are recognized as an expense when payable or on the date on which the policy is effective.
Gross general reinsurance premiums written comprise the total premiums payable for the whole cover provided by contracts entered into the period and are recognized on the date on which the policy incepts. Premiums include any adjustments arising in the accounting period in respect of reinsurance contracts incepting in prior accounting periods.
Unearned reinsurance premiums are those proportions of premiums written in a year that relate to periods of risk after the consolidated balance sheet date. Unearned reinsurance premiums are deferred over the term of the underlying direct insurance policies for risks-attaching contracts and over the term of the reinsurance contract for losses-occurring contracts.
iii Fees and commission incomeInsurance contract policyholders are charged for policy administration services, investment management services, surrenders and other contract fees. These fees are recognized as revenue over the period in which the related services are performed. If the fees are for services provided in future periods then they are deferred and recognized over those future periods.
Benefits, claims and expenses recognition
i Gross benefits and claimsGross benefits and claims for life insurance contracts include the cost of all claims arising during the year including internal and external claims handling costs that are directly related to the processing and settlement of claims. Death claims and surrenders are recorded on the basis of notifications received. Maturities and annuity payments are recorded when due.
General insurance and health claims includes all claims occurring during the year, whether reported or not, related internal and external claims handling costs that are directly related to the processing and settlement of claims, a reduction for the value of salvage and other recoveries, and any adjustments to claims outstanding from previous years.
ii Reinsurance claimsReinsurance claims are recognized when the related gross insurance claim is recognized according to the terms of the relevant contract.

notes to the consolidated financial statements 84(continued)
(f) Financial Instruments: Initial recognition and subsequent measurement Purchases or sales of financial assets that require delivery of assets within the time frame generally established by regulation or convention in the marketplace are recorded on the trade date, i.e. the date that the Group commits to purchase or sell the asset. Derivatives are recognized on a trade date basis.
The classification of financial instruments at initial recognition depends on the purpose for which the financial instruments were acquired and their characteristics. All financial instruments are measured initially at their fair value plus, in the case of financial assets and financial liabilities not at fair value through profit or loss, any directly attributable incremental cost of acquisition or issue.
The Group classifies its financial instruments in one of the categories defined by IAS 39: financial assets and financial liabilities at fair value through profit or loss; loans and receivables; available-for-sale financial investments and other financial liabilities. Management defines the classification of its financial instruments at initial recognition.
i Financial assets and financial liabilities at fair value through profit or loss:This category has two sub-categories: financial assets held for trading and financial assets and liabilities designated at fair value through profit or loss at inception. A financial asset is classified as held for trading if it is acquired or incurred principally for the purpose of selling or repurchas-ing in the near term or if it is part of a portfolio of identified financial instruments that are managed together and for which there is evidence of a recent actual pattern of short-term profit-taking. Derivatives are also categorized as held for trading unless they are designated as hedging instruments. Financial assets and financial liabilities are designated at fair value through profit or loss when the following criteria are met:
- The designation eliminates or significantly reduces the inconsistent treatment that would otherwise arise from measuring the assets or li-abilities or recognizing gains or losses on them on a different basis; or
- The assets and liabilities are part of a group of financial assets, financial liabilities or both which are managed and their performance evalu-ated on a fair value basis, in accordance with a documented risk management or investment strategy; or
- The financial instrument contains an embedded derivative, unless the embedded derivative does not significantly modify the cash flows or it is clear, with little or no analysis, that it would not be separately recorded.
Changes in fair value are recorded in the consolidated income statement caption “Net gain on financial assets and liabilities designated at fair value through profit and loss”. Interest earned or incurred is accrued in the consolidated income statement in the captions “Interest and dividend income” or “Interest expense”, respectively, according to the terms of the contract. Dividend income is recorded when the right to the payment has been established.
ii Loans and receivables:Loans and receivables are non-derivative financial assets with fixed or determinable payments that are not quoted in an active market, other than: those that the entity intend to sell immediately or in the short term, those that the entity upon initial recognition designates as available for sale; or those for which the holder may not recover substantially all of its initial investment, other than because of credit deterioration.
After initial measurement, loans and receivables are subsequently measured at amortized cost using the effective interest rate method, less any allowance for impairment. Amortized cost is calculated considering any discount or premium on acquisition and fees and costs that are an integral part of the effective interest rate. Impairment losses are recognized in the consolidated income statement in the caption “Provi-sion for loan losses”.
Direct loans are recorded when disbursement of funds to the clients are made. Indirect (off-balance sheet) loans are recorded when docu-ments supporting such facilities are issued. Likewise, Credicorp considers as refinanced or restructured those loans that change their payment schedules due to difficulties in the debtor’s ability to repay the loan.
An allowance for loan losses is established if there is objective evidence that the Group will not be able to collect all amounts due according to the original contractual terms of the loan. The allowance for loan losses is established based in the internal risk classification and considering any guarantees and collaterals received, note 3(i) and 29.1.

a world in motion85
iii Available-for-sale financial investments:Available-for-sale financial investments are those which are designated as such (to be held for an indefinite period, which may be sold in response to liquidity needs or changes in the interest rates, exchange rates or equity price); or do not qualify to be classified as designated at fair value through profit or loss, held-to-maturity, loans or receivables.
After initial measurement, available-for-sale financial investments are subsequently measured at fair value. Unrealized gains and losses are recognized directly in equity in “Other reserves”, net of its corresponding deferred tax and minority interest. When an available-for-sale financial investment is disposed of, the cumulative gain or loss previously recognized in equity is recognized in the consolidated income statement in the caption “Net gain on sales of securities” considering the average cost basis. Interest and dividends earned are recognized in the consolidated income statement in the caption “Interest and dividend income”. Interest earned is reported as interest income using the effective interest rate and dividends earned are recognized when collection rights are established.
Estimated fair values are based primarily on quoted prices or, if quoted market prices are not available, discounted expected cash flows using market rates commensurate with the credit quality and maturity of the investment.
Losses arising from impairment (see note 3(i) below) are recognized in the consolidated income statement and removed from the equity caption “Other reserves”.
iv Other financial liabilities:After initial measurement, other financial liabilities are subsequently measured at amortized cost using the effective interest rate method. Amortized cost is calculated by taking into account any issuance discount or premium and costs that are an integral part of the effective interest rate.
(g) Derecognition of financial assets and financial liabilities
Financial assetsA financial asset (or, where applicable a part of a financial asset or a part of a group of similar financial assets) is derecognized when: (i) the rights to receive cash flows from the asset have expired; or (ii) the Group has transferred its rights to receive cash flows from the asset or has assumed an obligation to pay the received cash flows in full without material delay to a third party under a “pass-through” arrangement; and (iii) either the Group has transferred substantially all the risks and rewards of the asset, or the Group has neither transferred nor retained substantially all the risks and rewards of the asset, but has transferred control of the asset..
Financial liabilitiesA financial liability is derecognized when the obligation under the liability is discharged, cancelled or expires. When an existing financial liability is replaced by another from the same lender on substantially different terms, or the terms of an existing liability are substantially modified, such an exchange or modification is treated as a derecognition of the original liability and the recognition of a new liability, and the difference in the respective carrying amounts is recognized as profit or loss.
(h) Offsetting financial instruments Financial assets and liabilities are offset and the net amount is reported in the consolidated balance sheet when there is a legally enforceable right to offset the recognized amounts and Management has the intention to settle on a net basis, or realize the assets and settle the liability simultaneously.

notes to the consolidated financial statements 86(continued)
(i) Impairment of financial assets
The Group assesses at each consolidated balance sheet date whether there is any objective evidence that a financial asset or a group of financial assets is impaired. A financial asset or a group of financial assets is deemed to be impaired if, and only if, there is objective evidence of impairment as a result of one or more events that has occurred after the initial recognition of the asset (an incurred loss event) and that loss event (or events) has an impact on the estimated future cash flows of the financial asset or the group of financial assets that can be reliably estimated. Evidence of impairment may include indications that the borrower or a group of borrowers is experiencing significant financial dif-ficulty, default or delinquency in interest or principal payments, the probability that they will go bankrupt or other legal financial reorganization process and where observable data indicate that there is a measurable decrease in the estimated future cash flows, such as changes in arrears or economic conditions that correlate with defaults. The criteria used for each category of financial assets is as follows:
i Loans and receivables:For loans and receivables that are carried at amortized cost, the Group first assesses whether objective evidence of impairment exists for financial assets that are individually significant, or collectively, for financial assets that are not individually significant. If the Group determines that no objective evidence of impairment exists for an individually assessed financial asset, whether significant or not, it includes the asset in a group of financial assets with similar credit risk characteristics and collectively assesses them for impairment. Assets that are individually assessed for impairment and for which an impairment loss is, or continues to be, recognized are not included in a collective assessment of impairment.
If there is objective evidence that an impairment loss has been incurred, the amount of the loss is measured as the difference between the asset carrying amount and the present value of estimated future cash flows. The carrying amount of the asset is reduced through the use of an allowance account and the amount of the loss is recognized in the consolidated statement of income. Interest income, if applicable, is ac-crued on the reduced carrying amount based on the original effective interest rate of the asset. A loan, together with its associated allowance is written off when there is no realistic prospect of future recovery and all collateral has been realized or has been transferred to the Group. If, in a subsequent year, the amount of the estimated impairment loss increases or decreases because of an event occurring after the impairment was recognized, the previously recognized impairment loss is increased or reduced by adjusting the allowance account. If a future write-off is later recovered, the recovery is recognized in the consolidated income statements, as a credit to the caption “Provision for loan losses”. The present value of the estimated future cash flows is discounted at the financial asset’s original effective interest rate. If a loan has a variable interest rate, the discount rate for measuring any impairment loss is the current effective interest rate. The calculation of the present value of the estimated future cash flows of a collateralized financial asset reflects the cash flows that may result from foreclosure less costs for obtain-ing and selling the collateral, whether or not foreclosure is probable.
For a collective evaluation impairment, financial assets are grouped considering the Group’s internal credit grading system, which considers credit risk characteristics; i.e. asset type, industry, geographical location, collateral type and past-due status.
Future cash flows from a group of financial assets that are collectively evaluated for impairment are estimated on the basis of historical loss experience for assets with similar credit risk characteristics to those in the group. Historical loss experience is adjusted on the basis of current observable data to reflect the effects of current conditions that did not affect the years on which the historical loss experience is based and to remove the effects of conditions in the historical period that do not currently exists. The methodology and assumptions used are reviewed regularly to reduce any differences between loss estimates and actual loss experience.
ii Available-for-sale financial investments:For available-for-sale financial investments, the Group assesses at each consolidated balance sheet date whether there is objective evidence that an investment or a group of investments is impaired.
In the case of equity investments, objective evidence would include a significant or prolonged decline in the fair value of the investment below its cost. Where there is evidence of impairment, the cumulative loss (measured as the difference between the acquisition cost and the current fair value, less any previously recognized impairment loss) is removed from equity and recognized in the consolidated income statement. Impairment losses on equity investments are not reversed through the consolidated income statement; increases in their fair value after impairment are recognized directly in equity.
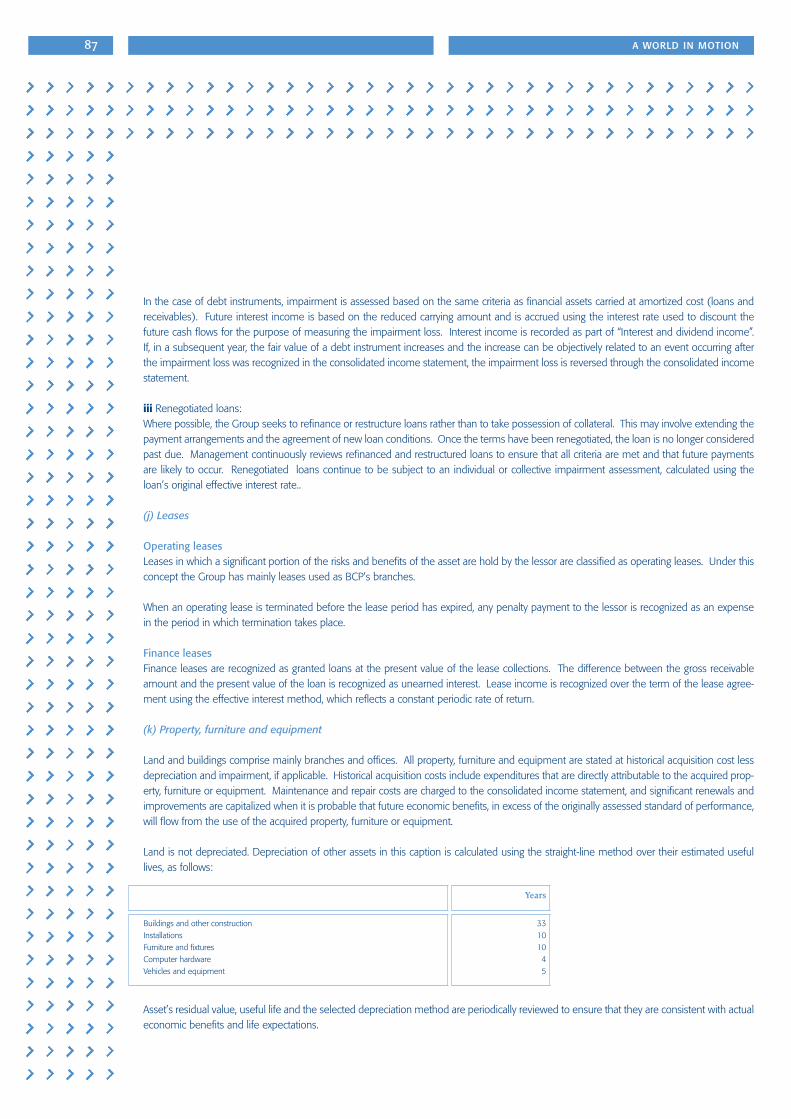
a world in motion87
In the case of debt instruments, impairment is assessed based on the same criteria as financial assets carried at amortized cost (loans and receivables). Future interest income is based on the reduced carrying amount and is accrued using the interest rate used to discount the future cash flows for the purpose of measuring the impairment loss. Interest income is recorded as part of “Interest and dividend income”. If, in a subsequent year, the fair value of a debt instrument increases and the increase can be objectively related to an event occurring after the impairment loss was recognized in the consolidated income statement, the impairment loss is reversed through the consolidated income statement.
iii Renegotiated loans:Where possible, the Group seeks to refinance or restructure loans rather than to take possession of collateral. This may involve extending the payment arrangements and the agreement of new loan conditions. Once the terms have been renegotiated, the loan is no longer considered past due. Management continuously reviews refinanced and restructured loans to ensure that all criteria are met and that future payments are likely to occur. Renegotiated loans continue to be subject to an individual or collective impairment assessment, calculated using the loan’s original effective interest rate..
(j) Leases
Operating leasesLeases in which a significant portion of the risks and benefits of the asset are hold by the lessor are classified as operating leases. Under this concept the Group has mainly leases used as BCP’s branches.
When an operating lease is terminated before the lease period has expired, any penalty payment to the lessor is recognized as an expense in the period in which termination takes place.
Finance leasesFinance leases are recognized as granted loans at the present value of the lease collections. The difference between the gross receivable amount and the present value of the loan is recognized as unearned interest. Lease income is recognized over the term of the lease agree-ment using the effective interest method, which reflects a constant periodic rate of return.
(k) Property, furniture and equipment
Land and buildings comprise mainly branches and offices. All property, furniture and equipment are stated at historical acquisition cost less depreciation and impairment, if applicable. Historical acquisition costs include expenditures that are directly attributable to the acquired prop-erty, furniture or equipment. Maintenance and repair costs are charged to the consolidated income statement, and significant renewals and improvements are capitalized when it is probable that future economic benefits, in excess of the originally assessed standard of performance, will flow from the use of the acquired property, furniture or equipment.
Land is not depreciated. Depreciation of other assets in this caption is calculated using the straight-line method over their estimated useful lives, as follows:
Asset’s residual value, useful life and the selected depreciation method are periodically reviewed to ensure that they are consistent with actual economic benefits and life expectations.
Years
Buildings and other constructionInstallationsFurniture and fixturesComputer hardwareVehicles and equipment
33101045

notes to the consolidated financial statements 88(continued)
(l) Seized assets
Seized assets are recorded at the lower of cost or estimated market value, which is obtained from valuations made by independent appraisals. Reductions in book values are recorded in the consolidated statements of income.
(m) Intangible assets Comprise internal developed and acquired software licenses used by the Group. Acquired software licenses are measured on initial recogni-tion at cost. These intangible assets are amortized using the straight-line method over their estimated useful life (between 3 and 5 years).
Intangible assets identified as a consequence of the acquisition of AFP Unión Vida, note 2, “client relationships” and other intangible assets, are recognized on the consolidated balance sheet at their fair values determined on the acquisition date and are amortized using the straight line method over their estimated useful life; 20 years for “client relationships” and 5 years for other identified intangible assets.
(n) Goodwill
Goodwill represents the excess of the acquisition cost of a subsidiary over the fair value of the net identifiable assets of the acquired subsidiary at the date of acquisition. Goodwill is tested annually for impairment to assess whether the carrying amount is fully recoverable. An impair-ment loss is recognized if the carrying amount exceeds the recoverable amount. Goodwill is allocated to cash-generating units for impairment testing purposes. See also paragraph (o) below.
(o) Impairment of non-financial assets
The Group assesses at each reporting date or more frequently if events or changes in circumstances indicate that the carrying value may be impaired, whether there is an indication that a non-financial asset may be impaired. If any such indication exists, the Group estimates the asset’s recoverable amount. Where the carrying amount of an asset (or cash-generating unit) exceeds its recoverable amount, the asset (or cash-generating unit) is considered impaired and is written down to its recoverable amount.
For non-financial assets, excluding goodwill, an assessment is made at each reporting date as to whether there is any indication that previously recognized impairment losses may no longer exist or may have decreased. If such indication exists, the recoverable amount is estimated. A previously recognized impairment loss is reversed only if there has been a change in the estimates used to determine the asset’s recoverable amount since the last impairment loss was recognized; if that is the case, the carrying amount of the asset is increased to its recoverable amount. Impairment losses relating to goodwill cannot be reversed for subsequent increases in its recoverable amount in future periods.
(p) Due from customers on acceptances
Due from customers on acceptances corresponds to accounts receivable from customers for import and export transactions, whose obliga-tions have been accepted by the banks. The obligations that must be assumed by the Group for such transactions are recorded as liabili-ties.
(q) Financial guarantees
In the ordinary course of business, the Group grants financial guarantees, such as letters of credit, guarantees and acceptances. Financial guarantees are initially recognized in the consolidated financial statements at fair value, in “Other liabilities”, being the premium received. Subsequent to initial recognition, the Group’s liability under each guarantee is measured at the higher of the amortized premium and the best estimate of expenditure required to settle any financial obligation arising as a result of the financial guarantee.
Any increase in the liability relating to a financial guarantee is included in the consolidated statement of income. The premium received is recognized in the consolidated statement of income in the caption “Banking services commissions” on a straight line basis over the life of the granted financial guarantee.

a world in motion89
(r) Defined contribution pension plan
The Group only operates a defined contribution pension plan. The contribution payable to a defined contribution pension plan is in pro-portion to the services rendered to the Group by the employees and; it is recorded as an expense in the caption “Salaries and employees benefits” of the consolidated income statement. Unpaid contributions are recorded as a liability.
(s) Provisions
Provisions for legal claims are recognized when the Group has a present (legal) or constructive obligation as a result of past events, it is prob-able that an outflow of resources will be required to settle the obligation; and the amount has been reliably estimated. The amount recorded as a provision is equal to the present value of future payments expected to be needed to settle the obligation.
(t) Contingencies
Contingent liabilities are not recognized in the consolidated financial statements. They are disclosed in notes unless the possibility of an outflow of resources is remote.
(u) Income tax and workers’ profit sharing
Income tax and workers’ profit sharing are computed based on individual financial statements of Credicorp and each one of its Subsidiaries.
Deferred income tax and deferred workers’ profit sharing reflect the effects of temporary differences between the carrying amounts of assets and liabilities for accounting purposes and the amounts determined for tax purposes. Deferred assets and liabilities are measured using the tax rates expected to be applied to taxable income in the years in which temporary differences are expected to be recovered or eliminated. The measurement of deferred assets and deferred liabilities reflects the tax consequences that arise from the manner in which Credicorp and its Subsidiaries expect, at the consolidated balance sheet date, to recover or settle the carrying amount of its assets and liabilities.
Deferred tax assets and liabilities are recognized regardless of when the timing differences are likely to reverse. Deferred tax assets are recog-nized when it is more likely than not that future taxable profit will be available against which the temporary difference can be utilized. At the consolidated balance sheet date, Credicorp and its Subsidiaries assess unrecognized deferred assets and the carrying amount of recognized deferred assets.
Credicorp and its Subsidiaries determine the deferred income tax considering the tax rate applicable to its undistributed earnings; any additional tax on dividends distribution is recorded on the date a liability is recognized.
(v) Earnings per share
Basic and diluted earnings per share are calculated by dividing the net profit attributable to Credicorp’s equity holders by the weighted aver-age number of ordinary shares outstanding during the year, excluding the average number of ordinary shares purchased and held as treasury stock. For the years ending December 31, 2008, 2007 and 2006 Credicorp has no financial instruments with dilutive effects. Therefore, basic and diluted earnings per share are the same for all years presented.

notes to the consolidated financial statements 90(continued)
(w) Stock appreciation rights
The Group has granted supplementary profit sharing participation to certain executives and employees who have at least one year of service in Credicorp or any of its Subsidiaries, in the form of stock appreciation rights (SARs) over a certain number of Credicorp’s shares. Such SARs options are granted at the market price of the shares of Credicorp on the date of the grant and are exercisable at that price, allowing the employee to obtain a gain from the difference between the fixed exercise price of the share at the date of execution and the market price, note 18.
The recorded expense in each year is the estimated market value of the rights that can be exercised by the beneficiaries at the consolidated balance sheets date. When Credicorp changes the price or the terms of the SARs, the additional compensation expense is recorded for an amount equal to the difference between the new exercise price and the market price of the underlying shares.
(x) Derivative financial instruments
TradingPart of transactions with derivatives, while providing effective economic hedges under Group’s risk management positions, do not qualify for hedge accounting under the specific rules of IAS 39 and are, therefore, treated as trading derivatives.
Derivative financial instruments are initially recognized in the consolidated balance sheet at cost and subsequently are re-measured at their fair value. Fair values are estimated based on the market exchange and interest rates. All derivatives are carried as assets when fair value is positive and as liabilities when fair value is negative. Gain and losses for changes in their fair value are recorded in the consolidated income statement.
HedgeThe Group uses derivative instruments to manage exposures to interest rate and foreign currency. In order to manage particular risks, the Group applies hedge accounting for transactions which meet the specified criteria.
At inception of the hedge relationship, the Group formally documents the relationship between the hedged item and the hedging instrument, including the nature of the risk, the objective and strategy for undertaking the hedge and the method that will be used to assess the effective-ness of the hedging relationship.
Also, at the inception of the hedge relationship, a formal assessment is undertaken to ensure the hedging instrument is expected to be highly effective in offsetting the designated risk in the hedged item. Hedges are formally assessed at each reporting date. A hedge is regarded as highly effective if the changes in fair value or cash flows attributable to the hedged risk during the period for which the hedge is designated is expected to offset in a range between 80 percent and 125 percent.
As part of its risk management, the Group uses derivative instruments for hedging purposes in order to reduce its exposure to market risk of certain liabilities. The accounting treatment is established according to the nature of the item hedged and compliance with the hedge criteria.
For designated and qualifying cash flow hedges, the effective portion of the gain or loss on the hedging instrument is initially recognized directly in equity in “Other reserves”. The ineffective portion of the gain or loss on the hedging instrument is recognized in the consolidated income statement in the captions “Interest and dividend income” or “Interest expense”, as appropriate. When the hedged cash flow affects the consolidated income statement, the gain or loss on the hedging instrument is recycled in the corresponding income or expense line of the consolidated income statement.
For designated and qualifying fair value hedges, the change in the fair value of a hedging derivative is recognized in the consolidated income statement in the captions “Interest and dividend income” or “Interest expense”, as appropriate. Changes in the fair value of the hedged item attributable to the risk hedged are recorded as part of the carrying value of the hedged item and recognized in the consolidated income statement. If the hedging instrument expires or is sold, terminated or exercised, or where the hedge no longer meets the criteria for hedge accounting, the hedge relationship is terminated.

a world in motion91
Embedded derivates:Certain derivatives embedded in other financial instruments are treated as separate derivatives when their economic characteristics and risks are not closely related to those of the host contract and the host contract is not carried at fair value through profit or loss. These embedded derivatives are measured at fair value with changes in fair value recognized in the consolidated income statement, unless the Group chooses to designate the hybrid contracts at fair value through profit and loss.
The Group has certificates indexed to Credicorp Ltd. share price that will be settled in cash and credit linked notes obtained to provide financial instruments in the same basis to its clients. These instruments have been classified at inception by the Group as “financial instrument at fair value though profit or loss”, note 7.
(y) Segment reporting
The Group considers as a business segment a group of assets and operations engaged in providing products or services that are subject to risks and returns that are different from those of other business segments. A geographical segment is engaged in providing products or services within a particular economic environment that are subject to risks and return that are different from those of segments operating in other economic environment, note 26.
(z) Fiduciary activities, management of funds and pension funds
The Group provides custody, trustee, investment management and advisory services to third parties that result in the holding of assets on their behalf. These assets and income arising thereon are excluded from these consolidated financial statements, as they are not assets of the Group, note 29.8.
Commissions generated for these activities are included in the caption “Other income” of the consolidated statements of income. (aa) Sale and repurchase agreements
Securities sold subject to repurchase agreements (‘Repos’) are presented as pledged assets when the counterparty has the right to sell or repledge the collateral; the counterparty liability is included in the caption “Due to banks and correspondents” or “Deposits and obligations”, as appropriate, in the consolidated balance sheets.
The difference between sale and repurchase price is considered as interest and accrued over the life of the related agreement using the ef-fective interest method.
(ab) Cash and cash equivalents
For the purposes of the consolidated cash flow statement, cash and cash equivalents comprise balances of cash and balances with central banks, overnight deposits and amounts due from banks with original maturities of three months or less.
(ac) Reclassifications
When it is necessary, the comparative figures have been reclassified to conform to the current year presentation. The main reclassifications to the report as of December 31, 2007 and for the two years ended December 31, 2007 are the following:
i For the year 2007, the “Impairment loss on available-for-sale investments” amounting to US$5.0 million was shown as part of the caption “Net gain on sale of securities”; as of December 31, 2008, this concept is shown separately in the consolidated income statement.
ii For the year 2006, the “Net gain on financial assets and liabilities designated at fair value through profit or loss” amounting to US$3.5 million was shown as part of the caption “Other income”; as of December 31, 2007, this concept is shown separately in the consolidated income statement.
notes to the consolidated financial statements 92(continued)
iii For the year 2006, the “Interest and dividend Income” and the “Interest expense” were shown in detail on the face of consolidated income statement. For the year 2007 they are shown as part of note 20 to the consolidated income statement.
Management considers that these reclassifications result in a better presentation of the Group’s activities.
(ad) Recently issued International Financial Reporting Standards but not yet effective
The Group decided not to early adopt the following standards and interpretations that were issued but not effective as December 31, 2008:
- IFRS 8 “Operating Segments”, effective for periods beginning on or after January 1, 2009, IFRS 8 replaces IAS 14 “Segment Reporting” and adopts a full management approach identifying, measuring and disclosing the results of its operating segments. The standard is only appli-cable to entities that have debt or equity instruments that are traded in a public market (as opposed to a “public securities market” as required by IAS 14) or that files (or is in the process of filing) its financial statements with a securities commission or similar party.
- IAS 23 (Amendment) “Borrowing Costs”, effective for periods beginning on or after January 1, 2009. The revised standard eliminates the option of expensing all borrowing costs and requires borrowing costs to be capitalized if they are directly attributable to the acquisition, con-struction or production of a qualifying asset. - IFRIC 13, “Customer Loyalty Programmes”, effective for periods beginning on or after July 1, 2008. The interpretation requires loyalty award credits granted to customers in connection with a sales transaction to be accounted for as a separate component of the sales transaction.
- IFRS 3 (Revised) “Business Combination and Consolidation” and IAS 27 (Revised) “Separated Financial Statements Consolidation”, effective modifications for periods beginning on or after July 1, 2009. The Standard establishes that its application is not retroactive; therefore, it will not have any effect on the Group’s consolidated financial statements.
- IFRS 2, “Share-based payments - Vesting conditions and cancellations”, effective for periods beginning on or after January 1, 2009. The Standard restricts the definition of “vesting condition” to a condition that includes an explicit or implicit requirement to provide services.
- IAS 1 (Revised) “Presentation of financial statements”, effective for periods beginning on or after January 1, 2009. The Standard separates owner and non owner-changes in equity. In addition, the Standard introduces the statement of comprehensive income.
- IAS 32 (Revised) and IAS 1 “Puttable Financial Instruments” (Revised), effective for periods beginning on or after January 1, 2009. The revisions provide a limited scope exception for puttable instruments to be classified as equity if they meet a number of specified features.
- IFRIC 15, “Agreement for the Construction of Real State”, effective for annual periods beginning on or after January 1, 2009. The interpreta-tion is to be applied retrospectively. It clarifies when and how revenue and related expenses from the sale of a real estate unit should be recognized if an agreement between a developer and a buyer is reached before the construction of the real estate is completed.
- IFRIC 16, “Hedges of a Net Investment in a Foreign Operation”, effective for periods beginning on or after October 1, 2008. The interpreta-tion is to be applied prospectively. This interpretation provides guidance in respect to hedges of foreign currency gains and losses on a net investment in a foreign operation.
- IAS 39 “Financial Instruments: Recognition and Measurement – Eligible Hedged Items”, effective for periods beginning on or after July 1, 2009, the amendment addresses the designation of a one-sided risk in a hedged item, and the designation of inflation as a hedged risk or portion in particular situations.
- IFRIC 17, “Distributions of Non-Cash Assets to owners”, effective for periods beginning on or after July 1, 2009. Early application is permitted. This interpretation provides guidance in the accounting treatment of distribution of - non cash assets to owners.
- IFRIC 18, “Transfer of assets from customers”, effective for periods beginning on or after July 1, 2009. This interpretation clarifies the requirements of IFRS for agreements in which an entity receives from a customer an item of property, plant and equipment that the
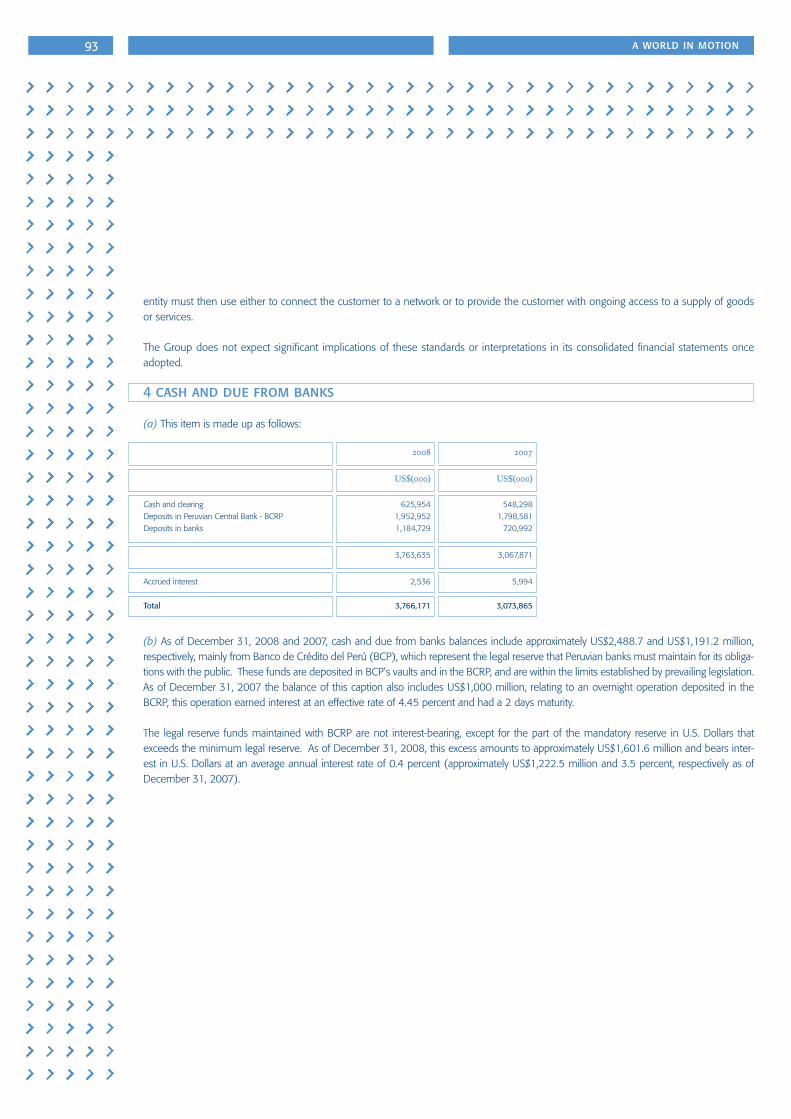
a world in motion93
entity must then use either to connect the customer to a network or to provide the customer with ongoing access to a supply of goods or services.
The Group does not expect significant implications of these standards or interpretations in its consolidated financial statements once adopted.
4 cash and due from banks
(a) This item is made up as follows:
(b) As of December 31, 2008 and 2007, cash and due from banks balances include approximately US$2,488.7 and US$1,191.2 million, respectively, mainly from Banco de Crédito del Perú (BCP), which represent the legal reserve that Peruvian banks must maintain for its obliga-tions with the public. These funds are deposited in BCP’s vaults and in the BCRP, and are within the limits established by prevailing legislation. As of December 31, 2007 the balance of this caption also includes US$1,000 million, relating to an overnight operation deposited in the BCRP, this operation earned interest at an effective rate of 4.45 percent and had a 2 days maturity.
The legal reserve funds maintained with BCRP are not interest-bearing, except for the part of the mandatory reserve in U.S. Dollars that exceeds the minimum legal reserve. As of December 31, 2008, this excess amounts to approximately US$1,601.6 million and bears inter-est in U.S. Dollars at an average annual interest rate of 0.4 percent (approximately US$1,222.5 million and 3.5 percent, respectively as of December 31, 2007).
2008 2007
US$(000) US$(000)
Cash and clearingDeposits in Peruvian Central Bank - BCRPDeposits in banks
625,9541,952,9521,184,729
548,2981,798,581
720,992
3,763,635 3,067,871
Accrued interest 2,536 5,994
Total 3,766,171 3,073,865

notes to the consolidated financial statements 94(continued)
5 investments available-for-sale
(a) This item is made up as follows:
(b) Credicorp’s Management has determined that the unrealized losses as of December 31, 2008 and 2007 are of temporary nature. Man-agement intents and has the ability to hold each investment for a period of time sufficient to allow for an anticipated recovery in fair value, until the earlier of its anticipated recovery or maturity.
Credicorp’s Management has considered the following criteria in determining whether a loss is temporary or not for equity investments (shares):
- The length of time and the extent to which fair value has been below cost;- The severity of the impairment;- The cause of the impairment and the financial condition and near-term prospects of the issuer; and- Activity in the market of the issuer which may indicate adverse credit conditions.
Credicorp’s Management has considered the following criteria in determining whether a loss is temporary or not for debt investments (fixed maturity):
2008 2007
Unrealized gross amount
Unrealized gross amount
Amortizedcost Gains Losses (b)
Estimated fair value
Amortizedcost Gains Losses (b)
Estimated fair value
US$(000) US$(000) US$(000) US$(000) US$(000) US$(000) US$(000) US$(000)
Fixed maturity BCRP certificates of deposit (d)Corporate, leasing and subordinated bonds (e)Government’s treasury bonds (f)Central Bank of Bolivia certificates of deposit (g)Participations in mutual funds Collateralized mortgage obligations (CMO) (h)US Government – Agencies and Sponsored Enterprises (i)Restricted mutual funds (j)Participation in RAL’s funds (k)Negotiable certificates of depositHedge funds Corporación Andina de Fomento and Corporación Financiera de Desarrollo bondsCommercial papersOther
2,209,460950,322833,729217,51697,23496,25641,00049,77573,26841,62831,742
34,79911,20320,104
2,939 16,015 57,678
115 2,189
463,718 1,887
-1,003 2,920
116 3 2
(3,457)(58,109)(10,231)
(81)(2,479)
(22,375)(67)
--
(76)(284)
(587)(96)
(674)
2,208,942908,228881,176217,55096,94473,92744,65151,66273,26842,55534,378
34,32811,11019,432
2,410,062945,794670,717121,706145,182106,24586,33747,34756,64153,23641,129
45,13615,58521,860
22417,02859,316
383,652
5972,337
18,255-
1,8508,557
14327
1,348
(3,281)(8,380)
(403)(96)
-(1,092)
(427)--
(1)(113)
-(9)
(21)
2,407,005954,442729,630121,648148,834105,75088,24765,60256,64155,08549,573
45,27915,60323,187
4,708,036 88,631 (98,516) 4,698,151 4,766,977 113,372 (13,823) 4,866,526
SharesListed securities (l)Not-listed securities
106,5216,242
109,0321,761
(5,936)(3)
209,6178,000
107,33219,568
167,57828,343
(1,701)(3)
273,20947,908
112,763 110,793 (5,939) 217,617 126,900 195,921 (1,704) 321,117
4,820,799 199,424 (104,455) 4,915,768 4,893,877 309,293 (15,527) 5,187,643
Accrued interest 43,300 40,998
Total 4,959,068 5,228,641

a world in motion95
- Assess whether it is probable that the Group will receive all amounts due according to the contractual terms of the security (principal and interest). The identification of credit-impaired securities considers a number of factors, including the nature of the security and the underly-ing collateral, the amount of subordination or credit enhancement supporting the security, published credit rating and other information, and other evidential analyses of the probable cash flows from the security. If recovery of all amounts due is not probable, a “credit impairment” is deemed to exist, and the unrealized loss is recorded directly in the consolidated income statement. This unrealized loss recorded in income represents the security’s decline in fair value, including the decline due to forecasted cash flow shortfalls as well as general market spread widening.
- For securities with unrealized losses but not identified as impairment, Credicorp’s Management determines whether it has the positive intent and ability to hold each investment for a period of time sufficient to allow for an anticipated recovery in its amortized cost. Credi-corp’s Management estimates the forecasted recovery period using current estimates of volatility in market interest rates (including liquidity and risk premiums). Management’s assertion regarding its intent and ability to hold investments considers a number of factors, including a quantitative estimate of the expected recovery period and the length of that period (which may extend to maturity), the severity of the impairment, and Credicorp’s Management intended strategy with respect to the identified security or portfolio. If Credicorp’s Management does not have the intent and ability to hold the security for a sufficient time period, the unrealized loss is recorded directly in the consoli-dated income statement.
(c) For the year ended December 31, 2008, as a result of the impairment assessment of its investments available-for-sale, the Group re-corded an gross impairment amounting to US$60.4 million, US$55.7 million net of deferred taxes and minority interest (US$5.0 million of impairment gross and net of deferred taxes and minority interest as of December 31, 2007), which is presented in the consolidated income statement caption “Impairment losses on available-for-sale investments”.
The movement of “Other reserves” in consolidated equity includes mainly the net change in the realized and unrealized gains and losses, net of deferred taxes, and the recorded impairment. This caption is as follows:
(d) BCRP certificates of deposit are discounted Nuevo Sol instruments with maturities due within one year and are acquired in public auc-tions. Annual effective interest rates in Peruvian currency range between 6.55 and 7.06 percent as of December 31, 2008 (between 4.93 and 6.01 annual percent as of December 31, 2007). As of December 31, 2008, this amount includes BCRP certificates of deposit in US$ Dollars amounting to US$1,070.7 million, with maturities between January and April 2009. These certificates accrue interests at annual effective rates that range between 0.34 and 1.55 percent.
As of December 31, 2008 and 2007, the Group has entered into BCRP - Repo transactions in Peruvian currency with its clients using these securities, for approximately US$294.2 and US$242.8 million, respectively. As of December 31, 2008, these operations earn an annual ef-fective interest rate between 6.75 and 7.00 percent and with maturities between February 2009 and November 2009 (between 5.04 and 6.00 percent and with maturities between January 2008 and December 2009 as of December 31, 2007).
(e) As of December 31, 2008, comprise corporate bonds for US$900.4 million, leasing bonds for US$5.8 million and subordinated bonds for US$2.0 million (US$947.9, US$4.3 and US$2.2 million, respectively, as of December 31, 2007), with maturities between January 2009 and November 2066 (between January 2008 and November 2066 as of December 31, 2007). These bonds accrue interests at annual effective rates that range between 2.81 and 8.8 percent for the bonds denominated in Peruvian currency (between 2.79 and 6.87 percent as of December 31, 2007), and between 1.58 and 18.4 percent for the bonds denominated in U.S. Dollars (between 3.13 and 15.63 percent
2008 2007 2006
US$(000) US$(000) US$(000)
Unrealized gains (loss), net of taxes and minority interest, note 16(c)Realized gains, net of taxes and minority interest, note 16(c)Impairment on investments, net of taxes and minority interest note 16(c)
(164,302)
35,684
(55,732)
85,129
17,634
(5,017)
69,411
6,620
-

notes to the consolidated financial statements 96(continued)
as of December 31, 2007). The unrealized losses on these investments as of December 31, 2008, correspond to 178 items of which the highest individual unrealized loss amounts to approximately US$2.0 million.
(f) Includes principally debt instruments for US$795.2, US$67.7 and US$4.9 million issued by the Peruvian Government, the Colombian Government and the Government of El Salvador, respectively, as of December 31, 2008 (US$616.1, US$85.4 and US$11.1 million, respectively, as of December 31, 2007). Their maturities are between January 2009 and August 2046 (between January 2008 and August 2046 as of December 31, 2007) and earned interests at annual effective rates that range between 2.85 and 9.15 percent (between 3.28 and 9.13 percent as of December 31, 2007).
As of December 31, 2007, the Group had Repo transactions in U.S. Dollars with its clients using Peruvian Government bonds and Colombian Government bonds for approximately US$38.9 million and US$59.3 million, respectively. Such transactions had maturities between October 2008 and December 2008 and accrued interest at annual effective rates that were between 5.35 and 6.00 percent, respectively.
(g) As of December 31, 2008 and 2007, certificates of deposit issued by the Central Bank of Bolivia are denominated in Pesos Bolivianos, had maturities between January and July 2009 and between January and October 2008, respectively, and accrued interest at annual effective rates that ranges between 7.4 and 11.5 percent and between 1.8 and 8.5 percent, respectively.
(h) Collaterized mortgage obligations are not related with “sub prime mortgages”, they correspond to senior tranches and have maturities between December 2015 and January 2047 (between May 2033 and January 2047 as of December 31, 2007) and accrues interest at annual effective rates that ranges between 3.8 and 14.2 percent (between 3.5 and 6.7 percent as of December 31, 2007). The unrealized losses on these instruments as of December 31, 2008 correspond to 23 items of which the highest individual unrealized loss amounts to approximately US$1.5 million.
(i) Corresponds to debt instruments issued by US Government – Agencies and Sponsored Enterprises. Their maturities are between April 2009 and August 2038 (between July 2008 and August 2038 as of December 31, 2007) and earned interest at annual effective rates between 4.1 and 6.3 percent (between 4.1 and 6.8 percent as of December 31, 2007).
(j) Restricted mutual funds comprise participation quotas on the private pension funds managed by the Group as required by Peruvian regula-tions. They have a restricted disposal and their profitability is the same as the one obtained by the private pension funds managed.
(k) The participation quotas in the Fund “Requirement of Cash Assets” (RAL for its Spanish acronym) are denominated in Pesos Bolivianos and comprise investments made by the Group in the Central Bank of Bolivia as collateral for the deposits maintained with the public. Such fund has restrictions for its use and it is required for all the banks established in Bolivia. The fund accrues interest at an average annual effec-tive rate of 5.48 and 5.42 percent as of December 31, 2008 and 2007, respectively.
(l) As December 31, 2008, the unrealized gains on listed securities arises mainly from shares in Banco de Crédito e Inversiones de Chile - BCI Chile, Inversiones Centenario S.A. and Alicorp S.A.A., which amounted to US$18.2, US$28.8 and US$8.8 million, respectively (US$61.3, US$31.2 and US$29.0 million, respectively, as of December 31, 2007).

a world in motion97
(m) Amortized cost and estimated fair value of investments available-for-sale classified by maturity are as follows:
6 loans, net
(a) This item is made up as follows:
(b) Loans by class, are as follows:
2008 2007
Amortized cost
Fairvalue
Amortized cost
Fairvalue
US$(000) US$(000) US$(000) US$(000)
Up to 3 monthsFrom 3 months to 1 yearFrom 1 to 3 yearsFrom 3 to 5 yearsOver 5 yearsWithout maturity (shares)
2,021,269950,458285,044262,872
1,188,393112,763
2,023,679946,369279,982258,878
1,189,243217,617
798,0531,961,129
922,822170,413914,560126,900
828,8391,959,497
925,330175,532977,328321,117
Total 4,820,799 4,915,768 4,893,877 5,187,643
2008 2007
US$(000) US$(000)
Direct loansLoansLeasing receivablesCredit card receivablesDiscounted notesAdvances and overdraftsFactoring receivablesRefinanced and restructured loansPast due and under legal collection loans
7,324,4851,792,827
854,968368,648102,687124,537
55,17982,867
5,842,934 1,118,301
677,182 325,047 127,486 109,928 88,451 61,488
10,706,198 8,350,817
Add (less)Accrued interestUnearned interestAllowance for loan losses (d)
90,094(249,914)(224,337)
66,974 (166,972)(211,319)
Total direct loans, net 10,322,041 8,039,500
Indirect loans, note 19(a) 1,755,902 1,564,525
2008 2007
US$(000) US$(000)
Commercial loansResidential mortgage loansConsumer loans
8,058,5851,485,2141,162,399
6,222,1781,253,835
874,804
Total 10,706,198 8,350,817

notes to the consolidated financial statements 98(continued)
(c) Interest rates on loans are set considering the rates prevailing in the markets where the Group’s subsidiaries operate. (d) The movement in the allowance for loan losses (direct and indirect loans) is shown below:
(*) The movement in the allowance for loan losses includes the allowance for direct and indirect loans for approximately US$224.3 and US$23.7 million, respectively, as of December 31, 2008 (approximately US$211.3 and US$18.4 million; and US$190.3 and US$20.3 million, as of December 31, 2007 and 2006, respectively). The allowance for indirect loan losses is included in the “Other liabilities” caption of the consolidated balance sheets, note 11(a).
In Management’s opinion, the allowance for loan losses recorded as of December 31, 2008 and 2007 and 2006 has been established in accordance with IAS 39 and is sufficient to cover the losses on the loan portfolio, note 3(i).
2006
Commercial loans
Residential mortgage loans
Consumerloans Total
US$(000) US$(000) US$(000) US$(000)
Beginning balances Provision (recoveries)Recoveries of written-off loansLoan portfolio written-off Translation result
196,059(19,118)
31,546(25,971)
858
8,5281,2021,064
(2,447)906
14,04913,67311,674
(21,441)4
218,636(4,243)44,284
(49,859)1,768
Ending balances (*) 183,374 9,253 17,959 210,586
2007
Commercial loans
Residential mortgage loans
Consumerloans Total
US$(000) US$(000) US$(000) US$(000)
Beginning balances Provision (recoveries)Recoveries of written-off loansLoan portfolio written-off Translation result
183,374(5,591)26,016
(22,079)2,864
9,2534,8842,587
(2,395)125
17,95929,1465,481
(22,792)868
210,58628,43934,084
(47,266)3,857
Ending balances (*) 184,584 14,454 30,662 229,700
2008
Commercial loans
Residential mortgage loans
Consumerloans Total
US$(000) US$(000) US$(000) US$(000)
Beginning balances Provision (recoveries)Recoveries of written-off loansLoan portfolio written-off Translation result
184,584(10,667)
19,956(31,595)
(1,108)
14,45416,024
808(291)(163)
30,66243,40310,515
(27,422)(1,097)
229,70048,76031,279
(59,308)(2,368)
Ending balances (*) 161,170 30,832 56,061 248,063

a world in motion99
(e) Part of the loan portfolio is collateralized with guarantees received from clients, which mainly consist of mortgages, trust assignments, financial instruments and industrial and mercantile pledges.
(f) Interest on past due and under legal collection loans are recognized when collected. Interest income that would have been recorded for these credits in accordance with the terms of the original contract amount approximately to US$17.0, US$18.7 and US$28.1 million as of December 31, 2008, 2007 and 2006, respectively.
(g) As of December 31, 2008 and 2007, the direct gross loan portfolio classified by maturity, based on the remaining period to repayment date is as follows:
2008 2007
US$(000) US$(000)
Outstanding loansUp to 1 yearFrom 1 to 3 yearsFrom 3 to 5 yearsOver 5 years
6,307,1971,648,8211,033,3751,633,938
4,980,0211,443,070
666,6701,199,568
Past due loansUp to 4 monthsOver 4 monthsUnder legal collection loans
34,95522,56925,343
20,82520,12220,541
Total 10,706,198 8,350,817
notes to the consolidated financial statements 100(continued)
7 financial assets and financial liabilities designated at fair value through profit or loss
(a) This item is made up as follows:
(b) In connection with the liabilities that result from Credicorp´s stock appreciation rights (SARs), (note 18), BCP signed several contracts with Citigroup Global Markets Holdings Inc., Citigroup Capital Limited and Citigroup Capital Market Inc.
These contracts consist of the purchase of up to 3,252,035 certificates indexed to the performance of Credicorp Ltd. (BAP) shares, in the form of “warrants”, issued by Citigroup, which are equivalent to the same number of shares of Credicorp Ltd. These certificates are cash settled and, at their maturity, they pay an amount equal to the final settlement price minus the strike price (US$ 0.0000001) plus the accrued dividends, less the annual fee multiplied by the number of warrants underlying the certificate. The final settlement price is equivalent to the daily volume-weighted average of the per share price for BAP shares on each business day, on which Citigroup or any of its affiliates effects any transactions with respect to BAP shares in order to unwind its position established and maintained to hedge its price and market risk with respect to the issued certificates.
The program has a maturity of 5 years but can be settled at anytime before its maturity, partially or totally. As of December 31, 2008 and 2007, the Group had acquired 2,487,414 and 2,097,414 certificates, respectively, at a total cost of US$129.1 and US$94.9 million, respective-ly (US$51.9 and US$45.3 per certificate on average, respectively). At those dates, the estimated market value amounted to US$129.6 million and US$162.6 million, respectively (US$52.1 and US$77.5 per certificate on average, as of December 31, 2008 and 2007, respectively). The loss resulting from the difference between cost and estimated market value amounting to approximately US$67.1 million (gain of US$65.1 million as of December 31, 2007) that has been recorded in the caption “Net (loss) gain on financial assets and liabilities designated at fair value through profit and loss” of the consolidated statement of income, according to the accounting principles described in note 3(x).
(c) During 2007, the Group acquired debt instruments in the form of “Credit linked notes”, which were issued by Bear Stearns Global Asset Holdings Ltd. and were linked to debt instruments issued by the Republic of Peru or any successor of this (credit default swap); these instru-ments were acquired for the purpose of providing financial instruments with the same terms, risk and benefits to certain clients.
During the first quarter of 2008 and before their maturity, said instruments were liquidated at their estimated market value. This transaction did not have a material effect on the Group’s net consolidated income.
Assets Liabilities
2008 2007 2008 2007
US$(000) US$(000) US$(000) US$(000)
Citigroup indexed certificates (b)Credit linked notes (c)
129,631-
162,59250,561
--
-50,561
129,631 213,153 - 50,561

a world in motion101
8 receivable and payable accounts from insurance contracts
(a) This item is made up as follows:
(b) Premiums and other polices receivable correspond to:
These accounts receivable are primarily due in a current period and have no collaterals; their aging is as follows:
2008 2007
US$(000) US$(000)
AssetsPremiums and other policies receivable (b)Accounts receivable from reinsurers and coinsurers (c)
111,561165,144
85,495116,141
Total 276,705 201,636
LiabilitiesAccounts payable to reinsurers and coinsurers (c) 55,841 33,963
2008 2007
US$(000) US$(000)
General insuranceLife insuranceHealth insurance
81,4895,982
24,090
73,5244,8577,114
111,561 85,495
2008 2007
US$(000) US$(000)
Non past due accounts receivable
Past due accounts receivableUp to 30 daysFrom 31 to 60 daysFrom 61 to 90 daysMore than 90 days
89,371
14,3756,3091,197
309
71,830
6,7932,0161,7483,108
111,561 85,495

notes to the consolidated financial statements 102(continued)
(c) The movements of accounts receivable and payable to reinsurers and coinsurers are as follows:
Accounts receivable:
Accounts receivable as of December 31, 2008 and 2007, include US$32.0 million and US$30.9 million, respectively which correspond to the unearned portion of the ceded premiums to the reinsurers.
Accounts payable:
Accounts payable to reinsurers are primarily related to the proportional facultative contracts for ceded premiums, automatic non-proportional contracts (excess of loss) and reinstallation premiums. For facultative contracts the Group transfers to the reinsurers a percentage or an amount of an insurance contract or individual risk, based on the premium and the covered period. The net movement of the accounts pay-able of non proportioned contracts (excess of loss) as well as installation premiums of the years 2008 and 2007 are included in the concept “Payments and other” for US$26.4 million and U$16.3 million, respectively.
2008 2007
US$(000) US$(000)
Beginning balancesReported claims of premiums cededPremiums ceded unearned during the yearPremiums assumedSettled claims of premiums cededCollections and other
116,14164,7871,054
22,66414,885
(54,387)
35,18186,458
(14,538)15,81114,213
(20,984)
Ending balances 165,144 116,141
2008 2007
US$(000) US$(000)
Beginning balancesPremiums ceded to reinsurers by facultative contractsCoinsurance grantedPayments and other
33,96384,3012,531
(64,954)
25,13453,1808,153
(52,504)
Ending balances 55,841 33,963

a world in motion103
9 property, furniture and equipment, net
(a) The movement of property, furniture and equipment and accumulated depreciation, for the years ended December 31, 2008 and 2007, is as follows:
(b) Banks, financial institutions and insurance entities operating in Peru are not allowed to pledge their fixed assets.
(c) As of December 31, 2008, Credicorp and its Subsidiaries have property available for sale for approximately US$25.0 million, net of its accumulated depreciation amounting to approximately US$8.8 million (US$24.4 and US$7.3 million, respectively, as of December 31, 2007).
(d) Management periodically reviews the residual value, useful life and method of depreciation of the Group’s property, furniture and equip-ment to ensure that they are consistent with their actual economic benefits and life expectations. In Management’s opinion, as of December 31, 2008 and 2007 there is no evidence of impairment of the Group’s property, furniture and equipment.
Description
Land
Buildings and other
constructionInstalla-
tions
Furni-tureand
fixturesComputer hardware
Vehiclesand equip-
ment
Workin
progress 2008 2007
US$(000) US$(000) US$(000) US$(000) US$(000) US$(000) US$(000) US$(000) US$(000)
Cost Balance as of January 1stAdditionsTransferSales and other
37,2891,285
-(207)
263,2413,289
11,959(664)
99,6247,8843,737(487)
73,5378,800
-(1,238)
197,13233,717
-(11,737)
20,6378,946
-(517)
17,02327,432
(15,696)7
708,48391,353
-(14,843)
659,33453,901
-(4,752)
Balance as of December 31 38,367 277,825 110,758 81,099 219,112 29,066 28,766 784,993 708,483
Accumulated depreciation Balance as of January 1stDepreciation for the yearSales and other
---
140,0466,568(664)
63,8136,707(404)
58,4293,308
(1,222)
163,581
17,095(11,278)
7,6792,356(479)
---
433,54836,034
(14,047)
403,85633,535(3,843)
Balance as of December 31 - 145,950 70,116 60,515 169,398 9,556 - 455,535 433,548
Net book value 38,367 131,875 40,642 20,584 49,714 19,510 28,766 329,458 274,935

notes to the consolidated financial statements 104(continued)
10 intangibles assets and goodwill, net
(a) Intangibles
The movement of intangible assets for the years ended December 31, 2008 and 2007 is as follows:
During the year ended December 31, 2008 and 2007, Credicorp has capitalized disbursements related to the implementation and develop-ment of sundry computer systems in BCP (mainly SAP-ERP and SERIVA, an integrated system for capital markets operations). (b) Goodwill
This item is made up as follows:
Management annually assesses goodwill to identify any impairment; assumptions used are consistent with previous years. As of December 31, 2008 and 2007, Management concluded that there is no impairment in the recorded goodwill.
Description Client Relation-ships (note 2) Software Developments Other 2008 2007
US$(000) US$(000) US$(000) US$(000) US$(000) US$(000)
Cost
Balance as of January 1st
Additions
Retirements
88,378
-
-
48,187
21,404
(431)
41,421
14,297
(792)
9,251
3,560
(1,213)
187,237
39,261
(2,436)
172,025
30,404
(15,192)
Balance as of December 31 88,378 69,160 54,926 11,598 224,062 187,237
Accumulated amortization
Balance as of January 1st
Amortization of the year
Retirements
5,017
4,419
-
19,933
9,980
(430)
16,542
5,627
(708)
6,060
1,309
(30)
47,552
21,335
(1,168)
45,220
17,478
(15,146)
Balance as of December 31 9,436 29,483 21,461 7,339 67,719 47,552
Net book value 78,942 39,677 33,465 4,259 156,343 139,685
2008 2007
US$(000) US$(000)
GoodwillPrima AFP (AFP Unión Vida S.A.), note 2Banco de Crédito del PerúEl Pacífico Peruano – Suiza Compañía de Seguros y ReasegurosAtlantic Security Holding CorporationCoporación Novasalud Perú S.A. EPS
44,59418,609
13,00710,660
3,744
44,59415,582
13,00710,660
3,744
Book value, net 90,614 87,587

a world in motion105
The movement of goodwill for the years ended December 31, 2008, 2007 and 2006 is as follows:
11 other assets and other liabilities
(a) These items are made up as follows:
2008 2007 2006
US$(000) US$(000) US$(000)
Cost Opening balanceAcquisition, notes 2 and 3(b)Decreases
87,5873,027
-
88,8423,282
(4,537)
33,55756,285(1,000)
Final balance 90,614 87,587 88,842
2008 2007
US$(000) US$(000)
Other assetsFinancial instruments:Value added tax creditDerivatives receivable (b)Accounts receivableOperations in process (c)Income tax prepayments, net
124,88079,27556,88638,28227,417
55,98945,84347,65335,78612,397
326,740 197,668
Non-financial instruments:Deferred income tax asset, note 17(c)Prepaid expensesDeferred feesInvestments in associatesOther
67,17356,25236,526
8,47415,755
66,85624,46830,6344,599
16,160
184,180 142,717
Total 510,920 340,385
Other liabilitiesFinancial instruments:Derivatives payable (b)Accounts payablePayroll, taxes, salaries and other personnel expensesOperations in process (c)ContributionsAllowance for indirect loan losses, note 6(d)
256,792126,421126,29536,9964,882
23,726
69,662122,029181,22336,06331,61818,381
575,112 458,976
Non-financial instruments:Deferred income tax liability, note 17(c)Provision for sundry risks (d)Other
66,13347,51213,642
89,82524,03817,206
127,287 131,069
Total 702,399 590,045

notes to the consolidated financial statements 106(continued)
(b) The table below presents the fair value of derivative financial instruments, recorded as an asset or a liability, together with their notional amounts. The notional amount, recorded gross, is the amount of a derivative’s underlying asset and is the basis upon which changes in the value of derivatives are measured. The notional amounts indicate the volume of transactions outstanding at year end and are not indicative of market risk nor credit risk, note 19(c).
(*) On December 2007 and during the first months of 2008, the Group entered into three cross currency swaps (CCS) contracts which were initially designated as fair value hedges as they reduced the Group’s exposure to changes in the fair value of three fixed-rate corporate bonds issued in Peruvian currency, see note 15 (a)(i); arising from changes in the exchange rate and interest rates (Libor).
During 2008, given the current international context, the Group entered into three interest rate swaps (IRS) contracts aimed at mitigating the inherent risks in having a variable interest rate (Libor) for the hedged corporate bonds indicated in the previous paragraph; fixing their respective interest rates. Therefore, in accordance with IAS 39, the initial designations of fair value hedges were revoked and the combined CCS and IRS were redesignated as cash flow hedges from the date of entering into the IRS contracts. In this sense, net loss on these cash flow hedges recognized directly in equity amounted to approximately US$5.8 million.
2008
Assets LiabilitiesNotional amount
US$(000) US$(000) US$(000)
Derivatives held for trading (i)
Forward exchange contracts
Interest rate swaps
Currency swaps
33,427
32,918
12,904
49,979
38,181
9,675
2,478,234
763,126
192,899
Derivatives held as hedgesCash flow hedge(ii) :Interest rate swaps, notes 13(a)(i)(*), 13(b) and 12(a)Cross currency swapCross currency swap and Interest rate swaps (*)
--
26
112,9785,992
19,389
1,283,90239,696
113,362
Fair value hedge (iii) :Cross currency swap - 20,598 163,985
79,275 256,792 5,035,204
2007
Assets LiabilitiesNotional amount
US$(000) US$(000) US$(000)
Derivatives held for trading (i)
Forward exchange contracts
Interest rate swaps
Currency swaps
36,546
9,297
-
19,414
10,986
1,194
2,210,179
581,841
118,552
Derivatives held as hedgesCash flow hedge (ii) :Interest rate swaps - 37,433 696,000
Fair value hedge (iii) :Cross currency swap - 635 50,420
45,843 69,662 3,656,992

a world in motion107
i The Group’s derivative trading activities mainly relate to transactions with customers which are normally laid off with counterparties. The Group may also take positions with the expectation of profiting from favorable movements in prices, rates or indices. Also included under this caption are any derivatives which do not meet IAS 39 hedging requirements.
ii The Group is exposed to variability in future interest cash flows on non-trading assets and liabilities which bear interest at variable rates. The Group uses IRS and CCS as cash flow hedges of these interest rate risks. A schedule indicating as of December 31, 2008 the periods when the hedged cash flows are expected to occur and when they are expected to affect the consolidated income statement is as follows:
For the years 2008 and 2007, the unrealized loss arising from the cash flow hedges amounted to US$80.7 million and US$40.4 million, respectively, and is included in the “Other reserves” caption of the consolidated equity, see note 16(c). Likewise, the transfer of net loss on cash flow hedges to the consolidated income statement amounts to US$14.3 million for the year 2008 (net gain of US$1.0 million for the year 2007).
As of December 31, 2008 and 2007 the accumulated balance of unrealized loss on cash flow hedges recorded in the caption “Other reserves” of the consolidated equity amounted to US$118.1 and US$37.4 million, respectively, see note 16(c).
iii The Group maintains CCS designated as fair value hedges because they reduce the exposure to changes in the fair value of fixed-rate subordinate and corporate bonds denominated in Peruvian currency, see note 15 (a)(ii); related to variations in the foreign currency exchange and interest rates (Libor).
(c) Operations in process include deposits received, loans disbursed, loans collected, funds transferred and other similar types of transactions, which are made at the end of the month and not reclassified to their final consolidated balance sheet account until the first days of the fol-lowing month. These transactions do not affect the Group’s net income.
(d) The movement of the provision for sundry risks for the years ended on December 31, 2008, 2007 and 2006 is as follows:
i The year 2008 provision include US$36.4 million related to the estimated liability arising from a fund managed by ASHC, which had invested with Bernard L. Madoff Invest-ment Securities LLC (Madoff Securities) on behalf of its clients. In Management’s opinion, based in the information available up to date, it is not expected that any additional liability will be incurred.
Up to 1 yearFrom 1 to
3 yearsFrom 3 to
5 years Over 5 years
US$(000) US$(000) US$(000) US$(000)
Cash outflows (liabilities) (11,599) (522,086) (109,169) (71,401)
Income statement (38,299) (48,481) (30,317) (13,926)
2008 2007 2006
US$(000) US$(000) US$(000)
Beginning balanceProvision (i), note 24Decreases
24,03837,549
(14,075)
17,1798,096
(1,237)
18,7686,461
(8,050)
Ending balance 47,512 24,038 17,179

notes to the consolidated financial statements 108(continued)
Due to the nature of its business, the Group has some pending legal claims for which it has recorded a provision when, in Management’s and its legal advisor’s opinion, they will result in an additional liability and such amount can be reliably estimated. Regarding any legal claim against the Group which has not been provided for, in Management’s and its legal advisor’s opinion, they will not have a material effect on the Group’s consolidated financial statements.
12 deposits and obligations
(a) This item is made up as follows:
The Group has established a policy to remunerate demand deposits and savings accounts according to an interest rate scale, based on their average balance; on the other hand balances that are lower than a specified amount, do not bear interest.
Interest rates are determined by the Group considering interest rates prevailing in the market in which each of Group’s subsidiaries operates. As of December 31, 2008, the Group has hedged time deposits with variable interest rates through interest rate swaps for a notional amount of US$177.9 million, see note 11(b).
2008 2007
US$(000) US$(000)
Time depositsDemand depositsSaving depositsSeverance indemnity depositsClient - Repurchase agreementsBank’s negotiable certificates
4,856,1124,578,2472,968,7391,039,887
294,030140,013
3,967,8643,638,5932,380,904
896,283325,908
90,119
13,877,028 11,299,671
Interest payable 73,409 51,043
Total 13,950,437 11,350,714

a world in motion109
(b) The amounts of non-interest and interest bearing deposits and obligations are made up as follows:
(c) Time deposits balance classified by maturity is as follows:
As of December 31, 2008 and 2007, in Management’s opinion the Group’s deposits and obligations is widely diversified with no significant
concentrations.
13 due to banks and correspondents and borrowed funds
(a) Due to bank and correspondents
This item is made up as follows:
2008 2007
US$(000) US$(000)
Non-interest bearing deposits and obligationsIn PeruIn other countries
2,710,770502,759
2,257,840668,468
3,213,529 2,926,308
Interest bearing deposits and obligationsIn PeruIn other countries
8,689,9771,973,522
6,591,8151,781,548
10,663,499 8,373,363
Total 13,877,028 11,299,671
2008 2007
US$(000) US$(000)
Up to 3 monthsFrom 3 months to 1 yearFrom 1 to 3 yearsFrom 3 to 5 yearsMore than 5 years
3,039,0291,578,258
147,00851,87639,941
2,944,189699,479254,75030,74338,703
Total 4,856,112 3,967,864
2008 2007
US$(000) US$(000)
International funds and others (i)Promotional credit lines (ii)Inter-bank funds
1,016,932109,73039,216
1,145,340196,204102,470
1,165,878 1,444,014
Interest payable 14,113 9,247
Total 1,179,991 1,453,261

notes to the consolidated financial statements 110(continued)
i This item is made up as follows:
(*) As of December 31, 2007, this amount was related to three loans of US$100 million each one, obtained from three financial entities. In March 2008, these loans were changed to a syndicated loan amounting to US$410.0 million obtained from diverse international financial entities, with maturity due within three years and an interest rate of Libor plus 0.70 percent during the first year, Libor plus 0.75 percent during the second year and Libor plus 0.85 percent during the third year. The syndicated loan, subject to variable interest rate risk, has been hedged through interest rate swap operations for a notional amount of US$410.0 million with the same maturities, see note 11(b).
As of December 31, 2008, these loans have maturities between January 2009 and March 2011 (between January 2008 and February 2011 as of December 31, 2007) and their annual interest rate is between 3.11 and 7.77 percent (between 4.88 and 5.73 percent as of December 2007).
Some of these borrowings include standard covenants related to financial ratios, use of funds and other administrative matters, which, in Management’s opinion, do not limit the Group’s operations and it has fully complied with as of the consolidated balance sheet dates.
ii Promotional credit lines represent loans granted to BCP by Corporación Financiera de Desarrollo (COFIDE) to promote the development of Peru, they have maturities between October 2009 and December 2028 and their annual interest rates are between 6.20 and 7.75 percent (between March 2008 and December 2027 and annual interest rate between 5.73 and 7.75 percent as of December 31, 2007). These credit lines are secured by a loan portfolio amounting to US$109.7 and US$196.2 million as of December 31, 2008 and 2007, respec-tively.
Promotional credit lines include standard covenants related to financial ratios, use of funds and other administrative matters, which in Manage-ment’s opinion, do not limit the Group’s operations and it has fully complied with as of the consolidated balance sheet dates.
2008 2007
US$(000) US$(000)
Syndicated loan (*)Corporación Andina de Fomento - CAFWachovia BankDresdner Bank AG. FrankfurtJP Morgan Chase & Co.Bank of New YorkCitibank N.A.Commerz BankBanco Latinoamericano de Exportaciones - BLADEXOther
410,000180,00060,32645,00032,00020,00020,00020,000
-229,606
300,000150,000145,00035,00050,00030,00040,00044,78080,000
270,560
Total 1,016,932 1,145,340

a world in motion111
(b) Borrowed funds
This item is made up as follows:
All issuances are secured by the collection of BCP’s (including its foreign branches) future inflows from electronic messages sent through the Society for Worldwide Interbank Financial Telecommunications network and utilized within the network to instruct correspondent banks to make a payment of a certain amount to a beneficiary that is not a financial institution.
Loans obtained include the obligation to comply with certain covenants which, in Management’s opinion, are being fulfilled at the consoli-dated balance sheet dates.
BCP has signed an insurance policy with AMBAC Assurance Corporation, which guarantees the timely payment of scheduled principal and certain accrued interest of all of the 2007 and 2006 issuances (Series A y B).
Series 2007 (A and B) and a portion of the loan (70 percent) of the 2005 total issuance (Series A and B), subject to variable interest rate risk, has been hedged through an interest rate swap operation, for a notional amount of US$500 million and US$196.0 million, respectively (see note 11(b)).
(c) As of December 31, 2008 and 2007, maturities of due to bank and correspondents and borrowed funds are shown below, based on the remaining period to the repayment date:
Due to bank and correspondents 2008 2007
US$(000) US$(000)
Up to 3 months From 3 months to 1 yearFrom 1 to 3 years From 3 to 5 years More than 5 years
369,483256,884502,039
6,46831,004
670,153307,170338,802105,694
22,195
Total 1,165,878 1,444,014
Interest Maturity 2008 2007
% US$(000) US$(000)
CCR Inc. MT-100, Payment rights master Trust2005 Serie A Floating Rate Certificates2005 Serie B Floating Rate Certificates2006 Serie A Floating Rate Certificates2007 Serie A Floating Rate Certificates2007 Serie B Floating Rate Certificates2008 Serie A Fixed Rate Certificates2008 Serie B Floating Rate Certificates
Libor 1m + 21 bpsLibor 1m + 60 bpsLibor 1m + 24 bpsLibor 1m + 28 bpsLibor 1m + 25 bps
6.27%Libor 1m + 225 bps
10/10/201212/10/200910/03/201610/07/201710/07/201410/06/201510/12/2015
221,07937,918
100,000350,000150,000141,719150,000
230,00050,00090,404
350,000150,000
--
Total 1,150,716 870,404

notes to the consolidated financial statements 112(continued)
(d) As of December 31, 2008 and 2007, credit lines granted by several local and foreign financial institutions and available for future operating activities or to settle capital commitments amounted to US$1,617.0 million (US$1,390.5 million as of December 31, 2007).
14 technical reserves, insurance claims reserves and reserves for unearned premiums
(a) This item is made up as follows:
Insurance claims reserves represent reported claims and an estimation for incurred and not reported claims (IBNR). Reported claims are adjusted on the basis of technical reports received from independent adjusters. Claims to be paid by the reinsurers and coinsurers are shown as ceded claims.
As of December 31, 2008, the reserves for direct claims include reserves for incurred and non-reported claims for the three types of risks that the Group manages; US$15.2 millions for life risks, US$4.7 millions for general risks and US$20.1 millions to health risks (US$14.9, US$3.1 and US$18.6 millions, respectively, as of December 31, 2007). During 2008 and previous years, the differences between the estimations for the incurred and non-reported claims and the settled and pending liquidation claims have not been significant. In the case of general and health risks, retrospective analysis indicate that the amounts provisioned are greater than the settled claims and those pending liquidation by a percentage that does not exceed 10 percent of the provisioned amounts. Management believes that the estimated IBNR reserve is sufficient to cover any liability as of December 31, 2008 and 2007.
Borrowed funds 2008 2007
US$(000) US$(000)
Up to 1 year From 1 to 3 years From 3 to 5 years More than 5 years
63,324317,541362,374407,477
8,165148,921303,476409,842
Total 1,150,716 870,404
2008
Technical reserves
Reserves for direct claims Claims assumed Total
US$(000) US$(000) US$(000) US$(000)
Life insuranceGeneral insuranceHealth insurance
553,127124,846
17,367
64,553137,297
37,741
-32,812
27
617,680294,955
55,135
Total 695,340 239,591 32,839 967,770
2007
Technical reserves
Reserves for direct claims Claims assumed Total
US$(000) US$(000) US$(000) US$(000)
Life insuranceGeneral insuranceHealth insurance
500,76897,64615,766
50,04692,88725,059
-21,257
49
550,814211,79040,874
Total 614,180 167,992 21,306 803,478

a world in motion113
The movement for the years ended December 31, 2008 and 2007 of technical and insurance claims reserves is as follows:
(b) Insurance claims reserves (direct and assumed):
2008
Life insuranceGeneral
insuranceHealth
insurance Total
US$(000) US$(000) US$(000) US$(000)
Initial balance Claims PaymentsTranslation result
50,04688,059
(72,676)(876)
114,144163,251
(107,197)(89)
25,108155,387
(141,470)(1,257)
189,298 406,697
(321,343)(2,222)
Final balance 64,553 170,109 37,768 272,430
2007
Life insuranceGeneral
insuranceHealth
insurance Total
US$(000) US$(000) US$(000) US$(000)
Saldo inicialSiniestrosPagos de siniestros Resultado por traslación
42,72663,744
(57,626)1,202
41,593152,351(79,817)
17
19,061108,767
(103,061)341
103,380324,862
(240,504)1,560
Final balance 50,046 114,144 25,108 189,298

notes to the consolidated financial statements 114(continued)
(c) Technical reserves:
As of December 31, 2008 and 2007, no additional reserves were needed as a result of the liability adequacy test. The main assumptions used in estimation of annuities, disability and survivor reserves as of those dates, were the following:
The mortality tables used are those recommended by the Peruvian regulator (SBS).
2008
Life insuranceGeneral
insuranceHealth
insurance Total
US$(000) US$(000) US$(000) US$(000)
Initial balance Accretion expenses and otherUnearned premium reserves and annual variation, netInsurance subscriptionsPaymentsTranslation result
500,76814,8081,433
70,311(26,732)
(7,461)
97,646-
27,200---
15,766-
1,601---
614,18014,80830,23470,311
(26,732)(7,461)
Final balance 553,127 124,846 17,367 695,340
2007
Life insuranceGeneral
insuranceHealth
insurance Total
US$(000) US$(000) US$(000) US$(000)
Initial balance Accretion expenses and otherUnearned premium reserves and annual variation, netInsurance subscriptionsPaymentsTranslation result
442,17216,499
22078,342
(26,868)(9,597)
67,640-
30,006---
15,029-
737---
524,84116,49930,96378,342
(26,868)(9,597)
Final balance 500,768 97,646 15,766 614,180
Modality Mortality Table Technical rates
Life Immediate Annuity
Dead an Disability Pension System Insurance
Individual Life
RV–2004, B-85 and MI-85
B-85 and MI-85
CSO 80 adjustable
4.90% - 5.36% in US$3.32% in S/
Previsional regime 3.00%Definitive regime 2.14% in S/
Definitive regime 4.57% in US$4.00% - 5.00%

a world in motion115
The sensitivity of the estimates used by the Group to measure its insurance risks is represented primarily by the life insurance risks; the main variables as of December 31, 2008, are the interest rates and the mortality tables used. The Group has evaluated the changes of the reserves related to its most significant life insurance (Life immediate annuities) of +/- 100 bps of the interest rates and of +/- 5 bps of the mortality factors, being the results as follows:
15 bonds and subordinated notes issued
(a) This item is made up as follows:
Variation of the reserve
Variables Amount of the reserve Amount Percentage
US$(000) US$(000) %
Portfolio in US$ - Basis amountChanges in interest rates: + 100 bpsChanges in interest rates: - 100 bpsChanges in Mortality tables to 105%Changes in Mortality tables to 95%
309,132281,653341,705305,679312,773
(27,479)32,573(3,453)
3,641
(8.89)10.54(1.12)
1.18
Portfolio in S/ - Basis amountChanges in interest rates: + 100 bpsChanges in interest rates: - 100 bpsChanges in Mortality tables to 105%Changes in Mortality tables to 95%
20,20318,01222,91320,07020,345
(2,191)2,710(133)
142
(10.84)13.41(0.66)
0.70
Weightedaverage annual
interest rate
2008 2007 Maturity 2008 2007
% % US$(000) US$(000)
Bonds Corporate bonds (i)Leasing bonds (i)Subordinated bonds (i)Mortgage bonds
6.916.876.717.69
6.596.106.727.70
Between November 2009 and July 2018Between June 2009 and August 2018
Between September 2009 and May 2027Between May 2011 and April 2012
227,902217,86361,07415,278
127,331167,255104,841
20,744
522,117 420,171
Subordinated notesSubordinated negotiable certificates notesSubordinated notes (ii)
6.957.17
6.957.17
November 2021October 2022
117,512137,761
113,503161,308
777,390 694,982
Interest payable 7,840 7,316
Total 785,230 702,298

notes to the consolidated financial statements 116(continued)
i During 2008 y 2007, the Group issued corporate and leasing bonds for the following amounts:
(*) As a result of the hedging strategy described in note 11(b)(*), these bonds were economically converted to US Dollars with fixed interest in US Dollar of 4.10, 4.02 and 4.41 percent, respectively, through CCS and IRS.
During 2008, redeemed corporate, leasing and subordinate bonds amounted to US$23.9 million, US$84.8 million and US$40.3 million, respectively (US$18.8 million, US$55.0 million and US$5.5 million, respectively, during 2007).
Leasing and mortgages bonds are collateralized by the fixed assets financed by the Group.
ii In October 2007, BCP through its Panama branch, issued Subordinated Notes for S/483.3 million in the international market with maturities on 2022. This debt accrues a fixed annual interest rate of 7.17 percent, for the first 10 years, with semi annual payments. After the first 10 years, in October 2017, interest rate will be the market interest rate for sovereign bonds issued by the Peruvian Government with maturity on 2037, plus 150 basis points, with semi annual payments. At those dates, BCP can redeem 100 percent of the notes, without penalties. This debt, subject to foreign exchange risk and interest rate risk, has been hedged through a CCS; as a result, the Subordinated Notes were changed to US$ Dollars and the fixed interest rate was changed to variable rate of Libor 6 months plus 99 basis points, note 11(b)(iii).
Issuance 2008 Amount Currency Maturity Rate
US$(000)
Second Program of Corporate Bonds BCPFirst issuance - Series B(*)Second issuance - Series A (*)Third issuance - Series AThird issuance - Series B
38,15225,93247,77015,924
Nuevo SolNuevo SolNuevo SolNuevo Sol
27/03/201518/04/201112/06/201810/07/2018
6.815.787.478.50
127,778
Sixth Program of Leasing Bonds BCPSixth issuance - Series A 31,847 Nuevo Sol 20/08/2018 8.72
Fourth Program of Leasing Bonds Credito LeasingFourth issuance – Series AFourth issuance – Series BFourth issuance – Series CFourth issuance – Series D
10,49230,00025,00018,000
US DollarsUS DollarsUS DollarsUS Dollars
08/02/201114/05/201123/06/201123/07/2011
5.476.256.256.25
83,492
Fifth Program of Leasing Bonds Credito LeasingFourth issuance – Series AFourth issuance – Series B
12,7391,653
Nuevo SolNuevo Sol
28/02/201114/05/2011
6.065.72
14,392
Issuance 2007 Amount Currency Maturity Rate
US$(000)
Second Program of Corporate Bonds BCPFirst issuance - Series A (*) 48,849 Nuevo Sol 19/12/2014 6.84
First Program of Leasing Bonds BCPSecond issuance – Series ASecond issuance – Series BSecond issuance – Series CSecond issuance – Series A
10,00015,0009,6254,777
US DollarsUS DollarsUS DollarsNuevo Sol
10/06/200913/07/200913/08/200911/01/2010
5.415.755.726.06
39,402

a world in motion117
This subordinated debt has certain financial and operating covenants which, in Management’s opinion, the Group is in compliance at the consolidated balance sheet date.
(b) Bonds and subordinated notes, classified by maturity are shown below:
16 equity
(a) Share capital
As of December 31, 2008, 2007 and 2006, 94,382,317 shares of capital stock were issued at US$5 per share.
(b) Treasury stock
As of December 31, 2008, 2007 and 2006, treasury stock comprises the par value of 14,620,842 Credicorp’s shares owned by the Group’s companies. The difference between their acquisition cost (US$186.5 million) and their par value (US$73.1 million), is presented as a reduc-tion of the “Capital surplus”.
(c) Reserves
In accordance with Peruvian regulation, a reserve of up to at least 35 percent of paid-in capital of the Group’s subsidiaries operating in Peru is required to be established through annual transfers of at least 10 percent of their net income. As of December 31, 2008, 2007 and 2006, these reserves amounted to approximately US$231.7, US$222.7 and US$214.8 million, respectively.
The Shareholders’ meetings held on March 28, 2008, February 28, 2007 and October 26, 2006 agreed to transfer from “Retained earnings” to “Other reserves” an amount of US$228.2, US$107.3 and US$210.4 million, respectively.
2008 2007
US$(000) US$(000)
Up to 3 months From 3 months to 1 yearFrom 1 to 3 yearsFrom 3 to 5 yearsOver 5 years
1,71764,190
235,86775,398
400,218
61,18885,968
154,95368,007
324,866
Total 777,390 694,982

notes to the consolidated financial statements 118(continued)
The caption “Other reserves” includes the unrealized net gain (loss) from available-for-sale investments and from derivatives instruments used as cash flows hedge net of its corresponding deferred tax and minority interest; its movement is as follows:
(d) Dividend distribution
During 2008, 2007 and 2006, Credicorp paid cash dividends, net of the effect of treasury shares, for approximately US$119.6, US$103.7 and US$87.7 million, respectively.
In accordance with current Peruvian legislation, there is no restriction for overseas remittance of dividends or the repatriation of foreign invest-ment. Dividends paid by the Peruvian subsidiaries to Credicorp are subject to a withholding tax of 4.1 percent.
(e) Equity for legal purposes (Regulatory capital)
As of December 31, 2008 and 2007, the regulatory capital for Credicorp’s subsidiaries engaged in financial and insurance activities in Peru calculated following SBS regulations amounted to approximately US$1,604.7 and US$1,420.2 million, respectively. On the other hand, the consolidated regulatory capital for Credicorp exceeds by approximately US$263.6 million the minimum regulatory capital required as of De-cember 31, 2008 (approximately US$350.4 million as of December 31, 2007).
Unrealized net gain (loss) of:
Available-for-sale investmentsDerivatives instruments used
as cash flow hedge Total
US$(000) US$(000) US$(000)
Balances as of January 1st, 2006Net unrealized gain from available-for-sale investments, note 5(c) Transfer of net realized gain from investments available-for-sale to the income statement, net of realized loss, note 5(c)Net gain on cash flow hedge
81,68069,411
(6,620)-
1,622-
-1,316
83,30269,411
(6,620)1,316
Balances as of December 31, 2006 144,471 2,938 147,409
Net unrealized gain from available-for-sale investments note 5(c) Transfer of net realized gain from investments available-for-sale to the income statement, net of realized loss, note 5(c)Transfer of impairment on investment available-for-sale to income statement, note 5(c)Net loss on cash flow hedge, note 11(b)(ii)
85,129
(17,634)
5,017-
-
-
-(40,371)
85,129
(17,634)
5,017(40,371)
Balances as of December 31, 2007 216,983 (37,433) 179,550
Net unrealized loss from available-for-sale investments note 5(c) Transfer of net realized gain from investments available-for-sale to the income statement, net of realized loss, note 5(c)Transfer of impairment on investment available-for-sale to income statement, note 5(c)Net loss on cash flow hedge, note 11(b)(ii)
(164,302)
(35,684)
55,732-
-
-
-(80,689)
(164,302)
(35,684)
55,732(80,689)
Balances as of December 31, 2008 72,729 (118,122) (45,393)

a world in motion119
17 taxes
(a) Credicorp is not subject to income tax or any taxes on capital gains, equity or property. Credicorp’s Peruvian subsidiaries are subject to corporate taxation on income under the Peruvian Tax system. The statutory Income Tax rate was 30 percent on taxable income after calculat-ing the workers’ profit sharing, which in accordance with current legislation is determined using a 5 percent rate.
ASHC and its Subsidiaries are not subject to taxes in the Cayman Islands or Panama. For the three years ended December 31, 2008, 2007 and 2006, no taxable income was generated from its operations in the United States of America.
The reconciliation between the statutory income tax rate and the effective tax rate for the Group is as follows:
(b) Income tax expense as of December 31, 2008, 2007 and 2006 comprises:
The deferred income tax has been calculated on all temporary differences considering an income tax rate of 30 percent.
2008 2007 2006
% % %
Peruvian statutory income tax rateIncrease (decrease) in the statutory tax rate due to:(i) Increase arising from net income of subsidiaries not
domiciled in Peru(ii) Non-taxable income, net(iii) Translation results not considered for tax purposes
30.00
4.39(14.90)
3.38
30.00
0.46(5.76)(3.15)
30.00
4.08(4.86)(3.96)
Effective income tax rate 22.87 21.55 25.26
2008 2007 2006
US$(000) US$(000) US$(000)
Current -In PeruIn other countries
110,3653,537
114,4962,712
85,4132,960
113,902 117,208 88,373
DeferredIn Peru (4,394) (14,921) (4,786)
Total 109,508 102,287 83,587

notes to the consolidated financial statements 120(continued)
(c) The following table presents a summary of the Group’s deferred income tax:
Credicorp and its subsidiaries have recorded a deferred income tax as part of the equity caption “Other reserves” for US$19.6, US$10.1, and US$9.2 million, as of December 31, 2008, 2007 and 2006, respectively, related to the income tax effects of unrealized gains and losses on investments available for sale. Likewise, in 2006, the Group recognized the deferred tax liability arising from the acquisition of AFP Union Vida (Note 2) for approximately US$25.6 million.
(d) The Peruvian Tax Authority has the right to review and, if necessary, amend the annual tax returns of the Peruvian subsidiaries up to four year after their filing. BCP’s tax returns for years 2001-2005 and PPS’s tax returns for years 2001-2006, were reviewed by the Tax Authority; no significant additional taxes arose from said reviews. Management of each subsidiary has filed an appeal in the applicable cases.
Years 2006 to 2008 for BCP and 2007 to 2008 for PPS, are pending review. Any additional tax arising as a result of the Tax Authority review will be charged to income in the year when such additional tax is determined. At present, it is not possible to estimate the adjustments that the Tax Authority may determine; however, in Management’s opinion, it is not expected that any additional tax will be determined in amounts considered significant to the consolidated financial statements as of December 31, 2008 and 2007.
18 stock appreciation rights
As indicated in note 3(w), Credicorp has granted stock appreciation rights (SARs) to certain key executives and employees who have at least one year service in Credicorp or any of its subsidiaries. At the grant date and in each one of the subsequent three years, the granted SARs may be exercised up to 25 percent of all SARs granted in the plan. The SARs expire after eight years.
2008 2007
US$(000) US$(000)
AssetsAllowance for loan losses, netStock appreciation rights provisionTax loss carry-forward -PPSReserve for sundry risks, netNon-accrued interestOther
28,33711,5786,0139,7091,7139,823
21,98524,0014,4518,8533,2434,323
Deferred income tax asset 67,173 66,856
LiabilitiesIntangibles assets, netUnrealized net gains on investmentsDeferred commissionsGain for difference tax exchangeLeasing operations, netValuation of Citigroup Indexed certificates Other
(23,128)(18,809)(6,926)(5,502)(1,862)
(815)(9,091)
(25,205)(38,424)(3,290)
(800)(1,250)
(18,131)(2,725)
Deferred income tax liability (66,133) (89,825)
Net deferred income tax asset (liability) 1,040 (22,969)

a world in motion121
The number of outstanding SARs and their exercise prices are as follows:
Credicorp’s Management has estimated the SARs´ fair value as of December 31, 2008 and 2007, using the binomial option pricing model, considering the following market information:
The movement of the SARs for the years ended December 31, 2008 and 2007 is as follows:
Credicorp assumes the payment of the related income tax on behalf of its executives and employees, which corresponds to 30 percent of the benefit. Credicorp estimates said income tax over the basis of the liability recorded for the vested benefits.
Year of Issuance Numberof outstanding SARs
issued as of December 31, 2008
Number of Vested SARsas of December 31 Exercise price
2008 2007 2008 2007
US$ US$
2000
2001
2002
2003
2004
2005
2006
2007
2008
-
60,000
60,000
134,900
185,950
241,700
362,800
513,125
656,750
-
60,000
60,000
134,900
185,950
241,700
327,784
320,859
286,625
49,750
73,000
92,500
151,900
237,700
349,813
310,800
271,656
-
8.00
4.80
6.48
7.67
10.49
15.50
24.82
48.00
72.04
8.50
5.30
6.98
8.17
10.99
16.00
25.32
48.50
-
2,215,225 1,617,818 1,537,119
2008 2007
Outstanding SARs
Vested SARs
Outstanding SARs
Vested SARs
Number Number Amount Number Number Amount
US$(000) US$(000)
Balance as of January 1stGranted and vestedExercisedDecreaseIncrease (decrease) in theoption fair value
2,134,650665,500
(496,175)(88,750)
-
1,537,119576,874
(496,175)-
-
89,6029,498
(19,734)-
(36,379)
1,858,350689,500
(410,700)(2,500)
-
1,301,928647,610
(410,700)(1,719)
-
38,76122,248
(18,801)(88)
47,482
Balance as of December 31 2,215,225 1,617,818 42,987 2,134,650 1,537,119 89,602
Key assumptions 2008 2007
Expected volatility Risk free interest rateExpected lifetimeQuoted price of Credicorp shares at year-end
34.98%6.25%
4.84 añosUS$49.96
32.70%3.51%
4.92 añosUS$76.30

notes to the consolidated financial statements 122(continued)
The liabilities, including the above mentioned income tax, recorded for this plan are included in the consolidated balance sheet caption “Other liabilities – Payroll taxes, salaries and other personnel expenses”, note 11 (a), and the expenses in the consolidated income statement caption “Personnel expenses”. In 2008, 2007 and 2006, SARs prices were modified and informed to the Group’s executives and employees.
During 2008, 2007 and 2006, the Group signed several contracts with Citigroup by which it acquired certificates linked to the yield of Credi-corp’s shares, see note 7(b).
19 off-balance sheet accounts
(a) This item is made up as follows:
(b) In the normal course of its business, the Group’s banking subsidiaries are party to transactions with off-balance sheet risk. These transac-tions expose them to credit risk in addition to the amounts recognized in the consolidated balance sheets.
Credit risk for off-balance sheet financial instruments is defined as the possibility of sustaining a loss because any other party to a financial instrument fails to perform in accordance with the terms of the contract. The exposures to losses are represented by the con-tractual amount specified in the related contracts. The Group applies the same credit policies in making commitments and conditional obligations as it does for on-balance sheet instruments (note 6(a)), including the requirement to obtain collateral when it is deemed necessary. Collateral held varies, but may include deposits in financial institutions, securities or other assets. Many of the contingent transactions are expected to expire without any performance being required, therefore the total committed amounts do not necessarily represent future cash requirements.
(c) As of December 31, 2008 and 2007, Credicorp has currency forwards derivatives. Currency forwards are commitments to buy or sell currency at a future date at a contracted price. Risk arises from the possibility that the counter-party to the transaction does not perform as agreed and from the changes in the prices of the underlying currencies. As of those dates, forward currency purchase and sale agreements nominal amounts were approximately US$2,478.2 million and US$2,210.2 million, respectively, which in general have maturities of less than a year. These agreements are entered into to satisfy client requirements and are recognized in the consolidated financial statements at their fair value. As of December 31, 2008, the forward contracts net position is an oversell of U.S. Dollars of approximately US$627.6 million (overbuy of approximately US$331.1 million as of December 31, 2007).
Interest rate and currency swaps are derivatives contracts, where counter parties exchange variable interest rates for fixed interest rates or different currencies, respectively, in the terms and conditions established at the contract inception. The risk arises each time the projected level of the variable rate during the term of the contract is higher than the swap rate, as well as from non-compliance with contractual terms
2008 2007
US$(000) US$(000)
Contingent credits (b)Guarantees and stand by lettersImport and export letters of credit
1,506,506249,396
1,133,476431,049
1,755,902 1,564,525
Responsibilities under credit lines agreements (d)Forward currency contracts - sell (c)Forward currency contracts - buy (c)Swap contracts (c)Interest rate swapsCurrency swapsCross currency swaps
1,234,9641,552,917(925,317)
2,160,390192,899317,043
1,082,115939,531
(1,270,648)
1,277,841118,55250,420
Total 6,288,798 3,762,336

a world in motion123
by one of the parties. As of December 31, 2008, the notional amount of open interest rate and currency swap contracts was approximately US$2,353.3 million (approximately US$1,396.4 million as of December 31, 2007).
Cross currency swap derivative contract involves the exchange of interest payments based on two different currency principal balances and reference interest rate, generally also includes the exchange of principal amounts at the start and / or end of the contract. As of December 31, 2008, the notional amount of cross currency swap contracts were approximately US$317.0 million (approximately US$50.4 million as of December 31, 2007).
As of December 31, 2008, the fair values of the asset and liability forward exchange contracts and interest rate and cross currency swaps amounted approximately to US$79.3 and US$256.8 million, respectively (approximately US$45.8 and US$69.7 million as of December 31, 2007) and are included under the caption “Other assets and other liabilities” of the consolidated balance sheets, respectively, note 11(b).
(d) Responsibilities under credit lines agreements include credit lines and other consumer loans facilities (credit card) and are cancelable upon notification to the client.
20 interest and dividend income and interest expenses
These items are made up as follow:
During 2008, 2007 and 2006 the interest income accrued on impaired financial instrument recognized in the consolidated income statement amounted to US$4.7, US$3.5 and US$4.1 million, respectively.
2008 2007 2006
US$(000) US$(000) US$(000)
Interest and dividend incomeInterest on loansInterest on due from banksInterest on trading securities Interest on investments available-for-saleDividends from investments available-for-sale and trading securitiesGain from hedging derivatives instrumentsOther interest income
963,94075,2661,168
298,549
12,21415,79433,403
701,471105,817
3,289228,473
9,083635
17,206
537,67193,886
2,913132,792
9,140-
5,600
Total 1,400,334 1,065,974 782,002
Interest expensesInterest on deposits and obligationsInterest on bonds and subordinated notes issuedInterest on due to banks and correspondents and borrowed fundsLoss from hedging derivatives instrumentsOther interest expenses
(360,238)(51,756)
(104,818)(16,296)(44,303)
(295,750)(33,592)
(83,070)(635)
(18,953)
(189,552)(25,282)
(56,634)-
(12,010)
Total (577,411) (432,000) (283,478)

notes to the consolidated financial statements 124(continued)
21 banking services commissions
This item is made up as follows:
22 net premiums earned
This item is made up as follows:
(*) Includes the annual variation of the technical and unearned premiums reserves.(**) “Premiums ceded to reinsurers, net” include: (i) US$22.5 million for non- proportional automatic contracts (excess of loss) (US$17.5 million in the year 2007), (ii) US$3.7 million for reinstallation premiums (US$6.1 million in the year 2007) and (iii) US$84.3 million for facultative contracts (US$53.1 million in the year 2007).
2008 2007 2006
US$(000) US$(000) US$(000)
Maintenance of accounts and transfers and credit and debit card servicesFunds managementContingent creditsCollection servicesCommissions for banking services Brokerage and custody services Other
180,512102,76030,17426,79512,85110,07531,080
152,62683,72623,81927,1639,468
13,70814,251
122,53438,72822,34424,514
7,3007,793
20,565
Total 394,247 324,761 243,778
Grosspremiums (*)
Premiums ceded to reinsurers,
net (**)
Assumedfrom other com-
panies, netNet premiums
earned
Percentageof assumed net
premiums
US$(000) US$(000) US$(000) US$(000) %
2008
Life insurance
Health insurance
General insurance
110,730
169,410
218,563
(2,484)
(2,692)
(105,431)
6
-
5,801
108,252
166,718
118,933
-
-
4.88
Total 498,703 (110,607) 5,807 393,903 1.47
2007
Life insurance
Health insurance
General insurance
89,598
129,306
146,331
(2,658)
(2,488)
(71,759)
1,408
116
7,418
88,348
126,934
81,990
1.59
0.09
9.05
Total 365,235 (76,905) 8,942 297,272 3.01
2006
Life insurance
Health insurance
General insurance
66,477
111,295
138,964
(2,923)
(2,377)
(64,767)
1,228
1,526
1,838
64,782
110,444
76,035
1.90
1.38
2.42
Total 316,736 (70,067) 4,592 251,261 1.83

a world in motion125
23 net claims incurred for life, general and health insurance contracts
This item is made up as follows:
2008
Life insuranceGeneral
insurance Health
insurance Total
US$(000) US$(000) US$(000) US$(000)
Gross insurance claimsCeded claims
88,059(1,693)
163,251(61,361)
155,387(1,733)
406,697(64,787)
Net insurance claims 86,366 101,890 153,654 341,910
2007
Life insuranceGeneral
insurance Health
insurance Total
US$(000) US$(000) US$(000) US$(000)
Gross insurance claimsCeded claims
63,744(52)
152,351(84,662)
108,767(1,548)
324,862(86,262)
Net insurance claims 63,692 67,689 107,219 238,600
2006
Life insuranceGeneral
insurance Health
insurance Total
US$(000) US$(000) US$(000) US$(000)
Gross insurance claimsCeded claims
52,713(823)
60,285(13,698)
89,797(1,752)
202,795(16,273)
Net insurance claims 51,890 46,587 88,045 186,522

notes to the consolidated financial statements 126(continued)
24 other income and expenses
These items are made up as follow:
25 earnings per share
The net earning per ordinary share has been determined over the net income attributable to equity holders of Credicorp as follows:
2008 2007 2006
US$(000) US$(000) US$(000)
Other incomeIncome from the sale of seized assetsReal estate rental incomeRecoveries of other accounts receivable and other assetsOther
12,8957,7432,859
14,175
10,6893,5193,1137,613
9,2443,0311,7638,638
Total other income 37,672 24,934 22,676
Other expensesCommissions from insurance activitiesProvision for sundry risks, note 11(d)Sundry technical insurance expensesProvision for other accounts receivablesOther
39,36437,5499,1583,288
12,517
29,1358,096
21,9292,836
10,003
25,5556,461
10,9103,1636,629
Total other expenses 101,876 71,999 52,718
2008 2007 2006
Number of shares:Ordinary shares, note 16(a)Less - treasury shares, note 16(b)
94,382,317(14,620,842)
94,382,317(14,620,842)
94,382,317(14,620,842)
Weighted outstanding average number of ordinary shares 79,761,475 79,761,475 79,761,475
Net income attributable to equity holders of Credicorp (in thousands of U.S. dollars) 357,756 350,735 230,013
Basic and diluted earnings per share for net income attributable to equity holders of Credicorp (in U.S. Dollars) 4.49 4.40 2.88

a world in motion127
26 business segments
Transactions between the business segments are realized on normal commercial terms and conditions. The following table presents the Group’s financial information by industry (primary segment) and geographical area (secondary segment) as of December 31, 2008, 2007 and 2006:
i Business segments by industry (amount expressed in million of U.S. Dollars):
External income
Income from other
segmentsElimina-
tions
Total income
(*)
Operat-ing
income (**)
Totalassets
Fixed assets,
net
Deprecia-tion and
amorti-zation
Impair-ment of
available-for-sale invest-ments
Other provi-sions (***)
2008BankingInsurancePension fundsBrokerage and other
1,797469
7150
83151
62
(83)(15)(1)
(62)
1,797469
7150
804118
-(47)
19,1681,231
224198
2625611
-
4449-
4411
-5
54--
(4)
Total consolidated 2,387 161 (161) 2,387 875 20,821 329 57 60 50
2007BankingInsurancePension fundsBrokerage and other
1,4073775547
6513(4)
7
(65)(13)
4(7)
1,4073775547
614110(1)
(30)
16,2451,138
24479
2184611
-
3948-
5---
35--
(4)
Total consolidated 1,886 81 (81) 1,886 693 17,706 275 51 5 31
2006BankingInsurancePension fundsBrokerage and other
9753162358
242-1
(24)(2)
-(1)
9753162358
447115
-1
11,090989227576
1974711
-
364
10-
----
2---
Total consolidated 1,372 27 (27) 1,372 563 12,882 255 50 - 2

notes to the consolidated financial statements 128(continued)
ii Segment information by geographical area (amounts expressed in millions of U.S. Dollars):
(*) Includes total interest and dividend income, other income and net premiums earned from insurance activities.(**) Operating income includes the net interest income from banking activities and the amount of the net premiums earned, less insurance claims.(***) Correspond to reserves for seized assets and the allowance for loan losses.
27 transactions with related parties
(a) The Group’s consolidated financial statements as of December 31, 2008 and 2007 include transactions with related companies, the Board of Directors, the Group’s key executives (defined as the management of Credicorp’s Holding) and enterprises which are controlled by these individuals through their majority shareholding or their role as chairman or CEO.
(b) The following table shows the main transactions with related parties as of December 31, 2008 and 2007.
(c) All transactions with related parties are made in accordance with normal market conditions available to other customers. As of December 31, 2008, direct loans to related companies are secured by collaterals, and had maturities between February 2009 and July 2017 and accrued an annual averages interest rate of 7.98 percent (as of December 31, 2007 had maturities between January 2008 and September 2017 and accrued an annual average interest rate of 6.79 percent). Likewise, as of December 31, 2008 and 2007, the Group maintains allowance for loan losses to related parties amount to approximately US$1.2 million, respectively.
(d) As of December 31, 2008 and 2007, directors, officers and employees of the Group have been involved, directly and indirectly, in credit transactions with certain subsidiaries of the Group, as permitted by Peruvian Banking and Insurance Law Nº26702, which regulates and limits certain transactions with employees, directors and officers of a bank or an insurance company. As of December 31, 2008 and 2007, direct loans to employees, directors and key management amounts to US$116.3 and US$85.1 million, respectively and are paid monthly and earn interest at market rates.
2008 2007 2006
Total income
(*)Operating
income (**)Total
assets
Total income
(*)Operating
income (**)Total
assets
Total income
(*)Operating
income (**)Total
assets
PeruPanamaCayman IslandsBoliviaUnited States of America
2,03520424
11212
80519(4)523
16,0812,4901,088
933229
1,5731071007828
6251019381
12,6932,5061,423
815269
1,15255816222
5187
1428(4)
9,655839
1,364654370
Total consolidated 2,387 875 20,821 1,886 693 17,706 1,372 563 12,882
2008 2007
US$(000) US$(000)
Direct loansTrading securitiesInvestments available-for-saleDepositsContingent creditsDerivatives at fair valueInterest income related to loans – incomeInterest expense related to deposits - expenseOther income
143,8551
63,78234,66923,574
4,1792,8892,6692,533
94,1021,673
90,39631,68914,026
3862,2882,0091,192

a world in motion129
There are no loans to the Group’s directors and key personnel guaranteed with Credicorp or any of it Subsidiaries’ shares.
(e) The Group’s key executives compensation (including the related income taxes assumed by the Group) as of December 31, 2008, 2007 and 2006, comprised the following:
(f) As of December 31, 2008 and 2007, the Group has participation in different mutual funds and hedge funds managed by certain Group’s subsidiaries, classified as trading securities and Investments available-for-sale for a total amount of US$94.7 million and US$133.8 million, respectively.
2008 2007 2006
US$(000) US$(000) US$(000)
Stock appreciation rights, note 18SalariesDirectors compensationsOther
27,3625,6251,3038,209
27,1135,5351,162
12,947
23,2064,8241,1736,962
Total 42,499 46,757 36,165

notes to the consolidated financial statements 130(continued)
28 financial instruments classification
The following are the carrying amounts of the financial assets and liabilities captions in the consolidated balance sheets, by categories as defined under IAS 39:
As of December 31, 2008 As of December 31, 2007
Financial assets/liabilities designated at fair value
Financial assets/liabilities designated at fair value
Held for trading At inception
Loans and receivables
Investments available-
for-sale
Liabilities at amortized
cost TotalHeld for trading At inception
Loans and receivables
Investments available-for-
sale
Liabilities at amortized
cost Total
US$(000) US$(000) US$(000) US$(000) US$(000) US$(000) US$(000) US$(000) US$(000) US$(000) US$(000) US$(000)
Assets
Cash and due from banks
Trading securities
Investments available-for-sale
Loans, net
Financial assets designated at fair value through profit or loss
Premiums and other policies receivable
Accounts receivable from reinsurers and coinsurers
Due from customers on acceptances
Other assets, note 11
-
36,084
-
-
-
-
-
-
79,275
-
-
-
-
129,631
-
-
-
-
3,766,171
-
-
10,322,041
-
111,561
165,144
232,580
247,465
-
-
4,959,068
-
-
-
-
-
-
-
-
-
-
-
-
-
-
-
3,766,171
36,084
4,959,068
10,322,041
129,631
111,561
165,144
232,580
326,740
-
50,995
-
-
-
-
-
-
45,843
-
-
-
-
213,153
-
-
-
-
3,073,865
-
-
8,039,500
-
85,495
116,141
35,901
151,825
-
-
5,228,641
-
-
-
-
-
-
-
-
-
-
-
-
-
-
-
3,073,865
50,995
5,228,641
8,039,500
213,153
85,495
116,141
35,901
197,668
115,359 129,631 14,844,962 4,959,068 - 20,049,020 96,838 213,153 11,502,727 5,228,641 - 17,041,359
Liabilities
Deposits and obligation
Financial liabilities designated at fair value through profit or loss
Due to banks and correspondents
Due from customers on acceptances
Accounts payable to reinsurers and coinsurers
Borrowed funds
Bonds and subordinated notes issued
Other liabilities, note 11
-
-
-
-
-
-
-
256,792
-
-
-
-
-
-
-
-
-
-
-
-
-
-
-
-
-
-
-
-
-
-
-
-
13,950,437
-
1,179,991
232,580
55,841
1,150,716
785,230
318,320
13,950,437
-
1,179,991
232,580
55,841
1,150,716
785,230
575,112
-
-
-
-
-
-
-
69,662
-
50,561
-
-
-
-
-
-
-
-
-
-
-
-
-
-
-
-
-
-
-
-
-
-
11,350,714
-
1,453,261
35,901
33,963
870,404
702,298
389,314
11,350,714
50,561
1,453,261
35,901
33,963
870,404
702,298
458,976
256,792 - - - 17,673,115 17,929,907 69,662 50,561 - - 14,835,855 14,956,078

a world in motion131
As of December 31, 2008 As of December 31, 2007
Financial assets/liabilities designated at fair value
Financial assets/liabilities designated at fair value
Held for trading At inception
Loans and receivables
Investments available-
for-sale
Liabilities at amortized
cost TotalHeld for trading At inception
Loans and receivables
Investments available-for-
sale
Liabilities at amortized
cost Total
US$(000) US$(000) US$(000) US$(000) US$(000) US$(000) US$(000) US$(000) US$(000) US$(000) US$(000) US$(000)
Assets
Cash and due from banks
Trading securities
Investments available-for-sale
Loans, net
Financial assets designated at fair value through profit or loss
Premiums and other policies receivable
Accounts receivable from reinsurers and coinsurers
Due from customers on acceptances
Other assets, note 11
-
36,084
-
-
-
-
-
-
79,275
-
-
-
-
129,631
-
-
-
-
3,766,171
-
-
10,322,041
-
111,561
165,144
232,580
247,465
-
-
4,959,068
-
-
-
-
-
-
-
-
-
-
-
-
-
-
-
3,766,171
36,084
4,959,068
10,322,041
129,631
111,561
165,144
232,580
326,740
-
50,995
-
-
-
-
-
-
45,843
-
-
-
-
213,153
-
-
-
-
3,073,865
-
-
8,039,500
-
85,495
116,141
35,901
151,825
-
-
5,228,641
-
-
-
-
-
-
-
-
-
-
-
-
-
-
-
3,073,865
50,995
5,228,641
8,039,500
213,153
85,495
116,141
35,901
197,668
115,359 129,631 14,844,962 4,959,068 - 20,049,020 96,838 213,153 11,502,727 5,228,641 - 17,041,359
Liabilities
Deposits and obligation
Financial liabilities designated at fair value through profit or loss
Due to banks and correspondents
Due from customers on acceptances
Accounts payable to reinsurers and coinsurers
Borrowed funds
Bonds and subordinated notes issued
Other liabilities, note 11
-
-
-
-
-
-
-
256,792
-
-
-
-
-
-
-
-
-
-
-
-
-
-
-
-
-
-
-
-
-
-
-
-
13,950,437
-
1,179,991
232,580
55,841
1,150,716
785,230
318,320
13,950,437
-
1,179,991
232,580
55,841
1,150,716
785,230
575,112
-
-
-
-
-
-
-
69,662
-
50,561
-
-
-
-
-
-
-
-
-
-
-
-
-
-
-
-
-
-
-
-
-
-
11,350,714
-
1,453,261
35,901
33,963
870,404
702,298
389,314
11,350,714
50,561
1,453,261
35,901
33,963
870,404
702,298
458,976
256,792 - - - 17,673,115 17,929,907 69,662 50,561 - - 14,835,855 14,956,078
notes to the consolidated financial statements 132(continued)
29 financial risk management
By their nature, the Group’s activities involve principally the use of financial instruments, including derivatives. The Group accepts deposits from customers at both fixed and floating rates, for various periods, and seeks to earn above-average interest margins by investing these funds in high-quality assets. The Group seeks to increase these margins by consolidating short-term funds and lending for longer periods at higher rates, while maintaining sufficient liquidity to meet all claims that might fall due.
The Group also seeks to raise its interest margins by obtaining above-average market margins, net of allowances, through lending to commercial and retail borrowers with a range of credit products. Such exposures involve not just on-balance sheet loans and advances; the Group also enters into guarantees and other commitments such as letters of credit and performance.
The Group also trades in financial instruments where it takes positions in traded and over-the-counter instruments, including derivatives, to take advantage of short-term market movements in equities, bonds, currency and interest rates.
In this sense, risk is inherent in the Group’s activities but it is managed through a process of ongoing identification, measurement and monitoring, subject to risk limits and other controls. This process of risk management is critical to the Group’s continuing profitability and each individual within the Group is accountable for the risk exposures relating to his or her responsibilities. The Group is exposed to operating risk, credit risk, liquidity risk and market risk, the latter being subdivided into trading and non-trading risks.
The independent risk control process does not include business risks such as changes in the environment, technology and industry. They are monitored through the Group’s strategic planning process.
(a) Risk management structure
The Group’s Board of Directors and of each subsidiary is ultimately responsible for identifying and controlling risks; however, there are sepa-rate independent bodies in the major subsidiaries (BCP, PPS and ASHC) responsible for managing and monitoring risks, as further explained bellow:
i Board of DirectorsThe Board of Directors of each major subsidiary is responsible for the overall risk management approach and responsible for the approval of the policies and strategies currently in place. The Board provides written principles for overall risk management, as well as written policies covering specific areas, such as foreign exchange risk, interest rate risk, credit risk, use of derivative financial instruments and non-derivative financial instruments. ii Risk Management CommitteeThe Risk Management Committee of each major subsidiary is responsible for the strategy used for mitigating risks as well as setting forth the overall principles, policies and limits for the different types of risks; it is also responsible for monitoring fundamental risk issues and manages and monitors the relevant risk decisions.
iii Risk Management DepartmentThe Risk Management Department of each major subsidiary is responsible for developing, implementing and improving, on a continuous basis, the Group’s risk management infrastructure by adopting and incorporating global best practices and following established policies.
iv Internal AuditRisk management processes throughout the Group are monitored by the internal audit function, which examines both the adequacy of the procedures and the compliance of them. Internal Audit discusses the results of all assessments with Management, and reports its findings and recommendations to Credicorp’s Audit Committee and Board of Directors.

a world in motion133
v Treasury and Foreign Exchange DepartmentsTreasury Department is responsible for managing the Group’s assets and liabilities and the overall financial structure. It is also primarily responsible for the Group’s management of funding and liquidity risks; as well as the investment, forward and spot portfolios, assuming the related liquidity, interest rate and exchange rate risks, under the policies and limits currently effective.
(b) Risk measurement and reporting systems
The Group’s risks are measured using a method which reflects both the expected loss likely to arise in normal circumstances and unexpected losses, which are an estimate of the ultimate actual loss based on statistical models. The models make use of probabilities derived from historical experience, adjusted to reflect the economic environment. The Group also runs worse case scenarios that would arise in the event that extreme events which are unlikely to occur do, in fact, occur.
Monitoring and controlling risks are primarily performed based on limits established by the Group. These limits reflect the business strategy and market environment of the Group as well as the level of risk that the Group is willing to accept. In addition, the Group monitors and measures the overall risk bearing capacity in relation to the aggregate risk exposure across all risk types and activities. Information compiled from all the Group’s subsidiaries is examined and processed in order to analyze, control and identify early risks. This information is presented and explained to the Board of Directors, the Risk Management Committee, and all relevant members of the Group. The report includes aggregate credit exposure, credit metric forecasts, hold limit exceptions, VaR (Value at Risk), liquidity ratios and risk profile changes. Senior management assesses the fair value of the investments and the appropriateness of the allowance for credit losses periodi-cally.
(c) Risk mitigation
As part of its overall risk management, the Group uses derivatives and other instruments to manage exposures resulting from changes in interest rates, foreign currencies, equity risk and credit risk.
The risk profile is assessed before entering into hedge transactions, which are authorized by the appropriate level of seniority within the Group. The effectiveness of hedges is assessed by the Risk Management Department (based on economic considerations rather than the IFRS hedge accounting regulations). The effectiveness of all the hedge relationships is monitored by the unit monthly. In situations of ineffectiveness, the Group will enter into a new hedge relationship to mitigate risk on a continuous basis.
The Group actively uses collateral to reduce its credit risks.
(d) Excessive risk concentration
Concentrations arise when a number of counterparties are engaged in similar business activities, or activities in the same geographic region, or have similar economic, political or other conditions. Concentrations indicate the relative sensitivity of the Group’s performance to develop-ments affecting a particular industry or geographical location.
In order to avoid excessive concentrations of risk, the Group’s policies and procedures include specific guidelines to focus on maintaining a diversified portfolio. Identified concentrations of credit risks are controlled and managed accordingly.

notes to the consolidated financial statements 134(continued)
29.1 credit risk
(a) The Group takes on exposure to credit risk, which is the risk that a counterparty will cause a financial loss by failing to discharge an obligation. Credit risk is the most important risk for the Group’s business; Management therefore carefully manages its exposure to credit risk. Credit exposures arise principally in lending activities that lead to loans, and investment activities that bring debt securities and other bills into the Group’s asset portfolio. There is also credit risk in off-balance sheet financial instruments, such as contingent credits, which expose the Group to similar risks to loans and these are mitigated by the same control processes and policies. Likewise, credit risk arising from derivative financial instruments is, at any time, limited to those with positive fair values, as recorded in the consolidated balance sheet.
Impairment provisions are provided for losses that have been incurred at the consolidated balance sheet date. Significant changes in the economy or in the particular situation of an industry segment that represents a concentration in the Group’s portfolio could result in losses that are different from those provided for at the consolidated balance sheet date.
The Group structures the levels of credit risk it undertakes by placing limits on the amount of risk accepted in relation to one borrower or groups of borrowers, and to geographical and industry segments. Such risks are monitored on a revolving basis and subject to a frequent review. Limits in the level of credit risk by product, industry sector and by geographic segment are approved by the Board of Directors.
Exposure to credit risk is managed through regular analysis of the ability of borrowers and potential borrowers to meet interest and principal repayment obligations and by changing these lending limits where appropriate. Some other specific control and mitigation measures are outlined below:
i CollateralThe Group employs a range of policies and practices to mitigate credit risk. The most traditional of these is the taking of security for funds advances, which is common practice. The Group implements guidelines on the acceptability of specific classes of collateral or credit risk mitigation. The principal collateral types for loans and advances are mortgages over residential properties; liens over business assets such as premises, inventory and accounts receivable; liens over financial instruments such as debt securities and equities.
Longer-term finance and lending to corporate entities are generally secured; revolving individual credit facilities are generally unsecured. In ad-dition, in order to minimize credit loss the Group will seek additional collateral from the counterparty as soon as impairment indicators arise.
Collateral held as security for financial assets other than loans is determined by the nature of the instrument. Debt securities, treasury and other eligible bills are generally unsecured, with the exception of asset-backed securities and similar instruments, which are secured by port-folios of financial instruments.
Management monitors the market value of collateral, requests additional collateral in accordance with the underlying agreement, and moni-tors the market value of collateral obtained during its review of the adequacy of the allowance for impairment losses. It is the Group’s policy to dispose of repossessed properties in an orderly manner. The proceeds are used to reduce or repay the outstanding claim. In general, the Group does not use repossessed properties for its business own. ii DerivativesThe Group maintains strict control limits on net open derivative positions (i.e., the difference between purchase and sale contracts), by both amount and term. The amount subject to credit risk is limited to the current fair value of instruments that are favorable to the Group (i.e., an asset when fair value is positive), which in relation to derivatives is only a small fraction of the contract, or notional values used to express the volume of instruments outstanding. This credit risk exposure is managed as part of the overall lending limits with customers, together with potential exposures from market movements. Collateral or other security is not usually obtained for credit risk exposures on these instru-ments.

a world in motion135
Settlement risk arises in any situation where a payment in cash, securities or equities is made in the expectation of a corresponding receipt in cash, securities or equities. Daily settlement limits are established for each counterparty to cover the aggregate of all settlement risk arising from the Group’s market transactions on any single day.
iii Credit-related commitmentsThe primary purpose of these instruments is to ensure that funds are available to a customer as required. Guarantees and standby letters of credit have the same credit risk as loans. Documentary and commercial letters of credit - which are written undertakings by the Group on behalf of a customer authorizing a third party to draw drafts on the Group up to a stipulated amount under specific terms and conditions - are collateralized by the underlying shipments of goods to which they relate and therefore have less risk than a direct loan. The Group has no mandatory commitments to extend credit.
In order to manage credit risk, as part of the Risk Management Department of the Group, see note 29(a), there is a Risk Management Service Unit whose major functions are implementing methodologies and statistical models for measuring credit risk exposures, developing and applying methodologies for the calculation of risk-ratings, both at the corporate and business unit levels, performing analysis of credit concentrations, verifying that credit exposures are within the established limits and suggesting global risk exposures by economic sector, time term, among others.
Also, a Risk Assessment Committee has been established comprising 3 directors, the Chief Executive Officer, the Chief Financial Officer, the Deputy Chief Executive Officer and the Risk Management Department Manager. Each of the financial indicators prepared by the Risk Manage-ment Service Unit are analyzed by this committee on a quarterly basis to subsequently evaluate the policies, procedures and limits currently effective at the Group to ensure that an efficient and effective risk management is always in place. At the same time, the Group has a Credit Division, which establishes the overall credit policies for each and all the businesses in which the Group decides to take part. These policies are set forth based on the guidelines established by the Board of Directors and keeping in mind the statutory financial laws and regulations. The main activities of this function are to establish the client credit standards and guidelines (evalu-ation, authorization and control), to follow the guidelines established by the Board of Directors and General Management as well as those established by governmental regulatory bodies, to review and authorize credit applications, up to the limit within the scope of its responsibili-ties and to submit to upper hierarchies those credit applications exceeding the established limits, to monitor credit-granting activities within the different autonomous bodies, among others.
(b) The maximum exposure to credit risk as of December 31, 2008 and 2007, before the effect of mitigation through any collateral, is the book value of each class of financial assets mentioned in note 29.7 and the contingent credits detailed in note 19(a).
Management is confident in its ability to continue to control and sustain minimal exposure of credit risk to the Group resulting from both its loan portfolio and investments based on the following:
- 98 percent of the loans portfolio is categorized in the top two grades of the internal rating system as of December 31, 2008 (97 percent as of December 31, 2007);
- 95 percent of the loan portfolio is considered to be neither past due nor impaired as of December 31, 2008 (94 percent as of December 31, 2007);
- 83 percent of the investments have at least investment grade credit rating (BBB- or higher) or are debt securities issued by Banco Central de Reserva del Peru - BCRP (not rated) as of December 31, 2008 (75 percent as of December 31, 2007); and
- 17 percent and 52 percent of the cash and due from banks represent amounts deposited in the Group’s vaults and in the BCRP (including overnight operations), respectively, as of December 31, 2008 (18 percent and 59 percent, respectively, as of December 31, 2007).

notes to the consolidated financial statements 136(continued)
(c) Credit risk management for loans
Credicorp classifies its loan portfolio into one of five risk categories, depending upon the degree of risk of non-payment of each debtor. The grades used by Credicorp are: (i) normal, (ii) potential problems, (iii) substandard, (iv) doubtful and (v) loss, and have the following characteristics:
Normal (Class A): Debtors of commercial loans that fall into this category have complied on a timely basis with their obligations and at the time of evaluation do not present any reason for doubt with respect to repayment of interest and principal on the agreed dates, and there is no reason to believe that the status will change before the next evaluation. To place a loan in Class A, a clear understanding of the use to be made of the funds and the origin of the cash flows to be used by the debtor to repay the loan is required. Consumer loans warrant Class A classification if payments are current or up to eight days past-due. Residential mortgage loans warrant Class A classification if payments are current or up to thirty days past-due.
Potential problems (Class B): Debtors of commercial loans included in this category are those that at the time of the evaluation demonstrate certain deficiencies, which, if not corrected on a timely manner, imply risks with respect to the recovery of the loan. Certain common charac-teristics of loans or credits in the category include: delays in loan payments which are promptly covered, a general lack of information required to analyze the credit, out-of-date financial information, temporary economic or financial imbalances on the part of the debtor which could affect its ability to repay the loan, market conditions that could affect the economic sector in which the debtor is active, material overdue debts or pending judicial collection actions initiated by other financial institutions, noncompliance with originally contracted conditions, conflicts of interest within the client, labor problems; unfavorable credit history, noncompliance with its own internal policies of concentration of suppliers or customers, and low inventory turnover ratios or large inventories that are subject to competitive challenges or technological obsolescence. Consumer loans are categorized as Class B if payments are between 9 and 30 days late. Residential mortgage loans become Class B when payments are between 31 and 90 days late.
Substandard (Class C): Debtors of commercial loans included in this category demonstrate serious financial weakness, often with operating results or available income insufficient to cover financial obligations on agreed upon terms, with no reasonable short-term prospects for a strengthening of their financial capacity. Debtors demonstrating the same deficiencies that warrant classification as category B warrant classifi-cation as Class C if those deficiencies are such that if they are not corrected in the near term, they could impede the recovery of principal and interest on the loan on the originally agreed terms. In addition, commercial loans are classified in this category when payments are between 61 and 120 days late. If payments on a consumer loan are between 31 and 60 days late, such loans are classified as Class C. Residential mortgage loans are classified as Class C when payments are between 91 and 120 days late.
Doubtful (Class D): Debtors of commercial loans included in this category present characteristics that make doubtful the recovery of the loan. Although the loan recovery is doubtful, if there is a reasonable possibility that in the near future the creditworthiness of the debtor might improve, a Class D categorization is appropriate. These credits are distinguished from Class E credits by the requirement that the debtor remain in operation, generate cash flow, and make payments on the loan, albeit at a rate less than that specified in its contractual obliga-tions. In addition, commercial loans are classified in this category when payments are between 121 and 365 days late. Consumer loans are categorized as Class D if payments are between 61 and 120 days late. Residential mortgage loans are Class D when payments are between 121 and 365 days late.
Loss credits (Class E): Commercial loans or credits which are considered unrecoverable or which for any other reason should not appear on Group’s books as an asset based on the originally contracted terms fall into this category. In addition, commercial loans are classified in this category when payments are more than 365 days late. Consumer loans are categorized as Class E if payments are more than 120 days late. Residential mortgage loans are Class E when payments are more than 365 days late.
The Group reviews its loan portfolio on a continuing basis in order to assess the completion and accuracy of its grades.

a world in motion137
All loans considered impaired (the ones classified as substandard, doubtful and loss) are analyzed by the Group’s Management, which ad-dresses impairment in two areas: individually assessed allowances and collectively assessed allowances, as follows:
- Individually assessed allowance The Group determines the allowances appropriate for each individually significant loan or advance on an individual basis. Items considered when determining allowance amounts include the sustainability of the counterparty’s business plan, its ability to improve performance once a financial difficulty has arisen, projected receipts and the expected dividend payout should bankruptcy ensue, the availability of other financial support and the realizable value of collateral, and the timing of the expected cash flows. Impairment losses are evaluated at each reporting date, unless unforeseen circumstances require more careful attention.
The methodology and assumptions used for estimating future cash flows are reviewed regularly by the Group in order to reduce any differ-ences between loss estimates and actual loss experience.
- Collectively assessed allowance Allowances are assessed collectively for losses on loans and advances that are not individually significant (including consumer and residential mortgages) and for individually significant loans and advances where there is not yet objective evidence of individual impairment (included in categories A and B). Allowances are evaluated on each reporting date with each portfolio receiving a separate review.
The collective assessment takes account of impairment that is likely to be present in the portfolio even though there is not yet objective evidence of the impairment in an individual assessment. Impairment losses are estimated by taking into consideration of the following infor-mation: historical losses on the portfolio, current economic conditions, the approximate delay between the time a loss is likely to have been incurred and the time it will be identified as requiring an individually assessed impairment allowance, and expected receipts and recoveries once impaired. Local management is responsible for deciding the length of this period which can extend for as long as one year. The impair-ment allowance is then reviewed by credit management to ensure alignment with the Group’s overall policy.
Financial guarantees and letter of credit are assessed and provision made in similar manners as for loans.
In the case of borrowers in countries where there is an increased risk of difficulties in servicing external debt, an assessment of the political and economic situation is made, and an additional country risk provisions provided.
When a loan is uncollectible, it is written off against the related provision for loan impairment. Such loans are written off after all the necessary procedures have been completed and the amount of the loss has been determined. Subsequent recoveries of amounts previously written off decrease the amount of the provision for loan impairment in the consolidated income statements.

notes to the consolidated financial statements 138(continued)
The following is a summary of the direct loans classified in three major groups: i) Loans neither past due nor impaired, comprising those direct loans having presently no delinquency characteristics and related to clients ranked as normal and potential problems; ii) Past due but not impaired loans comprising past due loans of clients classified as normal or with potential problems and iii) Impaired loans, or those past due loans of clients classified as substandard, doubtful and loss; presented net of the provision for loan losses for each of the loan grades:
As of December 31, 2008
Commercial loans
Residential mortgage loans Consumer loans Total %
US$(000) US$(000) US$(000) US$(000)
Neither past due nor impaired
Normal
Potential problem
7,526,355
214,040
1,350,793
18,348
1,020,352
8,932
9,897,500
241,320
94
2
Past due but not impaired
Normal
Potential problem
186,887
14,231
83,757
387
78,629
1,027
349,273
15,645
3
-
Impaired
Substandard
Doubtful
Loss
41,570
46,309
29,193
11,337
12,630
7,962
18,982
21,146
13,331
71,889
80,085
50,486
1
1
1
Gross 8,058,585 1,485,214 1,162,399 10,706,198 102
Less: Allowance for loan losses 137,444 30,832 56,061 224,337 2
Total, net 7,921,141 1,454,382 1,106,338 10,481,861 100
As of December 31, 2007
Commercial loans
Residential mortgage loans Consumer loans Total %
US$(000) US$(000) US$(000) US$(000)
Neither past due nor impaired
Normal
Potential problem
5,517,220
347,186
1,138,912
13,781
779,866
7,463
7,435,998
368,430
91
5
Past due but not impaired
Normal
Potential problem
204,766
5,410
70,738
318
52,379
134
327,883
5,862
4
-
Impaired
Substandard
Doubtful
Loss
49,535
61,578
36,483
10,097
12,552
7,437
11,733
14,586
8,643
71,365
88,716
52,563
1
1
1
Gross 6,222,178 1,253,835 874,804 8,350,817 103
Less: Allowance for loan losses 166,203 14,454 30,662 211,319 3
Total, net 6,055,975 1,239,381 844,142 8,139,498 100

a world in motion139
As of December 31, 2008 and 2007, loans that are neither past-due nor impaired whose terms have been renegotiated amounts to US$10.3 and US$19.7 million, respectively.
As of December 31, 2008 and 2007, loans amounting to approximately US$349.3 and US$327.9 million, respectively, were not impaired and were past due for less than 30 days. The break down of the gross amount of impaired loans by class, along with the fair value of related collateral and the amounts of their allow-ance for loan losses, is as follows:
(d) Credit risk management on investments in trading securities and available-for-sale
The Group evaluates the credit risk identified of each of the financial instruments in these categories, stating the risk rating granted to them by a risk rating agency. For investments traded in Peru, the risk ratings use are those provided by Apoyo & Asociados Internacionales S.A.C. (a Peruvian rating agency authorized by the Peruvian government regulator and associated to Fitch Rating) and for investments traded abroad, the risk-ratings used are those provided by Standard & Poors. In the event any subsidiary use a risk-rating prepared by any other risk rating agency, such risk-ratings are standardized with those provided by the afore-mentioned institutions for consolidation purposes
As of December 31, 2008
Commercial loans
Residential mortgage loans Consumer loans Total
US$(000) US$(000) US$(000) US$(000)
Impaired loans 117,072 31,929 53,459 202,460
Fair value of collateral 49,254 18,742 4,386 72,382
Allowance for loan losses 50,782 11,395 29,722 91,899
As of December 31, 2007
Commercial loans
Residential mortgage loans Consumer loans Total
US$(000) US$(000) US$(000) US$(000)
Impaired loans 147,596 30,086 34,962 212,644
Fair value of collateral 59,957 19,863 3,914 83,734
Allowance for loan losses 72,793 6,238 20,173 99,204

notes to the consolidated financial statements 140(continued)
The following table shows the analysis of the risk-rating of available-for-sale investments, provided by the institutions referred to above. These financial instruments are mostly concentrated on the first risk ratings or are debt securities issued by Banco Central de Reserva del Peru – BCRP (not rated), as a way to reduce their impact on the consolidated financial statements of any eventual substantial loss that may arise from the impairment of the credit and general position of issuers. The exposure composition is as follows:
(*) As of December 31, 2008, includes principally US$2,208.9 million, US$217.6 million and US$131.3 million of debt securities issued by BCRP, listed and non-listed equity securities and mutual funds, respectively (US$2,407.0 million, US$321.1 million and US$198.4 million as of December 31, 2007, respectively).
As of December 31, 2008 and 2007, most of held for trading investments were financial instruments issued by the BCRP or had an invest-ment grade rating.
The following table presents the summary of the various techniques used by the Group to measure the Investments available-for-sale recog-nized at fair value in percentage:
As of December 31, 2008 As of December 31, 2007
US$(000) % US$(000) %
Instruments rated in PeruAAAAA- to AA+A to A+BBB- to BBBBB- to BB+Lower than B-Unrated (*)
426,65336,48618,346
-1,858
-2,466,772
8.60.80.4
---
49.7
285,66135,94313,306
2,0182,214
-2,854,295
5.50.70.3
---
54.6
2,950,115 59.5 3,193,437 61.1
Instruments rated abroadAAAAA- to AA+A to A+BBB- to BBB+BB- to BB+Lower than B-Unrated (*)
105,249128,714410,118785,250325,86120,394
233,367
2.12.68.3
15.86.60.44.7
242,428132,907234,455584,549539,81622,740
278,309
4.62.54.5
11.210.40.45.3
2,008,953 40.5 2,035,204 38.9
Total 4,959,068 100.0 5,228,641 100.0
2008 2007
% %
Quoted Market PriceValuation Techniques - market observable inputsValuation Techniques - non-market observable inputs
40.058.81.2
39.458.62.0
Total 100.0 100.0

a world in motion141
(e) Concentration of financial instruments exposed to credit risk:
As of December 31, 2008 and 2007, the financial instruments with exposure to the credit risk were distributed by the following economic sectors:
2008 2007
Designated at fair value through profit or loss
Designated at fair value through profit or loss
Held for trading
At incep-tion
Loans and
receiv-ables
Invest-ments avail-
able-for-sale Total
Held for trading
At incep-tion
Loans and
receiv-ables
Invest-ments avail-
able-for-sale Total
US$(000) US$(000) US$(000) US$(000) US$(000) US$(000) US$(000) US$(000) US$(000) US$(000)
Financial services
Public administration and defense
Manufacturing
Commerce
Mortgage loans
Consumer loans
Electricity, gas and water
Communications, storage and transportation
Mining
Leaseholds and real estate activities
Micro-business loans
Community services
Construction
Agriculture
Education, health and other services
Fishing
Insurance activities
Other
101,126
13,466
44
5
-
-
523
-
130
-
-
-
-
-
-
2
-
63
129,631
-
-
-
-
-
-
-
-
-
-
-
-
-
-
-
-
-
3,897,748
273,506
2,536,277
1,484,431
1,401,296
1,126,301
556,937
632,895
660,855
608,651
619,680
247,144
236,163
224,417
127,670
80,277
27,430
103,284
3,245,159
932,227
156,925
64,595
-
-
203,595
117,103
78,416
47,321
-
-
2,283
7,761
29,699
159
-
73,825
7,373,664
1,219,199
2,693,246
1,549,031
1,401,296
1,126,301
761,055
749,998
739,401
655,972
619,680
247,144
238,446
232,178
157,369
80,438
27,430
177,172
49,901
22,161
2,710
520
-
-
9,802
-
11,737
-
-
-
-
-
-
-
-
7
213,153
-
-
-
-
-
-
-
-
-
-
-
-
-
-
-
-
-
3,303,821
73,533
2,134,497
861,701
1,079,955
833,505
330,480
387,911
448,570
373,659
474,968
239,947
197,257
172,817
102,456
131,483
122,667
233,500
3,569,312
746,634
199,874
62,011
-
-
207,014
97,945
138,578
159,063
-
-
3,914
5,550
4,514
-
-
34,232
7,136,187
842,328
2,337,081
924,232
1,079,955
833,505
547,296
485,856
598,885
532,722
474,968
239,947
201,171
178,367
106,970
131,483
122,667
267,739
Total 115,359 129,631 14,844,962 4,959,068 20,049,020 96,838 213,153 11,502,727 5,228,641 17,041,359

notes to the consolidated financial statements 142(continued)
As of December 31, 2008 and 2007, the financial instruments with exposure to credit risk were distributed by the following geographi-cal areas:
29.2 market risk
The Group takes on exposure to market risks, which is the risk that the fair value or future cash flows of a financial instrument will fluctuate because of changes in market prices. Market risks arise from open positions in interest rates, currency, commodities and equity products; all of which are exposed to general and specific market movements and changes in the level of volatility of prices such as interest rates, credit spreads, foreign exchange rates and equity prices. Due to the nature of the Group’s current activities, commodity price risk is not ap-plicable.
The Group separates exposures to market risk into two groups: (i) those that arise from value fluctuation of trading portfolios due to move-ments of market rates or prices (Trading Book) and (ii) those that arise from changes in the structural positions of non-trading portfolios due to movements of the interest rates, prices and foreign exchange ratios (ALM Book).
2008
Designated at fair value through profit or loss
Held for trading At inceptionLoans and
receivablesInvestments
available-for-sale Total
US$(000) US$(000) US$(000) US$(000) US$(000)
Peru
United States of America
Bolivia
Europe
Chile
Colombia
Other
113,015
109
2,224
-
-
-
11
-
129,631
-
-
-
-
-
12,565,873
871,859
566,170
307,533
115,883
101,173
316,471
3,571,213
681,184
309,530
84,445
90,587
72,178
149,931
16,250,101
1,682,783
877,924
391,978
206,470
173,351
466,413
Total 115,359 129,631 14,844,962 4,959,068 20,049,020
2007
Designated at fair value through profit or loss
Held for trading At inceptionLoans and
receivablesInvestments
available-for-sale Total
US$(000) US$(000) US$(000) US$(000) US$(000)
Peru
United States of America
Bolivia
Europe
Colombia
Chile
Other
70,189
49
3,683
13,690
-
-
9,227
-
213,153
-
-
-
-
-
10,048,500
591,202
578,436
93,141
59,471
5,178
126,799
3,693,246
889,421
192,896
58,477
89,363
124,557
180,681
13,811,935
1,693,825
775,015
165,308
148,834
129,735
316,707
Total 96,838 213,153 11,502,727 5,228,641 17,041,359

a world in motion143
Trading portfolios include those liquid positions arising from market-making transactions where the Group acts as principal with clients or with the market. Non-trading portfolios consist of relatively illiquid positions, mainly banking assets and liabilities (deposits and loans) and non-trading investments (available-for-sale).
The risks that trading portfolios face are managed through VaR historical simulation techniques; while non-trading portfolios are managed using Asset Liability Management (ALM).
(a) Trading Book
The trading book is made up of liquid investment instruments. The trading book is characterized for having liquid positions in equities, bonds, foreign currencies and derivatives. Some limits have been set in order to control and monitor the risks undertaken. These risks arise from the size of the positions and/or from the volatility of the risk factors embedded in each financial instrument. Regular reports are prepared for the Risk Management Committees and top management. The major measurement technique used to measure and control market risk is Value at Risk (VaR).
The Group applies VaR to its trading portfolios to estimate the market risk of positions held and the maximum losses that are expected, based upon a number of assumptions for various changes in market conditions. The Risk Management Committee set limits on the level of risk that may be accepted and review of daily.
VaR is a statistically-based estimate of the potential loss on the current portfolio from adverse market movements. It expresses the “maxi-mum” amount the Group might lose, but only to a certain level of confidence (99 percent). There is therefore a specified statistical probability (1 percent) that actual loss could be greater than the VaR estimate. The VaR model assumes a certain “holding period” until positions can be closed (1 day - 10 days). The time horizon used to calculate VaR is one day; however, the one-day VAR is amplified to a 10-day time frame and calculated multiplying the one-day VaR times the square root of 10 - results are presented in the tables below. The assessment of past movements has been based on historical one-year data. The Group applies these historical changes in rates directly to its current positions (a method known as historical simulation).
The use of this approach does not prevent losses outside of these limits in the event of more significant market movements.
As of December 31, 2008 and 2007, the Group’s VaR by type of asset was as follows:
2008 2007
US$(000) US$(000)
Equity securitiesMutual fundsFixed incomeDerivativesConsolidated VaR by type of asset
551,0341,116
-1,604
5,211-
567626
5,261

notes to the consolidated financial statements 144(continued)
As of December 31, 2008 and 2007, the Group’s VaR by risk type is as follows:
(b) ALM Book The management of the risks associated with long-term and structural positions is called Asset and Liability Management (ALM). Non-trading portfolios which comprise the ALM Book are exposed to different sensitivities that can bring about a deterioration in the value of the assets compared to its liabilities and hence to a reduction of its net worth.
i Interest riskInterest rate risk arises from the possibility that changes in interest rates will affect future cash flows or the fair values of financial instruments. Cash flow interest rate risk is the risk that the future cash flows of a financial instrument will fluctuate because of changes in market interest rates. Fair value interest rate risk is the risk that the value of a financial instrument will fluctuate because of changes in market interest rates. The Group takes on exposure to the effects of fluctuations in the prevailing levels of market interest rates on both its fair value and cash flow risks. Interest margins may increase as a result of such changes but may also decrease in the event that unexpected movements arise. The Board sets limits on the level of mismatch of interest rate re-pricing that may be undertaken, which is monitored daily by Treasury Department.
Re-pricing gap Gap analysis comprises aggregating re-pricing timeframes into buckets and checking if each bucket nets to zero. Different bucketing schemes might be used. An interest rate gap is simply a positive or negative net re-pricing timeframe for one of the buckets.
2008 2007
US$(000) US$(000)
Foreign exchange riskInterest rate riskEquity risk Consolidated VaR by risk type
5791,063
8501,604
133514
4,8795,261

a world in motion145
The table below summarizes the Group’s exposure to interest rate risks. It includes the Group’s financial instruments at carrying amounts, categorized by the earlier of contractual re-pricing or maturity dates:
As of December 31, 2008
Up to 1 month
1 to 3 months
3 to 12 months
1 to 5 years
More than 5
years
Non-interest bearing Total
US$(000) US$(000) US$(000) US$(000) US$(000) US$(000) US$(000)
Assets
Cash and due from banks
Investments
Loans
Assets designated at fair value through profit or loss
Premiums and other policies receivables
Accounts receivable from reinsurers and coinsurers
Other assets
2,455,413
818,153
2,038,457
-
-
-
-
196,588
1,208,593
2,412,234
-
-
-
-
46,536
989,125
2,274,854
-
-
-
-
10,218
543,549
2,992,480
-
-
-
-
-
1,141,155
604,016
-
-
-
-
1,057,416
294,577
-
129,631
111,561
165,144
1,331,369
3,766,171
4,995,152
10,322,041
129,631
111,561
165,144
1,331,369
Total assets 5,312,023 3,817,415 3,310,515 3,546,247 1,745,171 3,089,698 20,821,069
Liabilities
Deposits and obligations
Due to banks and correspondents
Accounts payable to reinsurers and coinsurers
Technical, insurance claims reserves and reserves for unearned premiums
Borrowed funds
Bonds and subordinated notes issued
Other liabilities
Equity
4,114,430
178,539 -
31,254
1,008,997
817
-
-
3,268,610
745,155
-
19,357
2,474
-
-
-
2,991,905
197,935
-
86,935
11,762
63,208
-
-
321,984
11,705
-
148,437
81,871
284,577
-
-
39,979
32,544
-
331,697
45,612
428,788
-
-
3,213,529
14,113
55,841
350,090
-
7,840
934,979
1,796,105
13,950,437
1,179,991
55,841
967,770
1,150,716
785,230
934,979
1,796,105
Total liabilities and equity 5,334,037 4,035,596 3,351,745 848,574 878,620 6,372,497 20,821,069
Off-Balance sheet items
Derivatives assets
Derivatives liabilities
2,444,863
1,582,377
1,267,306
770,950
577,445
816,213
458,944
1,438,652
286,646
427,012
-
-
5,035,204
5,035,204
862,486 496,356 (238,768) (979,708) (140,366) - -
Marginal gap 840,472 278,175 (279,998) 1,717,965 726,185 (3,282,799) -
Accumulated gap 840,472 1,118,647 838,649 2,556,614 3,282,799 - -

notes to the consolidated financial statements 146(continued)
As of December 31, 2007
Up to 1 month
1 to 3 months
3 to 12 months
1 to 5 years
More than 5
years
Non-interest bearing Total
US$(000) US$(000) US$(000) US$(000) US$(000) US$(000) US$(000)
Assets
Cash and due from banks
Investments
Loans
Assets designated at fair value through profit or loss
Premiums and other policies receivables
Accounts receivable from reinsurers and coinsurers
Other assets
2,331,637
567,613
2,078,657
-
-
-
-
31,074
680,272
2,294,056
-
-
-
-
48,172
1,974,368
1,499,311
50,561
-
-
-
42,045
837,269
2,051,629
-
-
-
-
19
842,317
115,847
-
-
-
-
620,918
377,797
-
162,592
85,495
116,141
898,108
3,073,865
5,279,636
8,039,500
213,153
85,495
116,141
898,108
Total assets 4,977,907 3,005,402 3,572,412 2,930,943 958,183 2,261,051 17,705,898
Liabilities
Deposits and obligations
Due to banks and correspondents
Financial liabilities designated at fair value through profit or loss
Accounts payable to reinsurers and coinsurers
Technical, insurance claims reserves and reserves for unearned premiums
Borrowed funds
Bonds and subordinated notes issued
Other liabilities
Equity
3,358,599
484,560
-
-
1,626
-
101,521
-
-
3,089,841
437,345
-
-
4,878
870,404
34,520
-
-
1,709,965
303,506
50,561
-
14,634
-
54,546
8,275
-
263,913
198,357
-
-
95,017
-
176,924
-
-
2,088
21,296
-
-
305,039
-
328,147
-
-
2,926,308
8,197
-
33,963
382,284
-
6,640
617,671
1,815,273
11,350,714
1,453,261
50,561
33,963
803,478
870,404
702,298
625,946
1,815,273
Total liabilities and equity 3,946,306 4,436,988 2,141,487 734,211 656,570 5,790,336 17,705,898
Off-Balance sheet items
Derivatives assets
Derivatives liabilities
1,746,686
967,415
724,850
617,771
719,635
801,599
349,552
806,626
116,269
463,581
-
-
3,656,992
3,656,992
779,271 107,079 (81,964) (457,074) (347,312) - -
Marginal gap 1,810,872 (1,324,507) 1,348,961 1,739,658 (45,699) (3,529,285) -
Accumulated gap 1,810,872 486,365 1,835,326 3,574,984 3,529,285 - -

a world in motion147
Sensitivity to changes in interest rates The following table presents the sensitivity to a reasonable possible change in interest rates, with all other variables held constant, of the Group’s consolidated income statement and consolidated statements of change in equity; before income tax and minority interest.
The sensitivity of the consolidated income statement is the effect of the assumed changes in interest rates on the net interest income for one year before income tax and minority interest, based on the floating rate non-trading financial assets and financial liabilities held at December 31, 2008 and 2007, including the effect of derivatives instruments. The sensitivity of equity is calculated by revaluing fixed rate available-for-sale financial assets, before income tax and minority interest, including the effect of any associated hedges, and derivatives instruments designated as cash flow hedges, as of December 31, 2008 and 2007 for the effects of the assumed changes in interest rates:
The interest rate sensitivities set out in the table above are illustrative only and are based on simplified scenarios. The figures represent the effect of the pro-forma movements in the net interest income based on the projected yield curve scenarios and the Group’s current interest rate risk profile. This effect, however, does not incorporate actions that would be taken by management to mitigate the impact of this interest rate risk. In addition, the Group seeks proactively to change the interest rate risk profile to minimize losses and optimize net revenues. The projections above also assume that interest rate of all maturities move by the same amount and, therefore, do not reflect the potential impact on net interest income of some rates changing while others remain unchanged. The projections make other simplifying assumptions too, including that all positions run to maturity.
As of December 31, 2008
Currency Changes in basis points Sensitivity of net income Sensitivity of Equity
US$(000) US$(000)
U.S. Dollar
U.S. Dollar
U.S. Dollar
U.S. Dollar
Peruvian Currency
Peruvian Currency
Peruvian Currency
Peruvian Currency
+/-
+/-
+/-
+/-
+/-
+/-
+/-
+/-
50
100
200
300
50
100
200
300
+/-
+/-
+/-
+/-
-/+
-/+
-/+
-/+
6,842
13,684
27,368
41,052
12,227
24,454
48,908
73,362
-/+
-/+
-/+
-/+
-/+
-/+
-/+
-/+
16,709
33,417
66,834
100,251
16,791
33,581
67,162
100,743
As of December 31, 2007
Currency Changes in basis points Sensitivity of net income Sensitivity of Equity
US$(000) US$(000)
U.S. Dollar
U.S. Dollar
U.S. Dollar
U.S. Dollar
Peruvian Currency
Peruvian Currency
Peruvian Currency
Peruvian Currency
+/-
+/-
+/-
+/-
+/-
+/-
+/-
+/-
50
100
200
300
50
100
200
300
+/-
+/-
+/-
+/-
-/+
-/+
-/+
-/+
7,652
15,305
30,609
45,914
4,335
8,670
17,340
26,010
-/+
-/+
-/+
-/+
-/+
-/+
-/+
-/+
20,204
40,408
80,816
121,224
20,705
41,409
82,818
124,227

notes to the consolidated financial statements 148(continued)
Available-for-sale equity securities and mutual funds are not considered as part of the investment securities for sensitivity calculation purposes; however, a 10, 30 and 50 percent for equity and 10, 20 and 30 percent for mutual funds changes in market prices is conducted to these price-sensitivity securities and the expected unrealized gain or loss, before income tax, is presented below:
ii Foreign exchange risk The Group is exposed to foreign currency exchange rates on its financial position and cash flows. Management sets limits on the level of exposure by currency and in total for both overnight and intra-day positions, which are monitored daily.
Market price sensitivity Changes in market prices As of December 31, 2008 As of December 31, 2007
% US$(000) US$(000)
Equity securities
Equity securities
Equity securities
Mutual funds
Mutual funds
Mutual funds
+/-
+/-
+/-
+/-
+/-
+/-
10
30
50
10
20
30
+/-
+/-
+/-
+/-
+/-
+/-
21,762
65,285
108,809
13,132
26,264
39,397
+/-
+/-
+/-
+/-
+/-
+/-
32,112
96,335
160,559
19,841
39,681
59,522

a world in motion149
Foreign currency transactions are made at the free market exchange rates of the countries where Credicorp’s Subsidiaries are established. As of December 31, 2008 and 2007, the Group’s assets and liabilities by currencies were as follows:
The Group manages foreign exchange risk by monitoring and controlling the position values due to changes in exchange rates. The Group measures its performance in U.S. Dollar, so if the net foreign exchange position (e.g. Peruvian currency) is an asset, any depreciation of the U.S. Dollar with respect to this currency would affect Group’s consolidated balance sheet positively. The current position in a foreign currency comprises exchange rate-linked assets and liabilities in that currency. An institution’s open position in individual currencies com-prises assets, liabilities and off-balance sheet items denominated in the respective foreign currency for which the institution itself bears the risk; any appreciation/depreciation of the foreign exchange would affect the consolidated income statement.
The Group’s net foreign exchange balance is the sum of its positive open non-U.S. Dollar positions (net long position) less the sum of its negative open non-U.S. Dollar positions (net short position); and any devaluation/revaluation of the foreign exchange position would affect the consolidated income statement. A currency mismatch would leave Group’s consolidated balance sheet vulnerable to a fluctuation of the foreign currency (exchange rate shock).
2008 2007
U.S. Dollars
Peruvian currency
Othercurren-
cies TotalU.S.
DollarsPeruvian currency
Othercurren-
cies Total
US$(000) US$(000) US$(000) US$(000) US$(000) US$(000) US$(000) US$(000)
Monetary assetsCash and due from banksTrading securitiesAvailable-for-sale investmentsLoans, netFinancial assets designated to fair value through profit or lossOther assets
3,156,27923,220
2,897,6586,930,125
129,631594,107
495,55011,523
1,736,1603,298,579
-255,476
114,3421,341
325,25093,337
-12,383
3,766,17136,084
4,959,06810,322,041
129,631861,966
2,644,85838,647
1,934,6725,555,864
213,153261,102
311,82811,463
3,129,3512,450,297
-299,695
117,179885
164,61833,339
-9,745
3,073,86550,995
5,228,6418,039,500
213,153570,542
13,731,020 5,797,288 546,653 20,074,961 10,648,296 6,202,634 325,766 17,176,696
Monetary liabilitiesDeposits and obligationsDue to bank and correspondents and borrowed fundsFinancial liabilities designated at fair value through profits or lossBonds and subordinated notes issuedOther liabilities
(8,614,042)(2,189,114)
-(311,860)
(1,425,817)
(4,963,932)(140,155)
-(473,370)(508,063)
(372,463)(1,438)
--
(24,710)
(13,950,437)(2,330,707)
-(785,230)
(1,958,590)
(7,173,362)(2,071,882)
(50,561)(329,567)
(1,040,178)
(3,892,138)(248,362)
-(372,731)(434,353)
(285,214)(3,421)
--
11,144
(11,350,714)(2,323,665)
(50,561)(702,298)
(1,463,387)
(12,540,833) (6,085,520) (398,611) (19,024,964) (10,665,550) (4,947,584) (277,491) (15,890,625)
1,190,187 (288,232) 148,042 1,049,997 (17,254) 1,255,050 48,275 1,286,071
Forwards position, net (627,600) 591,628 35,972 - 331,117 (273,971) (57,146) -
Currrency swaps position, net 31,458 (31,458) - - 7,227 (7,227) - -
Cross currency swaps position, net and interest rate swaps position, net (277,347) 277,347 - - (50,420) 50,420 - -
Net monetary position 316,698 549,285 184,014 1,049,997 270,670 1,024,272 (8,871) 1,286,071

notes to the consolidated financial statements 150(continued)
The table below shows the sensitivity analysis of the Peruvian Currency, the currency to which the Group had significant exposure as of Dec-ember 31, 2008 and 2007 on its non-trading monetary assets and liabilities and its forecast cash flows. The analysis calculates the effect of a reasonably possible movement of the currency rate against the U.S. Dollar, with all other variables held constant on the consolidated income statement, before income tax. A negative amount in the table reflects a potential net reduction in consolidated income statement, while a positive amount reflects a net potential increase:
29.3 liquidity risk
Liquidity risk is the risk that the Group is unable to meet its payment obligations associated with its financial liabilities when they fall due and to replace funds when they are withdrawn. The consequence may be the failure to meet obligations to repay depositors, fulfill commitments to lend or meet other operating cash needs.
The Group is exposed to daily calls on its available cash resources from overnight deposits, current accounts, maturing deposits, loans draw-downs, guarantees and other calls. The Group does not maintain cash resources to meet all of these needs, as experience shows that a minimum level of reinvestment of maturing funds can be predicted with a high level of certainty. The Management of the Group’s subsidiaries sets limits on the minimum proportion of funds available to meet such calls and on the minimum level of inter-bank and other borrowing fa-cilities that should be in place to cover withdrawals at unexpected levels of demands. Sources of liquidity are regularly reviewed by a separate team in Group Treasury Department to maintain a wide diversification by currency, geography, provider, product and term.
The matching and controlled mismatching of the maturities and interest rates of assets and liabilities is fundamental to the management of the Group. It is unusual for banks to be completely matched, as transacted business is often based on uncertain terms and of different types. An unmatched position potentially enhances profitability, but also increases the risk of losses.
The maturities of assets and liabilities and the ability to replace, at an acceptable cost, interest-bearing liabilities as they mature are important factors in assessing the liquidity of the Group and its exposure to changes in interest rates and exchange rates.
Liquidity requirements to support calls under guarantees and standby letters of credit are considerably less than the amount of the com-mitment, because the Group does not generally expect the third party to draw funds under the agreement. The total outstanding contractual amount of commitments to extend credit does not necessarily represent future cash requirements, as many of these commitments will expire or terminate without being funded.
A maturity mismatch, long-term illiquid assets against short-term liabilities, exposes a consolidated balance sheet to risks related both to ro-llover and to interest rates. If liquid assets do not cover maturing debts, a balance sheet is vulnerable to a rollover risk. Furthermore, a sharp increase in interest rates can dramatically increase the cost of rolling over short-term liabilities, leading to a rapid increase in debt service. The contractual-maturity gap report is useful in showing liquidity characteristics.
Sensitivity Analysis Change in currency rates 2008 2007
% US$(000) US$(000)
DevaluationPeruvian CurrencyPeruvian Currency
510
(28,910)(61,032)
(51,636)(109,009)
RevaluationPeruvian CurrencyPeruvian Currency
510
26,15649,935
46,71889,189

a world in motion151
The table below presents the cash flows payable by the Group by remaining contractual maturities at the consolidated balance sheets dates. The amounts disclosed in the table are the contractual undiscounted cash flows:
As of December 31, 2008
Up to a month
From 1 to 3 months
From 3 to 12 months
From 1 to 5 years Over 5 years Total
US$(000) US$(000) US$(000) US$(000) US$(000) US$(000)
Deposits and obligations
Financials liabilities designated at fair value through profit and loss
Due to bank and correspondents and Borrowed funds
Accounts payable to reinsurer and coinsurers
Technical, insurance claims reserves and reserves for unearned premiums
Bonds and subordinates notes issued
Other liabilities
4,200,202
-
222,667
16,232
57,470
6,635
122,619
1,573,685
-
262,027
13,663
117,509
5,883
155,032
6,727,731
-
355,464
25,946
280,424
110,975
379,563
1,485,233
-
1,226,162
-
200,023
444,563
90,430
381,475
-
564,212
-
606,096
589,016
60,048
14,368,326
-
2,630,532
55,841
1,261,522
1,157,072
807,692
Total liabilities 4,625,825 2,127,799 7,880,103 3,446,411 2,200,847 20,280,985
As of December 31, 2007
Up to a month
From 1 to 3 months
From 3 to 12 months
From 1 to 5 years Over 5 years Total
US$(000) US$(000) US$(000) US$(000) US$(000) US$(000)
Deposits and obligations
Financials liabilities designated at fair value through profit and loss
Due to bank and correspondents and Borrowed funds
Accounts payable to reinsurer and coinsurers
Technical, insurance claims reserves and reserves for unearned premiums
Bonds and subordinates notes issued
Other liabilities
3,509,461
266
274,279
3,507
77,047
48,867
30,464
1,785,348
534
524,809
10,840
100,991
43,071
23,993
3,914,794
2,448
486,328
14,984
177,197
104,174
367,922
2,602,403
65,063
1,053,649
4,632
160,618
315,911
83,492
298,750
-
529,040
-
558,301
426,688
-
12,110,756
68,311
2,868,105
33,963
1,074,154
938,711
505,871
Total liabilities 3,943,891 2,489,586 5,067,847 4,285,768 1,812,779 17,599,871

notes to the consolidated financial statements 152(continued)
The table below shows the contractual maturity of the Group’s contingent credits at the consolidated balance sheets dates:
The Bank expects that not all of the contingent liabilities or commitments will be drawn before expiry of the commitments.
29.4 operational risk
Operational risk is the risk of loss arising from systems failure, human error, fraud or external events. When controls fail to perform, operational risks can cause damage to reputation, have legal or regulatory implications, or lead to financial loss. The Group cannot expect to eliminate all operational risks, but through a control framework and by monitoring and responding to potential risks, the Group is able to manage the risks. Controls include effective segregation of duties, access, authorization and reconciliation procedures, staff education and assessment processes, including the use of Internal Audit.
29.5 risk of the insurance activity
The principal risk the Group faces under insurance contracts is that the actual claims and benefit payments or the timing thereof, differ from expectations. This is influenced by the frequency of claims, severity of claims, actual benefits paid and subsequent development of long-term claims. Therefore the objective of the Group is to ensure that sufficient reserves are available to cover these liabilities.
The above risk exposure is mitigated by diversification across a large portfolio of insurance contracts and geographical areas. The variability of risks is also improved by careful selection and implementation of underwriting strategy guidelines, as well as the use of reinsurance arrangements.
The Group purchases reinsurance as part of its risks mitigation program. Reinsurance ceded is placed on both a proportional and non-proportional basis. The majority of proportional reinsurance is quota-share reinsurance which is taken out to reduce the overall exposure of the Group to certain classes of business.
Non-proportional reinsurance is primarily excess-of-loss reinsurance designed to mitigate the Group’s net exposure to catastrophe losses. Retention limits for the excess-of-loss reinsurance vary by product line and geographical area.
As of December 31, 2008
Up to a month
From 1 to 3 months
From 3 to 12 months
From 1 to 5 years Over 5 years Total
US$(000) US$(000) US$(000) US$(000) US$(000) US$(000)
Contingent credits 208,248 541,900 705,150 279,693 20,911 1,755,902
As of December 31, 2007
Up to a month
From 1 to 3 months
From 3 to 12 months
From 1 to 5 years Over 5 years Total
US$(000) US$(000) US$(000) US$(000) US$(000) US$(000)
Contingent credits 318,692 253,054 571,702 402,443 18,634 1,564,525

a world in motion153
Amounts recoverable from reinsurers are estimated in a manner consistent with the outstanding claims provision and are in accordance with the reinsurance contracts. Although the Group has reinsurance arrangements, it is not relieved of its direct obligations to its policyholders and thus a credit exposure exists with respect to ceded insurance, to the extent that any reinsurer is unable to meet its obligations assumed under such reinsurance agreements. The Group’s placement of reinsurance is diversified such that it is neither dependent on a single reinsurer nor are the operations of the Group substantially dependent upon any single reinsurance contract.
Life insurance contractsLife insurance contracts offered by the Group include whole life, term assurance, unitised pensions, guaranteed annuity pensions, pure en-dowment pensions and mortgage endowments.
Whole life and term assurance are conventional regular premium products where lump sum benefits are payable on death or permanent disability. Few contracts have a surrender value.
Pensions are contracts where retirement benefits are expressed in the form of an annuity payable at retirement age. If death occurs before retirement, contracts generally return the value of the fund accumulated or premiums.
Guaranteed annuities are single premium products named “Rentas Vitalicias” which pay a specified payment to the policyholder whilst they and/or their spouse are still alive. Payments are generally either fixed or increased each year at a specified rate or at inflation rate.
Death benefits of endowment products are subject to a guaranteed minimum amount. The maturity value usually depends on the invest-ment performance of the underlying assets.
The main risks that the Group is exposed to are as follows:
- Mortality risk – risk of loss arising due to policyholder death experience being different than expected.- Morbidity risk – risk of loss arising due to policyholder health experience being different than expected.- Longevity risk – risk of loss arising due to the annuitant living longer than expected.- Investment return risk – risk of loss arising from actual returns being different than expected.- Expense risk – risk of loss arising from expense experience being different than expected.- Policyholder decision risk – risk of loss arising due to policyholder experiences (lapses and surrenders) being different than expected.
These risks do not vary significantly in relation to the location of the risk insured by the Group, type of risk insured or industry.
The Group’s underwriting strategy is designed to ensure that risks are well diversified in terms of type of risk and level of insured benefits. This is largely achieved through diversification across industry sectors and geography, the use of medical screening in order to ensure that pricing takes account of current health conditions and family medical history, regular review of actual claims experience and product pricing, as well as detailed claims handling procedures. Underwriting limits are in place to enforce appropriate risk selection criteria. For example, the Group has the right not to renew individual policies, it can impose deductibles and it has the right to reject the payment of fraudulent claims. Insurance contracts also entitle the Group to pursue third parties for payment of some or all costs. The Group further enforces a policy of actively managing and prompt pursuing of claims, in order to reduce its exposure to unpredictable future developments that can negatively impact the Group.
For contracts when death or disability is the insured risk, the significant factors that could increase the overall frequency of claims are epidemics, widespread changes in lifestyle and natural disasters, resulting in earlier or more claims than expected. Group wide reinsur-ance limits of US$50,000 on any single life insured and on all high risk individuals insured are in place.

notes to the consolidated financial statements 154(continued)
For annuity contracts, the most significant factor is continuing improvement in medical science and social conditions that would increase longevity.
Management has made a sensitivity analysis of the estimates of the technical reserves, note 14(c).
Non-life insurance contracts (general insurance and healthcare)The Group principally issues the following types of general insurance contracts: motor, household and commercial. Healthcare contracts provide medical expense cover to policyholders. Risks under non-life insurance policies usually covers 12 months.
For general insurance contracts the most significant risks arise from climate changes, natural disasters and other type of damages. For health-care contracts the most significant risks arise from lifestyle changes, epidemics and medical science and technology improvements.
These risks do not vary significantly in relation to the location of the risk insured by the Group, type of risk insured or industry.
The above risks exposures are mitigated by diversification across a large portfolio of insurance contracts. The variability of risk is improved by careful selection and implementation of underwriting strategies, which are designed to ensure that risks are diversified in terms of risks type and level of insured benefits. This is largely achieved through diversification across industry sectors and geography. Further, strict claim review policies to assess all new and ongoing claims, regular detailed review of claims handling procedures and frequent investigation of possible fraudulent claims are all policies and procedures put in place to reduce the Group´s risk exposure. Also, the Group actively manages and promptly pursues claims, in order to reduce its exposure to unpredictable future developments that can negatively impact the Group.
The Group has also limited its exposure by imposing maximum claim amounts on certain contracts as well as the use of reinsurance arrange-ments in order to limit exposure to catastrophic events.
In the following paragraphs the Group has segregated some risk information related to its insurance business, which has been already included in the Group’s consolidated risk information; in order to provide more specific insight about this particular business.
(a) Interest risk of the insurance activity
The following tables show the re-pricing gap of the insurance activity based on the financial statements in accordance with IFRS for invest-ments and Technical, insurance claims reserves and reserves for unearned premiums and after the eliminations for consolidation:
2008
Investments
Technical, insurance claims reserves and
reserves for unearned premiums
US$(000) US$(000)
Up to 1 month1 to 3 months3 to 12 months1 to 5 yearsMore than 5 yearsNon-interest bearing
7,87320,26344,850
112,057558,32863,543
31,25419,35786,935
148,437331,697350,090
Total 806,914 967,770

a world in motion155
The others financial assets and liabilities are related to the balances presented in the consolidated balance sheets and include mainly ac-counts receivable from and payable to reinsurers and premiums and other policies receivables which are non-interest bearing , see also note 29.2 (b)(i).
The following tables demonstrate the sensitivity to a reasonably possible change in interest rates, with all other variables held constant, in consolidated income statement and consolidated equity of the insurance activity, before income tax:
2007
Investments
Technical, insurance claims reserves and
reserves for unearned premiums
US$(000) US$(000)
Up to 1 month1 to 3 months3 to 12 months1 to 5 yearsMore than 5 yearsNon-interest bearing
4,29510,84711,63096,207
513,714159,755
1,6264,878
14,63495,017
305,039382,284
Total 796,448 803,478
As of December 31, 2008
Currency Changes in basis points Sensitivity of net income Sensitivity of Equity
US$(000) US$(000)
U.S. Dollar
U.S. Dollar
U.S. Dollar
U.S. Dollar
Peruvian Currency
Peruvian Currency
Peruvian Currency
Peruvian Currency
+/-
+/-
+/-
+/-
+/-
+/-
+/-
+/-
50
100
200
300
50
100
200
300
-/+
-/+
-/+
-/+
+/-
+/-
+/-
+/-
201
402
805
1,207
58
117
234
351
-/+
-/+
-/+
-/+
-/+
-/+
-/+
-/+
6,734
13,468
26,935
40,403
2,597
5,193
10,386
15,579
As of December 31, 2007
Currency Changes in basis points Sensitivity of net income Sensitivity of Equity
US$(000) US$(000)
U.S. Dollar
U.S. Dollar
U.S. Dollar
U.S. Dollar
Peruvian Currency
Peruvian Currency
Peruvian Currency
Peruvian Currency
+/-
+/-
+/-
+/-
+/-
+/-
+/-
+/-
50
100
200
300
50
100
200
300
-/+
-/+
-/+
-/+
+/-
+/-
+/-
+/-
129
259
517
776
50
101
201
302
-/+
-/+
-/+
-/+
-/+
-/+
-/+
-/+
9,883
19,766
39,532
59,297
1,533
3,066
6,132
9,199

notes to the consolidated financial statements 156(continued)
The interest rate sensitivities set out in the table above are illustrative only and employ simplified scenarios. It should be noted that the ef-fects may not be linear and therefore the results cannot be extrapolated. The sensitivities do not incorporate actions that could be taken by Management to mitigate the effect of the interest rate movements, nor any changes in policyholders´ behaviors.
(b) Foreign exchange risk of the insurance activity
As of December 31, 2008 and 2007, the insurance activity assets and liabilities by currencies after eliminations for consolidation were as follows:
The table below shows the sensitivity analysis of the peruvian currency as of December 31, 2008 and 2007 on the insurance activity non-trading monetary assets and liabilities and its forecasted cash flows. The analysis calculates the effect of a reasonably possible movement of the currency rate against the U.S. Dollar on the consolidated income statement, with all other variables held constant, before income tax. A negative amount in the table reflects a potential net reduction in consolidated income statement, while a positive amount reflects a net potential increase.
2008
U.S. Dollars Peruvian Currency Total
US$(000) US$(000) US$(000)
Monetary assetsMonetary liabilities
876,823(851,685)
358,855(261,271)
1,235,678(1,112,956)
Net monetary position 25,138 97,584 122,722
2007
U.S. Dollars Peruvian Currency Total
US$(000) US$(000) US$(000)
Monetary assetsMonetary liabilities
800,899(636,170)
259,279(211,013)
1,060,178(847,183)
Net monetary position 164,729 48,266 212,995
Sensitivity Analysis
Change in currency rates 2008 2007
% US$(000) US$(000)
DevaluationPeruvian CurrencyPeruvian Currency
510
5,13610,843
(2,540)(5,363)
RevaluationPeruvian CurrencyPeruvian Currency
510
(4,647)(8,871)
2,2984,388

a world in motion157
(c) Liquidity risk of the insurance activity
The Group´s insurance companies are exposed to requirements of cash available, mainly for contracts of insurance claims of short term. The Group holds the available funds for covering its liabilities according to their maturity and estimated unexpected claims.
The Group´s insurance companies control liquidity risk through the exposure of the maturity of their liabilities. Therefore, the investment plan has been structured considering the maturities in order to manage the risk of fund requirements to cover insurance claims and others, in addition to the Group support.
The following table presents the undiscounted cash flows payable by the Group for technical, insurance claims reserves and reserves for unearned premiums by their remaining contractual maturities as of December 31, 2008, including interest payments:
Other non-derivative financial liabilities are related to the balances presented in the consolidated balance sheets and include mainly accounts payable to reinsurers and coinsurers and other liabilities with contractual maturities of less than one year, see also note 29.3.
(d) Credit risk of the insurance activity
Credit risk is the risk that one party to a financial instrument will cause a financial loss to the other party by failing to discharge an obligation.
The following policies and procedures are in place to mitigate the Group’s exposure to credit risk:
- The Group sets the maximum amounts and limits that may be advanced to corporate counterparties by reference to their long- term credit ratings.
- Credit risk from customer balances, will only persist during the grace period specified in the policy document or trust deed until the policy is paid up or terminated. Commissions paid to intermediaries are netted off against amounts receivable from them in order to reduce the risk of doubtful accounts.
- Reinsurance is placed with counterparties that have a good credit rating and concentration of risk is avoided by following guidelines in re-spect of counterparties’ limits which are set each year by the Board of Directors and are subject to regular reviews. At each reporting date, Management performs an assessment of creditworthiness of reinsurers and updates the reinsurance purchase strategy, ascertaining suitable allowance for impairment.
- A Group policy setting out the assessment and determination of what constitutes credit risk for the Group is in place, its compliance is monitored and exposures and breaches are reported to the Group risk committee. The policy is regularly reviewed for pertinence and for changes in the risk environment.
2008 2007
US$(000) US$(000)
Up to 1 monthFrom 1 to 3 monthsFrom 3 to 12 monthsFrom 1 to 5 yearsOver 5 years
57,470117,509280,424200,023606,096
77,047100,991177,197160,618558,301
Total 1,261,522 1,074,154

notes to the consolidated financial statements 158(continued)
29.6 capital management
The Group maintains an actively managed capital base to cover risks inherent in its business. The adequacy of the Group’s capital is moni-tored using, among other measures, the rules and ratios established by the SBS, the supervising authority of its major subsidiaries and for consolidation purposes.
The Group’s objectives when managing capital, which is a broader concept than the “Equity” on the face of the consolidated balance sheets, are: (i) to comply with the capital requirements set by the regulators of the banking markets where the entities within the Group operate; (ii) to safeguard the Group’s ability to continue as a going concern so that it can continue to provide returns for shareholders and benefits for other stakeholders; and (iii) to maintain a strong capital base to support the development of its business.
Capital adequacy and the use of regulatory capital are monitored daily by the Group’s Management, employing techniques based on the guidelines developed by the Basel Committee, as implemented by the SBS for supervisory purposes. The required information is filed with the SBS on a quarterly basis. The SBS requires each bank or banking group to: (a) hold the minimum level of the regulatory capital, and (b) maintain a ratio of total regulatory capital to the risk-weighted asset at maximum level of 11. On June 2008, through Legislative Decree 1028, the ratio indicated in (b) above was modified, requiring that starting July 1, 2011, the regulatory capital be at least 10 percent of the assets and contingent credits weighed by credit risk plus 10 times the required regulatory capital for operational and market risk (9.5 percent starting July 1, 2009 and 9.8 percent starting July 1, 2010). In addition, those individual banking subsidiaries or similar financial institutions not incorporated in Peru are directly regulated and supervised by their local banking supervisor, which may differ from country to country.
The risk-weighted assets are measured by means of a hierarchy of five risk weights classified according to the nature and reflecting an estimate of credit, market and other risks associated with each asset and counterparty, taking into account any eligible collateral or guarantees. A similar treatment is adopted for off-balance sheet exposure, with some adjustments to reflect the more contingent nature of the potential losses.
As of December 31, 2008 and 2007, the regulatory capital for the subsidiaries engaged in financial and insurance activities amounted to approximately US$1,649.9 and US$1,420.2 million, respectively. This regulatory capital has been determined in accordance with SBS regu-lations in force as of such dates. According to the SBS and the Administradoras Privadas de Fondos de Pensiones (AFP) regulations, the Group’s regulatory capital exceeds in approximately US$308.7 million the minimum regulatory capital required as of December 31, 2008 (approximately US$350.4 million as of December 31, 2007).
29.7 fair value
Fair value is defined as the amount for which an asset could be exchanged or a liability settled, between knowledgeable, willing parties in an arm’s length transaction, assuming an on-going enterprise.
When a financial instrument is traded in an active and liquid market, its quoted market price in an actual transaction provides the best evidence of its fair value. When a quoted market price is not available, or may not be indicative of the fair value of the instrument, to determine such fair value, the current market value of another instrument that is substantially similar, discounted cash flow analysis or other estimation tech-niques may be used, all of which are significantly affected by assumptions used. Although Management uses its best judgment in estimating the fair value of these financial instruments, there are inherent weaknesses in any estimation technique. As a result, the fair value may not be indicative of the net realizable or liquidation value.

a world in motion159
The methodologies and assumptions used to determine fair values depend on the terms and risk characteristics of the various financial instru-ments and include the following:
(a) Assets for which fair value approximates carrying value - For financial assets and financial liabilities that are liquid or having a short term maturity (less than three months) it is assumed that the carrying amounts approximate to their fair value. This assumption is also applied to demand deposits, savings accounts without a specific maturity and variable rate financial instruments.
(b) Fixed rate financial instruments - The fair value of fixed rate financial assets and liabilities carried at amortized cost are estimated by com-paring market interest rates when they were first recognized with current market rates offered for similar financial instruments. The estimated fair value of fixed interest bearing deposits is based on discounted cash flows using prevailing money-market interest rates for debts with similar credit risk and maturity. For quoted debt issued the fair values are calculated based on quoted market prices. For those notes issued where quoted market prices are not available, a discounted cash flow model is used based on a current interest rate yield curve appropriate for the remaining term to maturity.
(c) Financial instrument recorded at fair value - The fair value for financial instruments traded in active markets at the consolidated balance sheets dates is based on their quoted market price or dealer price quotations (bid price for long positions and ask price for short positions), without any deduction for transaction costs. For all other financial instruments not listed in an active market, the fair value is determined by using appropriate valuation techniques. Valuation techniques include net present value techniques and comparison to similar instruments for which market observable prices exist.

notes to the consolidated financial statements 160(continued)
Based in the aforementioned, set out below is a comparison of the carrying amounts and fair values of the Group’s financial instruments that are carried in the consolidated balance sheets. The table does not include the fair values of non-financial assets and non-financial liabilities:
29.8 fiduciary activities, management of funds and pension funds
The Group provides custody, trustee, investment management and advisory services to third parties. The Group makes allocations and purchase and sale decisions in relation to a wide range of financial instruments. Those assets that are held in a fiduciary capacity are not included in these consolidated financial statements. These services give rise to the risk that the Group will be accused of poor administration or under-performance.
As of December 31, 2008 and 2007, the assigned value of the financial assets under administration (in U.S. Dollars million) is as follows:
Liabilities Deposits and obligationDue to banks and correspondentsBanker’s acceptances outstandingAccounts payable to reinsurers and coinsurersFinancial liabilities designated at fair value through profit or lossBorrowed fundsBonds and subordinated notes issuedOther liabilities
13,950,4371,179,991
232,58055,841
-1,150,716
785,230575,112
13,950,4371,180,404
232,58055,841
-1,153,108
773,652575,112
11,350,7141,453,261
35,90133,96350,561
870,404702,298458,976
11,350,7141,453,185
35,90133,96350,561
870,404716,609458,976
Total 17,929,907 17,921,134 14,956,078 14,970,313
2008 2007
Book value Fair value Book value Fair value
US$(000) US$(000) US$(000) US$(000)
AssetsCash and due from banksTrading securitiesInvestments available-for-saleLoans, netFinancial assets designated at fair value through profit or lossPremiums and other policies receivableAccounts receivable from reinsurers and coinsurersDue from customers on acceptancesOther assets
3,766,17136,084
4,959,06810,322,041
129,631111,561165,144232,580326,740
3,766,17136,084
4,959,06810,330,518
129,631111,561165,144232,580326,740
3,073,86550,995
5,228,6418,039,500
213,15385,495
116,14135,901
197,668
3,073,86550,995
5,228,6418,056,106
213,15385,495
116,14135,901
197,668
Total 20,049,020 20,057,497 17,041,359 17,057,965
2008 2007
Investments fundsPension FundsEquity managed
1,394.64,199.01,966.8
1,768.85,939.02,740.7
Total 7,560.4 10,448.5

Risk Ratings
Rating
1ª (pe)
Rating
1ª
Definition
Highest level of solvency and greatest stability in issuers’ economic results.
Definition
Highest level of solvency and greatest stability in issuers’ economic results.
Credicorp
Apoyo & Asociados Internacionales S.A.C.
Ordinary stock
Equilibrium Clasificadora de Riesgo S.A.
Ordinary stock
board of directors, senior management and auditing committee 162risk ratings

board of Directors, senior Management and auditing Committee
Board of Directors
Dionisio Romero S.Raimundo Morales Fernando Fort M. Reynaldo LlosaJuan Carlos Verme Luis Enrique Yarur Felipe Ortiz de ZevallosGermán Suárez
Management
Dionisio Romero S.Walter Bayly Alvaro Correa David Saettone
Auditing Committee
Reynaldo Llosa Germán Suárez Benedicto Cigüeñas Luis Nicolini
Chairman of the BoardVice chairmanDirectorDirectorDirectorDirectorDirectorDirector
Chief Executive OfficerChief Operating OfficerChief Financial OfficerSenior Vice President, Insurance
ChairmanDirectorAdvisorAdvisor
a world in motion163

164contacts
Contacts
Banco de Crédito BCP
Lima Headquarters Calle Centenario 156, La Molina, Lima 12, PerúTelephone (511) 313-2000 (511) 625-2000
Offshore Branches Miami, United States of America121 Alhambra Plaza, Suite 1200 Coral Gables, Florida 33134 United States of AmericaTelephone (305) 448-0971, Fax (305) 448-0981Panama, Republic of PanamaCalle 50 y Aquilino de la Guardia, Torre Banco Continental, piso 29, Apartado 6-8934 El Dorado, Panamá, República de PanamáTelephone (507) 215-7311Fax (507) 215-7323
BCP Bolivia
La Paz HeadquartersEsquina Calle Colón y Mercado Nº 1308, La Paz, BoliviaTelephone (5912) 233-0444, Fax (5912) 239-1044
Atlantic Security Holding Corporation
Panama HeadquartersCalle 50 y Aquilino de la Guardia, Torre Banco Continental, piso 29Apartado 6-8934 El Dorado, Panamá, República de PanamáTelephone (507) 215-7311, Fax (507) 215-7323

a world in motion165
Pacífico Grupo Asegurador
Lima HeadquartersJuan de Arona 830, San IsidroLima 27, PerúTelephone (511) 518 4000
Credicorp Securities Inc.
Florida Headquarters121 Alhambra Plaza, Suite 1200, Coral Gables, Florida 33134, United States of AmericaTelephone (305) 446 4446, Fax (786) 999 1624
Prima AFP
Lima HeadquarterCalle Chinchón 986, San Isidro, Lima 27, PerúTelephone (511) 615 7250, Fax (511) 615 7270

a world in motion167
Credits
Design and Conceptualization
Editing and editorial oversight
Photography
Printing
Studioa
b+A Comunicación Corporativa
José Carlos Martinat
Gráfica Biblos

a world in motion a world in motion2008 annual report
a w
orl
d in
mo
tio
n20
08
ann
ual
rep
ort
A world in motion
Credicorp LtdClaredon House 2 Church Street Hamilton, Bermudawww.credicorpnet.com
Banco de Crédito BCPAtlantic Security Holding CorporationPacífico Grupo AseguradorPrima AFP

Annual Report 2008
At the pace of change

Contents
2 Mission and Vision
3 Our principles
4 Letter from the Chairman
10 Economic environment
16 Corporate strategy
24 A graphic view of management
34 Business units
48 Risks management
56 Capital and assets
64 Systems, Organization and Human Resources Development
72 Banco de Crédito BCP Bolivia
78 Corporate governance and social responsibility
86 Financial Statements 2008
158 Risk ratings
160 Board of Directors, Executive Committee and Management
165 Contacts

1
Our simple banking model allowed
us to cope with the challenge we
faced in 2008. BCP evolved at the
pace of change, stayed close to its
basic principles and accomplished
unprecedented historical results.
At the pace of change
At the pace of change

2
Mission Serving the client.
VisionBeing a simple, transactional and profitable bank, and having a highly skilled and motivated staff.

3
Our principles
Dedication We focus on improving our
products, services and processes
to make our clients’ banking
activities easier.
Access All our clients can rely on us,
any time, any place.
Flexibility We offer useful and appropriate
solutions to the needs of
our clients through our staff’s
specialized consulting services.
At the pace of change

4

Letter from the Chairman 5
Letter from the Chairman1

6
Dear shareholders, Once again, on behalf of Banco de Crédito BCP’s Board of Directors, which I have the honor to chair, I submit the company’s 2008 annual report for your consideration.
ResultsIn the first place, I would like to refer to the international financial crisis which was evident since 2007 but reached its massive dimension only in 2008’s second half. It was certainly not expected to be as severe and significant as it has been. This event has in part conditioned the performance of our company, as I will comment below.
Once again, 2008 proved to be an exceptional year at BCP. Net consolidated income reached US$ 423.5 million, measured following international accounting principles. This represents a 28% increase over last year’s results and a return on average equity of 32.8%, the highest return in BCP’s history that we remember.
Earnings in nuevos soles, pursuant to local accounting principles, were likewise highly satisfactory, having reached S/. 1,334.5 million, 51% higher than 2007’s.
Practically all revenue items contributed to BCP’s improved results. Net Financial income increased 30%, commissions from bank services grew 20%, and among the other non financial revenues, commissions from foreign exchange transactions increased a remarkable 83% year over year.

Letter from the Chairman 7
Higher net financial income is principally accounted for by more loans, which measured in average daily balances grew 36% compared to 2007. In this respect, it is worthwhile underscoring that despite accelerated growth of loans in recent years, which practically tripled between 2004 and 2008, this portfolio’s quality has also improved annually. Past due loans at year-end 2008 reached 0.8% of the total portfolio, while provisions reached 2.7 times the non-performing portfolio.
Loans increased in all market segments. However, Retail Banking, loans to individuals and small companies, performed remarkably well. This business unit expanded its portfolio in 43%, measured in average daily balances and has made the largest contribution to the bank’s growth in earnings, deposits and loans.
Such positive evolution of both results and operations was influenced by Peru’s dynamic economy. Gross Domestic Product continued to grow strongly, and expanded 9.8% in 2008.
Operating expenses also experienced significant growth last year, and were 12% higher than in 2007. Such behavior is accounted for by the accelerated growth of our physical and technological infrastructure in the last two years. In 2007 and 2008, we opened 97 offices, installed 251 additional automated tellers and started operations through 1,491 newly established BCP Agents, our novel banking channel. In addition, we invested US$ 61 million to improve the technological support for our operations. Finally, in these two years we have hired 5,200 new employees, principally to meet the needs of our new offices. We are persuaded with these investments we are laying down the foundations for sustained growth, as Peruvian economy develops.

8
Banco de Crédito BCP BoliviaLast year was also a year of exceptional results for our subsidiary in Bolivia. Its net earnings reached US$ 44.5 million, 65% higher than in 2007, thus accomplishing an average return over equity of 39.9%. In recent years, this subsidiary has become a significant source of earnings for our corporation.
Exceptional growth of profits is accounted for by larger financial income, significant increases in non-financial revenues, in particular fees charged for the services we provide and improved credit risk which did not require significant provisioning.
Improvements in financial markets are principally due to the growth of retail loans and treasury investments, rather than to an overall growth of credits, which remained almost unaltered.
Dividends and capitalizationAt its February 27th meeting, the Board of Directors agreed to distribute a cash dividend of S/. 0.407 per share, which represents 46% of profits earned. Thus, this year, the company’s non-distributed earnings will reach a 54%.
In addition, BCP also increased its operating capital through retained earnings worth S/. 512.3 million, in order to support the strong asset growth during this year.

Letter from the Chairman 9
OutlookUncertainty is the buzz word in the current international economic scene. The present world crisis is the largest and most severe we have ever experienced. Although its impact is not yet fully felt in Peru, we must be aware that it will have an impact on economic activity in Peru this year.
Still, we are convinced such hardship will not totally obliterate growth in Peru. Strong external and fiscal accounts, significant foreign currency reserves, and the financial system’s high solvency ratios provide sufficient foundation to successfully cope with the challenges created by the international context.
BCP is also ready to successfully sail through these uncertain waters. It counts on a strong equity, technical and professional capital; the loyalty and trust of our clients, and talented employees deeply committed to their companies’ success.
Business will continue to grow, albeit at a slower pace than during the recent, exceptional years. We should expect higher credit risk in the banking business and, consequently, the need for larger provisioning.
To conclude this report, on behalf of the board of directors I wish to thank our shareholders for their confidence in us; our more than two million clients for their loyalty; and all our employees for their contribution to developing our company.
Thank you,
Dionisio Romero Seminario Chairman of the Board

10
Economic environment 2

Economic environment 11

12
In 2008, the United States’ economy, and the world economy generally, slipped into recession. Growth was particularly week as some key areas, including the labor market, contracted at levels not seen in recent recessions. As uncertainty mounted about the crisis’ depth and duration, the main world governments enforced fiscal policies to prevent a generalized collapse. Thus, the United
The economy in figures
Indicators 2006 2007 2008
World Economy
World GDP (% real change)
Inflation (% change)
5.1
3.4
5.2
5.0
3.4
5.9
Peruvian Economy
Real sector
GDP (% real change) 7.6 8.9 9.8
Prices
Inflation (% change)
Exchange rate, end of period (S/. to US$)
Exchange rate, period average (S/. to US$)
1.1
3.20
3.27
3.9
3.00
3.12
6.7
3.14
2.93
Fiscal sector (% GDP)
Central Government revenues
Central Government expenditures
Non Financial Public Sector Results
17.4
16.1
2.1
18.1
16.4
3.1
18.2
16.1
2.1
Foreign sector (US$ million)
Exports
Imports
Trade balance
Central Bank’s Foreign Currency Reserves
23,830
14,844
8,986
17,275
27,882
19,595
8,287
27,689
31,529
28,439
3,090
31,196
Source: Central Bank (BCR), Statistics Institute (INEI)
States approved a US$700 billion package to rescue some key industries, including the financial and automobile sectors. Expectations of lower growth slowed down price increases in the main commodities during the first half. Likewise, inflation expectations weakened as revealed by lower price increase rates in some countries in the last months of 2008.

Economic environment 13
Main economic and financial indicators
Economic activity: Driven by investmentIn 2008, Peru’s economy grew at 9.8% over a year before. Thus, Peru’s economy completed 10 years of uninterrupted growth at an average annual 5.1% rate (7.6% in the last 5 years). Industry by industry, the best performing sectors were construction, non-primary manufacturing and trade, while primary activities (agricultural, fisheries and mining) all grew below average. By type of expenditure, investment continued to drive growth, with government spending as the most powerful engine. In the foreign front exports slowed down in view of a slower world economy driven by the recession in the industrialized countries, while imports continued at a lively pace, responding to evolving domestic demand, weakening our up to now very strong trade surplus.
GDP growth rate (% real change)
10%
Source BCR
2006
8%
9%
7%
7.6%
2007
8.9%
2008
9.8%
6%
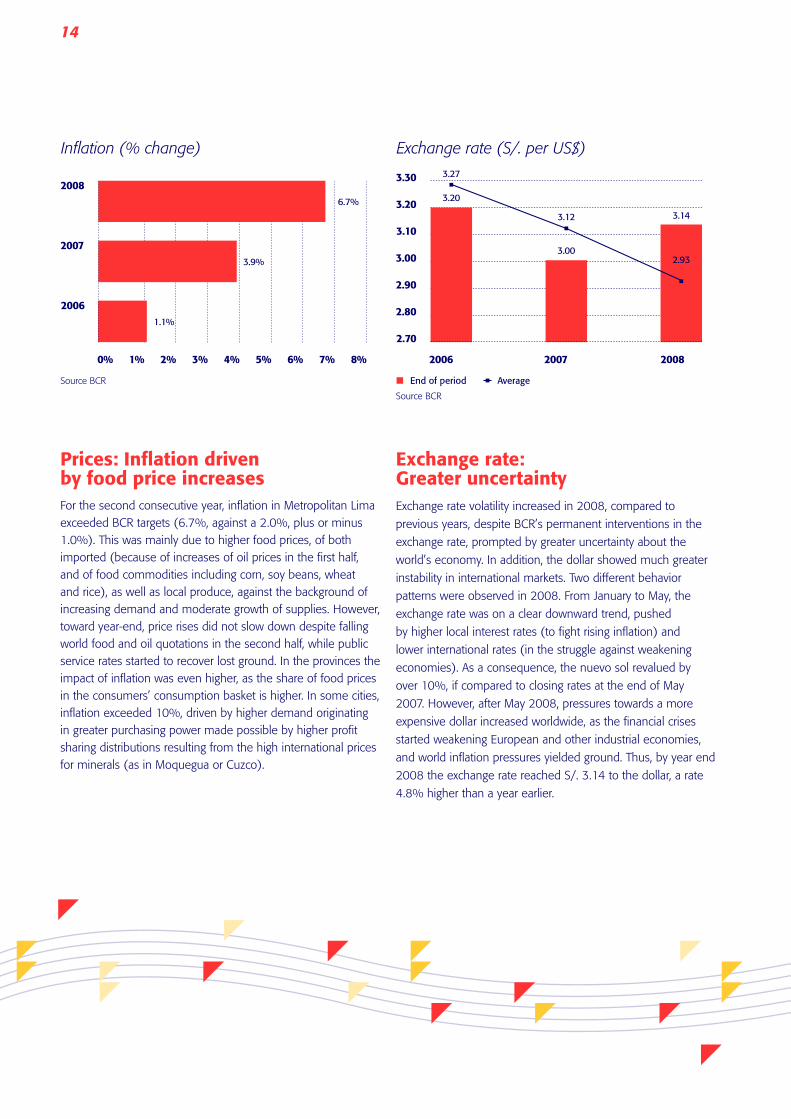
14
Prices: Inflation driven by food price increasesFor the second consecutive year, inflation in Metropolitan Lima exceeded BCR targets (6.7%, against a 2.0%, plus or minus 1.0%). This was mainly due to higher food prices, of both imported (because of increases of oil prices in the first half, and of food commodities including corn, soy beans, wheat and rice), as well as local produce, against the background of increasing demand and moderate growth of supplies. However, toward year-end, price rises did not slow down despite falling world food and oil quotations in the second half, while public service rates started to recover lost ground. In the provinces the impact of inflation was even higher, as the share of food prices in the consumers’ consumption basket is higher. In some cities, inflation exceeded 10%, driven by higher demand originating in greater purchasing power made possible by higher profit sharing distributions resulting from the high international prices for minerals (as in Moquegua or Cuzco).
Exchange rate: Greater uncertaintyExchange rate volatility increased in 2008, compared to
previous years, despite BCR’s permanent interventions in the
exchange rate, prompted by greater uncertainty about the
world’s economy. In addition, the dollar showed much greater
instability in international markets. Two different behavior
patterns were observed in 2008. From January to May, the
exchange rate was on a clear downward trend, pushed
by higher local interest rates (to fight rising inflation) and
lower international rates (in the struggle against weakening
economies). As a consequence, the nuevo sol revalued by
over 10%, if compared to closing rates at the end of May
2007. However, after May 2008, pressures towards a more
expensive dollar increased worldwide, as the financial crises
started weakening European and other industrial economies,
and world inflation pressures yielded ground. Thus, by year end
2008 the exchange rate reached S/. 3.14 to the dollar, a rate
4.8% higher than a year earlier.
Inflation (% change)
Source BCR
2006
2007
20086.7%
3.9%
1.1%
1% 3%2% 4% 5% 8%7%6%0%
Exchange rate (S/. per US$)
3.30
2.70
End of period
Source BCR
3.20
2006
Average
3.10
3.00
2.90
2.80
3.27
3.20
2007
3.6%
3.00
3.12
2008
2.93
3.14

Economic environment 15
Trade balance: Livelier importsAlthough the trade balance is still positive by US$ 3,090 million, it has drifted away from its record levels of the first months in 2007. Exports reached US$ 31,529 million (+13.1% compared to 2007), while imports reached US$ 28,439 million (+45.1%). Non-traditional exports showed the greatest strength, driven by agricultural and chemical products. However, such liveliness was dampened by a loss of momentum in textiles sales. Strong imports’ increase responded not only to higher agricultural inputs’ prices (corn, soy bean, wheat, rice), but mostly to higher crude quotations. However, it must be recalled that capital goods’ inputs grew at a quick 57.6% as a response to growing investments.
Fiscal sector: Government surplusThe central government’s tax revenues grew 11.1%, to almost S/. 58 billion. This result was mainly a consequence of higher IGV (value added tax) collections from foreign sources resulting from faster imports. On the other hand, import duties fell 13.1%, as Peru’s trade becomes increasingly open and tariffs fall to mitigate domestic inflation. Also, the selective consumption tax fell 19.4%, as a result of lower fuel consumption (-39.8%). It is worthwhile underscoring that this year’s tax collections from income tax back payments fell close to 40%, revealing the end of the upwards rising trend in minerals. Although in recent times public expenditure has increased, mainly on capital investments, surging revenues have preserved the public sector’s surplus, which remained at slightly above 2% of GDP.
Outlook for 2009Despite greater international turbulence and creeping recession in most industrial countries, Peru’s economy may continue to grow in a lower rate. The strength of the crisis’ adverse effects will depend on the severity, length and geographical scope of the world’s crises.
In 2009, a relatively more relaxed monitoring policy will be expected to boost the real sector, due to decreasing prime rate, in order to may taper off growth. Inflationary pressures, particularly from abroad, are perceived as less intense. Foreign exchange volatility and US dollar increasing trend may continue, according to international crisis. This may gradually restore, as international markets recover their calm, possibly at end of the year. By year end the nuevo sol may appreciate slightly. This would partially respond to a weaker dollar worldwide, resulting from expansionary US fiscal and monetary policies. In Peru, ample rule for both types of policies may contribute to alleviate the impacts of the world crisis.
Trade balance (US$ billion)
Source BCR
2006
2007
2008
3525200 5 1510
23.814.8
9.0
30
19.68.3
31.5
3.1
27.9
1.1%
Trade BalanceExports Imports
28.4
Non Financial Public Sector Results (% of GDP)
0%
Source BCR
4%
3%
2%
1%
2006
2.1%
3.6%
2007
3.1%
2008
2.1%

16

Corporate strategy 17
Corporate strategy 3

18
At the pace of changeYear 2008 was one of dramatic changes. Changes in the international economic scenario, where markets turned highly volatile and the unleashing of the world’s largest financial and economic crisis of recent times…, structural changes in the world’s financial system…, changes in the local environment…, and lastly, but most important to us, changes within our organization.
In a changing world, our organization’s ability to adapt is crucial to ensure its survival. More important still is the ability to identify the right time for change and seize the emerging opportunities.
The great challenge of 2008 was to move our organization at the pace of change and keep our sight clearly focused on our goals, without missing the pace.
Internal changes in our organization responded to a well-planned generational transition and occurred at a point in time that allowed
us to react nimbly to events in a changing world. In line with such internal changes, we have reorganized our functions within the organization to focus on those areas of emerging importance as our environment changes dramatically.
Our focus on enhancing our control over risk, on the asset management business, on strengthening our operating capacity and capabilities, as well as our technological support; our continuing efforts to deepen bank penetration, and our unyielding pursuit of excellence in service and product quality, are some of the topics that may become central next year and that we will be able to address as we reorganize and modernize our organization.
And yet, our strategy’s essence has remained intact. Our organization is built on the foundation of its people. It is its people that make it strong, and who have precisely demonstrated their exceptional capacity to move at the pace of change.

Corporate strategy 19
Strong foundations… the anchor in the midst of the stormStructural changes in the world financial system, still underway, will bring even greater challenges in 2009.
However, our strong fundamentals allow us to sail through stormy waters and suffer relatively minor harm, thus reassuring us in the wisdom of our conservative policies. Our traditional business model to provide simple banking, is demonstrating its strength to face such a massive crisis.
It is precisely under circumstances as we are experiencing at present that traditional values recover their importance.
At BCP, simple basic banking, transparent services to clients, streamlined products designed to address our clients’ needs, and traditional policies to build a strong organization represent the foundation of our organizational culture. It is precisely those features that are the source of our strength vis-à-vis the consequences of the crisis underway.
Our historic positioning and our acknowledged image as a sound and solid organization with a commitment to excellence have been, and will continue to be, the foundations on which we build our organization.

20
The changes we dealt with in 2008 and those that we will face in the next year, as a consequence of recent events, encouraged us to review and strengthen our strategy in order to introduce necessary changes. But our goals remained clearly unaltered, namely to focus on further developing our Retail Banking and increasing efficiencies throughout our organization
Continuing growth with clear goals
The main initiatives focus on expanding our banking business and increasing bank penetration can be summarized in:
Improvement of distribution model to offer greater value added through our distribution channels and to automate transactional services.
Upgrade of our technological systems to accomplish such heightened transactional operating efficiencies and to provide greater value added at the point of sale.
Enhacement of operating processes to increase efficiencies and reduce costs.
However, the initiatives to ensure our business’s sustainability over time are also very important:
Comprehensive, independent and sophisticated risk management.
Expanding our activities in asset management.
Corporate strategy 21
The economic crisis unleashed by the financial turmoil; the changes we see in the world and in the financial systems as a result of this crisis; and the severe global growth slowdown, have confirmed our conviction that in a country like ours the pace of our internal economy is largely nurtured by incorporating into the economy those partially excluded segments of the population who have little access to the financial system.
Our financial system has not yet reached the sophistication of developed economies and has therefore been less hurt by the crisis and still has a natural capacity to keep expanding.
These are the sources of our organization’s future growth. Our success will depend on our ability to achieve our bank penetration and to continue developing the financial system focused on simplicity and efficiency.
Beyond 2009

22
Awards and acknowledgements
The BankerThis renowned English publication, that benchmarks the world’s one thousand most important banks, recognized us as Peru’s Best Bank of 2008. This award has been granted since 1926 to recognize each country’s leading financial organization. It assesses the value of the asset’s organization in the last year, and the financial information provided by the banks themselves. In addition, it recognized the use of technology, innovation and strategies in place that have an impact on the financial organization’s long term positioning.
Gran EffieThe Effie Awards are awarded every year in 34 European, Asian, North American and South American countries to recognize creative corporate strategies with successful and outstanding results. In this year’s Peru Effie Awards under the Services category for our successful Cuenta Sueldo BCP campaign that resulted in significant increases in new accounts. This distinction fills us with pride and encourages us to be even better and continue giving our clients our characteristic quality services.
Corporate social responsibility and sustainable developmentOur Pilot20 education program was awarded the Anda 2008 Excellence Prize under the Social Responsibility Category in the V Corporate Social Responsibility and Sustainable Development Contest organized by Peru 2021, Universidad del Pacifico and Pontificia Universidad Católica del Perú. Such distinction commits us to continue encouraging learning efforts among our more than 200 thousand school children
Business CreativityOur Cuenta Sueldo BCP benefits program awarded us the Business Creativity Prize in the Bank, Financial and Insurance Services category. This award is organized by Universidad Peruana de Ciencias Aplicadas (UPC), RPP broadcasting corporation, ATV television and El Comercio daily to recognize innovative companies and their most significant achievements as examples to follow. This award is a further incentive for us to give our clients our best effort and to introduce innovative programs for their benefit.

Corporate strategy 23
National Quality Award 2008For the second time, the Quality Management Committee of the Peruvian National Association of Industry awarded BCP the National Quality Award and the Leader Company Gold Medal for our BCP Management Model, a Malcom Baldridge-inspired management model. In awarding this prize it evaluated seven criteria, namely strategic planning, customer and market drive, measurement, knowledge analysis and management, personnel driven policy, process management and results. This award encourages us to keep improving our processes and searching for excellence.
VIII Annual Management Survey 2008The 2008 Annual Management Survey organized by the Lima Chamber of Commerce awarded BCP the top rating for Personal, Business and Peruvian Model banking. It also spotted Dionisio Romero as Peru’s most outstanding business person and BCP for having been named by 56.9% of respondents as the best performer in personal banking. We are proud that our efforts to provide quality services are increasingly recognized by more people, thus infusing sense to our devotion and efforts.
Peru’s most valuable brandAmerica Economia, the renowned business publication, chose us as Peru’s most valuable brand and one of the 50 most valuable brands in Latin America, based on the findings of the Interbrand survey, a world leader in brand management. This survey also reviewed bands from companies in other industries. Such significant recognition is a source of great satisfaction for the BCP family, as it recognizes our people’s daily commitment to gain international recognition for our brand and keep moving ahead.
Latin FinanceOnce again, Banks of the Year, an annual prize awarded by Latin Finance, chose BCP as the Best Peruvian Bank of 2008, in recognition of its excellence and leadership among financial institutions of 17 Latin American countries. This award fills us with satisfaction because it recognizes BCP for its strength and leadership.

24
A graphic view of management
4

A graphic view of management 25
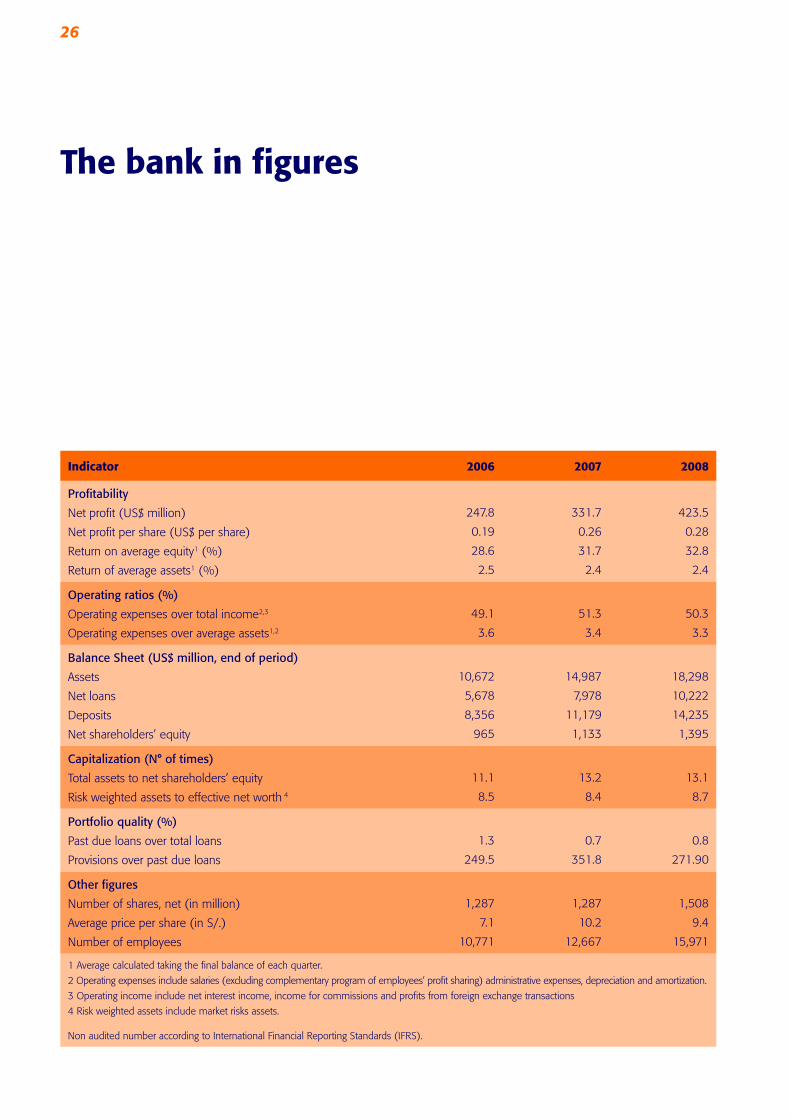
26
The bank in figures
Indicator 2006 2007 2008
Profitability
Net profit (US$ million)
Net profit per share (US$ per share)
Return on average equity1 (%)
Return of average assets1 (%)
247.8
0.19
28.6
2.5
331.7
0.26
31.7
2.4
423.5
0.28
32.8
2.4
Operating ratios (%)
Operating expenses over total income2,3
Operating expenses over average assets1,2
49.1
3.6
51.3
3.4
50.3
3.3
Balance Sheet (US$ million, end of period)
Assets
Net loans
Deposits
Net shareholders’ equity
10,672
5,678
8,356
965
14,987
7,978
11,179
1,133
18,298
10,222
14,235
1,395
Capitalization (N° of times)
Total assets to net shareholders’ equity
Risk weighted assets to effective net worth 4
11.1
8.5
13.2
8.4
13.1
8.7
Portfolio quality (%)
Past due loans over total loans
Provisions over past due loans
1.3
249.5
0.7
351.8
0.8
271.90
Other figures
Number of shares, net (in million)
Average price per share (in S/.)
Number of employees
1,287
7.1
10,771
1,287
10.2
12,667
1,508
9.4
15,971
1 Average calculated taking the final balance of each quarter.
2 Operating expenses include salaries (excluding complementary program of employees’ profit sharing) administrative expenses, depreciation and amortization.
3 Operating income include net interest income, income for commissions and profits from foreign exchange transactions
4 Risk weighted assets include market risks assets.
Non audited number according to International Financial Reporting Standards (IFRS).

A graphic view of management 27
ResultsAt year-end 2008, BCP earned net profit of US$ 423.5 million, a figure reflecting 27.7% growth compared to last year’s profits (US$ 331.7 million). Despite the present financial environment, earnings set a new record at BCP, and continued along the trend started in 2004 with average annual growth of 38.2%. As a consequence of such outstanding evolution, returns on equity (ROE) improved to 32.8%, above the system’s average (31.1%).
Such outstanding results were accomplished thanks to the ongoing and sound growth of our loan portfolio across all segments and products, and which was preserved to the end of the year. This was reflected in increased net interest income (29.5%), growth of non-financial revenues (16.5%)
Main management indicators
and appropriate expenditure containment, which increased at the pace of growth of our network that expanded 12%.
It is worthwhile underscoring such outstanding performance was accomplished despite the international financial crisis, which became more acute at the start of the first quarter of 2008. The crisis influenced the investment policies for our liquid assets, favoring high liquidity positions over more profitable investments, as did also the Central Reserve Bank policies against inflation in the first 9 months, increasing reserve requirements and leading such liquid assets toward less profitable instruments.
Net profit and ROE
Net profit (US$ million)
Source BCP - Finance Division
ROE
2007
332
31.7%
2008
424
32.8%
450
350
300
250
200
150
100
50
0 26%
27%
28%
29%
30%
31%
32%
33%
34%
248
28.6%
2006
400
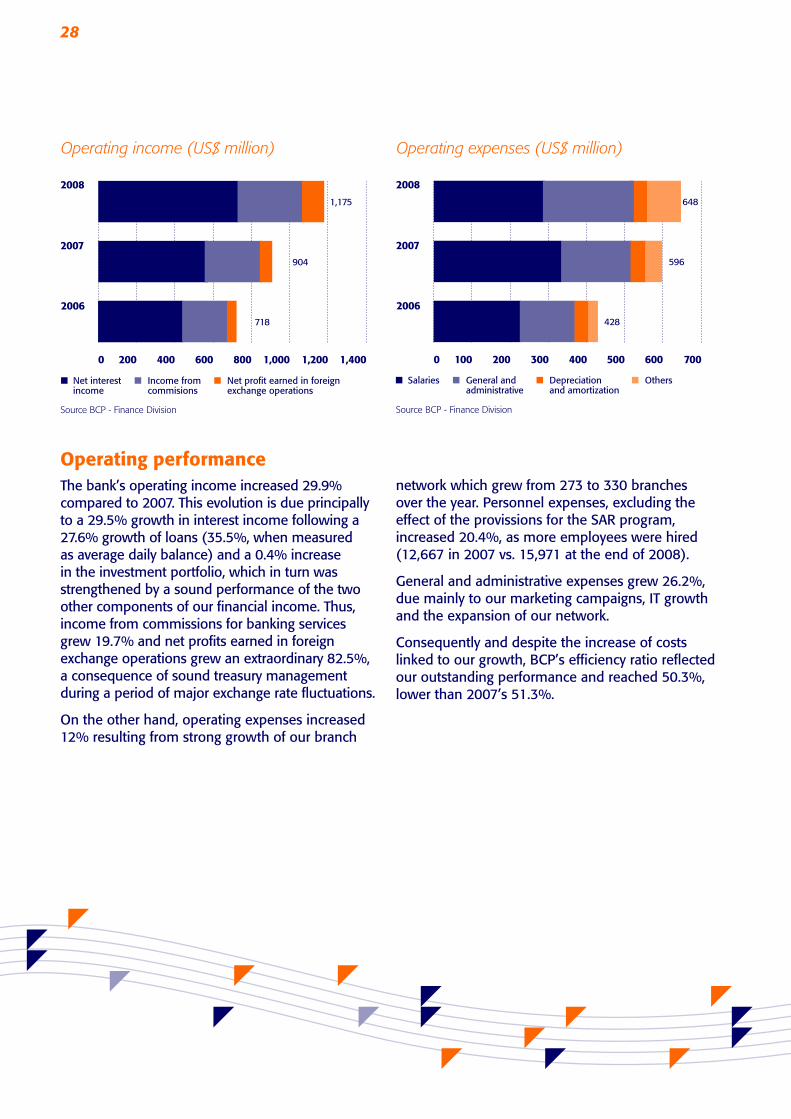
28
Operating performanceThe bank’s operating income increased 29.9% compared to 2007. This evolution is due principally to a 29.5% growth in interest income following a 27.6% growth of loans (35.5%, when measured as average daily balance) and a 0.4% increase in the investment portfolio, which in turn was strengthened by a sound performance of the two other components of our financial income. Thus, income from commissions for banking services grew 19.7% and net profits earned in foreign exchange operations grew an extraordinary 82.5%, a consequence of sound treasury management during a period of major exchange rate fluctuations.
On the other hand, operating expenses increased 12% resulting from strong growth of our branch
network which grew from 273 to 330 branches over the year. Personnel expenses, excluding the effect of the provissions for the SAR program, increased 20.4%, as more employees were hired (12,667 in 2007 vs. 15,971 at the end of 2008).
General and administrative expenses grew 26.2%, due mainly to our marketing campaigns, IT growth and the expansion of our network.
Consequently and despite the increase of costs linked to our growth, BCP’s efficiency ratio reflected our outstanding performance and reached 50.3%, lower than 2007’s 51.3%.
Operating income (US$ million)
Net interestincome
Source BCP - Finance Division
Income from commisions
Net profit earned in foreign exchange operations
Salaries General and administrative
Depreciation and amortization
Others
Operating expenses (US$ million)
Source BCP - Finance Division
2006
2007
2008
100 200 300 400 500 600 7000
648
596
428
2006
2007
2008
800 1,2001,000 1,4004000 200 600
1,175
904
718

A graphic view of management 29
Customer service channelsIn 2008, we directed our strategy to strengthen our customer service channels, in line with the need to provide more and better access to the financial system, together with appropriate products to meet our customers’ needs, in a way that will allow increasing our bank penetration and expand traditional and transactional businesses.
At the end of 2008, we have 57 additional branches, 58.3%s more than 2007, and thereby consolidated our positioning in this channel. Automatic teller machines (ATMs) grew by 142, while our innovative channel, the Agente BCP, increased significantly after adding 630 agents along the year.
Such strategy expanded our network by 37% and was characterized by growth of channels nationwide, while growth in the provinces reached 38.6%. We expanded the customer care network in less well served areas, as part of our effort to increase bank penetration.
The growth of our network has allowed us to meet the rising demand for banking services and products reflected by a significant 22.1% increase in the average number of transactions, year over year.
BCP Monthly average transactions (Thousand)
Teller transactions
Source BCP - Finance Division
Alternative Channels Others
Distribution channels (units)
Dec 07Dec 06
Source BCP - Finance Division
Dec 08
2,000
500
0
1,500
1,000
Agentes BCP
1,851
1,221
551
Branches
237 273 330
ATMs
655748
890
2006
2007
2008
5,00
0
10,0
00
15,0
00
20,0
00
25,0
00
30,0
00
40,0
00
35,0
000
9,836
8,763
8,003
20,047 6,490
15,437 5,597
12,022 4,679
+22%
+21%
+20%

30
Assets and loansAt year-end 2008, BCP assets reached US$ 18,298 million, representing a 22.1% increase compared to 2007.
Loans were the main component of the asset portfolio, and experienced 27.6% growth (US$ 10,445 million) compared to a year before. Such growth was experienced by all types of banking services and went hand in hand with the ongoing restructuring of our portfolio towards the most dynamic segments, including Retail Banking, which accounts for 38% of the entire portfolio, compared to 26% five years ago.
In addition, 2008 was also characterized by a restructuring of all other liquid assets, reflected by
the evolution of the share of available funds over total assets, which rose from 18.7% to 19.3%, as a consequence of the Central Bank’s policy against inflation through increased reserve requirements in force during the first nine months of 2008, and a deepening international crisis during the closing quarter, which required increased liquidity as a precautionary measure.
Our investment portfolio increased 0.4% in 2008 and we held positions in conservative, highly liquid and safe instruments, such as BCR’s certificates of deposit, which account for about 63.8% of the total amount.
Assets breakdown (US$ million)
Net loans
Source BCP - Finance Division
Investments Available funds Others
Loans portfolio composition* (%)
Wholesale Banking
* Average daily balance
Source BCP - Finance Division
Retail Banking
2006
2007
2008
20% 40% 60% 80% 100%0
62.0%
63.0%
63.5% 36.5%
37.0%
38.0%
2006
2007
2008
5,000 10,000 15,000 20,0000
18,298
14,987
10,672
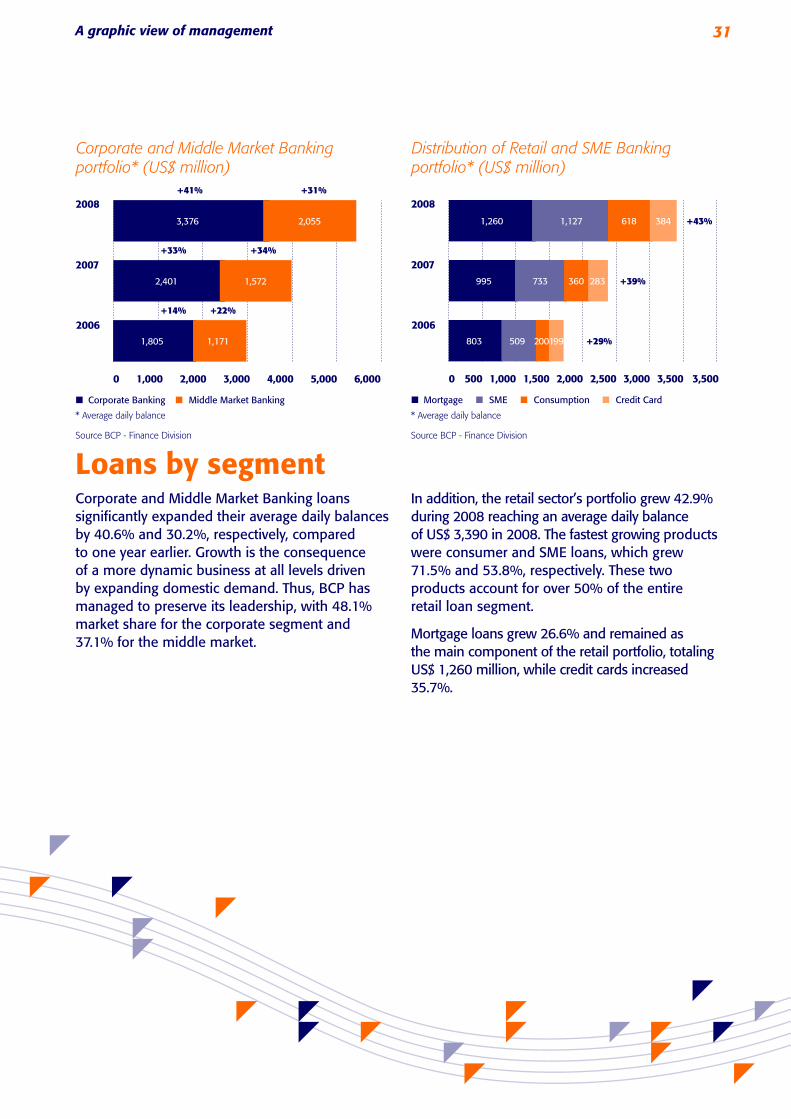
A graphic view of management 31
Loans by segmentCorporate and Middle Market Banking loans significantly expanded their average daily balances by 40.6% and 30.2%, respectively, compared to one year earlier. Growth is the consequence of a more dynamic business at all levels driven by expanding domestic demand. Thus, BCP has managed to preserve its leadership, with 48.1% market share for the corporate segment and 37.1% for the middle market.
In addition, the retail sector’s portfolio grew 42.9% during 2008 reaching an average daily balance of US$ 3,390 in 2008. The fastest growing products were consumer and SME loans, which grew 71.5% and 53.8%, respectively. These two products account for over 50% of the entire retail loan segment.
Mortgage loans grew 26.6% and remained as the main component of the retail portfolio, totaling US$ 1,260 million, while credit cards increased 35.7%.
Corporate and Middle Market Banking portfolio* (US$ million)
Corporate Banking
* Average daily balance
Source BCP - Finance Division
* Average daily balance
Source BCP - Finance Division
Middle Market Banking
Distribution of Retail and SME Bankingportfolio* (US$ million)
Mortgage SME Consumption Credit Card
2006
2007
2008
1,000 1,500 2,000 2,500 3,000 3,500 3,5000 500
1,260
995
803
1,127
733
509
618
360
200
384
283
199
+43%
+39%
+29%
2006
2007
2008
1,000 2,000 3,000 4,000 5,000 6,0000
3,376
2,401
1,805
2,055
1,572
1,171
+41%
+33%
+14% +22%
+34%
+31%

32
Liabilities and depositsTotal BCP deposits reached US$ 14,235 million at the end of 2008, or 27.3% increase compared to deposits a year before.
Such strong trend consolidates our funding structure as deposits account for 84,2% of all funding sources. It also consolidates our leadership in the entire system, as it gives us a 38.5% market share. It is worthwhile underscoring BCP remained as a leader in the mutual fund business, with US$ 1,273.6 million total funds under management through its subsidiary, Credifondo.
Once again, demand deposits experienced the fastest growth at 36.7%. Likewise, time and savings deposits grew 25.9% and 24.7%, respectively.Severance indemnity (CTS) grew a moderate 16%, because of unceasing competition from other market players and the customers’ sensitivity to interest earned from such deposits.
Composition of deposits (US$ million)
TimeSource BCP - Finance Division
Demand Savings Severance indemnity
Funding structure (%)
Source BCP - Finance Division
Due to banks7%
Others7%
Timedeposits
31%
Severance indemnity6%
Bonds5%
Demand deposits26%
Savingdeposits18%
2006
2007
2008
4,00
0
2,00
0
6,00
0
8,00
0
12,0
00
10,0
00
14,0
00
16,0
000
5,258
4,176
2,820
4,458
3,261
2,480
2,969
2,381
1,952
1,040
896
775

A graphic view of management 33
RisksPast due loan rate in Peru have showed a satisfactory trend in recent years and now rank among the lowest in the entire region, giving the Peruvian financial system a 1.27% portfolio quality index.
Yet, BCP’s 0.8% indicator, similar to 2007, is even below the system indicator. Such result is the consequence of the country’s improving economy, resulting in strong liquidity among persons and companies, and strict credit policies. Thus, in line with the growing portfolio, past due loans grew from US$ 60.3 million in 2007 and US$ 82.1 million in 2008.
In addition, BCP enforces conservative provisioning and long term risk management policies, placing our coverage ratio above the average ratio of the system. However, in 2008, this indicator slipped compared to a year before (351.8% vs. 271.9%).
Total cumulative provisions reached US$ 223.2 million, 6.3% higher than those of 2007. These amounts include the pro-cyclical provisions applied this year, which, following SBS guidelines, are constituted in times of prosperity as a precautionary measure against troubled times.
SystemBCP
Coverage ratio(Accumulated provisions / past due portfolio, %)
Source BCP - Finance Division
400%
350%
300%
250%
200%
150%
100%
50%
0%
2002 2003 20082007200620052004
SystemBCP
Portfolio quality(Past due loans / total loans, %)
Source BCP - Finance Division
10%
4%
2%
0%
8%
6%
2002 2003 20082007200620052004

34
Business units 5

Business units 35

36
Wholesale BankingWholesale Banking followed
the rhythm of the country’s
business sector’s economic
growth, in particular the
momentum added by the
corporate segment.
BCP has grown consistently in the corporate segment, which is evidenced by the high market share it has conquered with these clients over the time. Wholesale Banking at BCP provides sophisticated and innovative financial solutions to serve the needs of our clients in two main segments i.e. Middle Market Banking and Corporate Banking. The latter includes the institutional Banking segment. In addition, BCP operates specialized units to support all our business units, including Leasing, Corporate Finance, International Business and Corporate Services.
In 2008, Wholesale Banking grew at the same pace as Peru’s business sector. This required devising a business strategy to preserve our leadership in an increasingly competitive financial market. As a result, BCP’s market share in commercial credit year-end 2008 had reached 41.1%, as reported by the SBS bank regulator.
Wholesale Banking continued on the upward trend for direct loans that started in prior years, with an average annual total of US$ 5,431 million, representing 37% growth over the previous year. This outcome was accomplished despite BCP’s already high market share –a result of several years of growth and a

Business units 37
natural impediment to further expansion–, strong competition and reduced financial intermediation, as a consequence of strong local capital market development.
Annual interest income earned by Wholesale Banking reached US$ 184 million, evidencing 21% growth year over year. They were principally due to the increasing business volume, which partially offset the trend to slimmer asset spreads. Income from financial services, which is an increasingly significant component in this segment, totaled US$ 157 million in 2008 and now provides 46% of all revenues generated by Wholesale Banking.
These loans account for 54% of all BCP loans, as a consequence of the ongoing restructuring of our portfolio towards more dynamic and profitable segments. However, deposits are an increasingly important source of revenues, and accounted for 46% of all bank deposits in 2008.
Results for the year 2008 reflect profits of US$ 141million.
Results 2007 2008 Change
Financial intermediation margin 152 184 21%
Income from services 114 157 38%
Net profit 108 141 31%
Wholesale Banking key figures (US$ million)
Source Finance Division
Commercial loans and market share (US$ million)
Source SBS
Corporate Banking Middle MarketBanking
Total
Banking system BCP
16,000
14,000
12,000
10,000
8,000
6,000
4,000
2,000
0
8,235
3,880
6,901
2,348
15,135
6,228
Wholesale Banking direct loans (US$ million)
Source Finance Division
1,9642,400 2,370
2,547 2,976
3,973
5,4316,000
1,000
2,000
3,000
4,000
5,000
0
37%
2002 2003 2004 2005 2006 2007 2008
Wholesale Banking deposits (US$ million)
Source Finance Division
802
1,482 1,903
2,429 2,741
4,008
6,0257,000
6,000
1,000
2,000
3,000
4,000
5,000
0
50%
2002 2003 2004 2005 2006 2007 2008
47%
34%
41%

38
CorporationsOur significant goodwill and strong corporate image have continued to fuel the growth of our business in this traditional BCP segment that servers large corporations and companies. Corporate Banking loans grew for the fifth consecutive year to US$ 3,376 million (average daily balance), reflecting 41% growth compared to a year earlier, a significant growth rate in the framework of slower volume growth, compared to a year before.
Our market share for direct loans reached 47.1% at 2008-closing, preserving our leadership in this market segment.
On the liability side, this business segment experienced sustained deposits’ growth. These deposits now account for about 35% of all BCP deposits. In 2008, the average deposit balance reached US$ 4,647 million, reflecting the significant growth trend started in recent years.
Our institution’s focus on transactions has resulted in the development of BCP services to our wide corporate base. Such services have been designed to provide streamlined and fast financial services to meet our clients’ financial needs. Likewise, non-financial revenues from this bank segment, as with middle market banking, have became increasingly relevant to total revenues. In 2008, they accounted for 51% of total revenues (financial plus non-financial), reaching US$ 94 million. It is also important to highlight the growth of the currency exchange business, as a consequence of high volumes of transactions fuelled by the increased volatility of the United States dollar.
As a consequence of the above, net annual earnings in the corporate segment reached US$ 76.2 million, or 43% higher than in 2007.
Corporate Banking direct loans (US$ million)
Source Finance Division
1,511
1,584 1,805
41%
2,401
3,376
4,000
3,500
1,000
500
1,500
2,000
2,500
3,000
0
2004 2005 2006 2007 2008
Corporate Banking income from services (US$ million)
Source Finance Division
38
44
53
48%
64
9410090
40302010
50607080
0
2004 2005 2006 2007 2008
Corporate Banking deposits (US$ million)
Source Finance Division
1,453
1,889
2,060
52%
3,066
4,6475,0004,500
2,0001,5001,000
500
2,5003,0003,5004,000
0
2004 2005 2006 2007 2008
Composition of Corporate Banking total income (%)
Source SIG - Finance Division
Income from servicesUS$ 94.0 million51%
Active marginUS$ 45.6 million
24%
Passive marginUS$ 46.1 million
25%

Business units 39
Middle marketThe Middle Market loan portfolio continued to grow at an annual rate of 30% and totaled US$ 2,055 million, following the dynamic growth of Peru’s economy.
Interest income earned by Middle Market Banking this year exceeded US$ 91 million; this is the equivalent to 23% growth compared to a year earlier. This was mainly the consequence of a larger volume of business that offset the sliding trend of asset spreads that are a consequence of heightened competition in this segment by other companies of the financial system.
On strategy focused on transactional banking has also led this business unit. Non- financial revenues from this bank segment are becoming increasingly important as a portion of total revenues, so that in 2008 they accounted for 41% of total revenues (financial plus non-financial), and reached US$ 63.1 million. Taking into account all the above, net earnings this year in the middle market segment totaled US$ 64.6 million, representing an amount 19% higher than in 2007.
Middle Market Banking direct loans (US$ million)
Includes loans for US$ 83 million transferred from Retail Banking.
Source SIG - Finance Division
Includes loans for US$ 80 million transferred from Retail Banking.
Middle Market Banking income from services (US$ million)
Source Finance Division
Composition of Middle Market Banking total income (%)
Source SIG - Finance Division
Income from servicesUS$ 63.1 million41%
Active marginUS$ 58.1 million
37%
Passive marginUS$ 33.7 million
22%
859 9631,171
1,572
2,055
2,500
500
1,000
1,500
2,000
0
30%
2004 2005 2006 2007 2008
3234 38
26%
50
6370
60
10
20
30
40
50
0
2004 2005 2006 2007 2008

40
InstitutionsProviding financial advice to almost one thousand institutions throughout Peru, BCP’s Institutional Banking has concluded a decade of productive operations and contributions to BCP growth.
During this decade, the Institutional Banking team has been guided by two recurring questions about its clients: “What do our customers need?” and “What kind of customers are we talking about?” Answers to these questions drove this business unit to reshape its portfolio segmentation in 2004. Five specialized segments were established to provide better service to our institutional clients, mainly Central Government, Regional and Local Governments, education sector, NGOs and microfinance organizations, trade associations, civil associations, clubs and church associations.
Throughout 2008, our clients trusted us the management of more than US$ 1.9 billion worth of deposits and investments, equivalent to 14% of BCP deposits.
Income from financial services is extremely significant in the Institutional Banking segment and reached US$ 8.5 million in 2008, 15% higher than in 2007. It is worth underscoring the growth of institutional clients from the provinces, and which are expect to become an important source of growth in coming years.
Support units
2008: Year of international crisis
Many challenges rose in 2008 for financial institutions worldwide.
At the start of the year, BCP raised a US$ 410 million dollars with a three year term, in the international bank market, under extremely attractive conditions and despite the deteriorated credit environment. This was a unique transaction in the midst of the worst financial crisis, so we also made the decision not to search for additional funds in the international capitals market, given the strong volatility and increasingly weak response from market players.
Nevertheless, we did actively raise funds in the short term interbank market and exceeded US$ 1 billion of own debt stock. Although interest rates increased gradually, BCP was able to negotiate the most competitive market rates and financed its trade loans without undue pressure. In addition, BCR introduced several foreign exchange measures and policies against inflation. As a consequence of these measures, legal reserves were required on foreign funds, thus significantly
Income from sevicesUS$ 8.5 million38%
Composition of Institutional Banking total income (%)
Source SIG - Finance Division
Active marginUS$ 1.7 million
8%
Passive marginUS$ 12 million
54%

Business units 41
increasing their cost and leading to a gradual reduction of such financing. In November, and in view of reduced funding from foreign banks, the legal reserve on debt was lowered. However, BCP held an extremely liquid position that allowed it to serve its clients’ needs from its own funds.
The international factoring business has continued growing as expected, and increased the total amount of business from US$ 62 million in 2007 to US$ 106 million in 2008.
The strategy to increase revenues from foreign trade services continued to be a priority in 2008, and translated into 16.4% annual growth to US$ 13.9 million this year.
We managed to protect our share of the global foreign trade products business, which reached 36.5%.
In September, we visited banks in China, South Korea, Japan and Hong Kong to introduce BCP, expand our business
relations and evaluate the risks and cultures in those countries. Our Asian tour was extremely successful.
Having included in our plans to get closer to Asia, during the APEC meeting that took place in November in Lima, we signed a short and medium-term agreement with Korea Eximbank to finance imports of equipment and capital goods from that country or manufactured by Korean companies anywhere in the world, up to US$ 50 million. We also signed a cooperation agreement with China’s Development Bank to develop the El Galeno mining project that will require investments worth about US$ 2 billion.
BCP: Foreign trade transactions income(US$ thousands)
Source BCP
11,900
10,700
13,854
2008
2007
2006
0 5,000 10,000 15,000

42
More clients persuaded of the advantages of leasing
Since 2001, we have been the leaders in the leasing market. In 2008, our market share reached 36.3%, including the BCP and Credileasing transactions.
The fastest growth of leasing transactions since September 2004 took place in 2007. By December 2007, the market had increased 64% year over year. By year-end 2008, the leasing market totaled US$ 4.9 billion or a 54.8% increment year over year. A growing trend among our clients to recognize the tax benefits of this product for all kinds of investments in fixed assets, and the stable corresponding regulatory framework contributed to such preference, in addition to the growing Peruvian economy, in particular in the first half.
As in 2007, in 2008 we were the leaders in the corporate and middle market segment. Within only two large companies approximately US$ 128 million in leasing transactions were disbursed. Other transactions totaling US$ 129 million will be fully disbursed between 2009 and the beginning of 2010. We also experienced significant growth in the SME segment where we placed US$ 125 million in 2008 compared to US$ 48 million a year before.
Financing more and better projects
In 2008, our Corporate Finance area, focusing on investment banking and structured financing, grew simultaneously with the expanding Peruvian economy and, in particular, the local capitals market, creating income from structuring, counseling and placing commissions exceeding US$ 8.4 million.
This was the consequence of more and larger new projects underway in Peru, which required financing and where BCP’s Corporate Financing Area played a major role. The main projects and structured transactions of 2008 include a medium-term syndicated loan to “Compañía de Minas Buenaventura” for US$ 450 million, which became the largest structured financing provided by a local bank. Also, a leasing arrangement for US$ 95 million for Duke Energy Egenor to build “Las Flores” thermal power plant and the syndicated loans to Transportadora de Gas del Perú (TGP) for US$ 80 million and US$ 150 million, to expand capacity of the gas pipeline from Camisea to Lima. Likewise, retro-leasing transaction for S/. 244 million and a medium term loan to Inversiones en Turismo (Intursa) for US$ 50 million to partially finance their investment plan, including the Westin Lima Hotel.
In the capitals market, we successfully structured the takeover bid for ordinary stock issued by a mining company, as well as a private stock offering made in the Lima Stock Exchange and the Alternative Investment Market (AIM) of the London Stock Exchange, among other transactions. Also, the Corporate Finance Area was actively involved in the first private issues of bonds by Chilean companies in Peru, for more than S/. 500 million
Leasing financing and market share(US$ millions)
Source SBSGrupo Crédito Market
6,000
5,000
4,000
3,000
2,000
1,000
0
1,119
3,197
2007
1,794
4,947
2008
4341,163
2004
581
1,501
2005
691
1,948
2006
37% 39% 36% 35%
36%

Business units 43
Leaders in cash management solutions
In 2008, our Business Services area celebrated its 10th anniversary. During this period, BCP has positioned itself as the leading bank for transactional services for clients of the wholesale banking segment, where a study conducted in June 2008 by IPSOS Apoyo about key transactional products for companies, revealed 75% of respondents to the survey sought of BCP as their first choice in providing cash management solutions.
Income from financial services in the Business Services area exceeded US$ 95 million in 2008, equivalent to a 17% increase year over year. The share of these revenues in BCP’s non-financial income reaches 34%.
Financing of e-sales through electronic financing of paper and electronic factoring, increased 31% year over year, from US$ 98 million monthly- average in 2007 to US$ 129 million monthly- average in 2008.
Telecrédito, our remote banking system, used now by more than 11 thousand Wholesale Banking and Commercial
Department clients (87% growth by number of new member clients year over year, including holders and incorporated) allows customers to optimize their information and payment management processes; organize and streamline procedures, and save on transactional costs.
The amount collected or charged through the Collections Service increased 29% in 2008, from US$ 8.5 billion to US$ 11 billion.
There is a strong relationship between our various services. For instance, as more companies do collections through the Bank, they will pay to their employees and suppliers using Telecrédito (Remote Electronic Banking) against their accounts with us. This relationship creates customer loyalty and keeps us as the customer’s main bank.
Our present services, and which we will continue to expand, contribute to reduce BCP’s internal process costs and create loyalty among our clients.
Pay salaries67%
Others12%
Supplierspayment21%
Monetary transactioms by Telecrédito* (%)
*Total transactions: 2’216,000 monthly.
Source: BCP
Others 66%
Share of Corporate Services in BCP’s non-financial income (%)
Source BCP - Finance Division
Corporate services34%

44
Retail Banking2008 was a year for investments
in infrastructure and human
capital, both necessary building
blocks for increasing bank
penetration.
Loans (average daily balance) and deposits balances in Retail Banking grew 27% and 36%, respectively, year over year, to US$ 3.7 billion and US$ 6.1 billion. Retail balances account for 37% of total bank balance for loans and 45% for deposits.
Retail Banking keeps developing its ability to attract a larger percentage of the population to the financial system and improve service. To pursue such strategic goals, 2008 saw unprecedented investments in infrastructure and human capital, and a boom in customer service channels. BCP opened 57 additional branches (24% more); added 142 automated tellers to its network of 890 ATM’s nationwide; opened 630 Agentes BCP points and added more than 3,000 employees, needed to serve its network.

Business units 45
Transactions in these customer service channels continued to grow significantly, and expanded 22% compared to a year before. Retail Banking continued to move transactions towards channels that are friendlier to customers and cheaper to the Bank. Thus, in 2008, 73% of transactions were performed through electronic means, as opposed to teller transactions, or three percentage points more than in 2007.
We also increased our income from service commissions by 18%, to over US$200 million, while the 30-day past due rate of the retail portfolio remained under control throughout 2008, and was at 2% at year-end.
As a result of the strategy focusing on expanding growth of Retail Banking, and taking account of the expenditures and investments required for that, profits reached US$ 169.4 million, representing a contribution of 40% of BCP earnings.
Retail Banking profits (US$ thousands)
Others
Source BCP - Finance Division
Retail Banking
Evolution of infrastructure in customer service channels
Branches Agentes BCP
Source BCP - Finance DivisionDec 06 Dec 07 Dec 08
ATMs
237 273
330
655748
890
1,221
574
1,8512,000
1,500
500
1,000
0
21%
52%
19%
Retail Banking: Average daily balance of the month (US$ thousands)
Loans
Source BCP - Finance Division
Dec 07 Dec 08
Deposits
27%
36%
12,000
10,000
8,000
6,000
4,000
2,000
0
2,898
4,496
3,694
6,131
46%
7%
450,000
300,000
250,000
200,000
150,000
100,000
50,000
0
2007 2008
173,722
331,651
423,529
157,929
254,146
169,383
400,000
350,000
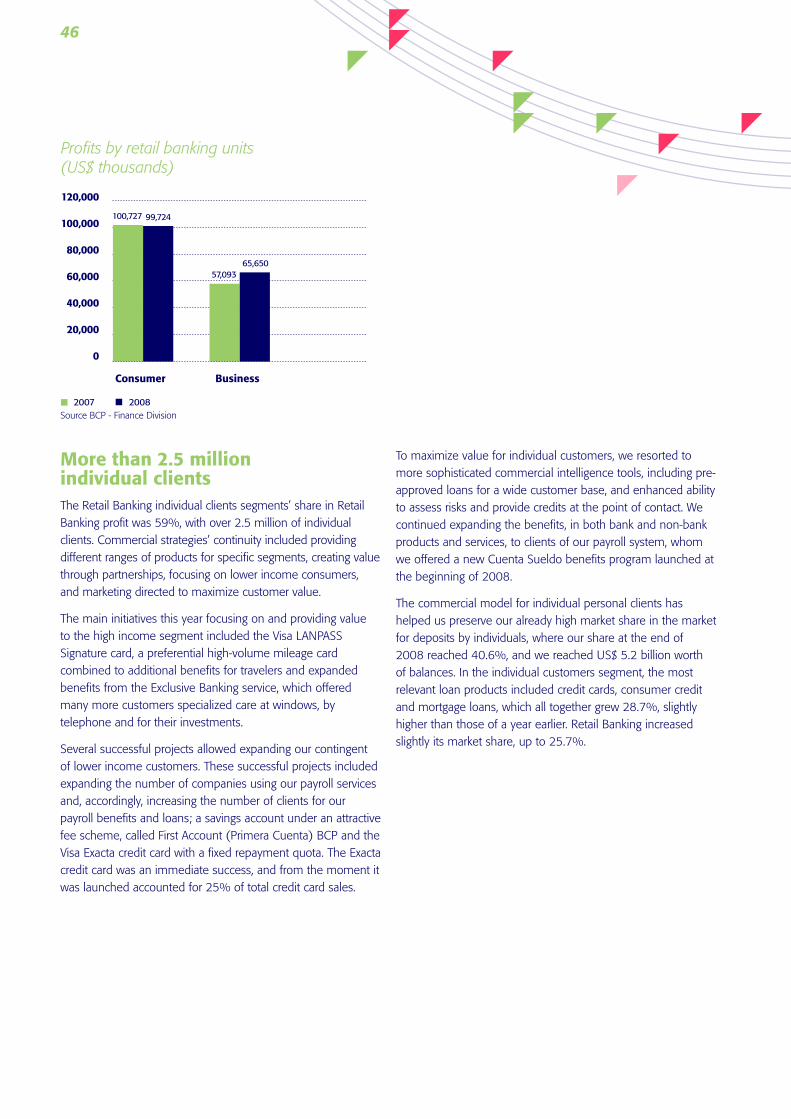
46
More than 2.5 million individual clientsThe Retail Banking individual clients segments’ share in Retail Banking profit was 59%, with over 2.5 million of individual clients. Commercial strategies’ continuity included providing different ranges of products for specific segments, creating value through partnerships, focusing on lower income consumers, and marketing directed to maximize customer value.
The main initiatives this year focusing on and providing value to the high income segment included the Visa LANPASS Signature card, a preferential high-volume mileage card combined to additional benefits for travelers and expanded benefits from the Exclusive Banking service, which offered many more customers specialized care at windows, by telephone and for their investments.
Several successful projects allowed expanding our contingent of lower income customers. These successful projects included expanding the number of companies using our payroll services and, accordingly, increasing the number of clients for our payroll benefits and loans; a savings account under an attractive fee scheme, called First Account (Primera Cuenta) BCP and the Visa Exacta credit card with a fixed repayment quota. The Exacta credit card was an immediate success, and from the moment it was launched accounted for 25% of total credit card sales.
To maximize value for individual customers, we resorted to more sophisticated commercial intelligence tools, including pre-approved loans for a wide customer base, and enhanced ability to assess risks and provide credits at the point of contact. We continued expanding the benefits, in both bank and non-bank products and services, to clients of our payroll system, whom we offered a new Cuenta Sueldo benefits program launched at the beginning of 2008.
The commercial model for individual personal clients has helped us preserve our already high market share in the market for deposits by individuals, where our share at the end of 2008 reached 40.6%, and we reached US$ 5.2 billion worth of balances. In the individual customers segment, the most relevant loan products included credit cards, consumer credit and mortgage loans, which all together grew 28.7%, slightly higher than those of a year earlier. Retail Banking increased slightly its market share, up to 25.7%.
Profits by retail banking units(US$ thousands)
Source BCP - Finance Division
Consumer Business
2007 2008
120,000
100,000
80,000
60,000
40,000
20,000
0
100,727 99,724
57,09365,650

Business units 47
More than 260 thousand business and SME customers Our value proposition for SME and Business Banking includes not just offering a wide range of products for financing business growth, but is based on providing business owners the tools they need to achieve sustainable growth of their companies. Our training and counseling approach became extremely important in 2008 and produced very satisfactory results, with returns rising 15% and contributing almost 40% to the Retail Banking bottom line.
By year end, close to 20 thousand small business owners had attended our business meetings in the main cities around Peru: Arequipa, Chiclayo, Cuzco, Huancayo, Lima, Pucallpa and Trujillo. Free business training was open to both BCP customers and non-customers. In addition, over 1,500 business owners had the chance to attend the training programs from PYME, the government’s small business promotion agency, at Universidad del Pacifico. This custom made course offerings include issues on planning, finance, marketing, human resources, processes and others.
In June 2008, BCP organized the third ExpoEmpresa, attended by the Minister of Production where firm owners visited close to 100 booths, to purchase goods and services. This initiative brought BCP corporate, middle-market and business banking customers together, to show them a number of options for small business growth.
Retail Banking lived up to its commitment to get decidedly involved in initiatives sustaining small and medium-size firm development. These initiatives include support to the Ministry of Labor’s Micro and Small Company office, by disseminating ways for firm mainstreaming; an agreement with the American Chamber of Commerce in Peru, to issue recommendations on how best to tap opportunities created by the Free Trade Agreement (FTA) with the United States and sponsoring events like the Annual Entrepreneurs Conference (CADE), the President of Peru Award, the Bread-Making Fair (FEPAN) 2008, and others.
Our commercial strategy and discipline in this segment has helped us preserve our share of this market, which reached 20.2% at the end of 2008, in a segment where players include not just other first-line banks, but also many organizations focusing exclusively on this type of customers. Dramatic 38% growth was also accomplished in balances of business and small company deposits, to reach a total US$ 1.5 billion.
Consumer61%
Business 39%
Contribution to Retail banking profits (%)
Source BCP - Finance Division

48
Risk management 6

49Risk management

50
Credit risksIn 2008, we remained vigilant
of the portfolio’s exposure to
the credit exchange risk, against
the backdrop of a highly volatile
exchange rate.
Implementation of adequacy project to Basel II In 2008, BCP continued adopting the principles and guidelines of the New Capital Agreement (NCA), Basel II. These activities took place in line with a plan designed in compliance with preliminary rules published by SBS in December 2007 and January 2008 to compute minimum regulatory capital. In October and December 2008, SBS again amended those regulations so that starting in January 2010 all financial organizations will compute their minimum regulatory capital using the standardized method and may request SBS to confirm their internal capital estimation models. This project is key for BCP for which reason both senior management and the Risk Management Committee have become actively involved in the process.
Some 2008 highlights are listed below.
(i) The second survey on quantitative impacts led by SBS concluded. It used standardized methods and methodologies building on internal models to compute the minimum regulatory capital.
(ii) Capital calculations using the standard method were fully developed and automated, in compliance with the preliminary regulations issued in January 2008.
(iii) With support from external consultants, we diagnosed the Retail Banking loan portfolio management and prepared a plan to adapt ourselves so we can apply the NCA Advanced IRB method for this portfolio.

51Risk management
(iv) We concluded the pilot projects to compute the capital for credit risk using the Foundation IRB for Wholesale Banking and for Market Risk using the internal models.
The new regulations published in October and December by SBS for consultation with market players resulted in some changes in activities planned to be able to accomplish our goals. In line with the adaptation plans, the next step will be to hire an external consultant at the beginning of 2009 to review BCP’s request for approval of the methods based on our internal models.
Development in credit risk modellingIn line with the project to adapt to Basel II in 2008, our credit risk modeling efforts focused on ensuring credit risk modeling for probability of default in Wholesale Banking should follow best practices in areas like basic principles for modelling, documenting, validation and monitoring. Presently automated processes are in place to assess the performance of the models. They have been used in credit evaluation since beginning of 2007.
Simultaneously, new non-compliance probability models were put in place focusing on some segments of the wholesale credit portfolio. In particular they focus on local and foreign financial institutions, sovereign risk and energy companies. Another expert model addressed specialized lending, new companies and slow maturity projects, based on Basel II recommendations.
In 2008 we started using tools and methods to perform stress testing on our loan portfolio and thereby be in a position to determine the right capital in those conditions. We established procedures to perform these stress tests on a half-yearly basis. These scenarios are coordinated with the Market Risk service that also performs its own tests and is aligned with requirements in the SBS regulations. The goal is to compile test results to better assess the portfolio’s behavior under extreme circumstances. Such enhanced knowledge should allow to design and adopt measures and policies that may be applied in specific situations for greater effectiveness in risk mitigation.
Operational Risk Central OfficeBCP continued working on its development of an information repository that will allow us to comply with SBS requirements to put in place an Operational Risk Central Office (ORCO) and adopt international standards for risk management in the framework of NAC. This project will provide us with the ability to store large volumes of information for the abovementioned regulatory goals, but also to estimate the basic parameters included in the Basel II framework. This is a very large scale project involving several bank departments because of the need to create or modify business processes, source applications and data models.
In 2008 SBS provided detailed technical considerations about the ORCO. They had requiriments for the design and development of all changes in the source language and data warehouse. After they were reviewed by the IT Division at the

52
bank, they were included in the work plans currently underway. SBS also expanded the volume of information that must be reported in the near future, including among others variables related to capital calculation methods using in-house models and more abundant guarantee information.
Exchange rate credit risk In 2008 we enforced an ongoing follow up of our portfolio’s exposure to exchange-rate credit risk against a backdrop of high exchange rate volatility. However, BCP’s high quality portfolio led to relatively low portfolio exposure to credit loss stemming from potential non-compliance by debtors exposed to exchange rate fluctuations. To December 2008, the portfolio at risk accounted for only 15.5% of total transactions.
Improvements introduced to the analysis of this type of risk now allow quantifying the potential loss derived from credit exchange risk.
Country risk BCP’s exposure to country risk remained relatively low in 2008. To December exposure was close to 90.5% in investment grade countries, based on ratings awarded by the main international rating agencies.
Several BCP divisions are in charge of jointly managing country risk to keep it at healthy levels. They closely monitor macroeconomic, political and social developments in the countries where we do business. In 2008, the bank further strengthened management of this risk by putting in place statistical stress simulation models that allow anticipating potential impacts and provide us with estimates of required provisioning in case of risk rating downgrades. Likewise, our country risk management internal policies were modified to hand over country risk management to the Risk Management Committee.
Credicorp exposition by risk classification, to december 2008*
Investment grade* Pacífico Peruano Suiza not includedSource BCP
RCC exposure level (% of total loans)
Dec 07 Sep 08 Dec 08
Unexposed Exposed Unidentifed
Source BCP
79.7
17.0
3.4 2.1
16.4 15.5
1.9
81.4 82.580%
90%
70%
60%
50%
40%
30%
20%
10%
0%
Risk 170.2% Risk 2
10.4%
Risk 39.9%
Risk 49.0%
Risk 50.5%

53Risk management
Market risksThe project to adapt to the
guidelines of the new Basel
Capital Agreement was the
main task in 2008.
In 2008 we continued developing tools and plans allowing the Market Risk Administration Unit to more closely monitor our trading book and the management of our Asset & Liability structure (banking book). Along this line also, the project to adopt the principles and guidelines of the NCA Basel II for market risk issues ranked among the most important projects.
Risk management of the trading portfolios in 2008 included introducing a new module for computing their Value at Risk (VaR) using automated rapid measurements. In addition, we improved our daily market risk reporting mechanisms. This allows more efficient and timely follow up of portfolio risk based on VAR calculations made possible by the new risk module.
Risk management of assets and liabilities benefited from a new methodology for calculating the economic capital needed in case of structural balance sheet risk. These computations are made on a monthly basis at present. Weekly calculations are planned for mid-2009.
The contingency liquidity plan was restructured and new indicators were established including periodical daily, weekly and monthly warning signals. Liquidity stress tests are performed bi-weekly to identify practicable solutions should action be needed to face such situations.
As regards to the New Capital Agreement in 2008 automated systems were put in place to compute the economic capital of the trading portfolio using the standard (monthly) and internal (daily) modules. Plans for 2009 include retaining external consultants to perform an independent test of BCP risk models.
Finally, in 2009 Treasury management will be assessed using an indicator for the economic capital calculations to be performed by the Market Risk Service that includes risk as a component of performance evaluations.

54
Operational risksThe OR team focuses on
optimizing the management
model that is now the
strategic framework for
planning all projects.
Risk identification and evaluationActivities focused on reviewing the present methodology for operational risk evaluations to propose improvements in line with the best international practices. Protivity, an experienced US risk management consultancy, was retained to review our methodology in risk management.
Additionally we expanded the scope of our operational risk identification and evaluation model to determine operational risks in areas not previously included in our model. This new approach includes a scheme to classify information assets, critical supplier contracts and insurance policy hiring. This last model will allow us to review insurance policies hired by BCP and accordingly put in place an appropriate strategy for risk conveyance and optimizing our insurance costs.
Simultaneously, and as is customary every year, now we evaluated BCP’s entire operational risk by reviewing a total 169 critical processes and thereby contributed to obtain certification required by Section 4 of the Sarbanes-Oxley Law. This process requires we provide technical and methodological support to other Credicorp Group companies.
Finally, we continued providing advice to other units in matters of operational risk analysis for their own commercial and operations projects, and for new products and processes. Support of this type was provided for 32 major initiatives.

55Risk management
Near-miss managementIn the field of near-miss management we have defined the policies, roles and responsibilities for managing near-misses and deployed a methodology to identify, capture and record information. This methodology is used in several BCP divisions including Fraud Prevention, Management and Human Resources Development, Legal Counsel and various units in the Operations area. We were thus able to capture 2,531 events in 2008.
In addition we proposed improvements to accounting book entries for risk of registered transactions, to provide a more transparent registration.
We expect our initiatives in 2008 will raise us to a level where we can identify and capture loss events occurring throughout our organization and thereby mitigate future occurrences. This however should go hand in hand with a number of accounting line items in the Profit and Loss Statement to register those events and thus permit to have a clear appreciation of operations risk.
All such initiatives will allow us to successfully meet in the medium term the cash requirements to meet operations risks as established by NCA and thus later propose more advanced models to determine the capital requirements to hedge operation risks.
Implementation of controls (Business Continuity Process)To further strengthen its operation risk management models, BCP successfully put in place a Business Continuity discipline to properly manage BCP’s exposure to business interruptions by creating an adequate response capability to such contingencies.
Presently the bank can count on business continuity control that allow it to protect its main business processes in case of key critical interruptions, and supported by a formal managers organization that ensure BCP’s business continuity. However, it is perhaps even more important to discuss the process to manage this discipline as it allows permanently updating it and improving our ability to provide a timely response. A strengthened system was accomplished by putting in place the Business Continuity Process in line with general guidelines provided by British Standard 25999.
A permanent process is now in place to identify and address interruption risks (modules I and II of our management model) and a maintenance process (in modules III and IV). These functions ensure the effectiveness of the controls in place and the degree to which our personnel are trained to respond. They also ensure greater effectiveness and efficiency in managing near-misses (in module V). US consultant Protivity assisted in defining the methodology needed to properly use modules I and II, and reviewed the main components of module V, vis-à-vis the best international practices in this regard.
Counting on a true and tried model and also as we look forward, we believe the main challenges faced by this discipline will come from BCP’s constant evolution and changing conditions in the financial market. Thus the necessary capability to assimilate those changes should be the result of correct and rigorous enforcement of the business continuity model.
Operational Risk Management Model
Identification and evaluation of risksI. Quantification and
continuous monitoringIV.
Occurrences and events managementV.
Monitoring of implementationIII.Definition of
mitigation actionsII.

56

57Capitals and assets
Capitaland assets7

58
Capital marketCredibolsa remained as the
leader of the securities market
and the fixed income segment.
In addition, the best international
practices for cash management
were enforced.
Stock Market intermediationDespite Peru’s strong economic results in 2008, when GDP growth reached 9.8%, the U.S. home mortgage crisis and its impact in the financial system of the United States also influenced behaviors in Peruvian markets, further compounded by sliding base and precious metal quotations, all of which triggered the fall of Lima Stock Exchange (BVL) indicators and trading.
In 2008, the Lima Stock Exchange’s general index (IGBVL) fell 60%. Total trading reached US$ 4,963 million, a drop of almost 48%. Fixed Income and Report Operations at the BVL reached US$ 2,668 million, 13% less than the average volume for the same period the year before.
Credibolsa remained as the leader of the securities market and funneled share transactions worth US$ 981 million (19.76% of the trading total). Likewise in the fixed income segment it was involved in the purchase and sale of bonds and other instruments for a total US$ 852 million (59% of the traded total). Finally, it was involved in report operations worth US$ 67 million. Thus, the total traded volume reached US$ 1.9 billion.
In the fixed income primary market, our major placements exceeded S/. 1,480 million. Two outstanding transactions were a private offering by Cencosud’s, worth S/. 410 million, and a package of four private offerings by BCP totaling S/. 510 million. Issues in dollars totaled US$ 152 million. The most important were Credileasing, worth US$ 84 million, Ferreyros’ corporate bonds for US$ 33 million, and Palmas del Espino’s issue for US$ 17 million.
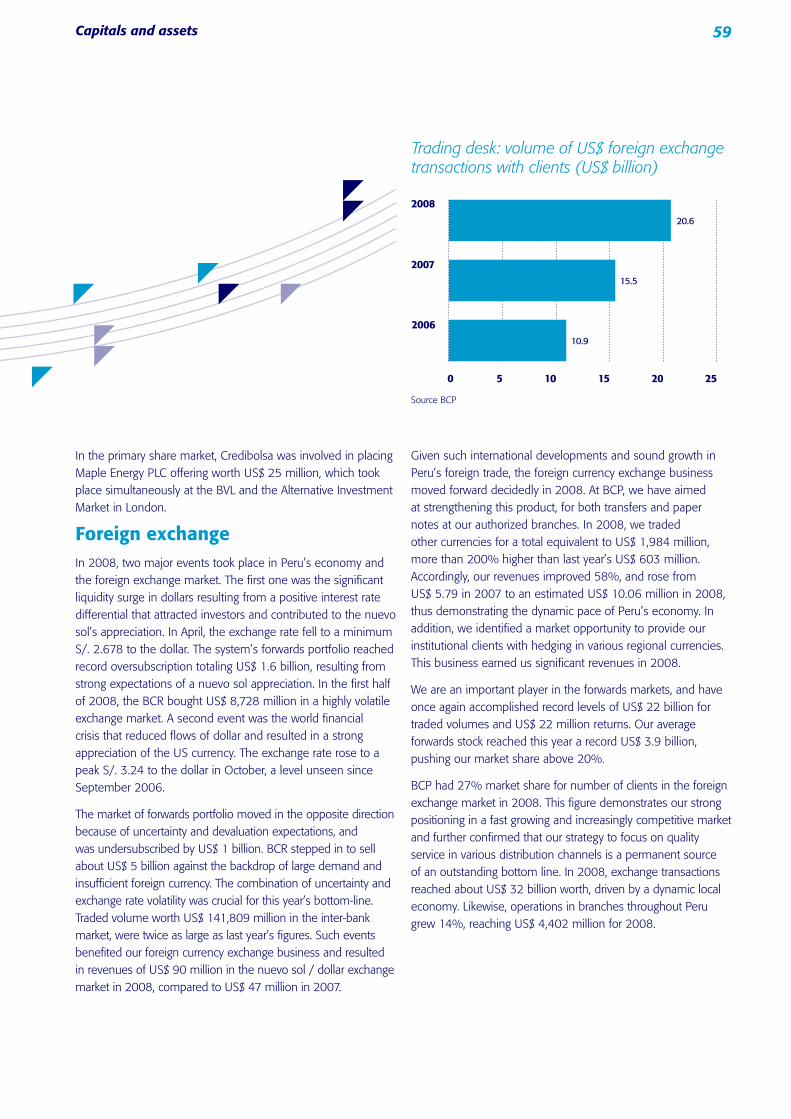
59Capitals and assets
In the primary share market, Credibolsa was involved in placing Maple Energy PLC offering worth US$ 25 million, which took place simultaneously at the BVL and the Alternative Investment Market in London.
Foreign exchangeIn 2008, two major events took place in Peru’s economy and the foreign exchange market. The first one was the significant liquidity surge in dollars resulting from a positive interest rate differential that attracted investors and contributed to the nuevo sol’s appreciation. In April, the exchange rate fell to a minimum S/. 2.678 to the dollar. The system’s forwards portfolio reached record oversubscription totaling US$ 1.6 billion, resulting from strong expectations of a nuevo sol appreciation. In the first half of 2008, the BCR bought US$ 8,728 million in a highly volatile exchange market. A second event was the world financial crisis that reduced flows of dollar and resulted in a strong appreciation of the US currency. The exchange rate rose to a peak S/. 3.24 to the dollar in October, a level unseen since September 2006.
The market of forwards portfolio moved in the opposite direction because of uncertainty and devaluation expectations, and was undersubscribed by US$ 1 billion. BCR stepped in to sell about US$ 5 billion against the backdrop of large demand and insufficient foreign currency. The combination of uncertainty and exchange rate volatility was crucial for this year’s bottom-line. Traded volume worth US$ 141,809 million in the inter-bank market, were twice as large as last year’s figures. Such events benefited our foreign currency exchange business and resulted in revenues of US$ 90 million in the nuevo sol / dollar exchange market in 2008, compared to US$ 47 million in 2007.
Given such international developments and sound growth in Peru’s foreign trade, the foreign currency exchange business moved forward decidedly in 2008. At BCP, we have aimed at strengthening this product, for both transfers and paper notes at our authorized branches. In 2008, we traded other currencies for a total equivalent to US$ 1,984 million, more than 200% higher than last year’s US$ 603 million. Accordingly, our revenues improved 58%, and rose from US$ 5.79 in 2007 to an estimated US$ 10.06 million in 2008, thus demonstrating the dynamic pace of Peru’s economy. In addition, we identified a market opportunity to provide our institutional clients with hedging in various regional currencies. This business earned us significant revenues in 2008.
We are an important player in the forwards markets, and have once again accomplished record levels of US$ 22 billion for traded volumes and US$ 22 million returns. Our average forwards stock reached this year a record US$ 3.9 billion, pushing our market share above 20%.
BCP had 27% market share for number of clients in the foreign exchange market in 2008. This figure demonstrates our strong positioning in a fast growing and increasingly competitive market and further confirmed that our strategy to focus on quality service in various distribution channels is a permanent source of an outstanding bottom line. In 2008, exchange transactions reached about US$ 32 billion worth, driven by a dynamic local economy. Likewise, operations in branches throughout Peru grew 14%, reaching US$ 4,402 million for 2008.
Trading desk: volume of US$ foreign exchange transactions with clients (US$ billion)
Source BCP
2006
2007
2008
20150 105
20.6
25
15.5
10.9

60
BCP’s competitiveness in the Distribution Desk and the livelier pace of Peru’s economy led us to dramatically exceed our annual volume growth targets in various business lines.
Growth in the SPOT market exceeded by more than 30% 2007’s figures while in the market for forwards and other currencies, expected growth should exceed 2007 figures by over 180%.
A troubled scenario is expected in 2009 as a consequence of the international financial crisis. However, we are persuaded we will reach our goals thanks to:
A professional team in the Distribution Desk that provides appropriate advice to our clients about our various products
Innovation in creating structured products.
The strengths of BCP’s Wholesale Banking marketing through which we can reach the main companies in the local market.
BCP’s branch network, that helps us further our Retail Banking business.
TreasurySince 2007, BCP has adhered to the best international cash management practices. Accordingly, our Assets and Liabilities Management Service became a business unit and given an annual revenue goal.
This change made the Assets and Liabilities Management Service (ALM) responsible for managing BCP’s balance sheet, under ALCO oversight, and for accepting reasonable interest rate and liquidity risks through management of the short and long term transfer rates, thus contributing to preserve our leadership in market share for loans, deposits, investments and currency forwards.
Rate, liquidity and fund concentration risk policies and limits are approved by the Risk Committee and reviewed every month by ALCO, to which the Assets and Liabilities Management Service proposes balance positioning strategies.
In 2008, an active ALM business management created revenues for BCP of US$ 27.6 million. Our ALM strategy includes an active involvement in the inter-bank market, where we were the first place in trade volumes during 2008. Likewise, we were market makers for Limabor, with operations at 30 days in local currency. We have held the highest share of the system since this market was created (31%) with a total S/. 500 million worth of trades.
In 2008, financial and economic indicator shifts, both locally and abroad, altered ALM’s evolution. On the local currency side, inflation led the Central Bank to increase its reference rate from 5.25% to 6.50%, thus hurting short term rates and impairing the local currency’s perception.
Trading desk: volume of other foreign exchange transactions with clients (US$ million)
2006
2007
2008
1,2009000 600300
1,363
1,500
442
247
Trading desk: volume of forwards with clients (US$ million)
Source BCP Source BCP
2006
2007
2008
8006000 400200
878
1000
276
132

61Capitals and assets
On the foreign currency side, the interbank rate fell 475 bps from 5.57% to 1.17% on average, because of liquidity created by maturities of purchase forward transactions, with foreign investors becoming the largest buyers of that currency. Likewise, a falling marginal legal reserve rate, from 49% to 39%, injected liquidity into the banking system.
In 2008, loans grew significantly surpassing the surge of deposits. The capitals market and foreign banks contributed to finance bank operations. Short term bank funding for foreign banks was used in foreign trade and working capital transactions. In addition, in March 2008, BCP received a syndicated loan from 17 banks totaling US$ 410 million, to fund medium run operations.
In September and December 2008, BCP placed two tranches of securitized notes worth US$ 150 million each, despite the unprecedented financial crisis. Issues in the local market totaled S/. 510 million.
Towards the end of 2008, a deepening international crisis dried up the capitals market and compromised the continuity of funding in both dollars and nuevos soles.
InvestmentsInvestments in 2008 targeted principally nuevos soles-denominated instruments, making BCP’s cash management the country’s largest investor for this type of instrument. Investments exceeded S/. 10 billion, on average, principally in BCR Certificates of Deposit. To November BCP held a 49% share of certificates of deposit held in the local banking system and 57.4% of the total issued by Central Bank. In addition, we were actively involved in the successful Market Makers program for sovereign bonds. In this a secondary market platform, where local and foreign investors trade BCR Certificates of Deposits and government bonds, we ranked second by volume of trading to December 2008. Also, this year we engaged on behalf of our customers in sovereign debt transactions worth S/. 11,334 million, thus also evidencing our leadership in this market.

62
The mutual funds market has been impaired by the global financial crisis, which created significant losses in funds under management. To December 2008, this industry managed wealth worth US$ 2,817 million (US$ 1,515 million less than in 2007), for 202,287 participants (72,839 less than in 2007). The -34.98% shift by volume and -26.47% drop in number of participants compared to a year earlier is mainly accounted for the impact of the world crisis and the greater volatility of the value of contributions to these funds.
From the viewpoint of business management, Credifondo preserved its position as industry leader with funds worth US$ 1,274 million under management (US$ 681 million less than in 2007), for 78,497 participants (35,843 less than in 2007). Credifondo also increased its market share from 45.1% to 45.2% by volume of funds under management, while the number of participants compared to a year earlier shifted from 41.6% to 38.8%.
Such accomplishments were the result of efficient fund distribution based on the principle of providing advice to investment customers in Lima and the provinces, both at the time of signing (using a state of the art client profiler throughout the bank’s network) and also subsequently (through conferencing nationwide). This has accomplished our goal of teaching our customers to make responsible investment decisions suitable to their investment profile.
Another contributing success factor was having the clearest and most comprehensive offering of the entire industry. Credifondo launched twelve new funds (while the industry as a whole launched 10). For the mixed revenue fund segment in nuevos soles we now provide the clearest and most comprehensive offering while fully reflecting risk profiles determined by the National Insurance and Securities Commission (CONASEV).
Asset managementCredifondo has kept its leadership
through an efficient fund
allocation process based on the
concept of advising our clients and
as a consequence of redefining
our investment strategy.

63Capitals and assets
From the point of view of investment management, Credifondo chose to redefine its investment strategy for the portfolios it manages, to reduce the impacts of international volatility. For conservative profile funds, a choice was made to improve diversification, reduce investment terms, and preserve such investments in their own currencies, thus achieving more stable returns and mitigating the likelihood of incurring losses. For the moderate, balanced, growth, and aggressive funds, a decision was made to guide investments to less volatile sectors. These strategies resulted in funds closing this year as the top or second-ranked funds in terms of yields, in each of their corresponding segments. It is worthwhile underscoring such positioning in yield rankings is in line with our own goals, and which we have consistently accomplished for four running years.
In 2009, Credifondo will rise to the challenge of increasing its market share, and to do so our crucial investment strategies will focus on two main areas.
a. Repositioning short term mutual funds as no-volatility funds, to retain and/or recover participants hurt by volatility in recent months.
b. Preserve our leadership as advisors through ongoing training for internal customers (office managers, business officials, loan and service officials) and ii) conferences for external clients nationwide.
Source CONASEV
Mutual Funds: Funds under management, 1999 - 2008 (US$ million)
Dec
99
Dec
00
Dec
01
Dec
02
Dec
03
Dec
04
Dec
05
Dec
06
Dec
07
Dec
08
Mutual Funds: Number of affiliates
Source CONASEV
Dec 99
Dec 00
Dec 01
Dec 02
Dec 03
Dec 04
Dec 05
Dec 06
Dec 07
Dec 08
495
2,817
4,332
2,581
1,9971,7672,007
1,5031,155
435
5,000
4,0003,5003,000
5001,0001,5002,0002,500
0
4,500
0
50,0
00
100,
000
150,
000
200,
000
250,
000
300,
000
202,287
275,126
167,522
115,447
82,463
66,653
13,043
16,985
40,984
55,178

64
Systems, Organization and Human Development 8

65Systems, Organization and Human Development

66
Systems and Organization Process redesign and aligning
our systems to the technological
architecture were some of the
main processes we undertook
in 2008.
Executed 2008Expenditure 2008
Source BCP
Depreciation and amortization
Printing
Communications
Maintenance and licenses
Operation
Core
Tactical
Subsistence
Expenditure of Systems Expenses 2008 (US$ million)
24.922.9
3.84.4
10.510.8
21.9 25.1
17.916.0
5.05.4
6.66.220.0 18.8
79.0 79.2
8.4 7.2
99.097.9

67Systems, Organization and Human Development
Expenses and investments In 2008, IT expenditure totaled US$ 97.9 million, of which US$ 79.2 million were spent in recurring items and US$ 18.8 million went to several projects. Total investments reached US$ 60.9 million of which US$ 16.6 million were for tactical projects, US$ 27.5 million for core processes and US$ 16.8 million for continuance projects.
Main projectsA new project started in 2008 to redesign the sales and service staff positions and thus help us meet our strategic objectives. This project is part of the initiative to redesign BCP offices and strengthen interactions among all staff within one single system, optimize work processes and improve customer care.
To further pursue our objective of increasing Retail Banking loans, in 2008 we expanded the Credit Integrated Module (MIC is the Spanish acronym) to embrace also consumer loans. Since 2007 this system has provided customers instant reply to credit card applications, and the approved credit line, if accepted. We will also start using this system for mortgage loan screening starting in March 2009, to give customers point of contact response.
In 2008, we continued to align our systems to the technological architecture by building and implementing shared services.
Finally, this year we introduced SAP’s human resources and procurement modules and in the first quarter of 2009 we will start introducing the accounting module. Also at that time, SAP will be implemented at our subsidiaries PPS, Prima and BCP Bolivia. Three major projects have been included. The first one is the collections management system for retail banking products. It will allow a more efficient management of collections in 2009, a year when we will face numerous challenges. The second completed project is the Telecredito system that will allow BCP client companies to carry out their transactions from a robust, modern and friendlier platform. Migration of clients to this new system will take place throughout 2009. The third project is a new system to manage clients’ applications and complaints.
Finally, in 2008 we made significant progress to comply with the guidelines of the Basel II New Capital Agreement. Results will become evident in the next two years.

68
ECO ProgramAs part of Our Excellence in Continuous Operations (ECO program) at the end of 2008, we opened the new IT center at La Molina headquarter, after having refurbished the mirror computer center located in the principal office in downtown Lima to minimize the risk of service interruption during the transfer of information. Likewise, we completed the architecture and general design of the new computer center that we will build in Chorrillos and which will replace the downtown Lima facility. Once these two new IT centers are mirrored and interconnected, we will be able to back up any incidents at either of them without suffering any service interruptions. Using the most recent techniques and methodologies to avail ourselves with highly efficient, reliable and redundant facilities will allow us providing the bank’s technology-based services to our clients with the utmost quality and without interruptions.
In addition, in 2008 we completed the architecture and detailed design of the contingency IT center that will allow us to face any major incidents occurring in Lima.
MAS ProgramIn its constant search for and introduction of the best world practices for its management model, BCP has devised the Improving IT Actions program (“Mejorando la Acción de Sistemas” MAS is the Spanish acronym).
Through MAS we expect to enhance our competitiveness and simplify our financial services to accomplish tangible and sustainable improvements in quality and time to market.
To integrate these efforts, we have created within our department the new MAS area that started operating on October 15, 2008. This area is advised by a renowned consultancy, a Steering Committee and an MAS Executive Committee involving BCP’S main management departments.
As a result of the work plan, we expect to conclude the new operational model’s definition phase towards year-end 2008 to start implementing the plan in 2009.

69Systems, Organization and Human Development
Management and Human DevelopmentKnowledge management and
the review and redesigns of
the training programs allowed
increasing efficiencies and
becoming more effective in 2008.
In 2008, the Human Resources Management and Development Division introduced a number of structural changes as a response to the strategic plan prepared with support of the Hay Group. Accordingly, we will continue meeting the needs of our internal clients through better aligned and more efficient projects.
How many are we?
Number of employees* 14,258
Number of positions 11,131
% women 55
% men 45
* Excluding subsidiaries
Source: Information management unit
Work climate The commitment and motivation of our workers are part of our strategic objectives and, given our interest in measuring our employees’ satisfaction at work, in 2008 we carried out a work climate survey, as we do every other year. The survey obtained a 69% response from our workers who showed 72% satisfaction. The survey was carried out with support from the Hay Group.
Work enviroment survey results (%)
Unsatisfactory
Source BCP - Human resources division
Neutral Satisfactory
Generalaverage
Corporateprocess
Commitment
Companygeneral style
Businessmanagement
0% 20% 40% 60% 80% 100%
11%
15%
13%
6%
17%
11%
20%
18%
15%
72%
83%
65%
69%
79%
6%

70
LeadershipTo further promote leadership in our organization, we continued providing a coaching program to our management staff and approved the BCP Leaders’ Performance Model that will come into effect in January 2009 with support from the Center of Creative Leadership (CCL).
Communications As a reaction to our survey on internal communications we redesigned some of its features to better fit our organization’s and target audiences’ needs. Additionally, we designed new media aimed at meeting our service staff’s information needs.
Finally, a media audit measured their efficiency and our workers’ appreciation of those media.
Screening and trainingIn 2008, BCP’s personnel grew significantly, basically as a response to needs of our growing bank network nationwide. Undoubtedly, this evolution had an impact on our recruitment, screening, hiring and training processes, all of which posed a major challenge for the Human Management and Development division.
We started a recruitment campaign to attract young people who want to pursue a professional career line at BCP. In the field of training, we are currently identifying virtual tools that will allow us to provide training programs in a timely and efficient manner.
The review and redesign of our education programs was, and still is, a fundamental task to improve their effectiveness and efficiency. A distinctive feature of our efforts was to identify and adopt best practices from other first line banks. These new
elements include virtual testing, business games, tutoring, on the job modules and new evaluation models.
Knowledge management at BCP has been the fundamental driver of staff and management’s involvement in our employees’ training. An in-house trainers’ program, refresher courses on presentation skills and case study design workshops have contributed to strengthen this work line. Over 70% of in-house training programs were prepared by officials and managers to be taught to the new employees, thus ensuring experience and acquired knowledge will be properly passed forward.
Simultaneously, we continued our program to sign agreements with renowned schools and learning institutes in Peru and abroad, including ESAN, USIL, IAE and EADA, to open a range of interesting and convenient professional development options to our employees.
In 2008 we built a leadership development model that will provide consistency, continuity, and quality to BCP’s leader training efforts. This model was built with support of renowned international consultants and will guide leadership training in coming years, linked to other critical issues such as key position profiling, performance-driven management, competency-driven management and talent management.
Talent managementBCP continued pursuing efforts to lure Peruvian talent to our organization through the MBA Talent Event in 2008. This event aims at establishing contacts with Peruvian professionals who have concluded or are about to obtain their MBAs at the best world organizations.

71Systems, Organization and Human Development
In addition, we prepared a retention program including economic retention strategies and personnel development for our key cadres. Simultaneously, and to promote BCP workers professional development, we used performance criteria to open opportunities for some of our workers to migrate from a fixed term to an open-ended work contract.
In addition, we have continued promoting talent development through the High Specialization Fund (FAE is the Spanish acronym) that provides financing for further education at convenient rates to employees with a management potential.
Competency-driven managementIn the second stage of the BCP’s Competency Driven Management Project we defined the competency models for the profiles in most demand in Corporate and Middle Market Banking, and the Commercial Division. This will help us direct our search for critical management behavior patterns needed to accomplish our corporate goals. We also held other training workshops on competency-driven screening for management-level departments involved in personnel hiring, and also for our hiring consultancy.
Integrated Human Resources SystemTo further integration and stability of administrative processes, in 2008 we concluded the first stage of our Human Resources ERP-SAP. Initial applications are already available.
BCP volunteersOur workers’ interest in getting involved in community outreach initiatives reflects our organization’s culture and our workers’ values. Since 2005, our volunteers program has engaged in community outreach projects through its committees in Lima and the interior, and has recruited a growing number of BCP employees committed to the enhancing the well-being of Peruvian underprivileged children.
In 2008, we continued involving our workers in the volunteer program initiatives, both in Lima (three activities) and in the provinces (seven activities completed).
Benefits To enhance our workers’ satisfaction and commitment, in 2008 we furthered our efforts to make available a range of financial, health, leisure and other benefits, and aimed at making them available also to direct family members (spouses, children and parents), to the extent possible. This is a way in which we try to more closely address our workers’ needs within and outside our organization.
ErgonomicsIncluded in our commitment to reduce occupational risk at work in our organization, in 2008 we continued building a culture of ergonomics, including initiatives like defining ergonomic criteria, purchasing ergonomic-designed furniture and equipment, and providing training and information about this topic to all our workers. In this way we expect to create an appropriate working environment and enhance the quality of life at work.

72
Banco deCrédito BCP Bolivia
9

73Banco de Crédito BCP Bolivia

74
BCP Bolivia reported a higher performance than the year before and above the Bolivian bank system’s average.
Bolivia’s GDP growth rate reached 6.0% in 2008, its best performance in recent years, driven mainly by progress in mining, hydrocarbons and manufacturing. The first two industries benefited particularly from international conditions. In addition, for the third running year, the government ran a non-financial balance overall surplus, estimated at 5.2% in 2008, compared to 1.7% in 2007.
Exports exceeded US$ 6,836 million in 2008, driven by larger international sales of minerals (43.7% higher than 2007), hydrocarbons (53.3% higher than 2007) and non-traditional products (25.9% higher than 2007). The increased value of mineral exports is accounted for by larger exports by Empresa San Cristóbal and tin sales by Empresa Metalúrgica Vinto. The growth of exports value is accounted for by international conditions (prices increasing) resulting, at the same time, in a higher export volume.
Imports grew in 44.3%, driven by larger disposable income, a lively domestic economy, advantageous terms of trade and remittances from abroad.
Also in recent months, total inflation was reasonable, but still in the double-digit rate, accounted for by lower imported inflation and dampened expectations of continued price increases. However, a lively aggregated domestic demand is still pushing prices up. In 2008, inflation reached 11.85%, exceeding the Central Bank’s targets.
The sustained appreciation of the Bolivian national currency (9.01% in 2008) was an answer to external inflation pressures. Thus, net foreign currency reserves increased considerably, which grew 45.17% to US$ 7.7 billion, compared to a year earlier.
The share of local currency deposits and UFV, compared to total deposits in the financial system, increased 10.5% in the 12 months to date, to reach 46.9% of all deposits (36.4% in December 2007). The portfolio indicator reached 31.59% in 2008 (compared to 19.4% in December 2007).
The system’s past due rate fell from 5.6% in 2007 to 4.3% in 2008, the sixth year of uninterrupted improvement. The global banking’s system net management bottom line reached US$ 124.8 million.
GDP growth in Bolivia (Annual % change)
Source INE
6
7
5
4
3
0
2002 2003 2004 2005 2006 2007 2008
2.5 2.7
4.64.8
6.0
4.2 4.4
2
1
Inflation and apreciation in Bolivia (%)
Source INE
Inflation Apreciation
15
10
5
-5
-10
-15
0
2002 2003 2004 2005 2006 20082007
4.9
0.6
11.7
4.5
11.9
9.0
3.9
-4.5
-9.8
2.5 4.6
-2.8
4.9
-0.2

75Banco de Crédito BCP Bolivia
ResultsA favorable macroeconomic environment had a positive impact in the Bolivian financial industry, with increases in the banking industry’s portfolio and number of loans. Also worthy of note is the improved quality of the portfolio where past due rates are under control and provisioning exceeds 100%.
BCP Bolivia holds one of the healthiest and best provisioned portfolios in the entire system, which combined with strong international backing, makes it one of the leading organizations in the Bolivian financial system.
BCP Bolivia reported cumulative IFRS US$ 44.5 million earnings reflecting 64.5% growth year over year (from US$ 27 million). Such remarkable results reveal the strong performance of high return segments, such as consolidated markets which grew 77.2%, and the SME segment that expanded its portfolio stock by 42.7%, thereby increasing diversification and fueling growth of the retail banking portfolio above last year’s.
Likewise, the larger number of loans and customers led to a wider financial spread, resulting in US$ 52.5 million earnings, 36% higher than a year earlier. BCP Bolivia has a 13.1% market share for loans and 13.3% for deposits, and ranks as the third largest bank for loans and also the third for deposits of the entire Bolivian banking system.
BCP Bolivia’s portfolio grew 2.8%, to US$ 472.6 million, mostly accounted for by 17.8% growth in Retail Banking. Meanwhile Wholesale Banking contracted slightly by 9.6%. Liabilities grew 15.5% to US$ 754.5 million.
BCP Bolivia has continued to expand its share of certain strategic products, and managed to expand its banking network to 64 facilities nationwide. The BCP Agents’ branchless banking network has opened a total 92 windows while penetration of still underserved audiences continued to increase.
By introducing innovative products in the local markets, BCP Bolivia has strengthened its market positioning and recognition as a safe, high-quality service organization. As a result it increased its non-financial revenues, which grew 69.4% year over year to US$ 47.5 million.
These larger earnings are distributed as fees for banking services (US$ 22.2 million), net earnings from exchange transactions (US$ 17.8 million) and other earnings (US$ 7.5 million). Non-financial revenues accounted for 47.8% of total income.

76
The significant growth of BCP Bolivia’s operations also reflects the value attached to our organization’s prudent portfolio management. The past due ratio was 2.0% while the provisioning ratio reached 230.6 % (compared to 144.3% for the Bolivian banking system). Normal rated portfolio loans (Class A) were 95.5% of the total portfolio, while the non-performing portfolio (Classes G and H) reached 1.8%.
The IFRS ROE reached 53.4% (39.9% under Local Standards), above that of 2007 (35.6% under Local Standards) and higher than the system’s (20.7% under Local Standards). So, BCP Bolivia has strengthened its positioning as a leading financial organization in the Bolivian banking system.
AcknowledgementsPaul HarrisThe Chuquiago Marka Rotary Club acknowledged BCP Bolivia for its corporate social responsibility initiatives, reflecting a sustainable effort over time to reach thousands of persons, including customers, company workers and the community at large, in an effort to create an increasingly fair and equitable Bolivian society.
Global FinanceFor the third consecutive time, US trade journal Global Finance chose BCP Bolivia as Bolivia’s best bank in its Best Emerging Market Bank annual survey.
For 15 years already, this journal has prepared this report based on a quantitative and qualitative analysis drawing on interviews with market observers and bankers, in addition to the corresponding financial review
Winners are chosen regardless of their size or age on the local markets. Most important is their ability to do business with corporations, individual customers and other financial organizations globally.
Euromoney Euromoney, an English publication specializing in financial markets and international business chose BCP Bolivia as the nation’s best bank for the third time running in its Annual Excellence Award 2008.

77Banco de Crédito BCP Bolivia
Euromoney is published monthly by Euromoney Institutional Investor PLC and the award is delivered after examining the organization’s management of financial risk exposure.
World Trade ChamberThe World Trade Chamber awarded BCP Bolivia, together with other Bolivian companies, its prize for corporate excellency in the bank management category for 2008.
A worldwide business organization, the World Trade Chamber aims at serving its members and promoting companies that have reached international acknowledgement.
Among its objectives, the World Trade Chamber identifies the best companies in each country through its Screening, Verification and Evaluation Commission, charged with performing a detailed and careful review.
The Bizz AwardsThe World Confederation of Businesses gave BCP Bolivia its Bizz Awards as one the best financial services companies in Bolivia this year of 2008.
The BankerBCP Bolivia was recognized us as Bolivia`s Best Bank of 2008 by The Banker, a renowned publication in financial world which provide deep information about global, regional and local financial systems. This publication provides a ranking of 1,000 top banks in the world.
Board of Directors and ManagementBoard of DirectorsDionisio Romero Seminario Chairman
Raimundo Morales Dasso Vice chairman
Reynaldo Llosa Barber Director
Fernando Fort Marie Director
Juan Verme Giannoni Director
Benedicto Cigüeñas Guevara Director
Walter Bayly Llona Director
Management Diego Cavero Belaunde General Manager

78

79 Corporate governance and social responsibility
Corporate governance and social responsibility
10

80
Our 120 years of existence have persuaded us strong corporate governance is and will continue to be a substantial component of corporate operations, to ensure an atmosphere of credibility ad transparency.
It is indispensable for BCP to enforce good corporate governance and social responsibility policies. To accomplish this objective, we have gathered our own guidelines in the corporate internal regulations and prepare an annual corporate Governance and Social Responsibility Report (www.viabcp.com).
Following our principles to ensure transparency and build confidence to create value, we decided to retain PricewaterhouseCoopers’s services to perform an independent and objective evaluation of the measure to which BCP enforces its principles and sound corporate governance policies. The results of this consultancy will allow us to identify areas ripe for improvement, in view of the 26 principles of good corporate governance disseminated by Peruvian organizations, such as the National Insurance and Securities Commission – CONASEV- and the BVL, and international practices adopted by organizations like the Andean Development Corporation (CAF is the Spanish acronym) and OECD.
Corporate governanceOur robust corporate
governance practices have laid
the foundations for successful
management in a highly
competitive global economic
environment.
81 Corporate governance and social responsibility
Board and internal administrationTo comply with our mandate and responsibilities, BCP’s Board of Directors includes several special committees that contribute to enhanced bank management.
Audit Committee
Risk Management Committee
Credit Committee
Operations Risk Committee
Assets and Liabilities Management Committee (ALCO)
Productivity Committee
IT Governance Committee
For ten years already, BCP has put in place asset laundering and terrorism financing prevention systems.
The Inspections area’s mission is to manage crisis resulting from fraud crimes and adopt corrective actions to protect BCP’s assets.
To enhance prevention and control improvement initiatives by the Inspections area, our organization retains dishonesty and/or professional malpractice insurance policies.
Customer relationsWe are aware of the importance of establishing good relations with our customers, with the purpose of obtaining their loyalty.
To better recognize and measure our customers’ satisfaction, BCP conducts customer general satisfaction surveys for the various business segments or banking businesses; carries out customer loyalty surveys; compiles a perceived value indicator; evaluates general quality, and prepares a customer loyalty indicator.
In view of increasing and new types of fraud against the banking system, we continue expanding the scope of prevention initiatives that involve clients and help them become aware of security as a team effort.

82
Moreover, BCP listens to customer complaints at both its front and back offices. These complaints are acknowledged through the Electronic Complaints and Requests System (FERS is the Spanish acronym).
Relationship with our shareholdersAt BCP, we hold the principle that equitable treatment of all shareholders, including minority and foreign stockholders, is fundamental to align their interests and those of the various areas of management.
Relations with our teamBCP’s most value asset includes its workers, to whom we give all our attention and support, so they can grow professionally and personally, in addition to other benefits and assistance. This fills us with deep satisfaction.
Relationship with our suppliersSuppliers are a fundamental component of resource management at BCP. This leads us to choose not just the best suppliers but also to engage in ongoing feedback with them.

83 Corporate governance and social responsibility
Social responsibilityCorporate social responsibility
contributes to our organization’s
sustainability by incorporating
our interest in Peru’s and
Peruvians’ development in our
organization’s operations.
As a good corporate citizen, BCP has directed its Corporate Social Responsibility Policy to accomplish quantifiable and sustainable objectives over time, for the benefit of the community at large.
The four pillars on which we enforce BCP’s Social Responsibility Policy are as follows. Education and Sports, focusing on children and young people as the makers of their own destinies. Our Social Well Being Policy promotes solidarity with the most vulnerable members of our community. Cultural development helps to strengthen national identity and Business Development allows underscoring and recognizing the efforts of Peru’s firms and improving their competitiveness.
Our commitment is to work harder and through our hard work contribute to our community’s prosperity. Along that line, BCP has undertaken the initiatives described below:
Mathematics for all (Matemáticas para todos – MTT – are the Spanish name and acronym, respectively)
A program underway since 2002 in coordination with Apoyo Institute to increase numeric skills of students from 5th grade primary to senior high school.
596 schools participating in the MPT program
More than 450,000 school beneficiaries
Present in 20 regions across Peru.
Figures as of December 31, 2008.Source: Instituto Apoyo.

84
Sports platforms
We have supported the building of alternative recreational areas where children and young people in Lima and provincial underprivileged towns and districts can engage in various sports disciplines.
Volleyball and Field and Track
For 20 years already, our bank has been involved in organizing sports tournaments. These competions have become a cradle of Peruvian sports stars that have eventually represented Peru in the international sports scene.
Pilot 20 Card (Tarjeta Piloto20)
Piloto20 is Peru’s first educational card and was awarded the 2008 award given by the National Association of Advertising Announcers (ANDA) in the social responsibility excellence category.
329,087 registered school students nationwide
10,537 registered teachers nationwide
9,430,368 tests
167,814,723 web page hits
10 participating schools
8 departments reached
3,395 school children beneficiaries
95,416 web page hits
Business Classroom (Aula Empresa)
The Aula Empresa program was launched by BCP, together with Instituto Apoyo and Fe y Alegría schools to awake the entrepreneurial spirit of young Peruvians.
Figures as of December 28, 2008 Source: Apoyo Virtual.
19,648 athletes from the provinces joined in 2008
13 host cities nationwide
80 sports platforms
230 multi-sports courts
Figures as of December 31, 2008 Source: Instituto Apoyo.
From 1988 to December 2008 Source: Comisión Organizadora “Semilleros del Perú”.
From 1988 to December 2008.

85 Corporate governance and social responsibility
Banco de Crédito BCP Bolivia
Our principles of sound corporate governance are sustained by an organizational culture based on strong ethical and moral behaviour and organized around a policy of transparency.
To put into practice our social responsibility principles, we have organized 13 social programs focusing on our interest groups; i.e. our customers, clients and the community at large.
Signing of the United Nations World Compact Adopting a business social responsibility-based management model was part of the commitment we made to United Nations Organization’s World Compact. We adopted and included in our strategy and corporation, ten behavior and action principles in the field of human rights, labor, the environment and the struggle against corruption.

86
Financial Statements 2008
11

87Financial Statements 2008
88
Banco de Crédito del Perú and subsidiaries
Consolidated Financial Statements as
of December 31, 2008 and 2007 together
with Report of Independent Auditors.

89Financial Statements 2008
Consolideted Financial Statements as of December 31, 2008 and 2007
Consolidated Pro forma balance sheets - Unaudited
Consolidated Pro forma incme statements - Unaudited
Supplementary exhibits to the Pro forma information – Unaudited
Independent auditor’s report
Consolidated balance sheets
Consolidated statements of income
Consolidated statements of changes in shareholders’ equity
Consolidated statements of cash flows
Notes to the consolidated financial statements
Financial Statements IFRS (International Financial Reporting Standards) (Pro Forma – Unaudited)

90


92
As of December 31, 2008 and 2007 Note 2008 2007
S/(000) S/(000)
Assets
Cash and due from banks:
Cash and clearing
Deposits in Peruvian Central Bank
Deposits in local and foreign banks
Accrued interest on cash and due from banks
4
1,962,928
6,132,268
2,890,521
7,480
1,640,603
5,388,548
1,356,262
14,461
10,993,197 8,399,874
Interbank funds
Trading, available-for-sale and held-to-maturity investments, net
Loans, net
Permanent investments, net
Property, furniture and equipment, net
Other assets, net:
Financial instruments at fair value through profit and loss
Other, net
5
6
7
8
9
9
90,123
9,532,750
32,047,997
158,285
843,336
620,472
1,209,000
14,982
8,938,054
23,899,174
105,232
676,766
753,139
926,521
Total assets 55,495,160 43,713,742
Off-balance sheet accounts
Contingent operations
Other
18
20,425,840
254,182,743
16,218,719
165,883,022
Total 274,608,583 182,101,741
Consolidated balance sheets
The accompanying notes are an integral part of these consolidated balance sheets.
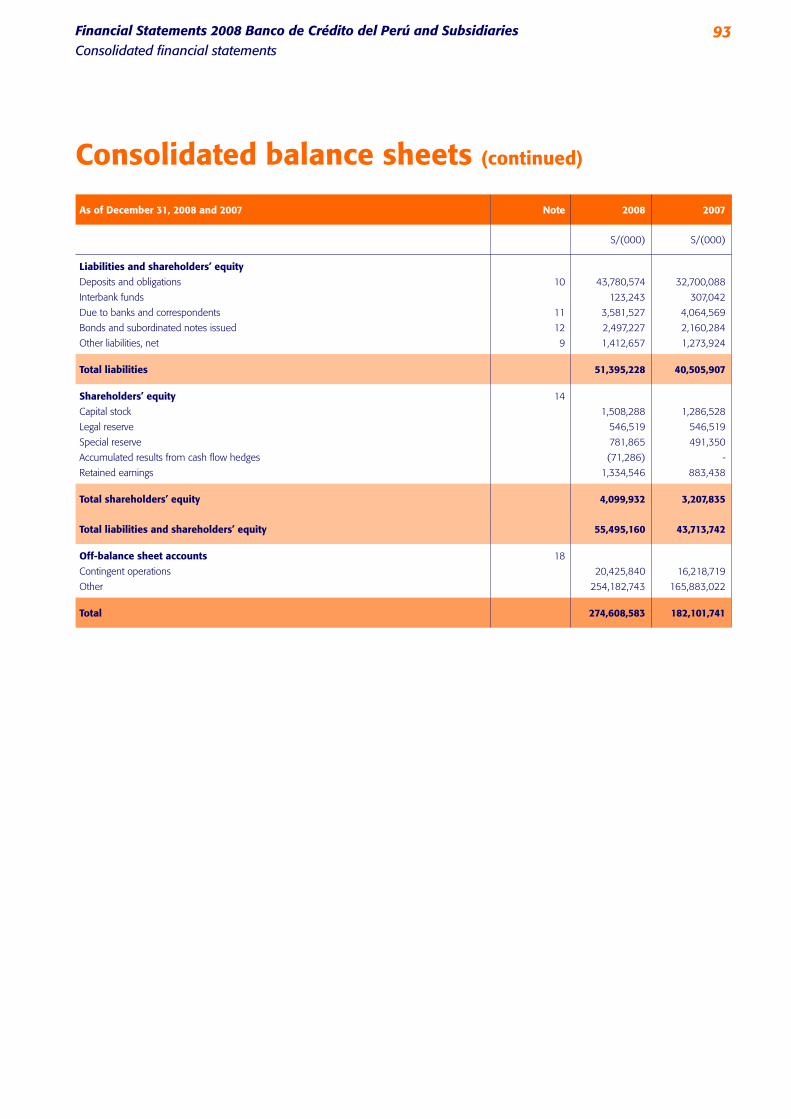
93Financial Statements 2008 Banco de Crédito del Perú and SubsidiariesConsolidated financial statements
As of December 31, 2008 and 2007 Note 2008 2007
S/(000) S/(000)
Liabilities and shareholders’ equity
Deposits and obligations
Interbank funds
Due to banks and correspondents
Bonds and subordinated notes issued
Other liabilities, net
10
11
12
9
43,780,574
123,243
3,581,527
2,497,227
1,412,657
32,700,088
307,042
4,064,569
2,160,284
1,273,924
Total liabilities 51,395,228 40,505,907
Shareholders’ equity
Capital stock
Legal reserve
Special reserve
Accumulated results from cash flow hedges
Retained earnings
14
1,508,288
546,519
781,865
(71,286)
1,334,546
1,286,528
546,519
491,350
-
883,438
Total shareholders’ equity 4,099,932 3,207,835
Total liabilities and shareholders’ equity 55,495,160 43,713,742
Off-balance sheet accounts
Contingent operations
Other
18
20,425,840
254,182,743
16,218,719
165,883,022
Total 274,608,583 182,101,741
Consolidated balance sheets (continued)

94
For the years ended
December 31, 2008, 2007 and 2006
Note 2008 2007 2006
S/(000) S/(000) S/(000)
Financial income and expenses
Financial income
Financial expenses
19
19
3,855,812
(1,692,166)
2,883,881
(1,138,649)
2,250,418
(810,418)
Gross financial margin 2,163,646 1,745,232 1,440,000
Provision for loan losses, net
Gain (loss) for exchange difference
20 (272,463)
1,891,183
49,435
(185,142)
1,560,090
(38,932)
(147,532)
1,292,468
(77,105)
Net financial margin 1,940,618 1,521,158 1,215,363
Non - financial income
Commissions from banking services, net
Net gain on securities
Net gain on foreign exchange transactions
Other non - financial income
21
22
23
990,698
74,955
324,420
234,586
883,586
57,526
184,667
364,138
755,002
25,087
136,559
222,015
1,624,659 1,489,917 1,138,663
Operating expenses
Salaries and employees’ benefits
Administrative expenses
Depreciation and amortization
Provision for seized assets
Taxes and contributions
Goodwill amortization
Other operating expenses
24
8(a) y 9(e)
9(g)
23
(831,247)
(622,785)
(137,827)
(7,343)
(61,197)
(980)
(230,220)
(1,016,326)
(510,093)
(128,707)
(11,596)
(54,600)
(5,880)
(62,127)
(757,584)
(424,216)
(120,667)
(9,668)
(48,273)
(5,880)
(54,835)
(1,891,599) (1,789,329) (1,421,123)
Income before workers’ profit sharing and
income tax 1,673,678 1,221,746 932,903
Workers’ profit sharing
Income tax
13(b)
13(b)
(41,557)
(297,575)
(40,746)
(297,562)
(35,504)
(235,825)
Net income 1,334,546 883,438 661,574
Basic and diluted earnings per share (in Nuevos Soles) 25(b) 0.8848 0.5857 0.4386
Weighted average number of outstanding shares, adjusted by stock
splits (in thousands) 25(a) 1,508,288 1,508,288 1,508,288
Consolidated income statements
The accompanying notes are an integral part of these consolidated statements.

95Financial Statements 2008 Banco de Crédito del Perú and SubsidiariesConsolidated financial statements
For the years ended December 31, 2008,
2007 and 2006
Number of
outstanding
shares
Capital
stock
Legal
reserve
Special
reserve
Accumu-
lated
results from
cash flow
hedges
Retained
earnings
Total
(in thousands) S/(000) S/(000) S/(000) S/(000) S/(000) S/(000)
Balances as of January 1, 2006
Transfer to special reserve, note 14(c)
Cash dividends, note 14(d)
Net income
1,286,528
-
-
-
1,286,528
-
-
-
546,519
-
-
-
258,965
107,293
-
-
-
-
-
-
699,096
(107,293)
(591,803)
661,574
2,791,108
-
(591,803)
661,574
Balances as of December 31, 2006 1,286,528 1,286,528 546,519 366,258 - 661,574 2,860,879
Transfer to special reserve, note 14(c)
Cash dividends, note 14(d)
Net income
-
-
-
-
-
-
-
-
-
125,092
-
-
-
-
-
(125,092)
(536,482)
883,438
-
(536,482)
883,438
Balances as of December 31, 2007 1,286,528 1,286,528 546,519 491,350 - 883,438 3,207,835
Capitalization of income, note 14(a)
Transfer to special reserve, note 14(c)
Cash dividends, note 14(d)
Net loss from valuation of derivative financial
instruments, note 9(c)(ii)
Net income
221,760
-
-
-
-
221,760
-
-
-
-
-
-
-
-
-
-
290,515
-
-
-
-
-
-
(71,286)
-
(221,760)
(290,515)
(371,163)
-
1,334,546
-
-
(371,163)
(71,286)
1,334,546
Balances as of December 31, 2008 1,508,288 1,508,288 546,519 781,865 (71,286) 1,334,546 4,099,932
Consolidated statements of changes in shareholders’ equity
The accompanying notes are an integral part of these consolidated statements.

96
For the years ended
December 31, 2008, 2007 and 2006
2008 2007 2006
S/(000) S/(000) S/(000)
Cash flows from operating activities
Net income 1,334,546 883,438 661,574
Adjustments to reconcile net income to net cash provided by
operating activities:
Provision for loan losses, net of recoveries
Depreciation and amortization
Goodwill amortization
Deferred income tax and workers’ profit sharing
Recovery of provision for buildings impairment, net
Provision for seized assets
Loss (gain) from valuation of indexed certificates
Net gain from sale of securities
Net gain from sale of seized assets
270,267
137,827
980
(40,664)
-
7,343
190,994
(72,364)
(41,641)
185,142
128,707
5,880
(35,924)
-
11,596
(207,819)
(57,526)
(39,710)
147,532
120,667
5,880
(18,336)
(14,540)
9,668
-
(25,087)
(41,075)
Changes in asset and liability accounts:
Other assets
Other liabilities
63,407
(319,765)
(526,997)
443,116
155,871
100,058
Net cash provided by operating activities 1,530,930 789,903 1,102,212
Cash flows from investing activities
Gain on sales of property, furniture and equipment
Gain on sales of seized assets
Purchase of intangible assets
Purchase of property, furniture and equipment
5,600
65,660
(97,496)
(270,823)
5,115
65,021
(79,036)
(152,435)
42,386
95,735
(49,111)
(103,174)
Net cash used in investing activities (297,059) (161,335) (14,164)
Consolidated cash flows statements

97Financial Statements 2008 Banco de Crédito del Perú and SubsidiariesConsolidated financial statements
For the years ended
December 31, 2008, 2007 and 2006
2008 2007 2006
S/(000) S/(000) S/(000)
Cash flows from financing activities
Net increase of deposits and obligations
Net purchase of trading securities
Net (purchase) sale of permanent investments
Net (decrease) increase of due to banks and correspondents and inter-bank funds
Net increase of bonds and subordinated notes issued
Net increase of loan portfolio
Cash paid for purchase of loan portfolio
Cash dividends
10,896,687
(529,842)
(21,093)
(558,183)
336,943
(8,393,897)
-
(371,163)
5,995,106
(3,019,496)
(9,100)
2,871,872
455,739
(5,972,536)
(11,602)
(536,482)
3,804,828
(560,105)
15
(1,927,327)
163,158
(2,348,799)
-
(591,803)
Net cash provided by (used in) financing activities 1,359,452 (226,499) (1,460,033)
Net increase (decrease) in cash and cash equivalents
Cash and cash equivalents at the beginning of year
2,593,323
8,399,874
402,069
7,997,805
(371,985)
8,369,790
Cash and cash equivalents at the end of year 10,993,197 8,399,874 7,997,805
Supplementary cash flow information
Cash paid during the year for:
Interests
Income tax
1,402,722
385,660
1,087,145
239,834
770,897
251,702
Consolidated cash flows statements (continued)
The accompanying notes are an integral part of these consolidated statements.

98
1 OperationsBanco de Crédito del Perú (hereinafter “the Bank” or “BCP”) was incorporated in 1889 and is a subsidiary of Credicorp Ltd. (a holding incorporated in Bermuda in 1995), which owns 97.41 percent of its capital stock as of December 31, 2008 (97.33 percent of its capital stock as of December 31, 2007).
The address of the Bank’s main office is Calle Centenario N°156, La Molina, Lima, Peru. As of December 31, 2008, the Bank and its Subsidiaries had 330 branches and agencies in Peru and 2 branches abroad (273 branches and agencies in Peru and 2 branches abroad as of December 31, 2007).
The Bank, whose operations are governed by the “Ley General del Sistema Financiero y de Seguros y Orgáni-ca de la Superintendencia de Banca, Seguros y AFP” (General Law of the Financial and Insurance Systems and Organic of the SBS – Law 26702), hereinafter the “Banking Law”, is authorized by the SBS to operate as a universal bank, in accordance with prevailing Peruvian legislation. The Bank is authorized to receive third-party deposits and invest them, together with its own capital, in loan placements and securities acquisitions; likewise, the Bank may grant guarantees and letters of credit, engage in any type of financing transaction or banking service and other activities as allowed by the Banking Law. Likewise, the Bank may engage in under-writing and brokerage activities and may establish and manage mutual funds, among other similar activities, provided that those activities are carried out by Subsidiaries organized for such purposes.
The accompanying consolidated financial statements include the Bank’s financial statements and those of its Subsidiaries in which the Bank has more than 50 percent of direct or indirect participation. The main financial data of the Bank and its Subsidiaries (hereafter “the Group”), which are included in the consolidation process as of December 31, 2008 and 2007, before eliminations for consolidation purposes, is as follows:
(*) Entities absorbed by Inmoviliaria BCP S.A. on June 16, 2008.
The consolidated financial statements as of December 31, 2007 and for the year then ended, were approved by the General Shareholders Meeting dated March 28, 2008. The accompanying consolidated financial statements as of December 31, 2008, were approved by the Audit Committee and Management on February 25, 2009, and will be submitted for their final approval by the Board of Directors and the General Shareholders Meeting within the period established by law. In Management’s opinion, the accompanying consolidated financial statements will be approved by the Board of Directors and the General Shareholders Meeting without modifications.
2 Significant accounting policies In the preparation and presentation of the accompanying consolidated financial statements, the Bank and its Subsidiaries’ Management has complied with the regulations established by the Superintendencia de Banca, Seguros y AFP (hereinafter “SBS” for its Spanish acronym) in force in Peru as of December 31, 2008 and 2007. Significant accounting principles and practices used in the preparation of the Bank and its Subsidiaries’ consolidated financial statements are the following:
(a) Basis for presentation, use of estimates and accounting changes
(i) Basis for presentation and use of estimates The accompanying consolidated financial statements have been prepared from the Bank’s accounting records which are maintained in nominal Peruvian currency (Nuevos Soles), in accordance with SBS
Entity Activity and country Percentage of participation Assets Liabilities Equity Net income (loss)
2008 2007 2008 2007 2008 2007 2008 2007 2008 2007
% % S/(000) S/(000) S/(000) S/(000) S/(000) S/(000) S/(000) S/(000)
Banco de Crédito del Perú
Banco de Crédito de Bolivia and Subsidiaries
Inversiones BCP Ltda.
Crédito Leasing S.A.
Credifondo S.A.F. - Sociedad Administrado-
ra de Fondos – SAF
Creditítulos Sociedad Titulizadora S.A.
Credibolsa - Sociedad Agente de Bolsa S.A.
Solución Financiera de Crédito del Perú S.A.
Inmobiliaria BCP S.A.
Inversiones Conexas S.A. (*)
BCP - Sociedad de Propósito Especial (*)
Banking, Peru
Banking and financial, Bolivia
Holding, Chile
Financial, Peru
Mutual funds management, Peru
Securitization management, Peru
Brokerage, Peru
Financial, Peru
Real estate, Peru
Real estate, Peru
Securitization management, Peru
-
95.92
99.99
100.00
100.00
100.00
100.00
100.00
100.00
-
-
-
95.92
99.99
100.00
100.00
100.00
100.00
100.00
100.00
100.00
100.00
52,548,933
2,946,248
125,455
772,904
88,542
4,254
34,565
112,060
2,773
-
-
41,286,745
2,459,293
86,397
970,524
77,840
4,195
56,123
121,758
8,043
4,338
486
48,449,001
2,611,122
21,038
696,993
3,947
259
11,219
86,854
145
-
-
38,078,910
2,206,986
-
899,377
6,618
226
22,227
106,426
8
34
1
4,099,932
335,126
104,417
75,911
84,595
3,995
23,346
25,206
2,628
-
-
3,207,835
252,307
86,397
71,147
71,222
3,969
33,896
15,332
8,035
4,304
485
1,334,546
138,082
13,868
9,321
33,566
223
14,094
1,379
1,435
-
-
883,438
78,965
9,142
20,440
34,504
197
24,644
1,428
(96)
1,871
(526)

99Financial Statements 2008 Banco de Crédito del Perú and SubsidiariesNotes to the consolidated financial statements (continued)Financial Statements 2008 Banco de Crédito del Perú and SubsidiariesNotes to the consolidated financial statements
Entity Activity and country Percentage of participation Assets Liabilities Equity Net income (loss)
2008 2007 2008 2007 2008 2007 2008 2007 2008 2007
% % S/(000) S/(000) S/(000) S/(000) S/(000) S/(000) S/(000) S/(000)
Banco de Crédito del Perú
Banco de Crédito de Bolivia and Subsidiaries
Inversiones BCP Ltda.
Crédito Leasing S.A.
Credifondo S.A.F. - Sociedad Administrado-
ra de Fondos – SAF
Creditítulos Sociedad Titulizadora S.A.
Credibolsa - Sociedad Agente de Bolsa S.A.
Solución Financiera de Crédito del Perú S.A.
Inmobiliaria BCP S.A.
Inversiones Conexas S.A. (*)
BCP - Sociedad de Propósito Especial (*)
Banking, Peru
Banking and financial, Bolivia
Holding, Chile
Financial, Peru
Mutual funds management, Peru
Securitization management, Peru
Brokerage, Peru
Financial, Peru
Real estate, Peru
Real estate, Peru
Securitization management, Peru
-
95.92
99.99
100.00
100.00
100.00
100.00
100.00
100.00
-
-
-
95.92
99.99
100.00
100.00
100.00
100.00
100.00
100.00
100.00
100.00
52,548,933
2,946,248
125,455
772,904
88,542
4,254
34,565
112,060
2,773
-
-
41,286,745
2,459,293
86,397
970,524
77,840
4,195
56,123
121,758
8,043
4,338
486
48,449,001
2,611,122
21,038
696,993
3,947
259
11,219
86,854
145
-
-
38,078,910
2,206,986
-
899,377
6,618
226
22,227
106,426
8
34
1
4,099,932
335,126
104,417
75,911
84,595
3,995
23,346
25,206
2,628
-
-
3,207,835
252,307
86,397
71,147
71,222
3,969
33,896
15,332
8,035
4,304
485
1,334,546
138,082
13,868
9,321
33,566
223
14,094
1,379
1,435
-
-
883,438
78,965
9,142
20,440
34,504
197
24,644
1,428
(96)
1,871
(526)

100
regulations and, supplementary, with International Financial Reporting Standards - IFRS approved and in force in Peru as of December 31, 2008 and 2007, see paragraph (x.2) below.
The Subsidiaries and branches’ accounting records are maintained in the currency of the country of their incorporation and their balances are translated into Nuevos Soles for consolidation purposes using the exchange rate prevailing as of the date of each balance sheet. The resulting translation differences are recognized in the consolidated income statements. On the other hand, the subsidiaries and branches financial statements were standardized to the SBS accounting rules, as applicable.
The preparation of consolidated financial statements requires Management to make estimates that affect the reported amounts of assets, liabilities, income and expenses and the disclosure of material events in the notes to the consolidated financial statements. Actual results could differ from those estimates. Estimates are continually evaluated and are based on historical experience and other factors. The most significant esti-mates used in relation with the accompanying consolidated financial statements are the computation of the allowance for loan losses, the valuation of investments, the estimated useful life and recoverable amount of property, furniture and equipment and intangible assets (including goodwill), the provision for seized assets, and the valuation of derivative financial instruments. The accounting criteria used for each of these items are described in this note.
(ii) Accounting changes On November 19, 2008, the SBS issued Resolution Nº 11356-2008 “Regulation for the Evaluation and Classification of Debtors and Provisioning Requirements”, which replaces Resolution Nº 808-2003 and modifications thereto, see paragraph (e) below. This Resolution will take effect on January 1, 2010; nevertheless, the following requirements apply from December 1, 2008: the generic provisioning percentage for loans classified as normal (equivalent to 1 percent) was modified to specific percentages for each type of loan, see note 6(e) and; the pro-ciclycal provisioning requirement came into force. The purpose of this provisioning requirement is, when certain macroeconomic conditions prevails, to include an additional provision to the fixed percentage described above for loans classified as normal. As of December 31, 2008, as the macroeconomic conditions for the activation of the pro-cyclical provisioning requirement were met, financial institutions had to record at least two thirds of the required provision; the balance must be recorded no later than February 28, 2009. Nevertheless, the Bank and its Subsidiaries recorded as of December 31, 2008 one hundred percent of the required provision.
On September 22, 2006, the SBS issued Resolution N° 1237-2006 “Risk Management Standards for Retail Borrowers with High Leverage Levels”, which established a provisioning requirement aimed to cover unused revolving credit lines of micro-business and consumer loans; these provisions had to be recorded from June 30, 2007 onwards. Nevertheless, on July 16, 2007, the SBS issued Resolution N° 930-2007 which modified the indicated date of implementation, being the new date January 31, 2008. Finally, on August 26, 2008, the SBS issued Resolution N° 6941-2008 “Risk Management Standards for Retail Borrowers with High Leverage Levels”, allowing a term up to December 31, 2008 to comply with the provisioning requirement and replacing Resolution N° 1237-2006. Resolution N° 6941-2008 updates and reinforces the matters contained in Resolution N° 1237-2006; however, the provisioning requirements for unused revolving lines for micro-business and consumer loans were not modified. In Management’s opinion and applying the criteria established in Resolutions N° 6941-2008, the Bank is not required to record any additional provision to those already recorded as of December 31, 2008.
(b) Consolidation
Subsidiaries are all entities (including special purpose entities) over which the Bank has the power to govern their financial and operating policies. This is generally evidenced by a shareholding of more than one half of the voting rights.
Subsidiaries are consolidated from the date on which effective control is transferred to the Bank and are no longer consolidated from the date that control ceases. The consolidated financial statements include the financial statements of the entities described in note 1, which are part of Banco de Crédito del Perú Group, here after “BCP Group”.
All inter-company transactions, balances and unrealized surpluses and deficits between companies of the BCP Group have been eliminated in the consolidation process. The minority interest resulting from the consolidation process is not significant and, for such reason, is not presented as a separate caption in the consolidated financial statements.
The individual accounting records of the companies that comprise BCP Group comply with the information requirements established by the SBS and by the legal regulators of the countries where they are located; their financial statements, which are included in annual reports and other public financial information, are presented in accordance with those requirements.
The accounting records of the subsidiaries and branches established abroad are maintained in the local currency of each country. For consolidation purposes, their balances have been translated into Nuevos Soles, the reporting currency, by using the exchange rate prevailing as of the date of each balance sheet. All the translation differences have been recorded in the consolidated income statements.

101Financial Statements 2008 Banco de Crédito del Perú and SubsidiariesNotes to the consolidated financial statements (continued)
(c) Financial instruments
Financial instruments are classified as assets, liabilities or equity according to the substance of the contractual agreement that originated them. Interest, dividends, gains and losses generated by financial instruments classified as assets or liabilities are recorded as income or expense. Financial instruments are offset when the Bank and its Subsidiaries have a legally enforceable right to offset them and Management has the inten-tion to settle them on a net basis or to realize the asset and settle the liability simultaneously.
Financial assets and liabilities carried in the consolidated balance sheet correspond to cash and due from banks, interbank funds, investments (trading, available-for-sale, held-to-maturity and permanent invest-ments), financial instruments at fair value through profit and loss, loans, accounts receivable (presented in “Other assets, net” caption) and liabilities in general, except for the liability for deferred income tax and worker’s profit sharing. In addition, all indirect loans are considered to be financial instruments. The specific accounting policies on recognition and measurement of these items are disclosed in the accounting policies described in this note.
(d) Recognition of revenues and expenses
Financial revenues and expenses for interests are recognized on an accrual basis over the related contract period for the transaction and the interest rates determined based on negotiations with clients, except for interest generated from past due, refinanced, restructured or under legal collection loans, and loans classified in the categories of doubtful and loss. Interests related to such loans are recognized as revenue on a cash basis. When Management determines that the debtor’s financial condition has improved and the loan is reclassified as current and/or in the categories of normal, with potential problems or substandard, interest is again recorded on an accrual basis.
Interest revenues include income on fixed income securities and trading securities, as well as discount and premium recognition on financial instruments.
Dividends are recognized as income when they are declared.
Commissions on financial services are recognized as income when collected, except for commissions related to the issuance of credit cards, which are recorded on an accrual basis.
Other revenues and expenses are recorded on an accrued basis.
(e) Loans and allowance for loan losses
Direct loans are recorded when disbursement of funds to the client is made. Indirect (off-balance sheet) loans are recorded when documents supporting such facilities are issued. Loans with changes in their pay-ment schedules due to difficulties in the debtors’ compliance with original payment terms are considered refinanced or restructured.
Leasing operations are registered as financial leases, recording as loans the principal of the installments pending collection. Financial revenues are based on a pattern that reflects a constant interest rate over the leasing period.
As of December 31, 2007 Management of the Bank and its Subsidiaries determined the allowance for loan losses in accordance with the guidelines established by SBS Resolution N° 808-2003 “Regulations for the Evaluation and Classification of Debtors and Provisioning Requirements” and modifications thereto. As of De-cember 31, 2008, as explained in note 2(a)(ii), the provision for loan losses was determined using the criteria established by SBS Resolution N° 11356-2008 “Regulations for the Evaluation and Classification of Debtors and Provision Requirements” and SBS Resolution N° 6941-2008 “Risk Management Standards for Retail Borrowers with High Leverage Levels “. In accordance with such criteria, Management periodically conducts a formal review and analysis of the loan portfolio; classifying all clients/loans under one of the following risk categories: normal, potential problems, substandard, doubtful or loss, based on the client’s non-payment risk.
For commercial loans, the risk classification takes into consideration several factors, such as the payment history of the loan, the Bank’s dealing history with the client/debtor’s management, the debtor’s operating history, repayment capability and availability of funds, the status of any collateral or guarantee received, the debtors financial statements, its risk classification granted by other financial institution and other relevant factors. For micro-business, consumer and residential mortgage loans, the risk classification is based on how long payments are overdue.
In accordance with prevailing regulation, the computation of the allowance is made considering the risk classification assigned and using specific percentages, which vary depending on whether the client’s debts are secured or not with highly liquid preferred guarantees (cash deposits and rights on credit certificates), or readily preferred guarantees (treasury bonds issued by the Peruvian Government, securities included in the Lima Stock Exchange Selective Index, among others) or preferred guarantees (primary lien/pledge on finan-cial instruments, securities and property, agriculture or mining pledge, insurance on export credits, among others), considered at their net realizable value as determined by an independent appraiser. Likewise, for Credits Affected by Counterparty Substitution (CACS); the provision requirement, for the secured amount, depends on the risk classification of the counterparty, regardless of the risk classification of the client/debtor.

102
Likewise, when calculating the allowance for clients classified as doubtful or loss for more than 36 and 24 months, respectively, the value of any collateral is disregarded and the required allowance is calculated as if such loans were not supported by any collateral.
The allowance for direct loans is presented as an asset deduction, while the allowance for indirect loans is presented as a liability in the caption “Others liabilities, net”, note 9(a).
In the case of borrowers in countries where there is an increased risk of difficulties in servicing external debt, an assessment of the political and economic situation is made, and an additional country risk provisions is recorded.
As of December 31, 2008, the Bank has an allowance for loan losses that exceeds the minimum amount required by the SBS, with the aim of covering additional risks that are identified in the loan portfolio for ap-proximately S/14.6 million (S/74.2 million as of December 31, 2007). This allowance complies with SBS requirements.
(f) Foreign currency transactions
Assets and liabilities denominated in foreign currency are recorded by applying to the foreign currency amount the exchange rate prevailing at the transaction date and are expressed in Peruvian currency at the end of each month using the exchange rates established by the SBS, as explained in note 3. Exchange gains or losses generated from the restatement of foreign currency transactions at the exchange rates prevailing as of the dates of the consolidated balance sheets are recorded in the consolidated income statement.
(g) Derivative financial instruments
Derivate financial insruments are recorded in accordanse wih SBS Resolution N° 1737-2006 “Regulation for Trading and Accounting of Derivatives for Financial Entities” and modification, as explained below:
Trading Derivate financial instruments are initially recognized in the consolidated balance sheet at cost, thereafter they are recognized at fair value. Fair values are obtained based on market exchange and interest rates. Gains and losses arising from changes in fair values are recorded in the consolidated income statement.
In the case of foreign currency forwards and interest rate and currency swaps, they are recorded at their esti-mated fair value, with an asset or liability being recognized in the consolidated balance sheet, as applicable, and the corresponding gain or loss being recognized in the consolidated income statement. In addition, forward and swap operations are also recorded in off-balance sheet accounts at their notional amount, note 18(d).
Hedge A derivative financial instrument that seeks to achieve a financial hedge for a given risk is designated as for “hedge purposes” if, at its negotiation, it is foreseen that the changes in fair value or cash flows are expected to be highly effective in offsetting the fair value or cash flow changes of the hedged item attributable to the hedge risk at the inception, which must be documented when the financial derivative is negotiated and dur-ing the period that the hedge relation exists. A hedge is considered as highly effective if the changes in fair value or cash flows attributable to the hedged risk during the period for which the hedge is designated are expected to offset in a range of 80 percent to 125 percent.
If the SBS considers the documentation to be unsatisfactory or finds weaknesses in the methodologies ap-plied, it may require the immediate termination of the hedge relationship and the recording of the derivative financial instrument as trading.
As of December 31, 2008 and 2007, as indicated by the SBS, the Bank and its subsidiaries have derivative financial instruments for hedging purposes, see note 9(c).
Embedded derivatives Certain derivatives embedded in other financial instruments (host contract) are treated as separate derivatives when their economic characteristics and risks are not closely related to those of the host contract and the host contract is not carried at fair value through profit or loss. These embedded derivatives are measured at fair value with changes in fair value recognized in the income statement unless the Bank and its subsidiaries choose to designate the hybrid contracts (host and embedded derivative) at fair value through profit and loss.
As of December 31, 2008, the Bank has Certificates Indexed to Credicorp stock price that will be settled in cash (Certificates Indexed to Credicorp stock price and Credit Linked Notes - acquired in order to provide financial instruments with the same characteristics, risks and benefits to its clients - as of December 31, 2007); which are hybrid instruments with embedded derivatives that are not closely related to the risk of the host contract. In this regard, the Bank has decided to classify these instruments at fair value through profit and loss. Therefore, the separation of the embedded derivative is not required, notes 9(b) and 9(d).
103Financial Statements 2008 Banco de Crédito del Perú and SubsidiariesNotes to the consolidated financial statements (continued)
(h) Trading, available-for-sale, and held-to-maturity investments
Initially, the Bank and its Subsidiaries record these investments at their acquisition cost and afterwards at their valuation criteria in accordance with their classification, which is determined as follows:
- Trading securities - Are investments maintained for sale in the short term and updated daily at their mar-ket value through individual valuation, recognizing gains and losses generated in the consolidated income statement.
Interest income from these investments is recognized when accrued and dividends when declared.
- Available-for-sale securities - Are investments that are not maintained for sale in the short term and are not to be held until their maturity. These investments are valued based on the global portfolio at the lower of their average acquisition cost or estimated fair value. The allowances recorded for these investments do not affect the results of the period, being recorded in a specific equity account until the sale of the invest-ments takes place. When sold, the unrealized losses, previously recognized reducing equity, are included in the result of the year. In the same way, when the Bank estimates that unrealized losses recorded are due to other than temporary impairment circumstances, such amount is recorded affecting the results of the year.
Interest income from these investments is recognized when accrued and dividends when declared.
In the case of debt securities, financial entities must update their book value every month through the ac-crual of capital discounts or premiums.
- Securities held-to-maturity – Are investments that Management has decided to maintain until their maturity. They are recorded at their acquisition cost, which must be individually adjusted for downgrades in the issuer’s credit rating affecting the consolidated income statement. Interest accrued on, as well as any premium or discount amortizations related to these investments, are recognized monthly as part of the cost and in the consolidated income statement.
An allowance is recorded individually for changes in the issuer’s credit risk similar to the treatment for direct loans. This allowance affects the consolidated results of the year. The consolidated results of the year are not affected by fluctuations in their market value, except when a significant reduction occurs.
If a held-to-maturity security is sold, any securities acquired from the same issuer can not be recorded in this category within the term of one year, unless expressly authorized by the SBS.
The difference between the proceeds received from the sale of any of the above described investments and their book value is recognized in the consolidated income statement.
In any of the aforementioned cases, if the SBS deems necessary to require the constitution of a provision for any investment, such provision must be determined by the SBS based on each individual investment and recorded in the consolidated income statement.
As mentioned in paragraph (x.1)(i), SBS Resolution N° 10639-2008 and its modifications will replace the existing regulations on investments recognition and valuation in order to harmonize its requirements with the accounting criteria and practices established in IAS 39. Said Resolution will take effect starting March 2009 and should be applied prospectively.
(i) Permanent investments
Comprise long term investments made in companies considered of interest for the Bank and its Subsidiaries. These investments are recorded using the equity participation method, i.e. the proportional gains or losses generated by the companies are recorded in the consolidated income statement.
The equity value must be determined according to SBS requirements. In the case of investments listed on security exchanges, when their market value shows a decreasing trend due to non-temporary circumstances, the SBS will require the recording of an allowance amounting to the difference between the market value and the equity value.
As mentioned in paragraph (x.1)(i), SBS Resolution N° 10639-2008 and its modification will replace the existing rules on recognition and valuation of investments. In the case of permanent investments, they must be initially recorded at their fair value including transaction costs that are directly attributable to their acquisition; thereafter, these investments should be recorded using the equity method. Likewise, these investments will be described as “Investments in subsidiaries and associates“ eliminating the “Permanent investments” category.
(j) Property, furniture and equipment and depreciation
Property, furniture and equipment are recorded at acquisition cost, less accumulated depreciation and accu-mulated amount of impairment, if applicable. Maintenance and repair costs are charged to the consolidated income statement and significant renewals and improvements are capitalized when it is probable that future economic benefits, in excess of the originally assessed standard of performance, will flow for the asset. The cost, the corresponding accumulated depreciation and the impairment loss of an asset sold or retired are

104
eliminated from the corresponding accounts and the related gain or loss is included in the consolidated income statement.
Work in progress and in transit units are accounted at their acquisition cost. These goods are not depreci-ated until they are received or finished and placed into service.
Land is not depreciated. Depreciation is computed on a straight-line basis over the following estimated use-ful lives:
The useful life assigned and the selected depreciation method are periodically reviewed to ensure that they are consistent with the economic benefit and useful life expectations of property, furniture and equip-ment items.
(k) Seized assets, assets received as payments and realizable assets
Realizable assets include assets purchased specifically for granting them as part of financial leasing opera-tions and are recorded initially at their acquisition cost; assets not granted in leasing operations are recorded at cost or market value, the lower.
Seized assets (which include assets from terminated leasing contract due to non-payment) are initially recorded at the value assigned to them through legal proceeding, out-of-court settlement, market value or at the unpaid value of the debt, the lower. At the time of initial recognition, a provision equivalent to 20 percent of the above determined value must be recorded; for this purpose it is permitted to reclassify the allowance for loan losses that was originally provided for the related loan.
Thereafter, additional provisions should be recorded using the following criteria:
- Assets that are not real state - A monthly provision equivalent to one twelfth of the book value of the asset (net of the 20 percent provision) will be provided starting from the first month of seizure or recovery, until reaching a provision of one hundred percent of the seized or recovered value.
- Real estate - After three and a half years, uniform monthly provisions must be provided for at the end of each month over the net book value obtained in the eighteenth or twelfth month, depending on whether the SBS extension term approval was obtained or not, respectively, until reaching a provision of one hundred percent of the seized or recovered value.
The required update of the market value of seized assets (which should be determined by an independent appraiser and not older than 1 year), necessarily implies the constitution of an impairment provision, when the net realization value is lower than its net book value. If the net realization value is higher than the net book value, the increased value can not be recognized for accounting purposes.
(l) Intangible assets
Intangible assets included in the “Other assets, net” caption of the consolidated balance sheets comprise principally software acquisitions and developments used in the Bank and its Subsidiaries’ operations. Software licenses acquired by the Bank and its Subsidiaries are capitalized considering the incurred cost to acquire or put in use the specific program. These assets are amortized using the straight-line method based on their estimated useful lives, which are from 3 to 5 years.
The useful life and the amortization method are reviewed periodically to ensure that they are consistent with the anticipated pattern of economic benefits from intangible assets.
(m) Goodwill
Goodwill included in the “Other assets, net” caption of the consolidated balance sheets, results from the difference between the estimated market value of the net assets acquired from the minority shareholders of Solución Financiera de Crédito del Perú S.A., and the amount paid for such assets on March 2003. Goodwill was amortized using the straight-line method over its estimated useful life, which was 5 years; therefore, as of December 31, 2008, goodwill is fully amortized.
(n) Bonds and subordinated notes issued
Include the liability from the issuance of different types of bonds and subordinated notes, which are re-corded at their face value, recognizing the accrued interest in the consolidated results of the year. Discounts
Years
Buildings and other constructions
Installations
Furniture and fixtures
Computer hardware
Equipment and vehicles
33
10
10
4
5

105Financial Statements 2008 Banco de Crédito del Perú and SubsidiariesNotes to the consolidated financial statements (continued)
granted or premiums generated in their placement are deferred in the “Other assets, net” and “Other liabilities, net” captions of the consolidated balance sheets, respectively, and are amortized during the term of each bond.
(o) Income tax and workers’ profit sharing
Income tax and worker’s profit sharing are computed based on taxable income determined for tax purposes, which is based on income tax principles that differ from accounting principles used by the Bank and its Sub-sidiaries; therefore, the accounting for income tax and workers’ profit sharing are in accordance with IAS 12.
Deferred income tax and workers’ profit sharing reflect the effects of temporary differences between the carrying amounts of assets and liabilities for accounting purposes and the amounts determined for tax purposes. Deferred assets and liabilities are measured using the tax rates expected to be applied to taxable income in the years in which temporary differences are expected to be recovered or settled. The measure-ment of deferred tax assets and deferred tax liabilities reflects the tax consequences that arise from the man-ner in which the Bank and its Subsidiaries expect to recover or eliminate the carrying amount of its assets and liabilities at the consolidated balance sheets dates.
Deferred tax assets and liabilities are recognized without taking into consideration the time in which it is es-timated that temporary differences will be written off. Deferred assets are recognized when sufficient future tax benefits are probable for applying the deferred assets. As at the date of the consolidated balance sheet, Management evaluates the non-recognized deferred assets and the balance of the recognized assets, record-ing deferred assets not previously recognized to the extent that probable future tax benefits will allow their recovery, or reducing the deferred assets to the extent that it is not likely that sufficient future tax benefits will be available to use part or all of the deferred assets recognized in the accounting records.
In accordance with the accounting standard (IAS 12), the Bank and its Subsidiaries determines its deferred tax and workers’ profit sharing considering the tax rate applicable to its non-distributed earnings; any ad-ditional tax on dividends distribution is recorded on the date a liability is recognized.
(p) Supplementary plan for workers’ profit sharing
The Bank has granted supplementary profit sharing participation to certain executives and employees who have at least one year of service, in the form of stock appreciation rights (SARs) over a certain number of Credicorp’s shares (the Bank’s main shareholder). Such SARs options are granted at the market price of the shares of Credicorp on the date of the grant and are exercisable at that price, allowing the employee to obtain a gain from the difference between the fixed exercise price of the share at the date of execution and the market price, note 16.
The recorded expense in each year is the estimated market value of the rights that can be exercised by the beneficiaries at the consolidated balance sheets date. The price of the SAR´s is estimated using a binomial method in accordance with IFRS 2 “Share-based payments”.
When the Bank changes the price or the terms of the SARs, the effect of such change is recognized in the consolidated income statement.
(q) Impairment
When changes on certain events indicate that the value of an asset could not be recovered, the Bank and its Subsidiaries review the value of property, furniture and equipment, goodwill and intangible assets in order to verify if there is no permanent impairment in their values. When the book value of the asset exceeds its recoverable value, a loss for impairment is recognized in the consolidated income statements for each cap-tion mentioned above. The recoverable value is the greater amount between the net sale price and its useful value. The net sale price is the amount that can be obtained from the sale of an asset in a free market, while the useful value is the present value of the estimated future cash flows by the continuous use of an asset and its disposal at the end of its useful life. The recoverable amounts are estimated for each asset or, if not possible, for each cash generating unit.
(r) Fiduciary activities
Assets and revenues from fiduciary operations in which there is a commitment to return such assets to a client and in which the Bank and its Subsidiaries participate as a trustee, have been excluded from these consolidated financial statements, because the Bank and its Subsidiaries are not owners of such assets and they do not assume the risk and rewards that arise from their ownership. The Bank and its Subsidiaries record these operations in the caption “Off-balance sheet accounts” of the consolidated balance sheets and the commissions for these activities are include in each caption “Other income” of the consolidated income statements.
(s) Provisions
Provisions are only recognized when the Bank and its Subsidiaries have a present (legal) obligation as a result of past events, it is probable that an outflow of resources will be required to settle such obligation, and the amount has been reliably estimated. Provisions are reviewed in each period and are adjusted to reflect

106
the best estimate as of the consolidated balance sheet date. When the effect of the time value of money is significant, the amount recorded as a provision is equal to the present value of future payments required to settle the obligation.
(t) Contingencies
Contingent liabilities are not recognized in the consolidated financial statements. They are disclosed in notes to the consolidated financial statements unless the possibility of an outflow of economic resources is remote.
Contingent assets are not recognized in the consolidated financial statements; however, they are disclosed when their contingency degree is probable.
(u) Earnings per share
Basic and diluted earnings per share are computed based on the weighted average number of shares outstanding at the consolidated balance sheets dates. Additional shares that should be issued due to the capitalization of retained earnings are deemed to be stock splits; thus, for the computation of the weighted average number of shares, such shares are considered as if they had always been issued.
As of December 31, 2008 and 2007, the Bank and its Subsidiaries do not have financial instruments with dilutive effects; therefore, basic and diluted earnings per share are the same.
(v) Sale and repurchase agreements
Following SBS rules, investments sold subject to repurchase agreements (“repos”) are presented in the consolidated financial statements as pledged assets when the transfer is made with an agreement to repurchase the collateral and legal ownership of the investments has not been transferred; being the li-ability with the counterparty included in the caption “Due to banks and correspondents” or “Deposits and obligations”, as appropriate, in the consolidated balance sheets. The difference between the sale and the repurchase price is treated as interest, which is accrued during the term of the agreement using the effec-tive interest method.
On the other hand, when legal ownership of the investment is transferred, which could happen even if there is an agreement to repurchase the transferred investment (repos), they are derecognized from the caption “Trading, available-for-sale and held-to-maturity investments, net”, recognizing the future commitment to repurchase the investment at the agreed maturity as a contingent operation in the caption “Off-balance sheet accounts”. The difference between the book value of the investment subject to the repurchase agreement and the future payment be made is recorded in the caption “Other assets, net” (if the book value of the transferred investment is higher than the committed amount) and “Other liabilities, net” (if the book value of the investment is lower than the committed amount).
(w) Cash and cash equivalents
Cash and cash equivalents presented in the consolidated statements of cash flows correspond to deposits with less than a three-month maturity as of the acquisition date, including funds deposited in central banks and overnight deposits.
(x) New accounting rules
(x.1) Accounting regulations issued by the SBS that do not apply for the year ended December 31, 2008
(i) Recording and valuation of investments SBS Resolution N° 10639-2008 dated October 31, 2008 and modification rule, modified the “Regulations for Investment Classification, Valuation and Provisions” and the Accounting Manual for Financial Companies; in order to harmonise the SBS accounting treatment of investments with the classification and valuation criteria contained in IAS 39 (Financial Instruments: Recognition and Measurement). This Resolution will take effect in March 2009 and should be applied prospectively.
The Resolution establishes criteria for the classification and valuation of investments in one of the following categories: (i) Investments at fair value through profit or loss, (ii) Available-for-sale investments, (iii) held-to-maturity investments and (iv) investments in subsidiaries and associates; the permanent investments category is eliminated.
It also modifies the following criteria regarding paragraphs (h) and (i) above:
Initial accounting record The initial recording of investments at fair value through profit or losss shall be at fair value and excluding transaction costs. In the case of other investment categories, they are recorded at fair value and including transaction costs that are directly attributable to the acquisition of the investments.
Available-for-sale Investments Investments in this category shall be valued at their fair value. Profit or loss arising from the fair value of investments in this category shall be recognised directly as equity, unless there is a permanent reduction in

107Financial Statements 2008 Banco de Crédito del Perú and SubsidiariesNotes to the consolidated financial statements (continued)
their value (permanent impairment). When the instrument is sold or realized, the profit or loss, previously recognised as part of equity, shall be included in the results of the year.
(ii) Classification and loan provisioning (direct and indirect loans)
SBS Resolution N° 11356-2008 “Regulations for the Evaluation and Classification of Debtors and Provision-ing Requirements”, will replace SBS Resolution Nº 808-2003 and modifications thereto starting January 1, 2010. According to this new regulation, certain changes must be implemented as of December 31, 2008, see paragraph (a)(ii), and other changes are applicable starting January 1, 2010. The most important changes applicable starting January 1, 2010 are the following:
- Loans, considering the established criteria, are to be recorded in one of the following eight categories: cor-porate loans, loans to large companies, loans to medium-sized companies, loans to small companies, loans to micro-business, revolving consumer loans, non-revolving consumer loans and mortgage loans.
- Considering the above detailed categories, new provisioning percentages (fixed and pro-cyclical compo-nents) for loans classified as normal were established.
(x.2) International financial reporting standards
Up to the date of these consolidated financial statements, the National Accounting Standards Board (CNC, for its Spanish acronym) has approved the application of IFRS 1 to 6, IAS 1 to 41, SIC 7 to 32 and IFRIC 1 to 12; which application is mandatory in Peru, except for financial entities when the SBS had issued specific accounting regulations.
As of December 31, 2008, there are several IFRS and IFRIC issued and in force at international level, which have been approved by the CNC but their application is in force starting January 1, 2009. These standards are: IAS 32 “Financial instruments – Presentation” (reviewed in 2006), IFRS 7 “Financial instruments: Dis-closures”, IFRS 8 “Operating segments”, IFRIC 13 “Customer Loyalty Programmes”, IFRIC 14 “The Limit on a Defined Benefit Asset, Minimum Funding Requirements and their Interaction”.
Except for IFRS 7 and 8, which do not affect accounting records and their objective is to provide more infor-mation in the financial statements, the standards mentioned above modifys certain accounting treatments. However, because these standards only apply in a supplementary manner to the accounting rules estab-lished by the SBS, they will not have any significant effect in the preparation of the Group’s consolidated financial statements, unless the SBS adopts them in the future through the modification of the Accounting Manual for Financial Entities or issues specific regulations. The Bank and its Subsidiaries have not estimated the impact, if any, of the application of these standards in their consolidated financial statements, if such regulations were adopted by the SBS.
On the other hand, the following IFRS and IFRIC have been issued at international level as of December 31, 2008; but not yet approved by the CNC or the SBS; in this sense, there are no applicable to the Bank and its Subsidiaries’ operations. Therefore, Management has not estimated their effect in the consolidated financial statements and consolidated operations.
- IFRS 1 revisions “First-time Adoption of International Financial Reporting Standards”, IAS 27 “Consolidated and Separate Financial Statements”, IAS 23 “Borrowing Costs” (Revised), IFRS 2 “Share-based Payment” (Revised), IAS 1 “Presentation of Financial Statements”( Revised 2007), IAS 32 “Financial Instruments: Pre-sentation” and IAS 1” Presentation of Financial Statements”, IAS 39 “Financial Instruments: Recognition and Measurement” (Revised 2008)and IFRIC 15 “Agreements for the Construction of Real Estate”; all of these standards are in force for annual periods beginning on or after January 1, 2009.
- IFRS 3 (Revised) “Business Combination and Consolidation” and IAS 27 (Revised) “Separated Financial Statements Consolidation”, internationally in force for annual periods beginning on or after July 1, 2009.
- IFRIC 16, “Hedges of a Net Investment in a Foreign Operation”, internationally in force for annual periods beginning on or after October 1, 2008.
- IFRIC 17, “Distributions of Non-Cash Assets to owners”, internationally in force for annual periods beginning on or after July 1, 2009.
- IFRIC 18, “Transfer of assets from customers”, effective for periods beginning on or after July 1, 2009. This interpretation clarifies the requirements of IFRS for agreements in which an entity receives from a customer an item of property, plant and equipment that the entity must then use either to connect the customer to a network or to provide the customer with ongoing access to a supply of goods or services.

108
3 Foreign currency transactions and exposure to exchange riskTransactions in foreign currency are completed using exchange rates prevailing in the market.
As of December 31, 2008, the weighted average market exchange rate published by SBS for transactions in US Dollars was S/3.137 for buying and S/3.142 or selling (S/2.995 and S/2.997 as of December 31, 2007, respectively). As of December 31, 2008, the exchange rate established by SBS to record assets and liabili-ties in foreign currencies was S/3.140 for each US Dollar and S/0.451 for each Bolivian Peso (S/2.996 and S/0.396, as of December 31, 2007, respectively). A detail of the Bank and its Subsidiaries’ foreign currency assets and liabilities is shown below:
The derivatives net long position as of December 31, 2008, corresponds to foreign currency forward pur-chase and sale operations for approximately US$886.0 and US$1,620.8 million equivalent to S/2,781.9 and S/5,089.5 million, respectively, (US$1,278.5 and US$995.8 million equivalent to S/3,830.4 and S/2,983.4 million, respectively as of December 31, 2007), note 9(c).
The net currency swap position as of December 31, 2008, corresponds to operations involving Nuevos Soles exchanged for U.S. Dollars and vice versa, and have reference values of approximately US$130.3 million and US$98.8 million, equivalent to S/.409.2 million and S/.310.4 million respectively (US$62.9 million and US$55.7 million, equivalent to S/.188,4 million and S/.166.8 million, respectively as at the 31st of Decem-ber 2007), see note 9(c).
The net currency and interest rate swap position as of December 31, 2008, corresponds to exchanges of principal and interest in Nuevos Soles for U.S. Dollars, and have reference values of approximately US$277.3 million, equivalent to S/.870.9 million (US$50.4 million equivalent to S/.151.1 million as at the 31st of December 2007) see note 9(c).
As of December 31, 2008, the Bank and its Subsidiaries have contingent operations in foreign currency for approximately US$1,728 million, equivalent to approximately S/5,431 million (approximately US$1,246 mil-lion, equivalent to approximately S/3,913 million, as of December 31, 2007), note 18.
2008 2007
U.S.
Dollars
Bolivian
Peso
U.S.
Dollars
Bolivian
Peso
US$(000) US$(000) US$(000) US$(000)
Assets
Cash and due from banks and
interbank funds
Trading, available-for-sale, and held-to-
maturity securities, net
Loans, net
Other assets
2,951,045
1,797,530
6,825,405
154,388
71,470
245,528
93,338
6,709
2,370,944
392,773
5,435,550
304,799
64,016
157,654
69,039
6,645
11,728,368 417,045 8,504,066 297,354
Liabilities
Deposits and obligations
Due to banks, correspondents and
interbank funds
Bonds and subordinated notes issued
Other liabilities
(8,905,439)
(1,044,994)
(319,660)
(221,587)
(332,241)
(23)
-
(23,671)
(7,085,382)
(1,208,898)
(339,846)
(289,922)
(233,874)
(2,418)
-
(22,889)
(10,491,680) (355,935) (8,924,048) (259,181)
Net forward operations – net long
position
Net currency swap position
Net currency and interest rates swap
position
(678,940)
31,458
(277,347)
(55,972)
-
-
320,602
7,227
(50,420)
(37,843)
-
-
Net asset (liability) position 311,859 5,138 (142,573) 330

109Financial Statements 2008 Banco de Crédito del Perú and SubsidiariesNotes to the consolidated financial statements (continued)
In prior years, the devaluation (revaluation) of the Nuevo Sol with respect to the US Dollar and inflation (deflation), in accordance with the National Wholesale Price Index published by the Instituto Nacional de Estadística e Informática (National Institute of Statistics and Informatics), are as follows:
4 Cash and due from banksAs of December 31, 2008, cash and due from banks includes approximately US$2,086.4 million and S/1,263.6 million (US$959.0 million and S/695.6 million as of December 31, 2007) which represent the legal reserve that the Bank and its Subsidiaries must maintain related to its obligations with the public. These funds are deposited in the vaults of the Bank and its Subsidiaries and in the Central Reserve Bank of Peru - BCRP, and are within the limits established by prevailing legislation.
During 2008, BCRP modified several times the procedures and calculation basis for the legal reserve, as well as the interest rate that accrues the reserve that exceeds the minimum legal requirement in foreign currency. In Management’s opinion, these modifications will not have a significant impact on the Bank and its Subsid-iaries’ operations.
Reserve funds kept in BCRP do not earn interest, except for the part of the mandatory reserve in foreign currency that exceeds the minimum legal reserve. As of December 31, 2008, this excess amounts to ap-proximately US$1,601.6 million, equivalent to approximately S/5,029.0 million, and earns interest in US Dollars at an annual rate of 0.40 percent (US$1,222.5 million equivalent to approximately S/3,662.5 million, and earned interest in US Dollars at an annual rate of 3.50 percent as of December 31, 2007).
As of December 31, 2008, the Bank does not have overnight operations with BCRP (as of December 31, 2007, it had one operation amounting to US$1,000 million, equivalent to S/2,996 million, this operation earned interests with a nominal annual rate of 4.45 percent and had a maturity of 2 days).
Deposits in local and foreign banks correspond to balances in Nuevos Soles and U.S. Dollars, as well as minor amounts in other currencies. All deposits are unrestricted and earn interests at market rates. As of December 31, 2008 and 2007, the Bank and its Subsidiaries do not have significant deposits in any specific financial institution.
Year Devaluation
(revaluation)
Inflation
% %
2004
2005
2006
2007
2008
(5.2)
4.5
(6.8)
(6.3)
4.8
4.9
3.6
1.1
3.9
6.7

110
5 Trading, available-for-sale and held-to-maturity investments, net(a) This item is made up as follows:
(b) As of December 31, 2008 and 2007, the Bank and its Subsidiaries maintain participations in several Peruvian mutual funds. The market value of the participation quotas, classified as trading, amount approxi-mately to US$21.3 and US$0.7 million, respectively, equivalent to approximately S/67.0 and S/2.3 million, respectively.
Likewise, the market value of the participation quotas, classified as available for sale, amount approximately to US$81.4 and US$133.7 million, respectively, equivalent to approximately S/255.6 and S/400.1 million as of December 31, 2008 and 2007, respectively.
(c) The Peruvian Treasury bonds correspond to global bonds issued in foreign currency by the Peruvian Gov-ernment. As of December 31, 2008, these bonds accrued interest at annual rates that range between 6.19 and 7.65 percent (between 5.25 and 6.66 percent as of December 31, 2007), with maturities between February 2012 and March 2037 (between January 2008 and May 2018 as of December 31, 2007).
Sovereign bonds are issued in Nuevos Soles; by the Peruvian Government. As of December 31, 2008, these bonds accrued interest at annual rates that range between 3.27 and 7.64 percent (between 3.34 and
2008 2007
S/(000) S/(000)
Trading securities
Mutual funds participation (b)
Peruvian Treasury bonds (c)
Sovereign bonds - Republic of Peru (c)
Corporate and leasing bonds
Listed equity securities
Other
67,009
31,017
6,302
1,828
916
5,368
2,290
6,347
56,343
5,146
74,763
6,312
112,440 151,201
Investments available-for-sale
BCRP negotiable certificates of deposit (d)
Peruvian Treasury bonds (c)
Treasury notes from the Central Bank of Bolivia (e)
Sovereign bonds - Republic of Peru (c)
Corporate and leasing bonds (f)
Mutual funds participation (b)
Participation in Bolivia’s RAL fund (g)
Treasury bonds of foreign governments (h)
Bonds of international financial entities (i)
Listed equity securities
Securitization instruments
Non - listed equity securities
Other
5,971,363
1,059,774
683,001
435,047
394,969
255,648
230,061
172,253
109,269
28,104
23,419
3,557
-
6,492,472
248,385
372,695
511,375
205,573
400,136
169,696
63,679
134,208
42,871
29,404
3,516
494
9,366,465 8,674,504
Held-to-maturity securities - 65,523
9,478,905 8,891,228
Allowance for investments available-for-sale and held-to-maturity securities (k) (12,131) (6,263)
Balance of trading, available-for-sale and held-to-maturity
securities, net 9,466,774 8,884,965
Accrued interest of available-for-sale and held-to-maturity investments 65,976 53,089
Total trading, available-for-sale and held-to-maturity investments, net 9,532,750 8,938,054

111Financial Statements 2008 Banco de Crédito del Perú and SubsidiariesNotes to the consolidated financial statements (continued)
6.44 percent as of December 31, 2007), with maturities between March 2010 and August 2026 (between July 2008 and August 2026 as of December 31, 2007).
(d) BCRP negotiable certificates of deposit are negotiable financial instruments issued in public auctions at discount, denominated in Nuevos Soles and negotiated in the Peruvian secondary market. As of December 31, 2008, these certificates accrued annual interest rates that range between 6.55 and 7.06 percent (be-tween 4.93 and 6.01 percent as of December 31, 2007), with maturities between January 2009 and April 2010 (between January 2008 and April 2010 as of December 31, 2007).
As of December 31, 2008, this amount includes S/3,354 million, corresponding to BCRP certificates read-justed to Nuevos Soles vs. U.S. Dollar exchange rate. These certificates accrued interests at annual rates that range between 0.34 and 1.55 percent, with maturities between January 2009 and April 2009.
(e) Treasury notes from the Central Bank of Bolivia are issued at discount and are denominated in Bolivian Pesos. As of December 31, 2008, these notes accrued interest at annual rates that range between 0.2 and 11.45 percent (between 1.80 and 8.50 percent as of December 31, 2007), with maturities between Janu-ary and July 2009 (between January and October 2008 as of December 31, 2007).
(f) The Bank and its Subsidiaries holds corporate bonds, principally issued by Peruvian entities, with maturi-ties between January 2009 and July 2035 as of December 31, 2008 (between January 2008 and May 2030, as of December 31, 2007). These bonds accrued interests at annual rates that range between 4.56 and 8.72 percent for bonds issued in Nuevos Soles (between 4.25 and 6.87 percent as of December 31, 2007) and between 4.73 and 11.0 percent for bonds issued in U.S. Dollars (between 3.16 and 11.00 percent as of December 31, 2007).
(g) The participation quotas in the Fund “Requirement of Cash Assets” (RAL for its Spanish acronym), are is-sued in Bolivian Pesos and comprises investments made by Banco de Crédito de Bolivia in the Central Bank of Bolivia as collateral for the deposits maintained with the public. RAL fund has restrictions for its use and it is required for all banks established in Bolivia; RAL fund accrued interest at annual average rates of 5.48 and 5.42 percent as of December 31, 2008 and 2007, respectively.
(h) As of December 31, 2008, includes US$54.9 million, equivalent to S/172.3 million, of debt instruments issued by the Colombian Government (approximately US$15.4 million, equivalent to S/46.2, as of Decem-ber 31, 2007), with maturities between February 2009 and January 2017 (between January 2008 and January 2017 as of December 31, 2007) and accrued interest at annual rates that range between 2.85 and 6.78 percent (between 4.04 and 6.39 percent as of December 31, 2007).
(i) As of December 31, 2008, comprise USS$32.8 million, (equivalent to S/103.0 million), and S/6.3 mil-lion corresponding to debt instruments issued in US Dollars by Corporación Andina de Fomento – CAF and Nuevos Soles by Corporación Financiera de Desarrollo - COFIDE, respectively, (US$32.8 million, equivalent to S/98.3 million, and S/35.9 million, respectively, as of December 31, 2007). As of December 31, 2008, such bonds have maturities between January 2009 and November 2011 (between April 2008 and Novem-ber 2011 as of December 31, 2007) and accrued annual interest rates that range between 3.38 and 3.54 percent (between 3.81 and 5.89 percent, as of December 31, 2007).
(j) As of December 31, 2008 and 2007, the Bank has repurchase agreement operations (repos) over the following investments:
As of December 31, 2008, all of the Bank’s total repurchase agreement operations (repos), were operations in Nuevos Soles, where legal ownership of the related investment was transferred to the counter party; these investments accrued effective annual interest rates that range between 6.75 and 7.00 percent (between 5.51 and 5.80 percent in Nuevos Soles and between 4.85 and 6.00 percent in U.S. Dollars, as of December 31, 2007) and their maturity are between January 2009 and November 2009 (between January 2008 and December 2008, as of December 31, 2007). These operations were recorded following SBS rules, note 2(v); thus, the commitment to repurchase the investments is included in the caption “Off-balance sheet ac-counts” and are presented as “Contingent operations”, note 18(f).
2008 2007
S/(000) S/(000)
BCRP negotiable certificates of deposits
Treasury bonds of foreign governments
Peruvian Treasury bonds
924,597
-
-
728,074
175,138
114,157
924,597 1,017,369

112
(k) The movement in the allowance for available-for-sale and held-to-maturity investments is shown below:
The allowance recorded by the Bank and its Subsidiaries corresponds to specific investments for which Man-agement estimates other than temporary impairment. As of December 31, 2008 and 2007, there are no ad-ditional allowances to be recorded that would affect the Bank and its Subsidiaries net equity as of such dates.
(l) As of December 31, 2008 and 2007, the reconciliation between the book value and the market value of available-for-sale and held-to-maturity investments is as follows:
Management has estimated the market value of its available-for-sale and held-to-maturity investments using market price quotations available in the market or, if a price is not available, market value is estimated by dis-counting the expected future cash flows at an interest rate that reflects the risk classification of the financial instrument.
The Bank and its Subsidiaries have determined that the unrealized losses as of December 31, 2008 and 2007, arise from the variation of the interest rates and not for changes in the risk classification of its investments. Moreover, the Bank and its Subsidiaries have decided and have the ability to maintain these investments until the recovery of their fair value, which can occur at their maturity; therefore, no additional impairment to the one indicated in paragraph (k) exists for these investments.
(m) As of December 31, 2008 and 2007, trading, available-for-sale and held-to-maturity investments classi-fied by their maturity date is as follows:
2008 2007
S/(000) S/(000)
Balance as of January 1st
Provision of the year, note 22
Recoveries
Income from sales
6,263
7,510
(1,434)
(208)
8,966
662
(2,332)
(1,033)
Balance as of December 31 12,131 6,263
2008 2007
S/(000) S/(000)
Book value, net of allowance
Unrealized gains
Unrealized losses
9,354,334
196,097
(39,718)
8,733,764
49,927
(12,274)
Estimated market value 9,510,713 8,771,417
2008 2007
S/(000) S/(000)
Up to 3 months
From 3 months to 1 year
From 1 to 3 years
From 3 to 5 years
More than 5 years
Without maturity (equity securities and mutual funds)
4,736,051
2,466,296
296,301
302,632
1,322,391
355,234
2,231,523
4,646,925
925,030
166,624
397,550
523,576
Total 9,478,905 8,891,228

113Financial Statements 2008 Banco de Crédito del Perú and SubsidiariesNotes to the consolidated financial statements (continued)
6 Loans, net(a) This item is made up as follows:
(b) As of December 31, 2008 and 2007, 51 percent of the commercial direct loan portfolio was concen-trated in 487 and 463 clients, respectively.
(c) As of December 31, 2008 and 2007, the distribution of the loan portfolio by economic sector is as follows:
2008 2007
S/(000) S/(000)
Direct loans
Loans
Leasing receivables
Credit cards
Discounted notes
Advances and overdrafts
Factoring receivables
Refinanced and restructured loans
Past due and under legal collection loans
22,637,415
5,678,520
2,684,599
1,157,555
321,544
391,046
173,262
246,866
17,323,725
3,350,430
2,028,837
973,841
380,726
329,344
264,998
186,898
33,290,807 24,838,799
Add (less)
Accrued interest from performing loans
Deferred interest on discounted notes and leasing receivables
Allowance for loan losses (f)
279,522
(782,852)
(739,480)
196,099
(491,825)
(643,899)
Total direct loans 32,047,997 23,899,174
Indirect loans, note 18(a) 6,164,166 4,648,716
2008 2007
S/(000) % S/(000) %
Manufacturing
Mortgage loans
Commerce
Consumer loans
Mining
Communications, storage and
transportation
Micro-business loans
Electricity, gas and water
Leaseholds and real estate activities
Community services
Financial services
Construction
Agriculture
Education, health and other services
Fishing
Other
7,833,579
4,659,854
4,095,918
3,657,975
2,081,616
2,011,562
1,942,957
1,710,740
1,515,018
812,233
720,572
712,102
650,807
366,766
233,514
285,594
23.5
14.0
12.3
11.0
6.3
6.0
5.8
5.1
4.6
2.4
2.2
2.1
2.0
1.1
0.7
0.9
6,494,410
3,539,777
2,395,001
2,513,057
1,221,020
983,516
1,381,577
1,050,868
1,302,360
598,246
969,799
284,423
851,254
467,154
556,565
229,772
26.1
14.3
9.6
10.1
4.9
4.0
5.6
4.2
5.2
2.4
3.9
1.2
3.4
1.9
2.2
1.0
Total 33,290,807 100 24,838,799 100

114
(d) As of December 31, 2008 and 2007, the Bank and its Subsidiaries’ loan portfolio credit risk classification according to SBS standards, is as follows:
(e) Financial entities in Peru should constitute their allowance for loan losses based on the aforementioned credit risk classification and using the following percentages:
(i) Since 2008, the normal category included a pro-cyclical component (note 2(a)(ii)) -
(ii) Other categories; depending upon if the loans are: Loans Without Guarantees (LWG), Loans With Pre-ferred Guarantees (LWPG) or Loans With Readily Preferred Guarantees (LWRPG) or Loans with Highly Liquid Preferred Guarantees (LWHLPG):
For loans subject to substitution of credit counterparty, see note 2(e), the provision requirement depends on the credit risk classification of the respective counterparty, regardless of the debtor credit risk classification.
2008 2007
Risk category Direct loans
Indirect loans
Total Direct loans
Indirect loans
Total
S/(000) % S/(000) % S/(000) % S/(000) % S/(000) % S/(000) %
NormalPotential problemsSubstandardDoubtfulLoss
31,768,209903,651222,758245,435150,754
95.42.70.70.70.5
6,073,46177,7205,9874,2542,744
98.51.30.10.10.0
37,841,670981,371228,745249,689153,498
95.92.50.60.60.4
23,122,1711,120,783
198,793263,917133,135
93.14.50.81.10.5
4,540,34187,37714,4163,5353,047
97.71.90.20.10.1
27,662,5121,208,160
213,209267,452136,182
93.84.10.70.90.5
33,290,807 100 6,164,166 100 39,454,973 100 24,838,799 100 4,648,716 100 29,487,515 100
Type of loan 2008 2007
Fixed-rate Pro-cyclical
component
Rate
% % %
Commercial
Commercial with highly liquid preferred guarantees
Micro-business
Mortgage
Mortgage with highly liquid preferred guarantees (WHLPG)
Revolving consumer
Non revolving consumer
Non revolving consumer under eligible agreements
0.70
0.70
1.00
0.70
0.70
1.00
1.00
1.00
0.45
0.30
0.50
0.40
0.30
1.50
1.00
0.30
1.00
1.00
1.00
1.00
1.00
1.00
1.00
1.00
Risk category LWG LWPG LWRPG LWHLPG
% % % %
Potential problems
Substandard
Doubtful
Loss
5.00
25.00
60.00
100.00
2.50
12.50
30.00
60.00
1.25
6.25
15.00
30.00
1.00
1.00
1.00
1.00

115Financial Statements 2008 Banco de Crédito del Perú and SubsidiariesNotes to the consolidated financial statements (continued)
(f) The movement in the allowance for loan losses (direct and indirect loans) is shown below:
(*) The movement in the allowance for loan losses includes direct and indirect loans for approximately S/739.5 and S/74.5 million, respectively, as of December 31, 2008 (approximately S/643.9 and S/55.1 million, respectively, as of December 31, 2007). The allowance for indirect loan losses is included in the “Other liabilities, net” caption of the consolidated balance sheets, note 9(a).
In Management’s opinion, the allowance for credit losses recorded as of December 31, 2008 and 2007, has been established in accordance with SBS regulations in force as of those dates, note 2(e).
(g) The loan portfolio is collateralized with guarantees received from clients, which are a principally in the form of mortgages, stand-by letters, financial instruments, and industrial and commercial pledges.
(h) Interest accrued on the loan portfolio is determined considering current interest rates prevailing in the markets where BCP Group operates.
(i) As of December 31, 2008 and 2007, the gross direct loan portfolio has the following maturity schedule:
2008 2007
S/(000) S/(000)
Balance as of January 1st
Net provision, note 20
Loan portfolio written-off
Exchange rate and other
698,899
270,267
(140,620)
(14,568)
668,476
193,414
(121,209)
(41,782)
Balance as of December 31(*) 813,978 698,899
2008 2007
S/(000) S/(000)
Outstanding loans
Up to 1 month
From 1 to 3 months
From 3 months to 1 year
From 1 to 3 years
From 3 to 5 years
More than 5 years
5,895,670
5,491,728
8,116,794
5,286,952
3,141,984
5,110,813
6,161,061
3,637,411
4,483,301
4,438,973
2,346,392
3,584,763
Past due loans
Up to 4 months
More than 4 months
Loans under legal collection
109,269
61,220
76,377
66,680
98,402
21,816
Total 33,290,807 24,838,799

116
7 Permanent investments, net(a) This item is made up as follows:
(b) As of December 31, 2008, this caption comprises a 3.14 percent participation in shares of Banco de Crédito e Inversiones de Chile - BCI Chile held by Inversiones BCP Ltda (2.93 percent as of December 31, 2007). As of December 31, 2008 and 2007, the estimated fair value of this investment corresponds to its quotation in the Santiago Stock Exchange (Chile).
(c) As of December 31, 2008, this caption mainly comprises S/15.5 and S/6.8 million corresponding to a 35.56 and 28.27 percent participation in shares of Visanet del Perú S.A.C. and Corporación de Servicios de Información - Infocorp S.A., respectively, held by Banco de Crédito del Perú (approximately S/5.4 and S/4.9 million, which represent a 34.83 and 28.27 percent participation, respectively as of December 31, 2007).
2008 2007
Book value
Provision Net book value
Unreali-zed gains
Estimated fair value
Book value
Provision Net book value
Unreali-zed gains
Estimated fair value
S/(000) S/(000) S/(000) S/(000) S/(000) S/(000) S/(000) S/(000) S/(000) S/(000)
Listed equity securities (b)Other investments (c)
124,450
35,082
-
(1,247)
124,450
33,835
58,283
-
182,733
33,835
86,330
18,957
-
(55)
86,330
18,902
183,765
-
270,095
18,902
159,532 (1,247) 158,285 58,283 216,568 105,287 (55) 105,232 183,765 288,997
Allowance for impairment (1,247) (55)
Total 158,285 105,232

117Financial Statements 2008 Banco de Crédito del Perú and SubsidiariesNotes to the consolidated financial statements (continued)
8 Property, furniture and equipment, net(a) The movement of property, furniture and equipment and accumulated depreciation for the years ended December 31, 2008 and 2007 is as follows:
(b) Banks in Peru are not allowed to pledge their fixed assets.
(c) As of December 31, 2008, the Bank has property available for sale for approximately S/20.0 million, net of accumulated depreciation of approximately S/11.5 million (approximately S/20.2 million net of accumu-lated depreciation of approximately S/13.5 million as of December 31, 2007).
(d) Management periodically reviews the fixed assets’ residual value, their useful life and the selected depreciation method to ensure that they are consistent with their economic benefits and life expectations. In Management’s opinion, there is no evidence of impairment of property, furniture and equipment as of December 31, 2008 and 2007.
(e) As of December 31, 2008, the Bank and its Subsidiaries sold fixed assets for approximately S/5.6 million, which had a net cost of S/2.9 million (S/5.1 and S/3.6 million, respectively, as of December 31, 2007). As of December 31, 2008 and 2007, none of these sales were made to related parties.
Land Buildingsand other construc-
tions
Installa-tions
Furnitureand fix-
tures
Computerhardware
Equip-ment and
vehicles
Work in progress
and in transit
units
2008 2007
S/(000) S/(000) S/(000) S/(000) S/(000) S/(000) S/(000) S/(000) S/(000)
Cost Balance as of January 1stAdditionsSalesTransfersRetirements and other
65,2756,095(733)
--
592,6929,987
(2,637)36,442(2,583)
295,6715,078(589)
65,3881,659
194,13024,096(365)
-(33)
611,36096,509
(37,258)-
(4,899)
74,15026,668(1,283)
-(87)
51,160102,390
-(101,830)
(188)
1,884,438270,823(42,865)
-(6,131)
1,746,273152,435(14,270)
--
Balance as of December 31 70,637 633,901 367,207 217,828 665,712 99,448 51,532 2,106,265 1,884,438
Accumulated depreciationBalance as of January 1 stDepreciation of the yearSalesRetirements and transfers
----
307,90814,323(2,176)(1,399)
191,57720,923(531)
713
161,8157,463(365)(33)
512,46450,724
(35,687)(4,885)
33,9087,508
(1,234)(87)
----
1,207,672100,941(39,993)
(5,691)
1,120,49897,845
(10,671)-
Balance as of December 31 - 318,656 212,682 168,880 522,616 40,095 - 1,262,929 1,207,672
Net book value 70,637 315,245 154,525 48,948 143,096 59,353 51,532 843,336 676,766

118
9 Other assets and other liabilities(a) These items are made up as follows:
(b) In connection with the liabilities that result from Credicorp´s stock appreciation rights (SARs), (note 16), BCP signed several contracts with Citigroup Global Markets Holdings Inc., Citigroup Capital Limited and Citigroup Capital Market Inc.
These transactions consist of the purchase of up to 3,252,035 certificates indexed to the performance of the shares of Credicorp Ltd. (BAP) in the form of “warrants” issued by Citigroup, which are equivalent to the same number of Credicorp Ltd. shares. These certificates will be settled exclusively in cash with a maturity of 5 years, with the possibility of being settled totally or partially at any moment before their total or partial maturity.
According to SBS Resolution N° 1737-2006, note 2(g), the certificates have an embedded derivative, which risks are not closely related to the host contract. In this sense, the Bank has decided to designate these hybrid instruments (host contract and embedded derivative) at fair value through profit and loss; therefore, separation of the embedded derivative is not required.
2008 2007
S/(000) S/(000)
Other assets, net
Financial instruments at fair value through profit and loss -
Citigroup indexed certificates (b)
Derivatives receivable (c)
Credit linked notes(d)
386,398
234,074
-
467,035
134,623
151,481
620,472 753,139
Other, net
VAT credits
Deferred income tax and workers’ profit sharing, note 13(a)
Intangible assets, net (e)
Accounts receivable
Deferred expenses
Operations in process (f)
Income tax prepayments, net
Seized assets and realizable assets, net (g)
Repurchase agreements with transfer of legal ownership, note 2(v) y 5(j)
Terminated leasing contracts receivable, net of allowance
Other
396,843
223,672
192,968
149,903
72,055
64,514
43,150
38,253
7,573
5,106
14,963
166,274
232,809
132,358
103,618
31,931
102,319
-
82,690
56,284
1,221
17,017
1,209,000 926,521
Total 1,829,472 1,679,660
Other liabilities, net
Derivatives payable (c)
Payroll taxes, salaries and other personnel expenses payable
Accounts payable
Operations in process (f)
Provision for sundry risks (h)
Allowance for indirect loan losses, note 6(f)
Deferred income tax and workers’ profit sharing, note 13(a)
Deposit Insurance Fund
Minority interest
Income tax, net of prepayments
Repurchase agreements with transfer of legal ownership, note 2(v) y 5(j)
Other
487,264
360,230
238,244
108,934
92,938
74,498
24,863
12,356
5,634
3,788
-
3,908
93,112
507,005
246,507
108,046
104,111
55,077
74,664
9,784
10,300
39,593
15,335
10,390
Total 1,412,657 1,273,924

119Financial Statements 2008 Banco de Crédito del Perú and SubsidiariesNotes to the consolidated financial statements (continued)
As of December 31, 2008 and 2007, the Bank has acquired 2,357,523 and 2,009,523 certificates, respectively, at a total cost of US$120.3 million and US$89.4 million, respectively, equivalent to US$51.0 and US$44.5 per certificate on average, respectively. At those dates, the estimated market value amounted to US$123.1 million and US$155.9 million, respectively (US$52.2 and US$77.6 per certificate on average, as of December 31, 2008 and 2007, respectively). As of December 31, 2008, following SBS rules, the loss resulting from the difference between cost and estimated market value amounting to approximately S/191.0 million has been recorded in the caption “Other operating expenses” of the consolidated statement of income (gain of S/207.8 million as of December 31, 2007, recorded in the caption “Other non-financial income” of the consolidated statement of income), note 23.
(c) The table below presents the fair value of the derivative financial instruments, recorded as an asset or a liability, together with their notional amounts. The notional amount, recorded gross, is the amount of a derivative’s underlying asset and is the basis upon which changes in the value of derivatives are measured, note 18(d).
(*) On December 2007 and during the first months of 2008, the Bank entered into three cross currency swaps (CCS) contracts related with the fluctuation of interest and exchange rates of three fixed-rate corporate bonds issued (see note 12). These contracts, as indicated by the SBS, were initially designated as fair value hedges.
Afterwards, the Bank entered into three interest rate swaps (IRS) contracts aimed at mitigating the inher-ent risks in having a variable interest rate (Libor) for the hedged corporate bonds indicated in the previous paragraph; fixing their respective interest rates in U.S. Dollars. Therefore, in accordance with SBS regulations, the combined CCS and IRS were redesignated as cash flow hedges from the date of entering into the IRS contracts.
2008
Assets Liabilities Notional
amount
S/(000) S/(000) S/(000)
Derivatives held for trading (i)
Forward exchange contracts
Interest rate swaps
Currency swaps
88,833
103,362
41,849
137,368
119,888
49,194
7,871,447
2,402,810
719,546
Derivatives held as hedges
Cash flow hedge (ii):
Interest rate swaps
Cross currency swap and interest rate swaps (*)
-
30
55,253
60,882
1,846,012
355,958
Fair value hedge (iii):
Cross currency swap - 64,679 514,912
234,074 487,264 13,710,685
2007
Assets Liabilities Notional
amount
S/(000) S/(000) S/(000)
Derivatives held for trading (i)
Forward exchange contracts
Interest rate swaps
Currency swaps
98,995
26,243
9,385
45,844
32,250
13,116
6,813,698
1,827,082
355,181
Derivatives held as hedges
Fair value hedge (iii):
Cross currency swap - 1,902 151,058
134,623 93,112 9,147,019

120
(i) The derivative trading activities mainly relate to transactions with customers which are normally laid off with counterparties. The Bank and its Subsidiaries may also take positions with the expectation of profiting from favorable movements in prices, rates or indexes. Also included under this caption are any derivatives which do not meet IAS 39 hedging requirements.
(ii) The Bank and its Subsidiaries are exposed to movements in future interest cash flows on non-trading assets and liabilities which bear interest at variable rates. The Bank and its Subsidiaries uses IRS and CCS as cash flow hedges of these interest rate risks. A schedule indicating as of December 31, 2008 the periods when the hedged cash flows are expected to occur and when they are expected to affect the consolidated income statement is as follows:
As of December 31, 2008, the unrealized loss arising from the cash flow hedges, which are included in the “Retained earnings for cash flow” caption of the consolidated equity, amount to S/71.3 million. Likewise, the transfer of net gain on cash flow hedges to the consolidated income statement amounts to S/2.9 million.
(iii) The Bank maintains CCS, which following SBS rules, are designated as fair value hedges of subordinated and corporate bonds issued in Nuevos Soles, see note 12; related to movements in the currency exchange rates and interest rates. The Bank uses these financial derivatives to reduce its funding risk in Nuevos Soles, generating liabilities in U.S. Dollars at market rates that will be used to fund loans granted in that currency.
(d) During 2007, the Bank acquired debt instruments in the form of “Credit linked notes”, which were issued by Bear Stearns Global Asset Holdings Ltd. and were linked to the credit risk of debt instruments issued by the Peruvian Government or any successor of this (“Credit default swap”); these instruments were acquired by the Bank with the purpose of providing financial instruments with the same terms, risks and benefits to certain clients.
According to SBS Resolution N° 1737-2006, the notes included an embedded derivative which risks were not closely related to those of the host contract. In this sense, the Bank decided to designate these hybrid instruments at fair value through profit and loss; therefore, separation of the embedded derivative was not required.
During the first quarter of 2008 and before their maturity, the notes were liquidated at their respective mar-ket value, with no significant effect on the consolidated results of the Bank and its Subsidiaries.
Up to 1 year
From 1 to 3
years
From 3 to 5
years Over 5 years
S/(000) S/(000) S/(000) S/(000)
Cash outflows (liabilities) (110,781) (1,750,372) (470,104) (313,649)
Consolidated income statement (30,548) (33,583) (22,549) (6,391)

121Financial Statements 2008 Banco de Crédito del Perú and SubsidiariesNotes to the consolidated financial statements (continued)
(e) The movement of intangible assets for the years ended December 31, 2008 and 2007, is as follows:
(i) During the year ended December 31, 2008 and 2007, the Bank has capitalized disbursements related to the implementation and development of sundry computer systems (mainly SAP-ERP and SERIVA, an integrated system for Capital Market operations).
(f) Operations in process include deposits received, loans disbursed and/or collected, funds transferred and other similar types of transactions, which are made at the end of the month and not reclassified to their final consolidated balance sheets accounts until the first days of the following month. These transactions do not affect the Bank and its Subsidiaries’ consolidated net income.
(g) The movement of this caption for the years ended December 31, 2008 and 2007, is as follows:
(*) In October 2005, the procedure to compute and record the provision for seized assets was modified by the SBS. BCP recalcu-lated such provision, concluding that it presented an excess in the required provision; such excess was transferred to the consolidated balance sheet caption “Other liabilities, net”. According to SBS regulations, this excess could not be reversed and had to be used to cover future losses in the value of other assets. As of December 31, 2007, the Bank had applied such excess to provide for additional requirements of provisions for seized assets.
During the years 2008 and 2007, the Bank and its Subsidiaries sold seized assets for approximately S/65.6 and S/65.0 million, respectively, generating a net gain of approximately S/41.6 and S/39.7 million, respec-tively, which is included in the caption “Other non - financial income” in the consolidated income state-ments, note 23.
In Management’s opinion, the provision for seized assets recorded as of December 31, 2008 and 2007 complies with SBS regulations as of such dates.
Description Software Other
developments
Intangibles
in process
2008 2007
S/(000) S/(000) S/(000) S/(000) S/(000)
Cost
Balance as of January 1st
Additions (i)
Retirements and other (ii)
95,375
43,962
(1,009)
136,396
41,691
(1,942)
-
11,843
-
231,771
97,496
(2,951)
191,605
79,036
(38,870)
Balance as of December 31 138,328 176,145 11,843 326,316 231,771
Accumulated amortization
Balance as of January 1st
Amortization of the year
Retirements and other (ii)
40,524
18,885
(1,009)
58,889
18,001
(1,942)
-
-
-
99,413
36,886
(2,951)
107,099
30,862
(38,548)
Balance as of December 31 58,400 74,948 - 133,348 99,413
Net book value 79,928 101,197 11,843 192,968 132,358
Descripción Realizable
assets
Seized
assets
2008 2007
S/(000) S/(000) S/(000) S/(000)
Balance as of December 31 32,410 59,384 91,794 186,200
Provision
Balance as of January 1st
Provision
Reversal of provision due to changes
in regulations (*)
Sales
-
-
-
-
103,510
7,343
-
(57,312)
103,510
7,343
-
(57,312)
127,594
11,596
11,022
(46,702)
Balance as of December 31 - 53,541 53,541 103,510
Net book value 32,410 5,843 38,253 82,690

122
(h) As of December 31, 2008 and 2007, comprises the allowance related to the estimated losses due to legal procedures against the Bank and its Subsidiaries, the adjustments to the fair value of the acquired liabilities in the merge with Banco Santander Central Hispano - Perú (in 2002) and other similar obligations that were recorded based on Management and its legal advisors’ best estimates.
10 Deposits and obligations(a) This item is made up as follows:
The Bank and its Subsidiaries have established a policy to pay interests on demand deposits and savings accounts according to sliding interest rate scale, based on the average balance maintained in those accounts. Additionally, according to such policy, it was established that the accounts having balances that were lower than a specified amount, for each type of account, do not bear interest.
Interest rates applied to the different deposits and obligations accounts are determined by the Bank and its Subsidiaries considering interest rates prevailing in the markets where they develop their operations.
(b) As of December 31, 2008 and 2007, the balance of deposits and obligations is made up as follows:
(*) As of December 31, 2007, includes approximately S/151.5 million related to deposits which have the same terms and interest rates that the “Credit linked notes” issued by Bear Stearns Global Asset Holding Ltd., note 9(d).
(c) As of December 31, 2008 and 2007, approximately S/12,736.0 and S/9,649.3 million of the total deposits and obligations balances, respectively, are covered by the “Fondo de Seguro de Depósitos” (Deposit Insurance Fund). As of December 31, 2008, the “Fondo de Seguro de Depósitos” amounted to S/87,580.
2008 2007
S/(000) S/(000)
Non-interest bearing deposits and obligationsIn PeruIn other countries
8,229,9331,568,408
8,683,2341,256,052
9,798,341 9,939,286
Interest bearing deposits and obligationsIn PeruIn other countries
26,484,2627,266,973
17,006,5685,613,096
33,751,235 22,619,664
43,549,576 32,558,950
Interest payable 230,998 141,138
Total 43,780,574 32,700,088
2008 2007
S/(000) S/(000)
Time deposits (*)
Demand deposits
Saving accounts
Severance indemnities deposits
Bank certificates in foreign currency
Repurchase agreements with clients, note 5(j)
16,498,333
14,009,450
9,322,212
3,272,257
447,324
-
12,510,430
9,939,289
7,133,508
2,690,139
277,195
8,389
Total 43,549,576 32,558,950

123Financial Statements 2008 Banco de Crédito del Perú and SubsidiariesNotes to the consolidated financial statements (continued)
(d) The balance of time deposits classified by maturity is as follows:
As of December 31, 2008 and 2007, the amounts over 5 years correspond mainly to time deposits received from an entity related to Credicorp Ltd.
11 Due to banks and correspondents(a) This item is made up as follows:
(b) Promotional credit lines represent loans granted to BCP mainly by Corporación Financiera de Desarrollo (COFIDE) to promote the social development in Peru. As of December 31, 2008, their annual interest rates ranged between 6.20 and 7.75 percent (between 5.73 and 7.75 percent as of December 31, 2007). These credit lines are secured by a loan portfolio amounting to US$109.7 million and US$196.2 million, equivalent approximately to S/344.5 million and S/587.8 million as of December 31, 2008 and 2007, respectively. These lines include covenants specifying the use of the funds, financial conditions that the borrower must maintain and other administrative matters. In Management’s opinion, such covenants are fulfilled by the Bank, as of December 31. 2008 and 2007.
(c) As of December 31, 2008, due to banks and correspondents with foreign financial institutions comprise mainly loans to fund foreign trade operations and working capital, granted by 37 foreign entities (33 as of December 31, 2007); of which 6 represent approximately 48.6 percent of the balance (5 represent approxi-mately 46.0 percent of the balance as of December 31, 2007).
As of December 31, 2008, the balance included a syndicated loan obtained from several foreign financial entities in March 2008, amounting to US$410 million (equivalent to S/.1,287.4 million), with maturity on March 2011 and a variable interest rate (Libor). This loan replaced three loans of US$100 million each as of December 31, 2007 with a three-year maturity. The syndicated loan generates interest payments every six months at Libor + 0.70 percent during the first year, Libor + 0.75 percent for the second year and Libor + 0.85 percent for the third and final year; considering that it is subject to interest rate risk, it has been hedged using interest rate swaps for a nominal value equal to the principal and the same maturity schedule, see note 9(c).
2008 2007
S/(000) S/(000)
Up to 3 months
From 3 months to 1 year
From 1 to 3 years
From 3 to 5 year
More than 5 years
7,991,125
4,310,269
330,259
162,756
3,703,924
7,279,828
1,830,842
567,038
90,852
2,741,870
Total 16,498,333 12,510,430
2008 2007
S/(000) S/(000)
By type
Promotional credit lines (b)
Due to banks and correspondents with foreign financial institutions (c)
344,552
3,192,765
587,827
3,449,497
3,537,317 4,037,324
Interest payable 44,210 27,245
Total 3,581,527 4,064,569
By term
Short-term debt
Long-term debt
1,843,255
1,694,062
2,639,118
1,398,206
Total 3,537,317 4,037,324

124
Some of the loan agreements include standard covenants requiring the Bank to comply with financial ratios, use of funds and other administrative matters, which, in Management’s opinion, do not limit the Bank’s normal operations and has fully complied with as of the consolidated balance sheets dates, following inter-national banking practices.
As of December 31, 2008, due to bank and correspondents with financial entities accrued annual interest at rates that ranged between 3.11 and 7.77 percent (between 4.88 and 5.73 percent as of December 31, 2007).
(d) As of December 31, 2008 and 2007, the balance of this caption, classified by maturity, is as follows:
12 Bonds and subordinated notes issued(a) This item is made up as follows:
2008 2007
S/(000) S/(000)
Up to 3 months
From 3 months to 1 year
From 1 to 3 years
From 3 to 5 years
More than 5 years
1,036,636
806,619
1,576,402
20,310
97,350
1,688,879
950,239
1,015,053
316,657
66,496
Total 3,537,317 4,037,324
Weighted average annual interest rate
2008 2007 Maturity Currency 2008 2007
% % S/(000) S/(000)
Bonds
Corporate bonds (i)
Leasing bonds (i), (ii)
Mortgage bonds (ii)
Subordinated bonds (i)
Mortgage certificates
6.91
6.87
7.69
6.71
6.59
6.10
7.70
6.72
Between November 2009 and July 2018
Between June 2009 and August 2018
Between May 2011 and April 2012
Between September 2009 and May 2027
S/
S/ and US$
S/
S/
720,610
688,065
49,709
191,772
118
391,000
519,905
61,951
321,722
200
1,650,274 1,294,778
Subordinated notes (iii)
Subordinated negotiable notes certificates (iv)
Subordinated notes (v)6.957.17
6.957.17
Noviembre de 2021Octubre de 2022
US$S/
376,800445,172
359,520483,280
821,972 842,800
Total bonds and subordinated debt 2,472,246 2,137,578
Interest payable 24,981 22,706
Total 2,497,227 2,160,284

125Financial Statements 2008 Banco de Crédito del Perú and SubsidiariesNotes to the consolidated financial statements (continued)
(i) During 2008, the Bank and its Subsidiaries redeemed bonds for S/413.3 million (S/219.1 million during 2007). The detail of the new issuances is the following:
(*) As a result of several financial derivatives contracted, see note 9(c), cash flows from these bonds have been changed from Nuevos Soles to U.S. Dollars and the fixed interest rates in Nuevos Soles of 6.81 percent, 5.78 percent and 6.84 percent, respectively have been changed to a fixed interest rate in U.S. Dollars of 4.095 percent, 4.02 percent and 4.40 percent, respectively.
Issuances 2008 Issued
amount
Book
value
Currency Maturity
S/(000) S/(000)
Corporate Bonds BCP
First Issuance Series B (*)
Second Issuance Series A (*)
Third Issuance Series A
Third Issuance Series B
125,000
85,000
150,000
50,000
119,802
81,421
150,000
50,000
S/.
S/.
S/.
S/.
27/03/2015
18/04/2011
12/06/2018
10/07/2018
410,000 401,223
Leasing bonds BCP
Sixth Issuance - Series A
100,000 100,000 S/. 20/08/2018
Credileasing
Fourth Issuance Series A
Fourth Issuance Series B
Fourth Issuance Series C
Fourth Issuance Series D
Fifth Issuance Series A
Fifth Issuance Series B
32,945
94,200
78,500
56,520
40,000
5,187
32,945
94,200
78,500
56,520
40,000
5,187
US$
US$
US$
US$
S/.
S/.
08/02/2011
14/05/2011
23/06/2011
23/07/2011
28/02/2011
14/05/2011
407,352 407,352
Issuances 2007 Issued
amount
Book
value
Currency Maturity
S/(000) S/(000)
Corporate Bonds BCP
First Issuance Series A (*) 150,000 153,386 S/. 19/12/2014
Leasing bonds BCP
Second Issuance Series A
Second Issuance Series B
Second Issuance Series C
Fourth Issuance Series A
31,400
47,100
30,223
15,000
31,400
47,100
30,223
15,000
US$
US$
US$
S/.
10/06/2009
13/07/2009
13/08/2009
01/11/2010
123,723 123,723
Credileasing
Second Issuance Series A
Second Issuance Series B
Second Issuance Series C
Fourth Issuance Series A
29,960
44,940
28,837
15,000
29,960
44,940
28,837
15,000
US$
US$
US$
S/.
10/06/2009
13/07/2009
13/08/2009
12/01/2010
118,737 118,737
Subordinated bonds BCP
First Issuance Series A 15,000 15,000 S/. 25/05/2027

126
(ii) Leasing and mortgage bonds are collateralized by the fixed assets financed by the Bank.
(iii) The subordinated notes were issued through the Bank’s Panamanian Branch and has certain financial and operating covenants which, in Management’s opinion, the Bank is in compliance at the consolidated balance sheet dates.
(iv) In November 2016, the interest rate will change to a variable interest rate, established as Libor plus 2.79 percent, with quarterly payments. At that date, the Bank can redeem 100 percent of the debt, without penalties.
(v) In October 2017, the interest rate will change to a variable interest rate, established as the average of at least three valuations over the interest rate of return for sovereign bonds issued by the Peruvian Govern-ment (with maturity in 2037) plus 150 basis points, with semi annual payments. At that date, the Bank can redeem 100 percent of the debt, without penalties. A cross currency swap has been contracted over the terms of this debt, see note 9(c); as a result the principal amount and interest rate have been changed from Nuevos Soles to U.S. Dollars and from a fixed interest rate in Nuevos Soles to a variable interest rate of Libor six-month plus 99 basis points in U.S. Dollars.
(b) Bonds and subordinated notes balances classified by maturity are as follows:
2008 2007
S/(000) S/(000)
Up to 3 months
From 3 months to 1 year
From 1 to 3 years
From 3 to 5 years
More than 5 years
5,387
201,766
748,242
236,750
1,280,101
167,779
309,656
489,669
177,684
992,790
Total 2,472,246 2,137,578

127Financial Statements 2008 Banco de Crédito del Perú and SubsidiariesNotes to the consolidated financial statements (continued)
13 Deferred income tax and workers’ profit sharing(a) These items are made up as follows:
(b) Amounts presented in the consolidated balance sheets as of December 31, 2008 and 2007, and in the consolidated income statements for the years then ended are shown below:
2008 2007
S/(000) S/(000)
Deferred assets
Allowance for loan losses
Stock appreciation rights provision, note 16
Provision for sundry expenses
Allowance for seized assets
Provision for sundry risks
Allowance for impairment of investments
Past due interests
Other
113,769
42,732
31,919
11,452
4,134
2,427
5,810
11,429
79,156
84,523
27,766
16,458
10,219
-
11,420
3,267
Total deferred assets, note 9(a) 223,672 232,809
Deferred liabilities
Exchange difference
Leasing operations, net
Valuation of Citigroup indexed certificates
Other
(17,136)
(4,073)
(3,009)
(645)
(4,103)
(3,857)
(66,704)
-
Total deferred liabilities, note 9(a) (24,863) (74,664)
Net balance 198,809 158,145
Consolidated balance sheets Deferred assets Deferred liabilities
2008 2007 2008 2007
S/(000) S/(000) S/(000) S/(000)
Income tax
Workers’ profit sharing
192,082
31,590
200,069
32,740
(21,856)
(3,007)
(64,122)
(10,542)
223,672 232,809 (24,863) (74,664)
Consolidated income statements Workers’ profit sharing Income tax
2008 2007 2008 2007
S/(000) S/(000) S/(000) S/(000)
Current
Deferred
47,942
(6,385)
44,235
(3,489)
331,854
(34,279)
329,997
(32,435)
41,557 40,746 297,575 297,562

128
(c) Reconciliation of the effective tax rate to the statutory tax rate for the years 2008 and 2007 is as follows:
14 Net shareholders’ equity(a) Capital stock
As of December 31, 2008 and 2007, the Bank’s capital stock is composed by 1,508.3 and 1,286.5 million, respectively, fully subscribed and paid common shares, each with a face value of one Nuevo Sol.
The General Shareholders Meeting held on March 28, 2008, approved the capitalization of retained income corresponding to year 2007 for an amount of S/221.8 million (equivalent approximately to US$70 million).
The Board of Directors Meetings held on May 28, 2008 and October 29, 2008, approved a commitment to capitalize retained earnings corresponding to year 2008, for an amount of S/400.0 and S/320.0 million, respectively.
(b) Legal reserve
Pursuant to legislation in force, the Bank must reach a legal reserve of at least 35 percent of its paid-in capi-tal. This reserve is to be funded through an annual appropriation of at least 10 percent of its net income. As of December 31, 2008 and 2007, the Bank has reached the minimal amount required.
The Bank’s Subsidiaries established in Peru must also record this reserve in their individual financial state-ments. As of December 31, 2008 and 2007, the Subsidiaries’ reported legal reserves amounts to approxi-mately S/96.0 and S/76.5 million, respectively.
(c) Special reserve
The special reserve has been funded through the appropriation of accumulated results and is considered to be unrestricted.
The General Shareholders Meetings held on March 28, 2008, March 30, 2007 and March 31, 2006, approved an increase of the special reserve for approximately S/290.5, S/125.1 and S/107.3 million, respectively.
(d) Dividend distribution
The General Shareholders Meetings held on March 28, 2008, March 30, 2007 and March 31, 2006, agreed to distribute dividends for an amount of approximately S/371.2, S/536.5 and S/591.8 million, respectively.
Under current legislation, there is no restriction for overseas remittance of dividends or repatriation of foreign investment. Individual persons and corporations not domiciled in Peru must pay an additional tax of 4.1 percent on dividends received, which must be retained and paid by the entity that distributes the dividends.
(e) Shareholders’ equity for legal purposes (Regulatory capital)
As of December 31, 2008, contingent assets and indirect loans weighted by credit risk and the minimal equity required for market risk applicable to currency risk, determined by the Bank following current legal regulations, amounted to approximately S/33,873.5 and S/150.5 million, respectively (S/25,775.4 and S/80.0 million as of December 31, 2007, respectively), generating a global leverage ratio for credit and market risk of 8.68 times the Bank’ regulatory capital (8.44 times as of December 31, 2007). According to the Banking Law, this ratio cannot be higher than 11 time.
2008 2007
% %
Income before income taxes 100.00 100.00
Theoretical expense 30.00 30.00
Effect on taxable income
Non-taxable financial revenue (16.25) (13.03)
Effect of non-deductible expenses
Non-deductible financial expenses
Other non - deductible expenses
5.84
2.85
3.01
4.38
Income tax, current and deferred 22.44 24.36

129Financial Statements 2008 Banco de Crédito del Perú and SubsidiariesNotes to the consolidated financial statements (continued)
In June 2008, by means of Legislative Decree (LD) N°1028, the Banking Law was modified; requiring that regulatory capital must be equal to or more than 10 percent of assets and contingencies weighted by credit risk plus 10 times the regulatory capital required for operating and market risk; this ratio will increase gradually until July 2011 in accordance with the percentages and dates established in LD N°1028. In ad-dition to credit and market risk, LD N°1028 seeks to cover the operating risks of financial institutions with new capital contributions. In Management’s opinion, these modifications will have no significant impact on the Bank’s operations.
15 Tax situation (a) The Bank and its Subsidiaries are subject to Peruvian Tax Law. As of December 31, 2008 and 2007, the statutory income tax was 30 percent on taxable income.
(b) The exemption of income and capital gains taxes arising from the disposal of securities through the Lima Stock Exchange, as well as their interests and any interest or other earnings from debt instruments issued by the Peruvian public sector has been extended until December 31, 2009.
Starting January 1, 2010, interest and other capital gains from debt instruments issued by the Peruvian Republic and interest and capital gains from BCRP negotiable certificates of deposit used as monetary regula-tions, will not be subject to income tax.
(c) For income tax and value added tax purposes, the transfer prices agreed in transactions between related parties and with entities located in tax heavens, require the presentation of supporting documents and information on the valuation methods and criteria applied for the agreed price. Based on the analysis of the Bank and its Subsidiaries operations, Management and its internal legal advisors consider that no significant contingencies will result for the Bank and its Subsidiaries as a consequence of application of such provisions as of December 31, 2008 and 2007.
(d) The Tax Authority has the right to review and, if applicable, amend the annual income tax returns of the Bank and its Subsidiaries established in Peru up to four years after their presentation.
For the Bank its 2008 and 2007 income tax returns are pending to be reviewed by the Tax Authority. As at the date of this report, the 2006 income tax return is being reviewed.
For the Subsidiaries, except for year 2001 and 2003 tax returns for Credileasing and Soluciones en Procesa-miento, respectively which have already been reviewed, and the tax returns for year 2006 for Credifondo and year 2007 for Credibolsa that are undergoing a review; as of the date of this report, years 2004 to 2008 are pending to be reviewed by the Tax Authority.
Because of the potential different interpretations that the Tax Authority may give to legal rules in force, it is not possible to determine to date whether the reviews will generate additional liabilities for the Bank and its Subsidiaries. Therefore, any higher tax, penalty, interest or sanction imposed as a result of such reviews will be applied to the results of the year in which they are determined. Nevertheless, in Management and its internal legal advisors’ opinion, any possible additional tax assessment would not have significant conse-quences on the consolidated financial statements as of December 31, 2008 and 2007.
As indicated in note 17(b), the Bank has pending legal claims with the Tax Authority, related to income tax reviews for the years 1999, 2004 and 2005.

130
16 Stock appreciation rightsAs indicated in note 2(p), the Bank and its Subsidiaries have granted options on Credicorp’s (the Bank’s majority shareholder) stock appreciation rights (SARs) to certain key executives and employees who have at least one year service to the Bank. At the grant date and in each one of the subsequent three years, the granted SARs may be exercised up to 25 percent of all SARs granted in the plan. The SARs expire after eight years.
At the end of the fourth year and until the expiration date of the SARs, all of the unexercised SARs may be exercised at any time. As of December 31, 2008 and 2007, 451,925 and 258,075 SARs had been exercised under this plan for an approximate amount of US$17.8 and US$12.3 million (equivalent to S/55.9 and S/36.7 million) for the years 2008 and 2007, respectively, plus the income tax on behalf of the executives and employees that is assumed by the Bank and its Subsidiaries, equivalent to 30 percent of the amount paid.
As of December 31, 2008 and 2007, the number of SARs issued and not exercised and their prices are as follows:
Bank’s Management has estimated the SARs’ fair value as of December 31, 2008 and 2007, using the bi-nomial option pricing model, with assumptions obtained from the relevant available market information. The key assumptions used are as follows:
Year of
issuance
Number
of outstanding
SARs issued as
of December
31, 2008
Number of vested SARs
as of December 31
Exercise price
2008 2007 2008 2007
US$ US$
2000
2001
2002
2003
2004
2005
2006
2007
2008
-
60,000
60,000
133,650
183,450
235,450
329,550
433,875
551,250
-
60,000
60,000
133,650
183,450
235,450
299,550
269,891
240,469
49,750
73,000
92,500
151,900
226,450
330,594
277,550
229,500
-
8.00
4.80
6.48
7.67
10.49
15.50
24.82
48.00
72.04
8.50
5.30
6.98
8.17
10.99
16.00
25.32
48.50
-
1,987,225 1,482,460 1,431,244
Key assumptions 2008 2007
Expected volatility
Risk free interest rate
Expected lifetime
Quoted price of Credicorp shares at year-end
34.98%
6.21%
4.71 años
US$49.96
32.70%
3.50%
4.82 años
US$76.30
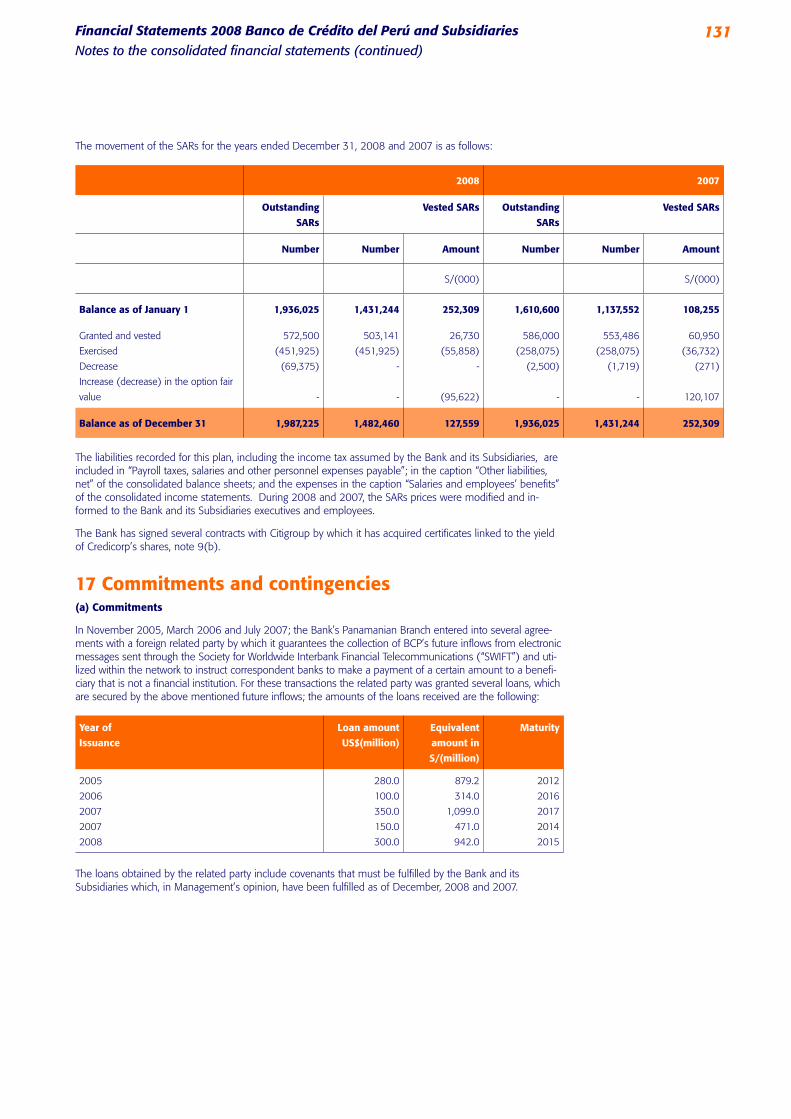
131Financial Statements 2008 Banco de Crédito del Perú and SubsidiariesNotes to the consolidated financial statements (continued)
The movement of the SARs for the years ended December 31, 2008 and 2007 is as follows:
The liabilities recorded for this plan, including the income tax assumed by the Bank and its Subsidiaries, are included in “Payroll taxes, salaries and other personnel expenses payable”; in the caption “Other liabilities, net” of the consolidated balance sheets; and the expenses in the caption “Salaries and employees’ benefits” of the consolidated income statements. During 2008 and 2007, the SARs prices were modified and in-formed to the Bank and its Subsidiaries executives and employees.
The Bank has signed several contracts with Citigroup by which it has acquired certificates linked to the yield of Credicorp’s shares, note 9(b).
17 Commitments and contingencies(a) Commitments
In November 2005, March 2006 and July 2007; the Bank’s Panamanian Branch entered into several agree-ments with a foreign related party by which it guarantees the collection of BCP’s future inflows from electronic messages sent through the Society for Worldwide Interbank Financial Telecommunications (“SWIFT”) and uti-lized within the network to instruct correspondent banks to make a payment of a certain amount to a benefi-ciary that is not a financial institution. For these transactions the related party was granted several loans, which are secured by the above mentioned future inflows; the amounts of the loans received are the following:
The loans obtained by the related party include covenants that must be fulfilled by the Bank and its Subsidiaries which, in Management’s opinion, have been fulfilled as of December, 2008 and 2007.
Year of
Issuance
Loan amount
US$(million)
Equivalent
amount in
S/(million)
Maturity
2005
2006
2007
2007
2008
280.0
100.0
350.0
150.0
300.0
879.2
314.0
1,099.0
471.0
942.0
2012
2016
2017
2014
2015
2008 2007
Outstanding
SARs
Vested SARs Outstanding
SARs
Vested SARs
Number Number Amount Number Number Amount
S/(000) S/(000)
Balance as of January 1 1,936,025 1,431,244 252,309 1,610,600 1,137,552 108,255
Granted and vested
Exercised
Decrease
Increase (decrease) in the option fair
value
572,500
(451,925)
(69,375)
-
503,141
(451,925)
-
-
26,730
(55,858)
-
(95,622)
586,000
(258,075)
(2,500)
-
553,486
(258,075)
(1,719)
-
60,950
(36,732)
(271)
120,107
Balance as of December 31 1,987,225 1,482,460 127,559 1,936,025 1,431,244 252,309

132
(b) Contingencies
As of December 31, 2008 and 2007, the Bank has received tax assessments from the Tax Authority as a result of:
The review of year 1999 income tax return: The Tax Authority determined a lower income tax credit balance for approximately S/5.9 million plus fines for approximately S/13.6 million, as of December 31, 2008. The Bank filed the corresponding claim, which was resolved in 2008 by a declaration of nullity and an order for a further examination of the disputed issues. At the date of this report, the Tax Authority is carrying out the ordered examination.
The review of years 2004 and 2005 income tax returns: The Tax Authority determined a higher income tax for approximately S/6.1 million plus interest and fines for S/3.4 million. The Bank has filed the corresponding claim and paid the amount demanded under protest.
In Management and its internal legal advisors’ opinion any possible additional tax assessment would not have any significant consequences on the consolidated financial statements as of December 31, 2008 and 2007.
In addition, the Bank and its Subsidiaries have several pending legal claims, related to their normal opera-tions which, in Management and its legal advisors’ opinion, will not result in additional liabilities to the ones already recorded by the Bank and its Subsidiaries; therefore, Management has not considered necessary to provide for an additional amount, note 9 (h).
18 Off-balance sheet accounts(a) This item is made up as follows:
2008 2007
S/(000) S/(000)
Contingent operations (b)
Guarantees and stand-by letters of credit
Import and export letters of credit (c)
Due from bank acceptances (c)
4,650,621
783,245
730,300
3,247,201
1,294,193
107,322
6,164,166 4,648,716
Foreign currency forwards contracts (d)
Responsibilities under credit line agreements (e)
Repurchase agreements (f)
Foreign currency and interest rates swap contracts (d)
Foreign currency swap contracts (d)
Other contingent operations
7,871,447
3,877,788
917,024
870,870
719,546
4,999
6,813,698
3,242,017
980,253
151,058
355,181
27,796
Total contingent operations 20,425,840 16,218,719
Other off-balance sheet accounts
Securities in custody
Risk classification of assets and contingent operations
Guarantees received (g)
Debt instruments under collection
Trust and debt trust commissions (h)
Interest Rate Swaps (d)
Written-off loans
Securities granted as warranties
Insurance coverages
Letters of credit advised
Other
96,955,082
68,835,524
46,200,240
8,406,938
6,306,665
4,604,780
3,066,972
2,915,045
2,750,143
1,431,839
12,709,515
42,494,416
51,489,217
32,316,671
6,760,332
7,377,802
1,827,082
2,884,411
604,167
2,668,009
1,399,869
16,061,046
Total other off-balance sheet accounts 254,182,743 165,883,022
Total 274,608,583 182,101,741

133Financial Statements 2008 Banco de Crédito del Perú and SubsidiariesNotes to the consolidated financial statements (continued)
(b) In the normal course of its business, the Bank and its Subsidiaries are party transactions with off-balance sheet risk exposure. These transactions expose them to credit risk in addition to the amounts recognized in the consolidated balance sheets. The Bank’s exposure to losses under commitments to extend credit, pro-vide export and import letters of credit and guarantees is represented by the contractual amounts specified in the related contracts.
The Bank and its Subsidiaries applies the same credit policies in making commitments and conditional obligations as it does for on-balance sheet instruments, including the requirement to obtain collateral to support off-balance sheet financial instruments when it is deemed necessary. Collateral held varies, but it may include deposits held in financial institutions, securities or other assets.
Because most of the contingent transactions are expected to expire without any performance being required, the total committed amounts do not necessarily represent future cash requirements.
(c) Export and import letters of credit, guarantees and stand by letters are conditional commitments issued by the Bank and its Subsidiaries to guarantee the performance of a customer to a third party. Export and import letters of credit are mainly issued as credit enhancements for overseas commercial transactions. The related credit risk is reduced by the participation of third parties.
Due from bank on acceptances represent collection rights for the Bank and its Subsidiaries that arise at the time of negotiation of the letters of credit; a collection right from the local importer (in the case of imports) or a collection right from the correspondent bank (in the case of exports).
(d) Foreign currency forwards are commitments to buy or sell currency at a future date at a contracted price and the seller commits to pay at a determined date a specific foreign currency amount. These agreements are executed to satisfy client requirements and are recognized in the consolidated financial statements at fair market value. As of December 31, 2008 and 2007, they had maturities mainly not longer than one year.
Currency swap operations are agreements to exchange United States dollars for Nuevos Soles or vice versa. These contracts are entered into in order to satisfy the needs of clients and are recorded at their estimated fair values. As of December 31, 2008, foreign currency swaps had maturities between January 2009 and September 2015 (between April 2008 and December 2014 as of December 31, 2007).
Currency and interest rate swaps are agreements to exchange payment of U.S. Dollar denominated principal and interest for Nuevos Soles. These operations were carried out in order to hedge certain liabilities, see note 9(c), and are recorded at their estimated fair values. As of December 31, 2008, these contracts had maturities between April 2011 and October 2017 (December 2014 as of December 31, 2007).
Interest rate swaps are agreements to exchange fixed and variable interest rates in the same currency for a reference amount and based on a reference interest rate, for example Libor. As of December 31, 2008, interest rate swaps were carried out for trading purposes and to hedge certain liabilities, see note 9(c), and are recorded at their estimated fair values. As of December 31, 2008, they had maturities between March 2009 and February 2018 (between February 2008 and March 2017 as of December 31, 2007).
The risk in all such operations arises from the possibility of the counterparty failing to comply with the terms and conditions agreed and of the reference rates at which the transactions take place changing.
(e) Responsibilities under credit lines agreements do not correspond to commitments to grant credits; and include credit lines and other consumer loans (credit cards) that are cancelable upon notification to the client.
(f) Corresponds to the future commitment to reacquire investments subject to repurchase agreements (repos), in which the legal ownership of the investments has been transferred according to SBS regulations, note 2(v). As of December 31, 2008 and 2007, the investments subject to repurchase agreements are detailed in note 5(j).
(g) The balance of the caption “Guarantees received” is stated at the value of the guarantee agreed as of the date of the loan contract. This balance does not necessarily represent the market value of guarantees received by the Bank and its Subsidiaries.
(h) The Bank and its Subsidiaries provide custody, trust, corporate administration, investment management and consulting services to third parties, which imply that the Bank and its Subsidiaries are involved in deci-sions over consignation (distribution), and the purchase and sale of these products. Assets kept as trust are not included in the consolidated financial statements. As of December 31, 2008 and 2007, assets managed on behalf of the Bank and its Subsidiaries clients amounted to S/5,117.5 and S/6,880.5 million, respectively.

134
19 Financial income and expensesThese items are made up as follows:
20 Provision for loan losses, netThis item is made up as follows:
2008 2007
S/(000) S/(000)
Financial income
Interest from loan portfolio
Interest from cash and due from banks and inter-bank funds
Interest from trading, available-for-sale and held-to-maturity investments
Fluctuation from derivative financial instruments position - forwards
Fluctuation from hedging derivatives instruments
Commissions on loan portfolio and other transactions
Other
2,807,602
199,344
661,908
94,308
49,592
25,990
17,068
2,145,425
214,025
445,626
43,300
-
20,337
15,168
3,855,812 2,883,881
Financial expenses
Interest on deposits and obligations
Interest and commissions on deposits from local financial entities and
international organizations
Interest on due to banks and correspondents
Interest on bonds and subordinated notes issued
Fluctuation from hedging derivatives instruments
Deposit Insurance Fund Fee
Fluctuation from derivative financial instruments position – swaps
Other
(891,042)
(248,969)
(241,378)
(161,202)
(48,375)
(46,685)
(20,939)
(33,576)
(624,135)
(188,923)
(139,988)
(116,880)
-
(39,733)
(9,277)
(19,713)
(1,692,166) (1,138,649)
Gross financial margin 2,163,646 1,745,232
2008 2007
S/(000) S/(000)
Provision (recovery) for:
Loan losses, note 6(f)
Country risk
Accounts receivable
270,267
2,042
154
193,414
(6,993)
(1,279)
Total 272,463 185,142

135Financial Statements 2008 Banco de Crédito del Perú and SubsidiariesNotes to the consolidated financial statements (continued)
21 Banking services commisions, netThis item is made up as follows:
22 Net gain on securitiesThis item is made up as follows:
2008 2007
S/(000) S/(000)
Income
Transfer and collection services
Maintenance of accounts
Credit and debit card services
Commissions from parties affiliated to the credit / debit card network
Commissions for contingent operations (indirect loans)
Trust services
Commissions for special services - credipago
Insurance commissions
Fees for consulting and technical studies
Withholding and collection services
Brokerage services
Fees related to leasing transactions
Checks issuances
Other
322,572
156,979
115,728
92,274
81,745
68,001
37,794
34,854
28,500
24,801
13,940
12,676
10,145
86,546
249,958
138,061
102,833
72,532
70,855
66,927
29,579
77,542
28,485
22,152
29,261
10,347
10,128
93,279
1,086,555 1,001,939
Expenses
Credit and debit card
Leasing commissions
Issuances of checks
Credit / debit card network
Insurances
Consulting and technical studies
Other
(43,628)
(14,101)
(7,870)
(7,018)
(6,809)
(3,692)
(12,739)
(34,571)
(11,011)
(3,776)
(6,255)
(52,713)
(4,018)
(6,009)
(95,857) (118,353)
Balance, net 990,698 883,586
2008 2007
S/(000) S/(000)
Net gain from purchase and sale of securities
Participation in permanent investments
Net (loss) gain from valuation of trading securities
Provision for impairment of trading, available-for-sale and held-to-maturity
investments , note 5(k)
Other, net
72,364
23,683
(12,819)
(7,510)
(763)
16,873
16,148
29,176
(662)
(4,009)
Total 74,955 57,526

136
23 Other non financial income and other operating expensesThese items are made up as follows:
(a) On October 2007, the Visa organization of affiliated entities completed a global restructuring to combine its affiliated operating entities, including Visa International, under a single holding company, Visa Inc. The Bank and its Subsidiaries, as affiliate members of Visa International, received shares of Visa Inc., which on March 2008 was subject to an initial public offering (IPO) in the New York Stock Exchange (NYSE). The Bank and its Subsidiaries sold approximately 56 percent of their shares in Visa Inc. as part of the IPO, recording an income of S/44.1 million.
2008 2007
S/(000) S/(000)
Other non financial income
Recoveries of loans previously written-off
Income form Visa Inc. restructuration (a)
Net gain from sales of seized assets, note 9(g)
Collection of interest previously written-off
Income from technical outsourcing services
Gain from indexed certificates, note 9(b)
Other
64,619
44,093
41,641
12,982
3,328
-
67,923
71,154
-
39,710
12,492
3,845
207,819
29,118
Total 234,586 364,138
Other operating expenses
Loss from indexed certificates, note 9(b)
Provision for legal claims
Expenses from third party services and other
Collection expenses
Maintenance of seized assets
Provision for accounts receivable
Provision for sundry risks
Other
(190,994)
(9,586)
(7,589)
(2,363)
(1,216)
(815)
(84)
(17,573)
-
(10,361)
(8,479)
(4,341)
(2,169)
(3,391)
(6,976)
(26,410)
Total (230,220) (62,127)

137Financial Statements 2008 Banco de Crédito del Perú and SubsidiariesNotes to the consolidated financial statements (continued)
24 Salaries and employees´ benefitsThis item is made up as follows:
25 Earnings per share(a) As of December 31, 2008, 2007 and 2006, the weighted average of outstanding shares was determi-nated as follows:
(b) The computation of earnings per share as of December 31, 2008, 2007 and 2006, is shown below:
2008 2007
S/(000) S/(000)
Salaries
Stock appreciation rights
Supplementary workers’ profit sharing
Legal gratifications
Social security
Severance indemnities
Vacations, medical assistance and others
501,033
(86,898)
108,336
76,413
58,596
43,238
130,529
389,558
253,455
90,192
67,954
46,017
34,002
135,148
Total 831,247 1,016,326
Average number of employees 14,573 11,722
Outstanding
shares
Shares for the
calculation
Effective days
before the
year ended
Weighted
outstanding
average shares
(in thousands) (in thousands) (in thousands)
2006
Balances as of January 1, 2006
Capitalization of income in 2008
1,286,528
221,760
1,286,528
221,760 365
1,286,528
221,760
Balances as of December 31, 2006 1,508,288 1,508,288 1,508,288
2007
Balances as of January 1, 2007 1,508,288 1,508,288 365 1,508,288
Balances as of December 31, 2007 1,508,288 1,508,288 1,508,288
2008
Balances as of January 1, 2008 1,508,288 1,508,288 365 1,508,288
Balances as of December 31, 2008 1,508,288 1,508,288 1,508,288
Year Income
(numerator)
Shares
(denominator)
Earnings per
share
S/(000) (in thousands) S/
2008
2007
2006
1,334,546
883,438
661,574
1,508,288
1,508,288
1,508,288
0.8848
0.5857
0.4386
138
26 Risk AssessmentThe Bank and its Subsidiaries’ activities are mainly related to the use of financial instruments including deriva-tives. The Bank and its Subsidiaries accept deposits from their customers at both fixed and floating rates and with different terms, with the intention of obtaining profit from interest margins by investing those funds in high-quality assets.
The Bank and its Subsidiaries seek to increase these margins by consolidating its short-term funds and lend-ing at longer periods at higher rates, while maintaining sufficient liquidity to comply with any withdrawals that may be made.
The Bank and its Subsidiaries seek to raise its interest margins by obtaining above average margins, net of provisions, through lending to commercial and retail borrowers with a range of credit standings. The expo-sure not only comprises loans and non-contingent advances but also any other indirect loans, such as credit letters and stand-by letters of credit.
The Bank and its Subsidiaries also trades financial instruments in the “Over-the- counter” and exchange mar-kets, including derivative financial instruments, for benefiting from the short term movements in market values of shares and bonds, and the fluctuations of exchange and interest rates. Management establishes limits to the Group’s exposure to market positions for daily and overnight operations. The exposure to exchange and interest rates related to these operations is normally offset and controlled through the fluctua-tions in the net cash amounts required to settle market positions.
Market risks The Bank and its Subsidiaries are exposed to market risks, which is the risk that the fair value or future cash flows of a financial instrument will fluctuate because of changes in market prices. Market risks arise from open positions in interest rates, currency, commodities and equity products; all of which are exposed to general and specific market movements and changes in the level of volatility of prices such as interest rates, credit spreads, exchange rates and equity prices. Due to the nature of the Bank and its Subsidiaries’ current activities, commodity price risk is not applicable.
The Bank and Subsidiaries separate exposures to market risk into two groups: (i) those that arise from value fluctuation of trading portfolios due to movements of market rates or prices (Trading Book) and (ii) those that arise from changes in the structural positions of non-trading portfolios due to movements of the interest rates, prices and exchange ratios (ALM Book).
Trading portfolios include those liquid positions arising from market-making transactions where the Bank and its Subsidiaries act as principal with clients or with the market. Non-trading portfolios consist of relatively illiquid positions, mainly banking assets and liabilities (deposits and loans) and non-trading investments (available-for-sale).
The risks that trading portfolios face is managed through Value at Risk (VaR) historical simulation techniques; while non-trading portfolios are managed using Asset Liability Management (ALM) techniques.
The daily market Value at Risk (VaR) is an estimate of the maximum potential loss that might arise if current positions were to be held unchanged for one trading session, taking into account a specific significance level. The measurement is structured so that daily losses exceeding the VaR figure on average occur, on average not more than one trading sessions out of one hundred. Actual outcomes are monitored regularly to test the validity of the assumptions and parameters used in the VaR calculation.
Management of the risks associated with long-term and structural positions is called Asset and Liability Management (ALM). Non-trading portfolios which comprise the ALM Book are exposed to different sensitivi-ties that can bring about a deterioration in the value of the assets compared to its liabilities and hence to a reduction of its net worth. The sensitivities to which the portfolio is exposed are of interest rate and exchange rate type, and management of re-pricing gaps.
Liquidity risk The Bank and its Subsidiaries are exposed to daily calls on its available cash resources from overnight depos-its, current account, maturing deposits, loans drawdown, guarantees and other. The Bank and its Subsidiaries do not maintain cash resources to meet all of these needs, as experience shows that a minimum level of reinvestment of maturity funds can be predicted with high level of certainty. The Bank and its Subsidiaries’ Management sets limits on the minimum proportion of funds available to meet such calls and the minimum level of inter-bank and other borrowing facilities that should be in place to cover withdrawals at unexpected levels of demands.
The matching and controlled mismatching of the maturities and interest rates of assets and liabilities is fun-damental to the Bank and its Subsidiaries Management. It is unusual for banks to be completely matched, as transacted business if often based on uncertain terms and of different types. An unmatched position potentially enhances profitability, but also increases the risk of losses.

139Financial Statements 2008 Banco de Crédito del Perú and SubsidiariesNotes to the consolidated financial statements (continued)
The maturities of assets and liabilities and the ability to replace, at an acceptable cost, interest-bearing liabilities as they mature are important factors in assessing Group’s the liquidity and its exposure to changes in interest and exchange rates.
Liquidity requirements to support calls under guarantees and stand by letters of credit are considerably less than the commited amount, because the Bank and its Subsidiaries do not generally expect the third party to draw funds under the agreement. The total outstanding contractual amount of commitments to extend credit not necessarily represents future cash requirements, as many of these commitments will expire with-out being funded.
The notes to the consolidated financial statements include an analysis of the Bank and its Subsidiaries’ main assets and liabilities by maturities based on contractual maturity dates.
Cash flow and fair value risks due to changes in interest rates The Bank and its Subsidiaries are exposed to the effect of fluctuations in the prevailing levels of market interest rates on both its fair value and cash flow risks. Interests margins may increase as a result of such changes, but may reduce or create losses in case of unexpected movements arise. Management of the Bank and its Subsidiaries sets limits on the level of mismatch of interest rate reprising that may be under-taken, which is monitored periodically.
The Bank and its subsidiaries also negotiate business instruments in the stock and over-the-counter markets including financial derivatives instruments, aimed at taking advantage of short term movements in the market and to hedge the risk of fluctuations in exchange and interest rates.
Resources for investing are mainly obtained form short-term liabilities, the interest of which are agreed at fixed and variable interest rates prevailing in the market. Loans, customer deposits and other financing instruments are subject to risk derived from interest rate fluctuations. The relevant contract maturity charac-teristics and interest rates of such financial instruments are disclosed in Notes 5, 6(h) and (i), 10(a) and (d), 11 and 12.
Currency risk The Bank and its Subsidiaries take on exposure to effects of fluctuations in the prevailing foreign currency exchange rates on its financial position and cash flows. Management sets limits on the level of exposure by currency and in total for both overnight and intra-day positions, which are monitored daily.
Most assets and liabilities are maintained in Nuevos Soles and U.S.Dollars. Foreign currency transactions are made at the free market exchange rates of the countries where the Bank and its Subsidiaries are established. As of December 31, 2008 and 2007, the Bank and its Subsidiaries’ assets and liabilities by currencies are shown in note 3.
Credit risk The Bank and its Subsidiaries take on exposure to credit risk, which is the risk that a counterparty will be unable to pay amounts in full when due. The Bank and its Subsidiaries provide impairment provisions for losses that have been incurred at the consolidated balance sheet date. Significant changes in the economy or in a particular industry segment, that represents a concentration in the Bank and its Subsidiaries’ portfolio, could result in losses that are different from those provided for at the consolidated balance sheet date. Man-agement, therefore, carefully manages its exposure to credit risk.
The Bank and its Subsidiaries structure the levels of credit risk that they undertake by placing limits on the amount of risk accepted in relation to one borrower or groups of borrowers, and to geographical and industry segments. Such risks are monitored on a revolving basis and subject to an annual or more frequent review. Limits in the level of credit risk by product, industry sector and by country are approved by the Board of Directors.
Exposure to credit risk is managed through regular analyses of the ability of borrowers and potential borrowers to meet interest and capital repayment obligations and by changing these lending limits when appropriate. Exposure to credit risk is also managed in part by obtaining corporate and personal guarantees, but there is a significant portion in personal loans (consumer loans) where no such guarantees can be obtained.
As of December 2008 and 2007, Management of the Bank ant its Subsidiaries have estimated that their maximum exposure to credit risk is represented by the book value of the financial assets that presents credit risk, which comprise, mainly, deposits in banks, trading securities, investments available-for-sale, financial instruments at fair value through profit and loss, loans and indirect loans, without considering the fair value of the guarantees and collaterals. The exposure for each borrower, including banks, is further restructured by sub-limits covering on and off balance sheet exposures, and daily delivery risk limits to trading items such as forward foreign exchange contracts. Real exposures compared against established limits are monitored daily.

140
27 Fair value Fair value is defined as the amount for which an asset could be exchanged or a liability settled, between knowledgeable, willing parties in an arm’s length transaction, assuming an on-going enterprise.
When a financial instrument is traded in an active and liquid market, its quoted market price in an actual transaction provides the best evidence of its fair value. When a quoted market price is not available, or may not be indicative of the fair value of the instrument, to determine such fair value, the current market value of another instrument that is substantially similar, discounted cash flow analysis or other estimation techniques may be used, all of which are significantly affected by assumptions used. Although Management uses its best judgment in estimating the fair value of these financial instruments, there are inherent weaknesses in any estimation technique. As a result, the fair value may not be indicative of the net realizable or liquidation value.
The methodologies and assumptions used to determine fair values depend on the terms and risk characteristics of the various financial instruments and include the following:
- Cash and due from banks represent cash and short-term deposits that do not represent significant credit or interest risks; in consequence, their book value is equivalent to their fair value.
- Trading securities are recorded at their estimated fair value at the dates of the consolidated balance sheets; in consequence, their book and fair values are the same.
- Available-for-sale investments are recognized at the lower of cost or estimated fair value; in consequence, the unrealized potential gains have been considered when estimating fair value, which is determined considering stock-market prices or other valuation techniques; thus, their book value is different from their fair value as indicated in note 5(l).
- Loans’ fair values are similar to their book value because they are mainly short-termed, granted at variable interest rates; and are shown net of their respective allowance for loan losses. The net amounts are con-sidered by Management as the approximate recoverable amounts at the dates of the consolidated financial statements.
- Management considers that the book values of permanent investments approximates to their fair value, because most of them are not listed securities and are recorded at their equity value, except for certain investments held by Inversiones BCP Ltda., which estimated fair values are indicated in note 7(b).
- Financial instruments at fair value through profit and loss, included in the caption “Other assets” are re-corded at their estimated fair value.
- The fair value of deposits and obligations is similar to its book value due, mainly, to their current maturities and interest rates, which are comparable to other similar liabilities in the market at the dates of the consoli-dated balance sheets.
- Due to banks and correspondents generate interest contracted at variable interest rates and/or preferred rates similar to the ones prevailing in the market. As a result, it is considered that their book value approxi-mates their fair values.
- Bonds and subordinated notes accrue interest at fixed or variable rates. Their fair value was estimated using discounted cash flows at rates prevailing in the market for liabilities with similar characteristics; the estimated fair value approximates the book value as of the consolidated balance sheets dates.
- As disclosed in note 18, the Bank and its Subsidiaries have various commitments to extend loans, open documentary credits and outstanding guarantees and it has received guarantees in endorsement of the granted loans. Based on the level of fees currently charged for granting such commitments and open docu-mentary credits, taking into account maturity and interest rates, together with the present creditworthiness of the counterparties, the Bank and its Subsidiaries has estimated that the difference between the book value and the fair value is not significant.
Considering the above detailed explanations, as of December 31, 2008 and 2007, Management considers that the estimated fair values of the Bank and it Subsidiaries financial instruments do not differ significantly from their book value, except for the fair values indicated in notes 5(l) and 7(b).

141Financial Statements 2008 Banco de Crédito del Perú and SubsidiariesNotes to the consolidated financial statements (continued)
28 Financial information by geographical areaAs of December 31, 2008 and 2007, segment information by geographical area is as follows (amounts expressed in millions of Nuevos Soles):
29 Transactions with related parties and related companies(a) During the years 2008 and 2007, the Bank and its Subsidiaries have acquired bonds, granted loans, supplied and requested several services, correspondent relationships and other operations with Credicorp´s subsidiaries, balances are shown below:
Loans and other contingent credits with related entities, not Credicorp’s subsidiaries, are as follows:
2008 2007
Total income
Gross financial
margin
Deprecia-tion and
amortiza-tion
Property, furniture
and equi-pment
Total assets
Total income
Gross financial
margin
Deprecia-tion and
amortiza-tion
Property, furniture
and equi-pment
Total assets
PerúPanamá BoliviaUnited States of America
4,543510396
32
1,91961
162
22
128-
10
-
792-
49
2
44,0597,8172,946
673
3,759305240
70
1,57229
115
29
120-9
-
633-
43
1
32,5197,5072,460
1,228
Total 5,481 2,164 138 843 55,495 4,374 1,745 129 677 43,714
2008 2007
S/(000) S/(000)
Assets
Cash and due form banks
Loans, net
Other assets
18,051
325,050
16,310
17,068
213,937
14,203
Liabilities
Deposits and obligations
Due to banks and correspondents
Bonds and subordinated notes issued
Other liabilities
Contingent operations
Other off-balance sheet accounts
4,877,663
-
31,605
3,556
40,897
1,193,437
2,757,560
30,367
84,400
2,840
131,828
992,436
Income
Financial income
Financial expenses
Other income
Other expenses
15,611
277,330
89,794
55,742
16,658
122,134
24,390
18,625
2008 2007
S/(000) S/(000)
Direct loans
Indirect loans
Derivatives, market value
Deposits
451,705
74,022
13,122
108,860
281,930
42,022
1,156
94,940

142
Likewise, as of December 31, 2008 and 2007, the Bank and its Subsidiaries hold debt or equity instruments, presented as securities available-for-sale, issued by related entities for an amount of S/12.5 and S/16.8 mil-lion, respectively.
The Bank has contracted insurance coverage with El Pacífico-Peruano Suiza Compañia de Seguros y Rease-guros (PPS), the related premiums amounted to S/80.5 million in 2008 (S/56.7 million in 2007); the accrued part is recorded in the caption “Administrative expenses” of the consolidated statement of income.
The Bank receives fees from Pacífico Vida S.A for the selling of life insurance through its offices and agencies to customers who have saving accounts; fees received amounted to approximately S/6.2 and S/5.1 million in 2008 and 2007, respectively.
According to Peruvian legislation, loans to related parties can not be granted on terms more favorable than those that would have been offered to the general public. Management considers that the Group has complied with all legal requirements for transactions with related parties. Loans granted to related parties are secured by guarantees and collaterals. Loans granted to related parties as of December 31, 2008, have maturities between February 2009 and July 2017 and accrue interest at interest rates that range between 5.25 and 14.0 percent (maturities between January 2008 and September 2017 and interest rates between 5.8 and 9.3 percent, as of December 31, 2007). As of December 31, 2008, the allowance for loan granted to related parties amounts to US$1.9 million (US$1.1 million as of December 31, 2007) and was estab-lished based on an individual assessment of the related parties financial positions and the market where they operate.
(b) As of December 31, 2008 and 2007, the Group has participations quotas in several mutual funds man-aged by one of its Subsidiaries, the detail is the following:
As of December 31, 2008, the Bank had entered into foreign exchange sales with mutual funds managed by Credifondo S.A. Sociedad Administradora de Fondos, with a notional amount of S/.77,019 (sales operations with notional amounts of S/.100,145, as of December 31, 2007), which are included under the caption “Contingent operations” of the consolidated balance sheet, see note 18.
(c) Loans to employees and their families
The Bank and its Subsidiaries grant loans to their employees and families for terms that depends on the different types of loans granted to third parties. Loans granted to employees and their families are mainly mortgage loans and are included under the caption “Loans, net” of the consolidated balance sheets. Generally, interest rates applied are lower than market interests rates; however, others terms are similar to those prevailing in the market. As of December 31, 2008 and 2007, the balance of loans and other facilities granted to employees, family members, directors and key executives of the Bank and its Subsidiaries amounted to S/494.0 and S/346.1 million, respectively.
(d) The Bank’s key executive’s compensation for the years 2008 and 2007, considering all payments made, is as follows:
2008 2007
S/(000) S/(000)
Trading and available-for-sale investments
Mutual funds - Credifondo U.S. Dollars
Mutual funds - Credifondo Nuevos Soles
Real estate fund - Credifondo
229,084
29,146
-
334,733
20,603
955
Total 258,230 356,291
2008 2007
S/(000) S/(000)
Stock appreciation rights, note 16
Salaries
Directors compensation
Other
84,695
16,542
4,091
25,409
81,229
16,582
3,482
38,798
Total 130,737 140,091

143Financial Statements 2008 Banco de Crédito del Perú and SubsidiariesNotes to the consolidated financial statements (continued)
30 Explanation added for translation into English
The accompanying translated consolidated financial statements were originally issued in Spanish and are presented on the basis of accounting principles generally accepted in Peru for financial entities, as described in note 3. Certain accounting practices applied by the Bank and its Subsidiaries that conform to generally accepted accounting principles in Peru for financial entities may not conform in a significant manner with generally accepted accounting principles applied in other countries. In the event of a discrepancy, the Spanish language version prevails.

144
As of December 31, 2008 and 2007 Exhibit 2008 2007
Assets US$(000) US$(000)
Cash and due from banks:
Non-interest bearing
Interest bearing
1
1,052,908
2,476,814
615,012
2,193,688
3,529,722 2,808,700
Investments:
Trading securities
Investments available-for-sale
2
3
36,084
3,405,393
50,995
3,377,558
3,441,477 3,428,553
Loans, net:
Loans, net of unearned income
Allowance for loan losses
4
10,444,723
(223,161)
8,187,848
(209,996)
10,221,562 7,977,852
Financial assets designated at fair value through profit or loss
Property, furniture and equipment, net
Due from customers on acceptances
Assets seized, net
Intangible assets and goodwill, net
Other assets 5
204,660
261,967
232,580
11,454
68,530
326,445
252,085
217,049
35,822
19,615
46,897
200,423
Total assets 18,298,397 14,986,996
Consolidated balance sheets Proforma - Unaudited

145Financial Statements 2008
As of December 31, 2008 and 2007 Exhibit 2008 2007
Liabilities and Equity US$(000) US$(000)
Deposits and obligations:
Non-interest bearing
Interest bearing
6
3,128,662
11,106,079
2,625,259
8,553,864
14,234,741 11,179,123
Financial liabilities designated at fair value through profit or loss
Due to banks and correspondents
Bankers’ acceptances outstanding
Bonds and subordinated notes issued
Other liabilities
7
8
5
162,344
1,179,863
232,580
795,295
298,081
82,724
1,459,359
35,822
721,056
375,545
Total liabilities 16,902,904 13,853,629
Shareholder’s equity
Capital stock
Reserves
Unrealized gain
Retained earnings
439,474
388,062
33,203
534,754
364,706
282,189
58,575
427,897
Total shareholder’s equity 1,395,493 1,133,367
Total liabilities and shareholder’s equity 18,298,397 14,986,996
Consolidated balance sheets Proforma - Unaudited (continued)

146
For the years ended December 31, 2008 and 2007 2008 2007
US$(000) US$(000)
Interest and dividends income
Interest on loans
Interest on deposits in banks
Interest from trading securities and investments available-for-sale
Other interest income
959,490
66,774
206,356
49,183
697,585
68,633
143,665
18,071
Total interest and dividends income 1,281,803 927,954
Interest expense
Interest on deposits and obligations
Interest on bonds and subordinated notes issued
Interest on due to banks and correspondents and borrowed funds
Other interest expense
(389,969)
(54,262)
(66,542)
(42,446)
(264,900)
(36,497)
(45,038)
(18,764)
Total interest expense (553,219) (365,199)
Net interest income and dividends
Provision for loan losses
728,584
(51,275)
562,755
(33,074)
Net interest income after provision for loan losses 677,309 529,681
Other income
Banking services commissions
Net gain on foreign exchange transactions
Net gain on sales of securities
Other
336,844
109,032
40,881
27,417
281,310
59,739
20,993
79,348
Total other income 514,174 441,390
Consolidated income statements Proforma - Unaudited

147Financial Statements 2008
For the years ended December 31, 2008 and 2007 2008 2007
US$(000) US$(000)
Other expenses
Salaries and employees benefits
Administrative expenses
Depreciation and amortization
Provision for assets seized
Other
(294,115)
(229,862)
(43,526)
(1,067)
(79,161)
(335,903)
(182,105)
(38,238)
(3,057)
(19,224)
Total other expenses (647,731) (578,527)
Income before translation result and income tax
Translation result
Income tax
543,752
(12,244)
(107,979)
392,544
29,562
(90,453)
Net income 423,529 331,653
Basic and diluted earnings per share (1,508,288 shares) 0.28 0.22
Consolidated income statements Proforma - Unaudited (continued)
Conciliation between Net income in Soles according to SBS Standards and net income under International Financial Reporting Standards (in thousands )
For the years ended December 31, 2008 and 2007 2008 2007
Net income in Soles according to SBS Standards 1,334,546 883,438
Average exchange rate 2.941 3.124
Expressed net income in dollars to exchange rate SBS 453,773 282,791
Translation result from monetary accounts in nuevos soles
Translation result from monetary accounts in US dollars
Effect on exchange rate by non monetary items
Adjustments that would be required to determine the net income under NIIF’s instead of under SBS standards
(16,809)
(12,244)
(6,258)
5,067
12,347
29,562
6,434
519
Net income in US dollars according to International Financial Reporting Standards 423,529 331,653

148
1 Cash and due from banksThis item is made up as follows:
2 Trading securities This item is made up as follows:
2008 2007
US$(000) US$(000)
Cash and clearing
Deposits in Peruvian Central Bank - BCRP
Deposits in banks
625,830
1,952,952
948,519
548,128
1,798,581
457,163
3,527,301 2,803,872
Accrued interest 2,421 4,828
Total 3,529,722 2,808,700
2008 2007
US$(000) US$(000)
Shares
Listed equity securities
Bonds and similar instruments
Peruvian treasury bonds
Corporate and leasing bonds
Bank certificates
Participation in mutual funds
Bolivian government treasury bonds
Other
161
11,885
583
364
21,471
1,341
5
24,947
20,925
1,711
1,400
762
707
7
35,649 25,512
35,810 50,459
Accrued interest 274 536
Total 36,084 50,995

149Financial Statements 2008 Banco de Crédito del Perú and SubsidiariesNotes to the consolidated financial statements (continued)
3 Investments available-for-sale(a) This item is made up as follows:
2008 2007
Amortized Cost
Unrealized gross amount Estimated Market
valueAmortized
Cost
Unrealized gross amount Estimated Market
valueGains Losses Gains Losses
US$(000) US$(000) US$(000) US$(000) US$(000) US$(000) US$(000) US$(000)
Fixed maturityBCRP deposit certificates Corporate, leasing and subordinated bonds Government treasury bonds Participation in mutual fundsCentral Banks of Bolivia deposit certificatesUS Federal Agencies bondsParticipation in RAL’s fundsNegotiable deposit certificatesBonds from international financial institutionsOther
2,196,165 125,452 530,915 81,276
217,516 -
73,268 -
34,799 7,624
2,938 4,566
33,579 2,095
115 - - -
116 -
(2,818) (4,293) (2,245)
(478) (81)
- - -
(587) (267)
2,196,285 125,725 562,249 82,893
217,550 -
73,268 -
34,328 7,357
2,410,062 68,626
388,903 133,563 121,705
837 56,641 2,692
44,796 10,021
224 1,970 6,478
120 38 3 - 1
143 97
(3,281) (500) (271)
- (96)
- - - -
(4)
2,407,005 70,096
395,110 133,683 121,647
840 56,641 2,693
44,939 10,114
3,267,015 43,409 (10,769) 3,299,655 3,237,846 9,074 (4,152) 3,242,768
SharesListed securities Non-listed securities
30,062 2,697
52,338 -
(97) -
82,303 2,697
40,622 2,117
75,930 -
(367) -
116,185 2,117
32,759 52,338 (97) 85,000 42,739 75,930 (367) 118,302
3,299,774 95,747 (10,866) 3,384,655 3,280,585 85,004 (4,519) 3,361,070
Accrued interest 20,738 16,488
Total 3,405,393 3,377,558
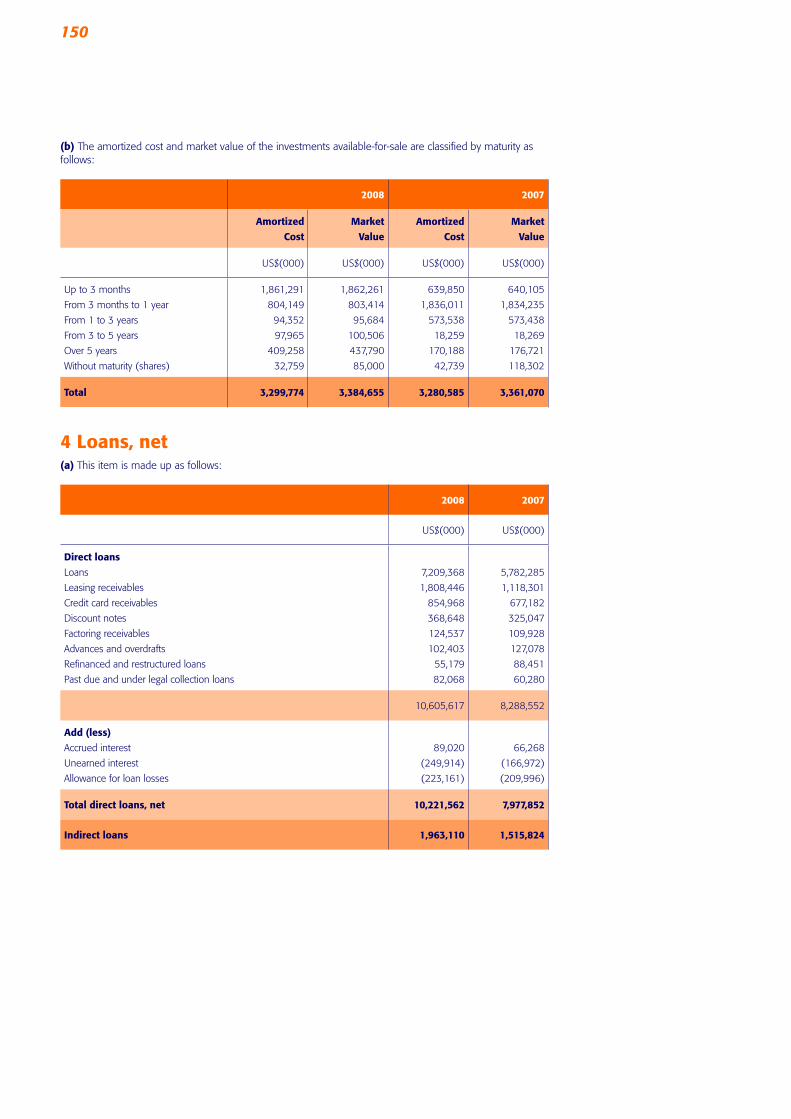
150
(b) The amortized cost and market value of the investments available-for-sale are classified by maturity as follows:
4 Loans, net(a) This item is made up as follows:
2008 2007
Amortized
Cost
Market
Value
Amortized
Cost
Market
Value
US$(000) US$(000) US$(000) US$(000)
Up to 3 months
From 3 months to 1 year
From 1 to 3 years
From 3 to 5 years
Over 5 years
Without maturity (shares)
1,861,291
804,149
94,352
97,965
409,258
32,759
1,862,261
803,414
95,684
100,506
437,790
85,000
639,850
1,836,011
573,538
18,259
170,188
42,739
640,105
1,834,235
573,438
18,269
176,721
118,302
Total 3,299,774 3,384,655 3,280,585 3,361,070
2008 2007
US$(000) US$(000)
Direct loans
Loans
Leasing receivables
Credit card receivables
Discount notes
Factoring receivables
Advances and overdrafts
Refinanced and restructured loans
Past due and under legal collection loans
7,209,368
1,808,446
854,968
368,648
124,537
102,403
55,179
82,068
5,782,285
1,118,301
677,182
325,047
109,928
127,078
88,451
60,280
10,605,617 8,288,552
Add (less)
Accrued interest
Unearned interest
Allowance for loan losses
89,020
(249,914)
(223,161)
66,268
(166,972)
(209,996)
Total direct loans, net 10,221,562 7,977,852
Indirect loans 1,963,110 1,515,824

151Financial Statements 2008 Banco de Crédito del Perú and SubsidiariesNotes to the consolidated financial statements (continued)
(b) As of December 31, 2006 and 2005, direct loan portfolio is distributed among the following economic sectors:
(c) As of December 31, 2008 and 2007, the credit risk classification of the loan portfolio is as follows:
2008 2007
US$(000) % US$(000) %
Sector
Manufacturing
Mortgage loans
Commerce
Consumer loans
Electricity, gas and water
Micro-business
Leaseholds and real estate activities
Mining
Communications, storage and transportation
Agriculture
Financial services
Construction
Fishing
Education, health and other services
Other
2,495,420
1,390,060
1,305,836
1,164,670
546,005
606,168
482,711
662,999
640,524
207,733
323,917
226,917
74,367
128,022
350,268
23.5
13.1
12.3
11.0
5.1
5.7
4.6
6.3
6.0
2.0
3.1
2.1
0.7
1.2
3.3
2,166,916
1,121,775
866,607
864,491
341,708
493,360
382,179
455,919
389,859
167,338
271,305
195,724
129,770
105,834
335,767
26.1
13.5
10.5
10.4
4.1
6.0
4.6
5.5
4.7
2.0
3.3
2.4
1.6
1.3
4.0
Total 10,605,617 100 8,288,552 100
2008 2007
Credit risk classification
Direct loans
Indirect loans
Total Direct loans
Indirect loans
Total
US$(000) % US$(000) % US$(000) % US$(000) % US$(000) % US$(000) %
NormalPotential problemsSubstandardDoubtfulLoss
10,141,599 264,735 70,356 79,545 49,382
95.6 2.5 0.7 0.8 0.4
1,937,887 21,628 1,657 1,178
760
98.7 1.1 0.1 0.1 0.0
12,079,486 286,363
72,013 80,723 50,142
96.1 2.3 0.6 0.6 0.4
7,698,155 384,198 68,145 90,469 47,585
92.9 4.6 0.8 1.1 0.6
1,479,156 29,563
4,878 1,196 1,031
97.6 2.0 0.3 0.1
-
9,177,311 413,761 73,023 91,665 48,616
93.6 4.2 0.7 0.9 0.6
Total 10,605,617 100 1,963,110 100 12,568,727 100 8,288,552 100 1,515,824 100 9,804,376 100

152
5 Other assets and other liabilitiesThis item is made up as follows:
2008 2007
US$(000) US$(000)
Other assets
Financial instruments:
Accounts receivable
Operations in process
Value added tax
Income tax prepayments, net
46,630
18,953
124,880
13,743
36,097
34,152
55,989
2,110
204,206 128,348
Non-financial instruments:
Deferred expenses
Deferred income tax asset
Deferred workers’ profit sharing
Investment in related companies
Other
22,455
62,494
10,060
7,240
19,990
9,820
45,294
8,037
3,035
5,889
122,239 72,075
Total 326,445 200,423
Other liabilities
Financial instruments:
Tax, payroll salaries and other personnel expenses
Accounts payable
Operations in process
Contributions
Allowance for indirect loan losses.
113,817
67,007
41,839
-
23,726
170,852
68,141
36,043
24,072
18,383
246,389 317,491
Non-financial instruments:
Deferred income tax liability
Transfers received in process
Provision for sundry risks
Deposit insurance fund
33,922
2,896
10,939
3,935
19,623
16,096
19,069
3,266
51,692 58,054
Total 298,081 375,545

153Financial Statements 2008 Banco de Crédito del Perú and SubsidiariesNotes to the consolidated financial statements (continued)
6 Deposits and obligations(a) This item is made up as follows:
(b) As of December 31, 2008 and 2007, deposits and obligations are classified by type as follows::
2008 2007
US$(000) US$(000)
Non-interest bearing deposits and obligations
In Peru
In other countries
2,724,717
403,945
2,206,016
419,243
3,128,662 2,625,259
Interest bearing deposits and obligations
In Peru
In other countries
8,712,457
2,320,056
6,633,435
1,873,530
11,032,513 8,506,965
14,161,175 11,132,224
Interest payable 73,566 46,899
Total 14,234,741 11,179,123
2008 2007
US$(000) US$(000)
Time deposits
Demand deposits
Saving deposits
Severance indemnity deposits
Client - Repurchase agreements
Bank and Deposit negotiable certificates
5,257,655
4,458,300
2,968,842
1,039,887
294,030
142,461
4,175,712
3,260,787
2,381,012
896,283
325,908
92,522
Total 14,161,175 11,132,224

154
(c) Time deposits are classified by maturity as follows:
7 Due to banks and correspondents This item is made up as follows:
2008 2007
US$(000) US$(000)
International funds and others
Promotional credit lines
Inter-bank funds
1,016,803
109,730
39,217
1,151,367
196,204
102,470
1,165,750 1,450,041
Interest payable 14,113 9,318
Total 1,179,863 1,459,359
2008 2007
US$(000) US$(000)
Up to 3 months
From 3 months to 1 year
From 1 to 3 years
From 3 to 5 years
More than 5 years
2,548,163
1,372,824
105,241
51,833
1,179,594
2,429,650
611,096
189,265
30,525
915,176
Total 5,257,655 4,175,712

155Financial Statements 2008 Banco de Crédito del Perú and SubsidiariesNotes to the consolidated financial statements (continued)
8 Bonds and subordinate notes issued(a) This item is made up as follows:
(b) The bonds and subordinate notes issued as of December 31, 2008 and 2007, classified by maturity are shown below::
Weighted average annual interest rate
2008 2007 Maturity 2008 2007
% % US$(000) US$(000)
BondsCorporate bonds
Leasing bonds
Mortgage bonds
Subordinated bonds
6.91
6.87
7.69
6.71
6.59
6.10
7.70
6.72
Between November 2009 and July 2018
Between June 2009 and August 2018
Between May 2011 and April 2012
Between September 2009 and May 2027
229,494
219,129
15,868
61,074
130,507
173,535
20,744
107,383
Total bonds 525,565 432,169
Subordinate notesSubordinated negotiable certificates notes
Subordinated notes 120,000 141,774
120,000 161,308
Total subordinate notes 787,339 713,477
Interest payable 7,956 7,579
Total 795,295 721,056
2008 2007
US$(000) US$(000)
Up to 3 months
From 3 months to 1 year
From 1 to 3 years
From 3 to 5 years
Over 5 years
1,716
64,257
238,294
75,398
407,674
62,544
96,823
163,441
59,306
331,363
Total 787,339 713,477

156
Risk ratings Risk ratings Rating
Standard & Poor’s
Domestic currency
Foreign currency
BBB- / Stable /
A-3
BBB- / Stable /
A-3
Moody’s
Financial strength
Long term deposits - foreign currency
Long term deposits - domestic
currency
Outlook
Subordinated debt - foreign currency
Subordinated debt - domestic currency
D+
Ba2
Baa2 / P-2
Stable
Baa3
Baa3
Fitch Ratings
Long term issuances
Long term issuances in domestic
currency
Short term issuances
Short term issuances in domestic
currency
Outlook
Subordinated debt
Support
BBB-
BBB-
F3
F3
Positivo
BB+
BB+

157Risk ratings
Risk ratings Rating
Company rating
Short term time deposits
1st Program of negotiable
certificates of deposits
2nd Program of negotiable
certificates of deposits
Leasing bonds
Medium and long term deposits
Mortgage certificates
Corporate bonds
Mortgage bonds
Subordinated bonds
Common stock
A+
CP-1+ (pe)
CP-1+ (pe)
CP-1+ (pe)
AAA (pe)
AAA (pe)
AAA (pe)
AAA (pe)
AAA (pe)
AA+ (pe)
1ª (pe)
Risk ratings Rating
Company
Short term time deposits
Negotiable certificates of short term
deposits
Medium and long term deposits
Negotiable certificates of long term
deposit
Corporate bonds
Leasing bonds
Mortgage bonds
Subordinated bonds
Common stock
A+
EQL 1+
EQL 1+
AAA
AAA
AAA
AAA
AAA
AA+
1ª

158
Board of Directors and Executive Committee
Board of Directors Dionisio Romero S. Chairman
Dionisio Romero P. Vicechairman
Jorge Camet Director
Fernando Fort M. Director
Eduardo Hochschild Director
Juan Bautista Isola Director
Reynaldo Llosa Director
Benedicto Cigüeñas Director
Luis Nicolini Director
Juan Carlos Verme Director
Luis Enrique Yarur Director
Felipe Ortiz de Zevallos Director
Germán Suárez Director
Executive CommitteeDionisio Romero S. Chairman
Dionisio Romero P. Director
Fernando Fort M. Director
Reynaldo Llosa Director
Juan Carlos Verme Director
Benedicto Cigüeñas Director

159
Management Management
Walter Bayly General Manager
Central Management
Alvaro Correa
José Luis Muñoz
André Figuerola
Central Planning and
Finance Manager
General Accounting
Treasury and Foreign
Exchange Operations
Pedro Rubio
Christian Laub
Andrés Arredondo
Luis Alfonso Carrera
Central Wholesale
Banking Manager
Corporate Banking
Division
Institutional Banking Division
Corporate Finance
Fernando Fort G.
Miguel del Mar
Luis Bouroncle
Pedro Bordarampé
Francisco Paz
Gonzalo Álvarez-Calderón
Andrés Ferrand
Middle Market Banking
Division
Middle Market Banking Lima 1
Middle Market Banking Lima 2
Middle Market Banking Lima 3
Business Services
International Business
Leasing

160
Javier Maggiolo
Bruno Ghio
Ignacio Aguirre
Pablo Rojas
Augusto Pérez
Jose Manuel Peschiera
Central Asset
Management Manager
Investments Management
Investment Products
Management
Portfolio Management
Products and Technology
Management
Fiduciary Business
Gianfranco Ferrari
Carlos Morante
Percy Urteaga
Jorge Mujica
Enrique Rizo Patrón
Lionel Derteano
Javier Ichazo
Paul Macarachvili
Nancy Tueros
Alfredo Fernández
Central Retail
Banking Manager
Commercial Division
Commercial Banking Lima 1
Commercial Banking Lima 2
Commercial Banking Lima 3
Commercial Banking Lima 4
Commercial Banking
Provinces 1
Commercial Banking
Provinces 2
Sales
Real Estate Business
Ricardo Bustamante
Italo Muñoz
Carlos Herrera
Ivana Osores
Bruno Rivadeneyra
César Sanguinetti
Patty Canales
System and Organization
Division
Business Solutions
Infrastructure and IT
Operations
System Development
System Development
Process and Information
Management
Systems Action
Improvement
Jorge Ramírez del Villar
Augusto Astete
César Ríos
Jose Marangunich
Agustín Pestana
Jose Ignacio Maúrtua
Process and
Administration Division
Operations
Retail Banking Collection
Fraud Prevention
Central Administration
Infrastructure Division
Fernando Dasso
María del Pilar Ruiz
Arturo Johnson Pastor
Constantino Sulopulos
Ernesto Melgar
Antonio Di Paola
Werner Harster
Marketing Division
Products
Customer Service Channels
Management
Commercial Management
Marketing
Insurance Banking
Quality

161
Walter Bayly General Manager
Alvaro Correa Central Planning and Finance Manager
Pedro Rubio Central Wholesale Banking Manager
Javier Maggiolo Central Asset Management Manager
Gianfranco Ferrari Central Retail Banking Manager
Board of Directors, Executive Committee Management.

162
Others
Reynaldo Llosa
Pablo Miñán
Risks Division
Credit Management
Division
Alicia Franco
Alfonso Gavilano
Álvaro García
Javier Gómez
Luis Rivera
Cristina Arias
Juan Inchaústegui
Harold Marcenaro
Foreign Bank Risk and
Corporate Credit Risk
Middle Market Banking
Credit - Lima
Middle Market Banking
Credit - San Isidro
Central Credit
Monitoring and Control of
Credit
Special Accounts
Risks Management
Retail Banking Risks
Javier Otero
Alvaro Carrulla
Aida Kleffmann
Luciana Puente
Maritza Podestá
Coporate Business
Division
Institutional Relations
Investor Relations
Social Responsibility
Government Relations
Franco Giuffra
Karim Mitre
Bernardo Sambra
Management and Human
Development Division
Planning and Development
MGD Advisor
Mario Ferrari
Guillermo Morales
Legal Division
Legal Advisor
Jorge Bellido Audit Division
Bárbara Falero Prevention and Compliment
Fernando Palao Corporate Secretary

163Contacts
ContactsLima HeadquartersCalle Centenario 156, La Molina Lima 12, Perú Telephone (511) 313-2000 (511) 625-2000
Offshore BranchesMiami, United States of America 121 Alhambra Plaza, Suite 1200 Coral Gables, Florida 33134 United States of America Telephone (305) 448-0971 Fax (305)448-0981
Panamá, Republic of Panama Calle 50 y Aquilino de la Guardia, Torre Banco Continental, pisos 28 y 29, Apartado 6 8934 El Dorado, Panamá, Republic of Panama Telephone (507) 215-7311 Fax (507) 215-7323
BCP BoliviaLa Paz Headquarters Esquina calle Colón y Mercado N° 1308, La Paz, Bolivia Telephone (5912) 233-0444 Fax (5912) 239-1044
CreditsDesign and ConceptStudioa
Editing and editorial oversightb+A Comunicación Corporativa
Photography José Carlos Martinat
PrintingGráfica Biblos

Calle Centenario 156, La Molina Lima 12, Perú Telephone (511) 313 2000 www.viabcp.com

Management Report
2008
Atlantic Security Holding Corporation

1
Content
Main indicators
Market comment
Financial results
Consolidated Balance Sheet
Consolidated Statement of Income and Expenses
Board of Directors and Executive Committee
2
3
5
8
9
10
1
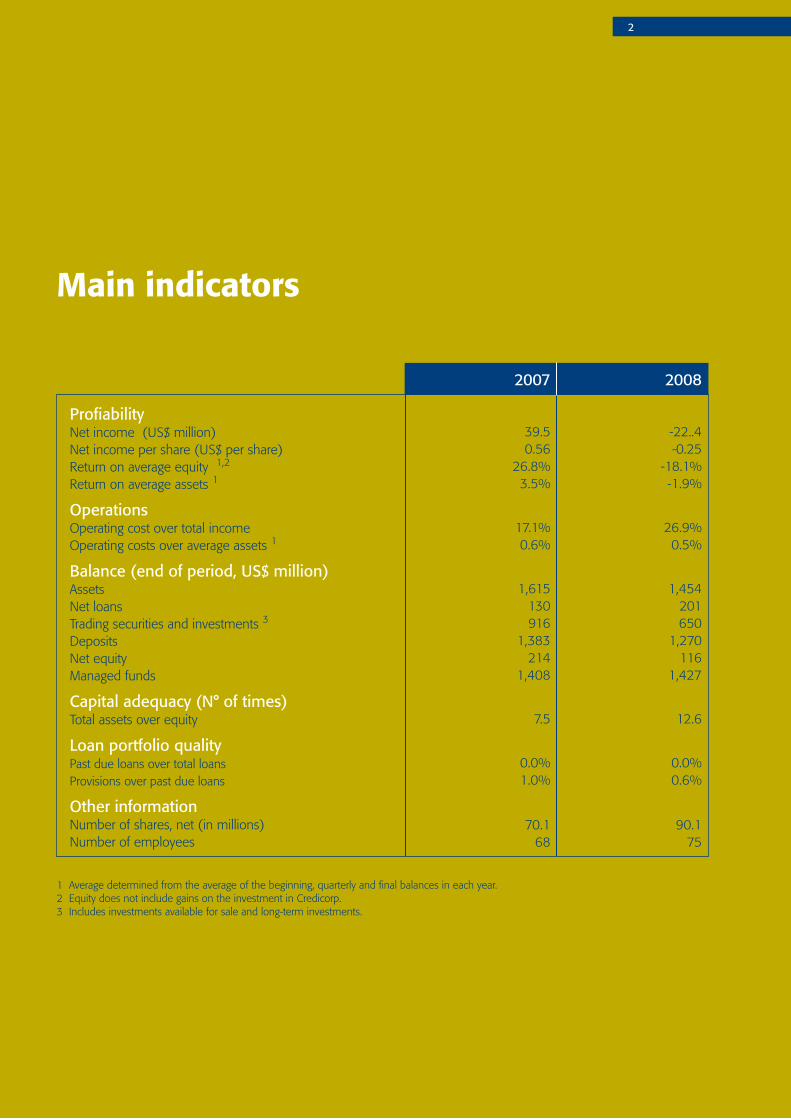
Main indicators
1 Average determined from the average of the beginning, quarterly and final balances in each year.2 Equity does not include gains on the investment in Credicorp.3 Includes investments available for sale and long-term investments.
Profiability Net income (US$ million) Net income per share (US$ per share) Return on average equity 1,2 Return on average assets 1
OperationsOperating cost over total income Operating costs over average assets 1
Balance (end of period, US$ million)Assets Net loans Trading securities and investments 3 Deposits Net equityManaged funds
Capital adequacy (N° of times) Total assets over equity
Loan portfolio quality Past due loans over total loans Provisions over past due loans
Other informationNumber of shares, net (in millions) Number of employees
20082007
39.5 0.56
26.8%3.5%
17.1% 0.6%
1,615 130 916
1,383214
1,408
7.5
0.0%1.0%
70.168
-22..4 -0.25
-18.1%-1.9%
26.9% 0.5%
1,454 201 650
1,270116
1,427
12.6
0.0%0.6%
90.175
2

The effects of the sub-prime mortgages crisis that initiated in 2007 and its later contagion to
the whole U.S. Financial system became more critical during this 2008, year that would be
remembered for being the start of the most severe financial crisis in the U.S. since “The Great
Depression” of 1929. This year is marked with several milestones ranging from bankruptcy of
large traditional Wall Street Investment Banks; intervention of the U.S. Government and control
take over of companies with well known financial strength to the promotion of a Financial Relief
Program from the U.S. Government.
With the effects of the financial sector crisis and announcements of poor economic performance
through the year, until the declaration of an U.S. economy in true recession, the FED decreased its
intervention rate in more than 300 basis points to leave its FED Funds rate ranging between 0%
and 0.25% as of December 2008, reporting historic lowest levels of this rate.
The general market crisis pushed for widening of credit risk spreads in debt markets. This was more
noticeable in the difference between LIBOR rate and U.S. Treasury rate, especially in the short term.
This also implies that the yield curves for different risk levels will tend to become sloppiest
Market comment
3

4
4
This market condition was translated in a higher volatility on global capital markets, with more
impact during this last quarter of 2008. At stock market level, in general terms most of the profits
made during year, were reverted with negative corrections between September and October, being
this the month in which historical negative results were reported. At debt market level, an important
transition to low-risk securities has been observed (flight-to-quality), a move that although represents
lower returns, provides capital protection in contrast to securities that represent higher risks.
Global markets closed the last quarter in negative territory, being harshly affected by the general
financial crisis, which had a significant impact in all markets and in the world economy. The financial
sector crisis and mortgage market had impact in the real sector of the economy, mostly in the
developed regions (U.S., Europe and Japan), whose countries went also into recession, due to
the weakening of their main macroeconomic indicators, internal consumption rates and private
investment, which in turn propelled higher unemployment rates. Under this scenario, the main
World Central Banks were forced to lower their interest rates like the U.S. did with its FED Funds
rate. Along with the weakening macroeconomic conditions, a strong increase in market volatility
was also observed, forcing investors to take protection under U.S. Treasury Bonds, causing that
short-term bonds yielded minimum rates.

5
From all of the Credicorp subsidiaries, ASHC received the strongest embattlement from the financial
crisis. The impact of the severe financial crisis affected the results for the year 2008 that represented
a loss for US$ 22.4 million. This performance has no precedent in the history of ASHC and was
caused mainly by a large impairment charge of securities affected by the market meltdown that
reached US$ 35.4 million for the year and by a provision for potential losses and contingencies
related to the alleged Madoff fraud that was constituted for a total of US$ 43.5 million.
Atlantic US Blue Chip Fund (AUSBCF) one of the funds managed on behalf of our customers went
insolvent as a result of the collapse of Madoff Securities. Confronted by this alleged fraud, the
company decided to constitute provisions anticipating losses in its proprietary positions as well as
any other potential contingencies arising from such event.
Income from dividends
Higher dividend income is the result of the ASHC stockholding position in Credicorp Ltd. This year, this
revenue is 14% higher, due to better results reported by Credicorp Ltd., in 2007. Notwithstanding,
this dividend income is eliminated in the reporting consolidation, therefore the ASCH contribution
to Credicorp Ltd., resulted in a US$ 50.4 million loss.
Financial results

Net income from interests
Net interest income presents an increase of 21% due to the widening of spreads, obtained
through the year, until the third quarter, as a result of the combined effect of interest rate
drop-down and short term deposit structure of the Bank, allowing quick repricing effect
and consequently a lower cost of funds with locked-in higher and longer term interest
rates on the asset side. By mid third quarter, the stabilization on interest rate environment
was observed which maintained the cost of funds in more stable levels.
Income from commissions
Commission’s income derived from asset management presents a decrease of 8%
originated by lower market value of managed funds, being this main factor for calculation
of performance incentive and management commissions.
Foreign exchange
Foreign exchange currency operations report a loss of US$ 320 thousand, originated by
EUROS and British Pounds positions, currencies with strong devaluation within current
economic global turmoil.
6

7
Balance Sheet
Balance sheet decreased 10%, decrease concentrated in Available-for-Sale Investments which in
turn decreased 33% due to the combination of maturities, sales and market value loss reported as
a separate component in shareholders’ equity as unrealized loss.
Return on average equity (ROE) went from 23.8% during 2007 to -18% in 2008. Meanwhile,
return on average assets went from 3.5% to -1.9% in the same period. Operative expenses
maintained same levels in relation to prior year. Core revenues increased from US$ 49.0
millions to US$ 54.0 million. Other income / expenses include charges related to Madoff Securities
of US$ 36 million, to report an efficiency ratio of 26% for 2008 after reporting 17.1% for 2007.
Notwithstanding, without considering the effect of Madoff Securities, an adjusted efficiency ratio
reports 12.4%
For 2009, although ASHC will not modify its low risk proprietary investment strategy, an increase
in financial margin is expected as a direct consequence of credit spreads widening. Regarding,
Asset Management business it is expected to take advantage of the fact in spite of the extreme
market conditions of 2008, adequate returns were obtained by our customers and although the
reduced figures, these outperformed those from our competitors. These facts should contribute in
maintaining steady growth of the business.
ASHC aspires to maintain recognition from its customers, as the best investment manager in the
market, with the best global products offer with the intention to attend each customer profile, with
returns, diversification and risk controls and the best financial advisory team. This identity has been
built over all years ASHC has operated in the market and it is based on its high-quality standards.

8
Assets Available funds Cash and banks Deposits in banks Overnight funds Investments available for sale, net Investments available for sale ASB Investments available for sale ASB Corporate Investment STL Loans, net Loans, net Less: provisions Other investments Fixed assets, net Other assets
Total assets
Net liabilities and shareholder’s equity Deposits Current account deposits term deposits Liabilities ASB Other liabilities
Total liabilities
Net shareholder’s equity
Total liability and net shareholder’s equity
Consolidated Balance Sheet
548,106 65
530,59117,450
853,739853,739
00
130,096131,419(1,323)61,838
18821,374
584,41226
438,385 146,000575,600575,600
12,47412,474
201,405202,581(1,176)61,838
26318,256
1’454,2481’615,341
1’382,88296,625
1,286,25700
18,354
1’270,213162,862
1,107,35115,00015,00053,326
1’338,540
1’454,248
115,708
1’401,237
1’615,341
214,105
(US$ 000) (US$ 000)2007 2008

9
Consolidated Statement ofIncome and Expenses
Income and expenses from interests Income from interests Income from dividends Expense from interests Income from interests, net
Non financial revenues Commissions from services Earnings from sales of securities Net earning (loss) from exchange operations Other revenues Provision for loans Provision for trading securities Operating expenses Salaries and benefits of employees General and administration expenses Depreciation and amortization Other expenses Net Income
2007(US$ 000)
(292)
87,924 19,566
(69,214)
15,8309,1642,5812,0392,047
38,276
(4,167)(4,962)
(120)(5)
39,544
(5,017)
(9,254)
2008(US$ 000)
(1,000)
79,842 22,365
(55,758)
(15,374)8,4558,222(322)
(31,729)
46,448
(4,417)(3,799)
(127)(39)
(22,439)
(44,130)
(8,384)

Board of Directors
Chairman
Vice chairman
Directors
Eduardo Montero
Fernando FortReynaldo LlosaFernando MonteroRaimundo MoralesJuan Carlos VermeBenedicto Cigüeñas
Executive Committee
General Manager
Dionisio Romero S.
Dionisio Romero P.
10

Pacífico Insurance Group
Management Report
2008

Contents
1
Main indicators
The Peruvian insurance market
The insurance business Pacífico Seguros Pacífico Vida Pacífico Salud EPS
Consolidated Balance Sheet
Profit and Loss Statement
Board
2
3
8
17
19
18
8
12
15

Main indicators 1
2008
372.6 63.550.0
259.1186.526.910.934.889.461.253.313.6
996.2728.9629.4706.3236.753.2
2.1025.4%5.8%
23.8%16.2%72.0%14.6%13.4%23.6%6.7%
104.4%
25.41,467
467.2 97.462.6
307.3238.631.321.915.576.872.512.59.4
1,197.9821.3817.5932.8206.159.1
0.465.6%1.1%
17.2%16.9%77.7%17.3%5.0%
23.6%6.6%
115.4%
27.12,242
587.6 111.270.6
405.7341.956.814.7(7.7)70.480.4
(15.0)(15.9)
1,298.9822.3968.5
1,113.0146.339.7
n.d.-8.5%-1.2%
11.3%14.8%84.3%17.6%-1.9%19.8%6.4%
118.3%
27.12,316
2006 2007
Profit and loss statement (US$ million, at the end of period)Total premiums Ceded premiumsIncrease in ReserveNet earned premiumsNet claimsNet commissionsNet technical expensesTechnical resultsFinancial performanceGeneral expenses and provisionsNet consolidated incomeContribution to Credicorp
Balance (US$ million, end of period)Assets Investments in secuirities and real propertyTechnical reserves Total liabilitiesNet shareholders’ equityMinority interests
Profiability Net profit per share (US$ per share) Return on average equity 2
Return on average assets 2
Operating ratiosEquity / total assetsIncrease in technical reservesNet claims / net premiumsExpenses and commissions / net earned premiumsTechnical results / net earned premiumsOperating expenses and fees / net earned premiumsOperating expenses and fees / average assets 2
Combined ratio 3
Other informationNumber of shares, net (in millions) Number of employees
1 Non-audited numbers according to International Fiancial Reporting Standars (IFRS). 2 Average are calculated using the average initial balance and final balance of each period. 3 It does not include Pacífico Vida.
2

As of December 2008, in terms of production, the insurance market’s net premiums
were US$ 1,466.7 million, 24.1% higher than the figure recorded for the same period last
year. Premiums corresponding to general insurance grew 25.7% to total US$ 846.4 millon,
while premiums associated with the Life, Pension and Annuity lines totaled US$ 620.3 million,
demonstrating 22.0% growth over figures for last year. Health insurance contributions, as of
December 2008, grew 30.5% for a total contribution of US$ 220.1 million.
The Peruvian insurance market
3
Evolution of premiums and contributions - Peruvian insurance market as of December 2008 (US$ million)
900
750
600
450
300
150
0
2003 2004 2005 2006 2007 2008
General Risk Life EPS
Source: SBS - Progress Report November 2008Elaboration: In house.Note: SBS’s average exchange rate was used to calculate the premium in dollars.
The total market for General Insurance, Personal Accidents, Life and Health totaled US$ 1,686.8
million as of December 2008, demonstrating 24.9% growth in comparison to the same period
last year.

4
In the General Insurance segment, as of December 2008 and in comparison with the same
period in 2007, Automobile premiums grew 56.4%; Theft and Assault grew 52.9%; Technical
Lines increased by 38.5%; Transport by 30.1%; Transportation grew 30.1%; Personal Accidents
increased 21.5%; Medical Assistance saw 18.9% growth and Fire 16.7%. These growth rates
were due to the economy’s dynamism, particularly in the construction, manufacturing and
commercial sectors.
It is important to mention that the Maritime Hull Insurance market was among those that
experienced a market decline (-9.2%).
The system’s net earned premiums grew 27.2% due to a higher demand for property insurance
in the business segment. This was the result of the economy’s increased dynamism and
significant growth in automobile insurance policies.
The Technical Result Index in relation to Net Earned Premiums in the market was -2.3% as of
December 2008.
In terms of payments to policyholders, the net incurred claims rate in General Lines was 65.9%,
lower than the 73.0% obtained up to December 2007. The Index of General Expenses over Net
Earned Premiums in the system, considering General and Life Insurance, decreased 25.2%. The
Peruvian insurance system’s financial income declined 31.8%.
Distribution of the net premium portfolio in the General Insurance, Accidents and Illnesses lines in the Peruvian insurance market as of December 2008 (%)
19.5%
20.4%
13.5% 7.4%
8.6%
6.5%
5.5%
4.3%
3.1%
3.8%
2.2%
2.6% 2.7%
Source: SBS – Progress Report November2008.Elaboration: In-house.
Personal Accidents SOAT Automobiles
Medical Assistance Fire Aviation Others Civil Liability
Dishonesty Technical LinesMaritime Hulls TransportationBurglary and Armed Robbery

5
Pension Insurance AnnuityComplementary Safety InsuranceGroup Life Insurance
Individual Life InsuranceMortage InsuranceLife Insurance: LawBurial
Source: SBS – Progress Report November 2008.Elaboration: In-house.
Distribution of the net premium portfolio in Life Insurance lines in the Peruvian market as of December 2008 (%)
1.2%
4.8%
4.2%
9.2%
9.8%
17.9% 20.4%
32.5%
Distribution of the Contributions’ portfolio in the Peruvian market for Health Care Providers (EPS) as of December 2008 (%)
1.2%
12.6%
86.2%
Facultative InsuranceComplementary Safety Insurance (SCTR)Regular Insurance
Source: SBS – Progress Report November 2008.Elaboration: In-house.

6
The insurance business
During 2008, the insurance business’s results were negative. There was an increase in claims in all
three market segments (General Insurance, Health and Life, which experienced five large claims in
its Fire and Technical Lines for US$ 11.9 million). Additionally, US$ 11.3 million were recorded as
impairment and a translation loss was taken for US$ 3.4 million, attributable to the Nuevo Sol’s
devolution against the US dollar.
The insurance business recorded a net loss of US$ 15.0 million in comparison to the US$ 12.5
million net earnings achieved in 2007. If consolidation adjustments are considered, Grupo Pacifico’s
contribution to Credicorp went from a positive contribution of US$ 9.4 million in 2007 to a loss of
US$15.9 million in 2008.
Despite this year’s less than favorable result, the Pacífico Group continues to push forward with
its successful strategy to penetrate the individual insurance segment. This effort is directed at
atomizing and diversifying the risk portfolio and transferring exposure to significant corporate risk
to the international reinsurance market, thereby reducing the volatility of results and enhancing the
ability to predict the same.
During 2008, premium production grew 25.8% to reach US$ 587.6 million at the end of the same
period. This means that the Pacífico Group is one of the primary insurance groups in the region. By
segments, growth in General Insurance was 23.5%; Pacífico Vida experienced 30.4% growth and
Pacífico Salud EPS saw 27.4% growth. This allowed us, as a group, to achieve a total market share
of 34.4% considering all three market segments: General Insurance, Health Insurance and Life.

Pacífico Seguros
During 2008, general insurance sales performed positively, achieving a 23.5% increase over
figures for the same period last year. Total yearly production reached US$ 296.8 million,
US$ 56.4 million more than premiums obtained in 2007.
This growth includes all lines. Particularly notable growth was evident in: Automobiles (80.0%),
SOAT (62.2%), Transportation (42.3%), Dishonesty and Theft (27.4%), Medical Assistance
(18.5%), Fire (11.2%) and Personal Accidents (10.2%).
7
Au
tom
ob
iles
Fire
Med
ical
A
ssis
tan
ce
Tech
nic
al L
ines
Dis
ho
nes
ty
and
Th
eft
Civ
il Li
abili
ty
Tran
spo
rtat
ion
Avi
atio
n
SOA
T
Mar
itim
e H
ulls
Oth
ers
Pers
on
al
Acc
iden
ts
Distribution of Pacífico Seguro’s premium portfolio(Total premiums and growth 2008 / 2007, US$ million IFRS / %)
Source: SBS – Progress Report November 2008.Elaboration: In-house.
Growth20072008
80
60
40
20
0
-20
-40
-60
100%
80%
60%
40%
20%
0%
-20%
-40%
-60%
42.3%
80.0%
27.4% 3.2%
62.2%
10.2%
-12.5%
-41.1%
10.4%18.5%
11.2%6.5%

50
0
Fire
107.5%
40
30
20
10
80.8%105.1%
75.7%
92.7%
126.7%
53.5%
67.7%
35.9%62.9%
0.5%
58.3%
140%
120%
100%
80%
60%
40%
20%
0%
Med
ical
A
ssis
tan
ce
Au
tom
ob
iles
Tech
nic
al L
ines
Civ
il Li
abili
ty
Dis
ho
nes
ty a
nd
Th
eft
Tran
spo
rtat
ion
Avi
atio
n
Mar
itim
e H
ulls
Oth
ers
SOA
T
Pers
on
al
Acc
iden
ts
8
Distribution Pacífico Seguro’s claim portfolio(Net claims/ Net Incurred Claims 2008, US$ million IFRS / %)
It is important to point out that the reorganization process begun in 2006 seeks to increase
our sales in terms of individual insurance in order to atomize or risk portfolio, make claims
occurrence more predictable and reduce our results’ volatility. In this context, production in
personal lines- which the company defines as Automobile, SOAT, Medical Assistance, Personal
Accidents and Home Insurance- increased 45.1% during the year. As such, over the last three
years, the participation of personal lines in our risk portfolio went from 34.9% to 46.8%.
During 2008, claims totaled US$ 152.8 million- US$ 49.9 million more than the previous year-
reporting Net Incurred Claims of 87.2% in comparison to 80.2% in 2007, when an earthquake
hit the southern-central area of the country.
Source: SBS – Progress Report November 2008.Elaboration: In-house.
Net Claims NEC

9
This increase in claims can be explained by an unusually adverse environment attributable
primarily to increased economic activity in the country, which generates higher use of installed
capacity, and an intense rainy season in northern Peru during the fourth quarter of the year, with
precipitation levels 60% above the historic average. In this scenario, the company processed five
large claims in the Fire and Technical Insurance lines for a total cost of US$11.9 million. In total,
these events have caused a seven percent increase in PPS’s net incurred claims.
It is also important to mention that the local automobile import sector has experienced
extraordinary dynamism, thanks to sustained economic growth. Unfortunately, this has been
accompanied by an increase in vehicle theft. At a national level during the period from
2000-2007, the Peruvian insurance industry recorded an annual average of US$ 6.7 million
in vehicle theft. This figure rose to US$ 35.0 million in 2008, for which PPS has recorded
reserves for US$ 8 million. Finally, in the Medical Assistance line, we experienced a significant
increase in claims, attributable to higher costs for medical services that could not be immediately
transferred to premiums for the entire portfolio of shareholders or higher requirements for
actuarial reserves.
Recorded net income for the year was US$ 19.1 million, 33.8% lower than that obtained in
2007, when the total was US$ 28.9 million. This result has prompted the company to make an
impairment of US$ 6.9 million, based on its conservative policy for recording investments and in
accordance with international financial reporting standards. All impairment is the direct result of
the global financial crisis’s effects on the Peruvian stock market. Nevertheless, PPS estimates that,
given the quality of the assets in its portfolio, these results will tend to recover in the mid-term.
StocksReal propertyTrading securitiesTime deposits
Total
16.2%21.9%52.3%9.7%
100.0%
Investments - Pacífico Seguros* (US$ thousands, end of period) %
31,10241,880
100,14018,524
191,646
2008
(*) Net of Pacífico Vida and Pacífico Salud investment.

10
In 2008, general expenses and remunerations increased 1.6%. During this period, gross premiums
grew 23.5% and net earned premiums 36.5%, which means that expenses represent 22.5%
of net premiums earned in comparison to the 30.2% achieved last year. Despite this significant
improvement, the company will continue its efforts to rationalize expenses to achieve levels
below 20% of the net earned premium and improve the company’s ability to compete with
local and international insurers. To achieve this, we will continue to implement the strategies
begun two years ago to reduce operating costs through intensive use of computer systems and
integrating technology in our distribution channels.
Due to an increase in claims and impairment in 2008, PPS recorded a net loss of US$19.6
million in its General Insurance business. To cover the operating deficit and take advantage
of opportunities that the Peruvian market offers for growth and investment, the company’s
shareholders decided, in the month of December, to make a cash contribution equivalent to
US$ 17.5 million.
By December 2008, we had achieved a 34.1% market share in general insurance. It is important
to point out that, in keeping with our objective to increase our penetration of the individual
insurance segment, we have recovered our position as market leader in the Automobile segment
with a 38.1% share. We have also significantly increased our participation in the SOAT (21.2%),
personal accidents and home insurance lines.

Pacífico Vida
As of December 2008, the total premium volume was US$ 178.2 million, 30.4% higher than that
obtained in 2007. This means that we have maintained our position as market leader (27.6%).
It is fundamental to mention that all business lines have showed significant increases, the most
representative of which are AFP, Individual Life and Credit Life.
In the Individual Life Insurance line, there was a 31% increase in premiums, attributable to the
higher productivity obtained by each of our account advisors, an increase in our sales force, an
increase in the sales of new products such as Pacífico Saving Life and Premium Life Max and
improved service. We expect this growth to continue and are in the process of recruiting more
experienced account advisors to improve our persistence and productivity. It is important to point
out that development in other channels, including brokers, part-time employees and sponsors, has
contributed to generating more production.
The Individual Life line represents 21% of total annual income. Pacífico Vida maintains its position
as market leader in Individual Life insurance with a 32.8% share (as of December 2008).
11
Evolution of Pacífico Vida’s premium portfolio (US$ million)
2007 20082005
0
10
2006
60
50
40
30
20
Annuity
AFP
Credit Life
Complementary Safety Insurance
Life Group
Life Law
Individual Life and AP
Source: SBS – Progress Report November 2008.Elaboration: In-house.

12
The Life Annuity line increased its income by 14% to represent 22% of the company’s total
accumulated premiums. It is important to mention that this year’s growth in Pacífico Vida’s Life
Annuity segment exceeded market growth (7% on average). As of December 2008, we had
achieved third place with a market share of 19.9%.
The Pension Insurance segment (AFP) has also shown significant growth and currently represents
20% of our income. At the end of the accumulated year, our income in this line exceeded figures
recorded for 2007 by 33% while average market growth was 22%. An increase in the country’s
development has contributed to this growth trend. Pacífico Vida maintained its position as market
leader in this segment with a 31.7% share as of December of 2008.
In terms of accumulated levels, the Group Life line (Collective Life, Law and Complementary
Employment Insurance), which represents 18% of our income, showed an increase of 29% over
last year’s figure. This is primarily attributable to the Complementary Employment Insurance
line, which experienced an increase of 50%, followed by Life Law. This significant increase is
directly related to the country’s growth, an increase in the number of businesses formalized and
development in sectors such as mining and construction. In December of 2008, this business line
held second place in the corresponding market with a 27.4% share.
Life Credit has increased its production 102% in comparison to last year. Without a doubt, the
dynamism of the company’s credit market contributed to this line’s good performance (credit cards
and home loans). This increase is attributable to an individualization of our insurance products,
primarily through BCP and to a lesser degree, Ripley Bank. It is important to point out that in
December of 2008, we held third place in terms of market share with 33% participation.
Although the Personal Accidents line does not represent a significant portion of this year’s income
(5%), it has shown significant growth over last year’s figures (33%). We would like to point out
that this business line is commercialized, like our Individual Life line, by means of our agency
channel, banks and other alternative channels (sponsors) that have facilitated significant growth.
Development in both traditional and alternative distribution channels continues to be a key strategy
at Pacífico Vida. In addition to companies in the financial system, our distribution channels have
been expanded with positive results to department stores and public service companies.

13
We are committed to maintaining our position as market leader to develop new products through
our traditional and non-traditional channels by taking strategic action. We are convinced that this
vehicle best complements market development.
In terms of investment management, despite an adverse international and local juncture, our
investment portfolio’s financial income continued to grow with regard to previous fiscal years to
obtain a positive results that can be attributed to the company’s habitual investment operations. In
2008, there were no significant profits or losses due to extraordinary or non-recurring events.
With regard to portfolio investment, by December 31, approximately 40% was invested in foreign
instruments, 40% in instruments either issued or guaranteed by the Peruvian Government and
approximately 20% in financial institutions or private local companies. As such, more than
80% of the company’s investments correspond to instruments that fall into the International
Investment Grade category. Local risk classifiers have given all of our corporate investments a
local investment grade.
These investments correspond to financial instruments issued by top-notch international and
local institutions that also have the highest credit ratings. As such, the financial quality (credit
related) of our investments means that we are able to ensure payment of future commitments
with our clients.
More than 96% of our investment portfolio corresponds to fixed income instruments, which are
invested until they reach maturity. These assets back business lines whose obligation flows are
known or inferred (probability estimate) and guaranteed by the company.
In terms of this kind of product, the company’s investment policy is focused on achieving an
adequate currency ratio and cash flow matching to mitigate or eliminate the risk associated with
reinvestment rates and liquidity risk.
In business lines that do not guarantee minimum returns, the investment policy focuses on
achieving long-term profitability based on risk and each portfolio’s investment policy.
In the first quarter of 2008, Pacífico Vida made its first investment in real property, acquiring an
office building in the Cronos Business Center in the district of Surco. This building will be ready in
the first quarter of 2009. The objective of this purchase is to generate income from leasing offices
to businesses or corporations. .
14
Fitch Rating International maintain Pacífico Vida’s investment grade and improved its expectation
from stable to positive. This is due to the company’s favorable results, adequate risk management,
strict subscription policies, investment management and financial strength. This rating identifies
Pacífico Vida as a reliable, safe company with an elevated capacity to cover the commitments and
obligations it has with its clients and suppliers.
Administrative expenses have increased 33% in comparison to last year due to the company’s
significant growth in terms of personnel, operations and infrastructure. Personnel spending and
third-party services represented the most significant expenditure increases. In terms of ratios,
however, we are at 16.5% versus last year’s 16.2%.
This year, we will continue to implement our policy to reduce costs. We hope that this will enable
us to reach the objective we have set to further improve our profitability.
Our claims’ rate is above last years (38%), which is attributable to larger claims, particularly in
the group business line, and due to growth in the AFP business. The latter recorded a higher
number of claims due to an increase in affiliates. The claims’ ration increased to 47.9% of the total
premium value in comparison to 45.3% last year.
Technical expenses have increased 32% over last year’s figure. This is basically due to expenses
relative to the individualization of Life Credit operations, which has been accompanied by increases
in this line’s premiums.
In December 2008, accumulated earnings were 42% less than those recorded for the same period
last year, due primarily to higher claims in some business lines, a lower proportion of financial
income, a larger adjustment for a decline in market value, and, to a lesser extent, higher technical
expenses.
In December of 2008, Pacífico Vida obtained net profit before minority interests of US$ 14.5 million.

Evolution of Pacífico Salud EPS’s contribution portfolio (US$ million)
Source: SBS – Progress Report November 2008.Elaboration: In-house.
2006
0
2007 2008
120
100
Regular Insurance
80
60
40
20
Complementary Safety Insurance Facultative Insurance
15
Pacífico Salud EPS
Business results for the health services line have also been unsatisfactory. In the Medical Assistance
line, inflation relative to medical services could not be immediately transferred to premiums given
that the business’ structure only permits annual or mid-year adjustments. During this period, the
company has been more conservative in its approach to set up IBNR reserves (claims incurred
but not reported) due to the business’s evolution and a higher claims rate, which has generated
additional reserves for US$ 3.9 million.
Total production in 2008 grew 27.4% (US$ 116.5 million). The main contributor to this growth
was Regular Insurance, with US$ 102.8 million, followed by Complementary Safety Insurance
with US$ 11.0 million and contributions for facultative contracts for US$ 2.7 million.

Total claims in 2008 reached US$ 105.1 million, which represents a Net Incurred Claims Rate
of 90.3% in comparison with 82.4% last year. In addition to an increase in medical costs and
higher reserves, it is important to mention that an increase in the population’s purchasing
power allows people to assume co-payments more easily, contributing in parallel to higher use
of insurance policies.
During 2008, general expenses and remunerations totaled US$10.4 million, 2.3% higher
than the expense recorded last year. If general expenses and remunerations are calculated as
a percentage of the net earned premium, they reached an equivalent of 8.9% in this period,
an improvement of 11.1% over the figure obtained in 2007. This means that the company’s
performance in this area is within international levels.
At the end of 2008, Pacífico Salud recorded losses for S$ 4.6 million in comparison to the
US$ 2.7 million profit recorded in 2007.
Finally, Pacífico Salud managed to maintain its position as market leader during this period
despite the fact that two new companies entered the market in 2007. As of December 2008,
the company had obtained a market share of 52.4%.
16

Consolidated Balance Sheet(US$ million, at end of period)
Al 31 de diciembre de 2006 y 2007
Cash and banksNet investmentsReal property, furniture and equipment, netReceivables and other assets
Total assets
Technical reservesAccounts payable and other liabilities
Total liabilities
Net shareholders’ equity
Minority interest
Total liabilities and net shareholder’s equity
78.0728.947.0
142.3
996.2
629.476.9
706.3
236.7
53.2
996.2
49.7822.356.1
370.9
1,298.9
968.5144.5
1,113.0
146.3
39.7
1,298.9
Assets 2008
Liabilities and net shareholders’ equity
US$(000) US$(000)
17
46.2821.346.5
284.0
1,197.9
817.5115.3
932.8
206.1
59.1
1,197.9
2007US$(000)
2006

Profit and Loss Statement(US$ million, end of period)
Por los años terminados el 30 de diciembre de 2006 y 2007
Total premiumsCeded premiumsAdjustment of reserves
Net premiums earned
Net claimsNet commissionsNet technical costs
Technical result
Financial income, netGeneral expenses and provisionsOther incomeResults by shiftingIncome tax and employee participation
Income before minority interest
Minority interest
Consolidated net profit
Contribution to Credicorp
372.663.550.0
259.1
186.526.910.9
34.8
89.461.2
1.65.4
59.1
5.7
53.3
13.6
467.297.462.6
307.3
238.631.321.9
15.5
76.872.52.63.94.3
22.0
9.5
12.5
9.4
587.6111.270.6
405.7
341.956.814.7
(7.7)
70.480.42.3
(3.4)(9.2)
(9.5)
5.5
(15.0)
(15.9)
2007 2008
18
2006US$(000) US$(000)US$(000)

Board
19
President
Vice-president
Directors
Dionisio Romero Seminario
Dionisio Romero Paoletti
Eduardo Hochschild Beeck
Maximiano Lemaitre del Campo
Reynaldo Llosa Barber
José Miguel Morales Dasso
Raimundo Morales Dasso
Luis Nicolini Bernucci
José Antonio Onrubia Holder
Carlos Palacios Rey
Ricardo Rizo Patrón de la Piedra
Luis Enrique Romero Belismelis

ManageMent RepoRt

Contents
1. Evolution of the private pension system
1.1 Market comment1.2 Main indicators
2. Prima AFP
2.1 Highlights2.2 Market share2.3 Commercial outcome2.4 Outcome from investments2.5 Financial results
2.5.1 Revenues2.5.2 Operative expenses2.5.3 Other revenues and expenses2.5.4 Balance Sheet2.5.5 Legal and corporate highlights
2.6 Outlook for 2009
3. Financial statements
3.1 Balance Sheet3.2 Profit and Loss statement3.3 Board of Directors and Management
ManageMent RepoRt

2. pRiMa aFp
2.1 Highlights
2.2 Market Share
2.3 Commercial Outcome
2.4 Outcome from Investments
2.5 Financial Results
2.6 Outlook for 2009
3. Financial StateMentS
3.1 Balance Sheet
3.2 Profit and Loss Statement
3.3 Board of Directors and Management
ManageMent RepoRt 2008
1
1. evolution oF the pRivate penSion SySteM
1.1 Market Comment
1.2 Main Indicators
Throughout 2008, the private pension system showed stability in its commercial activity, allowing for a reduction in the number of transfers and sales representatives compared to the previous year. However, high market volatility sparked by the severe international crisis impacted negatively the performance of the funds under management.
The international financial crisis was the single most important event in 2008’s agenda, particularly during the second half and translated into a steep decline of the value of most financial assets and created extreme market volatility. These developments affected returns of funds under management. The system’s portfolio reached S/.49.9 billion as of December 2008, an 18.3% reduction in soles compared to 2007-closing.
In the commercial arena, companies slowed down their competition to recruit transfers, resulting in a sliding trend throughout 2008. Sales personnel fell from 2,265 in January to 1,763 in December,
while transfers fell from a monthly 26,200 in January to 17,300 in December. Nonetheless, new affiliations remained at 2007 levels. As the national economy becomes increasingly formal, the number of payroll workers as a percent of new affiliations remained strong, with 94% of members on payrolls in 2008 and 95% in 2007.
Pension fund management companies’ (AFP is the Spanish acronym) financial revenues reached US$ 254.7 million, 24.7% more than the previous year, a consequence of an increased revenue base and a stronger on average domestic currency. System-wide administrative expenses rose and sale expenses fell, leading to operative expenses of US$ 178.7 million, comparable to last year. Although earnings from operations reached US$ 76.0 million, 204.0% more than in 2007, AFP’s impaired legal reserves reduced net profits that reached US$ 1.8 million compared to US$ 52.2 million in 2007.
Pension fund management companies’ (AFP is the Spanish acronym) financial revenues reached US$ 254.7 million, 24.7% more than the previous year.
1. evolution oF the pRivate penSion SySteM
1.1 MaRket coMMent

2. pRiMa aFp
2.1 Highlights
2.2 Market Share
2.3 Commercial Outcome
2.4 Outcome from Investments
2.5 Financial Results
2.6 Outlook for 2009
3. Financial StateMentS
3.1 Balance Sheet
3.2 Profit and Loss Statement
3.3 Board of Directors and Management
ManageMent RepoRt 2008
2
1. evolution oF the pRivate penSion SySteM
1.1 Market Comment
1.2 Main Indicators
System-wide earnings from operations grew 204.0% year over year. However, the AFPs’ legal reserves’ value fell as markets slipped, leading to a S/. 143.88 million (22.3%) loss in value compared to 2007’s closing.
The SSP’s total number of affiliates continued to grow at a pace similar to 2007.
The number of individuals contributing to the system increased significantly. Although the annual growth rate was slightly below the previous year, it did exceed that of other years’, reflecting a livelier contribution from individuals and companies.
The number of sales representatives declined gradually as competition for transfers also slipped.
Funds under management were strongly impaired by fluctuations in international financial markets, with the subsequent 22.1% value impairment in the portfolio under management for the entire year (change in dollars).
System-wide earnings from operations grew 204.0% year over year. However, the AFPs’ legal reserves’ value fell as markets slipped, leading to a S/. 143.88 million (22.3%) loss in value compared to 2007’s closing.
We present below the main indicators of the Private Pension System (SPP is the Spanish acronym) for 2008:
1.2 Main indicatoRS
1. evolution oF the pRivate penSion SySteM

2. pRiMa aFp
2.1 Highlights
2.2 Market Share
2.3 Commercial Outcome
2.4 Outcome from Investments
2.5 Financial Results
2.6 Outlook for 2009
3. Financial StateMentS
3.1 Balance Sheet
3.2 Profit and Loss Statement
3.3 Board of Directors and Management
ManageMent RepoRt 2008
3
1. evolution oF the pRivate penSion SySteM
1.1 Market Comment
1.2 Main Indicators Main pRivate penSion SySteM indicatoRS
Source: Conasev and Superintendencia de Banca y Seguros.
(1) Change year over year.
(2) Annual average number of contributors.
(3) Contributions: Total deposits during this period from mandatory and voluntary contributions.
(4) Pursuant to Peruvian accounting rules, legal reserves are included in net profits contrary to IFRS reports.
No system-wide information is available on results adjusted for international accounting rules
end of period 2008 2007 2006
Members (thousands) 4,296 4,101 3,882
% change (1) 4.8% 5.6% 6.7%
New members (thousands) 229 226 258
% change 1.1% -12.5% 2.8%
Contributions (thousands) (2) 1,708 1,591 1,416
% change (1) 7.4% 12.4% 3.6%
Sales 1,763 2,340 5,647
Funds under management (US$ million) 15,875 20,371 14,404
% change (1) -22.1% 41.4% 51.7%
Voluntary contributions (US$ million) 138.6 356.1 128.1
% change (1) -61.1% 178.0% n.a.
Contributions (US$ million) (3) 1,635 1,731 1,163
Revenues (US$ million) 254.7 204.2 158.0
Operating expenses (US$ million) 178.7 179.1 161.4
Operating earnings (US$ million) 76.0 25.0 (3.4)
Operating returns (US$ million) -50.8 39.4 30.9
Net earnings (US$ million) (4) 1.8 52.2 15.4
1. evolution oF the pRivate penSion SySteM

2. pRiMa aFp
2.1 Highlights
2.2 Market Share
2.3 Commercial Outcome
2.4 Outcome from Investments
2.5 Financial Results
2.6 Outlook for 2009
3. Financial StateMentS
3.1 Balance Sheet
3.2 Profit and Loss Statement
3.3 Board of Directors and Management
ManageMent RepoRt 2008
4
1. evolution oF the pRivate penSion SySteM
1.1 Market Comment
1.2 Main Indicators
A stable commercial climate where competition for transfers was less acute was the main characteristic of the pension fund market in 2008. Prima AFP preserves its leading market position thanks to a stronger value proposal aimed at providing quality information and service to its members, as well as outstanding returns and strong backing from Grupo Credito, Peru’s largest financial holding. In August, Prima AFP announced an increase of its management fee from 1.50% to 1.75% that would apply to revenues starting in January 2009. Despite the increase, they are still the lowest in the market. These higher fees are consistent with our value proposal to markets, as is widely acknowledged by our affiliates. In consequence, the transition to the new fee took place in a stable scenario.
Strong productivity from Prima AFP sales management helped preserve a high quality portfolio and reached the growth goals set against the monthly insurable remuneration (RAM in Spanish) that is the basis of the company’s revenues. It also contributed in maintaining a robust market share.
Investments-wise, weaker international and local financial markets hurt the value of funds under management. Thus, as of December 2008, the value of our portfolio under management was S/. 15,275 million.
2. pRiMa aFp
2.1 highlightS
Prima AFP preserves its leading market position thanks to a stronger value proposal aimed at providing quality information and service to its members.
In addition, operative systems were improved and developed to increase the efficiency of collections and auditing of revenues and charges, with a positive overall influence in the company’s operative efficiency.
In human resources, we launched the "Cultura Prima" project to define the values, believes and rules that should guide our organization, while maintaining a strong commitment to corporate objectives. Throughout 2008, we engaged in a number of activities to tighten our bonds with our workers and strengthen our corporate identity.
We launched our “Comprometidos” project to obtain quality certification for our management system under the ISO 9001:2000 norm and which we expect to receive in 2009.
In addition, we confirmed our interest in enhancing the image of senior citizens through the second edition of the Entrepreneur Senior Citizen Award and the Outstanding Senior Citizen Award, which acknowledge senior citizens who take up new activities when arriving at their senior age or who stand out for their contributions and example to their community.

2. pRiMa aFp
2.1 Highlights
2.2 Market Share
2.3 Commercial Outcome
2.4 Outcome from Investments
2.5 Financial Results
2.6 Outlook for 2009
3. Financial StateMentS
3.1 Balance Sheet
3.2 Profit and Loss Statement
3.3 Board of Directors and Management
ManageMent RepoRt 2008
5
1. evolution oF the pRivate penSion SySteM
1.1 Market Comment
1.2 Main Indicators
2. pRiMa aFp
2.2 MaRket ShaRe
The increased number of contributors, as well as the wider base of collections available for revenue calculation reflects Prima AFP’s stronger commercial position.
A slight reduction in the sales team took the total number of sales representative from 421 persons in December of 2007 to 335 a year later, as reported by SBS.
By December 2008, Prima AFP’s share of the portfolio under management reached 30.6%, worth US$ 4,862 million (US$ 6,403 million in 2007, when our share was 31.4%). This slide is accounted for by (i) a commercial strategy that reduced PRIMA AFP’s sales force and the expected slip of funds with lower RAM; and (ii) the impact of declining markets, which had a greater effect on the value of Fund 3, where we held the largest share of the market.
The remunerations level of our contributors is the core source of our revenues. Pursuant to estimates based on revenues at Prima AFP, and taking into account the 1.5% administration fee, in 2008 the basis remuneration for revenues increased allowing us to garner, one more time, the highest share of the market (32.3%).
Prima AFP also accomplished the largest market share (32.7% as of December 2008) for contributions’ collection. This figure was slightly lower than last year’s as the market crisis reduced voluntary contributions.
In accordance to market evolution, in 2008 our volume of voluntary contributions under management fell to US$ 61.9 million in December 2008. However, we still hold the largest share in the system (44.7%).
In 2008 we strengthened our market position in the most important fronts. The main indicators of 2008 and their relationship with system-wide figures are as follows:
By December 2008, Prima AFP’s share of the portfolio under management reached 30.6%, worth US$ 4,862 million.
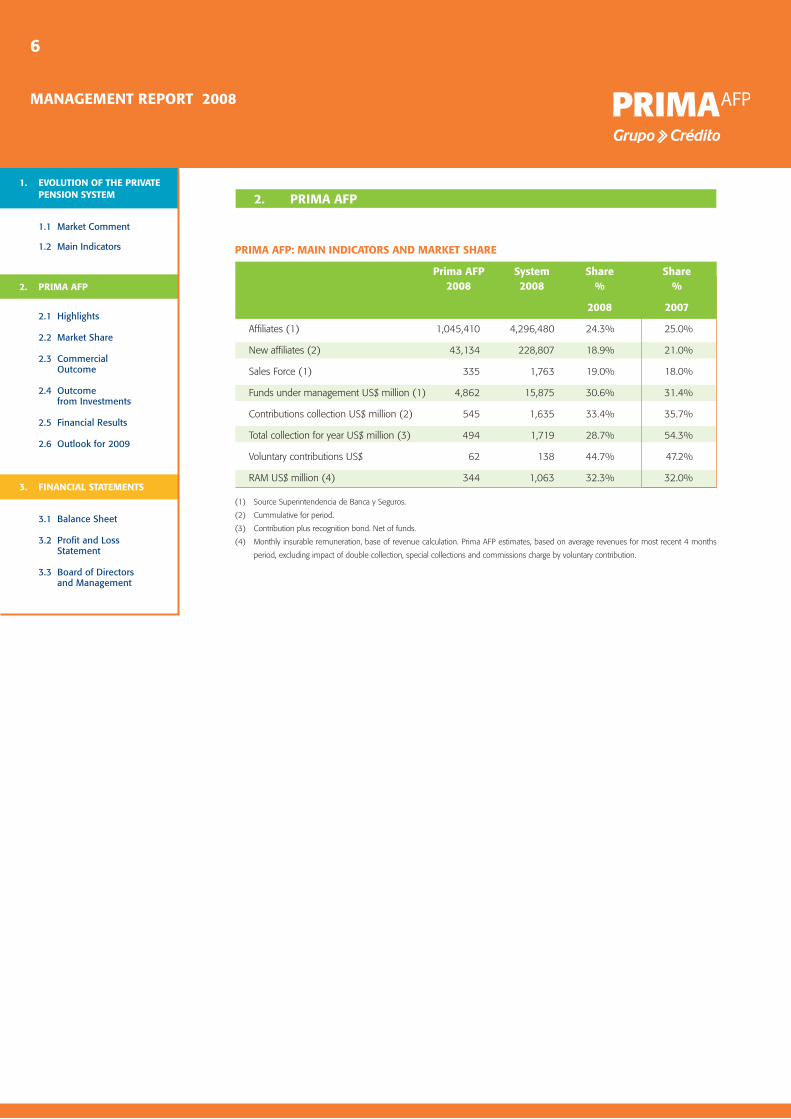
2. pRiMa aFp
2.1 Highlights
2.2 Market Share
2.3 Commercial Outcome
2.4 Outcome from Investments
2.5 Financial Results
2.6 Outlook for 2009
3. Financial StateMentS
3.1 Balance Sheet
3.2 Profit and Loss Statement
3.3 Board of Directors and Management
ManageMent RepoRt 2008
6
1. evolution oF the pRivate penSion SySteM
1.1 Market Comment
1.2 Main Indicators
2. pRiMa aFp
pRiMa aFp: Main indicatoRS and MaRket ShaRe
(1) Source Superintendencia de Banca y Seguros.
(2) Cummulative for period.
(3) Contribution plus recognition bond. Net of funds.
(4) Monthly insurable remuneration, base of revenue calculation. Prima AFP estimates, based on average revenues for most recent 4 months
period, excluding impact of double collection, special collections and commissions charge by voluntary contribution.
prima aFp System Share Share 2008 2008 % %
2008 2007
Affiliates (1) 1,045,410 4,296,480 24.3% 25.0%
New affiliates (2) 43,134 228,807 18.9% 21.0%
Sales Force (1) 335 1,763 19.0% 18.0%
Funds under management US$ million (1) 4,862 15,875 30.6% 31.4%
Contributions collection US$ million (2) 545 1,635 33.4% 35.7%
Total collection for year US$ million (3) 494 1,719 28.7% 54.3%
Voluntary contributions US$ 62 138 44.7% 47.2%
RAM US$ million (4) 344 1,063 32.3% 32.0%

2. pRiMa aFp
2.1 Highlights
2.2 Market Share
2.3 Commercial Outcome
2.4 Outcome from Investments
2.5 Financial Results
2.6 Outlook for 2009
3. Financial StateMentS
3.1 Balance Sheet
3.2 Profit and Loss Statement
3.3 Board of Directors and Management
ManageMent RepoRt 2008
7
1. evolution oF the pRivate penSion SySteM
1.1 Market Comment
1.2 Main Indicators
In the commercial field, during 2008, we strengthened our focus on preserving our customers’ portfolio and recruiting new affiliates. Recruitment of new affiliates was stable throughout the year (monthly average equalling 3,600). Transfers fell from a monthly average of 4,700 at the beginning of the year to 4,000 towards year-end.
As a consequence of our commercial efforts, Prima AFP collected approximately a net S/.110 million RAM.
In 2008 Prima AFP again led the industry by volume of contributions collected, as shown below.
Prima remains focused on giving its affiliates the greatest possible comfort. In October we opened a new office in Chimbote (Ancash). This new office has strengthened our network comprised of 15 branches nationwide combined with 16 sales points.
Our decision to increase our management fee was supported by a new value proposal to the market, namely becoming the AFP providing best information, service and returns to its affiliates with
2.3 coMMeRcial outcoMe
Monthly contRibution collection by aFp(S/. MILLIOn)
18.8%
2.1%
22.3%
50.5%
6.3%
5.1% 5.9%
0.7%
64.8%23.5%
6.8% 1.1%
64.6%
23.7%3.8%
Short term fixed incomeOperations in transit + current account
Long term fixed incomeLocal equity revenues
Foreign equity income
Short term fixed incomeOperations in transit + current account
Long term fixed incomeLocal equity revenues
Foreign equity income
Short term fixed incomeOperations in transit + current account
Long term fixed incomeLocal equity revenues
Foreign equity income
Jan08
Feb08
Mar08
Apr08
May08
Jun08
Jul08
Aug08
Sep08
Oct08
Nov08
Dec08
20018016014012010080604020-
Prima AFP 2 AFP 3 AFP 4
solid support from Grupo Credito. As a response to this challenge, our commercial initiatives within the system grew slightly to the levels planned for the transition period. Likewise, we focused our efforts on the maintenance of affiliates and direct contact with clients, supported by successful advertising and communications campaigns. Our success in introducing the fee change was evidenced by the negligible loss of RAM during the months when we were most exposed.
2. pRiMa aFp

2. pRiMa aFp
2.1 Highlights
2.2 Market Share
2.3 Commercial Outcome
2.4 Outcome from Investments
2.5 Financial Results
2.6 Outlook for 2009
3. Financial StateMentS
3.1 Balance Sheet
3.2 Profit and Loss Statement
3.3 Board of Directors and Management
ManageMent RepoRt 2008
8
1. evolution oF the pRivate penSion SySteM
1.1 Market Comment
1.2 Main Indicators
In a year of international financial crisis, characterized by high volatility and strong impairment of financial instruments, pension funds’ investments were significantly hurt though in line with each fund’s risk profile. However, it is important to mention that investments made by pension funds are managed with a long term vision that discounts short term fluctuations. In addition, the system’s average returns since its inception remain strong.
Prima AFP’s rate of return in the last 24 months placed it in the first and second positions for funds 2 and 3, and in third position for fund 1. In terms of risk-adjusted returns, Prima AFP ranked first for fund 2, in line with its objective of managing the lowest-risk investments.
In the last year, returns of investments from funds 1, 2 and 3 were -5.04%, -21.09% and -38.44%, respectively.
2.4 outcoMe FRoM inveStMentS
Prima AFP’s rate of return in the last 24 months placed it in the first and second positions for funds 2 and 3, and in third position for fund 1.
pRiMa aFp: RetuRn RateS
Accumulated nominal rate of return to December.
Source: SBS
Results dec - 08 from investments prima aFp System
Fund 1
Returns (12 months) -5.04% -4.26%
Returns (24 months) 5.24% 5.88%
Fund 2
Returns (12 months) -21.09% -21.87%
Returns (24 months) -1.00% -2.36%
Fondo 3
Returns (12 months) -38.44% -37.84%
Returns (24 months) -9.88% -10.87%
2. pRiMa aFp

2. pRiMa aFp
2.1 Highlights
2.2 Market Share
2.3 Commercial Outcome
2.4 Outcome from Investments
2.5 Financial Results
2.6 Outlook for 2009
3. Financial StateMentS
3.1 Balance Sheet
3.2 Profit and Loss Statement
3.3 Board of Directors and Management
ManageMent RepoRt 2008
9
1. evolution oF the pRivate penSion SySteM
1.1 Market Comment
1.2 Main Indicators
2. pRiMa aFp
The financial crisis changed the relative weight of each fund in the total portfolio under management. Accordingly, fund 3 saw its share fall, while shares of funds 1 and 2 increased.
System-wise, efforts focused on diversifying existing portfolios by expanding the supply of investment instruments. In 2008 Prima took steps to establish new rules for derivatives, define new criteria for security eligibility and approve centralized trading mechanisms. It is important to underscore the Central Reserve Bank of Peru authorized an increase from 20 to 30% in the maximum amount of AFP investments abroad, although this rule has not yet been put in effect.
Locally, Prima AFP continued supporting Peru’s development efforts. Our funds under management have been invested in the country’s main companies and are part of major development projects in the energy, (electricity distribution and hydropower and hydrocarbons), transportation (road networks), telecommunications and agricultural industries.
pRiMa aFp: poRtFolio ManageMent aS oF deceMbeR 2008 and 2007(US$ million)
Source: Superintendencia de Banca y Seguros.
dec - 08 Share % dec - 07 Share %
Fund 1 397 8.2% 277 4.3%
Fund 2 3,355 69.0% 4,154 64.9%
Fund 3 1,110 22.8% 1,973 30.8%
Total US$ mm 4,862 100.0% 6,403 100.0%
System-wise, efforts focused on diversifying existing portfolios by expanding the supply of investment instruments.

2. pRiMa aFp
2.1 Highlights
2.2 Market Share
2.3 Commercial Outcome
2.4 Outcome from Investments
2.5 Financial Results
2.6 Outlook for 2009
3. Financial StateMentS
3.1 Balance Sheet
3.2 Profit and Loss Statement
3.3 Board of Directors and Management
ManageMent RepoRt 2008
10
1. evolution oF the pRivate penSion SySteM
1.1 Market Comment
1.2 Main Indicators
2. pRiMa aFp
pRiMa aFp: Fund 1 StRuctuRe by type oF aSSetS, aS oF deceMbeR 2008 (%)
pRiMa aFp: Fund 2 StRuctuRe by type oF aSSetS, aS oF deceMbeR 2008 (%)
pRiMa aFp: Fund 3 StRuctuRe by type oF aSSetS, aS oF deceMbeR 2008 (%)
18.8%
2.1%
22.3%
50.5%
6.3%
5.1% 5.9%
0.7%
64.8%23.5%
6.8% 1.1%
64.6%
23.7%3.8%
Short term fixed incomeOperations in transit + current account
Long term fixed incomeLocal equity revenues
Foreign equity income
Short term fixed incomeOperations in transit + current account
Long term fixed incomeLocal equity revenues
Foreign equity income
Short term fixed incomeOperations in transit + current account
Long term fixed incomeLocal equity revenues
Foreign equity income
Jan08
Feb08
Mar08
Apr08
May08
Jun08
Jul08
Aug08
Sep08
Oct08
Nov08
Dec08
20018016014012010080604020-
Prima AFP 2 AFP 3 AFP 4

2. pRiMa aFp
2.1 Highlights
2.2 Market Share
2.3 Commercial Outcome
2.4 Outcome from Investments
2.5 Financial Results
2.6 Outlook for 2009
3. Financial StateMentS
3.1 Balance Sheet
3.2 Profit and Loss Statement
3.3 Board of Directors and Management
ManageMent RepoRt 2008
11
1. evolution oF the pRivate penSion SySteM
1.1 Market Comment
1.2 Main Indicators
Prima AFP earned revenues for US$ 70.7 million in 2008 and profits of US$ 11.2 million (IFRS results), through growth of its revenue base and a gradual reduction in operative expenses.
2.5.1 Revenues
Our revenues reached US$ 70.7 million, or 23.1% higher than in 2007. This increase was made possible by a strong contributing client portfolio which has remained stable throughout 2008 and was further supported by a growing Peruvian labour market. In addition, the local currency was stronger on average than a year earlier, allowing to further increased revenues.
In 2008, we expected to strengthen our “Voluntary Contribution” product as a complement of our revenues. However, the world’s financial crisis has strongly impaired this product. After the balance of funds under management fell, subsequent to both withdrawals and value impairments, their contribution to our business fell drastically.
2.5.2 operative expenses
Our sales personnel expenses reached US$ 13.9 million, 7.3% less than in 2007. This outcome was a consequence of a downscaled sales effort (lower sales commissions and expenses) and would have been even stronger had it not been for the greater deferral of expenses in 2007, pursuant to IFRS.
In addition, in 2008 the sales force was significantly smaller than the previous year. Dismissals and lower commissions paid to the sales team translated into overall lower expenses.
Administrative expenses reached US$ 36.8 million or 16.8% higher than in 2007, including US$ 8.8 million for depreciation and amortization. This expense increase originated in heavier personnel charges (mainly increases in windfall provisioning), greater expenses relating to the higher number of contributors and increased spending for securities trading in the volatile atmosphere reigning in 2008.
2.5.3 other revenues and expenses
By the end of 2008, revenues and expenses totalled US$ 4.1 million, mainly accounted for by interest related to the company’s financial burden.
2.5 Financial ReSultS
2. pRiMa aFp
Our revenues reached US$ 70.7 million, or 23.1% higher than in 2007. This increase was made possible by a strong contributing client portfolio which has remained stable throughout 2008 and was further supported by a growing Peruvian labour market.
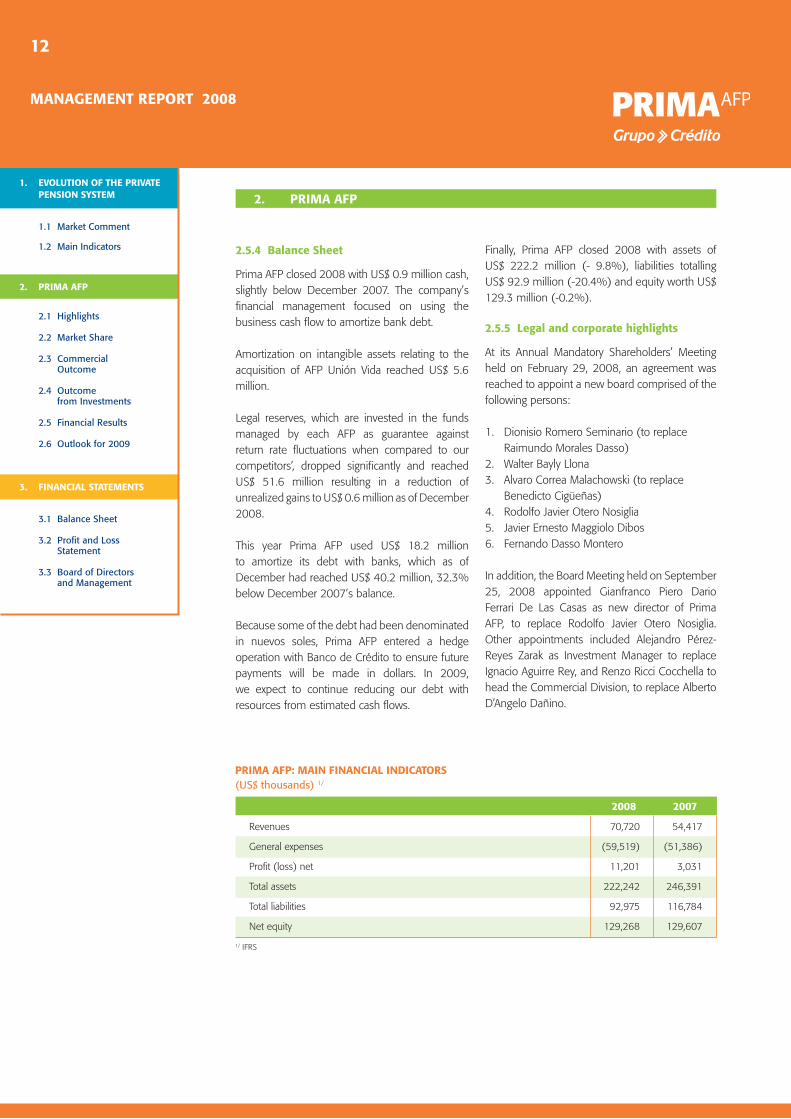
2. pRiMa aFp
2.1 Highlights
2.2 Market Share
2.3 Commercial Outcome
2.4 Outcome from Investments
2.5 Financial Results
2.6 Outlook for 2009
3. Financial StateMentS
3.1 Balance Sheet
3.2 Profit and Loss Statement
3.3 Board of Directors and Management
ManageMent RepoRt 2008
12
1. evolution oF the pRivate penSion SySteM
1.1 Market Comment
1.2 Main Indicators 2.5.4 balance Sheet
Prima AFP closed 2008 with US$ 0.9 million cash, slightly below December 2007. The company’s financial management focused on using the business cash flow to amortize bank debt.
Amortization on intangible assets relating to the acquisition of AFP Unión Vida reached US$ 5.6 million.
Legal reserves, which are invested in the funds managed by each AFP as guarantee against return rate fluctuations when compared to our competitors’, dropped significantly and reached US$ 51.6 million resulting in a reduction of unrealized gains to US$ 0.6 million as of December 2008.
This year Prima AFP used US$ 18.2 million to amortize its debt with banks, which as of December had reached US$ 40.2 million, 32.3% below December 2007’s balance. Because some of the debt had been denominated in nuevos soles, Prima AFP entered a hedge operation with Banco de Crédito to ensure future payments will be made in dollars. In 2009, we expect to continue reducing our debt with resources from estimated cash flows.
2. pRiMa aFp
pRiMa aFp: Main Financial indicatoRS (US$ thousands) 1/
1/ IFRS
2008 2007
Revenues 70,720 54,417
General expenses (59,519) (51,386)
Profit (loss) net 11,201 3,031
Total assets 222,242 246,391
Total liabilities 92,975 116,784
Net equity 129,268 129,607
Finally, Prima AFP closed 2008 with assets of US$ 222.2 million (- 9.8%), liabilities totalling US$ 92.9 million (-20.4%) and equity worth US$ 129.3 million (-0.2%).
2.5.5 legal and corporate highlights
At its Annual Mandatory Shareholders’ Meeting held on February 29, 2008, an agreement was reached to appoint a new board comprised of the following persons:
1. Dionisio Romero Seminario (to replace Raimundo Morales Dasso)
2. Walter Bayly Llona3. Alvaro Correa Malachowski (to replace
Benedicto Cigüeñas)4. Rodolfo Javier Otero Nosiglia5. Javier Ernesto Maggiolo Dibos6. Fernando Dasso Montero
In addition, the Board Meeting held on September 25, 2008 appointed Gianfranco Piero Dario Ferrari De Las Casas as new director of Prima AFP, to replace Rodolfo Javier Otero Nosiglia. Other appointments included Alejandro Pérez-Reyes Zarak as Investment Manager to replace Ignacio Aguirre Rey, and Renzo Ricci Cocchella to head the Commercial Division, to replace Alberto D’Angelo Dañino.

2. pRiMa aFp
2.1 Highlights
2.2 Market Share
2.3 Commercial Outcome
2.4 Outcome from Investments
2.5 Financial Results
2.6 Outlook for 2009
3. Financial StateMentS
3.1 Balance Sheet
3.2 Profit and Loss Statement
3.3 Board of Directors and Management
ManageMent RepoRt 2008
13
1. evolution oF the pRivate penSion SySteM
1.1 Market Comment
1.2 Main Indicators
Our commercial outlook for 2009 will focus on strengthening our affiliate base and preserving our existing client portfolio through providing pension and investment counselling. We will also direct our efforts to recruit new affiliates to widen our contributions base within the private pension’s market. In addition, we expect that competition for
transfers will continue to slide, thus contributing to improve efficiency in the sector’s operations.
We expect to accomplish significant revenue growth and to keep our operative expenses tightly under control, thus maximizing our contribution to Credicorp’s bottom line.
2. pRiMa aFp
Our commercial outlook for 2009 will focus on strengthening our affiliate base and preserving our existing client portfolio through providing pension and investment counselling.
2.6 outlook FoR 2009

2. pRiMa aFp
2.1 Highlights
2.2 Market Share
2.3 Commercial Outcome
2.4 Outcome from Investments
2.5 Financial Results
2.6 Outlook for 2009
3. Financial StateMentS
3.1 Balance Sheet
3.2 Profit and Loss Statement
3.3 Board of Directors and Management
ManageMent RepoRt 2008
14
1. evolution oF the pRivate penSion SySteM
1.1 Market Comment
1.2 Main Indicators
3. Financial StateMentS
2008 2007 (uS$ 000) (uS$ 000)
Assets
Cash 990 3,008
Mandatory reserves 51,663 65,602
Fixed Assets 10,967 10,948
Intangibles 89,157 86,780
Goodwill 44,594 44,594
Other assets 23,717 29,883
Income tax and profit sharing, deferred 1,155 5,574
Total assets 222,243 246,391
Liabilities and net equity
Deposits and obligations 788 -
Bank debt 40,848 60,484
Income tax and profit sharing, deferred 40,953 49,143
Other liabilities 10,386 7,157
92,975 116,784
net equity
Capital 107,956 107,956
Unrealized earnings 598 12,137
Cummulative results 9,511 6,481
Annual results 11,203 3,033
Total liabilities and net equity 222,243 246,391
3.1 balance Sheet

2. pRiMa aFp
2.1 Highlights
2.2 Market Share
2.3 Commercial Outcome
2.4 Outcome from Investments
2.5 Financial Results
2.6 Outlook for 2009
3. Financial StateMentS
3.1 Balance Sheet
3.2 Profit and Loss Statement
3.3 Board of Directors and Management
ManageMent RepoRt 2008
15
1. evolution oF the pRivate penSion SySteM
1.1 Market Comment
1.2 Main Indicators
2008 2007 (uS$ 000) (uS$ 000)
Financial revenues 414 270
Interests from bank deposits 332 270
Derivatives` returns (+) financial expenses 82 -
Financial expenses -4,268 -4,898
Interests paid on bank and correspondents` loans -3,896 -4,281
Interests paid on securities, papers and liabilities outstanding -372 -
Other expenses from interests -617
Revenues from net interests -3,854 -4,628
Other earnings 71,893 55,394
Commissions 70,720 54,181
Net earnings from exchange transactions 336 128
Other earnings 837 1,085
Operative expenses -51,758 -46,421
Personnel expenses -25,782 -22,522
Administrative expenses -16,036 -14,968
Depreciation and amortization -8,801 -8,384
Other expenses -1,139 -547
Profit sharing -1,033 -248
Income tax -4,047 -1,064
net earnings 11,201 3,033
3.2 pRoFit and loSS StateMent
3. Financial StateMentS

2. pRiMa aFp
2.1 Highlights
2.2 Market Share
2.3 Commercial Outcome
2.4 Outcome from Investments
2.5 Financial Results
2.6 Outlook for 2009
3. Financial StateMentS
3.1 Balance Sheet
3.2 Profit and Loss Statement
3.3 Board of Directors and Management
ManageMent RepoRt 2008
16
1. evolution oF the pRivate penSion SySteM
1.1 Market Comment
1.2 Main Indicators 3.3 boaRd oF diRectoRS and ManageMent
Board of Directors
Dionisio Romero Seminario President
Walter Bayly Llona Vicepresident
Alvaro Correa Malachowski Director
Javier Maggiolo Dibós Director
Fernando Dasso Montero Director
Gianfranco Ferrari De Las Casas Director
Management
Ruben Loaiza negreiros General Manager
Renzo Ricci Cocchella Commercial Manager
Alejandro Pérez-Reyes Zarak Investment Manager
Jaime Vargas Galdós Central Processes Department Manager
Michel Flit Pait Finance and Administration Manager
Julio Bravo Torrontegui Operations Manager
Fernando Díaz Camacho IT Manager
Claudia Subauste Uribe Legal Manager
Bruno Zapata Mansilla Risk Manager
Rossina Castagnola Vásquez Human Resources Manager
3. Financial StateMentS