q4 & fy10 financial results - iis windows...
TRANSCRIPT

Q4 & FY10 Financial Results
January 25, 2011

Business Overview
Alain DutheilChief Operating OfficerChief Operating Officer
2

STMicroelectronicsA Global Semiconductor Company
FY10 revenue: $10.35BBy location of order shipment
13%America
25%EMEA
44%Greater China &
South Asia
18%Japan & Korea
15 main manufacturing sites Advanced R&D centers in 10 countries
South Asia
Advanced R&D centers in 10 countries Over 53,000 employees, including
ST-Ericsson Listed on NYSE Euronext (New York &
Paris) and Milan stock exchanges
3

Business Segment Overview
50/50 JV with Ericsson
Automotive, Consumer, Computer &
Communication Infrastructure (“ACCI”)
Industrial and Multisegment Sector
(“IMS”)Wireless
Home Entertainment
& Displays
Computer & Communication Infrastructure
Automotive Products
Group
Analog, Power and
MEMS
Microcontrollers, Memories and
SmartcardsMajor Product Lines
Products
Major Customers
4

Semiconductor Market Growth
300350$B
Total Available Market
150200250300
050
100
1 2 3 4 5 6 7 8 9 e e
2001
2002
2003
2004
2005
2006
2007
2008
2009
2010
e
2011
e
Serviceable Available Market (SAM):
Estimated SAM Growth in 2010: ~26%
E t d 5% t 8% th f SAM i 2011
Serviceable Available Market (SAM):
Source: WSTS, Nov. 2010
Expected 5% to 8% growth of SAM in 2011
5

ST Total Revenues
FY10 Reported Revenues = $10.35B+21.6% vs. FY09
12,000US$M
Record revenues driven by ACCI and IMS
8,000
10,000
Flash Memory
4,000
6,000ST ex Flash
0
2,000
FY05 FY06 FY07 FY08 FY09 FY10
* See appendix
6

Market Share Gains for ACCI & IMS
Total Available Market9 Months 20109 Months 2010
In the first 9 months of 2010:
49% ACCI & IMS SAM*STE SAM
ACCI & IMS SAM up 36%
Combined ACCI & IMS revenue up 46%Non SAM**
10 points ahead of the market
* SAM = Serviceable Available Market** Non SAM = Microprocessor, Optoelectronics, DRAM and Flash memoriesSource: WSTS, Company
7

Top Customers
Top 10 OEM Customers FY 2010 (listed alphabetically)
Apple
Bosch
Cisco/Scientific Atlanta
Continental
HPHP
Nokia
Research in Motion
Samsung
Seagate
8
Sony Ericsson

Revenues by Market Segment / Channel*
FY10 Sales: $10.35B FY10 vs. FY09
• Automotive +39%14%21%
• Automotive +39%• Industrial & Other +30%• Consumer +28%• Computer +23%
13%
12%32% p• Telecom -3%
8%32%
• Distribution +61%Automotive Computer
Consumer Industrial & Other
Telecom Distribution
* See appendix
9

Revenues by Region
FY10 Revenue up 21.6%By location of order shipment
Greater China & South Asia
AmericasFY10 +31%
Q410 +14% y-o-y
EMEAFY10 +7%
Q410 -2% y-o-y
& South AsiaFY10 +32%
Q410 +15% y-o-y
Japan & KoreaFY10 +15%
Q410 +12% y-o-yQ y y
10

Revenues by Product Segment
ACCI Segment
Computer and Communication f (CC )
FY10 Sales: $10.35B
27%
38%
35%Infrastructure (CCI)
Home Entertainment & Displays (HED)**
Automotive (APG)
40%22%
IMS Segment
38%
70%
30%Analog, Power and MEMS (APM)
Micro, non-Flash Memory and
ACCI IMS Wireless*
ST’s exposure to the Wireless segment
Smartcard (MMS)
ST’s exposure to the Wireless segment at the earnings level is ~12% * See appendix
** Includes Imaging business
11

ACCI in 2010
ACCI RevenueRevenue up 32% with contribution from all key product families particularly for Automotive, Set-Top-
4000
4500
particularly for Automotive, Set TopBoxes, Printers and Communication Infrastructure Applications
US$M
2000
2500
3000
3500
Key Achievements:
Led STB in Europe & Asia
500
1000
1500
2000Significant design wins gained especially in
automotive, printers and communication infrastructure applicationsLaunch of Freeman, new single-chip TV SoC
L h f th fi t 32 b lk t h l0
FY08 FY09 FY10
Launch of the first 32nm bulk technology platform for networking applications
12

ACCI – Q410 Products Highlights
Automotive Key design win in China for a full engine-control kit from a tier-one playerCooperation between ST, a major Chinese car maker and a major European p , j j p
tier-one OEM to generate a next-generation direct-injection engine platform Key design win for car infotainment chips for an OEM radio-navigation
application
Digital Consumer Significant new deployments of second-generation STB decoders in Europe,
China, India, Middle East and South America with more than 50 customers in production 10 major designs for third-generation STBsWorld’s first demonstration to key customer of the Freeman Premier single-chip
TV SoC Key design wins for DisplayPort and monitor chipsets
Computer and Communications Infrastructure ZT Systems announced the first ARM-based computing server, embedding
ST’s SPEAr1310 microprocessorDesign win for a 32nm ASIC for a very high capacity networking switchDesign win for a 32nm ASIC for a very high capacity networking switch
application
13

IMS in 2010
Record sales with revenue up 45% driven by MEMS, advanced analog and microcontroller f ili
IMS Revenuefamilies
Key achievements:
ST MEMS everywhere: games smartphones 3500
4000
4500
US$M
ST MEMS everywhere: games, smartphones, tablets “Year of the gyroscope”Tremendous growth in 32-bit microcontrollersSeveral breakthroughs in Advanced Analog and 2000
2500
3000
3500
Several breakthroughs in Advanced Analog and SmartPowerQualification of Advanced Analog completed in
Crolles 300mm0
500
1000
1500
0FY08 FY09 FY10
14

IMS - Q410 Product HighlightsMEMS 3-axis digital MEMS gyroscope in production for a leading tablet maker based in
KoreaMEMS e-compass now in volume production at smartphone maker in China Launch of new family of high-g acceleration sensors for advanced airbag systems
Sensors & Analog Increased market penetration for micro-power op amps in glucose meters, LED
lights bulb and hard-disk drive applicationslights bulb and hard disk drive applications Launch of extremely small silicon pressure sensor for various applications
including smartphones, sports watches and other portable equipment
Smartcard & MicrocontrollersF th t i f th 32 bit MCU f il t i l d ARM C t M0 d M4 Further extension of the 32-bit MCUs family to include ARM Cortex-M0 and -M4 coresDesign wins for the new 1-Mbyte-Flash Access/Performance Line of 32-bit MCUs
at leading OEMs in consumer, healthcare and smart-metering applicationsNew NFC-enabled SIM card from Oberthur Technologies based on ST33 MCU
Energy Metering and PowerDesign win as the sole source for STarGRIDTM SoCs for smart metering
equipment in SpainMultiple design wins for power transistors including for a leading European maker p g p g g p
of solar panels and an important games platform power supply.
15

ST-Ericsson in 2010
Pivotal year for ST-Ericsson
As expected, on going legacy portfolio decrease not yet compensated by new products ST-Ericsson Revenue
(FY09 f )
4000
not yet compensated by new productsST Wireless Product Segment revenue down 14%
Key achievements:
(FY09 proforma)
US$M
2000
3000
Key achievements:
Restructuring efforts completed Strong performance of new 2G/EDGE platformsLaunch of HSPA+ M570 thin modem
1000
Launch of HSPA+ M570 thin modemPrepared product portfolio expansion in the
smartphone and tablet markets……including U8500 smartphone platform expected
to ramp in the second half of 2011 with several0
FY09 FY10
to ramp in the second half of 2011 with several Tier 1 customers
16

ST-Ericsson – Q410 Product Highlights
Collaboration with Quanta Computer on LTE modules and USB dongles
Joined forces with Nokia in TD-LTE in China, demonstrating multimedia services on a TD-LTE Nokia booklet containing ST-Ericsson’s M700 TD-LTE thin modem.
Smart mobility & multimedia
Samsung selected single-chip G4906 GSM/GPRS platform
Acer, Ericsson and Telstra launched the first netbook with a built-in 21Mbps HSPA+ mobile broadband module, based on p ,ST-Ericsson’s M570 thin modem
17

ST Products / Priorities for 2011Innovative products in highly successful applications continue to grow
MEMS gyroscopes & accelerometersgy pGeneral and secure 32-bit microcontrollers families ICs for Automotive
B kth h i d tBreakthrough in new products
SoCs for 3-D and connected TVsMEMS microphones and pressure sensors Advanced analog products for medical and smart grid applications Advanced analog products for medical and smart grid applications 32-bit Power PC microcontrollers for Automotive
ST-Ericsson’s key new products to ship in volume including HSPA+ thin modems and U8500 platform
We are ready for the next wave…
E M t & S i / H lth & W ll / T t d D t S it / Energy Management & Saving / Healthcare & Wellness / Trust and Data Security / Smart Consumer Devices
18

ST Manufacturing Evolution
ST STRATEGY PATH:
IDM Flexible IDM Lighter Asset
17 14 9 8
NUMBER OF FRONT END FABS:
17 14 9 8
WAFER PROBING (EWS):
From Europe to a major WW center in Singapore
ASSEMBLY NUMBER OF PLANTSASSEMBLY – NUMBER OF PLANTS:In Mediterranean :In Asia:
3 3 (1 China)
24 (2 China) Expand Asia
2005 end Q111end 2009
19

Manufacturing LocationsFrance
(Crolles I & II, Rousset, Tours)
Italy(Agrate, Catania 6”& 8”)
China Morocco
Malaysia
Phoenix(final stages of closure) Philippines
(Shenzhen, Longgang)Malta
Malaysia
Front-end fabs
Back-end fabs
20

Key Initiatives to Increase Capacity - 2010
Crolles 300mm Ramp to 3,200 w/week 32nm R&D capability
Agrate 200mm Increase capacity in BCD technologies & MEMS
Singapore 150mm Ramp to 18,000 w/day Partial conversion to 200mm
Q409 to Q410:Increase in total capacity including foundry ~20%
Foundry
Electrical Wafer Sort Increase capacity in wafer probing Increase capacity in wafer probing
Longgang / Shenzhen / Calamba Increase capacity in back-end fabs
21

Capacity Strategy for 2011
Objectives:
Support key product ramps:
AutomotiveMEMSWireless (U8500 smartphone platform)
30%
35%
40%
45%
Fuel revenue growth faster than SAM:
Anticipated CapEx between $1.1B and $1.5B as a transitional effort to support revenue growth and new products 10%
15%
20%
25% 2005 – 2010 ~11%ST 1995 – 2005 ~26%
growth and new products
Model:
Committed to asset lighter model
0%
5%
10%
Committed to asset lighter model 2009-10 capex/sales 7.9% 80% internal / 20% externalAdvanced CMOS targeting 2/3 external
CapEx as % of Revenues
22

Financial Results
Carlo FerroChief Financial Officer

Q4 & FY10 Highlights
2010: A year of improvement of financial results
Q410: Exiting the year with strong results and a solid capital structurea solid capital structure
Met our financial model
2011 opportunities
24

Financial Performance
In US$M, except EPS Q110 Q210 Q310 Q410 FY10 FY09
Net Revenues 2,325 2,531 2,657 2,833 10,346 8,510
Gross Margin 37.7% 38.3% 39.2% 39.9% 38.8% 30.9%
Adjusted Operating Profit*Adjusted Operating Margin*
120 5%
1034 1%
2208 3%
2458 6%
5805 6%
(732)8 6%Adjusted Operating Margin
Attributable to ST*0.5%4.0%
4.1%7.7%
8.3%11.6%
8.6%12.4%
5.6%9.2%
-8.6%-6.8%
Net Income – Reported 57 356 198 219 830 (1,131)
EPS Diluted 0 06 0 39 0 22 0 24 0 92 (1 29)EPS DilutedAdjusted EPS Diluted*
0.060.07
0.390.18
0.220.23
0.240.27
0.920.75
(1.29)(0.72)
Net Operating Cash Flow**Net Financial Position*
176565
212702
224878
3491 152
9611 152
1363420Net Financial Position 565 702 878 1,152 1,152 420
Effective Exchange Rate €/$ 1.39 1.35 1.34 1.34 1.36 1.37
* See appendix
** Including M&A, main amount being $1,145M in Q109
25

ST Total Revenues12 000
8 000
10,000
12,000
Flash Memory*US$M
4 000
6,000
8,000 yST ex FlashOthersWPSACCI
0
2,000
4,000 ACCIIMS
ACCI: +32%• Driven by all key families
IMS: +45%• MEMS – “year of gyros”
WPS: -14%• Ongoing transition
0FY01 FY02 FY03 FY04 FY05 FY06 FY07 FY08 FY09 FY10
Driven by all key families• Automotive• Printers• Set-top Box• Comm. Infrastructure
MEMS year of gyros• Microcontrollers• Advanced analog• Power & Industrial
Ongoing transition• New products ramping:
• 2G/EDGE• HSPA+ modem
• Preparing for U8500
* See appendix
26
Comm. Infrastructure Preparing for U8500

Operating Profitability
580
Operating Income(in US$M; excluding restructuring)
-7322009 Unused
CapacityVolume Price
EffectEfficiency
of Operations
Other Inc Exp
ProductMix
Opex $ Effect Operating Income
Wireless
2010
Leverage$1.31B operating income
Ongoing investment in ST-Ericsson
Analysis excluding ST-Ericsson
27
$ p g$1.84B revenue growth

Completed Exit from FlashM h 2008 F b 2010 M 2010 D b 2010March 2008
Numonyxformation
February 2010
Sale Agreementwith Micron signed
May 2010
Transaction Closing
December 2010
Monetized 70% of share
66.88M shares of Micron common stock At Micron’s share price of $8.75 on May 6, 2010 (transaction close) the value of the shares
were $585.2M A payable of $77 8M was due by ST to Francisco Partners
Considerationfor ST
proceeds
A payable of $77.8M was due by ST to Francisco Partners
Full ownership of the Numonyx M6 facility in Catania, Italy Contributed for 60M € by ST to the new photovoltaic joint initiative owned 33% by ST
46 8M h ld i d f $397M
for ST
St t f 46.8M shares sold against net proceeds of $397M 20.1M shares outstanding are fully hedged
At hedged price, total net consideration similar to value at closingE ti i h t f th $225M ST’ t t N lFinancial
Status as of Dec 31, 2010
Extinguishment of the $225M ST’s guarantee to a Numonyx loan Recovered $250M of restricted cash
Financial impact to ST
Over $1B improvement to ST’s capital structure
28
Over $1B improvement to ST s capital structure$265M gain recorded in ST’s 2010 P&L

ST Q410 Revenues
Q410 Revenues: +6.6% sequentially to $2,833M IMS, ACCI and Wireless increased 12%, 4% & 3%, respectively Growth in all regions; led by Japan-Korea, GC-South Asia, & America at 10%, 8%, & 7%, respectively
M k t t d i b A t ti I d t i l d C t t 16% 13% & 10% ti l
3,000US$M
Market segments driven by Automotive, Industrial and Computer at 16%, 13% & 10%, respectively
2,000
2,500
1,000
1,500
500
1,000
0Q308 Q408 Q109 Q209 Q309 Q409 Q110 Q210 Q310 Q410
29

ST Q410 Gross Margin
40%39.9%
35%
37.0%
30%
25%Q409 GM FX Price Volume & Product Mix* Group Mix* Q410 GM
Efficiency
30
* Product mix indicates the impact on the gross margin within each of the product groups. Group mix indicates the impact on the gross margin of business mix changes among product groups.

Operating Margin by SegmentWi l
25%1200
ACCI IMS Wireless
25%1200
50
100
150800
0%
13%
400
800
0%
13%
400
800
-150
-100
-50
0
0
400
Q308 Q409 Q410 Q308 Q409 Q410 Q409 Q410
Operating MarginRevenue Operating Income (US$M)
• 2010 Sales: $4.2B• FY10/09 Sales: +32%• Q410 Op Margin: 11.9%
• 2010 Sales: $3.9B• FY10/09 Sales: +45%• Q410 Op Margin: 22.5%
• 2010 Sales: $2.2B• FY10/09 Sales: -14%,
ongoing transition• Q410 Op Result: -$136M• 50% minority interesty
Targets*:
Q410: High single digitsMid t T
Targets*:
Q410: High teensMid t > 20%
Target:
Sustainable profitability
31
Mid-term: Teens Mid-term: > 20%
* Targets set on June 3, 2010; assumed revenues based on a substantial continuity in market demand trends and an effective exchange rate between 1.25 €/$ to 1.30 €/$

IMS BusinessesAnalog, MEMS & Microcontrollers (AMM) Advanced analog
Op Amps / Comparators MEMS
Gyroscopes / AccelerometersAMM Q410:
Gyroscopes / Accelerometers Microphones Pressure sensors
Microcontrollers 32-bit General purpose / secure
Revenues: $786MOperating Margin: 24.4%
p p Memories
E-EPROM / EPROMIMSQ410 Sales:
$1 13BPower Discrete Products (PDP) Discrete
Thyristors / Triacs / RectifiersPDP Q410:
$1.13B
y IPAD Protection
Power Transistors MOSFET IGBT
P RF
Revenues: $366MOperating Margin: 17.2%
Power RF
32
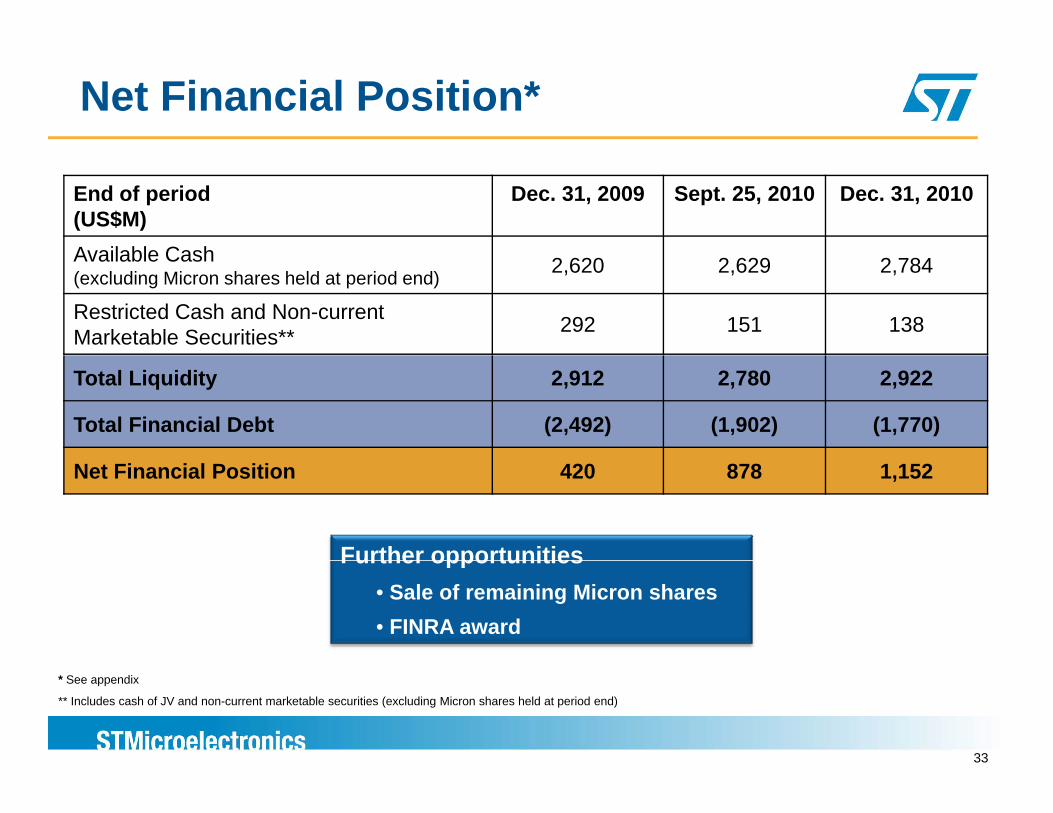
Net Financial Position*
End of period(US$M)
Dec. 31, 2009 Sept. 25, 2010 Dec. 31, 2010
Available CashAvailable Cash(excluding Micron shares held at period end) 2,620 2,629 2,784
Restricted Cash and Non-current Marketable Securities** 292 151 138
Total Liquidity 2,912 2,780 2,922
Total Financial Debt (2,492) (1,902) (1,770)
Net Financial Position 420 878 1,152
Further opportunitiesFurther opportunities• Sale of remaining Micron shares• FINRA award
* See appendix
** Includes cash of JV and non-current marketable securities (excluding Micron shares held at period end)
33

2 Years of Improving ST Capital Structure
1,152
-545
(US$M)
Dec. 312008
Operating Cash Flow before M&A
M&A Others Dividends Dec. 312010
-545
$1.7B swing in 8 quarters through 2009 recession + 2010 recovery
Capex/sales 7.9%
34
Dividend yield ~3% (on average share price in the period)

Return on Invested Capital
Return on Net Assets* (%)
19.020.7
20
30 RONA RONA attributable to ST*
10.5
4.60 7
6.0
13.0 13.9
7.65.1
11.9
10
-0.8
-7.1
0.7
-16 1-13.8
-5.3
-10
0
-16.2 -16.6
-16.1
-20Q3 08 (**) Q4 08 Q1 09 Q2 09 Q3 09 Q4 09 Q1 10 Q2 10 Q3 10 Q4 10
* See appendix
** w/o NXP acquisition-related one-time IP/inventory
35
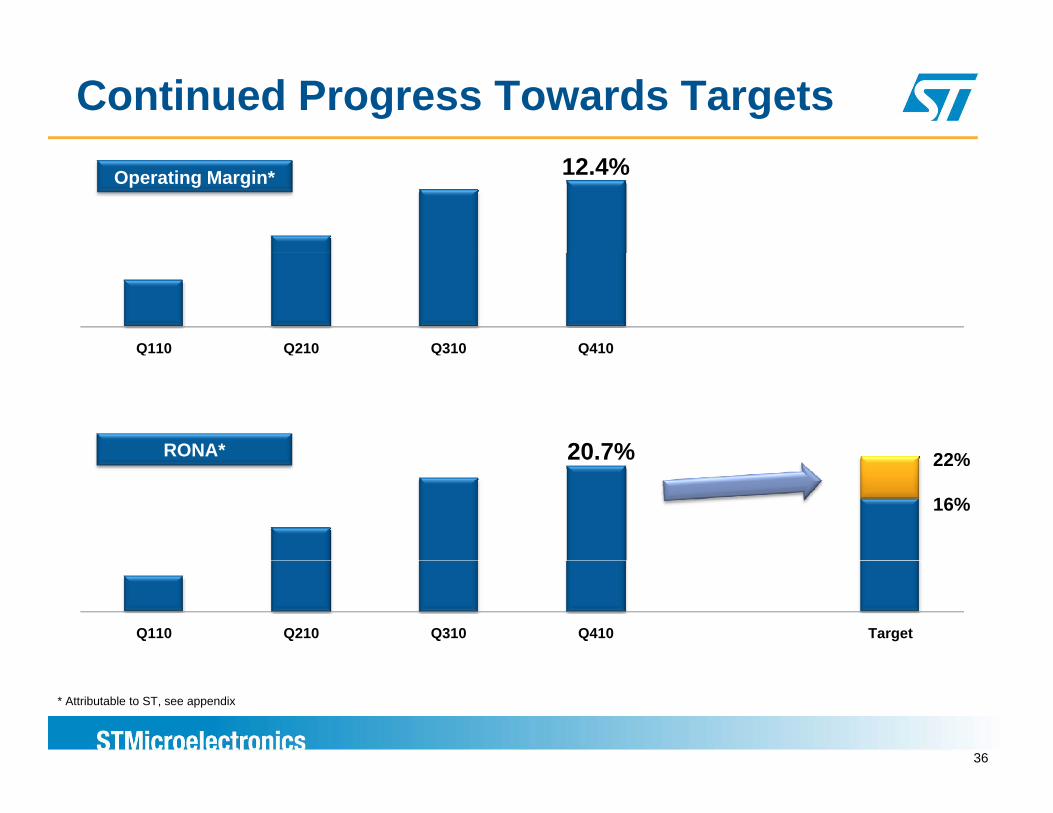
Continued Progress Towards Targets12.4%Operating Margin*
Q110 Q210 Q310 Q410
20.7% 22%RONA* 20.7% 22%
16%
Q110 Q210 Q310 Q410 Target
36
* Attributable to ST, see appendix
Q4 & FY10 – Summary
2010: A year of improvement of financial results Revenues up 21.6% to a record $10.35B Y-o-Y growth of 38% in ACCI+IMS higher than expected SAM growthg % g p g Operating income of $476M Completed exit from Flash Memory business Transition in Wireless progressing
Q410: Exiting the year with strong results and solid capital structure Revenues up 6.6% sequentially Gross margin increased again to 39.9%, up 70 basis points sequentially ACCI and IMS operating margins reached 11.9% and 22.5%, respectively, while
ti l f Wi l $136Moperating loss for Wireless was $136M Net financial position of $1.15B
Met our financial modelRONA and Operating Margin attributable to ST progressed throughout 2010 to reach RONA and Operating Margin attributable to ST progressed throughout 2010 to reach 20.7% and 12.4%, respectively in Q410*
Targets set in June 2010 for Q410 achieved one quarter in advance
* See appendix
37

Looking Forward to 2011
SAM expected to grow 5% to 8%:
ST to gain market shareST to gain market share
Leverage product portfolio:All segments targeting
operating margin
Deliver results:Y-o-Y improvements in operating margin
improvement from current levels
o p o e e tsquarterly operating
profitability
Anticipated CapEx of between $1.1B to $1.5B as a transitional effort to support
revenue growth and new productsproducts
Q1 2011 Outlook:Revenues sequentially about -7% to -12% (assuming midpoint, up 10% y-o-y)
38
q y % % ( g p , p % y y)Gross Margin about 39% ± 1%

Shareholders Value Proposition
World-wide semiconductor
leader
ST value driven by strategic
transformations
Sustainable profitability & strong
capital structure
Wireless as a value opportunity
Expanded customer base y
Innovative products serving high-growth
d k t
39
end markets

Appendix Net operating cash flow is defined as net cash from operating activities minus net cash used in investing activities, excluding payment for purchases of and
proceeds from the sale of marketable securities (both current and non-current), short-term deposits and restricted cash. We believe net operating cash flow provides useful information for investors and management because it measures our capacity to generate cash from our operating and investing activities to sustain our operating activities. Net operating cash flow is not a U.S. GAAP measure and does not represent total cash flow since it does not include the cash flows generated by or used in financing activities. In addition, our definition of net operating cash flow may differ from definitions used by other companies
Net financial position: resources (debt), represents the balance between our total financial resources and our total financial debt. Our total financial resources include cash and cash equivalents net of bank overdrafts if any current and non current marketable securities excluding Micron shares received in connection withinclude cash and cash equivalents, net of bank overdrafts, if any, current and non-current marketable securities excluding Micron shares received in connection with the sales of Numonyx, short-term deposits and non-current restricted cash, and our total financial debt includes the current portion of long-term debt and long-term debt, all as reported in our consolidated balance sheet. We believe our net financial position provides useful information for investors because it gives evidence of our global position either in terms of net indebtedness or net cash by measuring our capital resources based on cash, cash equivalents and marketable securities and the total level of our financial indebtedness. Net financial position is not a U.S. GAAP measure.
Return on Net Assets (RONA) is the ratio of operating income before impairment and restructuring charges divided by average net assets used during the period. ST defines average net assets as average total assets net of total liabilities as reported in our consolidated balance sheet excluding all items related to our financial position such as cash and cash equivalents marketable securities short term deposits bank overdrafts current portion of long term debt and long term debtposition such as cash and cash equivalents, marketable securities, short term deposits, bank overdrafts, current portion of long term debt and long term debt.
Adjusted operating income (loss) excludes impairment, restructuring charges and other related closure costs.
Adjusted operating income attributable to ST is calculated as adjusted operating income (loss) excluding 50% of ST-Ericsson operating income (loss) before restructuring as consolidated by ST. Adjusted operating margin attributable to ST is calculated as adjusted operating income attributable to ST divided by reported revenues excluding 50% of ST-Ericsson revenues as consolidated by ST. Return on Net Assets (RONA) attributable to ST is calculated as annualized adjusted operating income attributable to ST divided by reported net assets excluding 50% of ST-Ericsson net assets as consolidated by ST.
Adjusted net earnings and earnings per share (EPS) are used by our management to help enhance an understanding of ongoing operations and to communicate the impact of the excluded items. Adjusted earnings exclude impairment, restructuring charges and other related closure costs attributable to ST, the impact of equity investment divestiture, other-than-temporary impairment (OTTI) charges on financial assets, net of the relevant tax impact.
Key Information on Consolidation / Deconsolidation: ST completed the deconsolidation of its Flash Memory Group (FMG) segment and took an equity interest in Numonyx on March 30, 2008. Numonyx was
sold to Micron on May 7, 2010. ST-NXP Wireless, a joint venture initially owned 80% by ST, began operations on August 2, 2008 and was fully consolidated into ST’s operating results. On
February 1, 2009 and prior to the closing of the merger of ST-NXP Wireless and Ericsson Mobile Platforms to create ST-Ericsson, ST exercised its option to buy out NXP’s 20% ownership stake of ST-NXP Wireless.
ST-Ericsson, a joint venture owned 50% by ST, began operations on February 3, 2009 and is consolidated into ST’s operating results as of that date. ST-Ericsson is led by a development and marketing company and is consolidated by ST. A separate platform design company providing platform designs mostly to the development and marketing company is accounted for by ST using the equity method.
Wi l S t A f F b 3 2009 “Wi l ” i l d th ti f l d ti lt f th 50/50 ST E i j i t t lid t d i Wireless Segment: As of February 3, 2009, “Wireless” includes the portion of sales and operating results of the 50/50 ST-Ericsson joint venture as consolidated in the Company’s revenues and operating results, as well as other items affecting operating results related to the wireless business.
Sales recorded by ST-Ericsson and consolidated by ST are included in Telecom and Distribution
40

Pre-Tax Items to Adjusted Earnings*
In US$M Q110 Q210 Q310 Q410 FY10 FY09
ULT
U.S. GAAP Net Earnings 57 356 198 219 830 (1,131)
I i t & R t t i ChRAT
ING
RES
UG
S
Impairment & Restructuring Charges(attributable to Parent Company’s shareholders)**
20 8 18 20 66 240
Other-than-Temporary Impairment 140
OPE
RET
EA
RN
ING
Other-than-Temporary ImpairmentNumonyx ImpairmentEquity Investment DivestitureLoss on sale of Micron sharesEstimated Income Tax effect of Adj. (15)
(265)
60 (5)13(9)
(265)1331
140200
(76)
N
Adjusted Net Earnings* 62 159 211 243 675 (627)
* See appendix
** Total Impairment & Restructuring Charges were $33M in Q110, $12M in Q210, $27M in Q310, $33M in Q410, $104M in FY10 and $291M in FY09
41

Forward Looking StatementsS f th t t t t i d i thi l th t t hi t i l f t t t t f f t t ti d th f d l ki t t t ( ithi Some of the statements contained in this release that are not historical facts are statements of future expectations and other forward‐looking statements (within the meaning of Section 27A of the Securities Act of 1933 or Section 21E of the Securities Exchange Act of 1934, each as amended) that are based on management’s current views and assumptions, and are conditioned upon and also involve known and unknown risks and uncertainties that could cause actual results, performance or events to differ materially from those in such statements due to, among other factors:
Changes in demand in the key application markets and from key customers served by our products, which make it extremely difficult to accurately forecast and plan our future business activities. In particular, following a period of significant order cancellations in 2009, we have over the last quarters experienced a strong surge in customer demand, which has led to capacity constraints in certain applications; however we may again in the future, inexperienced a strong surge in customer demand, which has led to capacity constraints in certain applications; however we may again in the future, in case of excessive inventory at customers or distribution channels, experience order cancellations;
our ability to utilize and operate our manufacturing facilities at sufficient levels to cover fixed operating costs during periods of reduced customer demand, as well as our ability to ramp up production efficiently and rapidly to respond to increased customer demand, in an intensely cyclical and competitive industry, and the financial impact of obsolete or excess inventories if actual demand differs from our expectations;
the operations of the ST‐Ericsson Wireless joint venture, which represents a significant investment and risk for our business and which may lead to significant additional impairment and restructuring charges, in the event ST‐Ericsson is unable to successfully compete in a rapidly changing and increasingly competitive market;
our ability to compete in the semiconductor industry since a high percentage of our costs are fixed and are incurred in Euros and currencies other than U.S. dollars, especially in light of the increasing volatility in the foreign exchange markets and, more particularly, in the U.S. dollar exchange rate as compared to the Euro and the other major currencies we use for our operations;
the outcome of ongoing litigation as well as any new litigation to which we may become a defendant; changes in our overall tax position as a result of changes in tax laws or the outcome of tax audits, and our ability to accurately estimate tax credits,
benefits, deductions and provisions and to realize deferred tax assets; the impact of intellectual property (“IP”) claims by our competitors or other third parties, and our ability to obtain required licenses on reasonable terms
and conditions;and conditions; product warranty or liability claims based on epidemic failures or recalls by our customers for a product containing one of our parts; our ability in an intensively competitive environment to secure customer acceptance and to achieve our pricing expectations for high‐volume supplies of
new products in whose development we have been, or are currently, investing; availability and costs of raw materials, utilities, third‐party manufacturing services, or other supplies required by our operations; and changes in the political, social or economic environment, including as a result of military conflict, social unrest and/or terrorist activities, economic
turmoil, as well as natural events such as severe weather, health risks, epidemics, earthquakes, volcano eruptions or other acts of nature in, or affecting, the countries in which we our key customers or our suppliers operatethe countries in which we, our key customers or our suppliers, operate.
Such forward‐looking statements are subject to various risks and uncertainties, which may cause actual results and performance of our business to differ materially and adversely from the forward‐looking statements. Certain forward‐looking statements can be identified by the use of forward‐looking terminology, such as “believes,” “expects,” “may,” “are expected to,” ”, “should,” “would be,” “seeks” or “anticipates” or similar expressions or the negative thereof or other variations thereof or comparable terminology, or by discussions of strategy, plans or intentions.
Some of these risk factors are set forth and are discussed in more detail in “Item 3. Key Information— Risk Factors” included in our Annual Report on Form 20‐F for the year ended December 31, 2009, as filed with the SEC on March 10, 2010. Should one or more of these risks or uncertainties materialize, or should underlying
42
the year ended December 31, 2009, as filed with the SEC on March 10, 2010. Should one or more of these risks or uncertainties materialize, or should underlying assumptions prove incorrect, actual results may vary materially from those described in this release as anticipated, believed or expected. We do not intend, and do not assume any obligation, to update any industry information or forward‐looking statements set forth in this release to reflect subsequent events or circumstances.