htc corporation - iis windows servermedia.corporate-ir.net/media_files/irol/14/148697/2016/htc...
TRANSCRIPT
CHIALIN CHANG, CFO & PRESIDENT OF GLOBAL SALES May 9, 2016
HTC CORPORATION 1Q16 BUSINESS REVIEW
DISCLAIMER STATEMENT
• This presentation and release contain “forward-looking statements” which may include projections of future
results of operations, financial condition or business prospects based on our own information and other
sources.
• Our actual results of operations, financial condition or business prospects may differ from those expressed
or implied in these forward-looking statements for a variety of reasons, including but not limited to market
demand, price fluctuations, competition, international economic conditions, supply chain issues, exchange
rate fluctuations and other risks and factors beyond our control.
• The forward-looking statements in this release reflect the current belief of HTC as of the date of this
release. HTC undertakes no obligation to update these forward-looking statements for events or
circumstances that occur subsequent to such date.
EXECUTIVE SUMMARY
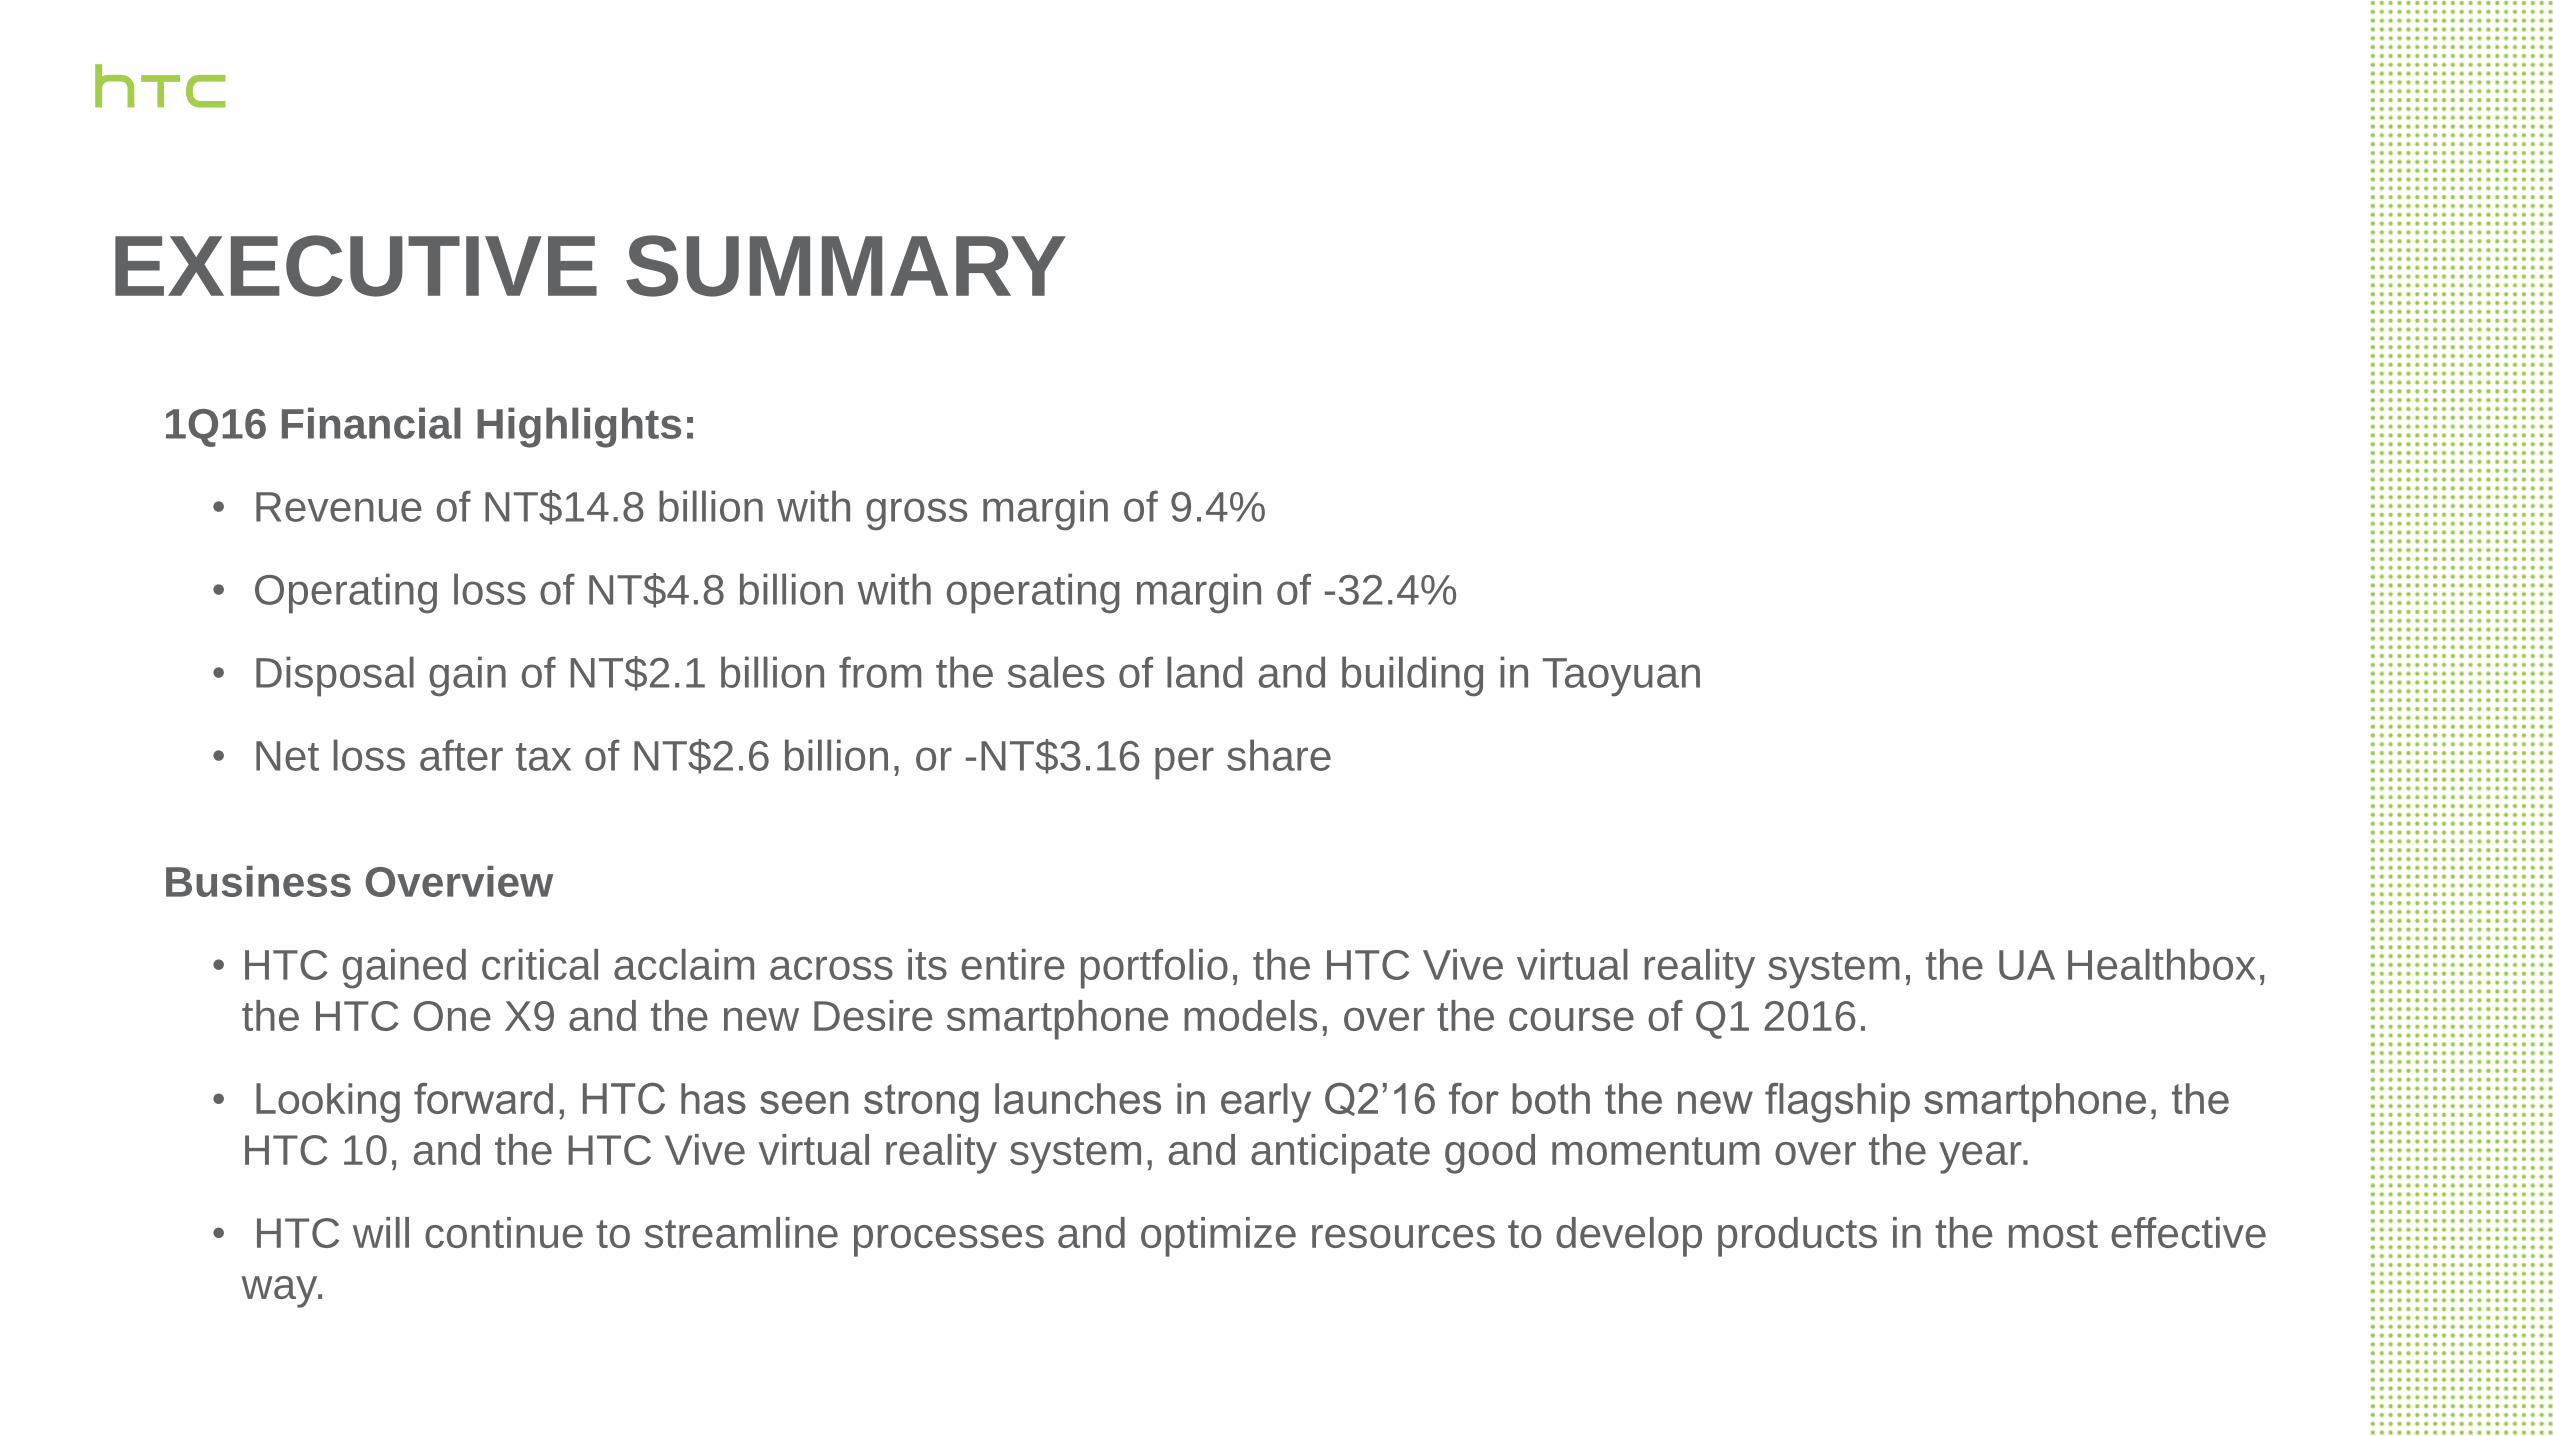
1Q16 Financial Highlights:
• Revenue of NT$14.8 billion with gross margin of 9.4%
• Operating loss of NT$4.8 billion with operating margin of -32.4%
• Disposal gain of NT$2.1 billion from the sales of land and building in Taoyuan
• Net loss after tax of NT$2.6 billion, or -NT$3.16 per share
Business Overview
• HTC gained critical acclaim across its entire portfolio, the HTC Vive virtual reality system, the UA Healthbox,
the HTC One X9 and the new Desire smartphone models, over the course of Q1 2016.
• Looking forward, HTC has seen strong launches in early Q2’16 for both the new flagship smartphone, the
HTC 10, and the HTC Vive virtual reality system, and anticipate good momentum over the year.
• HTC will continue to streamline processes and optimize resources to develop products in the most effective
way.
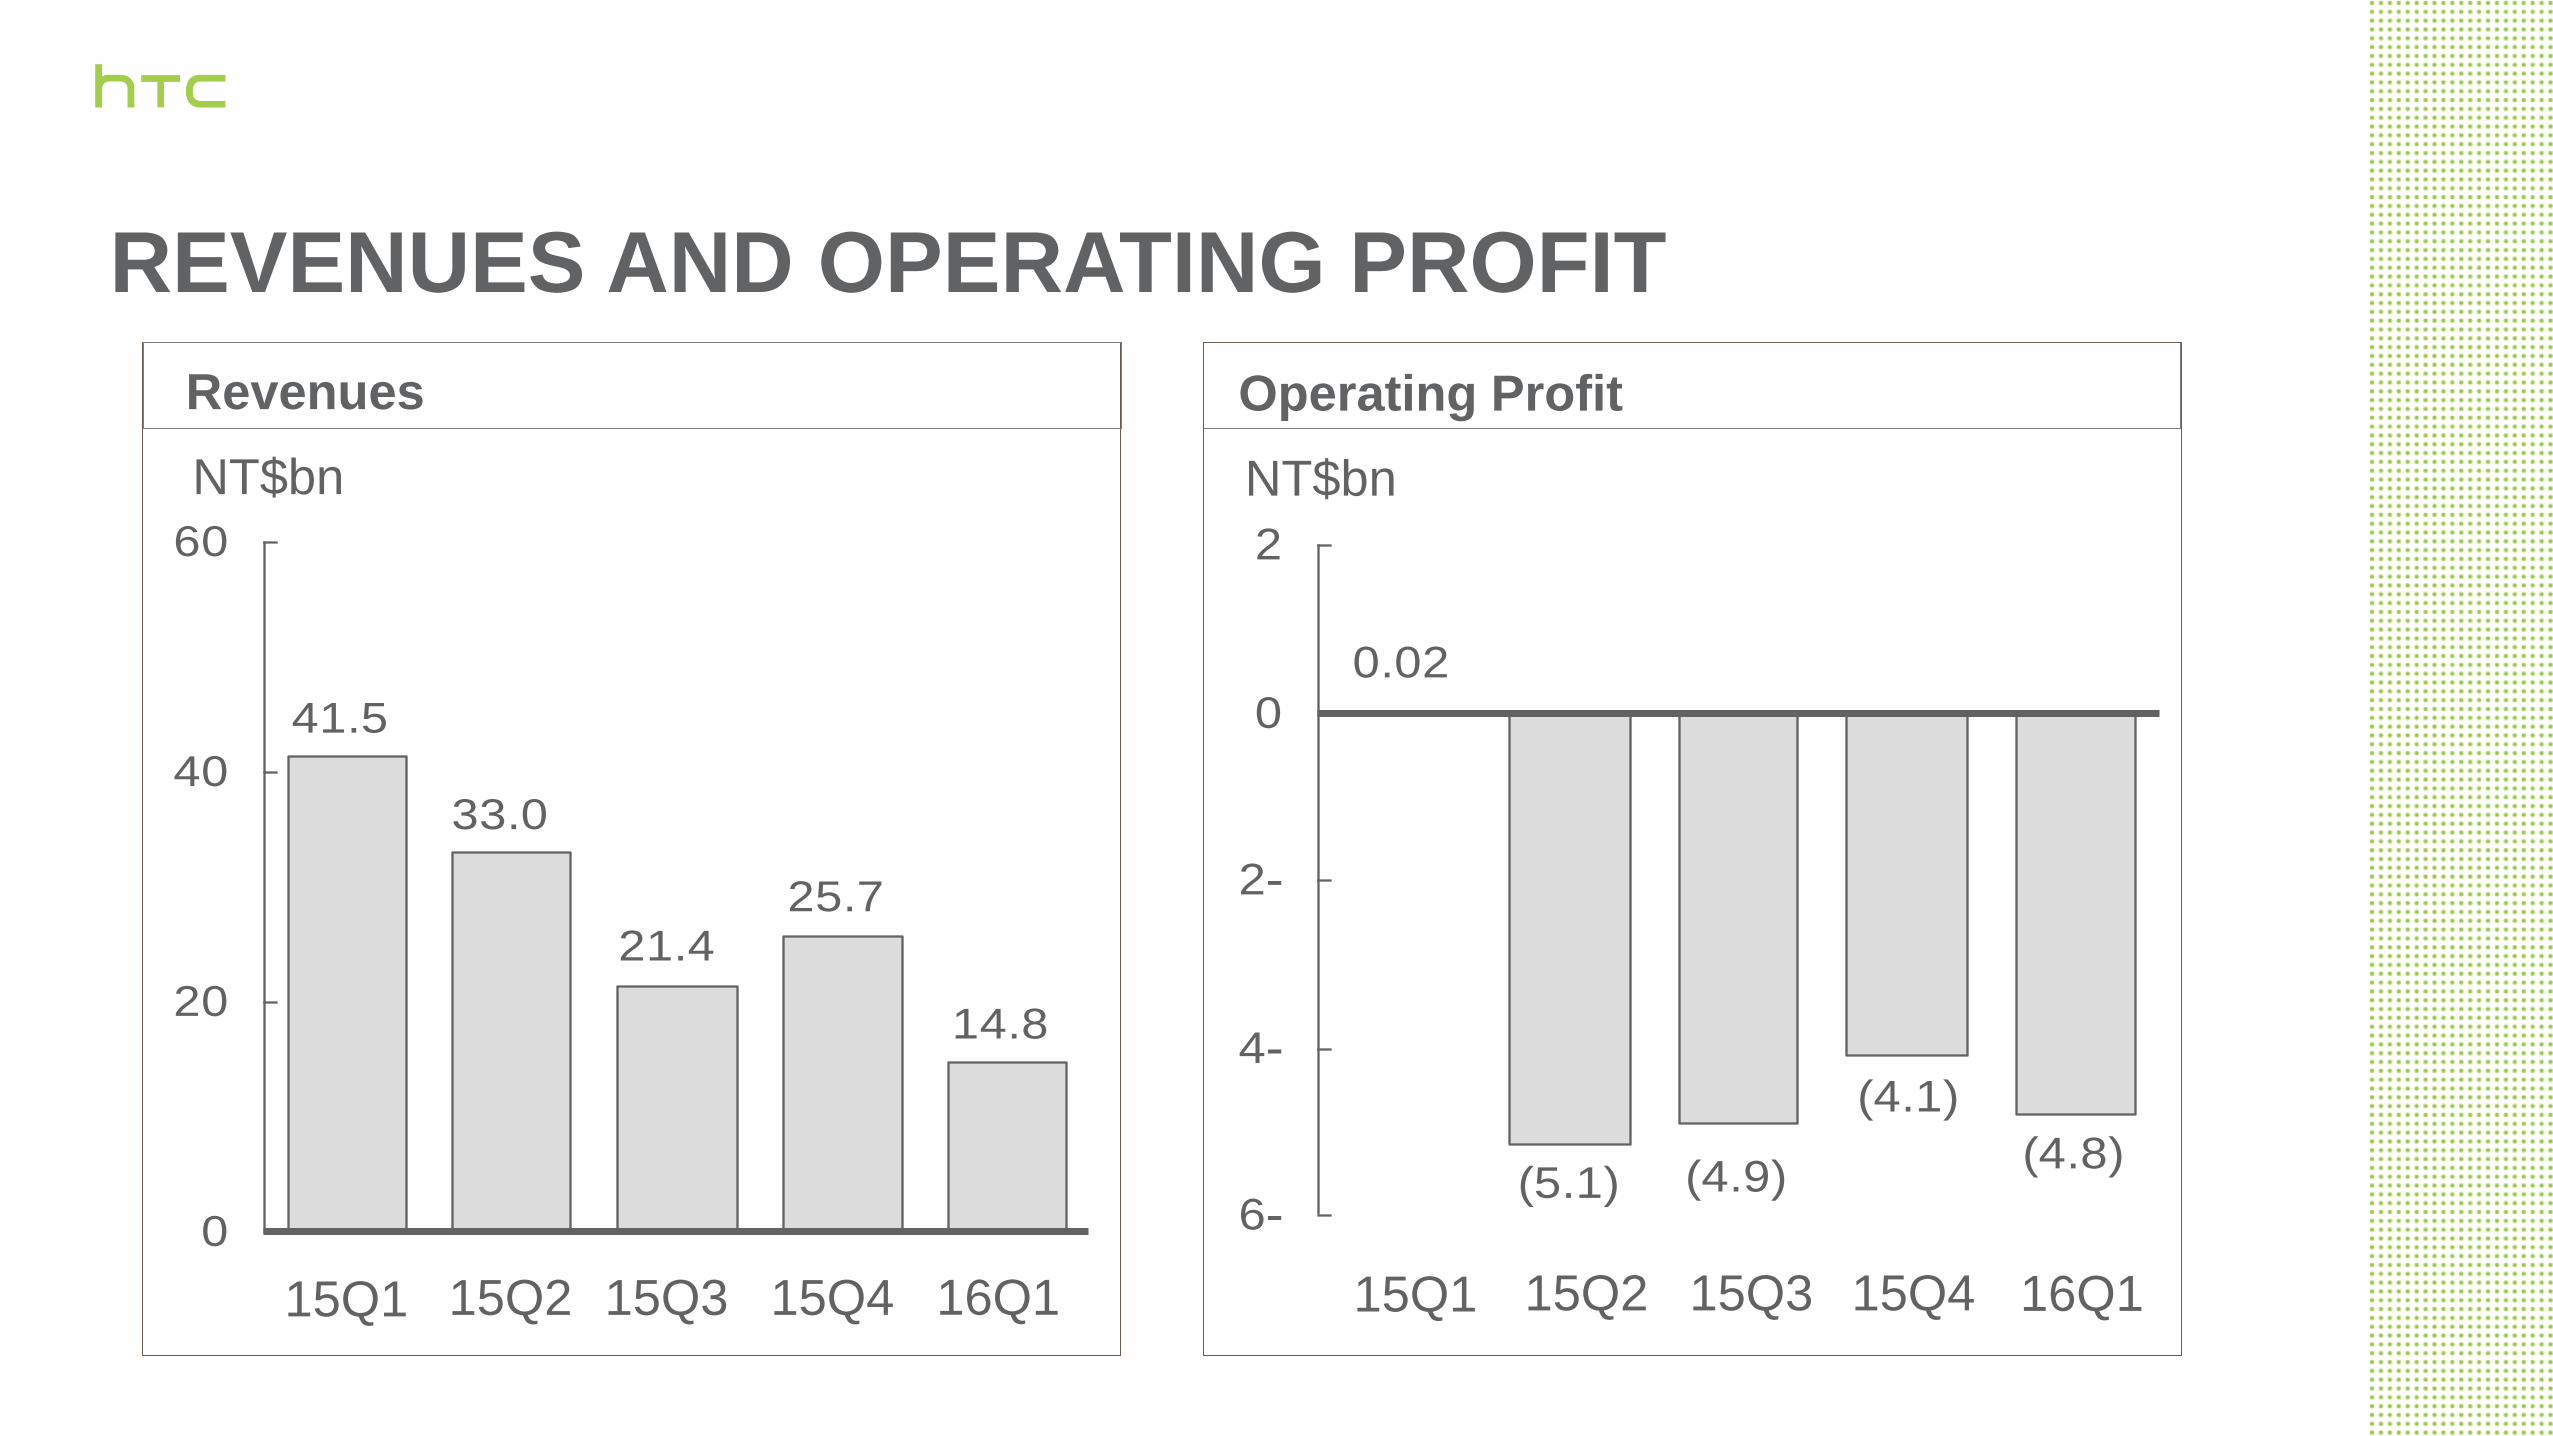
14.8
25.721.4
33.0
41.5
0
20
40
60
REVENUES AND OPERATING PROFIT
Revenues
NT$bn
Operating Profit
15Q1 15Q2 15Q3 15Q4 16Q1
(4.8)
(4.1)
(4.9)(5.1)
0.02
6-
4-
2-
0
2
15Q1
NT$bn
15Q2 15Q3 15Q4 16Q1
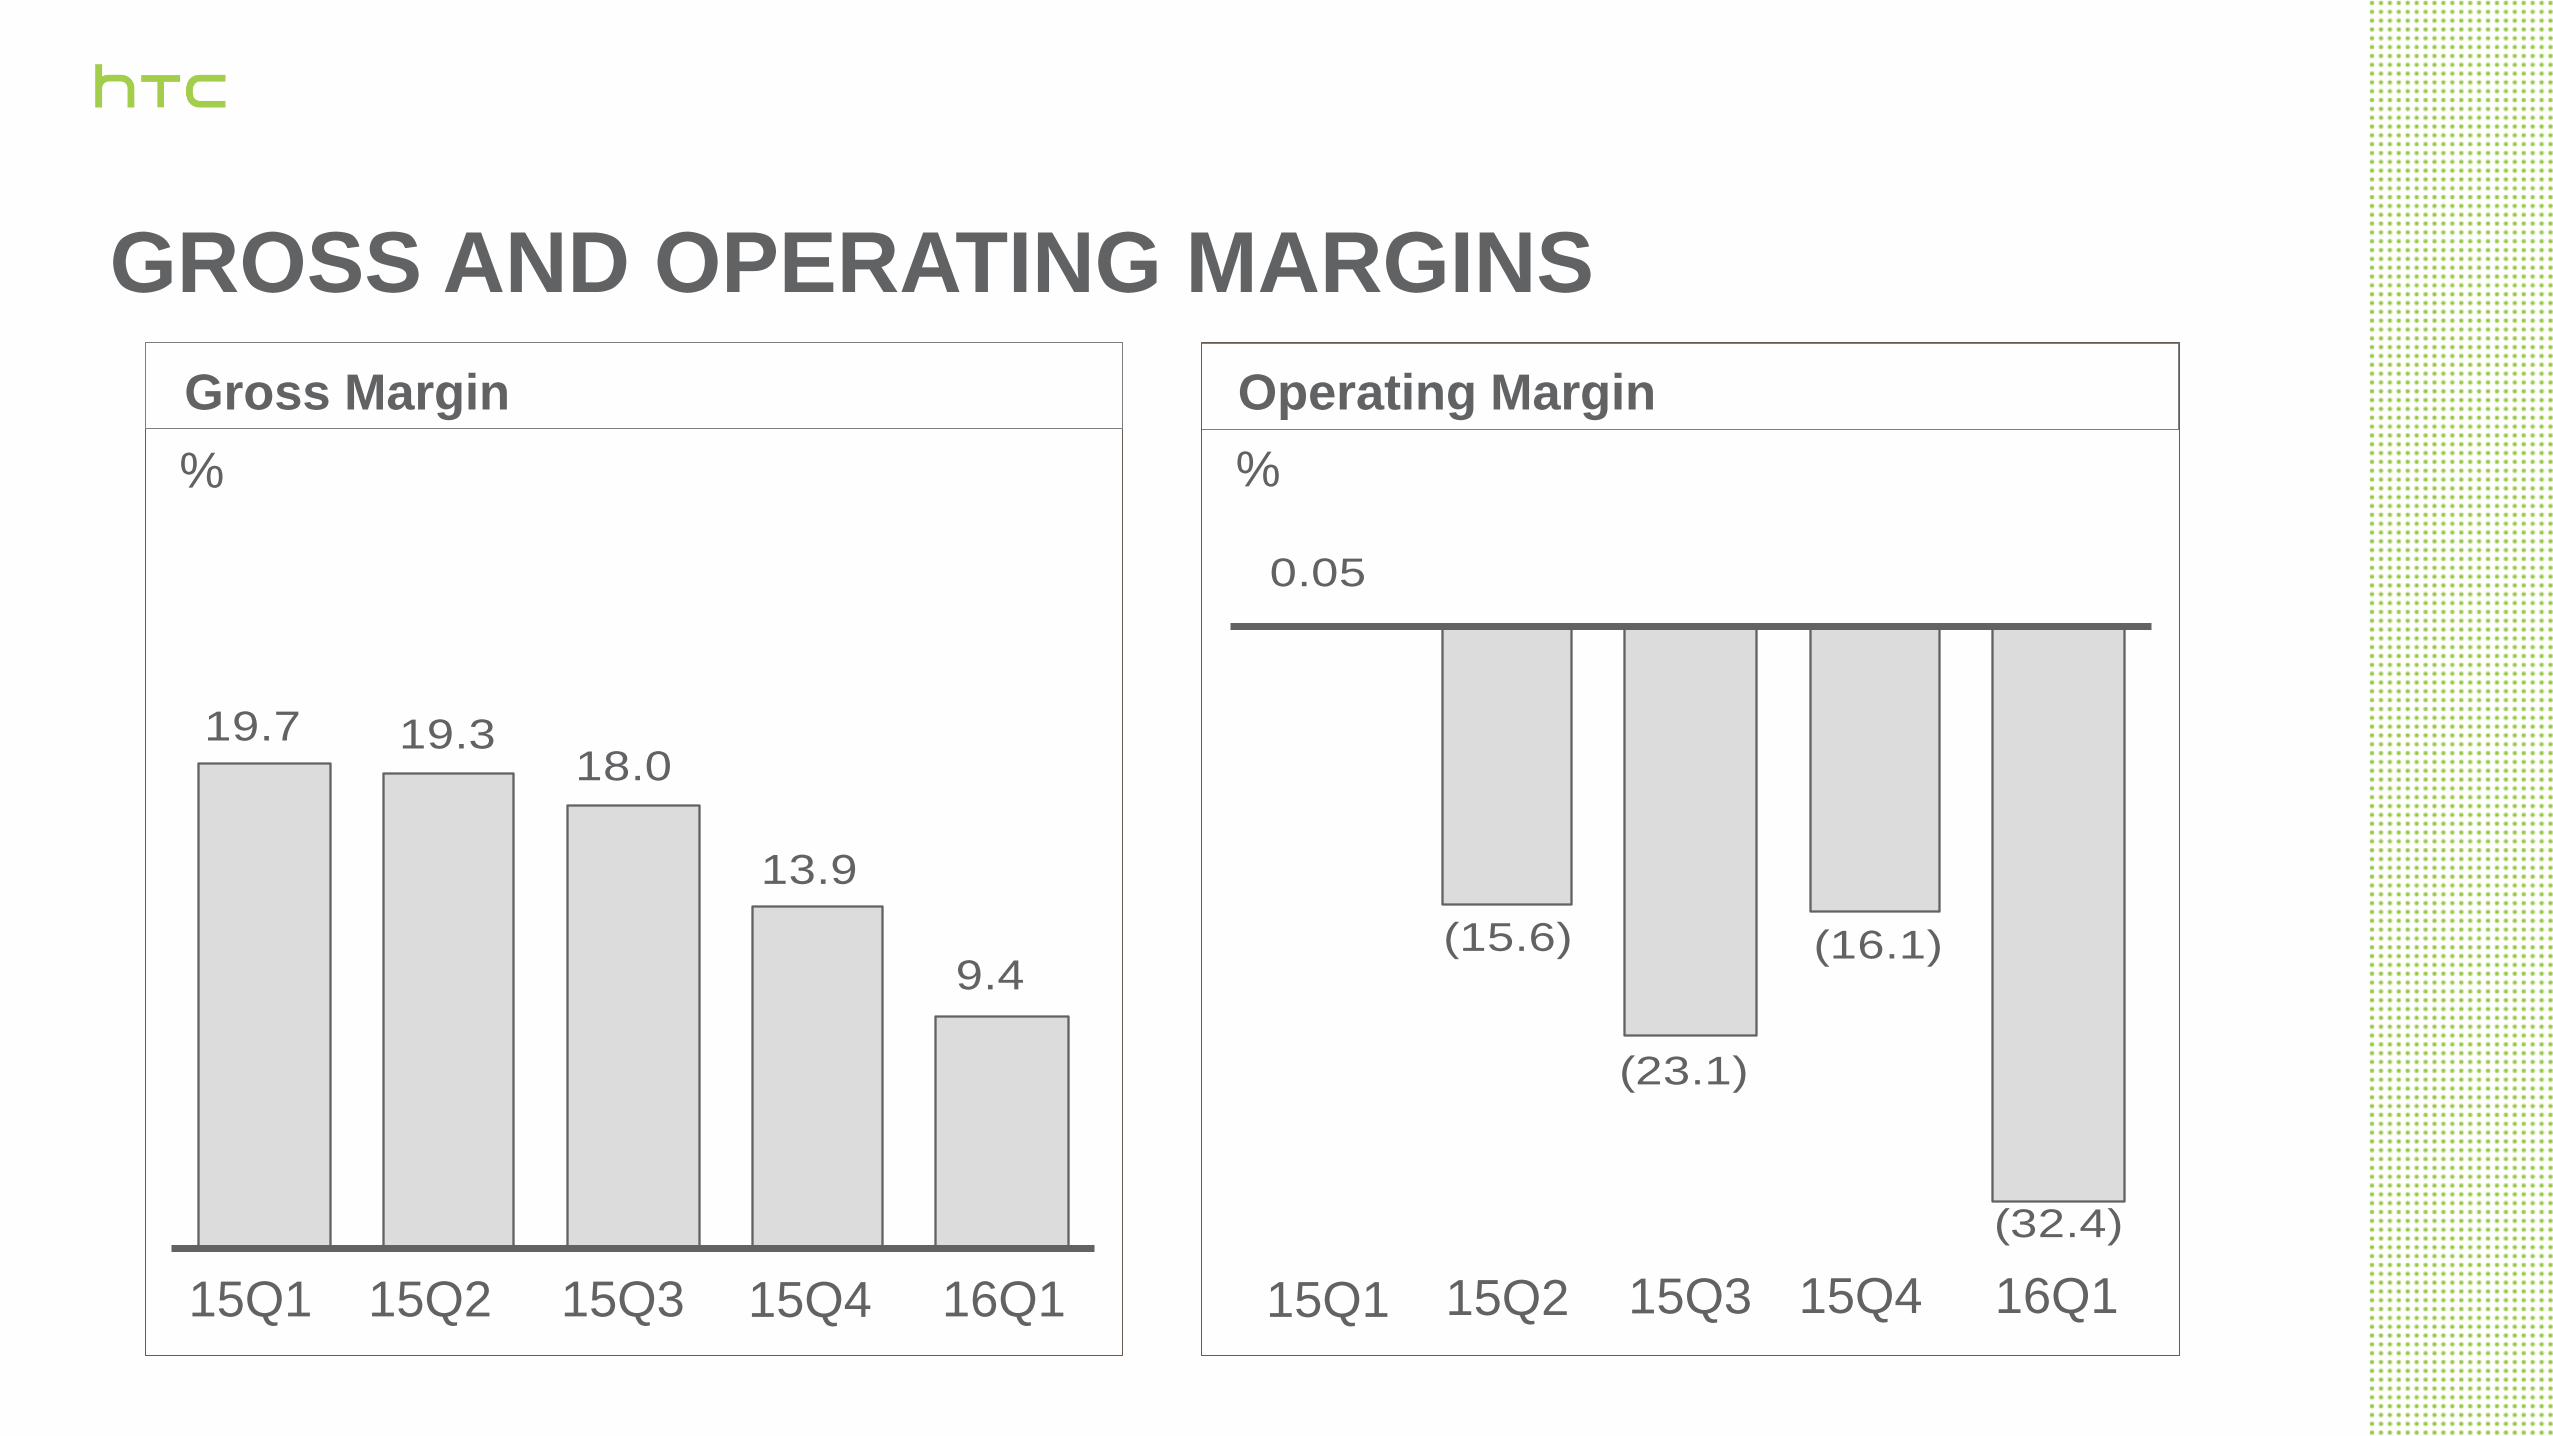
GROSS AND OPERATING MARGINS
Gross Margin
48%
Operating Margin
15Q1 15Q2 15Q3 15Q4 16Q1 15Q1 15Q2 15Q3 15Q4 16Q1
% %
(32.4)
(16.1)
(23.1)
(15.6)
0.05
9.4
13.9
18.019.319.7
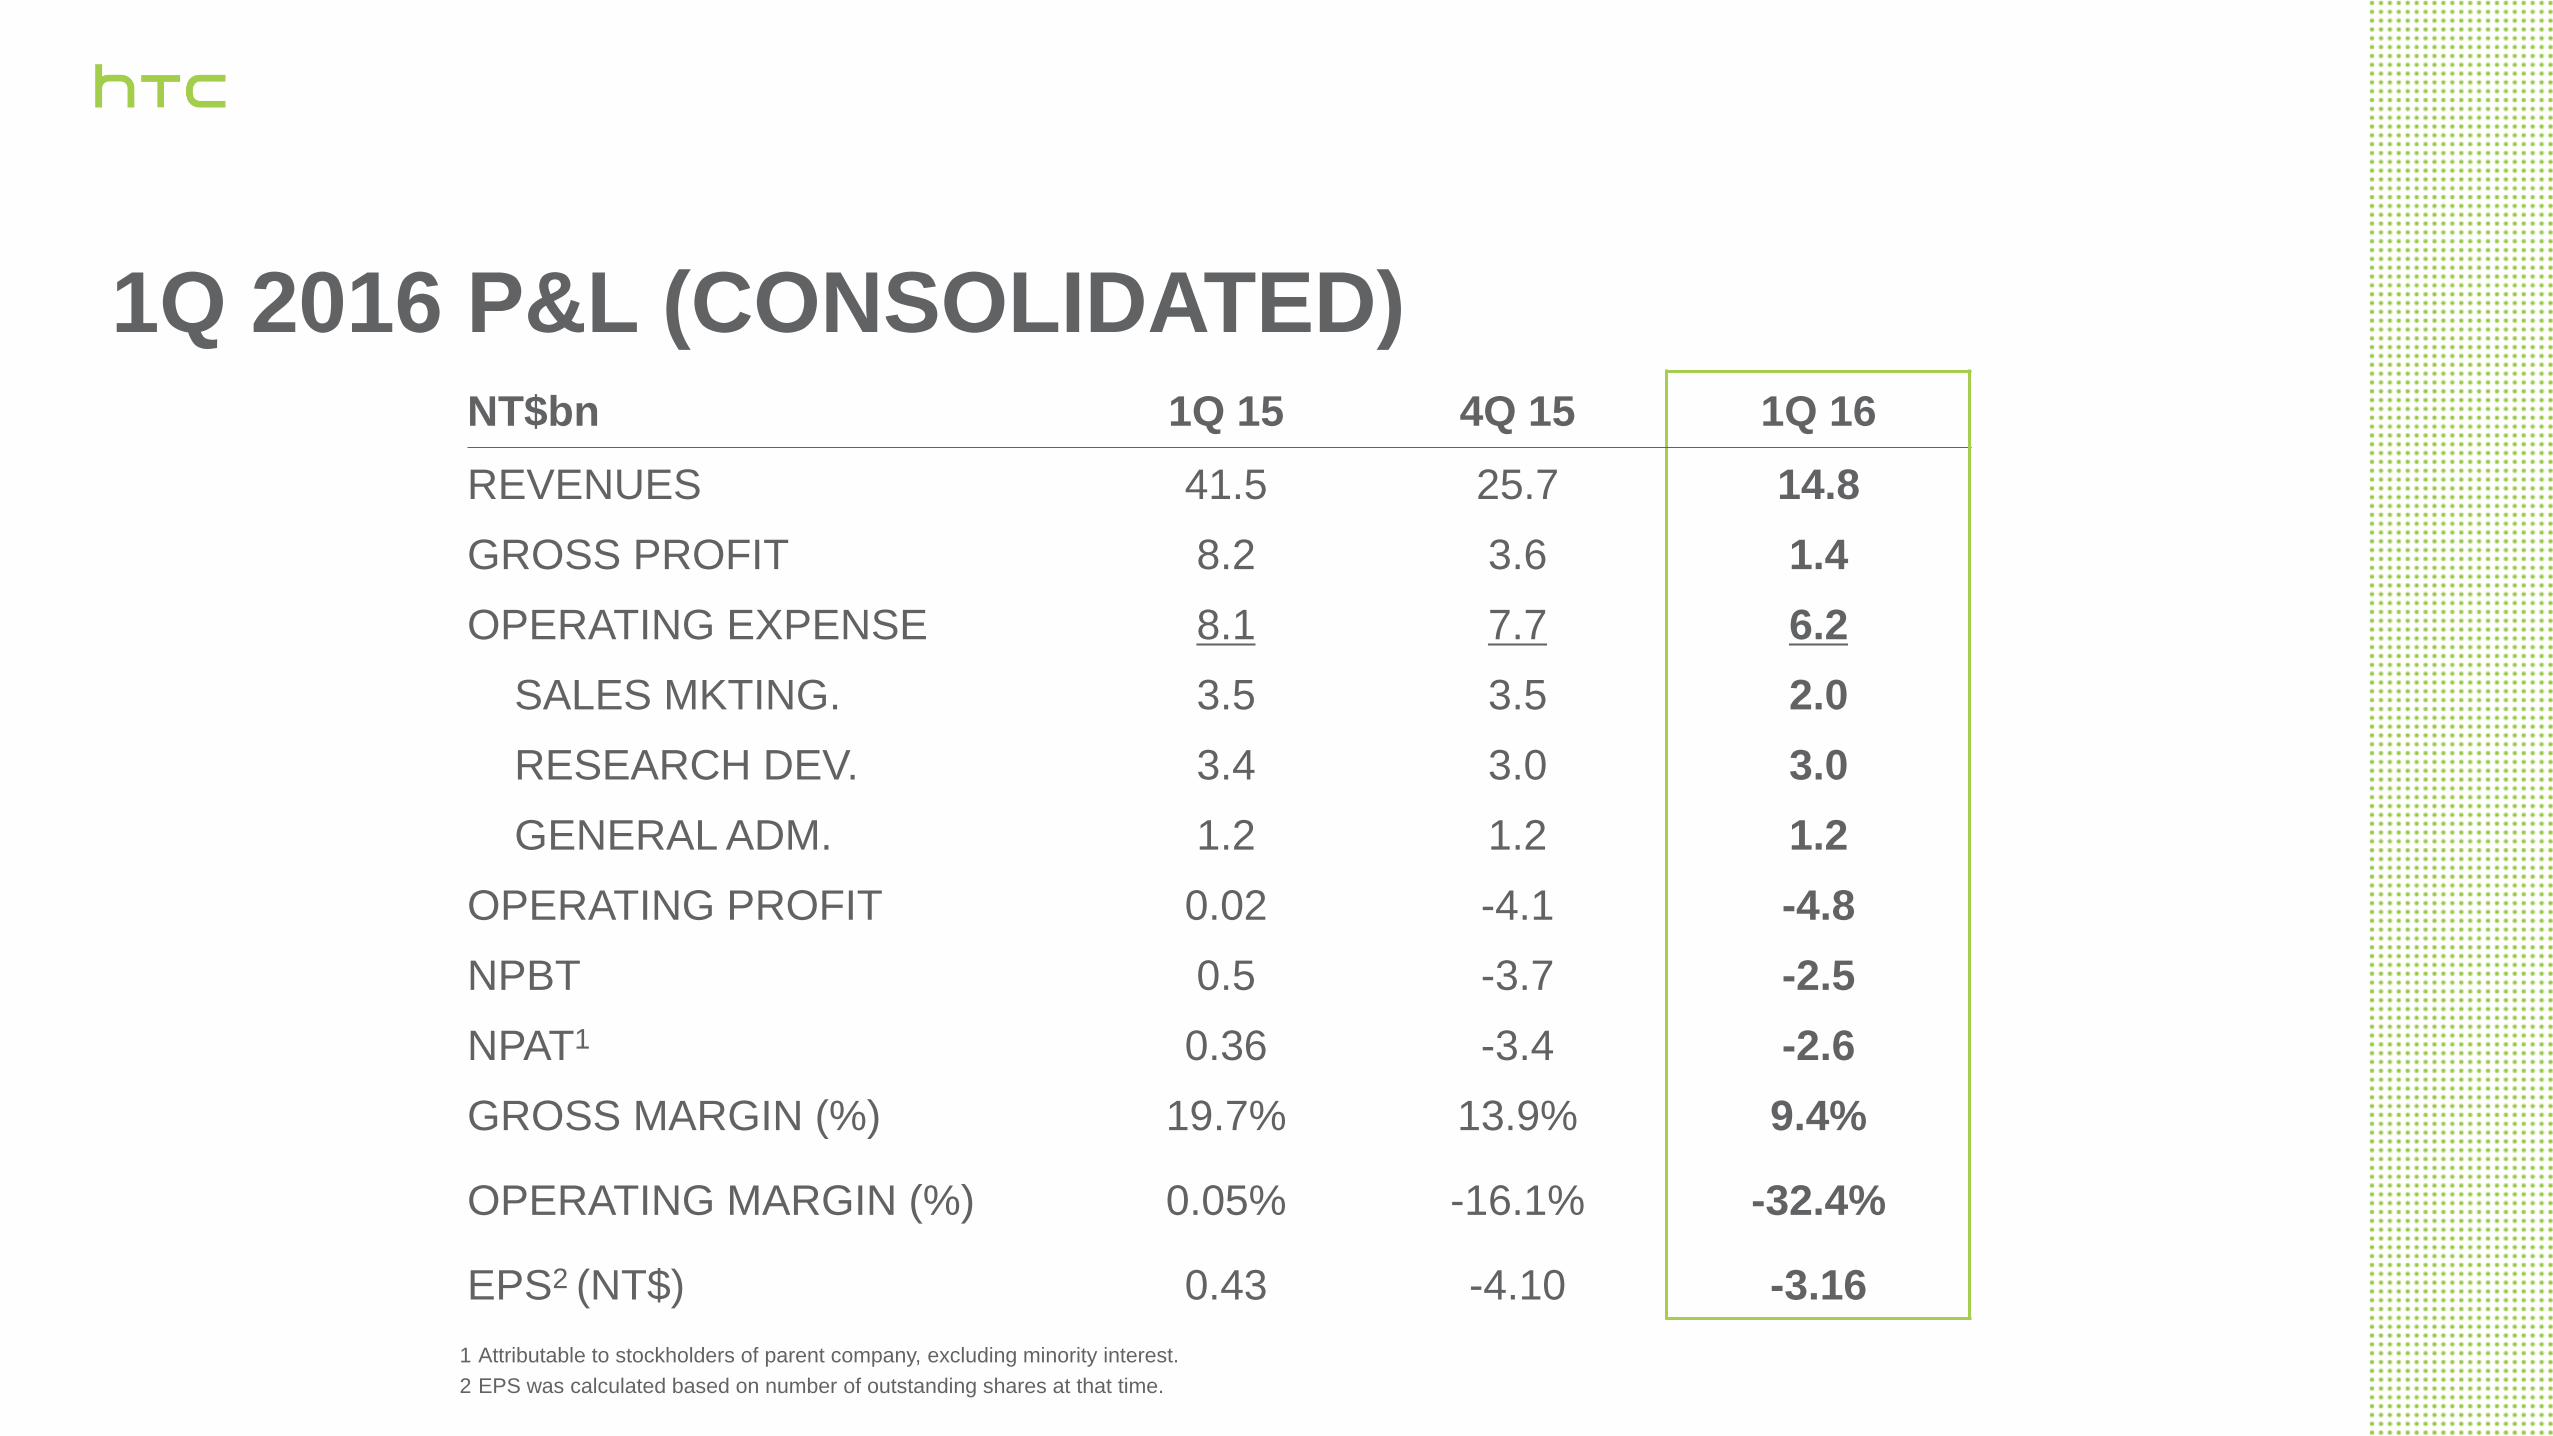
1Q 2016 P&L (CONSOLIDATED) NT$bn 1Q 15 4Q 15 1Q 16
REVENUES 41.5 25.7 14.8
GROSS PROFIT 8.2 3.6 1.4
OPERATING EXPENSE 8.1 7.7 6.2
SALES MKTING. 3.5 3.5 2.0
RESEARCH DEV. 3.4 3.0 3.0
GENERAL ADM. 1.2 1.2 1.2
OPERATING PROFIT 0.02 -4.1 -4.8
NPBT 0.5 -3.7 -2.5
NPAT1 0.36 -3.4 -2.6
GROSS MARGIN (%) 19.7% 13.9% 9.4%
OPERATING MARGIN (%) 0.05% -16.1% -32.4%
EPS2 (NT$) 0.43 -4.10 -3.16
1 Attributable to stockholders of parent company, excluding minority interest.
2 EPS was calculated based on number of outstanding shares at that time.
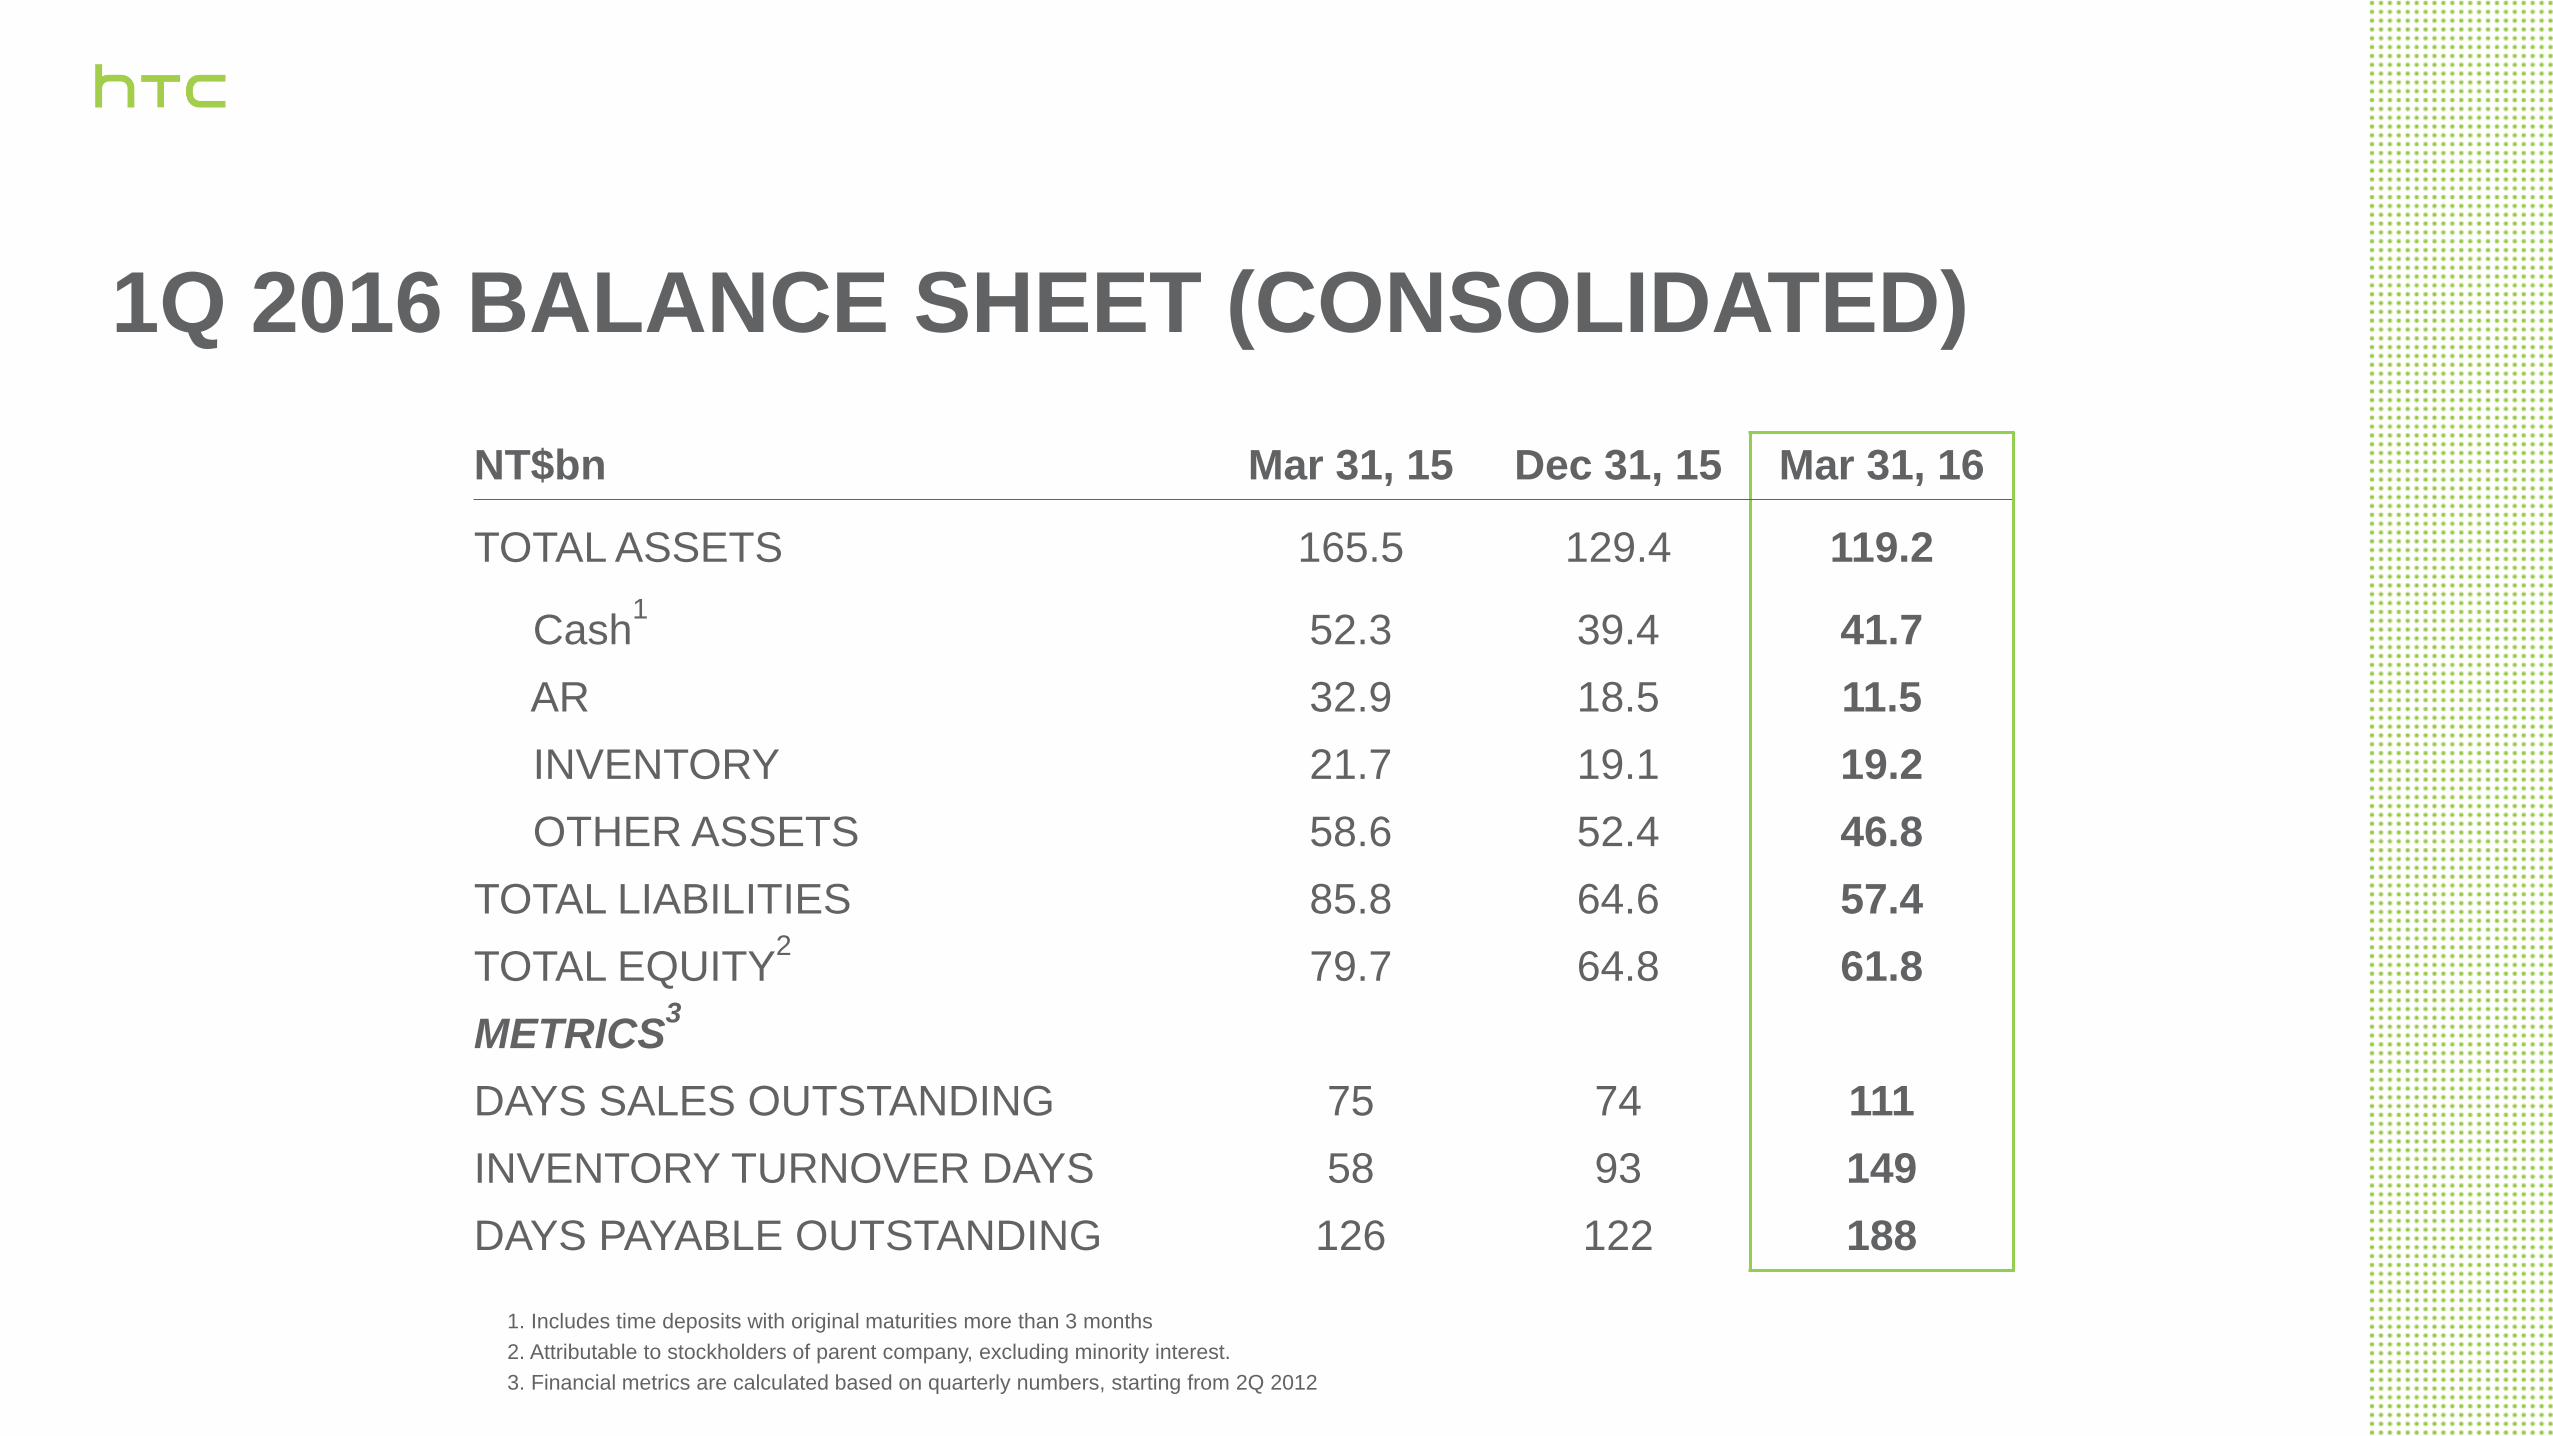
1Q 2016 BALANCE SHEET (CONSOLIDATED)
NT$bn Mar 31, 15 Dec 31, 15 Mar 31, 16
TOTAL ASSETS 165.5 129.4 119.2
Cash1 52.3 39.4 41.7
AR 32.9 18.5 11.5
INVENTORY 21.7 19.1 19.2
OTHER ASSETS 58.6 52.4 46.8
TOTAL LIABILITIES 85.8 64.6 57.4
TOTAL EQUITY2 79.7 64.8 61.8
METRICS3
DAYS SALES OUTSTANDING 75 74 111
INVENTORY TURNOVER DAYS 58 93 149
DAYS PAYABLE OUTSTANDING 126 122 188
1. Includes time deposits with original maturities more than 3 months
2. Attributable to stockholders of parent company, excluding minority interest.
3. Financial metrics are calculated based on quarterly numbers, starting from 2Q 2012

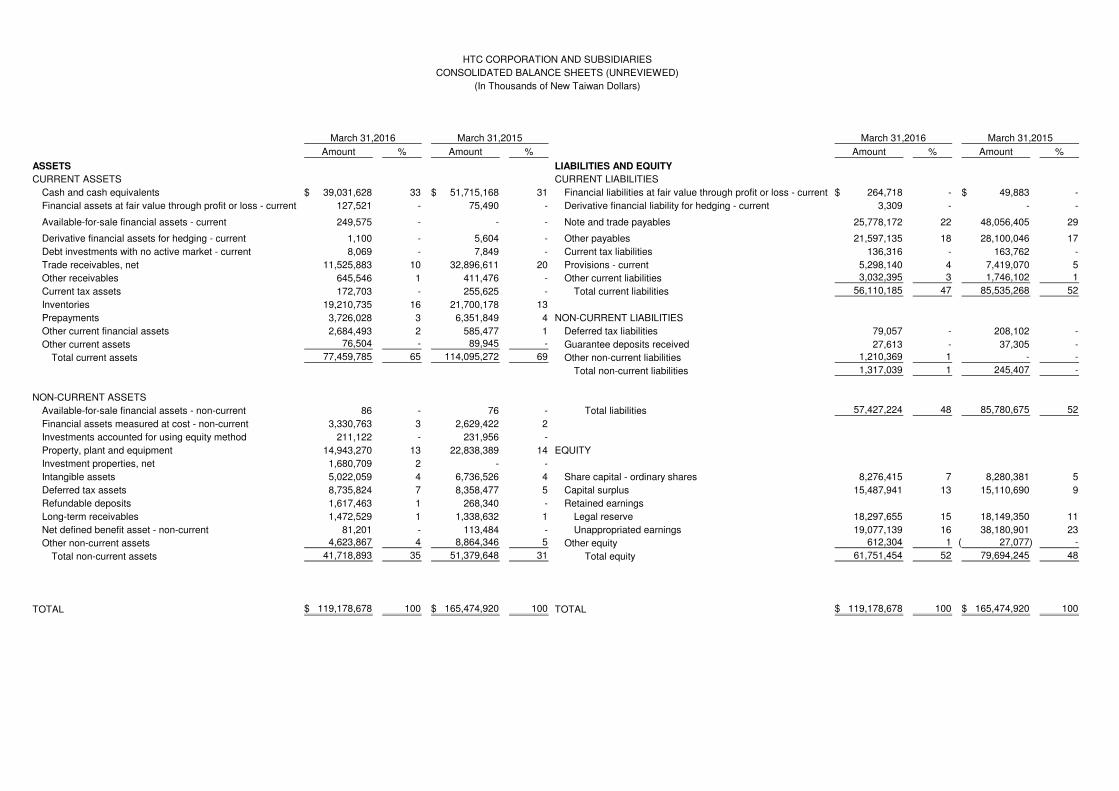
Amount % Amount % Amount % Amount %
ASSETS LIABILITIES AND EQUITY
CURRENT ASSETS CURRENT LIABILITIES
Cash and cash equivalents 39,031,628$ 33 51,715,168$ 31 Financial liabilities at fair value through profit or loss - current 264,718$ - 49,883$ -
Financial assets at fair value through profit or loss - current 127,521 - 75,490 - Derivative financial liability for hedging - current 3,309 - - -
Available-for-sale financial assets - current 249,575 - - - Note and trade payables 25,778,172 22 48,056,405 29
Derivative financial assets for hedging - current 1,100 - 5,604 - Other payables 21,597,135 18 28,100,046 17
Debt investments with no active market - current 8,069 - 7,849 - Current tax liabilities 136,316 - 163,762 -
Trade receivables, net 11,525,883 10 32,896,611 20 Provisions - current 5,298,140 4 7,419,070 5
Other receivables 645,546 1 411,476 - Other current liabilities 3,032,395 3 1,746,102 1
Current tax assets 172,703 - 255,625 - Total current liabilities 56,110,185 47 85,535,268 52
Inventories 19,210,735 16 21,700,178 13
Prepayments 3,726,028 3 6,351,849 4 NON-CURRENT LIABILITIES
Other current financial assets 2,684,493 2 585,477 1 Deferred tax liabilities 79,057 - 208,102 -
Other current assets 76,504 - 89,945 - Guarantee deposits received 27,613 - 37,305 -
Total current assets 77,459,785 65 114,095,272 69 Other non-current liabilities 1,210,369 1 - -
Total non-current liabilities 1,317,039 1 245,407 -
NON-CURRENT ASSETS
Available-for-sale financial assets - non-current 86 - 76 - Total liabilities 57,427,224 48 85,780,675 52
Financial assets measured at cost - non-current 3,330,763 3 2,629,422 2
Investments accounted for using equity method 211,122 - 231,956 -
Property, plant and equipment 14,943,270 13 22,838,389 14 EQUITY
Investment properties, net 1,680,709 2 - -
Intangible assets 5,022,059 4 6,736,526 4 Share capital - ordinary shares 8,276,415 7 8,280,381 5
Deferred tax assets 8,735,824 7 8,358,477 5 Capital surplus 15,487,941 13 15,110,690 9
Refundable deposits 1,617,463 1 268,340 - Retained earnings
Long-term receivables 1,472,529 1 1,338,632 1 Legal reserve 18,297,655 15 18,149,350 11
Net defined benefit asset - non-current 81,201 - 113,484 - Unappropriated earnings 19,077,139 16 38,180,901 23
Other non-current assets 4,623,867 4 8,864,346 5 Other equity 612,304 1 27,077)( -
Total non-current assets 41,718,893 35 51,379,648 31 Total equity 61,751,454 52 79,694,245 48
TOTAL 119,178,678$ 100 165,474,920$ 100 TOTAL 119,178,678$ 100 165,474,920$ 100
HTC CORPORATION AND SUBSIDIARIES
CONSOLIDATED BALANCE SHEETS (UNREVIEWED)
(In Thousands of New Taiwan Dollars)
March 31,2016 March 31,2015 March 31,2016 March 31,2015
Amount % Amount %
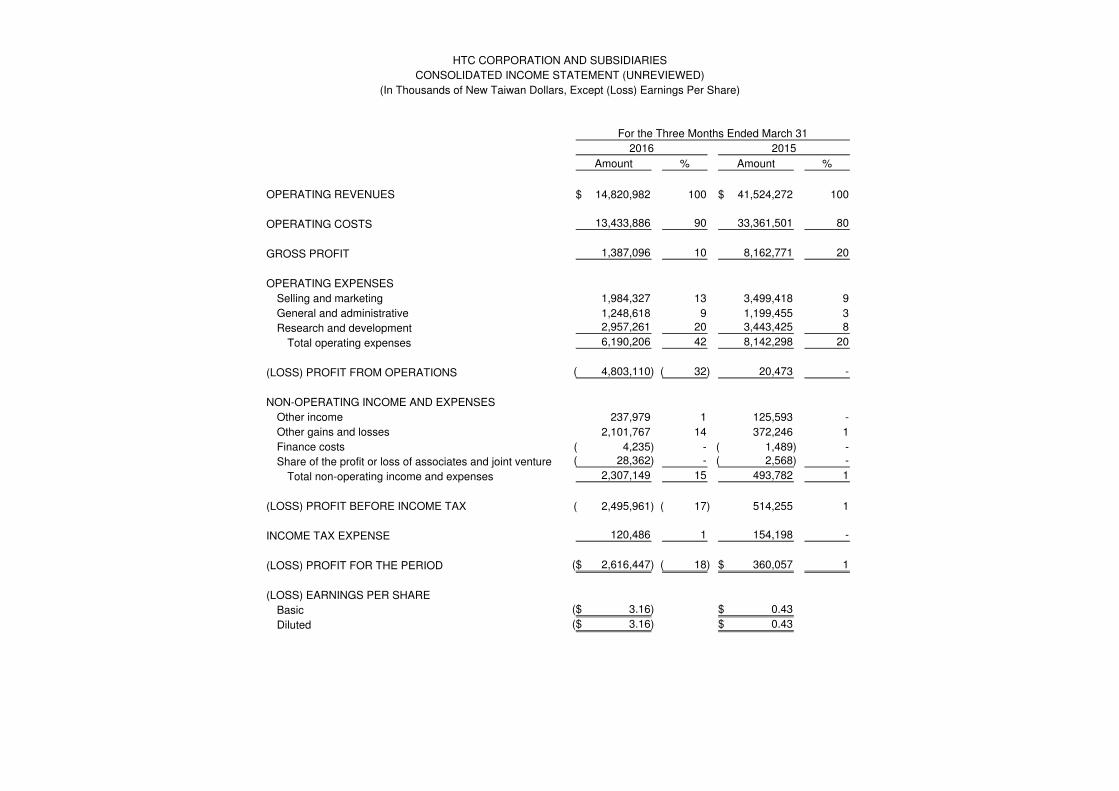
OPERATING REVENUES 14,820,982$ 100 41,524,272$ 100
OPERATING COSTS 13,433,886 90 33,361,501 80
GROSS PROFIT 1,387,096 10 8,162,771 20
OPERATING EXPENSES
Selling and marketing 1,984,327 13 3,499,418 9
General and administrative 1,248,618 9 1,199,455 3
Research and development 2,957,261 20 3,443,425 8
Total operating expenses 6,190,206 42 8,142,298 20
(LOSS) PROFIT FROM OPERATIONS 4,803,110)( 32)( 20,473 -
NON-OPERATING INCOME AND EXPENSES
Other income 237,979 1 125,593 -
Other gains and losses 2,101,767 14 372,246 1
Finance costs 4,235)( - 1,489)( -
Share of the profit or loss of associates and joint venture 28,362)( - 2,568)( -
Total non-operating income and expenses 2,307,149 15 493,782 1
(LOSS) PROFIT BEFORE INCOME TAX 2,495,961)( 17)( 514,255 1
INCOME TAX EXPENSE 120,486 1 154,198 -
(LOSS) PROFIT FOR THE PERIOD 2,616,447)($ 18)( 360,057$ 1
(LOSS) EARNINGS PER SHARE
Basic 3.16)($ 0.43$
Diluted 3.16)($ 0.43$
HTC CORPORATION AND SUBSIDIARIES
CONSOLIDATED INCOME STATEMENT (UNREVIEWED)
(In Thousands of New Taiwan Dollars, Except (Loss) Earnings Per Share)
2016 2015
For the Three Months Ended March 31
2016 2015
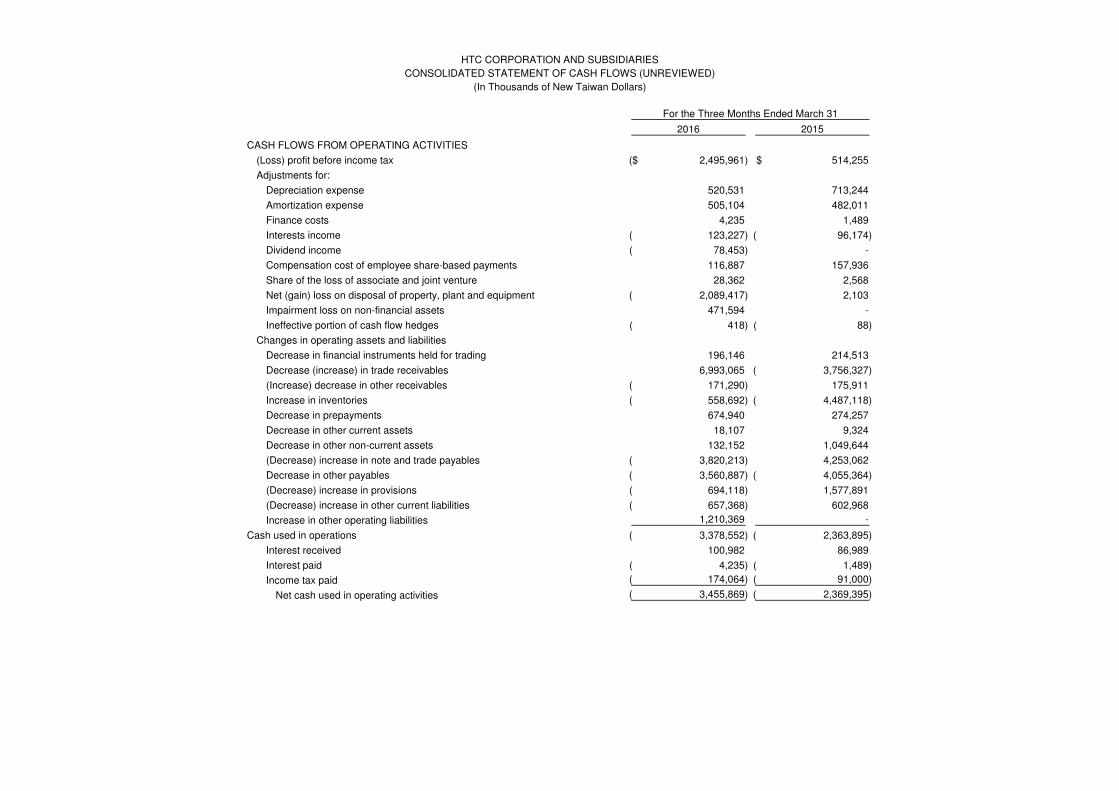
CASH FLOWS FROM OPERATING ACTIVITIES
(Loss) profit before income tax 2,495,961)($ 514,255$
Adjustments for:
Depreciation expense 520,531 713,244
Amortization expense 505,104 482,011
Finance costs 4,235 1,489
Interests income 123,227)( 96,174)(
Dividend income 78,453)( -
Compensation cost of employee share-based payments 116,887 157,936
Share of the loss of associate and joint venture 28,362 2,568
Net (gain) loss on disposal of property, plant and equipment 2,089,417)( 2,103
Impairment loss on non-financial assets 471,594 -
Ineffective portion of cash flow hedges 418)( 88)(
Changes in operating assets and liabilities
Decrease in financial instruments held for trading 196,146 214,513
Decrease (increase) in trade receivables 6,993,065 3,756,327)(
(Increase) decrease in other receivables 171,290)( 175,911
Increase in inventories 558,692)( 4,487,118)(
Decrease in prepayments 674,940 274,257
Decrease in other current assets 18,107 9,324
Decrease in other non-current assets 132,152 1,049,644
(Decrease) increase in note and trade payables 3,820,213)( 4,253,062
Decrease in other payables 3,560,887)( 4,055,364)(
(Decrease) increase in provisions 694,118)( 1,577,891
(Decrease) increase in other current liabilities 657,368)( 602,968
Increase in other operating liabilities 1,210,369 -
Cash used in operations 3,378,552)( 2,363,895)(
Interest received 100,982 86,989
Interest paid 4,235)( 1,489)(
Income tax paid 174,064)( 91,000)(
Net cash used in operating activities 3,455,869)( 2,369,395)(
HTC CORPORATION AND SUBSIDIARIES
CONSOLIDATED STATEMENT OF CASH FLOWS (UNREVIEWED)
(In Thousands of New Taiwan Dollars)
For the Three Months Ended March 31
2016 2015
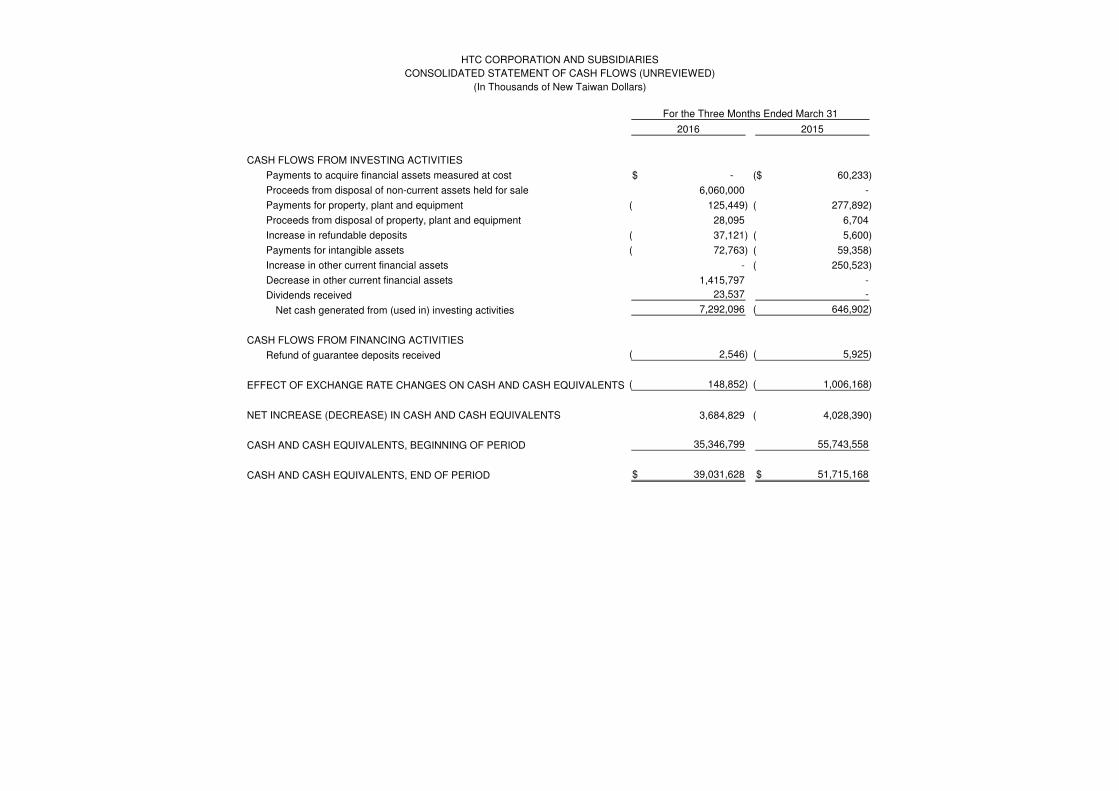
HTC CORPORATION AND SUBSIDIARIES
CONSOLIDATED STATEMENT OF CASH FLOWS (UNREVIEWED)
(In Thousands of New Taiwan Dollars)
For the Three Months Ended March 31
CASH FLOWS FROM INVESTING ACTIVITIES
Payments to acquire financial assets measured at cost -$ 60,233)($
Proceeds from disposal of non-current assets held for sale 6,060,000 -
Payments for property, plant and equipment 125,449)( 277,892)(
Proceeds from disposal of property, plant and equipment 28,095 6,704
Increase in refundable deposits 37,121)( 5,600)(
Payments for intangible assets 72,763)( 59,358)(
Increase in other current financial assets - 250,523)(
Decrease in other current financial assets 1,415,797 -
Dividends received 23,537 -
Net cash generated from (used in) investing activities 7,292,096 646,902)(
CASH FLOWS FROM FINANCING ACTIVITIES
Refund of guarantee deposits received 2,546)( 5,925)(
EFFECT OF EXCHANGE RATE CHANGES ON CASH AND CASH EQUIVALENTS 148,852)( 1,006,168)(
NET INCREASE (DECREASE) IN CASH AND CASH EQUIVALENTS 3,684,829 4,028,390)(
CASH AND CASH EQUIVALENTS, BEGINNING OF PERIOD 35,346,799 55,743,558
CASH AND CASH EQUIVALENTS, END OF PERIOD 39,031,628$ 51,715,168$