passion for taste & health - iis windows...
TRANSCRIPT
Company OverviewMarch 2017
Passion for Taste & Health
DISCLAIMER
This presentation includes statements data, forecasts, goals and Company plans that are "forward-looking statements“, as defined in theSecurities Law - 1968, whose occurrence is not certain and which are not solely in the Company's control. These forward-looking statementsare included, inter alia, in discussions of strategy, objectives, goals, plans, events, future intentions or other information relating to futureevents or issues whose occurrence is not certain.
By their nature, forward-looking statements involve risk and uncertainty. Whether the forward looking information occurs or not is affected,inter alia, by risk factors characteristic to the Company's operations and developments in the general environment and external factorswhich impact the Frutarom Group and its area of activities.
This forward looking information could include facts and data based on the Company's subjective assessment, including with regards to thecurrent status of the Company and its business, the current situation in the industry in which the Frutarom Group operates, macro-financialfacts and information, all as are known to the Company on the date on which this presentation was prepared, some of which were given tothe Company by external sources, the content of which was not independently examined by the Company, and therefore the Company is notresponsible for their verity.
This presentation must be read together with the Company's periodic and immediate reports, and was not meant to replace the need forstudy of reports the Company has published, including, inter alia, the Company's periodic report for 2016, published on March 2017, andthe Company's periodic and immediate reports subsequently published. These reports could include, inter alia, updates to the informationregarding the Company's activities or of the forward looking statements appearing in this presentation.
Subject to the requirements of applicable law, the Company does not intend to update any industry information or forward-lookingstatements appearing in this presentation, and is not required to publish any additional presentations for its shareholders in future.
It is to be emphasized that the financial estimations and the pro-forma figures included in this presentation are based on figures which werenot audited or reviewed by an auditor and therefore the actual results may differ from these financial estimations.
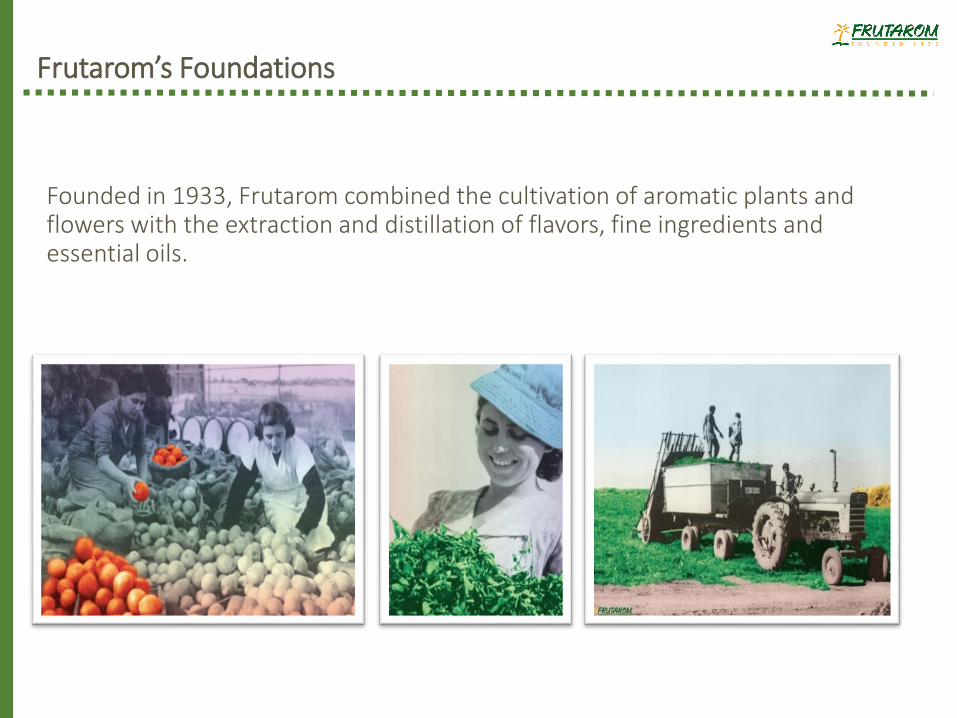
Frutarom’s Foundations
Founded in 1933, Frutarom combined the cultivation of aromatic plants and flowers with the extraction and distillation of flavors, fine ingredients and essential oils.
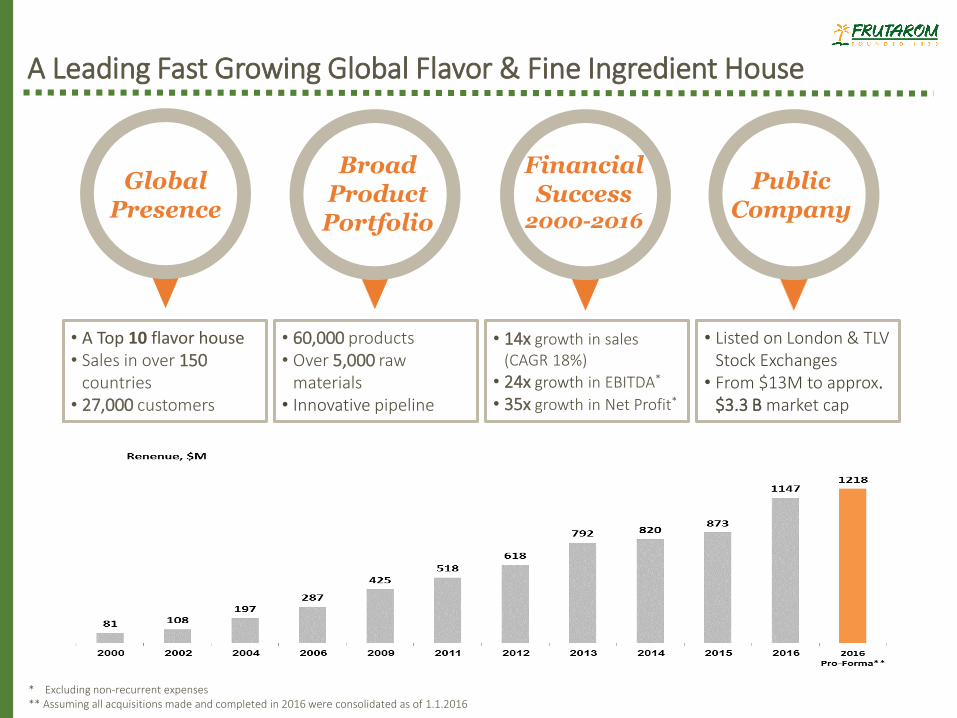
A Leading Fast Growing Global Flavor & Fine Ingredient House
Global Presence
Public Company
Financial Success
2000-2016
Broad Product Portfolio
• A Top 10 flavor house • Sales in over 150
countries• 27,000 customers
• 60,000 products• Over 5,000 raw
materials• Innovative pipeline
• Listed on London & TLV Stock Exchanges
• From $13M to approx. $3.3 B market cap
• 14x growth in sales (CAGR 18%)
• 24x growth in EBITDA*
• 35x growth in Net Profit*
* Excluding non-recurrent expenses** Assuming all acquisitions made and completed in 2016 were consolidated as of 1.1.2016
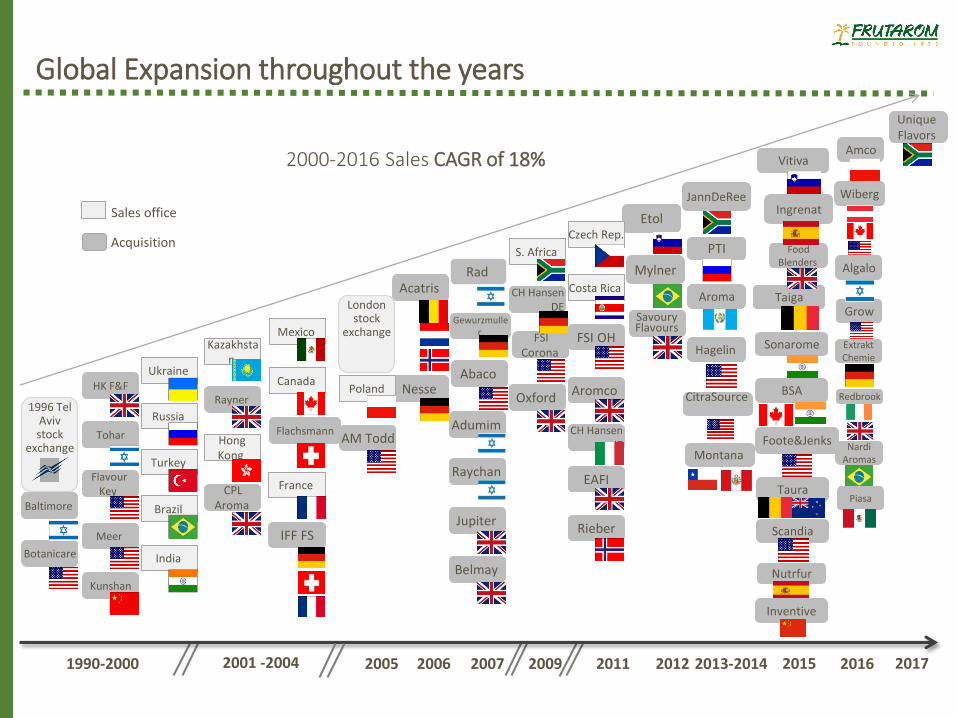
Global Expansion throughout the years
2000-2016 Sales CAGR of 18%Amco
Wiberg
2016
Sales office
Acquisition
2006 2007 2009 20121990-2000 20112001 -2004 2013-20142005
1996 Tel Aviv stock
exchange
IFF FS
Adumim
Raychan
Rieber
EAFI
SavouryFlavours
Oxford
Belmay
Jupiter
FSI Corona
Nesse
CH Hansen DE
CH Hansen IT
Etol
Mylner
Aromco
FSI OH
Acatris
FlachsmannTohar
Meer
RaynerHK F&F
CPL Aroma
FlavourKey
Baltimore
Botanicare
Kunshan
AM Todd
Russia
Canada
Turkey
France
Mexico
Ukraine
Poland
Kazakhstan
Hong Kong
Costa Rica
Czech Rep.
S. Africa
India
Brazil
Gewurzmuller
Abaco
Rad
London stock
exchange
JannDeRee
PTI
Aroma
Hagelin
CitraSource
Montana
2015
Ingrenat
Food Blenders
Sonarome
BSA
Taiga
Foote&Jenks
Scandia
Vitiva
Nutrfur
Inventive
Taura
Grow
Algalo
ExtraktChemie
Redbrook
NardiAromas
Piasa
2017
Unique Flavors
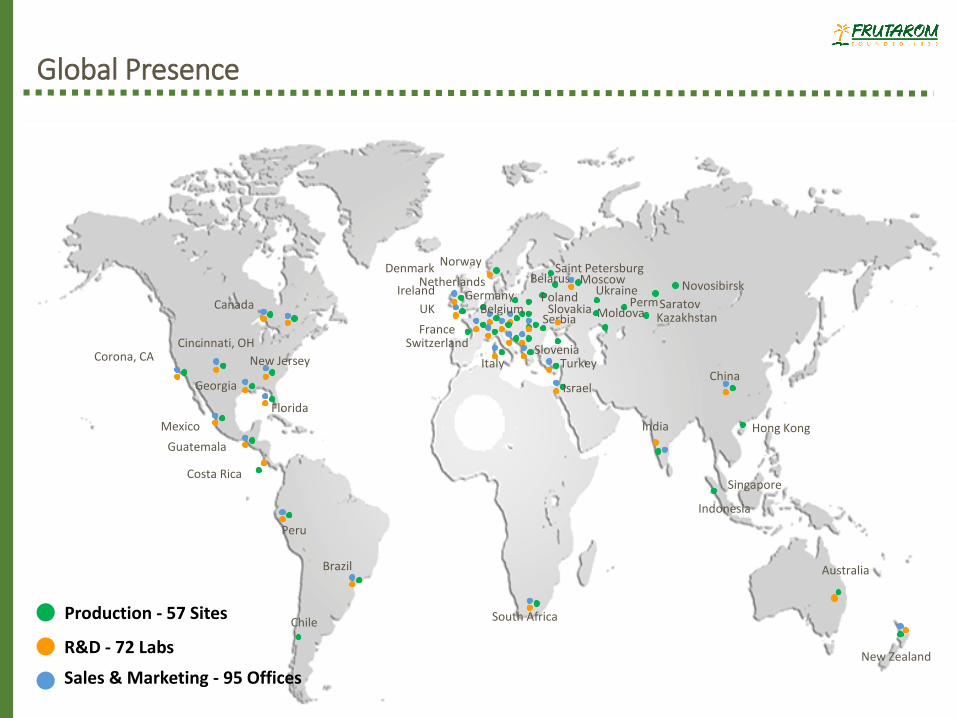
Sales & Marketing - 95 Offices
Production - 57 Sites
R&D - 72 Labs
Global Presence
Belgium
Brazil
China
Denmark
France
Germany
India
Indonesia
Israel
Italy
Kazakhstan
Mexico
Netherlands
Norway
Poland
Serbia
Singapore
Slovakia
Slovenia
South Africa
Turkey
Ukraine
UK
Ireland
Corona, CA New Jersey
Cincinnati, OH Switzerland
Moscow Saint Petersburg
Perm Saratov
Hong Kong
Costa Rica
Georgia
Guatemala
NovosibirskBelarus
Moldova
Florida
Peru
Chile
Australia
New Zealand
Canada
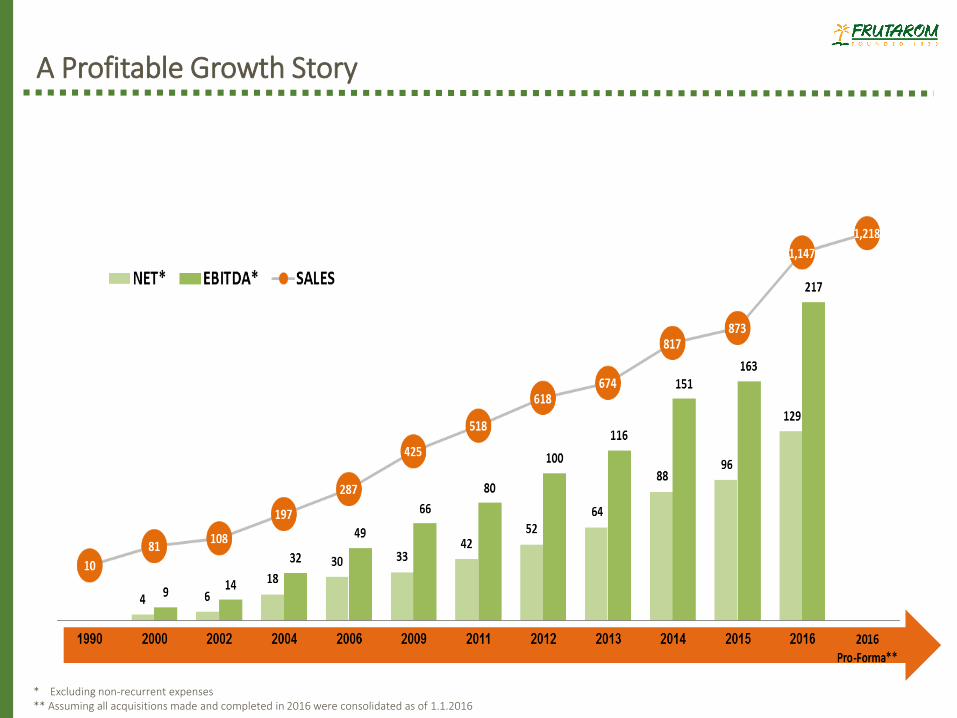
A Profitable Growth Story
* Excluding non-recurrent expenses** Assuming all acquisitions made and completed in 2016 were consolidated as of 1.1.2016
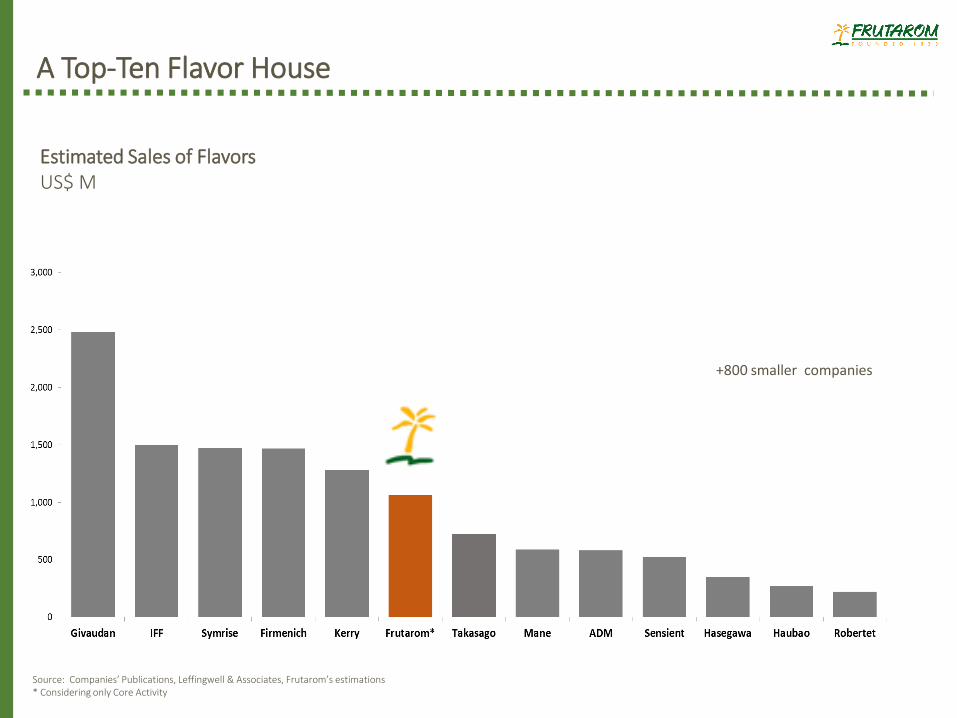
Estimated Sales of FlavorsUS$ M
A Top-Ten Flavor House
Source: Companies’ Publications, Leffingwell & Associates, Frutarom’s estimations * Considering only Core Activity
+800 smaller companies
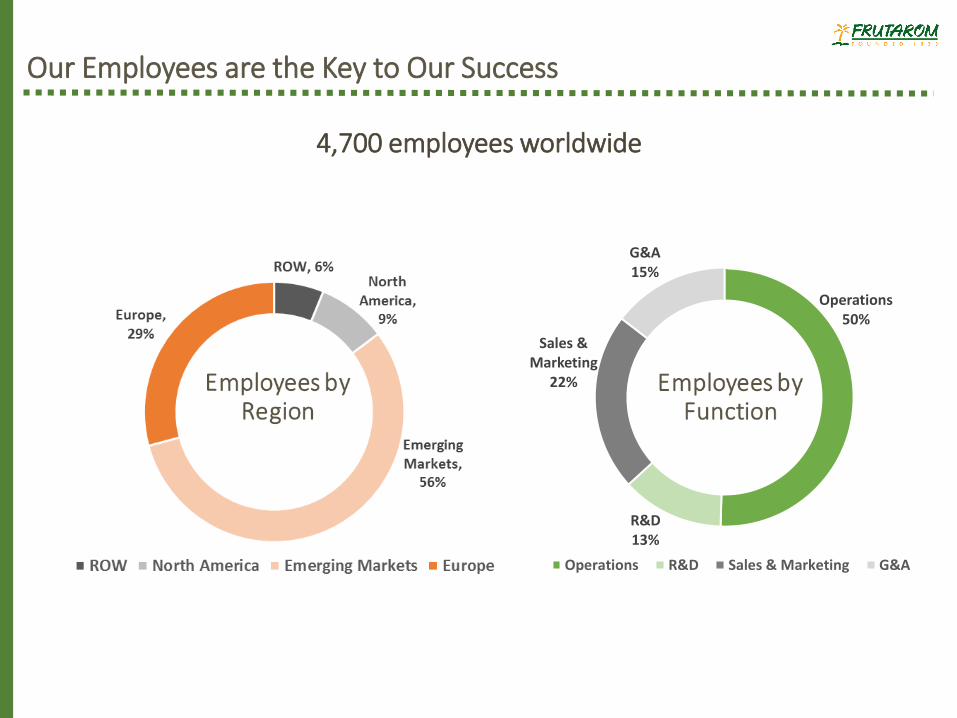
Operations50%
R&D13%
Sales & Marketing
22%
G&A15%
Operations R&D Sales & Marketing G&A
Our Employees are the Key to Our Success
4,700 employees worldwide
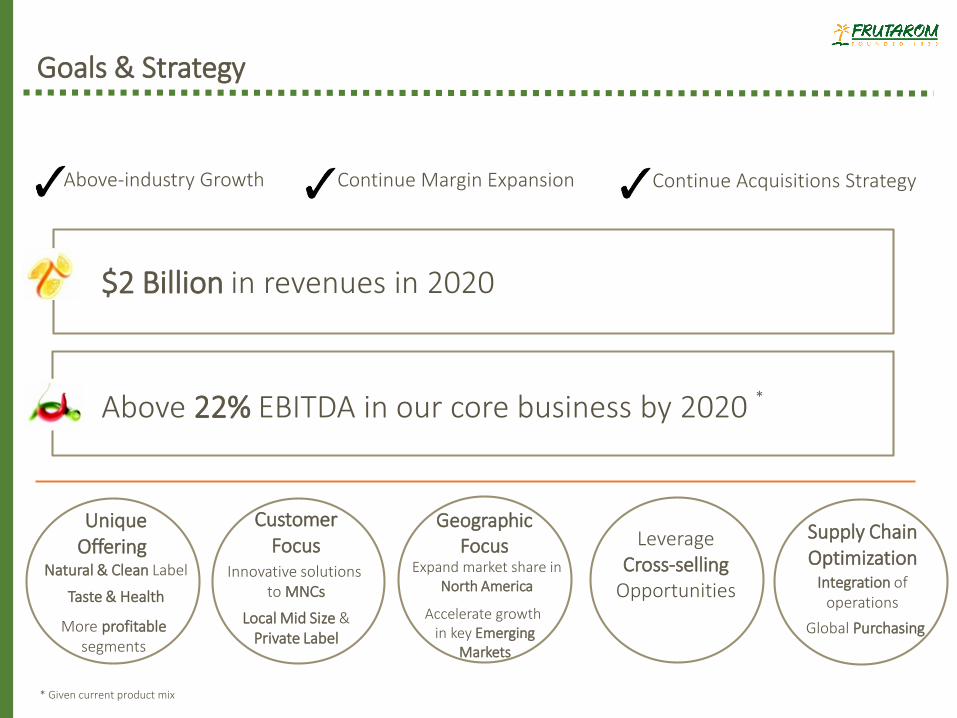
Goals & Strategy
Continue Margin Expansion Above-industry Growth
$2 Billion in revenues in 2020
Above 22% EBITDA in our core business by 2020
Geographic Focus
Accelerate growth in key Emerging
Markets
Customer Focus
Local Mid Size & Private Label
Innovative solutions to MNCs
Leverage Cross-selling
Opportunities
Continue Acquisitions Strategy
*
* Given current product mix
Unique Offering
Natural & Clean Label
Taste & Health
More profitablesegments
Supply Chain Optimization
Integration ofoperations
Global Purchasing
Expand market share in North America
Frutarom’s Unique Offering
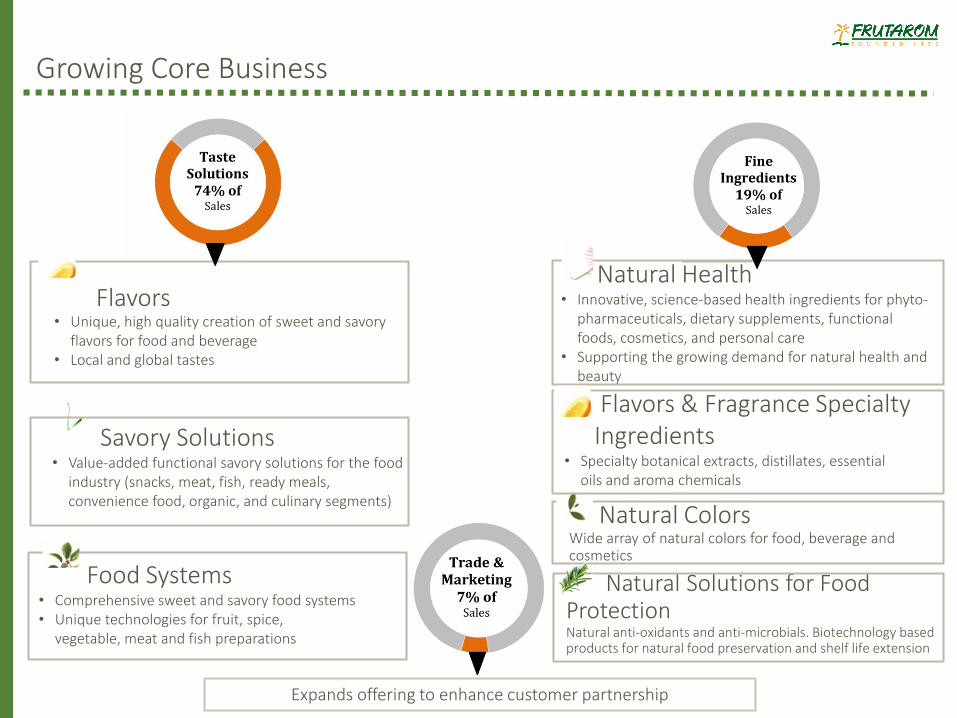
Expands offering to enhance customer partnership
Growing Core Business
Flavors• Unique, high quality creation of sweet and savory
flavors for food and beverage• Local and global tastes
Food Systems• Comprehensive sweet and savory food systems• Unique technologies for fruit, spice,
vegetable, meat and fish preparations
Savory Solutions• Value-added functional savory solutions for the food
industry (snacks, meat, fish, ready meals, convenience food, organic, and culinary segments)
Natural ColorsWide array of natural colors for food, beverage and cosmetics
Flavors & Fragrance Specialty Ingredients
• Specialty botanical extracts, distillates, essential oils and aroma chemicals
Natural Health • Innovative, science-based health ingredients for phyto-
pharmaceuticals, dietary supplements, functional foods, cosmetics, and personal care
• Supporting the growing demand for natural health and beauty
Natural Solutions for Food ProtectionNatural anti-oxidants and anti-microbials. Biotechnology based products for natural food preservation and shelf life extension
Sharing the
Passion for Taste & Health
We develop tailored solutions combining excellent tastewith health and functionality all under one roof
Taste Solutions
Fine Ingredients
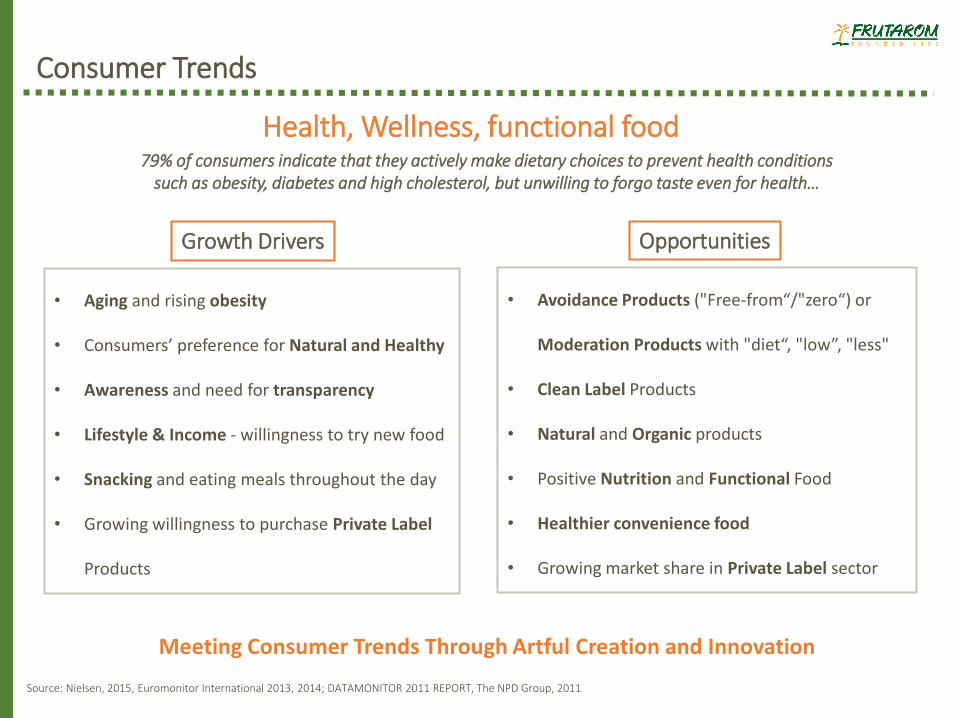
• Avoidance Products ("Free-from“/"zero“) or
Moderation Products with "diet“, "low”, "less"
• Clean Label Products
• Natural and Organic products
• Positive Nutrition and Functional Food
• Healthier convenience food
• Growing market share in Private Label sector
Source: Nielsen, 2015, Euromonitor International 2013, 2014; DATAMONITOR 2011 REPORT, The NPD Group, 2011
Consumer Trends
Health, Wellness, functional food 79% of consumers indicate that they actively make dietary choices to prevent health conditions
such as obesity, diabetes and high cholesterol, but unwilling to forgo taste even for health…
• Aging and rising obesity
• Consumers’ preference for Natural and Healthy
• Awareness and need for transparency
• Lifestyle & Income - willingness to try new food
• Snacking and eating meals throughout the day
• Growing willingness to purchase Private Label
Products
Meeting Consumer Trends Through Artful Creation and Innovation
Growth Drivers Opportunities
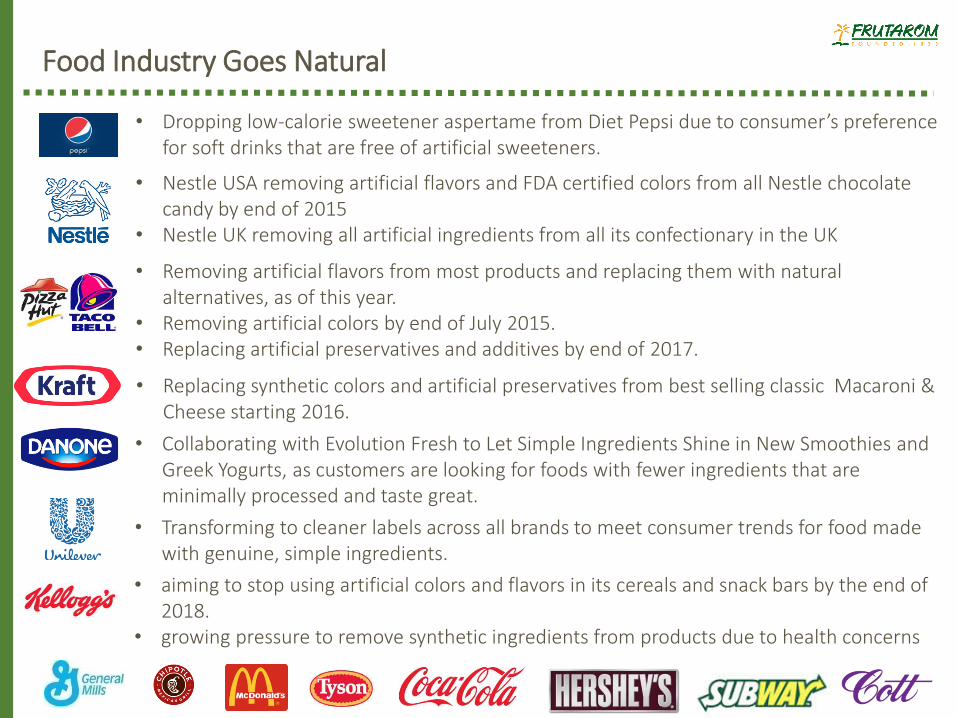
Food Industry Goes Natural
• Dropping low-calorie sweetener aspertame from Diet Pepsi due to consumer’s preference for soft drinks that are free of artificial sweeteners.
• Nestle USA removing artificial flavors and FDA certified colors from all Nestle chocolate candy by end of 2015
• Nestle UK removing all artificial ingredients from all its confectionary in the UK
• Removing artificial flavors from most products and replacing them with natural alternatives, as of this year.
• Removing artificial colors by end of July 2015.• Replacing artificial preservatives and additives by end of 2017.
• Replacing synthetic colors and artificial preservatives from best selling classic Macaroni & Cheese starting 2016.
• Collaborating with Evolution Fresh to Let Simple Ingredients Shine in New Smoothies and Greek Yogurts, as customers are looking for foods with fewer ingredients that are minimally processed and taste great.
• Transforming to cleaner labels across all brands to meet consumer trends for food made with genuine, simple ingredients.
• aiming to stop using artificial colors and flavors in its cereals and snack bars by the end of 2018.
• growing pressure to remove synthetic ingredients from products due to health concerns
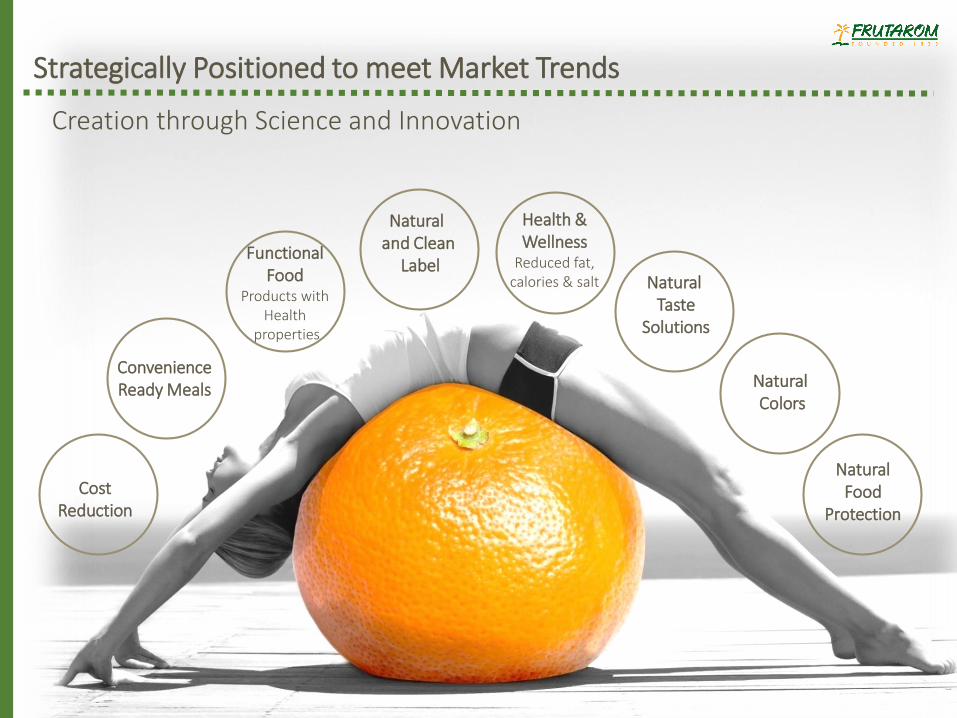
Strategically Positioned to meet Market Trends
Cost Reduction
Creation through Science and Innovation
Convenience Ready Meals
Natural Taste
Solutions
Natural and Clean
LabelFunctional
FoodProducts with
Healthproperties
Health & Wellness
Reduced fat, calories & salt
NaturalFood
Protection
NaturalColors
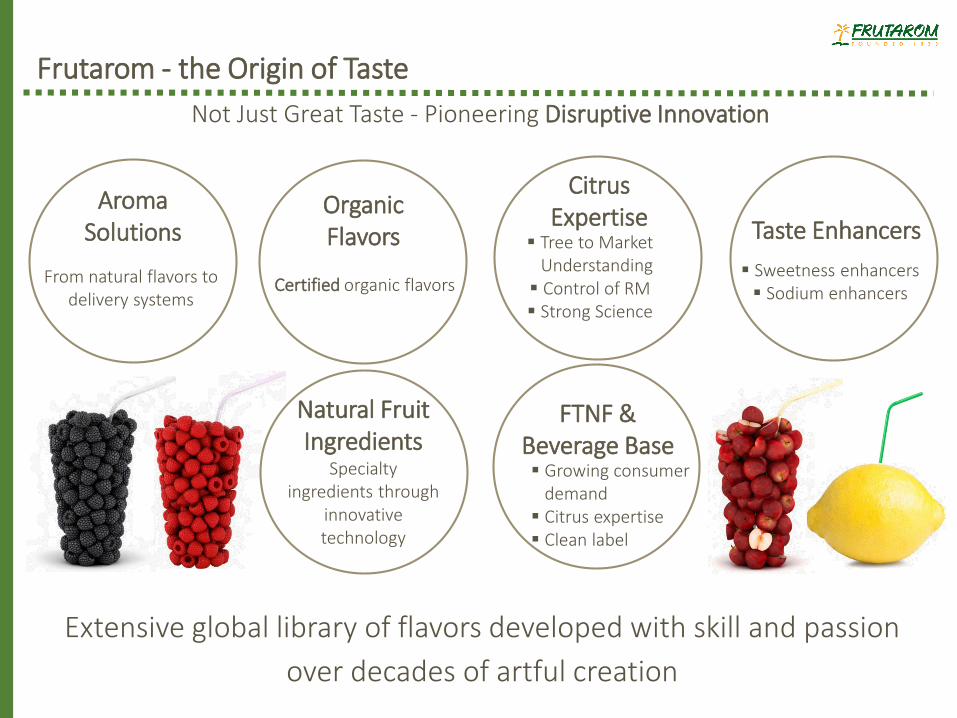
Frutarom - the Origin of Taste
Extensive global library of flavors developed with skill and passion
over decades of artful creation
Not Just Great Taste - Pioneering Disruptive Innovation
Organic Flavors
AromaSolutions
From natural flavors to delivery systems
CitrusExpertise
Tree to Market Understanding Control of RM Strong Science
Certified organic flavors
FTNF & Beverage Base Growing consumer
demand Citrus expertise Clean label
Taste Enhancers
Sweetness enhancers Sodium enhancers
Natural Fruit Ingredients
Specialty ingredients through
innovative technology
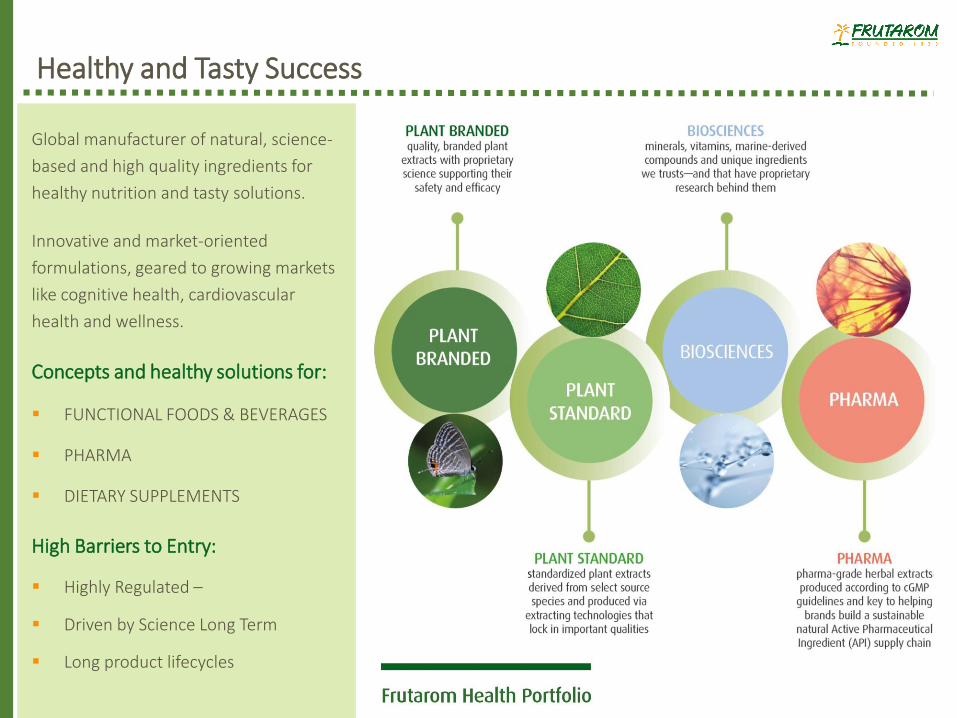
Healthy and Tasty Success
Global manufacturer of natural, science-
based and high quality ingredients for
healthy nutrition and tasty solutions.
Innovative and market-oriented
formulations, geared to growing markets
like cognitive health, cardiovascular
health and wellness.
Concepts and healthy solutions for:
FUNCTIONAL FOODS & BEVERAGES
PHARMA
DIETARY SUPPLEMENTS
High Barriers to Entry:
Highly Regulated –
Driven by Science Long Term
Long product lifecycles
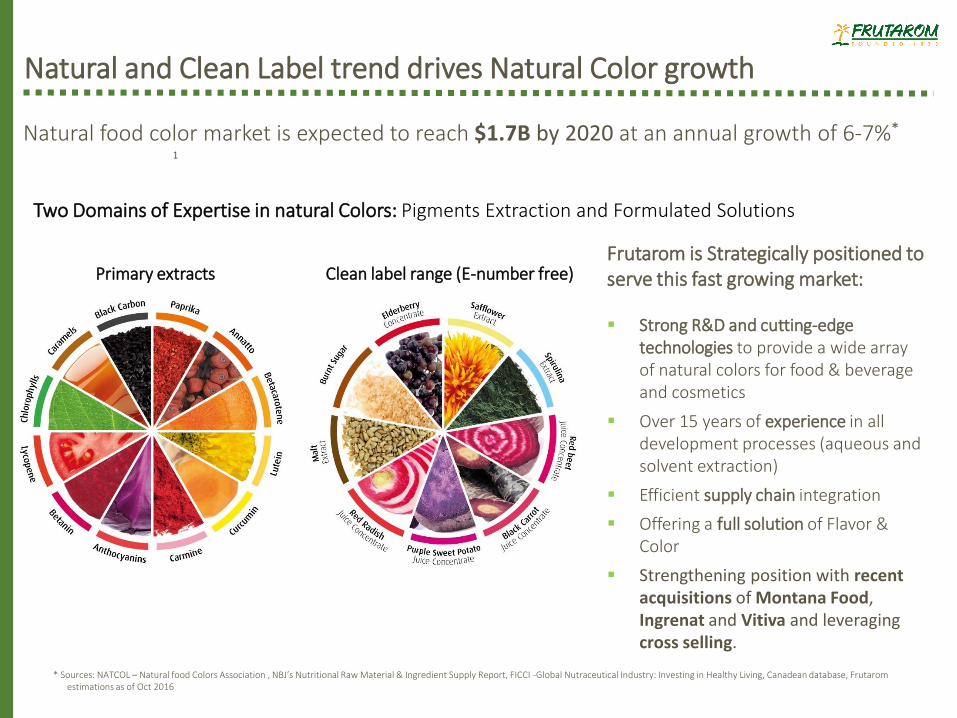
Natural and Clean Label trend drives Natural Color growth
Natural food color market is expected to reach $1.7B by 2020 at an annual growth of 6-7%*
1
Two Domains of Expertise in natural Colors: Pigments Extraction and Formulated Solutions
Clean label range (E-number free)Primary extractsFrutarom is Strategically positioned to serve this fast growing market:
Strong R&D and cutting-edge technologies to provide a wide array of natural colors for food & beverage and cosmetics
Over 15 years of experience in all development processes (aqueous and solvent extraction)
Efficient supply chain integration
Offering a full solution of Flavor & Color
Strengthening position with recent acquisitions of Montana Food, Ingrenat and Vitiva and leveraging cross selling.
* Sources: NATCOL – Natural food Colors Association , NBJ’s Nutritional Raw Material & Ingredient Supply Report, FICCI -Global Nutraceutical Industry: Investing in Healthy Living, Canadean database, Frutarom estimations as of Oct 2016
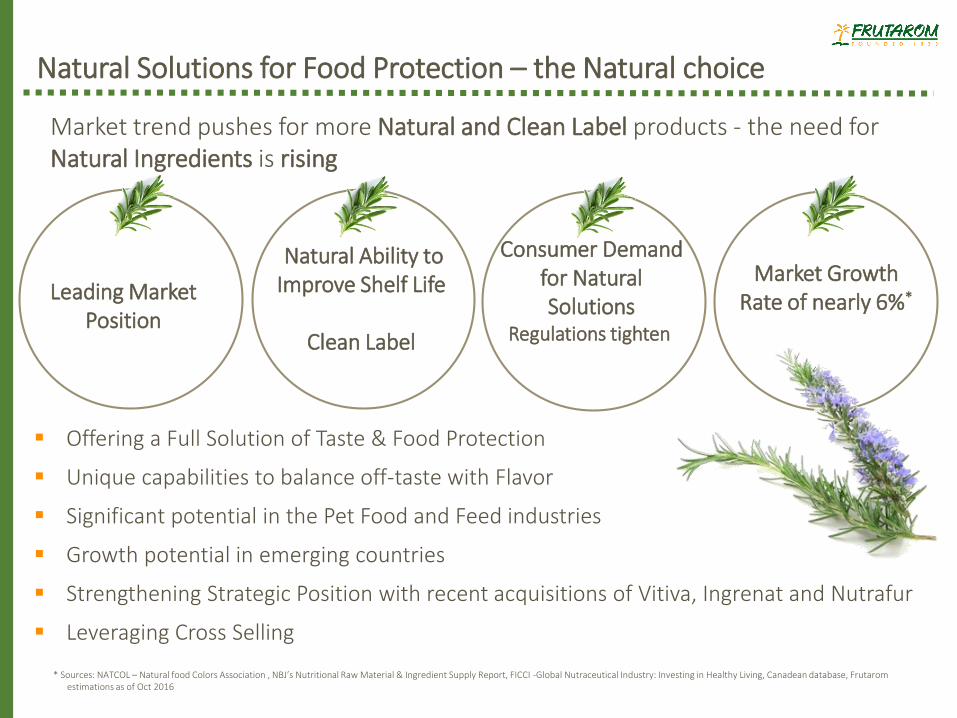
Natural Solutions for Food Protection – the Natural choice
Market Growth Rate of nearly 6%*
Consumer Demand for Natural Solutions
Regulations tighten
Leading Market Position
Market trend pushes for more Natural and Clean Label products - the need for Natural Ingredients is rising
Natural Ability to Improve Shelf Life
Clean Label
Offering a Full Solution of Taste & Food Protection
Unique capabilities to balance off-taste with Flavor
Significant potential in the Pet Food and Feed industries
Growth potential in emerging countries
Strengthening Strategic Position with recent acquisitions of Vitiva, Ingrenat and Nutrafur
Leveraging Cross Selling
* Sources: NATCOL – Natural food Colors Association , NBJ’s Nutritional Raw Material & Ingredient Supply Report, FICCI -Global Nutraceutical Industry: Investing in Healthy Living, Canadean database, Frutarom estimations as of Oct 2016
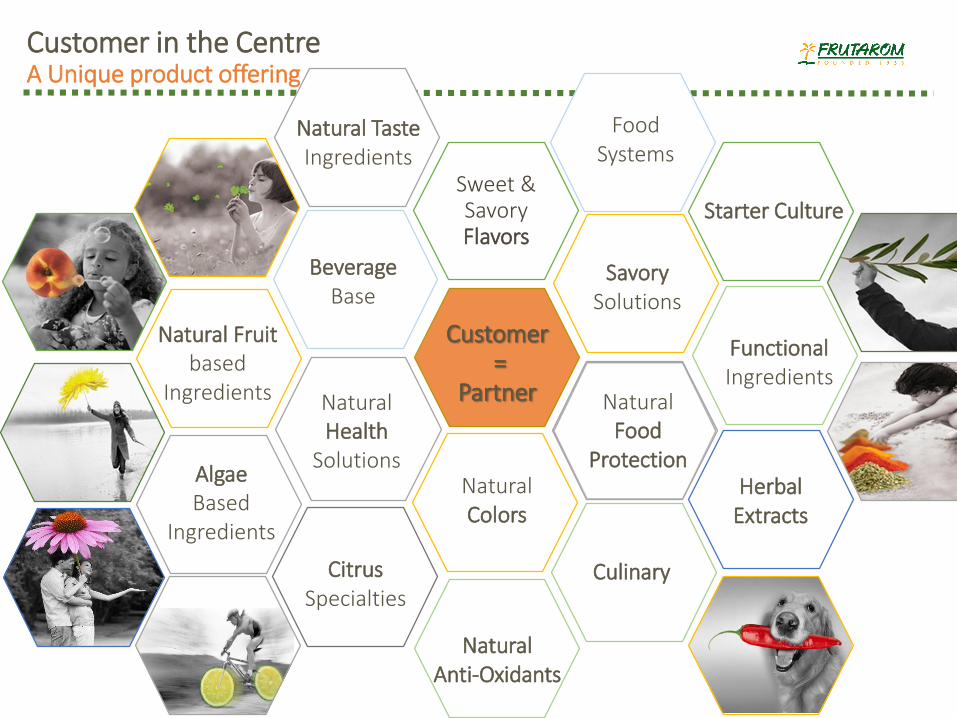
Customer=
Partner
Sweet &Savory Flavors
SavorySolutions
Natural Food
ProtectionNatural Colors
BeverageBase
Starter Culture
Natural Health
Solutions
Natural Fruitbased
Ingredients
Food Systems
Natural Taste Ingredients
AlgaeBased
Ingredients
Herbal Extracts
Citrus Specialties
Natural Anti-Oxidants
Culinary
Functional Ingredients
Customer in the CentreA Unique product offering

Frutarom’s Customer Focus

Growing Mid-Sized Food & Beverage Market
(% of Market Share)
The Global Food Market
*Source: Jan, 2016 Datamonitor, Euromonitor and Frutarom’s estimations
Service Expectations
New Mid-size & Local Companies Emerging• Growing Private Label Sector• Developing Markets
Fragmented market
Marketsize
$4,595B*
Small & Local(<$1B)
60%
Large(>$10B)
20%
($3B-$10B)11%
($1B-$3B)9%
* Source: Oct, 2016 Laffingwell & Associates, Datamonitor, Euromonitor and Frutarom’s estimations
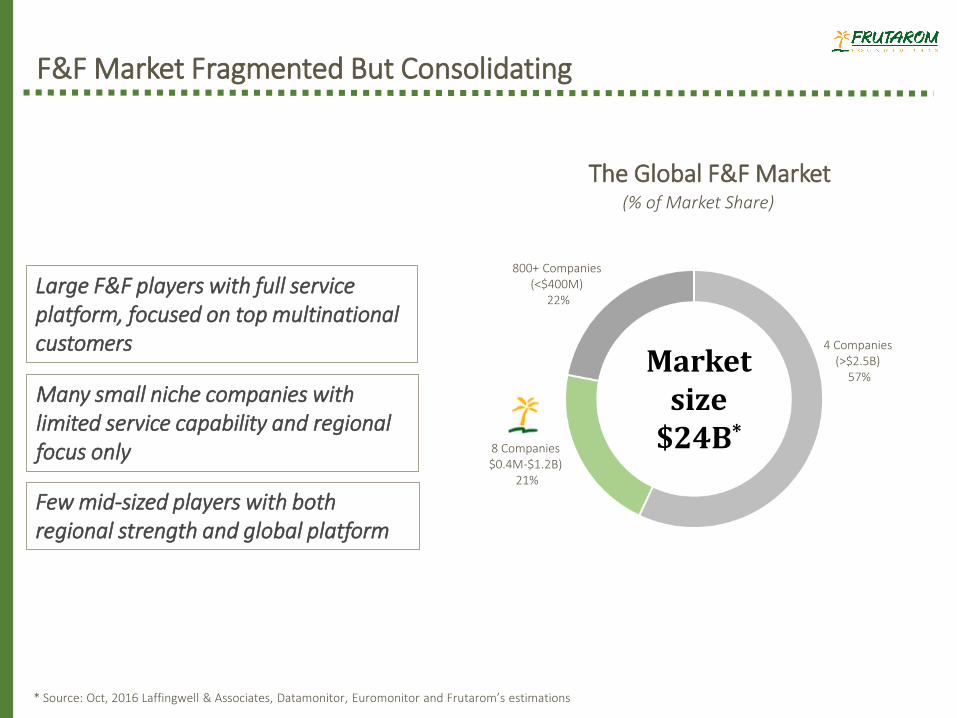
F&F Market Fragmented But Consolidating
The Global F&F Market
Large F&F players with full service platform, focused on top multinational customers
Many small niche companies with limited service capability and regional focus only
Few mid-sized players with both regional strength and global platform
(% of Market Share)
Marketsize
$24B*8 Companies $0.4M-$1.2B)
21%
800+ Companies(<$400M)
22%
4 Companies (>$2.5B)
57%
* Sources: NATCOL – Natural food Colors Association , NBJ’s Nutritional Raw Material & Ingredient Supply Report, FICCI -Global Nutraceutical Industry: Investing in Healthy Living, Canadean database, Frutarom estimations as of Oct 2016
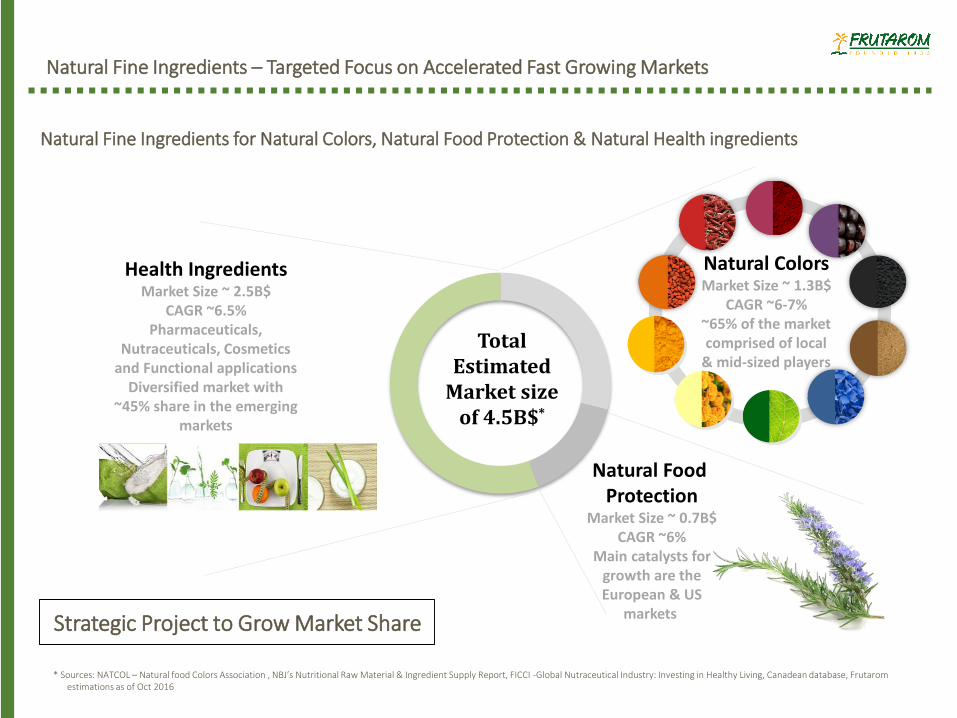
Natural Fine Ingredients – Targeted Focus on Accelerated Fast Growing Markets
Natural Fine Ingredients for Natural Colors, Natural Food Protection & Natural Health ingredients
Total Estimated
Market size of 4.5B$*
Natural ColorsMarket Size ~ 1.3B$
CAGR ~6-7%~65% of the market comprised of local
& mid-sized players
Health IngredientsMarket Size ~ 2.5B$
CAGR ~6.5%Pharmaceuticals,
Nutraceuticals, Cosmetics and Functional applications
Diversified market with ~45% share in the emerging
markets
Natural Food Protection
Market Size ~ 0.7B$CAGR ~6%
Main catalysts for growth are the European & US
markets Strategic Project to Grow Market Share
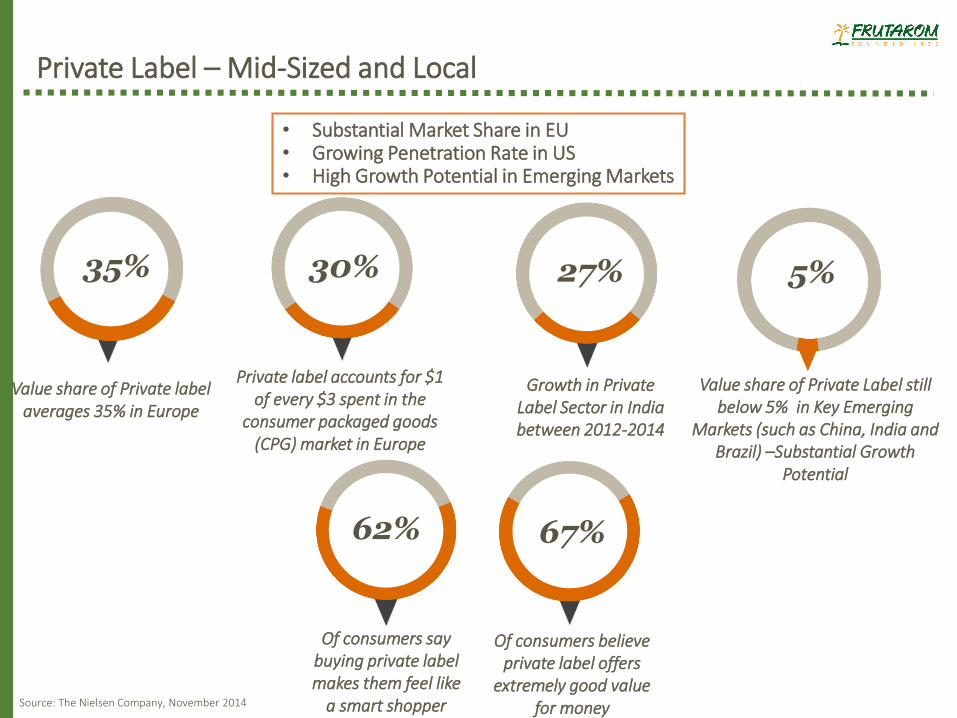
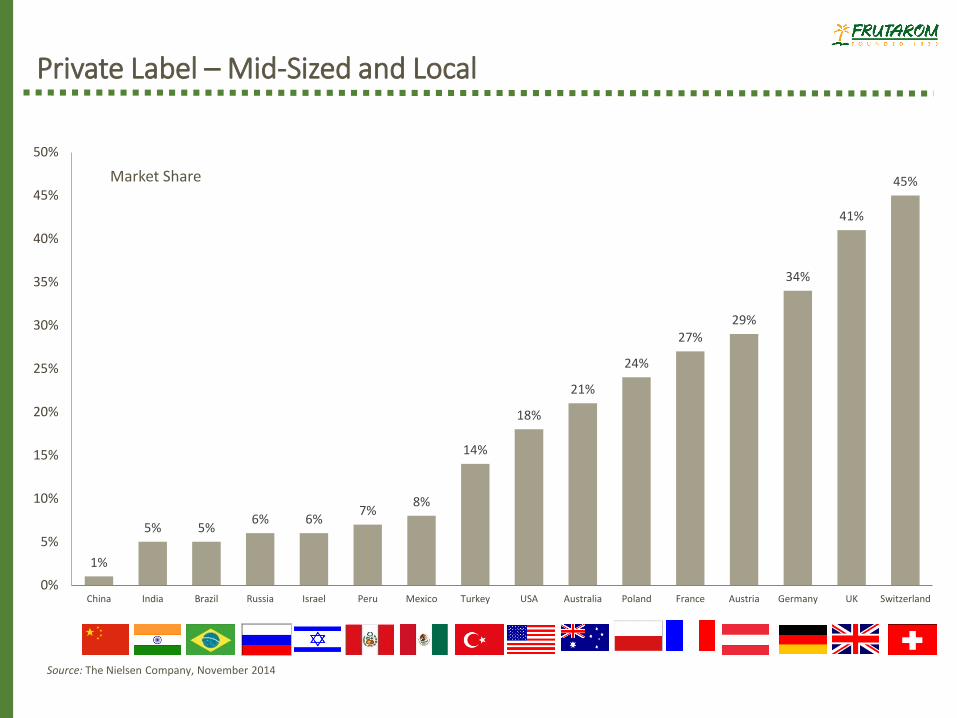
Private Label – Mid-Sized and Local
Source: The Nielsen Company, November 2014
Growth in Private Label Sector in India between 2012-2014
Private label accounts for $1 of every $3 spent in the
consumer packaged goods (CPG) market in Europe
Of consumers believe private label offers
extremely good value for money
27%30%
67%62%
Of consumers say buying private label makes them feel like
a smart shopper
5%
Value share of Private Label still below 5% in Key Emerging
Markets (such as China, India and Brazil) –Substantial Growth
Potential
35%
Value share of Private label averages 35% in Europe
• Substantial Market Share in EU• Growing Penetration Rate in US• High Growth Potential in Emerging Markets
Private Label – Mid-Sized and Local
Source: The Nielsen Company, November 2014
Market Share
1%
5% 5%6% 6%
7%8%
14%
18%
21%
24%
27%29%
34%
41%
45%
0%
5%
10%
15%
20%
25%
30%
35%
40%
45%
50%
China India Brazil Russia Israel Peru Mexico Turkey USA Australia Poland France Austria Germany UK Switzerland

Frutarom’s Geographic Focus
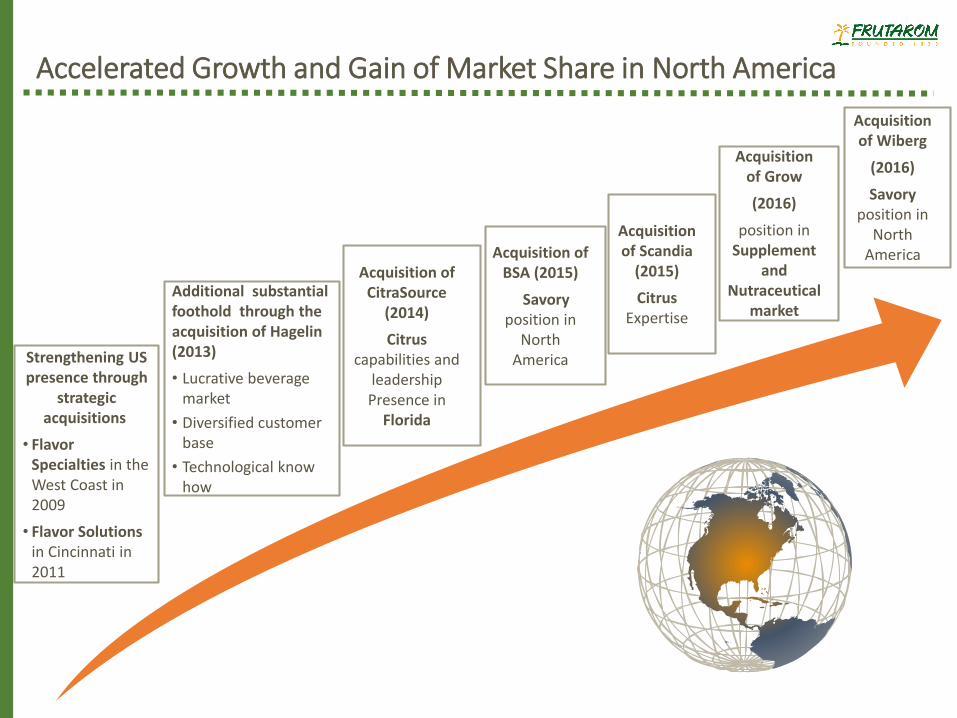
Accelerated Growth and Gain of Market Share in North America
Strengthening US presence through
strategic acquisitions
• Flavor Specialties in the West Coast in 2009
• Flavor Solutionsin Cincinnati in 2011
Acquisition of CitraSource
(2014)
Citrus capabilities and
leadershipPresence in
Florida
Acquisition of BSA (2015)
Savoryposition in
North America
Acquisition of Scandia
(2015)
CitrusExpertise
Acquisition of Grow
(2016)
position in Supplement
and Nutraceutical
market
Acquisition of Wiberg
(2016)
Savoryposition in
North America
Additional substantial foothold through the acquisition of Hagelin (2013)
• Lucrative beverage market
• Diversified customer base
• Technological know how
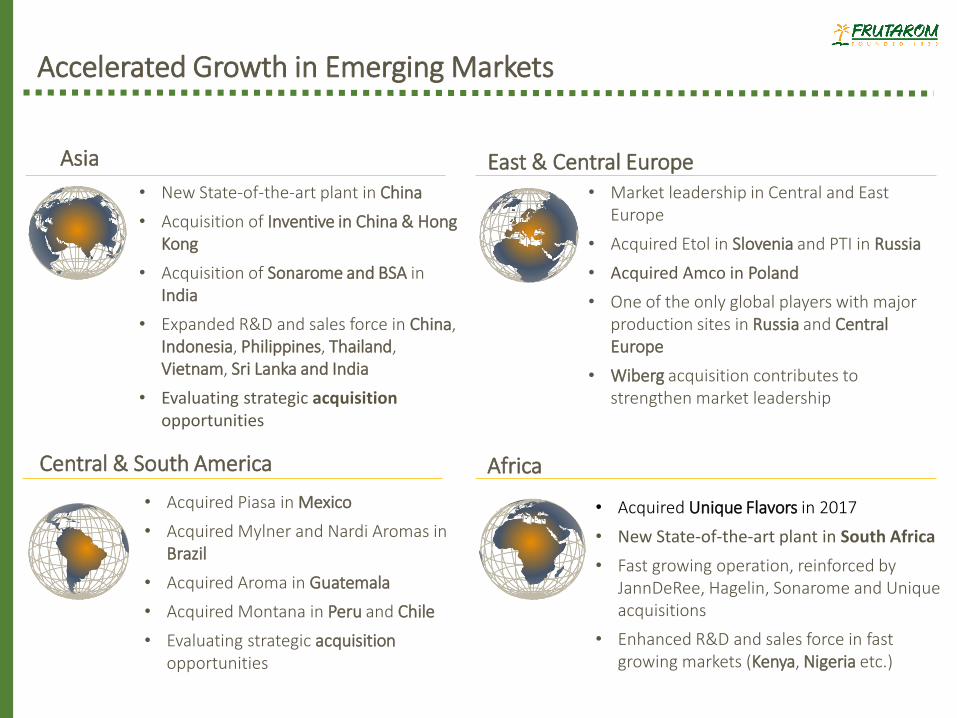
Accelerated Growth in Emerging Markets
• New State-of-the-art plant in China
• Acquisition of Inventive in China & Hong Kong
• Acquisition of Sonarome and BSA inIndia
• Expanded R&D and sales force in China, Indonesia, Philippines, Thailand, Vietnam, Sri Lanka and India
• Evaluating strategic acquisitionopportunities
Asia
Central & South America Africa
• Acquired Unique Flavors in 2017
• New State-of-the-art plant in South Africa
• Fast growing operation, reinforced by JannDeRee, Hagelin, Sonarome and Unique acquisitions
• Enhanced R&D and sales force in fast growing markets (Kenya, Nigeria etc.)
East & Central Europe
• Acquired Piasa in Mexico
• Acquired Mylner and Nardi Aromas in Brazil
• Acquired Aroma in Guatemala
• Acquired Montana in Peru and Chile
• Evaluating strategic acquisitionopportunities
• Market leadership in Central and East Europe
• Acquired Etol in Slovenia and PTI in Russia
• Acquired Amco in Poland
• One of the only global players with major production sites in Russia and Central Europe
• Wiberg acquisition contributes to strengthen market leadership
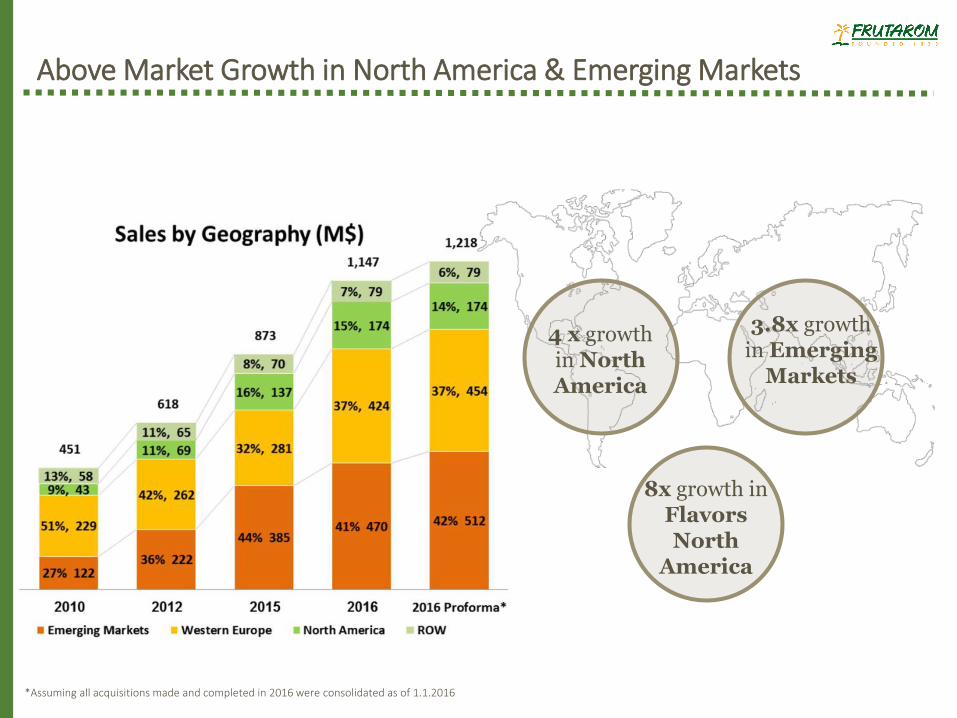
Above Market Growth in North America & Emerging Markets
3.8x growth in Emerging
Markets
4 x growth in North America
8x growth in FlavorsNorth
America
*Assuming all acquisitions made and completed in 2016 were consolidated as of 1.1.2016

Frutarom’s Growth Strategy
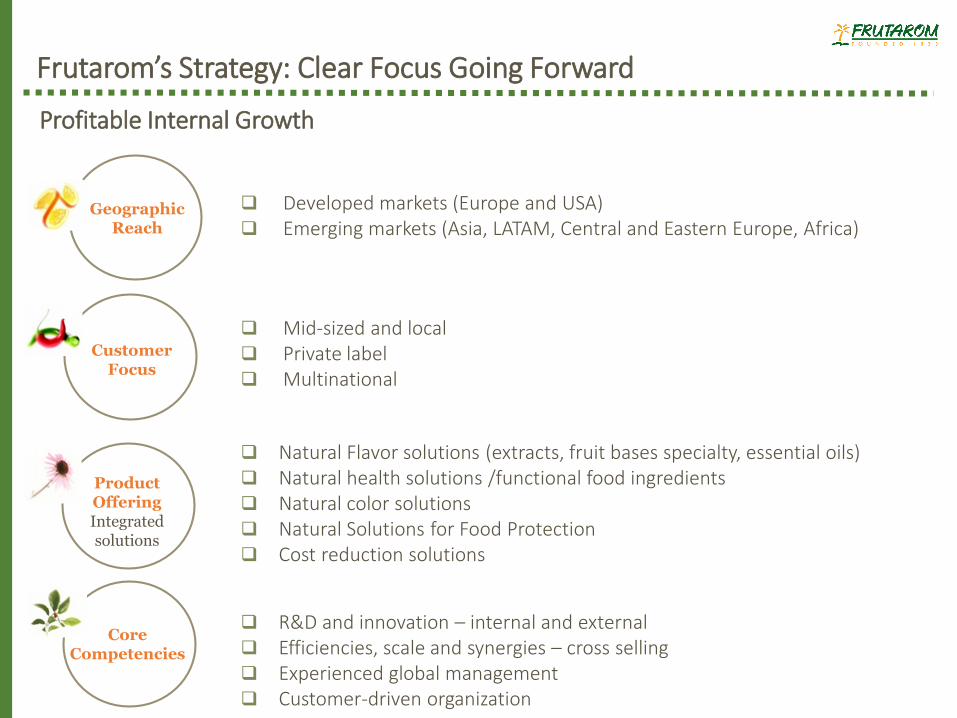
Frutarom’s Strategy: Clear Focus Going Forward
Mid-sized and local Private label Multinational
Developed markets (Europe and USA) Emerging markets (Asia, LATAM, Central and Eastern Europe, Africa)
Natural Flavor solutions (extracts, fruit bases specialty, essential oils) Natural health solutions /functional food ingredients Natural color solutions Natural Solutions for Food Protection Cost reduction solutions
R&D and innovation – internal and external Efficiencies, scale and synergies – cross selling Experienced global management Customer-driven organization
CustomerFocus
GeographicReach
Product OfferingIntegrated solutions
Core Competencies
Profitable Internal Growth
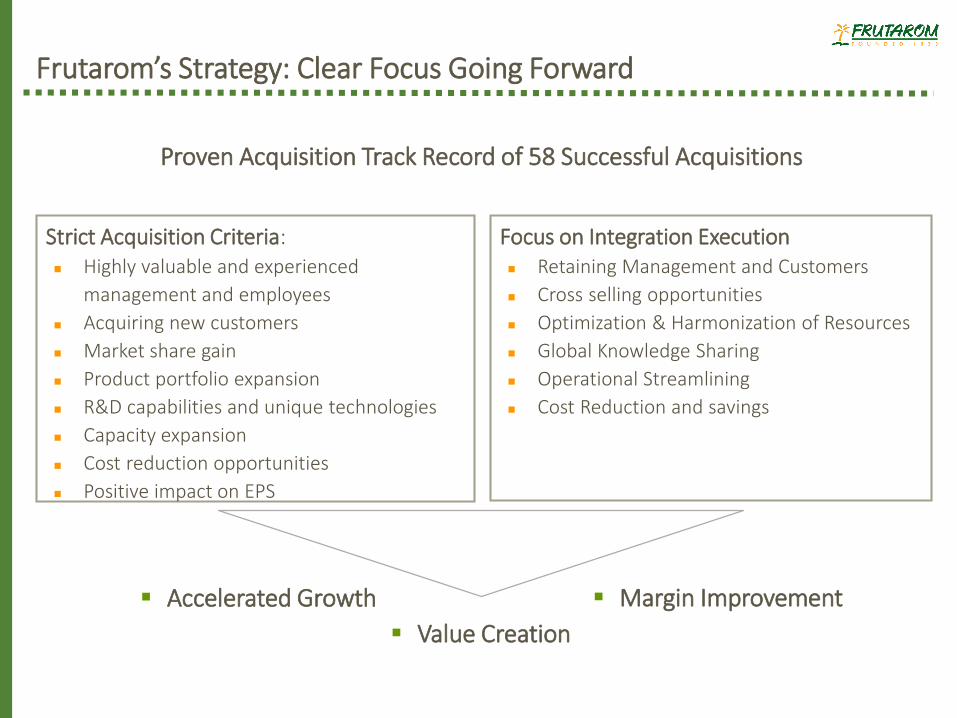
Strict Acquisition Criteria: Highly valuable and experienced
management and employees
Acquiring new customers
Market share gain
Product portfolio expansion
R&D capabilities and unique technologies
Capacity expansion
Cost reduction opportunities
Positive impact on EPS
Frutarom’s Strategy: Clear Focus Going Forward
Focus on Integration Execution Retaining Management and Customers
Cross selling opportunities
Optimization & Harmonization of Resources
Global Knowledge Sharing
Operational Streamlining
Cost Reduction and savings
Proven Acquisition Track Record of 58 Successful Acquisitions
Margin Improvement Accelerated Growth
Value Creation
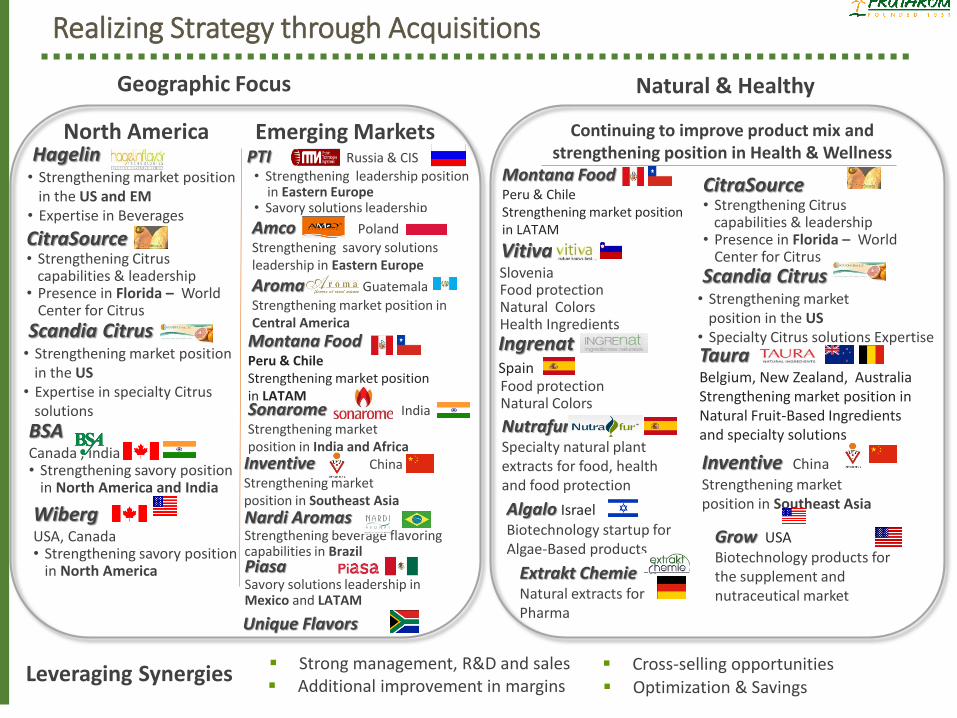
Realizing Strategy through Acquisitions
Additional improvement in margins Strong management, R&D and sales Cross-selling opportunitiesLeveraging Synergies
Optimization & Savings
Geographic Focus
Food protection Natural ColorsHealth Ingredients
TauraBelgium, New Zealand, AustraliaStrengthening market position in Natural Fruit-Based Ingredients and specialty solutions
Scandia Citrus• Strengthening market
position in the US• Specialty Citrus solutions Expertise
CitraSource• Strengthening Citrus
capabilities & leadership• Presence in Florida – World
Center for Citrus
Inventive China
Strengthening market position in Southeast AsiaAlgalo Israel
Biotechnology startup for Algae-Based products
Grow USA
Biotechnology products for the supplement and nutraceutical market
Natural & Healthy
North America Emerging MarketsHagelin• Strengthening market position
in the US and EM• Expertise in Beverages
CitraSource• Strengthening Citrus
capabilities & leadership• Presence in Florida – World
Center for Citrus
BSA Canada , India• Strengthening savory position
in North America and India
Scandia Citrus• Strengthening market position
in the US• Expertise in specialty Citrus
solutions
WibergUSA, Canada• Strengthening savory position
in North America
PTI Russia & CIS• Strengthening leadership position
in Eastern Europe • Savory solutions leadership
Amco Poland
Strengthening savory solutions leadership in Eastern Europe
Sonarome India
Strengthening market position in India and AfricaInventive China
Strengthening market position in Southeast AsiaNardi AromasStrengthening beverage flavoring capabilities in Brazil
Aroma Guatemala
Strengthening market position inCentral America
VitivaSlovenia
Montana FoodPeru & ChileStrengthening market position in LATAM
Montana FoodPeru & ChileStrengthening market position in LATAM
Continuing to improve product mix and strengthening position in Health & Wellness
IngrenatSpainFood protection Natural Colors
NutrafurSpecialty natural plant extracts for food, health and food protection
Extrakt ChemieNatural extracts for Pharma
PiasaSavory solutions leadership in Mexico and LATAM
Unique Flavors
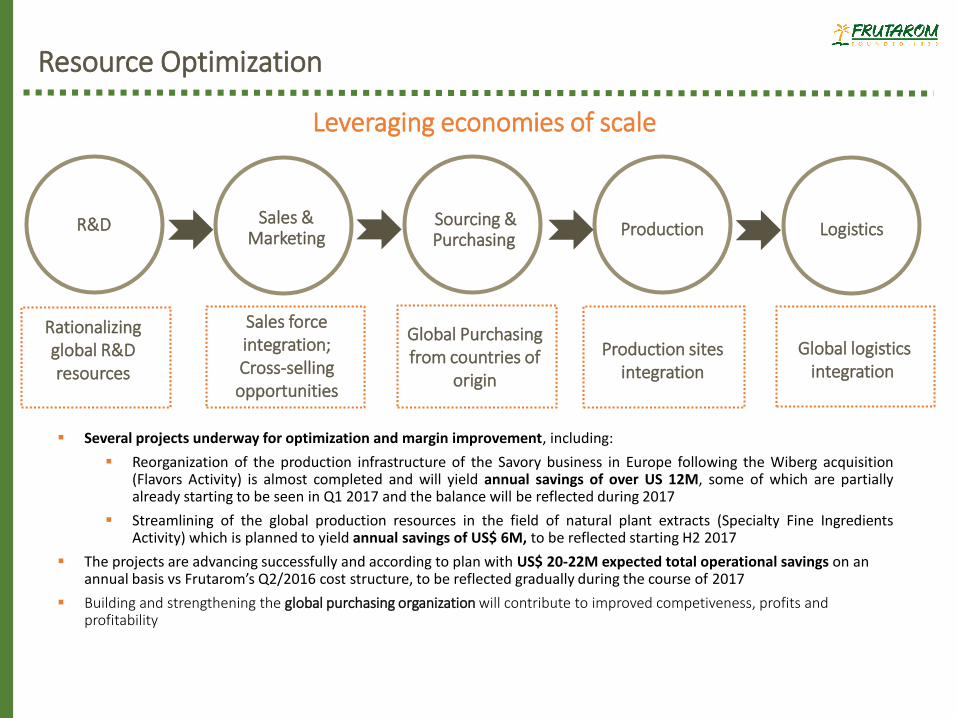
Resource Optimization
Several projects underway for optimization and margin improvement, including:
Reorganization of the production infrastructure of the Savory business in Europe following the Wiberg acquisition(Flavors Activity) is almost completed and will yield annual savings of over US 12M, some of which are partiallyalready starting to be seen in Q1 2017 and the balance will be reflected during 2017
Streamlining of the global production resources in the field of natural plant extracts (Specialty Fine IngredientsActivity) which is planned to yield annual savings of US$ 6M, to be reflected starting H2 2017
The projects are advancing successfully and according to plan with US$ 20-22M expected total operational savings on an annual basis vs Frutarom’s Q2/2016 cost structure, to be reflected gradually during the course of 2017
Building and strengthening the global purchasing organization will contribute to improved competiveness, profits and profitability
Global Purchasing from countries of
origin
Rationalizing global R&D resources
Sales force integration;Cross-selling opportunities
Leveraging economies of scale
R&D Sales & Marketing Production Logistics
Sourcing &Purchasing
Global logistics integration
Production sites integration
Frutarom’s 2016 Annual and Q4/2016 Results
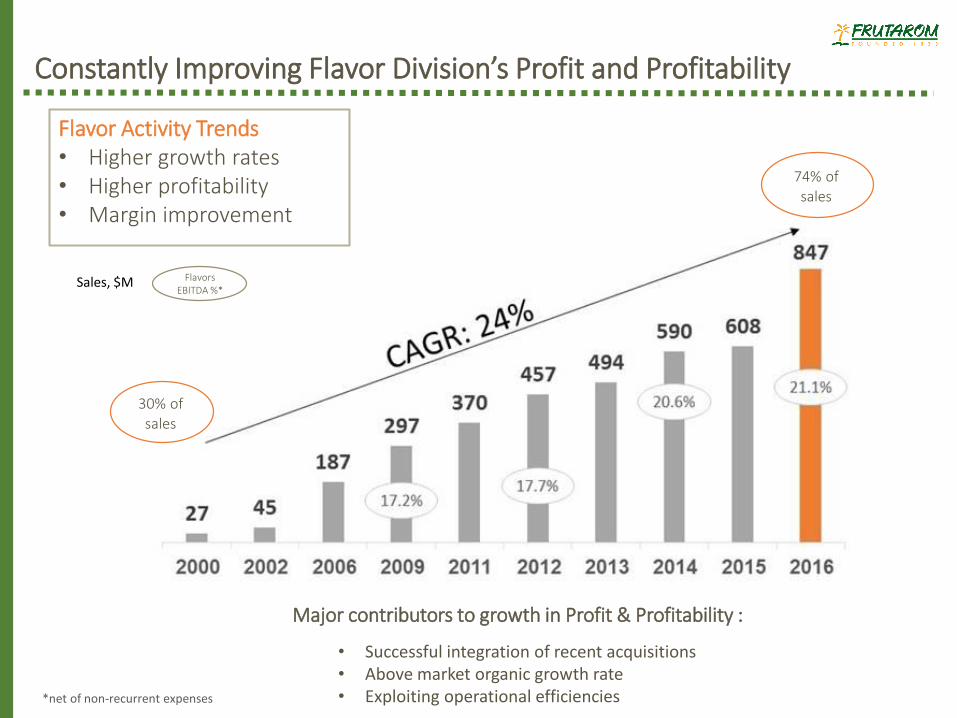
Constantly Improving Flavor Division’s Profit and Profitability
Major contributors to growth in Profit & Profitability :
• Successful integration of recent acquisitions• Above market organic growth rate• Exploiting operational efficiencies
FlavorsEBITDA %*
30% of sales
74% of sales
Flavor Activity Trends• Higher growth rates• Higher profitability • Margin improvement
Sales, $M
*net of non-recurrent expenses
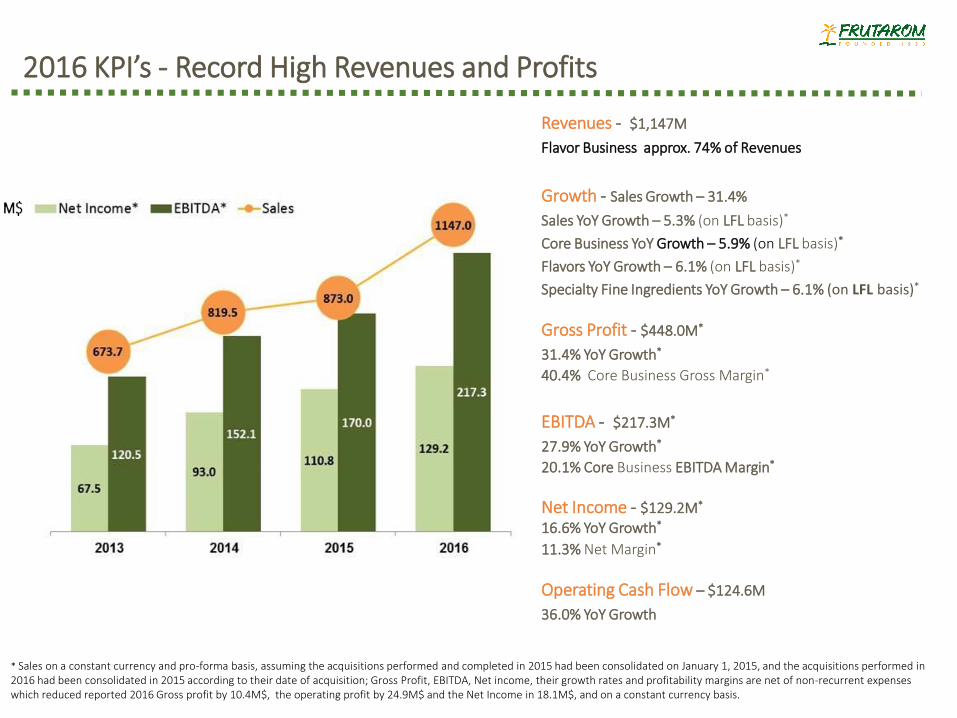
2016 KPI’s - Record High Revenues and Profits
Revenues - $1,147M
Flavor Business approx. 74% of Revenues
Growth - Sales Growth – 31.4%
Sales YoY Growth – 5.3% (on LFL basis)*
Core Business YoY Growth – 5.9% (on LFL basis)*
Flavors YoY Growth – 6.1% (on LFL basis)*
Specialty Fine Ingredients YoY Growth – 6.1% (on LFL basis)*
Gross Profit - $448.0M*
31.4% YoY Growth*
40.4% Core Business Gross Margin*
EBITDA - $217.3M*
27.9% YoY Growth*
20.1% Core Business EBITDA Margin*
Net Income - $129.2M*
16.6% YoY Growth*
11.3% Net Margin*
Operating Cash Flow – $124.6M
36.0% YoY Growth
* Sales on a constant currency and pro-forma basis, assuming the acquisitions performed and completed in 2015 had been consolidated on January 1, 2015, and the acquisitions performed in 2016 had been consolidated in 2015 according to their date of acquisition; Gross Profit, EBITDA, Net income, their growth rates and profitability margins are net of non-recurrent expenses which reduced reported 2016 Gross profit by 10.4M$, the operating profit by 24.9M$ and the Net Income in 18.1M$, and on a constant currency basis.

Q4/2016 KPI’s - Continued Accelerated Growth
Revenues - $289.0M
Flavor Business approx. 74% of Revenues
Growth - Sales Growth – 28.1%
Sales YoY Growth – 3.8% (on LFL basis)*
Core Business YoY Growth – 4.2% (on LFL basis)*
Flavors YoY Growth – 5.1% (on LFL basis)*
Specialty Fine Ingredients YoY Growth – 3.0% (on LFL basis)*
Gross Profit - $113.4M*
28.3% YoY Growth*
40.7% Core Business Gross Margin*
EBITDA - $52.7M*
23.8% YoY Growth*
19.4% Core Business EBITDA Margin*
Net Income - $33.9M*
10.3% YoY Growth*
11.7% Net Margin*
Operating Cash Flow - $28.2M
13.3% YoY Growth
* Sales on a constant currency and pro-forma basis assuming the acquisitions performed and completed in 2015 had been consolidated on January 1, 2015, and the acquisitions performed in 2016 had been consolidated in 2015 according to their date of acquisition; Gross Profit, EBITDA, Net income, their growth rates and profitability margins are net of non-recurrent expenses which reduced reported Q4/2016 Gross profit by 3.2M$, the operating profit by 9.5M$ and the Net Income in 6.9M$, and on a constant currency basis.
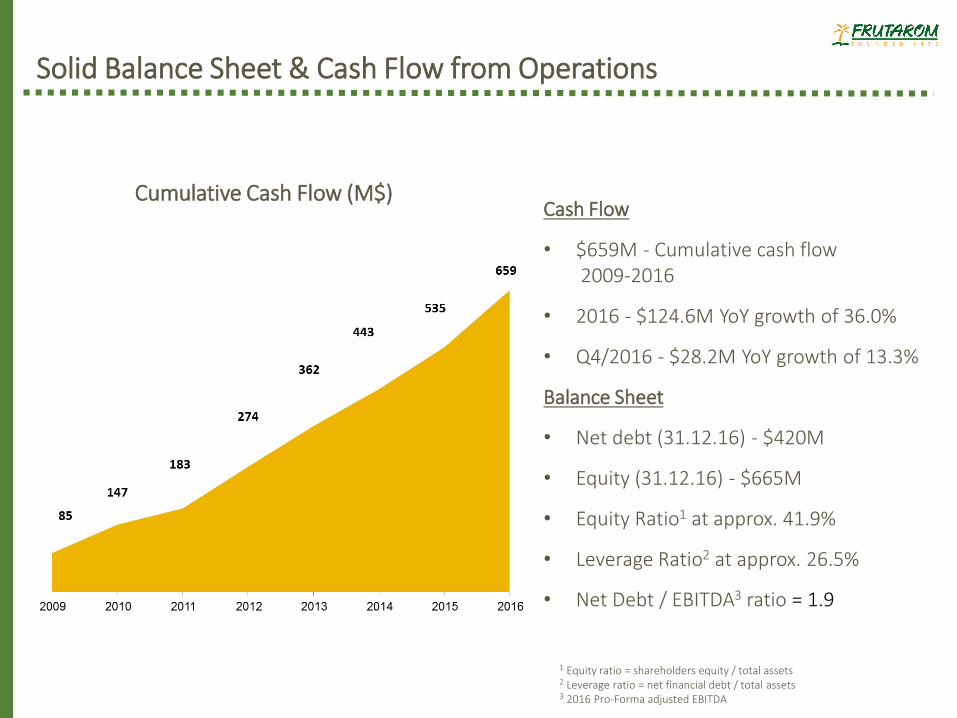
Solid Balance Sheet & Cash Flow from Operations
Cash Flow
• $659M - Cumulative cash flow2009-2016
• 2016 - $124.6M YoY growth of 36.0%
• Q4/2016 - $28.2M YoY growth of 13.3%
Balance Sheet
• Net debt (31.12.16) - $420M
• Equity (31.12.16) - $665M
• Equity Ratio1 at approx. 41.9%
• Leverage Ratio2 at approx. 26.5%
• Net Debt / EBITDA3 ratio = 1.9
Cumulative Cash Flow (M$)
1 Equity ratio = shareholders equity / total assets2 Leverage ratio = net financial debt / total assets3 2016 Pro-Forma adjusted EBITDA
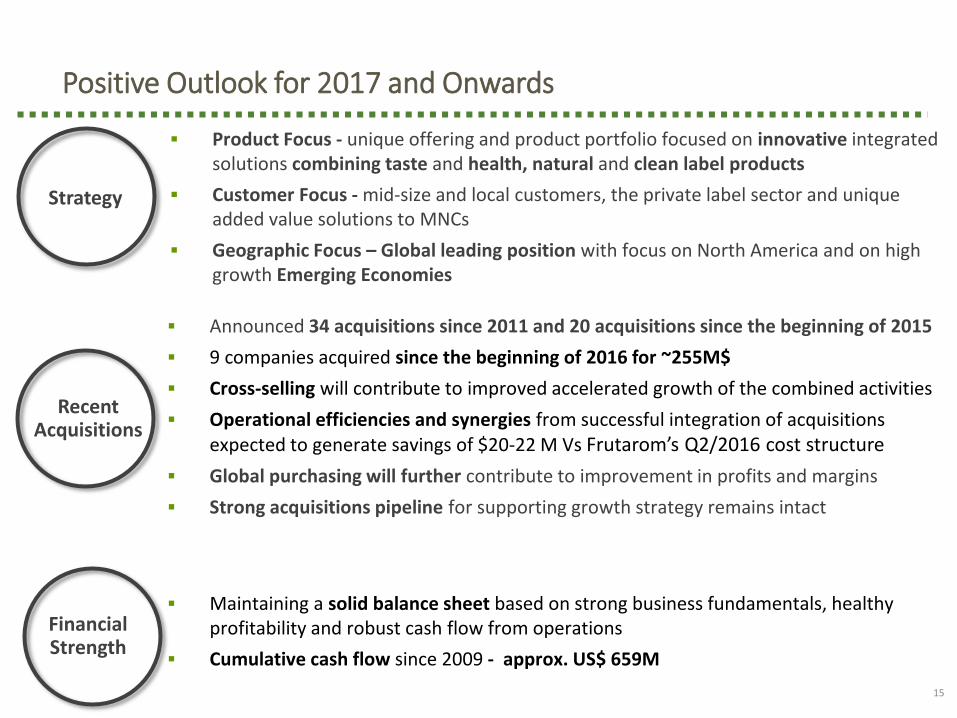
Positive Outlook for 2017 and Onwards
Recent Acquisitions
Strategy
Financial Strength
Announced 34 acquisitions since 2011 and 20 acquisitions since the beginning of 2015
9 companies acquired since the beginning of 2016 for ~255M$
Cross-selling will contribute to improved accelerated growth of the combined activities
Operational efficiencies and synergies from successful integration of acquisitions expected to generate savings of $20-22 M Vs Frutarom’s Q2/2016 cost structure
Global purchasing will further contribute to improvement in profits and margins
Strong acquisitions pipeline for supporting growth strategy remains intact
Maintaining a solid balance sheet based on strong business fundamentals, healthy profitability and robust cash flow from operations
Cumulative cash flow since 2009 - approx. US$ 659M
Product Focus - unique offering and product portfolio focused on innovative integrated solutions combining taste and health, natural and clean label products
Customer Focus - mid-size and local customers, the private label sector and unique added value solutions to MNCs
Geographic Focus – Global leading position with focus on North America and on high growth Emerging Economies
15
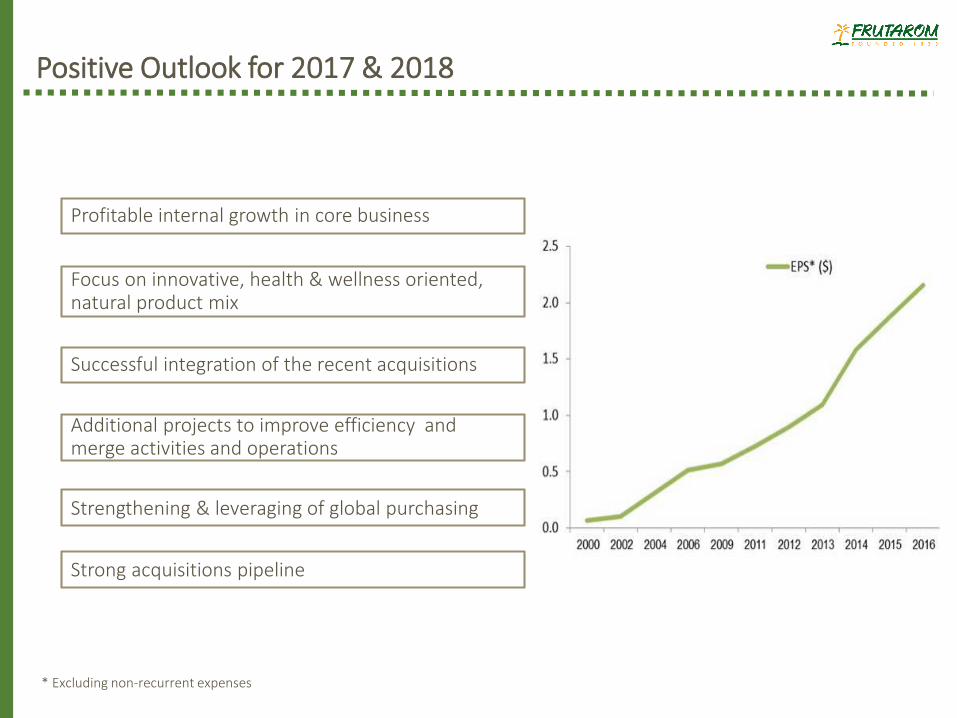
Positive Outlook for 2017 & 2018
Profitable internal growth in core business
Focus on innovative, health & wellness oriented, natural product mix
Additional projects to improve efficiency and merge activities and operations
Successful integration of the recent acquisitions
Strong acquisitions pipeline
Strengthening & leveraging of global purchasing
* Excluding non-recurrent expenses
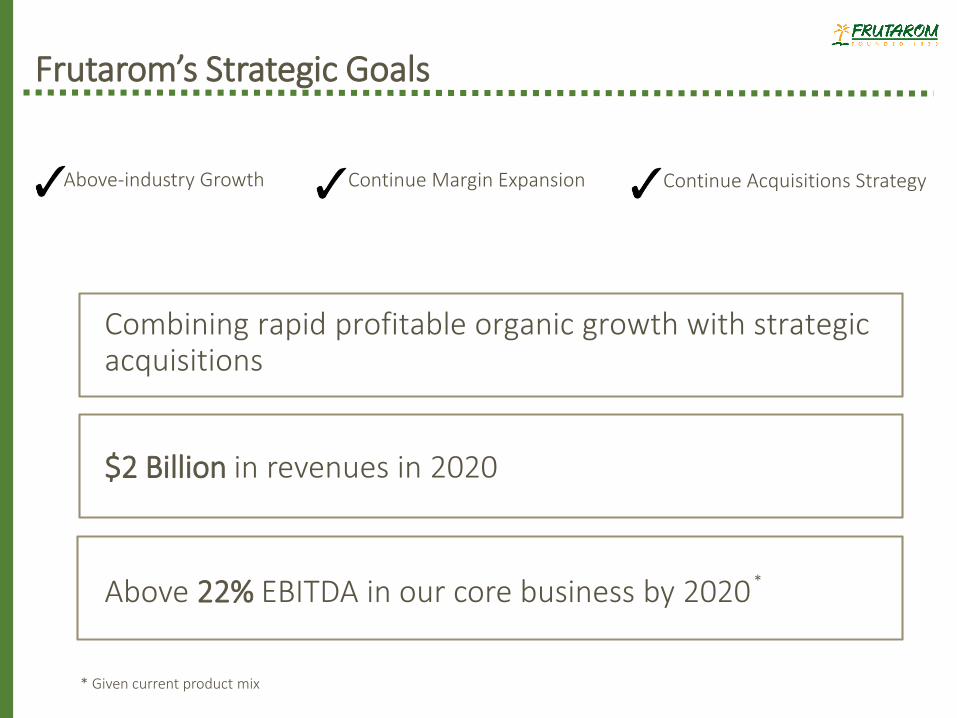
Frutarom’s Strategic Goals
Combining rapid profitable organic growth with strategic acquisitions
* Given current product mix
Continue Margin Expansion Above-industry Growth
$2 Billion in revenues in 2020
Above 22% EBITDA in our core business by 2020
Continue Acquisitions Strategy
*
Frutarom’s Vision
To Be The Preferred Partner For Tasty And Healthy
Success