investor presentation -...
TRANSCRIPT

Investor PresentationNovember 2014

Disclaimer
2
This presentation is not an offer to sell securities, nor is it a solicitation of an offer to buy securities, inany locality, state, country or other jurisdiction where such distribution, publication, availability or usewould be contrary to law or regulation or which would require any registration or licensing withinsuch jurisdiction.
Certain statements in this presentation and responses to various questions may constituteforward‐looking statements, including statements regarding the Company’s financial position,business strategy and plans and objectives of management for future operations. These statements,which in some cases contain words such as "believe,” “expect,” “anticipate,” “intends,” “estimate,”“forecast,” “project,” “will,” “may,” “should” and similar expressions, reflect the beliefs andexpectations of the Company and are subject to significant known and unknown risks, contingenciesand uncertainties, including those described under “Risk factors” in our most recent Annual Report onForm 20-F filed with the Securities and Exchange Commission or the SEC, which are difficult orimpossible to predict and beyond the company’s control, and which may cause actual results to differmaterially from those discussed in the forward-looking statement. These forward-looking statementsare made only as of the date hereof, and the Company undertakes no obligation to update or revisethe forward-looking statements, whether as a result of new information, future events or otherwise.
Throughout this presentation, we reference adjusted EBITDA, which is a non-GAAP financial measure.Please refer to the Appendix to this presentation, as well as to our most recent Annual Report on Form20-F, filed with the SEC on March 27, 2014, and our report of Foreign Private Issuer on Form 6-K,furnished to the SEC on November 12, 2014, for a discussion of adjusted EBITDA, reconciliation ofGAAP to Non-GAAP results, and a reconciliation of net income to adjusted EBITDA, the most directlycomparable financial measure required by, or presented in accordance with U.S. GAAP.
Presenting today
3
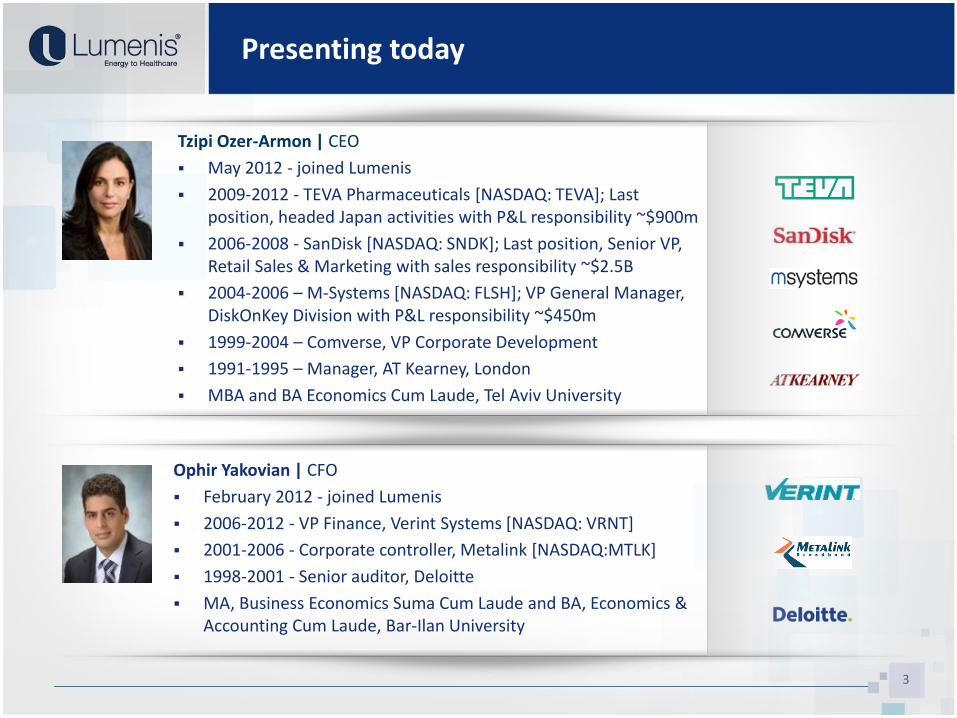
Tzipi Ozer-Armon | CEO
May 2012 - joined Lumenis
2009-2012 - TEVA Pharmaceuticals [NASDAQ: TEVA]; Last position, headed Japan activities with P&L responsibility ~$900m
2006-2008 - SanDisk [NASDAQ: SNDK]; Last position, Senior VP, Retail Sales & Marketing with sales responsibility ~$2.5B
2004-2006 – M-Systems [NASDAQ: FLSH]; VP General Manager, DiskOnKey Division with P&L responsibility ~$450m
1999-2004 – Comverse, VP Corporate Development
1991-1995 – Manager, AT Kearney, London
MBA and BA Economics Cum Laude, Tel Aviv University
Ophir Yakovian | CFO
February 2012 - joined Lumenis
2006-2012 - VP Finance, Verint Systems [NASDAQ: VRNT]
2001-2006 - Corporate controller, Metalink [NASDAQ:MTLK]
1998-2001 - Senior auditor, Deloitte
MA, Business Economics Suma Cum Laude and BA, Economics & Accounting Cum Laude, Bar-Ilan University

Who are we?
4

5
Investment highlights
Committed to delivering accelerating, sustainable and profitable growth
Total addressable market of $3.5b, growing at high single digitGrowth correlates with aging population2/3 reimbursed, 1/3 out of pocket
Large and growing markets
Innovative technology- better technology for better patient careGlobal reach, with strong presence in APACStrong brand- over 40 years of clinical outcomes
Strong management, proven execution track recordTwo largest business segments grew at an average of 10% in 2013GM expansion of 810 BPS over the last three years
Transformed-delivering accelerated profitable growth
Key product launches in 2014 Geographical expansionNew domains, leveraging technology / market reachExpanding margins
Solid plans: growth and margin expansion
Strong competitive assets

Accelerated growth on an LTM basis…
6
New management
Realigned organization
Revitalized R&D process and pipeline
Culture of accountability and success
Demonstrated financial results
LTM Revenues, $m
Q4Q3
284
261
257
Q3
265
Q2
251
Q2Q1 Q3
245
Q1Q4
247245
249
271
Q2
277
Q1
6.7%
2.4%
4.7%
5.3%
0.7%
2012 LTM 2013 LTM
7.9%
2014 LTM
8.0%
8.8%
X%LTM growth, YoY

Q3’14LTM
152
2013
142
113
123
2011 2012
…and significant improvement in profitability
7
Revenue growth acceleration
810bps gross margin improvement
Adjusted EBITDA margins1 doubled
1%
7%
10%
15%
$m$m$m
2011 2012
265
249
Q3’14LTM
284
2013
247
(1) Adjusted EBITDA represents net income before depreciation and amortization, stock-based compensation, legal settlements, net and other non-recurring expenses, financial expenses, net and taxes on income.
7%
45.6%
49.6%
53.6%53.7%
2011
26
12
2013
31
Q3’14LTM
2012
18
46%
4.9%
7.2%
9.8%
10.8%
47%
19%7%

Revenue growth acceleration
Key launches will support future growth
8
Completely shifted gear
1 1
1
1
1
2
11
11
2013
2Aesthetic
Surgical
Ophthalmic
20142011 201220102009
2
2008
4
2007
Number of product releases per year, 2007-2014
5 Launches
6 Launches
New products launched in the past 18 months generated over
15% of product revenues in Q3’14

Well-positioned across multiple attractive end markets
9
Q3’14 LTM: $284m
Ophthalmic - $59m -3% in LTM; 21% of total revenue Retina Glaucoma & Secondary
CataractAddressable market of ~$350m
Aesthetic - $116m +19% Growth in LTM; 41% of total revenue Skin rejuvenation Hair removalAddressable market of ~$1.5b
Surgical - $109m +6% Growth in LTM; 38% of total revenue BPH (Benign Prostatic
Hyperplasia) Lithotripsy ENT Micro-SurgeryAddressable market of ~$1.7b
Total addressable market of ~$3.5b

Global reach, scale and APAC strength
10
Asia Pacific business more than doubled within the past 5 years
Q3’14 LTM: $284m
>420 employees
across:
China
India
Australia
Hong Kong
Singapore
Americas32% - $92m
Japan14% - $40m
EMEA20% - $56m
APAC34% - $96m
$m
75
60
4739
201120102009 2013
$86m
2012 2014E
Growth of 16% in 2014 YTD

Surgical leader focused on improving patient outcomes
11
~$1.7b addressable market
BPH
The BPH solution - Enucleation Minimizes collateral damage Better symptomatic recovery Lowest re-intervention rate Shorter hospital stays
PowerSuite 100W Holmium
Lithotripsy
The stone dusting solution Minimally invasive urinary lithotripsy Self clearing stones Broad stone targeting
PowerSuite 60W Holmium
ENT
Advanced precision and guidance High-end, high-energy, short-pulse-duration CO2 laser Vaporization and excision Minimal collateral tissue damage Better patient outcomes
AcuPulse DUO

New Product Introduction -Lumenis Pulse 120H
12
“All in One” superior platform for laser Urology solutions: Enucleation, Vaporization, Flexible Ureteroscopy and PCNL
Addressing 5 most desired outcomes: safety, minimized procedure time, superior clinical outcome, ease of use, cost efficiency
Set of new supplemental tools: tools and fibers for comprehensive treatment
Received FDA clearance and CE mark in March 2014
First units shipped in Q2’14; sales expected to ramp up in 2015

Pioneer in the Ophthalmic laser market
13
~$350m addressable market
Retina
Upgradable, cost effective treatment Treats various retinal pathologies Better treatment of existing indications
Vision One
Array Laser Link
Glaucoma& Secondary Cataract
SLT1 inventor SLT, YAG photo-disruption and photo-coagulation Maximum space utilization Proven long term clinical efficacy Accounts for 50% of global SLT market
Selecta Trio
Continual innovation Array Laser Link pattern scanning device Reduces procedure time by 80% Received FDA and MHLW clearance in Q4’13 Expands the capability of Vision1 and Spectra
(1) Selective Laser Trabeculoplasty

New Product Introduction - Array - Scanning Laser Link
14
The benefits of pattern scanning laser with the familiarity of Lumenis laser for Retina treatments
Shorter duration for each spot creates less intense burns, less pain to the patient and greater predictability
Multiple spots allow shorter and fewer treatments
Reduced risk of retinal bleeding
Product differentiation
Touchpad allows the physician to maintain eyes-forward while performing titrate, power adjustments and pattern modifications
Heads up display - While changing the system’s parameters the physician gets a visual confirmation displayed on the Retina (power, status)
Received FDA, CE mark and Japanese MHLW

Premium brand in Aesthetics
15
~$1.5b addressable market
Skin Rejuvenation
Deep, single pulse penetration
Multi-application, modular, upgradable platform
Proven clinical efficacy and safety
ResurFx – “truly fractional” solution
Ability to address severe scarring
M22
UltraPulse
HairRemoval
The Gold standard in hair removal
Significantly more comfortable and less painful
Short treatment cycle
Fast treatment time
Superior efficacy
LightSheer

New Product Introduction - LightSheer Infinity & Desire
16
LightSheer Infinity LightSheer Desire
Compact, portable and upgradablelaser hair removal system with HIT1
technology and advanced user interface
Ability to treat all body areas and skin types
805nm wavelength diode, vacuum assist technology and contact cooling ChillTip
FDA and CE approved
Our cutting edge laser hair removal system with HIT1 and advanced user interface
Up to 75 percent faster than other currently available devices
All existing benefits plus Dual Wavelength – 805nm & 1060nm to treat dark and tanned skin, vacuum assist technology and contact cooling ChillTip
FDA and CE approved
(1) High-speed Integrated Technology for increased safety and efficacy and decreased pain and treatment time
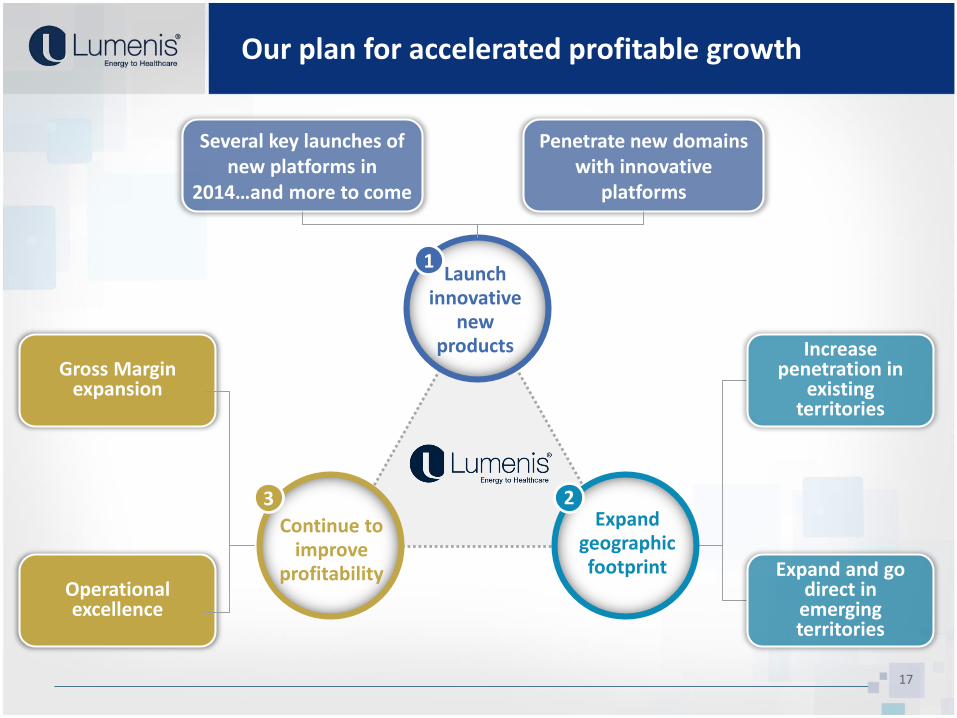
Increase penetration in
existing territories
Expand and go direct in
emerging territories
Several key launches of new platforms in
2014…and more to come
Penetrate new domains with innovative
platforms
Our plan for accelerated profitable growth
17
3
Continue to improve
profitability
2Expand
geographic footprint
1Launch
innovative new
productsGross Margin
expansion
Operational excellence

Ophir Yakovian — Chief Financial Officer
Financial review

Growth expected to continue at high-single digit pace
Nine quarters of continuous revenue growth
19
YoY
3.7%(0.4%)
74.272.5
65.871.1
67.866.360.1
66.363.960.9
57.6
Q3’12 Q2’13Q1’13Q4’12Q2’12Q1’12 Q3’14Q2’14Q1’14Q3’13 Q4’13
(2.8%) 1.9% 4.4% 9.0% 6.2% 7.3% 9.5%
Revenues, $m
9.3% 9.4%

Proven track record of margin expansion
2020
Gross margin expanding 810 BPS since 2011Adjusted EBITDA margin expanding 590 BPS ($18.5m) since 2011
Drivers of margin expansion: Tight inventory management
Improved manufacturing efficiency
Product quality
Cost reduction across platforms
Scale
Q2’13 Q4’13
9.8%
26.0
10.1%
27.3
Q1’14
29.2
10.5%
$30.6m
Q2’14Q3’13
9.4%
24.5
Q1’13 Q3’14
10.8%
22.1
8.6%
13.2
Q4’12
17.8
4.2%
7.7%
12.1
7.2%
19.2
Q3’12Q1’12 Q2’12
15.710.4
Q4’11
4.9% 5.4%6.3%
Q3’12
48.5%
Q2’12
51.5%
Q1’13Q4’12
50.5%
Q2’14Q1’14
53.9%
Q4’13
54.0%
Q3’13
53.5%
Q2’13
52.6%
49.8%
53.7%
45.6% 45.9%
Q4’11
47.2%
Q1’12 Q3’14
% of revenue
$mx

Q3’14 Non-GAAP results
21
$ in millionActual Q3’13
Actual Q3’14
Variance Q3’13-Q3’14
Revenues 67.8 74.2 6.4
YoY growth (%) 9.4%
Gross profit 37.2 39.7 2.5
Gross margin, % 54.8% 53.5% -1.3%
Adjusted EBITDA 8.7 10.2 1.4
EBITDA margin, % 12.9% 13.7% 0.8%
YoY growth (%) 16.4%
Net income 5.7 6.0 0.2
Net margin, % 8.4% 8.0% -0.4%
YoY growth (%) 4.2%
Fully diluted EPS ($) 0.19 0.17 -0.02

2014 Annual guidance
22
For the full year ended December 31, 2014, we expect to report on a non-GAAP basis:
Revenue in a range of $285 and $287 million, representing an
increase of 7% - 8% year-over-year
Adjusted EBITDA in a range of $29.6 to $30.6 million,
representing an increase of 14% - 18% year-over-year
Non-GAAP Net Income in a range of $18.1 to $19.6 million
reflecting an Non-GAAP EPS of $0.51 - $0.55

Thank You
www.lumenis.com

APPENDIX
24

Q3’14 vs. Q3’13 Reconciliation of GAAP to Non-GAAP
25
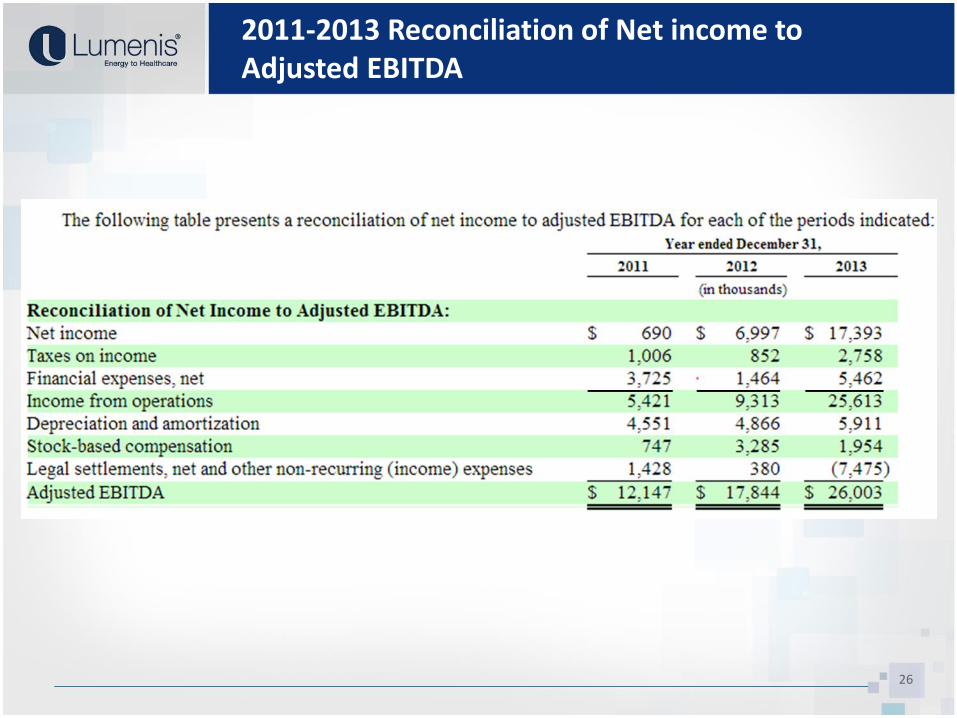
2011-2013 Reconciliation of Net income to Adjusted EBITDA
26