emmanuel faber -...
TRANSCRIPT

Emmanuel Faber Vice Chairman and Co-Chief Operating Officer

2
Disclaimer
This document contains certain forward-looking statements concerning DANONE. Although
DANONE believes its expectations are based on reasonable assumptions, these forward-looking
statements are subject to numerous risks and uncertainties, which could cause actual results to
differ materially from those anticipated in these forward-looking statements. For a detailed
description of these risks and uncertainties, please refer to the section “Risk Factors” in
DANONE’s Annual Report (which is available on www.danone.com). DANONE undertakes no
obligation to publicly update or revise any of these forward-looking statements. This document
does not constitute an offer to sell, or a solicitation of an offer to buy, Danone shares.
2
3
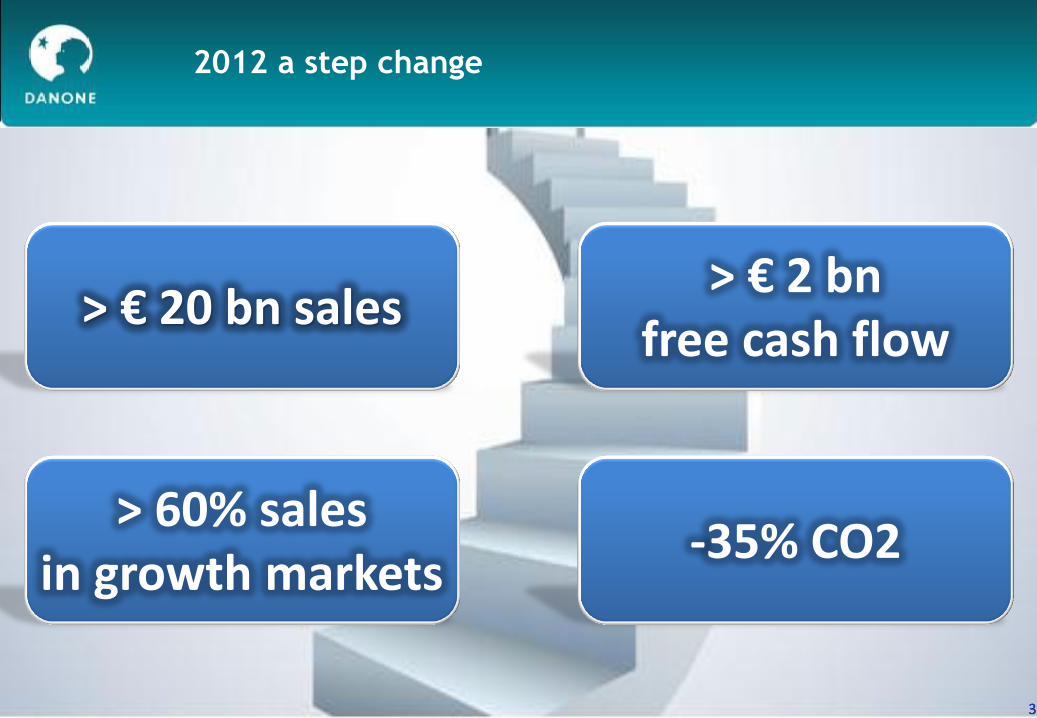
2012 a step change
3 3
> € 2 bn free cash flow > € 20 bn sales
> 60% sales in growth markets -35% CO2

4
2012 a step change
€15 bn
€20 bn
> € 20 bn sales
Strong brands

5
2012 a step change
986
1 183
1 427
1 713
1 874
2007 2008 2009 2010 2011 2012 (e)
2 088
x2 Free Cash Flow in 5 years Capital expenditures (€ mln)
706 699
832885
976
2008 2009 2010 2011 2012
Acquisitions
> € 2 bn free cash flow
6
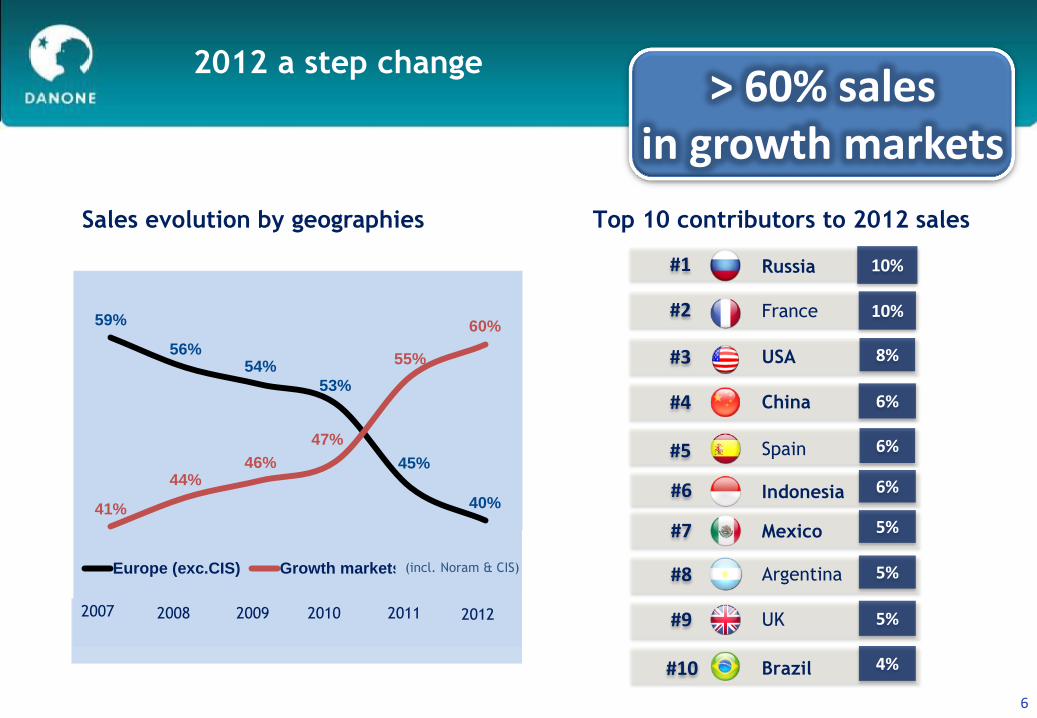
2012 a step change
Sales evolution by geographies
59%
56% 54%
53%
45%
40% 41%
44% 46%
47%
55%
60%
2007 2008 2009 2010 2011 YTD 2012(9M)
Europe (exc.CIS) Growth markets (inc.US&CIS)
2007 2009 2010 2011 2008 2012
Top 10 contributors to 2012 sales
Russia
France
USA
China
Spain
Indonesia
Mexico
Argentina
UK
Brazil
#1
#2
#3
#4
#5
#6
#7
#8
#9
#10
10%
10%
8%
6%
6%
6%
5%
5%
5%
4%
> 60% sales in growth markets
(incl. Noram & CIS)

7
2012 a step change
7 7
Employees
engagement & loyalty
Volumes
-35% Innovation &
consumer
satisfaction
Efficient sourcing
Connecting business
& sustainability
-35% CO2
Tonnes C02
Carbon footprint reduction

8
A unique mission
Bring health
through food to the largest
number of people 2007-2012
From 600 mln to 900 mln
Danone consumers
9
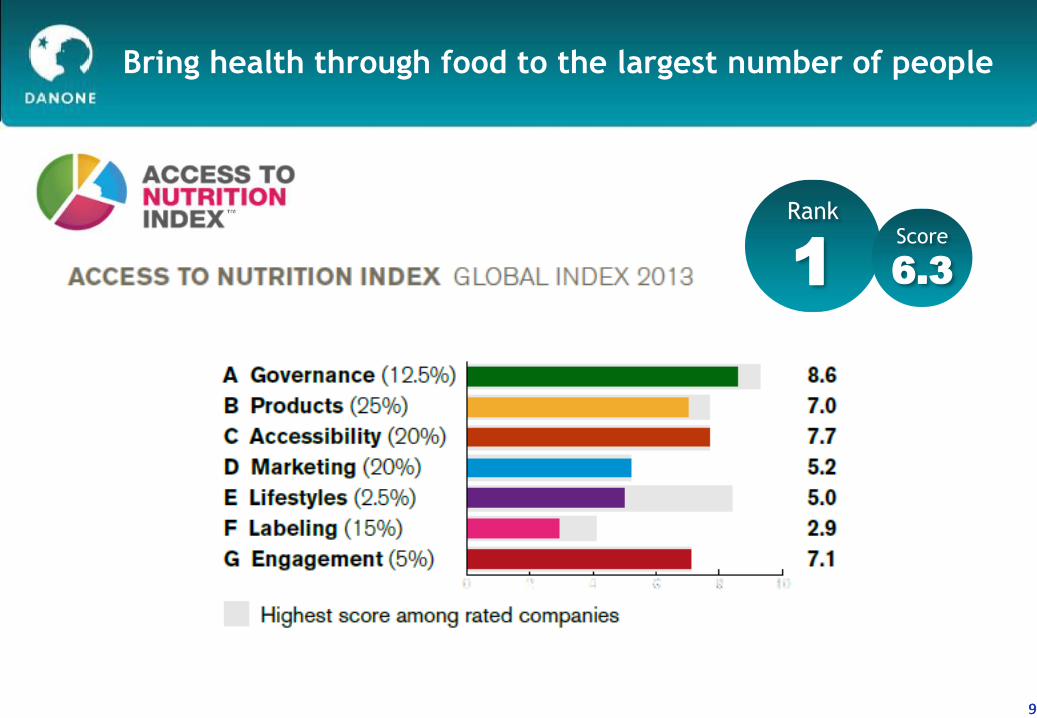
Bring health through food to the largest number of people
9 9
Rank
1
Score
6.3

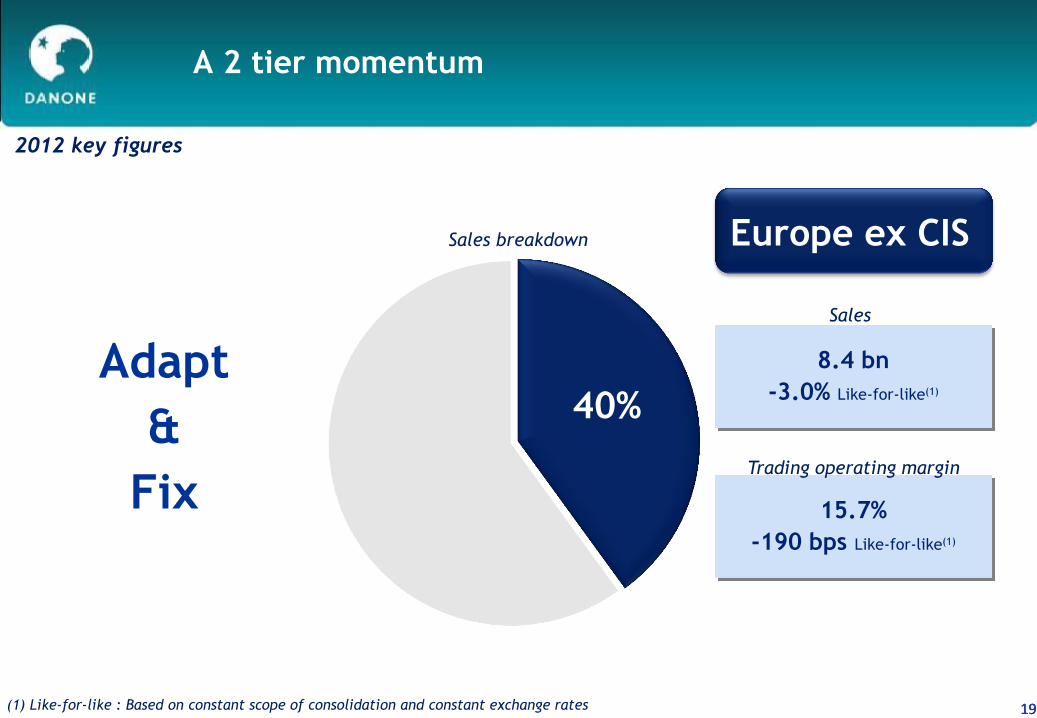
8.4 bn
-3.0% Like-for-like(1)
10
A 2 tier momentum
10 10 (1) Like-for-like : Based on constant scope of consolidation and constant exchange rates
Europe ex CIS
15.7%
-190 bps Like-for-like(1)
12.5 bn
+12.4 % Like-for-like(1)
13.2%
+80 bps Like-for-like(1)
Growth Markets
40% 60%
Sales
Trading operating margin
Sales
Trading operating margin
Sales breakdown
2012 key figures

11
FY 2012 Results
Sales growth (1)
11
5-7%
2012 objectives
Stable,
adjusted to -50 bps in June
Trading operating margin
€ 2 bn
Free cash flow (2)
11
(1) Like-for-like : Based on constant scope of consolidation and constant exchange rates
(2) Free cash flow: Cash flow from operations less capital expenditure (net of disposals) and excluding business combinations fees
+5.4%
FY 2012
14.18%
-50 bps Like-for-like(1)
€ 2,088 mln

12
A 2 tier momentum
12 12
12.5 bn
+12.4 % Like-for-like(1)
13.2%
+80 bps Like-for-like(1)
Growth Markets
60%
Sales
Trading operating margin
Sales breakdown
Invest
&
leverage
2012 key figures

Fresh Dairy US : Building a strong market leader
* Dannon + Stonyfield
2011 2012
2010 2012
Oikos* and Light&Fit Greek $ sales
x 2.2
Dannon Category Captaincy
24.0%
32.0%
Total Fresh Dairy products :
value market shares
The only key player in all segments
* Dannon + Stonyfield
The only key player in all segments
Core
Light
Active Health
Greek
Kids
Organic
13
(% retail universe with Danone as category caotain)
Source : IRI Multi Outlet
31.9%
27.2%
14.9%
9.4%
Q4 2011 Q4 2012
Competitor 1
Total Danone
Competitor 2
Danone Greek
2009 2010 2011 2012
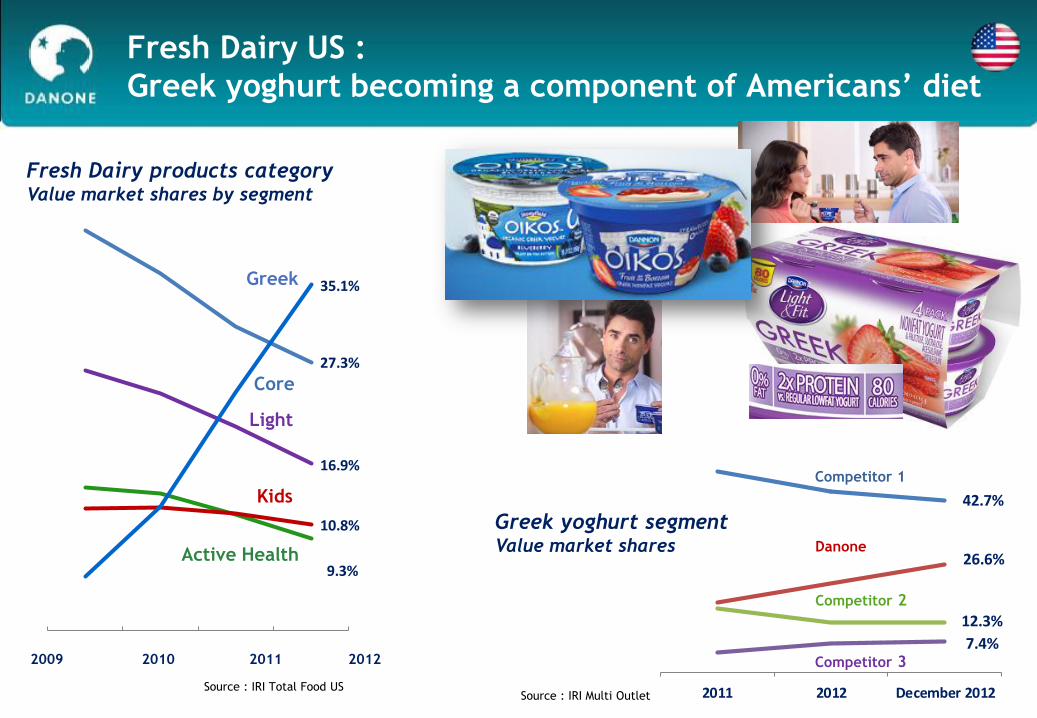
Fresh Dairy US :
Greek yoghurt becoming a component of Americans’ diet
7.4%
12.3%
26.6%
42.7%
2011 2012 December 2012
Greek yoghurt segment Value market shares
Source : IRI Multi Outlet
Competitor 1
Danone
Competitor 2
Competitor 3
35.1%
27.3%
16.9%
10.8%
9.3%
Fresh Dairy products category Value market shares by segment
Source : IRI Total Food US
Greek
Core
Light
Active Health
Kids
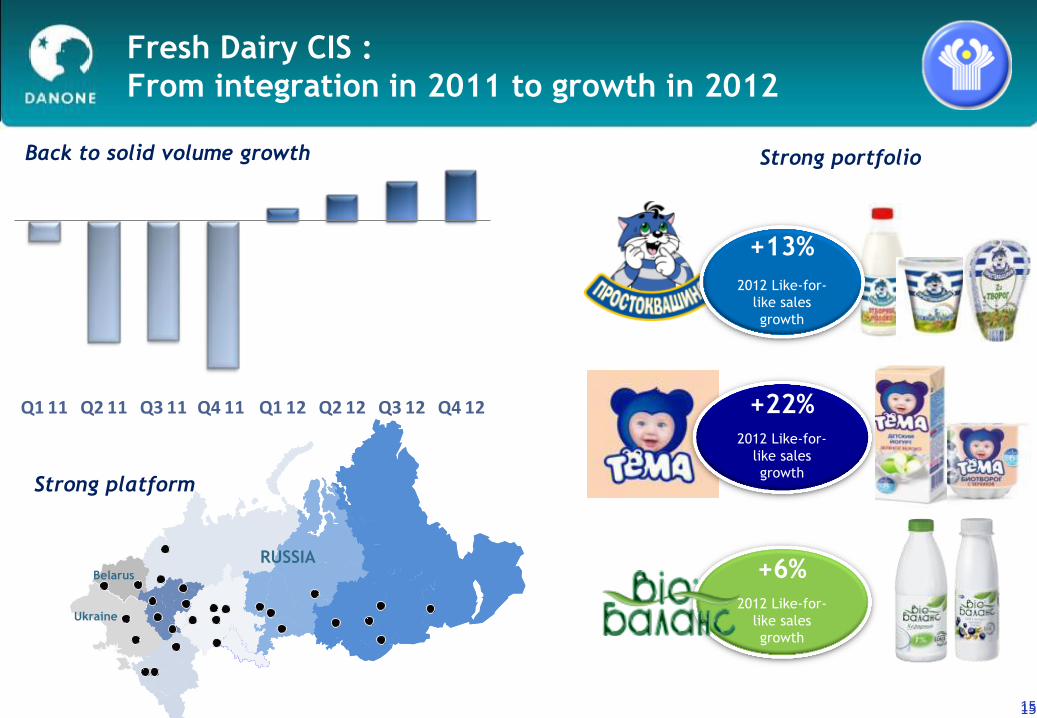
Fresh Dairy CIS :
From integration in 2011 to growth in 2012
15 15
Back to solid volume growth
Strong platform
+22%
2012 Like-for-
like sales
growth
Strong portfolio
+6%
2012 Like-for-
like sales
growth
+13%
2012 Like-for-
like sales
growth
Q1 11 Q2 11 Q3 11 Q4 11 Q1 12 Q2 12 Q3 12 Q4 12
RUSSIA
Ukraine
Belarus

Baby Nutrition : leveraging our platform
16 16
28.6% 28.9%
2011 2012
+ 30
bps
Danone market share
(Danone Universe)
2012
like-for-like growth
+11.6%
Prudent & harmonious
mums Expert & ambitious
mums
Our mission:

Waters : unlocking the potential of the category
17 17
> 10 bn litres > € 500 mln ≈ € 500 mln
+1.0%
+5.3%
+15.7%
+10.0%
FY 2009 FY 2010 FY 2011 FY 2012
2012
like-for-like growth
+10.0%
Mizone
Aquadrinks: a key contributor to our growth
20%
CAGR
2008 2009 2010 2011 2012
Like-for-like sales growth

62%
38%
18
Waters : Strong engine in emerging markets
2009 2010 2011 2012Europe
Growth markets
Europe ex CIS Growth markets
Sales breakdown
Like-for-Like Sales growth
8.4 bn
-3.0% Like-for-like(1)
19
A 2 tier momentum
19 19 (1) Like-for-like : Based on constant scope of consolidation and constant exchange rates
Europe ex CIS
15.7%
-190 bps Like-for-like(1)
40%
Sales
Trading operating margin
Sales breakdown
Adapt
&
Fix
2012 key figures

Drive category growth
Deepen consumer
connection
The right price
point
Differentiating
innovation
Restoring growth in Europe: our roadmap
20
The best
packaging
Deliver value for
money
The best
product
+
+

The right price
Innovation
Restoring growth in Europe: Example in Dairy Portugal
21
Stronger brand identity + better
formula + ownable pack
€1.99
€1.99 €1.99
Renovation of Corpos Danone, core range and Dan’up
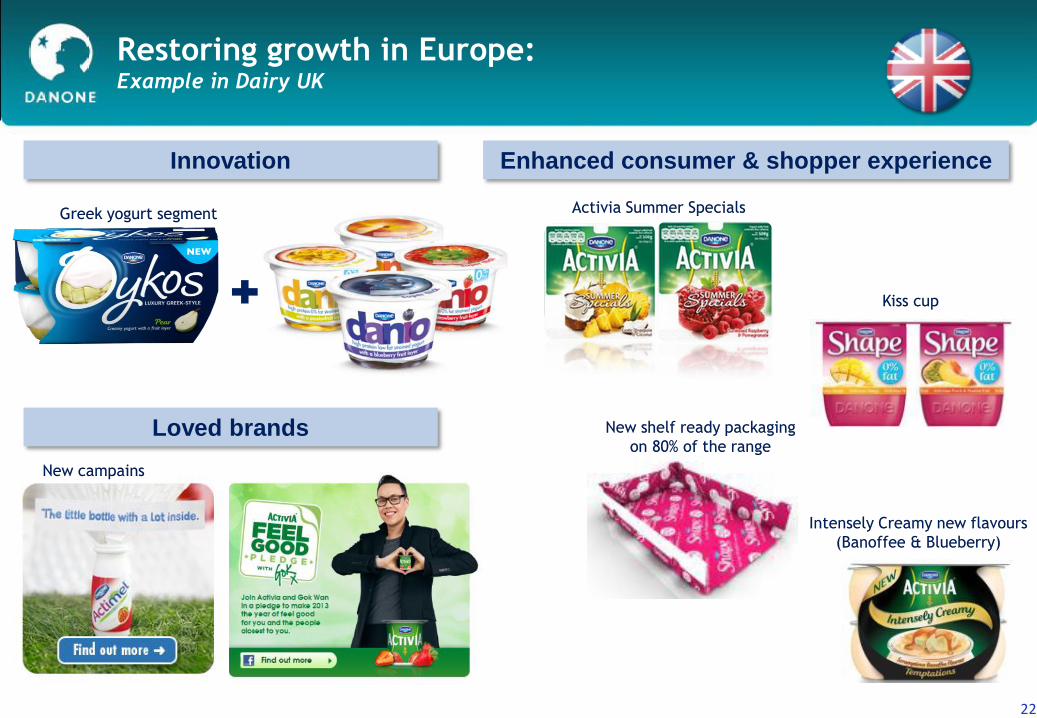
Restoring growth in Europe: Example in Dairy UK
22
Enhanced consumer & shopper experience
Loved brands
Activia Summer Specials
Kiss cup
New shelf ready packaging
on 80% of the range
Greek yogurt segment
Innovation
New campains
Intensely Creamy new flavours
(Banoffee & Blueberry)
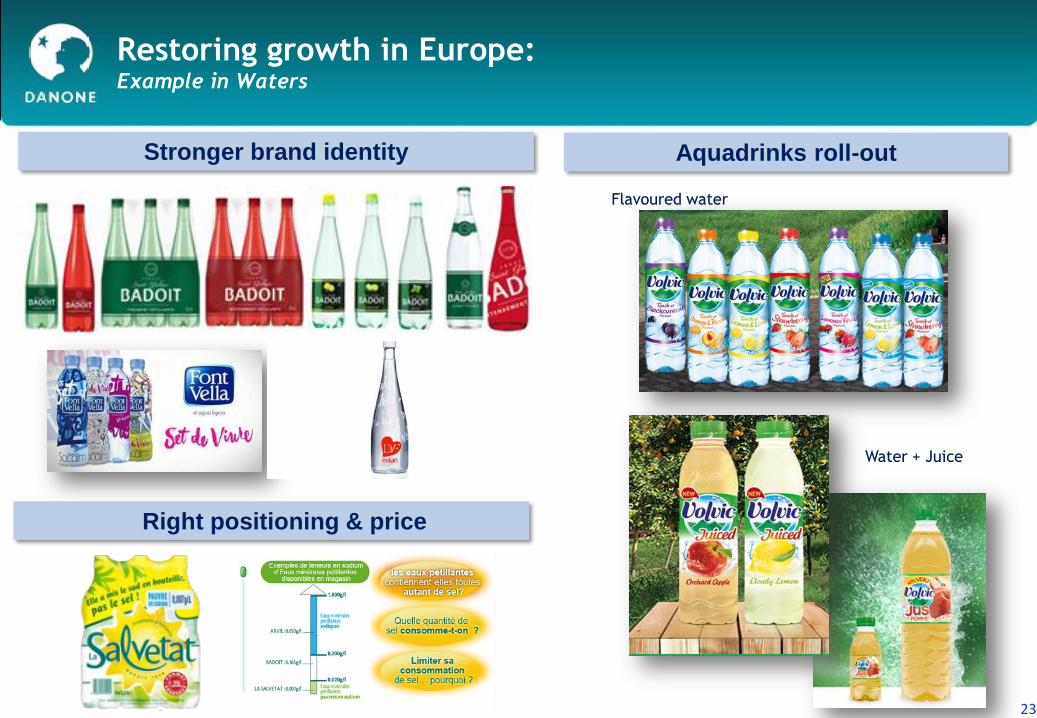
Restoring growth in Europe: Example in Waters
23
Aquadrinks roll-out Stronger brand identity
Flavoured water
Water + Juice
Right positioning & price

24
Plan for competitiveness in Europe
24 24
SAVINGS
€200mln
ADAPT &
SIMPLIFY
ORGANISATION
& PROCESSES
EUROPE – 26 countries
REGAIN COMPETITIVE EDGE
&

25 25 25
Plan for competitiveness in Europe Reorganization Project of European management & support functions
(Presented to European Works Council on February 19th)
Shift from a“Country” to a “Cross-Country” Business Unit model :
Example of “DACH”* zone in Dairy division
* DACH = Deutschland, Austria, Communauté Hélvétique
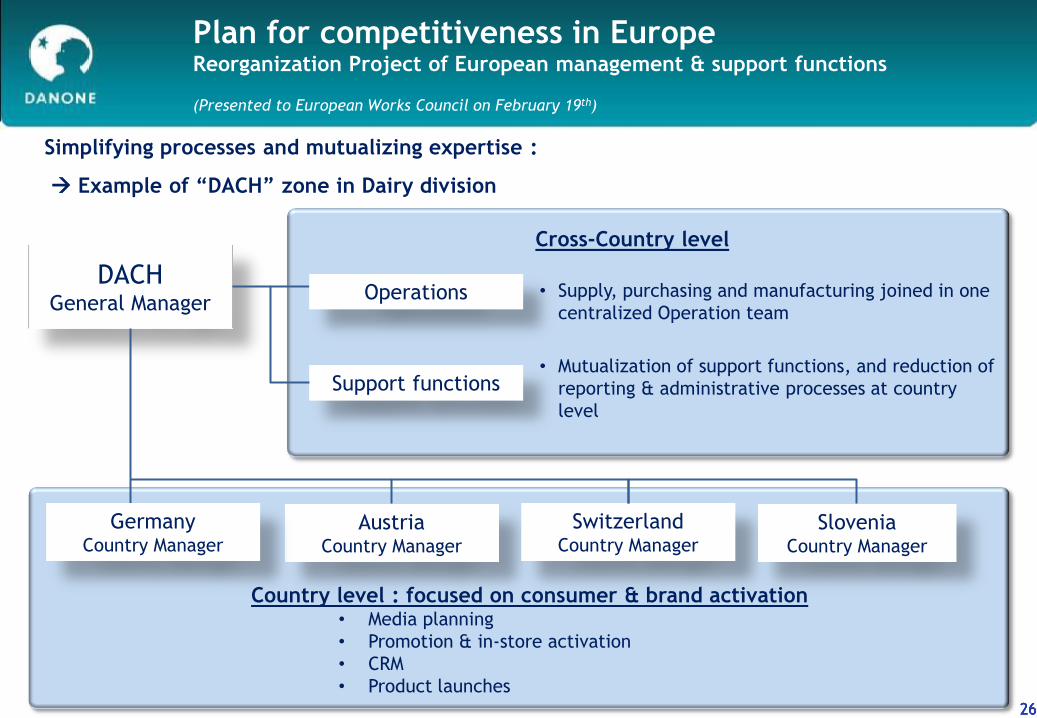
Country level : focused on consumer & brand activation • Media planning
• Promotion & in-store activation
• CRM
• Product launches
26 26 26
DACH General Manager
Cross-Country level
Austria Country Manager
Switzerland Country Manager
Slovenia Country Manager
Support functions
• Supply, purchasing and manufacturing joined in one
centralized Operation team
• Mutualization of support functions, and reduction of
reporting & administrative processes at country
level
Simplifying processes and mutualizing expertise :
Example of “DACH” zone in Dairy division
Plan for competitiveness in Europe Reorganization Project of European management & support functions
(Presented to European Works Council on February 19th)
Operations
Germany Country Manager
27 27 27
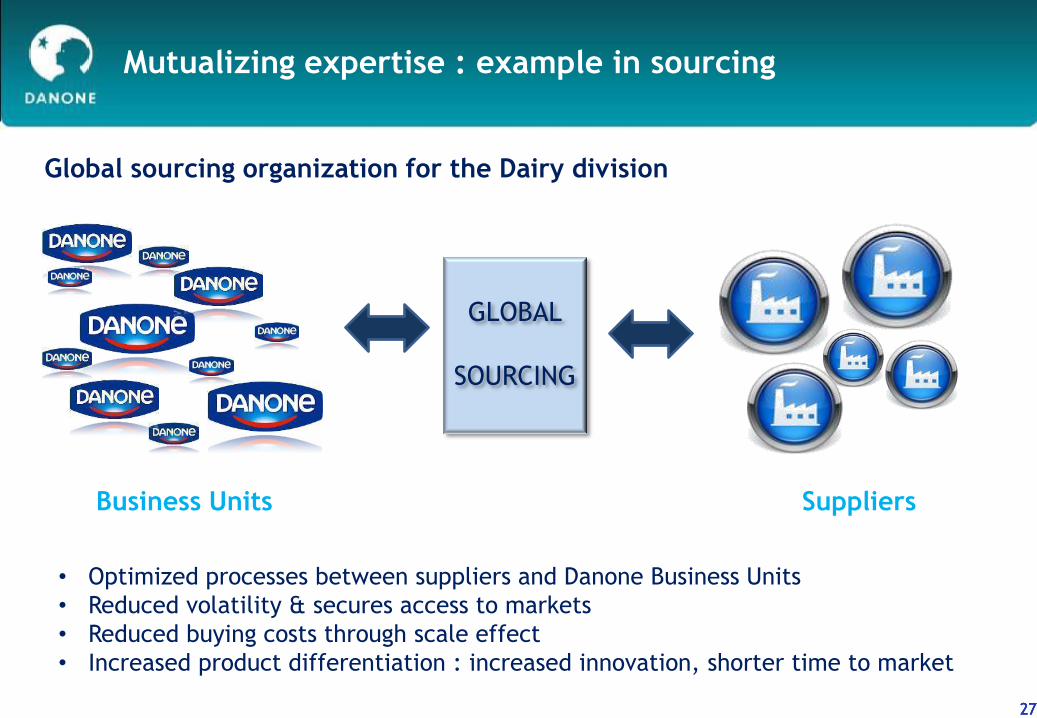
Mutualizing expertise : example in sourcing
• Optimized processes between suppliers and Danone Business Units
• Reduced volatility & secures access to markets
• Reduced buying costs through scale effect
• Increased product differentiation : increased innovation, shorter time to market
Business Units Suppliers
Global sourcing organization for the Dairy division
GLOBAL
SOURCING

28
2012 Group equation
EUROPE (ex CIS)
NORAM & CIS
% Group
Sales
ALMA
LFL margin
change LFL
Growth
40.4%
21.2%
38.4%
- 190 bps
+ 144 bps
+ 31 bps
-3.0%
+ 6.7%
+ 15.7%
TOTAL 100% - 50 bps + 5.4%
% margin
15.66%
10.21%
14.81%
14.18%
TOPLINE MARGIN 2012 key figures

-30bps to -50bps
Trading operating margin(1)
29
2013 objectives
(1) Like-for-like : Based on constant scope of consolidation and constant exchange rates
At least 5%
2013 objectives
Sales growth (1)
Around € 2 bn Ex exceptionnal items
Free cash flow (2)
29 (2) Free cash flow: Cash flow from operations less capital expenditure (net of disposals) and excluding business combinations fees

30
2013-2014 VISION
30 30
Europe :
Adapt & fix
– Savings & competitiveness
– Value for consumers
Growth markets :
Invest & leverage
Strong Sustainable
2013 a year of transition 2014 back to