october 2016 torrance real estate market trends update
TRANSCRIPT

Table of
Contents
Key Statistics for October
Sales 2016 Residential Sales Stats Year-to-Year Total Sales by Map Area Median 2016 Median Sales Stats Year-to-Year Median Sales by Map Area Listings 2016 Active Listings by Map Area 2016 Total Active Listings vs. Total Sales Year-to-Year Active Listings by Map Area Inventory 2016 Months of Inventory by Map Area Year-to-Year Months of Inventory
Summary
About Hady Chahine Contact Information

Key Statistics for October
Back to Table of Contents
= trending positive = trending positive
= trending negative = trending negative
Month-to-Month Comparison Sep 2016 Oct 2016 Delta (qty) Delta (%) Increase Decrease
Total Sales 108 90 -18 -16.7%
Median Sales Price 733,500 732,500 (1,000) -0.1%
Median Days to Sell 31 19 -12 -38.7%
Listings 169 150 -19 -11.2%
Sales/Listing Ratio 63.9% 60.0% -3.9% -6.1%
Months of Inventory 2.0 2.0 0.0 0.0%
Monthly Comparison Year-to-Year Oct 2015 Oct 2016 Delta Delta Increase Decrease
Total Sales 94 90 -4 -4.3%
Median Sales Price 611,750 732,500 120,750 19.7%
Median Days to Sell 40 19 -21 -52.5%
Listings 237 150 -87 -36.7%
Months of Inventory 3.0 2.0 -1 -33.3%

Back to Table of Contents
Total Sales Month-to-Month by Map Area Aug Sep Oct
Central Torrance 15 12 19
South East Torrance - West 11 13 7
Hollywood Riviera 14 15 11
South Torrance 16 8 12
Southwood 6 7 5
West Torrance 16 8 7
N Torrance - West 17 17 9
N Torrance - East 13 3 6
Old Torrance 15 16 10
South East Torrance - East 11 9 4
Total Sales 134 108 90
-
20
40
60
80
100
120
140
Aug Sep Oct
2016 Total Sales Month-to-Month by Map Area
Central Torrance
South East Torrance - West
Hollywood Riviera
South Torrance
Southwood
West Torrance
N Torrance - West
N Torrance - East
Old Torrance
South East Torrance - East
Total Sales

Back to Table of Contents
Total Sales Year-to-Year by Map Area 2014 2015 2016
Central Torrance 18 16 19
South East Torrance - West 7 9 7
Hollywood Riviera 15 14 11
South Torrance 8 4 12
Southwood 5 5 5
West Torrance 6 4 7
N Torrance - West 11 10 9
N Torrance - East 9 15 6
Old Torrance 10 13 10
South East Torrance - East 7 4 4
Total Sales 96 94 90
-
10
20
30
40
50
60
70
80
90
100
2014 2015 2016
Total Sales Year-to-Year by Map Area: October
Central Torrance
South East Torrance - West
Hollywood Riviera
South Torrance
Southwood
West Torrance
N Torrance - West
N Torrance - East
Old Torrance
South East Torrance - East
Total Sales
Back to Table of Contents
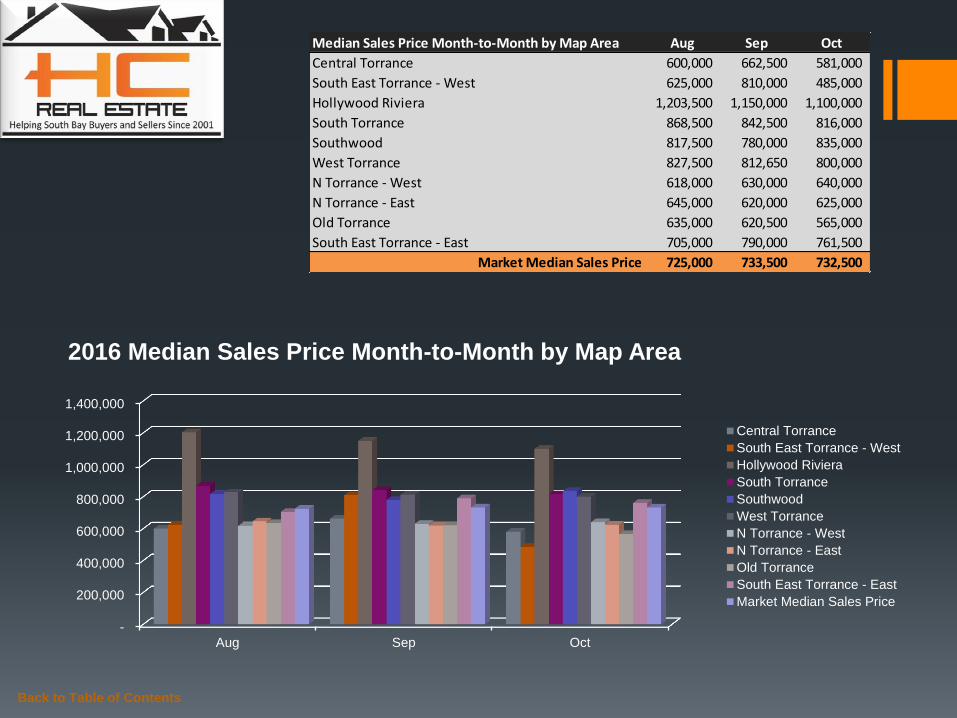
Median Sales Price Month-to-Month by Map Area Aug Sep Oct
Central Torrance 600,000 662,500 581,000
South East Torrance - West 625,000 810,000 485,000
Hollywood Riviera 1,203,500 1,150,000 1,100,000
South Torrance 868,500 842,500 816,000
Southwood 817,500 780,000 835,000
West Torrance 827,500 812,650 800,000
N Torrance - West 618,000 630,000 640,000
N Torrance - East 645,000 620,000 625,000
Old Torrance 635,000 620,500 565,000
South East Torrance - East 705,000 790,000 761,500
Market Median Sales Price 725,000 733,500 732,500
-
200,000
400,000
600,000
800,000
1,000,000
1,200,000
1,400,000
Aug Sep Oct
2016 Median Sales Price Month-to-Month by Map Area
Central Torrance
South East Torrance - West
Hollywood Riviera
South Torrance
Southwood
West Torrance
N Torrance - West
N Torrance - East
Old Torrance
South East Torrance - East
Market Median Sales Price

Back to Table of Contents
Median Sales Price Year-to-Year by Map Area 2014 2015 2016
Central Torrance 519,000 560,000 581,000
South East Torrance - West 780,000 390,000 485,000
Hollywood Riviera 999,000 1,424,968 1,100,000
South Torrance 748,750 893,750 816,000
Southwood 725,000 815,000 835,000
West Torrance 690,050 762,500 800,000
N Torrance - West 590,000 552,500 640,000
N Torrance - East 540,000 560,000 625,000
Old Torrance 515,625 548,000 565,000
South East Torrance - East 695,000 694,000 761,500
Market Median Sales Price 622,750 611,750 732,500
-
200,000
400,000
600,000
800,000
1,000,000
1,200,000
1,400,000
1,600,000
2014 2015 2016
Median Sales Price Year-to-Year by Map Area: October
Central Torrance
South East Torrance - West
Hollywood Riviera
South Torrance
Southwood
West Torrance
N Torrance - West
N Torrance - East
Old Torrance
South East Torrance - East
Market Median Sales Price

Back to Table of Contents
Active Listings vs. Total Sales by Map Area Jan Feb Mar Apr May Jun Jul Aug Sep Oct Nov Dec
Central Torrance 24 25 23 21 20 24 27 29 27 21
South East Torrance - West 12 18 14 16 22 21 13 12 6 6
Hollywood Riviera 18 22 14 16 22 24 26 25 26 22
South Torrance 10 15 17 15 23 21 21 14 12 12
Southwood 11 14 12 11 10 7 8 7 6 7
West Torrance 4 10 14 13 13 24 17 19 14 18
N Torrance - West 27 33 23 30 28 28 32 27 31 24
N Torrance - East 13 18 17 15 13 14 15 5 13 12
Old Torrance 20 24 28 30 30 32 30 18 23 19
South East Torrance - East 12 13 15 15 16 18 14 9 11 9
Total Active Listings 151 192 177 182 197 213 203 165 169 150
-
5
10
15
20
25
30
35
Jan Feb Mar Apr May Jun Jul Aug Sep Oct Nov Dec
2016 Active Listings by Map Area
Central Torrance
South East Torrance - West
Hollywood Riviera
South Torrance
Southwood
West Torrance
N Torrance - West
N Torrance - East
Old Torrance
South East Torrance - East

Back to Table of Contents
Active Listings vs. Total Sales by Map Area Jan Feb Mar Apr May Jun Jul Aug Sep Oct Nov Dec
Central Torrance 24 25 23 21 20 24 27 29 27 21
South East Torrance - West 12 18 14 16 22 21 13 12 6 6
Hollywood Riviera 18 22 14 16 22 24 26 25 26 22
South Torrance 10 15 17 15 23 21 21 14 12 12
Southwood 11 14 12 11 10 7 8 7 6 7
West Torrance 4 10 14 13 13 24 17 19 14 18
N Torrance - West 27 33 23 30 28 28 32 27 31 24
N Torrance - East 13 18 17 15 13 14 15 5 13 12
Old Torrance 20 24 28 30 30 32 30 18 23 19
South East Torrance - East 12 13 15 15 16 18 14 9 11 9
Total Active Listings 151 192 177 182 197 213 203 165 169 150
Total Sales 58 60 89 109 89 114 103 134 108 90
Sales/Listings Ratio 38.4% 31.3% 50.3% 59.9% 45.2% 53.5% 50.7% 81.2% 63.9% 60.0%
-
50
100
150
200
250
Jan Feb Mar Apr May Jun Jul Aug Sep Oct Nov Dec
2016 Total Active Listings vs. Total Sales
Total Active Listings
Total Sales

Back to Table of Contents
Active Listings Year-to-Year by Map Area 2014 2015 2016
Central Torrance 33 37 21
South East Torrance - West 20 16 6
Hollywood Riviera 30 35 22
South Torrance 16 15 12
Southwood 7 4 7
West Torrance 17 21 18
N Torrance - West 25 42 24
N Torrance - East 16 19 12
Old Torrance 36 23 19
South East Torrance - East 25 25 9
Total Active Listings 225 237 150
-
50
100
150
200
250
2014 2015 2016
Active Listings Year-to-Year by Map Area: October
Central Torrance
South East Torrance - West
Hollywood Riviera
South Torrance
Southwood
West Torrance
N Torrance - West
N Torrance - East
Old Torrance
South East Torrance - East
Total Active Listings
Back to Table of Contents
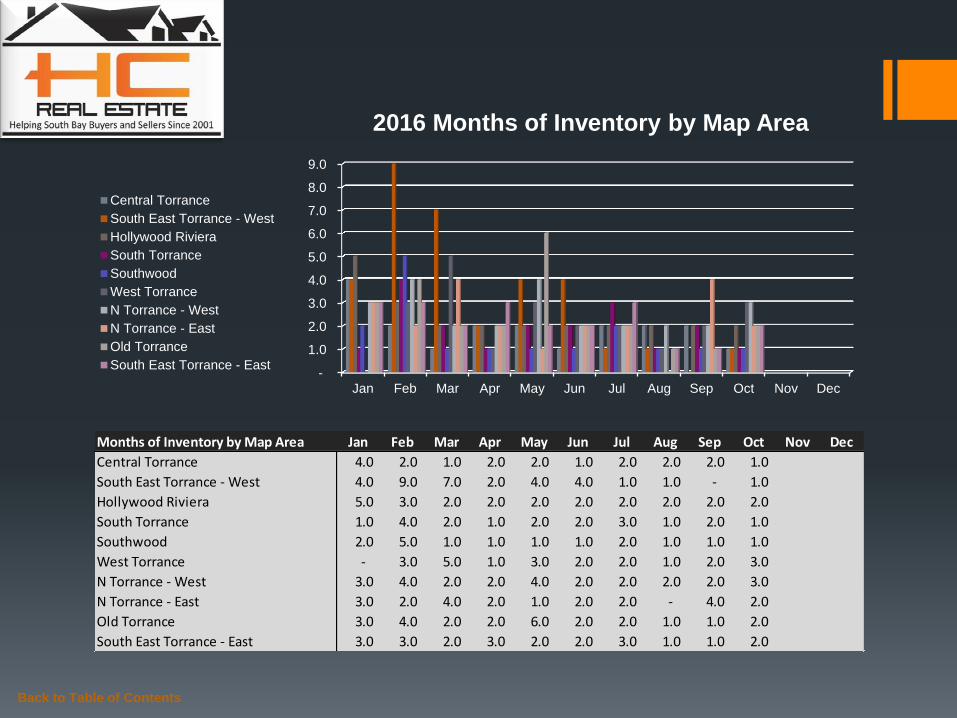
Months of Inventory by Map Area Jan Feb Mar Apr May Jun Jul Aug Sep Oct Nov Dec
Central Torrance 4.0 2.0 1.0 2.0 2.0 1.0 2.0 2.0 2.0 1.0
South East Torrance - West 4.0 9.0 7.0 2.0 4.0 4.0 1.0 1.0 - 1.0
Hollywood Riviera 5.0 3.0 2.0 2.0 2.0 2.0 2.0 2.0 2.0 2.0
South Torrance 1.0 4.0 2.0 1.0 2.0 2.0 3.0 1.0 2.0 1.0
Southwood 2.0 5.0 1.0 1.0 1.0 1.0 2.0 1.0 1.0 1.0
West Torrance - 3.0 5.0 1.0 3.0 2.0 2.0 1.0 2.0 3.0
N Torrance - West 3.0 4.0 2.0 2.0 4.0 2.0 2.0 2.0 2.0 3.0
N Torrance - East 3.0 2.0 4.0 2.0 1.0 2.0 2.0 - 4.0 2.0
Old Torrance 3.0 4.0 2.0 2.0 6.0 2.0 2.0 1.0 1.0 2.0
South East Torrance - East 3.0 3.0 2.0 3.0 2.0 2.0 3.0 1.0 1.0 2.0
-
1.0
2.0
3.0
4.0
5.0
6.0
7.0
8.0
9.0
Jan Feb Mar Apr May Jun Jul Aug Sep Oct Nov Dec
2016 Months of Inventory by Map Area
Central Torrance
South East Torrance - West
Hollywood Riviera
South Torrance
Southwood
West Torrance
N Torrance - West
N Torrance - East
Old Torrance
South East Torrance - East

Back to Table of Contents
Months of Inventory Year-to-Year Jan Feb Mar Apr May Jun Jul Aug Sep Oct Nov Dec
2014 3.0 2.0 2.0 3.0 2.0 4.0 2.0 2.0 3.0 2.0 3.0 2.0
2015 4.0 3.0 2.0 2.0 2.0 2.0 2.0 2.0 3.0 3.0 3.0 1.0
2016 3.0 3.0 2.0 2.0 2.0 2.0 2.0 1.0 2.0 2.0
-
0.5
1.0
1.5
2.0
2.5
3.0
3.5
4.0
Jan Feb Mar Apr May Jun Jul Aug Sep Oct Nov Dec
Months of Inventory Year-to-Year
2014
2015
2016
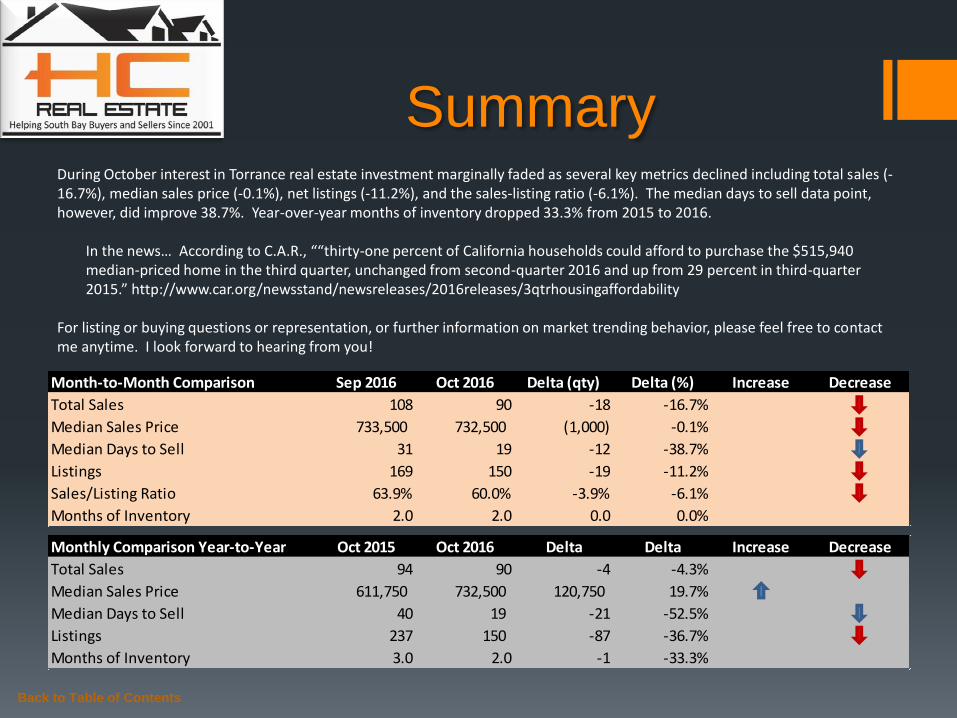
Summary During October interest in Torrance real estate investment marginally faded as several key metrics declined including total sales (-16.7%), median sales price (-0.1%), net listings (-11.2%), and the sales-listing ratio (-6.1%). The median days to sell data point, however, did improve 38.7%. Year-over-year months of inventory dropped 33.3% from 2015 to 2016.
In the news… According to C.A.R., ““thirty-one percent of California households could afford to purchase the $515,940 median-priced home in the third quarter, unchanged from second-quarter 2016 and up from 29 percent in third-quarter 2015.” http://www.car.org/newsstand/newsreleases/2016releases/3qtrhousingaffordability
For listing or buying questions or representation, or further information on market trending behavior, please feel free to contact me anytime. I look forward to hearing from you!
Back to Table of Contents
Monthly Comparison Year-to-Year Oct 2015 Oct 2016 Delta Delta Increase Decrease
Total Sales 94 90 -4 -4.3%
Median Sales Price 611,750 732,500 120,750 19.7%
Median Days to Sell 40 19 -21 -52.5%
Listings 237 150 -87 -36.7%
Months of Inventory 3.0 2.0 -1 -33.3%
Month-to-Month Comparison Sep 2016 Oct 2016 Delta (qty) Delta (%) Increase Decrease
Total Sales 108 90 -18 -16.7%
Median Sales Price 733,500 732,500 (1,000) -0.1%
Median Days to Sell 31 19 -12 -38.7%
Listings 169 150 -19 -11.2%
Sales/Listing Ratio 63.9% 60.0% -3.9% -6.1%
Months of Inventory 2.0 2.0 0.0 0.0%

Back to Table of Contents
Serving South Bay Home Buyers and Sellers Since 2001
RE/MAX Top 4 Team in California – 2012
RE/MAX 100% Club - 2011
Shorewood Realtors Top 5% in Overall Sales 2001-2006, 2008-2010

The information being provided by CARETS (CLAW, CRISNet MLS, DAMLS, CRMLS, i-Tech MLS, and/or VCRDS) is for the visitor’s personal, non-commercial use and may not be used for
any purpose other than to identify prospective properties visitor may be interested in purchasing. Any information relating to a property referenced on this web site comes from the Internet
Data Exchange (IDX) program of CARETS. This web site may reference real estate listing(s) held by a brokerage firm other than the broker and/or agent who owns this web site. The accuracy
of all information, regardless of source, including but not limited to square footages and lot sizes, is deemed reliable but not guaranteed and should be personally verified through personal
inspection by and/or with the appropriate professionals.
Back to Table of Contents
Listings MLS BLOG Website
Hady Chahine
• 310-404-5361