january 2017 torrance real estate market trends update
TRANSCRIPT

Table of
Contents
Key Statistics for January
Sales 2017 Residential Sales Stats Year-to-Year Total Sales by Map Area Median 2017 Median Sales Stats Year-to-Year Median Sales by Map Area Listings 2017 Active Listings by Map Area 2017 Total Active Listings vs. Total Sales Year-to-Year Active Listings by Map Area Inventory 2017 Months of Inventory by Map Area Year-to-Year Months of Inventory
Summary
About Hady Chahine Contact Information
Key Statistics for January
Back to Table of Contents
= trending positive = trending positive
= trending negative = trending negative
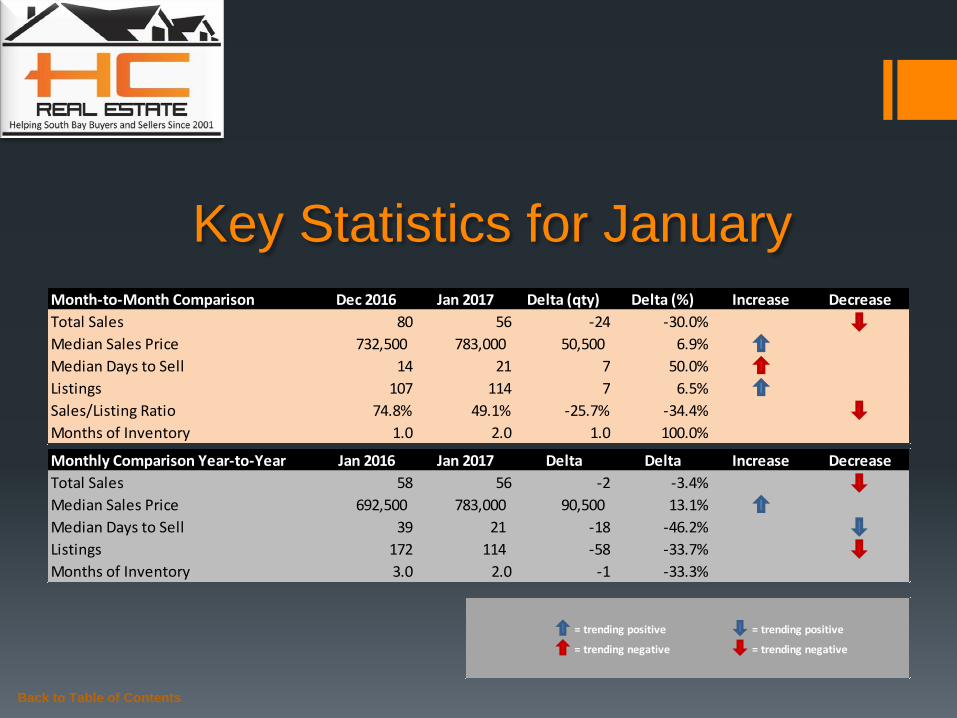
Month-to-Month Comparison Dec 2016 Jan 2017 Delta (qty) Delta (%) Increase Decrease
Total Sales 80 56 -24 -30.0%
Median Sales Price 732,500 783,000 50,500 6.9%
Median Days to Sell 14 21 7 50.0%
Listings 107 114 7 6.5%
Sales/Listing Ratio 74.8% 49.1% -25.7% -34.4%
Months of Inventory 1.0 2.0 1.0 100.0%
Monthly Comparison Year-to-Year Jan 2016 Jan 2017 Delta Delta Increase Decrease
Total Sales 58 56 -2 -3.4%
Median Sales Price 692,500 783,000 90,500 13.1%
Median Days to Sell 39 21 -18 -46.2%
Listings 172 114 -58 -33.7%
Months of Inventory 3.0 2.0 -1 -33.3%
Back to Table of Contents
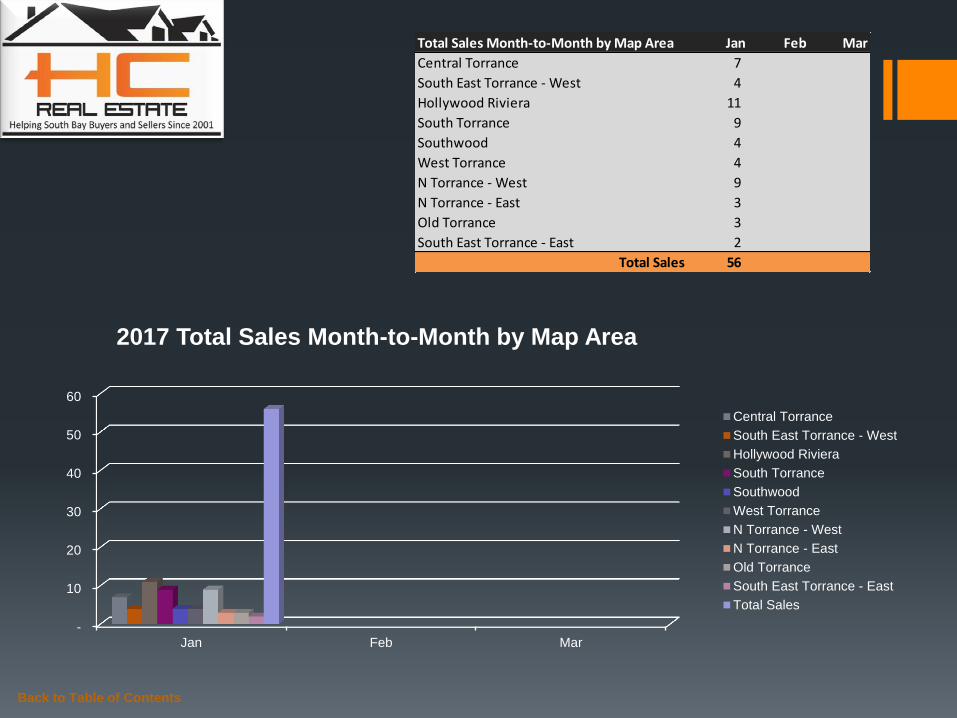
Total Sales Month-to-Month by Map Area Jan Feb Mar
Central Torrance 7
South East Torrance - West 4
Hollywood Riviera 11
South Torrance 9
Southwood 4
West Torrance 4
N Torrance - West 9
N Torrance - East 3
Old Torrance 3
South East Torrance - East 2
Total Sales 56
-
10
20
30
40
50
60
Jan Feb Mar
2017 Total Sales Month-to-Month by Map Area
Central Torrance
South East Torrance - West
Hollywood Riviera
South Torrance
Southwood
West Torrance
N Torrance - West
N Torrance - East
Old Torrance
South East Torrance - East
Total Sales

Back to Table of Contents
Total Sales Year-to-Year by Map Area 2015 2016 2017
Central Torrance 5 6 7
South East Torrance - West 6 3 4
Hollywood Riviera 4 4 11
South Torrance 4 7 9
Southwood 2 5 4
West Torrance 5 9 4
N Torrance - West 6 9 9
N Torrance - East 5 5 3
Old Torrance 4 6 3
South East Torrance - East 3 4 2
Total Sales 44 58 56
-
10
20
30
40
50
60
2015 2016 2017
Total Sales Year-to-Year by Map Area: January
Central Torrance
South East Torrance - West
Hollywood Riviera
South Torrance
Southwood
West Torrance
N Torrance - West
N Torrance - East
Old Torrance
South East Torrance - East
Total Sales
Back to Table of Contents
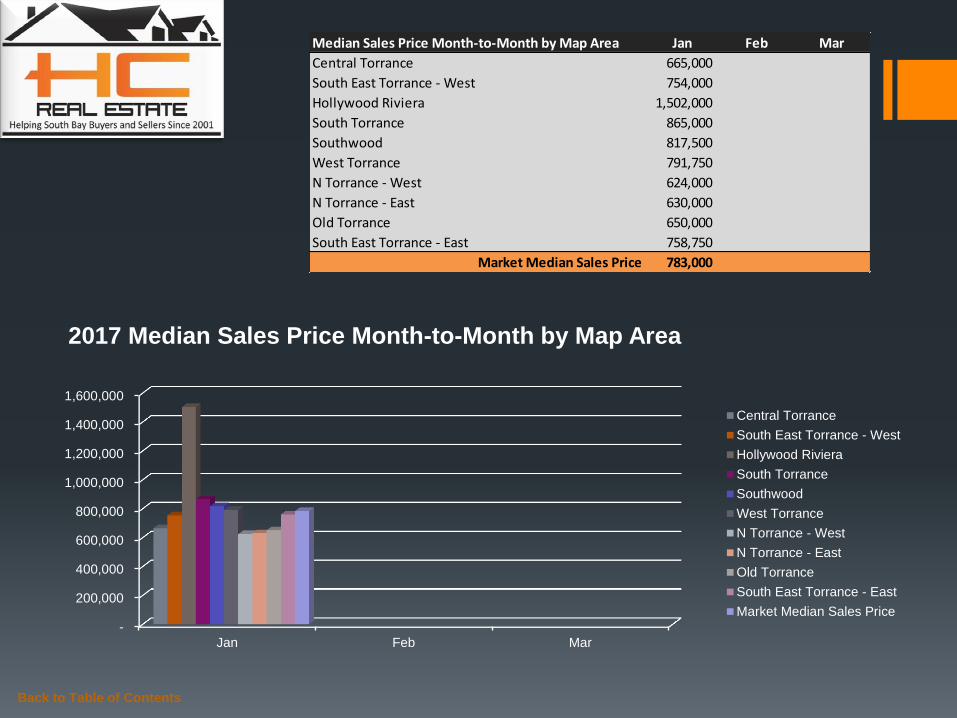
Median Sales Price Month-to-Month by Map Area Jan Feb Mar
Central Torrance 665,000
South East Torrance - West 754,000
Hollywood Riviera 1,502,000
South Torrance 865,000
Southwood 817,500
West Torrance 791,750
N Torrance - West 624,000
N Torrance - East 630,000
Old Torrance 650,000
South East Torrance - East 758,750
Market Median Sales Price 783,000
-
200,000
400,000
600,000
800,000
1,000,000
1,200,000
1,400,000
1,600,000
Jan Feb Mar
2017 Median Sales Price Month-to-Month by Map Area
Central Torrance
South East Torrance - West
Hollywood Riviera
South Torrance
Southwood
West Torrance
N Torrance - West
N Torrance - East
Old Torrance
South East Torrance - East
Market Median Sales Price

Back to Table of Contents
Median Sales Price Year-to-Year by Map Area 2015 2016 2017
Central Torrance 615,000 592,500 665,000
South East Torrance - West 751,500 911,700 754,000
Hollywood Riviera 984,500 1,222,500 1,502,000
South Torrance 692,500 730,000 865,000
Southwood 927,500 770,000 817,500
West Torrance 771,000 959,900 791,750
N Torrance - West 565,000 565,000 624,000
N Torrance - East 583,000 632,000 630,000
Old Torrance 585,500 592,500 650,000
South East Torrance - East 675,000 730,000 758,750
Market Median Sales Price 637,500 692,500 783,000
-
200,000
400,000
600,000
800,000
1,000,000
1,200,000
1,400,000
1,600,000
2015 2016 2017
Median Sales Price Year-to-Year by Map Area: January
Central Torrance
South East Torrance - West
Hollywood Riviera
South Torrance
Southwood
West Torrance
N Torrance - West
N Torrance - East
Old Torrance
South East Torrance - East
Market Median Sales Price
Back to Table of Contents
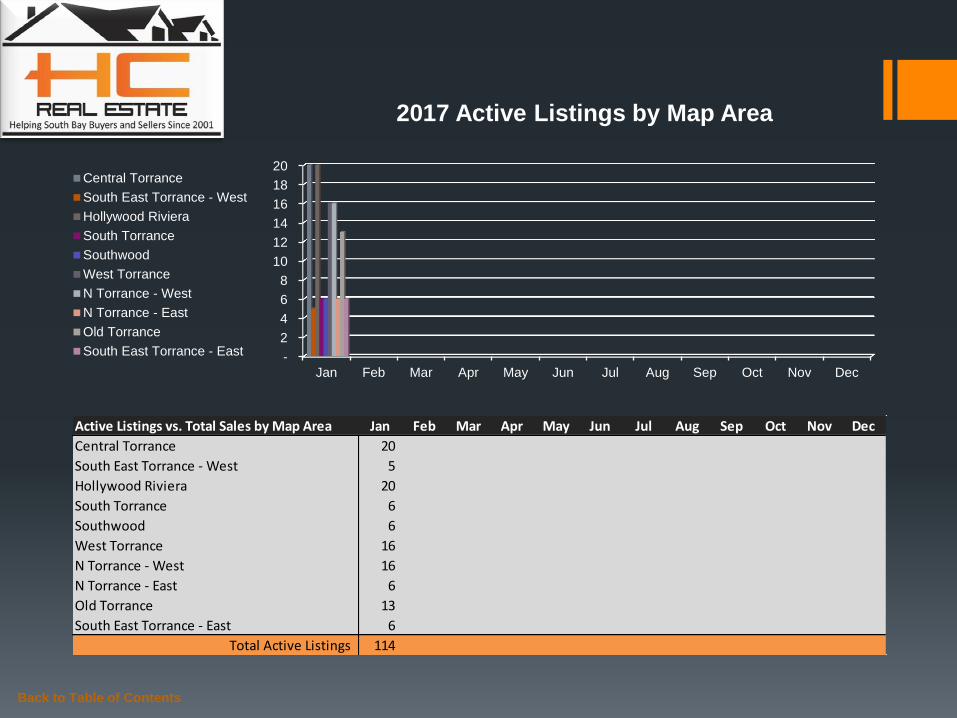
Active Listings vs. Total Sales by Map Area Jan Feb Mar Apr May Jun Jul Aug Sep Oct Nov Dec
Central Torrance 20
South East Torrance - West 5
Hollywood Riviera 20
South Torrance 6
Southwood 6
West Torrance 16
N Torrance - West 16
N Torrance - East 6
Old Torrance 13
South East Torrance - East 6
Total Active Listings 114
-
2
4
6
8
10
12
14
16
18
20
Jan Feb Mar Apr May Jun Jul Aug Sep Oct Nov Dec
2017 Active Listings by Map Area
Central Torrance
South East Torrance - West
Hollywood Riviera
South Torrance
Southwood
West Torrance
N Torrance - West
N Torrance - East
Old Torrance
South East Torrance - East
Back to Table of Contents
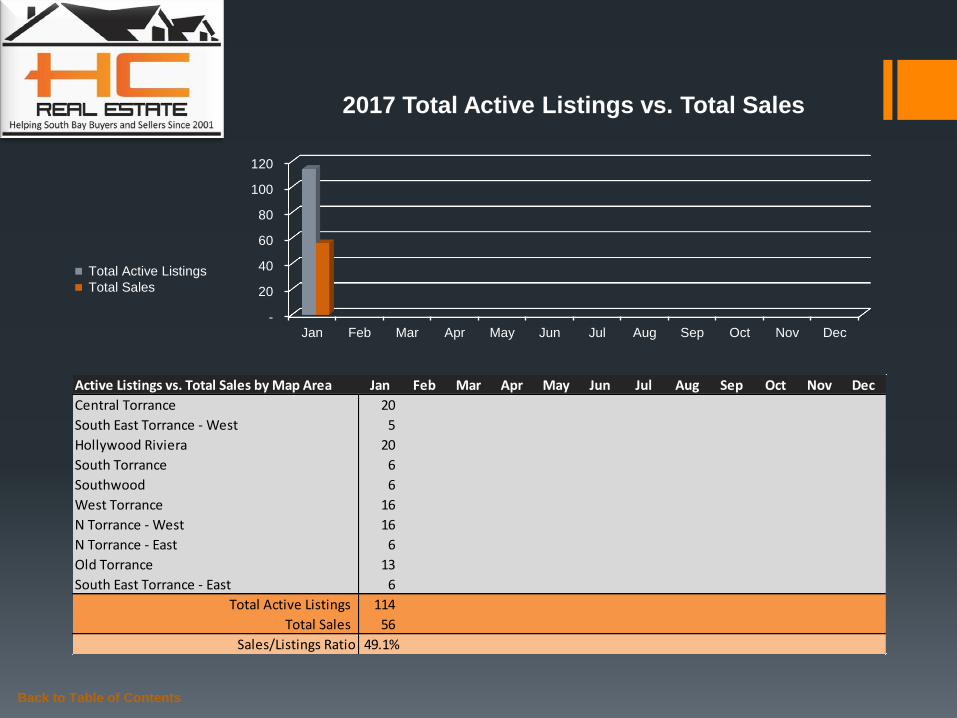
Active Listings vs. Total Sales by Map Area Jan Feb Mar Apr May Jun Jul Aug Sep Oct Nov Dec
Central Torrance 20
South East Torrance - West 5
Hollywood Riviera 20
South Torrance 6
Southwood 6
West Torrance 16
N Torrance - West 16
N Torrance - East 6
Old Torrance 13
South East Torrance - East 6
Total Active Listings 114
Total Sales 56
Sales/Listings Ratio 49.1%
-
20
40
60
80
100
120
Jan Feb Mar Apr May Jun Jul Aug Sep Oct Nov Dec
2017 Total Active Listings vs. Total Sales
Total Active Listings
Total Sales
Back to Table of Contents
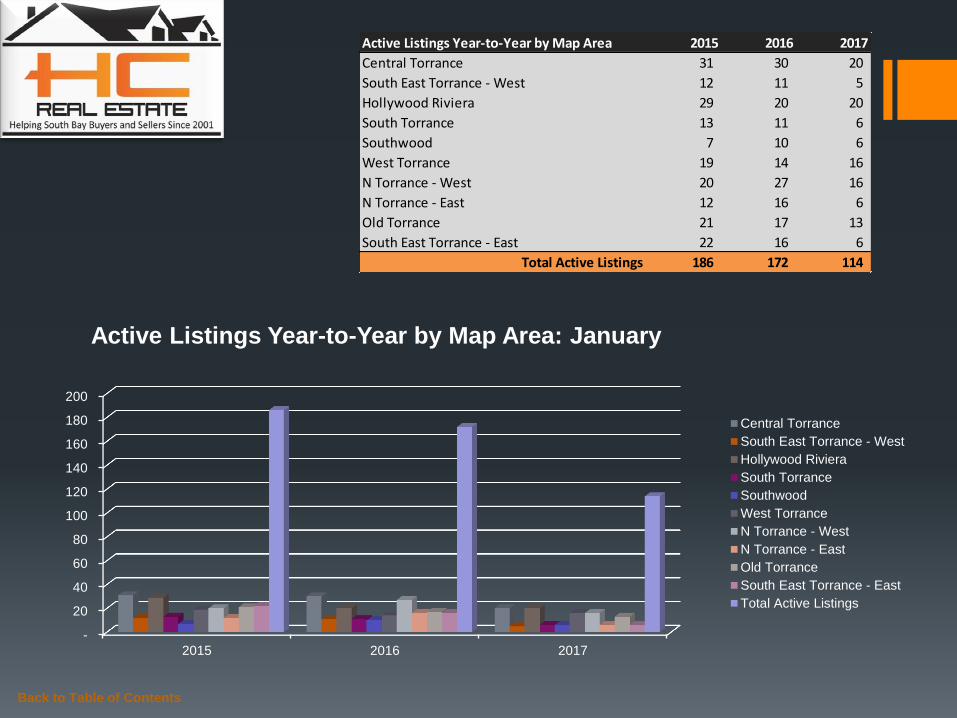
Active Listings Year-to-Year by Map Area 2015 2016 2017
Central Torrance 31 30 20
South East Torrance - West 12 11 5
Hollywood Riviera 29 20 20
South Torrance 13 11 6
Southwood 7 10 6
West Torrance 19 14 16
N Torrance - West 20 27 16
N Torrance - East 12 16 6
Old Torrance 21 17 13
South East Torrance - East 22 16 6
Total Active Listings 186 172 114
-
20
40
60
80
100
120
140
160
180
200
2015 2016 2017
Active Listings Year-to-Year by Map Area: January
Central Torrance
South East Torrance - West
Hollywood Riviera
South Torrance
Southwood
West Torrance
N Torrance - West
N Torrance - East
Old Torrance
South East Torrance - East
Total Active Listings
Back to Table of Contents
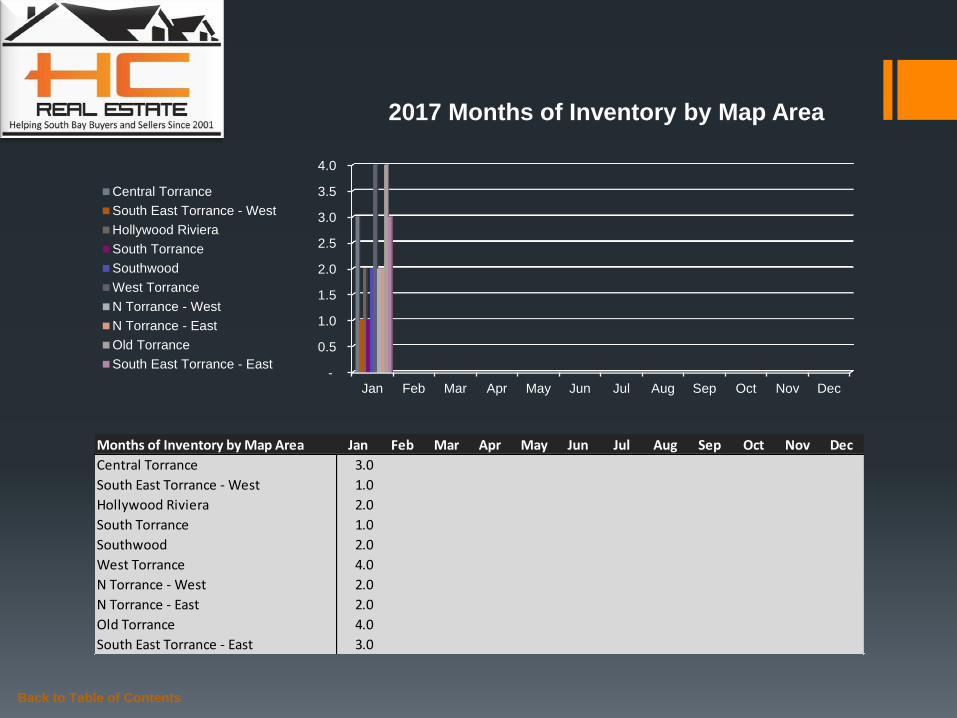
Months of Inventory by Map Area Jan Feb Mar Apr May Jun Jul Aug Sep Oct Nov Dec
Central Torrance 3.0
South East Torrance - West 1.0
Hollywood Riviera 2.0
South Torrance 1.0
Southwood 2.0
West Torrance 4.0
N Torrance - West 2.0
N Torrance - East 2.0
Old Torrance 4.0
South East Torrance - East 3.0
-
0.5
1.0
1.5
2.0
2.5
3.0
3.5
4.0
Jan Feb Mar Apr May Jun Jul Aug Sep Oct Nov Dec
2017 Months of Inventory by Map Area
Central Torrance
South East Torrance - West
Hollywood Riviera
South Torrance
Southwood
West Torrance
N Torrance - West
N Torrance - East
Old Torrance
South East Torrance - East
Back to Table of Contents
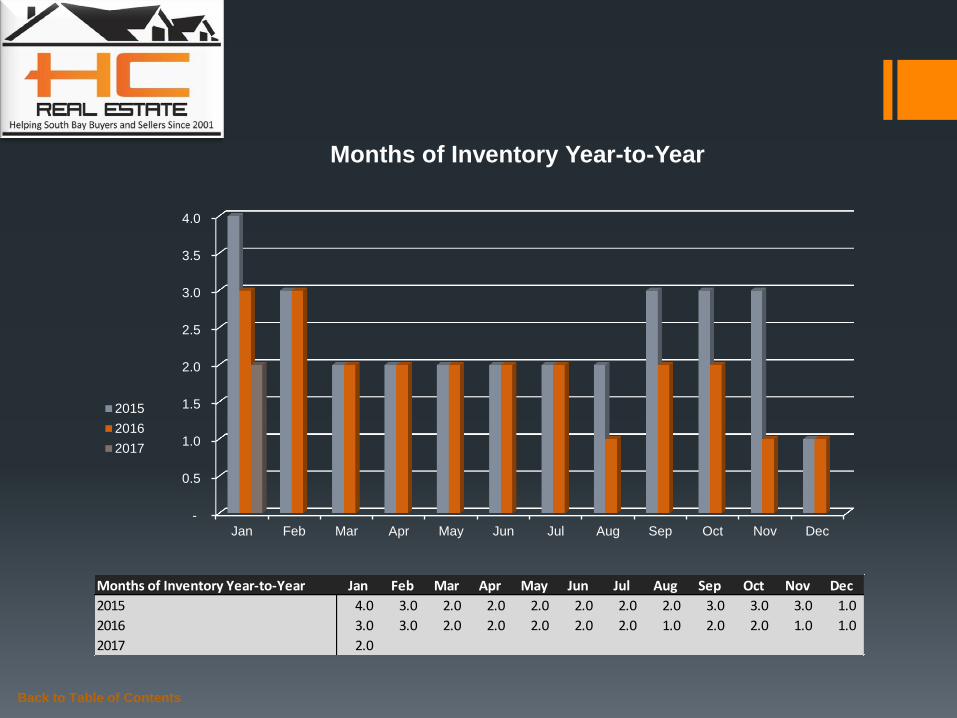
Months of Inventory Year-to-Year Jan Feb Mar Apr May Jun Jul Aug Sep Oct Nov Dec
2015 4.0 3.0 2.0 2.0 2.0 2.0 2.0 2.0 3.0 3.0 3.0 1.0
2016 3.0 3.0 2.0 2.0 2.0 2.0 2.0 1.0 2.0 2.0 1.0 1.0
2017 2.0
-
0.5
1.0
1.5
2.0
2.5
3.0
3.5
4.0
Jan Feb Mar Apr May Jun Jul Aug Sep Oct Nov Dec
Months of Inventory Year-to-Year
2015
2016
2017
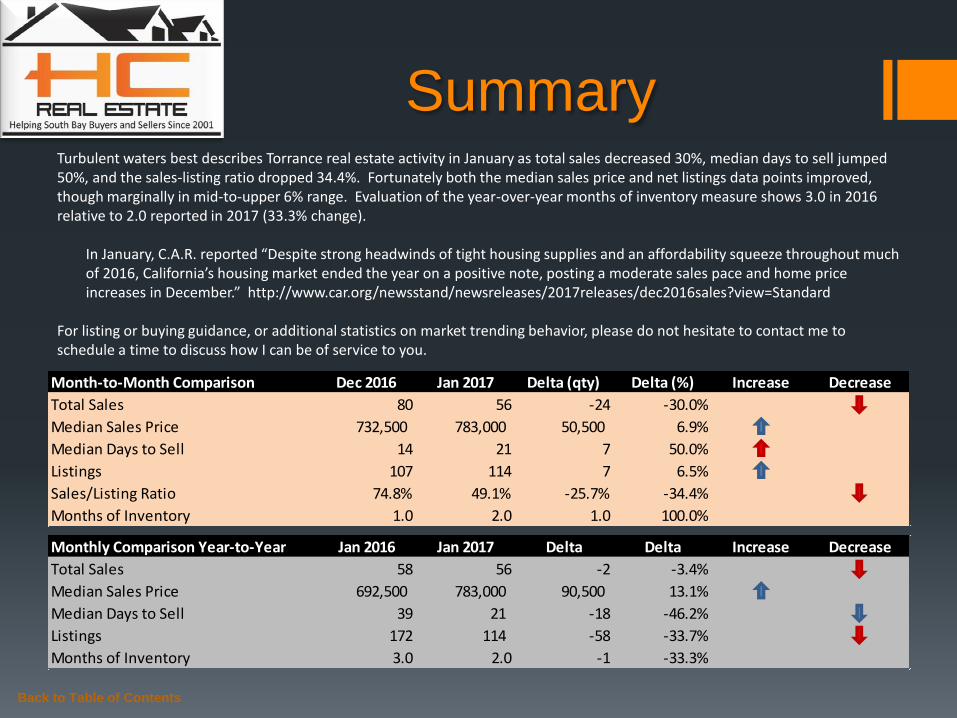
Summary Turbulent waters best describes Torrance real estate activity in January as total sales decreased 30%, median days to sell jumped 50%, and the sales-listing ratio dropped 34.4%. Fortunately both the median sales price and net listings data points improved, though marginally in mid-to-upper 6% range. Evaluation of the year-over-year months of inventory measure shows 3.0 in 2016 relative to 2.0 reported in 2017 (33.3% change).
In January, C.A.R. reported “Despite strong headwinds of tight housing supplies and an affordability squeeze throughout much of 2016, California’s housing market ended the year on a positive note, posting a moderate sales pace and home price increases in December.” http://www.car.org/newsstand/newsreleases/2017releases/dec2016sales?view=Standard
For listing or buying guidance, or additional statistics on market trending behavior, please do not hesitate to contact me to schedule a time to discuss how I can be of service to you.
Back to Table of Contents
Monthly Comparison Year-to-Year Jan 2016 Jan 2017 Delta Delta Increase Decrease
Total Sales 58 56 -2 -3.4%
Median Sales Price 692,500 783,000 90,500 13.1%
Median Days to Sell 39 21 -18 -46.2%
Listings 172 114 -58 -33.7%
Months of Inventory 3.0 2.0 -1 -33.3%
Month-to-Month Comparison Dec 2016 Jan 2017 Delta (qty) Delta (%) Increase Decrease
Total Sales 80 56 -24 -30.0%
Median Sales Price 732,500 783,000 50,500 6.9%
Median Days to Sell 14 21 7 50.0%
Listings 107 114 7 6.5%
Sales/Listing Ratio 74.8% 49.1% -25.7% -34.4%
Months of Inventory 1.0 2.0 1.0 100.0%
Back to Table of Contents
Serving South Bay Home Buyers and Sellers Since 2001
RE/MAX Top 4 Team in California – 2012
RE/MAX 100% Club - 2011
Shorewood Realtors Top 5% in Overall Sales 2001-2006, 2008-2010

The information being provided by CARETS (CLAW, CRISNet MLS, DAMLS, CRMLS, i-Tech MLS, and/or VCRDS) is for the visitor’s personal, non-commercial use and may not be used for
any purpose other than to identify prospective properties visitor may be interested in purchasing. Any information relating to a property referenced on this web site comes from the Internet
Data Exchange (IDX) program of CARETS. This web site may reference real estate listing(s) held by a brokerage firm other than the broker and/or agent who owns this web site. The accuracy
of all information, regardless of source, including but not limited to square footages and lot sizes, is deemed reliable but not guaranteed and should be personally verified through personal
inspection by and/or with the appropriate professionals.
Back to Table of Contents
Listings MLS BLOG Website
Hady Chahine
• 310-404-5361