january 2016 torrance real estate market trends update
TRANSCRIPT


Table of
Contents
Key Statistics for January
Sales 2016 Residential Sales Stats Year-to-Year Total Sales by Map Area Median 2016 Median Sales Stats Year-to-Year Median Sales by Map Area Listings 2016 Active Listings by Map Area 2016 Total Active Listings vs. Total Sales Year-to-Year Active Listings by Map Area Inventory 2016 Months of Inventory by Map Area Year-to-Year Months of Inventory
Summary
About Hady Chahine Contact Information
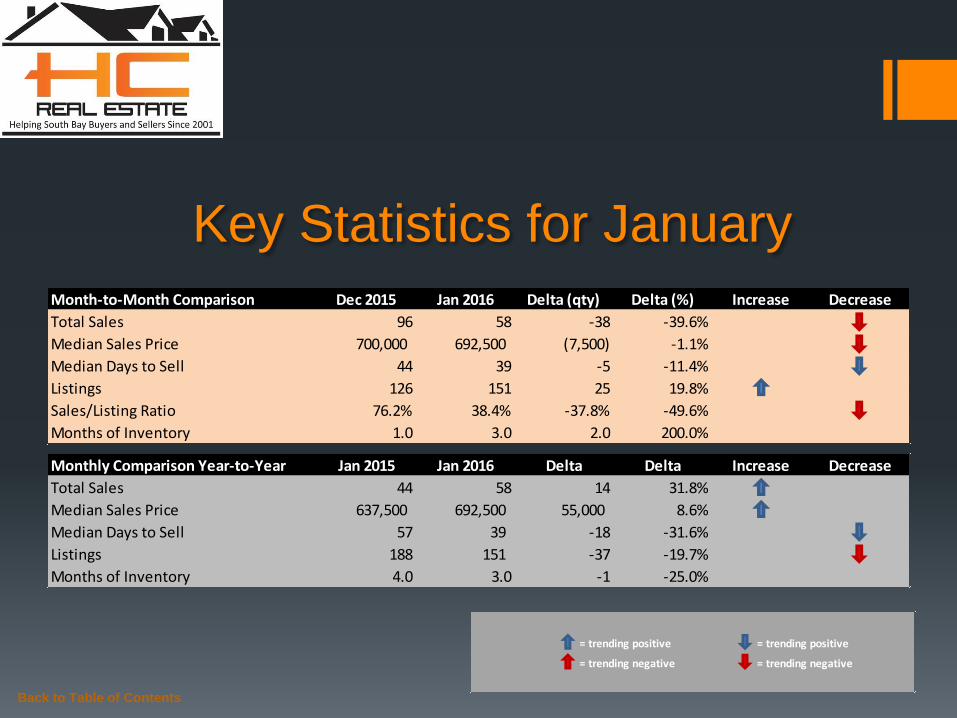
Key Statistics for January
Back to Table of Contents
= trending positive = trending positive
= trending negative = trending negative
Month-to-Month Comparison Dec 2015 Jan 2016 Delta (qty) Delta (%) Increase Decrease
Total Sales 96 58 -38 -39.6%
Median Sales Price 700,000 692,500 (7,500) -1.1%
Median Days to Sell 44 39 -5 -11.4%
Listings 126 151 25 19.8%
Sales/Listing Ratio 76.2% 38.4% -37.8% -49.6%
Months of Inventory 1.0 3.0 2.0 200.0%
Monthly Comparison Year-to-Year Jan 2015 Jan 2016 Delta Delta Increase Decrease
Total Sales 44 58 14 31.8%
Median Sales Price 637,500 692,500 55,000 8.6%
Median Days to Sell 57 39 -18 -31.6%
Listings 188 151 -37 -19.7%
Months of Inventory 4.0 3.0 -1 -25.0%
Back to Table of Contents
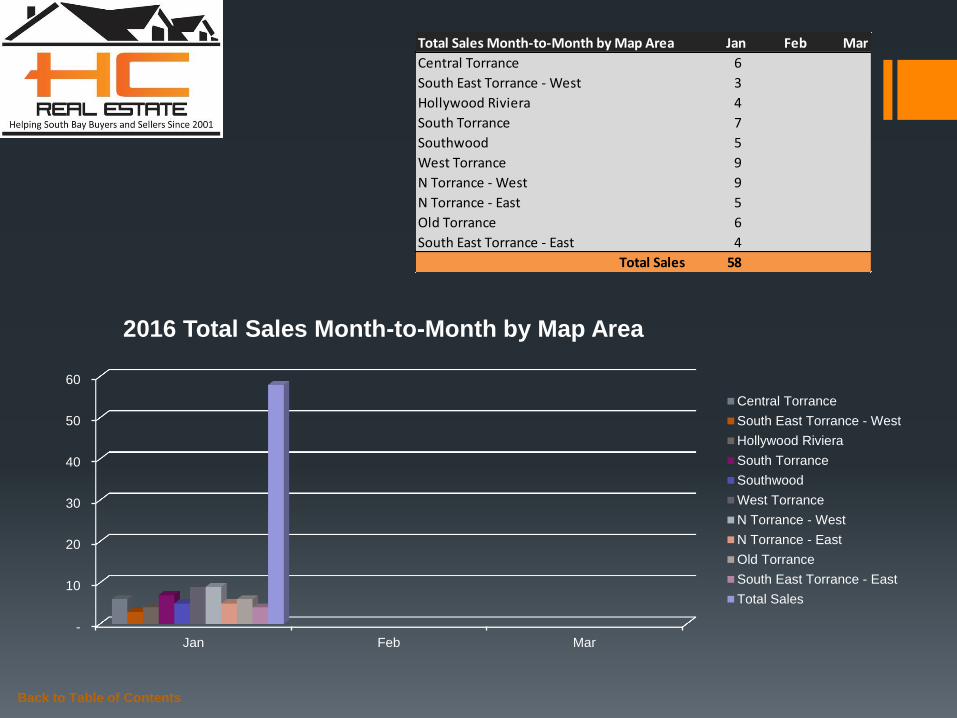
Total Sales Month-to-Month by Map Area Jan Feb Mar
Central Torrance 6
South East Torrance - West 3
Hollywood Riviera 4
South Torrance 7
Southwood 5
West Torrance 9
N Torrance - West 9
N Torrance - East 5
Old Torrance 6
South East Torrance - East 4
Total Sales 58
-
10
20
30
40
50
60
Jan Feb Mar
2016 Total Sales Month-to-Month by Map Area
Central Torrance
South East Torrance - West
Hollywood Riviera
South Torrance
Southwood
West Torrance
N Torrance - West
N Torrance - East
Old Torrance
South East Torrance - East
Total Sales
Back to Table of Contents
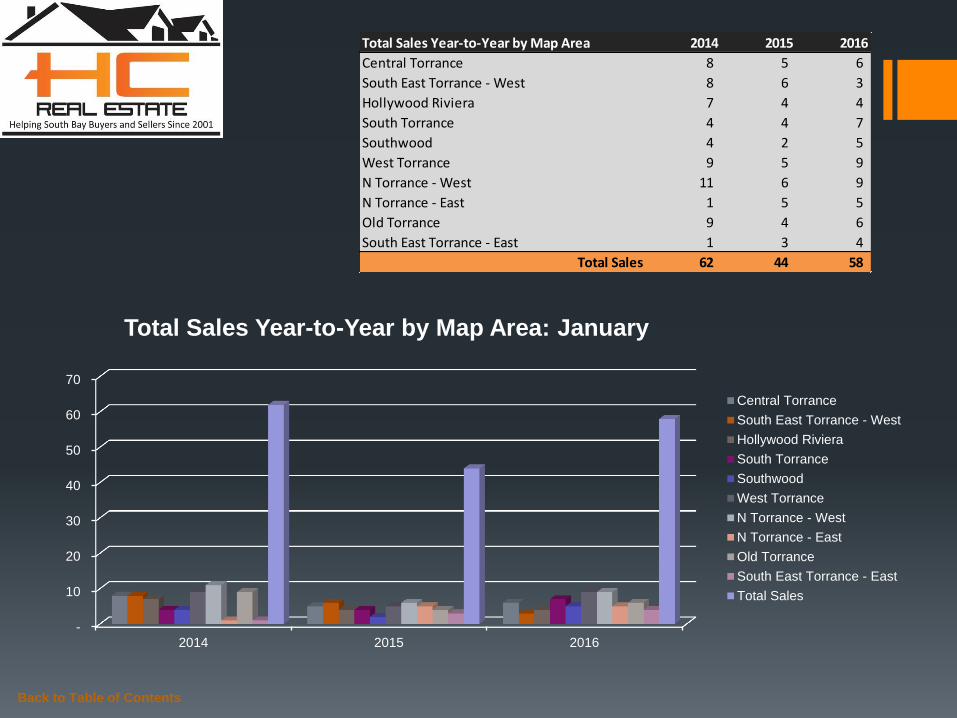
Total Sales Year-to-Year by Map Area 2014 2015 2016
Central Torrance 8 5 6
South East Torrance - West 8 6 3
Hollywood Riviera 7 4 4
South Torrance 4 4 7
Southwood 4 2 5
West Torrance 9 5 9
N Torrance - West 11 6 9
N Torrance - East 1 5 5
Old Torrance 9 4 6
South East Torrance - East 1 3 4
Total Sales 62 44 58
-
10
20
30
40
50
60
70
2014 2015 2016
Total Sales Year-to-Year by Map Area: January
Central Torrance
South East Torrance - West
Hollywood Riviera
South Torrance
Southwood
West Torrance
N Torrance - West
N Torrance - East
Old Torrance
South East Torrance - East
Total Sales

Back to Table of Contents
Median Sales Price Month-to-Month by Map Area Jan Feb Mar
Central Torrance 592,500
South East Torrance - West 911,700
Hollywood Riviera 1,222,500
South Torrance 730,000
Southwood 770,000
West Torrance 959,900
N Torrance - West 565,000
N Torrance - East 632,000
Old Torrance 592,500
South East Torrance - East 730,000
Market Median Sales Price 692,500
-
200,000
400,000
600,000
800,000
1,000,000
1,200,000
1,400,000
Jan Feb Mar
2016 Median Sales Price Month-to-Month by Map Area
Central Torrance
South East Torrance - West
Hollywood Riviera
South Torrance
Southwood
West Torrance
N Torrance - West
N Torrance - East
Old Torrance
South East Torrance - East
Market Median Sales Price
Back to Table of Contents
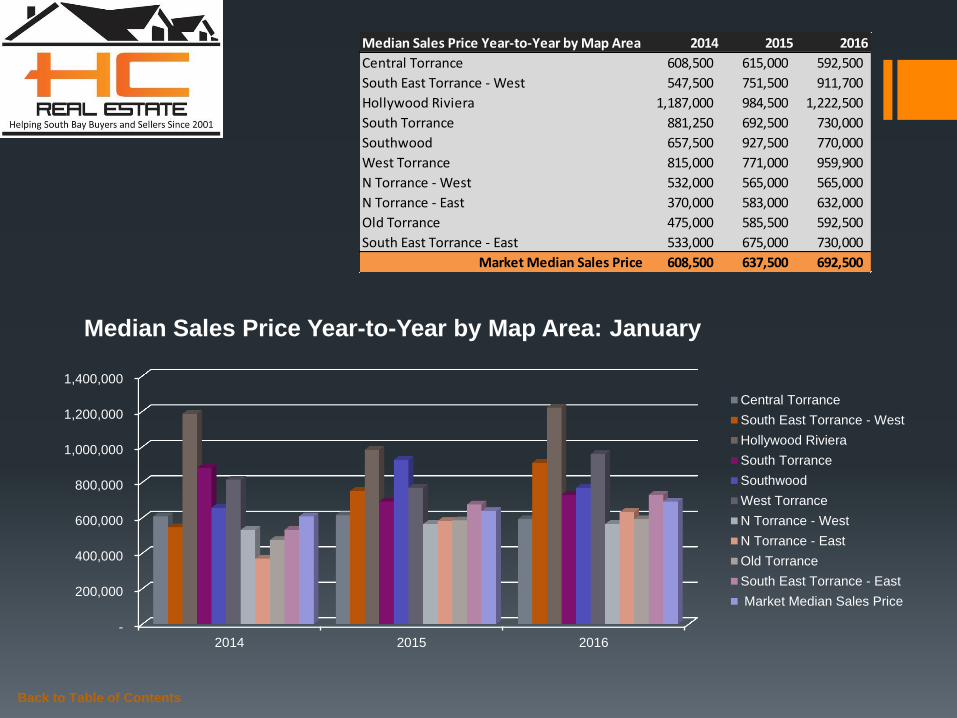
Median Sales Price Year-to-Year by Map Area 2014 2015 2016
Central Torrance 608,500 615,000 592,500
South East Torrance - West 547,500 751,500 911,700
Hollywood Riviera 1,187,000 984,500 1,222,500
South Torrance 881,250 692,500 730,000
Southwood 657,500 927,500 770,000
West Torrance 815,000 771,000 959,900
N Torrance - West 532,000 565,000 565,000
N Torrance - East 370,000 583,000 632,000
Old Torrance 475,000 585,500 592,500
South East Torrance - East 533,000 675,000 730,000
Market Median Sales Price 608,500 637,500 692,500
-
200,000
400,000
600,000
800,000
1,000,000
1,200,000
1,400,000
2014 2015 2016
Median Sales Price Year-to-Year by Map Area: January
Central Torrance
South East Torrance - West
Hollywood Riviera
South Torrance
Southwood
West Torrance
N Torrance - West
N Torrance - East
Old Torrance
South East Torrance - East
Market Median Sales Price
Back to Table of Contents
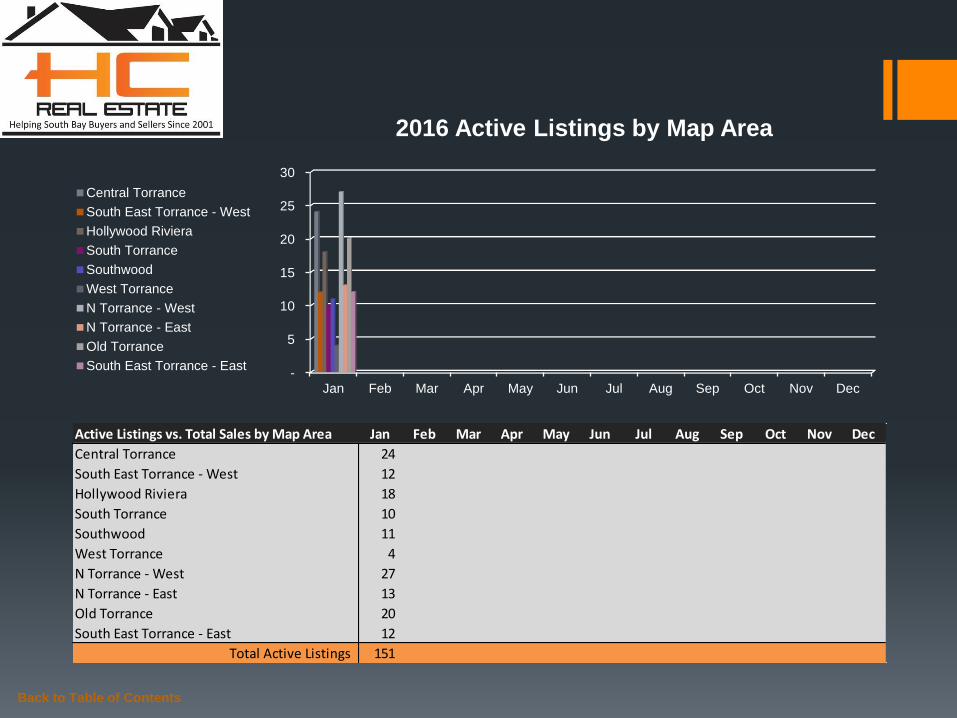
Active Listings vs. Total Sales by Map Area Jan Feb Mar Apr May Jun Jul Aug Sep Oct Nov Dec
Central Torrance 24
South East Torrance - West 12
Hollywood Riviera 18
South Torrance 10
Southwood 11
West Torrance 4
N Torrance - West 27
N Torrance - East 13
Old Torrance 20
South East Torrance - East 12
Total Active Listings 151
-
5
10
15
20
25
30
Jan Feb Mar Apr May Jun Jul Aug Sep Oct Nov Dec
2016 Active Listings by Map Area
Central Torrance
South East Torrance - West
Hollywood Riviera
South Torrance
Southwood
West Torrance
N Torrance - West
N Torrance - East
Old Torrance
South East Torrance - East

Back to Table of Contents
Active Listings vs. Total Sales by Map Area Jan Feb Mar Apr May Jun Jul Aug Sep Oct Nov Dec
Central Torrance 24
South East Torrance - West 12
Hollywood Riviera 18
South Torrance 10
Southwood 11
West Torrance 4
N Torrance - West 27
N Torrance - East 13
Old Torrance 20
South East Torrance - East 12
Total Active Listings 151
Total Sales 58
Sales/Listings Ratio 38.4%
-
20
40
60
80
100
120
140
160
Jan Feb Mar Apr May Jun Jul Aug Sep Oct Nov Dec
2016 Total Active Listings vs. Total Sales
Total Active Listings
Total Sales

Back to Table of Contents
Active Listings Year-to-Year by Map Area 2014 2015 2016
Central Torrance 22 28 24
South East Torrance - West 10 17 12
Hollywood Riviera 16 27 18
South Torrance 14 13 10
Southwood 5 7 11
West Torrance 15 14 4
N Torrance - West 33 24 27
N Torrance - East 11 13 13
Old Torrance 23 24 20
South East Torrance - East 13 21 12
Total Active Listings 162 188 151
-
20
40
60
80
100
120
140
160
180
200
2014 2015 2016
Active Listings Year-to-Year by Map Area: January
Central Torrance
South East Torrance - West
Hollywood Riviera
South Torrance
Southwood
West Torrance
N Torrance - West
N Torrance - East
Old Torrance
South East Torrance - East
Total Active Listings

Back to Table of Contents
Months of Inventory by Map Area Jan Feb Mar Apr May Jun Jul Aug Sep Oct Nov Dec
Central Torrance 4.0
South East Torrance - West 4.0
Hollywood Riviera 5.0
South Torrance 1.0
Southwood 2.0
West Torrance -
N Torrance - West 3.0
N Torrance - East 3.0
Old Torrance 3.0
South East Torrance - East 3.0
-
0.5
1.0
1.5
2.0
2.5
3.0
3.5
4.0
4.5
5.0
Jan Feb Mar Apr May Jun Jul Aug Sep Oct Nov Dec
2016 Months of Inventory by Map Area
Central Torrance
South East Torrance - West
Hollywood Riviera
South Torrance
Southwood
West Torrance
N Torrance - West
N Torrance - East
Old Torrance
South East Torrance - East
Back to Table of Contents
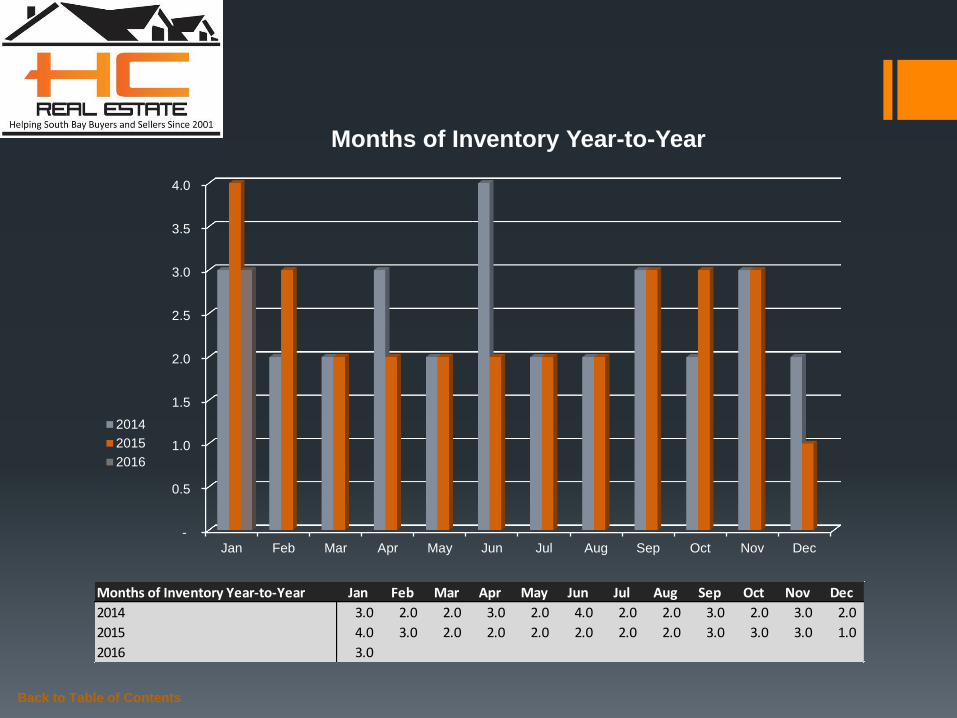
Months of Inventory Year-to-Year Jan Feb Mar Apr May Jun Jul Aug Sep Oct Nov Dec
2014 3.0 2.0 2.0 3.0 2.0 4.0 2.0 2.0 3.0 2.0 3.0 2.0
2015 4.0 3.0 2.0 2.0 2.0 2.0 2.0 2.0 3.0 3.0 3.0 1.0
2016 3.0
-
0.5
1.0
1.5
2.0
2.5
3.0
3.5
4.0
Jan Feb Mar Apr May Jun Jul Aug Sep Oct Nov Dec
Months of Inventory Year-to-Year
2014
2015
2016
Summary
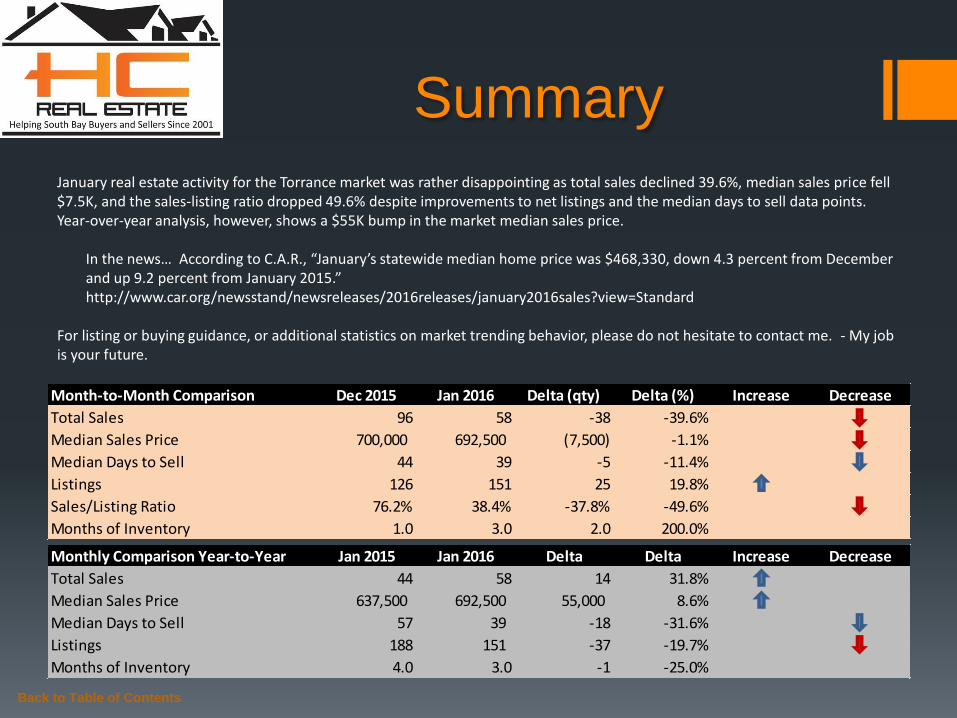
January real estate activity for the Torrance market was rather disappointing as total sales declined 39.6%, median sales price fell $7.5K, and the sales-listing ratio dropped 49.6% despite improvements to net listings and the median days to sell data points. Year-over-year analysis, however, shows a $55K bump in the market median sales price.
In the news… According to C.A.R., “January’s statewide median home price was $468,330, down 4.3 percent from December and up 9.2 percent from January 2015.” http://www.car.org/newsstand/newsreleases/2016releases/january2016sales?view=Standard
For listing or buying guidance, or additional statistics on market trending behavior, please do not hesitate to contact me. - My job is your future.
Back to Table of Contents
Monthly Comparison Year-to-Year Jan 2015 Jan 2016 Delta Delta Increase Decrease
Total Sales 44 58 14 31.8%
Median Sales Price 637,500 692,500 55,000 8.6%
Median Days to Sell 57 39 -18 -31.6%
Listings 188 151 -37 -19.7%
Months of Inventory 4.0 3.0 -1 -25.0%
Month-to-Month Comparison Dec 2015 Jan 2016 Delta (qty) Delta (%) Increase Decrease
Total Sales 96 58 -38 -39.6%
Median Sales Price 700,000 692,500 (7,500) -1.1%
Median Days to Sell 44 39 -5 -11.4%
Listings 126 151 25 19.8%
Sales/Listing Ratio 76.2% 38.4% -37.8% -49.6%
Months of Inventory 1.0 3.0 2.0 200.0%
Back to Table of Contents
Serving South Bay Home Buyers and Sellers Since 2001
RE/MAX Top 4 Team in California – 2012
RE/MAX 100% Club - 2011
Shorewood Realtors Top 5% in Overall Sales 2001-2006, 2008-2010
About
Hady Chahine…

The information being provided by CARETS (CLAW, CRISNet MLS, DAMLS, CRMLS, i-Tech MLS, and/or VCRDS) is for the visitor’s personal, non-commercial use and may not be used for
any purpose other than to identify prospective properties visitor may be interested in purchasing. Any information relating to a property referenced on this web site comes from the Internet
Data Exchange (IDX) program of CARETS. This web site may reference real estate listing(s) held by a brokerage firm other than the broker and/or agent who owns this web site. The accuracy
of all information, regardless of source, including but not limited to square footages and lot sizes, is deemed reliable but not guaranteed and should be personally verified through personal
inspection by and/or with the appropriate professionals.
Back to Table of Contents
Listings MLS BLOG Website
Hady Chahine
• 310-404-5361